report of student performance on the north carolina ... · north carolina testing program report of...
TRANSCRIPT

North CarolinaTesting Program
Report of StudentPerformance
on theNorth Carolina
Alternate Assessments
Reading, Mathematics, and WritingGrades 3 - 8
North Carolina Alternate Assessment Academic Inventory (NCAAAI)North Carolina Alternate Assessment Portfolio (NCAAP)
2003-04
Published April 2005
Public Schools of North CarolinaState Board of EducationDepartment of Public InstructionAccountability Services/Test Development SectionRaleigh, North Carolina 27601-2825www.ncpublicschools.org/accountability/testing
STATE BOARD OF EDUCATION
HOWARD N. LEEChairmanRaleigh
JANE P. NORWOODVice ChairCharlotte
KATHY A. TAFTGreenville
MICHELLE HOWARD-VITALWilmington
EDGAR D. MURPHYDurham
EVELYN B. MONROEWest End
MARIA T. PALMERChapel Hill
ROBERT “TOM” SPEEDBoone
WAYNE MCDEVITTAsheville
JOHN TATE IIICharlotte
BEVERLY PERDUELieutenant GovernorNew Bern
RICHARD MOOREState TreasurerKittrell
NC DEPARTMENT OF PUBLIC INSTRUCTIONPatricia N. Willoughby, State Superintendent301 N. Wilmington Street :: Raleigh, North Carolina 27601-2825 :: www.ncpublicschools.org
In compliance with federal laws, N C Public Schools administers all state-operated educational programs, employment activities and admissions without discriminationbecause of race, religion, national or ethnic orgin, color, age, military service, disability, or gender, except where exemption is appropriate and allowed by law.Inquiries or complaints should be directed to:
Dr. Elsie C. Leak, Associate SuperintendentOffice of Curriculum and School Reform Services 6307 Mail Services Center Raleigh, NC 27699-6307Telephone (919) 807-3761; fax (919) 807-3767

Report of Student Performance on the North Carolina Alternate Assessments, 2003-04
Report of Student
Performance on the
North Carolina Alternate Assessments
Reading, Mathematics, and Writing
Grades 3 - 8
North Carolina Alternate Assessment Academic Inventory (NCAAAI) North Carolina Alternate Assessment Portfolio (NCAAP)
2003-04
Published April 2005
Public Schools of North Carolina State Board of Education Department of Public Instruction Accountability Services/Test Development Section Raleigh, North Carolina 27601-2825 www.ncpublicschools.org/accountability/testing

© 2005 All rights reserved. This document may not be reproduced by any means, in whole or in part, without prior written permission from the North Carolina Department of Public Instruction, Division of Accountability Services, North Carolina Testing Program, Raleigh, North Carolina 27601-2825.

Report of Student Performance on the North Carolina Alternate Assessments, 2003-04
Acknowledgments
This report is the collaborative work of many individuals. The North Carolina Testing Program is conducted by the North Carolina Department of Public Instruction (NCDPI), Division of Accountability Services. Technical support services for the program are carried out in collaboration with the Center for Urban Affairs and Community Services at North Carolina State University under the Technical Outreach for Public Schools (TOPS) program. Mildred Bazemore, Chief of the North Carolina Test Development Section, and Charles Lanier, Educational Research and Evaluation Consultant in the North Carolina Test Development Section, directed the design of the report. Staff at TOPS assisted in analysis and report production. At TOPS we thank Alissa Bernholc, Erin Bohner, Sheila Brown, Nancy Lanier, Marcy Roan, Corre Robinson, Stephen Ward, Anthony Wells, and Karin Wolfe for assistance in creating tables and figures, verifying data accuracy, and coordinating report editing and production. At DPI, we thank Mildred Bazemore, Pam Biggs, Jim Kroening, Charles Lanier, and Scott Ragsdale for assistance in preparing all phases of this publication.
Thanks are due especially to the Regional Accountability Coordinators, and the Test Coordinators and Accountability staff at the 117 public school systems and the charter schools who provided the data presented in this report. This report could not exist without the dedication of these professionals.
This publication and the information contained within must not be used for personal or financial gain. North Carolina LEA school officials and teachers, parents, and students may download and duplicate this publication for instructional and educational purposes only. Others may not duplicate this publication without prior written permission from the North Carolina Department of Public Instruction (NCDPI) Division of Accountability Services/North Carolina Testing Program.

Report of Student Performance on the North Carolina Alternate Assessments, 2003-04
Report of Student Performance on the
North Carolina Alternate Assessments
2003-04
Table of Contents Introduction ..............................................................................................................................1 General Findings and Trends ...................................................................................................3 Maps of Statewide Totals by LEA ...........................................................................................8 Statewide Performance NCAAP and NCAAAI Combined ...................................................17
NCAAP and NCAAAI Combined ...................................................................................19 NCAAAI On-Level and Off-Level Combined.................................................................22
Statewide Performance NCAAP and NCAAAI.....................................................................25
Performance by Subject Area...........................................................................................27 Performance by Achievement Level ................................................................................29 Performance by Ethnicity, by Subject Area .....................................................................42 Performance by Gender, by Subject Area........................................................................48 Performance of Students with Disabilities, by Subject Area ...........................................50 Performance of Limited English Proficient Students, by Subject Area...........................56
Appendices .............................................................................................................................57 Appendix A: NCAAP Sample...............................................................................................59 Appendix B: NCAAAI Sample.............................................................................................61 Appendix C: List of North Carolina Charter Schools, 2003-04............................................63

Report of Student Performance on the North Carolina Alternate Assessments, 2003-04
1
Introduction
North Carolina Alternate Assessment Portfolio (NCAAP) To comply with the Individuals with Disabilities in Education Act (IDEA) of 1997, the North Carolina Alternate Assessment Portfolio (NCAAP) was administered statewide during the 2000–2001 school year to students with disabilities in grades 3 through 8 and grade 10. The assessment is a year-long, performance-based assessment process in which assessors collect and evaluate student work and progress relative to goals outlined in the student’s Individualized Education Program (IEP). In order to participate in NCAAP, students must be in grades 3 through 8 or in grade 10 according to the student information management system, (e.g., SIMS/NCWISE). Students must have a significant cognitive disability and a current IEP. Criteria also dictate that students be instructed in the North Carolina Standard Course of Study through the North Carolina Standard Course of Study Essences.
In the initial 2000-2001 program, student performance and growth were assessed in certain functional areas, or “domains.” These domains included Communication, Personal and Home Management, Career and Vocational, and Community. Based on the goals in their IEP, student tasks were evaluated according to four performance levels: Novice, Apprentice, Proficient, and Distinguished. These categorizations correspond to the Achievement Levels I through IV currently used by assessors to evaluate student performance. Prior to the enactment of the federal No Child Left Behind Act (NCLB) of 2001, it was recommended that teachers include literacy, numeracy, and technology goals in students’ portfolios. This legislation mandated that reading, mathematics, and writing areas be addressed in the NCAAP. The transitional portfolio retained the original four functional domains. However the recommendation to include literacy and numeracy in the IEP tasks selected for the portfolio became a requirement for the 2001-2002 portfolio. The full transition to an academic portfolio occurred with the 2002-2003 portfolio and the original functional domains were changed to the academic components of English/language arts, and mathematics. Writing is addressed within the English/language arts component of the NCAAP. Within the North Carolina Standard Course of Study for English/language arts, there are five competency goals and within the North Carolina Standard Course of Study for Mathematics, there are four strands. Each competency goal and strand is paired with a statement of its critical “essence.” These essence statements provide a broad interpretation of the competency goal to promote the inclusion of students with the most significant disabilities. The fourth and fifth competency goals in English/language arts are used in the NCAAP to demonstrate performance in writing for fourth, seventh, and tenth grade students participating in this year-long, performance-based assessment. North Carolina Alternate Assessment Academic Inventory (NCAAAI) Initiated in March 2001, the North Carolina Alternate Assessment Academic Inventory (NCAAAI) was developed to address the needs of exceptional children not met by the NCAAP and the North Carolina Computerized Adaptive Testing System (NCCATS). The NCAAAI is an assessment in which teachers utilize a checklist to evaluate student performance in the areas of reading and mathematics at grades 3 through 8 and 10, writing at grades 4, 7, and 10, and in high school courses in which an end-of-course (EOC) test is administered. Data are collected at the

Report of Student Performance on the North Carolina Alternate Assessments, 2003-04
2
North Carolina Alternate Assessment Academic Inventory (NCAAAI) (continued) beginning of the school year or course (baseline), in the middle (interim), and at the end of the school year or course (final). Eligible students with disabilities and students with limited English proficiency (LEP) may participate in the NCAAAI instead of taking the multiple-choice test as stated in State Board of Education (SBE) policy HSP-C-005. For students with disabilities, participation must be documented in each student’s current IEP. Beginning with the 2002-03 school year, LEP students that met length of enrollment and language proficiency requirements as set forth in SBE policy HSP-C-005 were eligible to participate in the NCAAAI. If the student is LEP and has an IEP, the IEP determines NCAAAI eligibility. Beginning with the 2003-04 school year, students with a Section 504 plan must participate in the standard test administration with or without test accommodations and are ineligible for participation in alternate assessments including the NCAAP. For each student participating in the NCAAAI, the assessor (teacher) receives an individual inventory folder. The folder includes the inventory (reading, mathematics, and/or writing or EOC) for the student, score descriptors, and baseline and student profiles to record individual student strengths and needs, as well as the student’s assessment history. Additionally, assessors are required to keep a student work folder as evidence to support the assessor’s scores for the student. The academic inventory is designed to monitor an individual student’s progress throughout the school year. Assessed objectives are the same as the North Carolina Standard Course of Study for reading, mathematics, and writing at each grade level or for high school courses. Objectives are listed by goals for mathematics, and by categories for reading and writing. Students with disabilities assessed using the NCAAAI in reading and mathematics may be assessed below grade level, depending on the decision of the IEP team. Students with LEP must be assessed on grade level for reading and mathematics. Students with disabilities and students with LEP who participate in high school courses that require an EOC exam may be assessed using the NCAAAI on grade level. As part of the writing assessment at grades 4, 7, and 10, the NCAAAI for writing was piloted during the 2002-03 school year as an alternate assessment for the standard administration. All students participating in the NCAAAI in writing must be assessed on grade level (at the assigned grade level) in grades 4, 7, and 10. There is no below grade level administration of the NCAAAI for writing or EOC assessments. Students assessed on grade level in any area may receive an Achievement Level of I, II, III, or IV if the assessor has assigned goal or category scores in the 5 to 8 range. Students that are assessed one or two grade levels below their assigned grade may not receive an Achievement Level of III or IV. Students that are assessed three or more grade levels below their assigned grade level and deemed to have the most significant cognitive disability may receive Achievement Levels of I, II, III, or IV if the assessor has assigned goal or category scores in the 5 to 8 range. The assessor (the teacher) also indicates on the academic checklist if the student achieved growth on the content being assessed. A PDF version of this report is available at: http://www.ncpublicschools.org/accountability/testing/reports.

Report of Student Performance on the North Carolina Alternate Assessments, 2003-04
3
General Findings and Trends Demographic Trends The graph below shows the total number of NCAAP students for 2002-03 and 2003-04.
Figure 1. 2002-03 & 2003-04 Number of NCAAP Students* *Refer to Tables 2 - 4 for the number of NCAAP and NCAAAI students combined by subject. The number of students in NCAAP increased to 3,417 in 2003-04 from 3,146 in 2002-03 for reading and mathematics. This represents an 8.6 percent increase in the number of students. Totals also increased among NCAAP students in writing, from 1,213 in 2002-03 to 1,422 in 2003-04, representing a 17.2 percent increase. As the following graph (Figure 2) indicates, the number of students in NCAAAI decreased overall in 2003-04 compared to 2002-03. The number of on-level reading and mathematics students decreased by 1,771 and 896, respectively, in 2003-04. This represents a 30.2 percent decrease in on-level reading students and a 16.5 percent decrease in on-level mathematics students. Off-level reading and mathematics students decreased by 3,687 and 3,262, respectively, in 2003-04. This represents a 30.3 percent decrease in off-level reading students and a 30.3 percent decrease in off-level mathematics students. Of the 12,583 students tested for reading in 2003-04, and the 18,041 in 2002-03, 32.5 percent were on-level. Of the 12,039 students tested for mathematics, 37.5 percent were on-level in 2003-04 vs. 33.4 percent of 16,197 students in 2002-03.
2002-03
N=1,213
2002-03 N=3,146
2003-04N=1,422
2003-04N=3,417
0
500
1,000
1,500
2,000
2,500
3,000
3,500
4,000
Reading & Mathematics Writing

Report of Student Performance on the North Carolina Alternate Assessments, 2003-04
4
4,086 4,518 4,224
8,497 7,521
0
2,000
4,000
6,000
8,000
10,000
12,000
14,000
16,000
18,000
Reading Mathematics Writing
5,857 5,414 4,988
12,18410,783
0
2,000
4,000
6,000
8,000
10,000
12,000
14,000
16,000
18,000
Reading Mathematics Writing
Off-Level
On-Level
Demographic Trends (continued)
Figure 2. 2002-03 & 2003-04 Number of NCAAAI Students* *Students can be tested on-level and/or off-level in one or more subjects. In 2003-04, there were 471 students who participated in the reading inventory and 142 students who participated in the mathematics inventory who were not included due to missing values. Male students outnumbered female students by almost two to one for both NCAAP and NCAAAI students in 2003-04. Males composed 63.7 percent of the 3,417 NCAAP students and 63.3 percent of the 14,480 NCAAAI students.1 Among ethnicity groups representing the 3,417 students in NCAAP:
• White males composed 30.8 percent of all students and 48.3 percent of all males, • Black males composed 27.1 percent of all students and 42.5 percent of all males, • White females made up 18.3 percent of all students and 50.6 percent of all females, • Black females made up 14.3 percent of all students and 39.5 percent of all females, • Hispanic males made up 2.2 percent of all students and 3.5 percent of all males, • Hispanic females made up 1.6 percent of all students and 4.4 percent of all females, • Multi-racial males represented 1.1 percent of all students and 1.8 percent of all males, • Asian males represented 1.0 percent of all students and 1.6 percent of all males, • American Indian males represented .9 percent of all students and 1.4 percent of all males, • Multi-racial females represented .7 percent of all students and 1.9 percent of all females, • Asian and American Indian females each represented .5 percent of all students and 1.3
percent of all females. Among ethnicity groups representing the 14,480 students in NCAAAI in 2003-04:
• Black males constituted 22.8 percent of all students and 36.0 percent of all males,
1 The 14,480 NCAAAI students includes students with no indication of whether they were tested on- or off-level.
2002-03 2003-04

Report of Student Performance on the North Carolina Alternate Assessments, 2003-04
5
Demographic Trends (continued)
• White males constituted 19.5 percent of all students and 30.7 percent of all males, • Hispanic males made up 16.6 percent of all students and 26.2 percent of all males, • Hispanic females made up 13.6 percent of all students and 37.1 percent of all females, • Black females represented 10.9 percent of all students and 29.8 percent of all females, • White females represented 9.4 percent of all students and 25.7 percent of all females, • Asian males represented 1.9 percent of all students and 3.0 percent of all males, • Asian females represented 1.5 percent of all students and 4.2 percent of all females, • American Indian males composed 1.7 percent of all students and 2.8 percent of all males, • Multi-racial males composed 0.8 percent of all students and 1.3 percent of all males, • American Indian females composed 0.8 percent of all students and 2.2 percent of all
females, • Multi-racial females composed 0.4 percent of all students and 1.0 percent of all females.
A higher proportion of NCAAAI students (28.2%) are designated as LEP than NCAAP students (1.8%) in 2003-04. This difference is due in large part to the fact that LEP status is one reason students participate in NCAAAI. The chart below displays the notable differences in the distribution of exceptional students within each alternate assessment.
Figure 3. 2003-04 Percent of NCAAP and NCAAAI Students with Exceptionalities
7.7
0.61.10.6 0.4
23.8
1.8
0.2
34.3
0.20.1
17.2
0.8
11.7
0.20.10.2
2.8
0.2 0.4
3.53.92.8
5.6
13.5
3.0
28.2
0.2
36.5
1.2
0.0
5.0
10.0
15.0
20.0
25.0
30.0
35.0
40.0
Autistic
Behavio
rally-
Emotional
ly Disa
bled
Deaf-B
lind
Educab
le Ment
ally D
isable
d
Hearin
g Impa
ired
Multiha
ndicappe
d
Not Ide
ntified/
Non
-LEP
Orthop
edical
ly Im
paired
Other Heal
th Im
paired
Seve
rely/P
rofoun
dly M
ental
ly Disable
d
Specif
ic Lear
ning D
isable
d
Speec
h/Languag
e Impair
ed
Traina
ble M
entall
y Disa
bled
Traumati
c Brai
n Inju
ry
Visuall
y Impa
ired
Limite
d Eng
lish P
roficien
t (LEP)
Perc
ent
NCAAP NCAAAI

Report of Student Performance on the North Carolina Alternate Assessments, 2003-04
6
Demographic Trends (continued) In 2003-04, the NCAAP students were distributed among the exceptionality categories as follows: trainable mentally disabled (34.3%), autistic (23.8%), multihandicapped (17.2%), and severely/profoundly mentally disabled (11.7%). Of all NCAAAI students, more than a third (36.5%) were in the educable mentally disabled and 13.5 percent were in the specific learning disabled categories respectively. Performance Trends Overall, students in both NCAAP and NCAAAI performed at higher Achievement Levels in 2003-04 compared to 2002-03. In every subject a larger proportion of NCAAP and NCAAAI students were performing either at or above Achievement Level III.
*NCAAAI students were not tested at Levels III and IV in off-level reading or mathematics in 2002-03. Over 96.0 percent of all NCAAP students demonstrated growth (where both scorers agree), 1.8 percent demonstrated some growth (where one scorer agrees and the other does not), and 1.5 percent of students demonstrated no growth.
NCAAAI NCAAP NCAAAI
Figure 4. 2002-03 & 2003-04 Percent of All NCAAP and NCAAAI Students At or Above Level III for All Subject Areas
47.7 47.6
13.217.2
7.4
70.3
61.7
24.1 26.2
11.7
31.1
*
52.2
*
74.3
28.4
0 10 20 30 40 50 60 70 80 90
100
Reading Mathematics Writing On-Level Reading On-LevelMathematics
Writing Off-Level Reading Off-LevelMathematics
2002-03 2003-04
NCAAAI
Perc
ent P
rofic
ient
NCAAP

Report of Student Performance on the North Carolina Alternate Assessments, 2003-04
7
Of the 90.2 percent of students in NCAAAI participating in reading and/or receiving an Achievement Level or growth score, 91.3 percent demonstrated growth, 5.1 percent did not, and 3.6 percent were missing responses. Of the 84.1 percent of NCAAAI students participating in mathematics, 93.2 percent demonstrated growth, 5.6 percent did not, and 1.2 percent were missing responses. Of the 30.6 percent tested in writing, 80.2 percent demonstrated growth, 15.9 percent did not, and 3.9 percent were missing responses.

Report of Student Performance on the North Carolina Alternate Assessments, 2003-04
8
Maps of Statewide Totals by LEA Out of the 117 LEAs in 2003-04, (including city units but not charter schools), the average number of NCAAP students in any particular LEA was 29 (SD=52.44) while the median was 13 students. The average density of NCAAP students in each LEA was 2.5 NCAAP students per 1,000 students enrolled (SD=2.82).2 The median number of NCAAP students per 1,000 was 2.19. The average number of NCAAAI students in each LEA was 141 while the median number was 77 students (SD=244.33). On average, LEAs contained about 12.44 NCAAAI students per 1,000 students enrolled in 2003-04 (SD=7.38). The median number of NCAAAI students per 1,000 was 11.3. Nineteen LEAs (not including Charter schools) contained no NCAAP students and one contained no NCAAAI students. The maps in Figures 5 and 6 show the distribution of NCAAP and NCAAAI students per 1,000 students for each LEA in North Carolina in 2003-04. Totals for city units and charter schools are not depicted in the maps but are listed in Table 1 at the end of this section.
Figure 5. 2003-04 Number of NCAAP Students Per 1,000 Students by LEA2
2 The number of NCAAP or NCAAAI students per 1,000 students is calculated by dividing the total number of NCAAP or NCAAAI students by first month Average Daily Membership (ADM) for grades 3-8 and 10, and multiplying by 1,000. Although there are LEAs and charter schools with fewer than 1,000 students in grades 3 and 8-10, all calculations are based on 1,000 students for comparison purposes.
,

Report of Student Performance on the North Carolina Alternate Assessments, 2003-04
9
Maps of Statewide Totals by LEA (continued) LEAs with the highest concentration were Newton-Conover City which had 16.4 NCAAP students per 1,000 and Shelby City which had 22.3 NCAAP students per 1,000.
Figure 6. 2003-04 Number of NCAAAI Students Per 1,000 Students by LEA
In 2003-04, one LEA (Clay County) had zero NCAAAI students and Hyde County had the highest number of NCAAAI students per 1,000 with 40.4 students.
,

Report of Student Performance on the North Carolina Alternate Assessments, 2003-04
10
Table 1. 2003-04 Number of NCAAP and NCAAAI Students Per 1,000 Students Enrolled, by LEA and Charter School3
LEA Name # NCAAP Students Per 1,000 # NCAAAI Students Per 1,000
ALAMANCE-BURLINGTON 1.0 5.2 ALEXANDER COUNTY 2.7 9.5 ALLEGHANY COUNTY 0.0 13.5 ANSON COUNTY 3.9 6.6 ASHE COUNTY 0.0 10.7 AVERY COUNTY 1.7 8.2 BEAUFORT COUNTY 3.5 1.7 BERTIE COUNTY 4.4 7.9 BLADEN COUNTY 1.2 9.9 BRUNSWICK COUNTY 1.2 12.6 BUNCOMBE COUNTY 2.8 12.8 ASHEVILLE CITY 0.0 35.2 BURKE COUNTY 2.3 6.1 CABARRUS COUNTY 2.5 15.0 KANNAPOLIS CITY 2.4 21.8 CALDWELL COUNTY 0.3 11.0 CAMDEN COUNTY 0.6 9.5 CARTERET COUNTY 1.9 12.6 CASWELL COUNTY 0.0 11.7 CATAWBA COUNTY 0.7 8.8 HICKORY CITY 0.0 11.5 NEWTON-CONOVER 16.4 26.9 CHATHAM COUNTY 0.0 24.4 CHEROKEE COUNTY 3.0 5.7 EDENTON/CHOWAN 1.2 3.6 CLAY COUNTY 0.0 0.0 CLEVELAND COUNTY 0.1 9.6 KINGS MOUNTAIN CITY 2.4 3.6 SHELBY CITY 22.3 15.6 COLUMBUS COUNTY 3.1 16.7 WHITEVILLE CITY 1.8 5.5 CRAVEN COUNTY 4.7 7.2 CUMBERLAND COUNTY 3.0 9.1 CURRITUCK COUNTY 0.0 11.5 DARE COUNTY 0.8 8.0 3The number of NCAAP and NCAAAI students per 1,000 students is calculated by dividing the total number of NCAAP or NCAAAI students by first month Average Daily Membership (ADM) for grades 3-8 and 10, multiplying by 1,000 and rounding to one decimal place.

Report of Student Performance on the North Carolina Alternate Assessments, 2003-04
11
LEA Name # NCAAP Students Per 1,000 # NCAAAI Students Per 1,000
DAVIDSON COUNTY 2.2 6.0 LEXINGTON CITY 0.0 36.6 THOMASVILLE CITY 0.0 29.2 DAVIE COUNTY 0.5 15.1 DUPLIN COUNTY 1.9 13.8 DURHAM COUNTY 3.8 12.7 EDGECOMBE COUNTY 4.7 7.0 FORSYTH COUNTY 3.3 17.8 FRANKLIN COUNTY 2.9 9.3 GASTON COUNTY 2.8 19.2 GATES COUNTY 2.5 6.1 GRAHAM COUNTY 5.9 0.8 GRANVILLE COUNTY 2.8 7.8 GREENE COUNTY 6.6 4.7 GUILFORD COUNTY 3.5 12.3 HALIFAX COUNTY 5.7 22.6 ROANOKE RAPIDS CITY 1.7 10.0 WELDON CITY 4.7 5.6 HARNETT COUNTY 0.7 22.3 HAYWOOD COUNTY 1.0 9.9 HENDERSON COUNTY 1.6 14.5 HERTFORD COUNTY 2.8 27.0 HOKE COUNTY 2.2 23.3 HYDE COUNTY 0.0 40.4 IREDELL-STATESVILLE 2.1 14.8 MOORESVILLE CITY 1.6 5.6 JACKSON COUNTY 4.1 7.7 JOHNSTON COUNTY 3.6 18.3 JONES COUNTY 7.3 22.5 LEE COUNTY 2.9 11.3 LENOIR COUNTY 4.2 10.6 LINCOLN COUNTY 1.9 6.8 MACON COUNTY 0.7 14.5 MADISON COUNTY 3.1 4.7 MARTIN COUNTY 0.0 2.7 MCDOWELL COUNTY 0.0 19.9 MECKLENBURG COUNTY 3.1 18.3 MITCHELL COUNTY 0.0 13.7 MONTGOMERY COUNTY 3.4 19.3 MOORE COUNTY 2.3 7.6 NASH-ROCKY MOUNT 0.0 9.5 NEW HANOVER COUNTY 4.3 9.7

Report of Student Performance on the North Carolina Alternate Assessments, 2003-04
12
LEA Name # NCAAP Students Per 1,000 # NCAAAI Students Per 1,000
NORTHAMPTON COUNTY 5.5 4.9 ONSLOW COUNTY 2.5 7.1 ORANGE COUNTY 0.8 10.0 CHAPEL HILL-CARRBORO 3.4 21.2 PAMLICO COUNTY 3.5 15.0 PASQUOTANK COUNTY 1.0 11.7 PENDER COUNTY 2.1 10.3 PERQUIMANS COUNTY 4.0 6.4 PERSON COUNTY 4.3 14.2 PITT COUNTY 1.5 13.0 POLK COUNTY 2.5 8.4 RANDOLPH COUNTY 1.7 6.1 ASHEBORO CITY 1.3 14.2 RICHMOND COUNTY 4.3 6.0 ROBESON COUNTY 3.0 25.9 ROCKINGHAM COUNTY 0.3 11.0 ROWAN-SALISBURY 0.0 11.9 RUTHERFORD COUNTY 3.9 3.5 SAMPSON COUNTY 1.6 15.7 CLINTON CITY 0.0 13.5 SCOTLAND COUNTY 6.5 14.9 STANLY COUNTY 1.9 16.0 STOKES COUNTY 1.9 4.4 SURRY COUNTY 1.4 13.4 ELKIN CITY 0.8 14.2 MOUNT AIRY CITY 1.1 23.1 SWAIN COUNTY 0.0 4.4 TRANSYLVANIA COUNTY 3.4 5.3 TYRRELL COUNTY 0.0 26.6 UNION COUNTY 2.3 12.1 VANCE COUNTY 4.5 14.0 WAKE COUNTY 2.7 8.1 WARREN COUNTY 4.5 8.3 WASHINGTON COUNTY 0.5 16.7 WATAUGA COUNTY 1.5 6.6 WAYNE COUNTY 3.1 11.5 WILKES COUNTY 3.2 9.3 WILSON COUNTY 2.5 5.3 YADKIN COUNTY 2.5 15.4 YANCEY COUNTY 1.6 15.0

Report of Student Performance on the North Carolina Alternate Assessments, 2003-04
13
Charter School Name # NCAAP Students Per 1,000 # NCAAAI Students Per 1,000
LAKESIDE SCHOOL 0.0 38.5 RIVER MILL ACADEMY 0.0 0.0
CLOVER GARDEN 0.0 2.9 NEW CENTURY CHARTER 0.0 9.4 GRANDFATHER ACADEMY 0.0 0.0
CROSSNORE ACADEMY 0.0 43.5 WASHINGTON MONTESSORI 0.0 16.1 CHARTER DAY SCHOOL 0.0 2.6
EVERGREEN COMMUNITY CHARTER 0.0 17.3 ARTSPACE CHARTER 0.0 38.1 F DELANY NEW SCHOOL 0.0 35.0
THE NEW DIMENSIONS 0.0 0.0 CAPE LOOKOUT HIGH SCHOOL 0.0 0.0 TILLER SCHOOL 0.0 17.7
ENGELMANN SCH OF ART 0.0 14.3 CHATHAM CHARTER 0.0 0.0 WOODS CHARTER 0.0 5.9
THE LEARNING CENTER 0.0 76.0 ALPHA ACADEMY 0.0 0.0 MAUREEN JOY CHARTER 0.0 20.1
HEALTHY START ACADEMY 0.0 0.0 CARTER COMMUNITY 0.0 43.9 KESTREL HEIGHTS SCHOOL 0.0 6.2
OMUTEKO GWAMAZIIMA 0.0 10.4 RESEARCH TRI CHARTER 0.0 0.0 ANN ATWATER CMTY 0.0 0.0
QUALITY EDUC ACADEMY 0.0 113.1 DOWNTOWN MIDDLE SCHOOL 0.0 27.3 WOODSON SCH OF CHAL 0.0 0.0
THE E WINSTON PRIM 0.0 8.2 FORSYTH ACADEMIES 0.0 1.6 ARTS BASED ELEMENTARY 0.0 5.9
A CHILD'S GARDEN SCHOOL 0.0 0.0 HIGHLAND CHARTER 0.0 0.0 PIEDMONT COMMTY CHAR 0.0 6.2
IMANI INSTITUTE 0.0 0.0 GREENSBORO ACADEMY 0.0 0.0 GUILFORD CHARTER 0.0 0.0
PHOENIX ACADEMY INC 0.0 0.0 THE MOUNTAIN COMMUNITY SCHOOL 0.0 67.1 AMERICAN RENAISSANCE 0.0 0.0
AM RENAISSANCE MID 0.0 5.7

Report of Student Performance on the North Carolina Alternate Assessments, 2003-04
14
Charter School Name # NCAAP Students Per 1,000 # NCAAAI Students Per 1,000
SUCCESS INSTITUTE 0.0 129.4
SUMMIT CHARTER 0.0 11.5 PROVISIONS ACADEMY 0.0 0.0 CHILDREN'S VILLAGE 0.0 15.9
LINCOLN CHARTER 0.0 0.0 COMMUNITY CHARTER SC 0.0 12.8 SUGAR CREEK CHARTER 0.0 10.3
KENNEDY CHARTER 0.0 14.9 LAKE NORMAN CHARTER 0.0 0.0 METROLINA REG SCH ACADEMY 0.0 0.0
QUEEN'S GRANT CMTY 0.0 9.0 CROSSROADS CHARTER 0.0 0.0 ACADEMY OF MOORE COUNTY 0.0 97.2
STARS CHARTER 0.0 0.0 ROCKY MOUNT PREP 0.0 26.7 CAPE FEAR CENTER INQUIRY 0.0 0.0
GASTON COLLEGE PREP 0.0 0.0 ORANGE CHARTER 0.0 11.1 ARAPAHOE CHARTER 0.0 0.0
BETHEL HILL CHARTER 0.0 0.0 CIS ACADEMY 0.0 0.0 BETHANY CMTY MIDDLE 0.0 0.0
ROWAN ACADEMY 0.0 0.0 THOMAS JEFFERSON ACADEMY 0.0 3.1 LAURINBURG CHARTER 0.0 0.0
LAURINBURG HOMEWORK CENTER 0.0 0.0 GRAY STONE DAY 0.0 0.0 MILLENNIUM CHARTER 0.0 0.0
MOUNTAIN DISCOVERY 0.0 12.2 BREVARD ACADEMY 0.0 15.0 UNION ACADEMY 0.0 1.9
VANCE CHARTER SCHOOL 0.0 0.0 EXPLORIS 0.0 0.0 BAKER CHARTER HIGH 0.0 0.0
MAGELLAN CHARTER 0.0 0.0 STERLING MONTESSORI 0.0 15.2 FRANKLIN ACADEMY 0.0 2.5
EAST WAKE ACADEMY 0.0 0.0 SPARC ACADEMY 0.0 0.0 RALEIGH CHARTER HIGH 0.0 0.0
TORCHLIGHT ACADEMY 0.0 0.0 PREEMINENT CHARTER 0.0 0.0

Report of Student Performance on the North Carolina Alternate Assessments, 2003-04
15
Charter School Name # NCAAP Students Per 1,000 # NCAAAI Students Per 1,000
QUEST ACADEMY 0.0 0.0
COMMUNITY PARTNERS 0.0 10.6 HOPE ELEMENTARY 0.0 0.0 HALIWA-SAPONI TRIBAL 0.0 0.0
DILLARD ACADEMY 0.0 0.0 BRIDGES CHARTER SCHOOL 0.0 49.6 SALLIE B HOWARD SCHOOL 0.0 55.3

17
Statewide Performance
NCAAP and NCAAAI Combined
2003-04

Report of Student Performance on the North Carolina Alternate Assessments, 2003-04
Category
Number of
Students2
Percent of All
Students3Percent at
Level IPercent at
Level IIPercent at Level III
Percent at Level IV
Percent At or Above Level III
Percent Achieving Growth
Percent Not Achieving Growth
All Students 16,469 100.0 25.3 34.9 26.1 10.5 36.7 92.7 ≤5.0.0Gender
Female 5,917 35.9 26.8 35.5 23.6 10.2 33.8 92.0 ≤5.0.0Male 10,546 64.0 24.5 34.6 27.6 10.7 38.3 93.0 ≤5.0.0Not Coded 6 0.0 16.7 16.7 0.0 66.7 66.7 ≥95.0 ≤5.0.0
EthnicityAmerican Indian 362 2.2 10.2 27.6 47.8 14.4 62.2 ≥95.0 ≤5.0Asian 447 2.7 37.4 36.1 14.3 ≤5.0 18.4 84.8 7.2Black 6,012 36.5 20.9 35.9 29.5 12.7 42.2 ≥95.0 ≤5.0Hispanic 3,757 22.8 41.8 32.7 13.8 ≤5.0 16.2 82.2 8.9Multi-Racial 225 1.4 17.4 37.5 27.7 15.2 42.9 ≥95.0 ≤5.0White 5,627 34.2 19.4 35.8 30.3 13.5 43.8 ≥95.0 ≤5.0
Not Exceptional4 3,538 21.5 46.2 31.8 9.8 ≤5.0 10.5 78.5 10.3All Students with Disabilities 12,926 78.5 19.6 35.8 30.6 13.2 43.9 ≥95.0 ≤5.0
Behaviorally-Emotionally Disabled 386 2.3 23.6 42.0 27.5 6.0 33.4 94.0 ≤5.0Hearing Impaired 163 1.0 29.4 44.2 19.6 6.1 25.8 ≥95.0 ≤5.0Educable Mentally Disabled 5,298 32.2 21.7 41.0 29.5 6.8 36.4 ≥95.0 ≤5.0
Specific Learning Disabled4 1,814 11.0 21.0 40.4 29.7 7.7 37.3 ≥95.0 ≤5.0Learning Disabled-Reading 1,979 12.0 22.4 40.0 29.7 7.0 36.7 ≥95.0 ≤5.0Learning Disabled-Mathematics 1,233 7.5 23.7 41.0 29.0 5.1 34.1 ≥95.0 ≤5.0Learning Disabled-Written Expression 1,421 8.6 22.9 40.8 29.3 6.1 35.4 ≥95.0 ≤5.0Learning Disabled-Other 101 0.6 25.7 44.6 20.8 7.9 28.7 ≥95.0 ≤5.0
Speech-Language Impaired 55 0.3 27.3 43.6 21.8 7.3 29.1 ≥95.0 ≤5.0Visually Impaired 29 0.2 20.7 34.5 31.0 13.8 44.8 ≥95.0 ≤5.0Other Health Impaired 853 5.2 21.2 38.6 29.9 9.4 39.3 ≥95.0 ≤5.0Orthopedically Impaired 107 0.6 19.6 47.7 26.2 5.6 31.8 ≥95.0 ≤5.0Traumatic Brain Injury 78 0.5 15.4 38.5 30.8 14.1 44.9 ≥95.0 ≤5.0Autistic 1,350 8.2 16.5 26.5 34.0 22.2 56.2 ≥95.0 ≤5.0Severely/Profoundly Mentally Disabled 405 2.5 17.5 19.0 32.6 30.9 63.5 ≥95.0 ≤5.0Multihandicapped 752 4.6 16.9 24.0 30.8 27.6 58.4 ≥95.0 ≤5.0Deaf-Blind 7 0.0 ≤5.0 28.6 57.1 14.3 71.4 ≥95.0 ≤5.0Trainable Mentally Disabled 1,606 9.8 12.3 25.6 34.7 27.3 62.0 ≥95.0 ≤5.0Section 504 23 0.1 39.1 26.1 30.4 ≤5.0 30.4 ≥95.0 ≤5.0
Limited English Proficient (LEP) 3,833 23.3 43.6 33.1 11.6 ≤5.0 13.1 80.6 9.7Not Served by Title I 9,494 57.6 24.1 35.5 25.5 11.8 37.3 93.0 ≤5.0Schoolwide Title I Program 6,608 40.1 26.1 34.1 27.7 9.2 36.8 92.6 ≤5.0Targeted Assistance 203 1.2 39.4 38.9 17.2 ≤5.0 19.7 89.2 9.4Migrant 497 3.0 42.7 29.4 20.3 ≤5.0 23.3 86.5 9.5
Assigned Grade3 2,486 15.1 34.6 36.2 20.0 5.7 25.7 91.4 ≤5.04 2,880 17.5 26.4 36.5 25.3 8.9 34.2 93.2 ≤5.05 2,804 17.0 20.9 33.6 30.2 12.4 42.6 93.8 ≤5.06 2,518 15.3 25.5 35.4 26.7 9.6 36.3 92.8 ≤5.07 2,345 14.2 24.6 34.4 26.6 11.3 37.9 92.5 ≤5.08 2,169 13.2 21.0 33.4 28.7 13.6 42.3 92.8 ≤5.09 2 0.0 * * * * * * *
10 1,263 7.7 22.9 34.5 24.6 15.0 39.7 91.1 5.1Notes: 1Combines the total number of students in NCAAP reading and NCAAAI on-level and off-level reading
2Total number of students assessed for reading; not all students were scored for growth. 3"Percent of All Students" within a category may not add up to 100.0 percent due to rounding or blanks. 4Inconsistencies in numbers reported are due to errors in coding on student answer sheets.
*Performance data are not reported when number of students is fewer than five. Performance data that are less than or equal to 5.0 percent, or greater than or equal to 95.0 percent, are not displayed.
When summed, subgroup N counts may not match the "All Students" N count because of incomplete coding on some student answer sheets. The total of "All Students with Disabilities" includes Section 504 but not those in the "Not Coded" category. Prepared by the NCDPI Division of Accountability Services/North Carolina Testing Program.
Table 2. 2003-04 North Carolina Alternate Assessment Totals - NCAAP and NCAAAI Combined1
Statewide Performance in Reading*
19

Report of Student Performance on the North Carolina Alternate Assessments, 2003-04
Category
Number of
Students2
Percent of All
Students3Percent at
Level IPercent at
Level IIPercent at Level III
Percent at Level IV
Percent At or Above Level III
Percent Achieving Growth
Percent Not Achieving Growth
All Students 15,595 100.0 27.8 33.4 27.9 9.7 37.6 94.2 ≤5.0Gender
Female 5,898 37.8 29.0 34.5 26.3 9.0 35.3 94.1 ≤5.0Male 9,691 62.1 27.0 32.7 28.9 10.1 39.0 94.3 ≤5.0Not Coded 6 0.0 ≤5.0 33.3 16.7 50.0 66.7 ≥95.0 ≤5.0
EthnicityAmerican Indian 303 1.9 13.2 25.4 43.9 16.8 60.7 ≥95.0 ≤5.0Asian 426 2.7 32.2 35.5 25.2 5.2 30.4 90.8 7.0Black 5,569 35.7 23.1 33.1 31.0 11.7 42.7 ≥95.0 ≤5.0Hispanic 3,875 24.8 42.8 34.3 18.5 ≤5.0 21.0 89.2 9.6Multi-Racial 213 1.4 22.2 33.0 27.8 15.6 43.4 ≥95.0 ≤5.0White 5,170 33.2 22.3 33.5 30.8 12.5 43.3 ≥95.0 ≤5.0
Not Exceptional4 3,828 24.5 44.9 34.3 16.8 ≤5.0 18.8 87.9 10.8All Students with Disabilities 11,763 75.4 22.2 33.1 31.5 12.3 43.8 ≥95.0 ≤5.0
Behaviorally-Emotionally Disabled 328 2.1 29.0 40.2 23.2 6.7 29.9 93.6 5.5Hearing Impaired 132 0.8 25.8 44.7 23.5 5.3 28.8 ≥95.0 ≤5.0Educable Mentally Disabled 5,077 32.6 24.7 39.9 28.0 6.5 34.5 ≥95.0 ≤5.0
Specific Learning Disabled4 1,035 6.6 22.8 42.5 26.2 5.6 31.8 94.1 ≤5.0Learning Disabled-Reading 1,183 7.6 23.1 41.8 27.6 5.3 32.9 ≥95.0 ≤5.0Learning Disabled-Mathematics 1,048 6.7 23.1 42.8 27.6 ≤5.0 32.1 ≥95.0 ≤5.0Learning Disabled-Written Expression 913 5.9 24.2 42.4 26.8 ≤5.0 31.4 ≥95.0 ≤5.0Learning Disabled-Other 85 0.5 35.3 47.1 16.5 ≤5.0 17.6 90.6 9.4
Speech-Language Impaired 49 0.3 26.5 46.9 16.3 8.2 24.5 ≥95.0 ≤5.0Visually Impaired 26 0.2 15.4 42.3 30.8 11.5 42.3 ≥95.0 ≤5.0Other Health Impaired 780 5.0 26.3 36.6 27.1 9.2 36.3 ≥95.0 ≤5.0Orthopedically Impaired 112 0.7 24.1 37.5 30.4 6.3 36.6 ≥95.0 ≤5.0Traumatic Brain Injury 77 0.5 19.5 41.6 27.3 11.7 39.0 ≥95.0 ≤5.0Autistic 1,354 8.7 18.1 23.3 39.7 18.1 57.7 ≥95.0 ≤5.0Severely/Profoundly Mentally Disabled 405 2.6 23.7 14.3 37.3 24.7 62.0 ≥95.0 ≤5.0Multihandicapped 750 4.8 20.3 20.2 37.3 21.4 58.7 ≥95.0 ≤5.0Deaf-Blind 7 0.0 ≤5.0 28.6 71.4 ≤5.0 71.4 ≥95.0 ≤5.0Trainable Mentally Disabled 1,610 10.3 14.0 19.2 40.0 26.6 66.7 ≥95.0 ≤5.0Section 504 21 0.1 23.8 38.1 28.6 ≤5.0 33.3 ≥95.0 ≤5.0
Limited English Proficient (LEP) 3,898 25.0 43.4 34.7 17.8 ≤5.0 19.9 88.4 10.2Not Served by Title I 9,166 58.8 26.9 33.0 27.9 10.8 38.7 94.5 ≤5.0Schoolwide Title I Program 6,074 38.9 28.6 33.6 28.3 8.5 36.8 94.3 ≤5.0Targeted Assistance 184 1.2 37.0 40.2 15.8 ≤5.0 19.6 85.9 13.6Migrant 534 3.4 32.4 38.8 25.7 ≤5.0 28.1 91.2 8.6
Assigned Grade3 2,285 14.7 35.6 35.8 22.0 5.8 27.8 94.4 ≤5.04 2,647 17.0 31.5 34.6 25.7 7.3 33.0 ≥95.0 ≤5.05 2,581 16.6 26.4 31.3 31.1 10.0 41.2 ≥95.0 ≤5.06 2,416 15.5 28.3 33.8 27.6 9.1 36.7 92.8 5.67 2,281 14.6 24.5 34.6 28.5 11.0 39.5 94.8 ≤5.08 2,158 13.8 22.3 32.7 30.4 13.4 43.8 94.2 ≤5.09 3 0.0 * * * * * * *
10 1,222 7.8 22.6 28.8 31.9 14.1 45.9 91.0 5.8Notes: 1Combines the total number of students in NCAAP mathematics and NCAAAI on-level and off-level mathematics
2Total number of students assessed for mathematics; not all students were scored for growth. 3"Percent of All Students" within a category may not add up to 100.0 percent due to rounding or blanks. 4Inconsistencies in numbers reported are due to errors in coding on student answer sheets.
*Performance data are not reported when number of students is fewer than five. Performance data that are less than or equal to 5.0, or greater than or equal to 95.0 percent, are not displayed.
When summed, subgroup N counts may not match the "All Students" N count because of incomplete coding on some student answer sheets. The total of "All Students with Disabilities" includes Section 504 but not those in the "Not Coded" category. Prepared by the NCDPI Division of Accountability Services/North Carolina Testing Program.
Table 3. 2003-04 North Carolina Alternate Assessment Totals - NCAAP and NCAAAI Combined1
Statewide Performance in Mathematics*
20

Report of Student Performance on the North Carolina Alternate Assessments, 2003-04
Category
Number of
Students2
Percent of All
Students3Percent at
Level IPercent at
Level IIPercent at Level III
Percent at Level IV
Percent At or Above Level III
Percent Achieving Growth
Percent Not Achieving Growth
All Students 5,641 100.0 44.7 30.2 13.7 10.7 24.5 87.0 12.3Gender
Female 2,150 38.1 45.6 30.0 13.3 10.5 23.8 88.0 11.3Male 3,489 61.9 44.2 30.3 14.0 10.9 24.8 86.4 13.0Not Coded 2 0.0 * * * * * * *
EthnicityAmerican Indian 148 2.6 37.8 29.7 25.0 7.4 32.4 79.1 20.9Asian 205 3.6 47.1 36.3 10.3 ≤5.0 15.2 90.7 8.3Black 1,913 33.9 40.0 29.7 16.2 13.6 29.8 88.6 10.5Hispanic 1,557 27.6 56.5 32.5 8.5 ≤5.0 10.3 84.9 15.1Multi-Racial 69 1.2 30.4 27.5 18.8 23.2 42.0 ≥95.0 ≤5.0White 1,736 30.8 40.5 28.0 14.9 15.9 30.8 86.9 12.0
Not Exceptional4 1,574 27.9 56.2 33.4 8.7 ≤5.0 9.5 85.4 14.6All Students with Disabilities 4,066 72.1 40.3 28.9 15.7 14.6 30.3 87.6 11.4
Behaviorally-Emotionally Disabled 109 1.9 36.7 36.7 23.9 ≤5.0 26.6 87.2 12.8Hearing Impaired 60 1.1 48.3 43.3 ≤5.0 ≤5.0 6.7 85.0 15.0Educable Mentally Disabled 1,574 27.9 48.7 34.3 11.8 ≤5.0 16.0 84.9 14.8
Specific Learning Disabled4 448 7.9 34.9 44.6 17.8 ≤5.0 20.5 86.8 12.1Learning Disabled-Reading 485 8.6 38.4 43.5 16.3 ≤5.0 17.9 86.0 13.8Learning Disabled-Mathematics 311 5.5 37.9 45.3 14.8 ≤5.0 16.1 88.7 10.9Learning Disabled-Written Expression 450 8.0 36.0 44.0 17.8 ≤5.0 19.6 86.9 12.9Learning Disabled-Other 27 0.5 40.7 48.1 11.1 ≤5.0 11.1 85.2 14.8
Speech-Language Impaired 26 0.5 57.7 34.6 7.7 ≤5.0 7.7 84.6 15.4Visually Impaired 3 0.1 * * * * * * *Other Health Impaired 224 4.0 49.6 28.1 13.8 7.6 21.4 87.1 12.9Orthopedically Impaired 33 0.6 48.5 30.3 18.2 ≤5.0 21.2 87.9 12.1Traumatic Brain Injury 21 0.4 38.1 ≤5.0 28.6 23.8 52.4 85.7 9.5Autistic 442 7.8 31.7 21.3 20.4 26.4 46.8 90.0 7.9Severely/Profoundly Mentally Disabled 177 3.1 28.5 15.1 20.9 35.5 56.4 ≥95.0 ≤5.0Multihandicapped 282 5.0 30.6 18.0 19.8 31.3 51.1 93.3 ≤5.0Deaf-Blind 5 0.1 20.0 20.0 40.0 20.0 60.0 80.0 20.0Trainable Mentally Disabled 650 11.5 32.0 16.9 16.9 34.2 51.1 88.6 10.3Section 504 12 0.2 50.0 8.3 33.3 8.3 41.7 ≥95.0 ≤5.0
Limited English Proficient (LEP) 1,592 28.2 56.2 32.9 8.8 ≤5.0 10.0 85.2 14.8Not Served by Title I 3,341 59.2 44.5 29.0 12.8 13.1 25.9 88.2 10.9Schoolwide Title I Program 2,171 38.5 44.7 31.5 15.6 7.7 23.2 84.8 14.8Targeted Assistance 57 1.0 59.6 40.4 ≤5.0 ≤5.0 ≤5.0 89.5 10.5Migrant 194 3.4 47.9 32.0 14.9 ≤5.0 17.0 88.7 11.3
Assigned Grade4 2,637 46.7 46.3 31.1 14.0 8.0 22.0 86.7 13.07 2,230 39.5 45.7 30.2 13.5 9.8 23.3 87.1 12.4
10 774 13.7 36.4 26.7 13.4 22.6 36.0 87.7 9.8
Notes: 1Combines total number of students in NCAAP and NCAAAI Writing 2Total number of students assessed for writing. Not all students were scored for growth. 3"Percent of All Students" within a category may not add up to 100.0 percent due to rounding or blanks. 4Inconsistencies in numbers reported are due to errors in coding on student answer sheets.
*Performance data are not reported when number of students is fewer than five. Performance data that are less than or equal to 5.0 percent, or greater than or equal to 95.0 percent, are not displayed.
When summed, subgroup N counts may not match the "All Students" N count because of incomplete coding on some student answer sheets. The total of "All Students with Disabilities" includes Section 504 but not those in the "Not Coded" category. Prepared by the NCDPI Division of Accountability Services/North Carolina Testing Program.
Table 4. 2003-04 North Carolina Alternate Assessment Totals - NCAAP and NCAAAI Combined1
Statewide Performance in Writing
21

Report of Student Performance on the North Carolina Alternate Assessments, 2003-04
CategoryNumber of
Students2
Percent of All
Students3Percent at
Level IPercent at
Level IIPercent at Level III
Percent at Level IV
Percent At or Above Level III
Percent Achieving Growth
Percent Not Achieving Growth
All Students 13,054 100.0 29.0 39.3 23.4 ≤5.0 27.8 91.3 5.1Gender
Female 4,684 35.9 30.7 39.8 20.7 ≤5.0 24.6 90.4 ≤5.0Male 8,369 64.1 28.1 39.0 24.9 ≤5.0 29.6 91.8 5.2Not Coded 1 0.0 * * * * * * *
EthnicityAmerican Indian 316 2.4 10.1 31.0 51.3 7.6 58.9 ≥95.0 ≤5.0Asian 396 3.0 40.2 37.4 11.6 ≤5.0 13.4 83.3 8.1Black 4,597 35.2 23.8 41.3 27.5 6.1 33.7 ≥95.0 ≤5.0Hispanic 3,629 27.8 43.0 33.2 12.7 ≤5.0 14.2 81.5 9.2Multi-Racial 163 1.2 20.9 42.9 25.2 8.0 33.1 ≥95.0 ≤5.0White 3,953 30.3 23.1 43.2 27.2 ≤5.0 32.3 ≥95.0 ≤5.0
Not Exceptional4 3,540 27.1 46.2 31.9 9.8 ≤5.0 10.5 78.5 10.3All Students with Disabilities 9,512 72.9 22.7 42.0 28.4 5.8 34.3 ≥95.0 ≤5.0
Behaviorally-Emotionally Disabled 381 2.9 23.6 42.5 26.8 6.0 32.8 94.2 ≤5.0Hearing Impaired 155 1.2 31.0 43.2 19.4 5.8 25.2 ≥95.0 ≤5.0Educable Mentally Disabled 5,034 38.6 22.3 42.4 29.0 5.3 34.4 ≥95.0 ≤5.0Specific Learning Disabled4 1,809 13.9 21.1 40.4 29.7 7.6 37.3 ≥95.0 ≤5.0
Learning Disabled-Reading 1,979 15.2 22.4 40.0 29.7 7.0 36.7 ≥95.0 ≤5.0Learning Disabled-Mathematics 1,233 9.4 23.7 41.0 29.0 5.1 34.1 ≥95.0 ≤5.0Learning Disabled-Written Expression 1,421 10.9 22.9 40.8 29.3 6.1 35.4 ≥95.0 ≤5.0Learning Disabled-Other 101 0.8 25.7 44.6 20.8 7.9 28.7 ≥95.0 ≤5.0
Speech-Language Impaired 49 0.4 28.6 46.9 22.4 ≤5.0 24.5 ≥95.0 ≤5.0Visually Impaired 24 0.2 25.0 33.3 33.3 8.3 41.7 ≥95.0 ≤5.0Other Health Impaired 757 5.8 22.3 41.5 28.9 6.3 35.3 ≥95.0 ≤5.0Orthopedically Impaired 80 0.6 23.8 53.8 18.8 ≤5.0 21.3 ≥95.0 ≤5.0Traumatic Brain Injury 56 0.4 17.9 50.0 23.2 7.1 30.4 ≥95.0 ≤5.0Autistic 537 4.1 27.7 39.1 26.1 ≤5.0 31.1 ≥95.0 ≤5.0Severely/Profoundly Mentally Disabled 7 0.1 14.3 71.4 14.3 ≤5.0 14.3 ≥95.0 ≤5.0Multihandicapped 164 1.3 18.9 41.5 32.3 ≤5.0 36.6 ≥95.0 ≤5.0Deaf-Blind 3 0.0 * * * * * * *Trainable Mentally Disabled 433 3.3 25.2 44.6 24.9 5.1 30.0 ≥95.0 ≤5.0Section 504 23 0.2 39.1 26.1 30.4 ≤5.0 30.4 ≥95.0 ≤5.0
Limited English Proficient (LEP) 3,772 28.9 44.2 33.3 11.0 ≤5.0 12.2 80.2 9.9Not Served by Title I 7,058 54.1 28.6 41.4 21.5 ≤5.0 25.9 91.3 ≤5.0Schoolwide Title I Program 5,644 43.2 28.6 36.9 26.4 ≤5.0 30.9 91.7 ≤5.0Targeted Assistance 201 1.5 39.8 39.3 16.9 ≤5.0 18.9 89.1 9.5Migrant 486 3.7 43.6 29.8 20.2 ≤5.0 21.8 86.2 9.7
Assigned Grade3 2,082 15.9 38.9 39.5 16.0 ≤5.0 17.3 89.9 6.04 2,407 18.4 30.0 40.2 22.6 ≤5.0 26.3 92.1 ≤5.05 2,253 17.3 24.5 37.3 28.5 6.2 34.7 92.7 ≤5.06 2,000 15.3 29.5 39.5 23.9 ≤5.0 27.5 91.7 ≤5.07 1,818 13.9 28.4 38.9 23.8 ≤5.0 28.6 90.9 5.48 1,647 12.6 23.5 38.9 26.6 6.7 33.3 91.1 ≤5.09 1 0.0 * * * * * * *
10 846 6.5 25.4 42.0 22.2 6.0 28.3 89.0 7.7
Notes: 1Combines total number of NCAAAI students in on-level and off-level reading including those students without a score for growth. 2Total number of students assessed for reading. Not all students were scored for growth. 3"Percent of All Students" within a category may not add up to 100.0 percent due to rounding or blanks. 4Inconsistencies in numbers reported are due to errors in coding on student answer sheets.
*Performance data are not reported when number of students is fewer than five. Performance data that are less than or equal to 5.0 percent, or greater than or equal to 95.0 percent, are not displayed.
When summed, subgroup N counts may not match the "All Students" N count because of incomplete coding on some student answer sheets. The total of "All Students with Disabilities" includes Section 504 but not those in the "Not Coded" category. Prepared by the NCDPI Division of Accountability Services/North Carolina Testing Program.
Table 5. 2003-04 NCAAAI1 Statewide Student Performance in On-Level and Off-Level Reading Combined
22

Report of Student Performance on the North Carolina Alternate Assessments, 2003-04
CategoryNumber of
Students2
Percent of All
Students3Percent at
Level IPercent at Level II
Percent at Level III
Percent at Level IV
Percent At or Above Level III
Percent Achieving Growth
Percent Not
Achieving Growth
All Students 12,181 100.0 31.7 39.5 23.3 ≤5.0 27.3 93.2 5.6Gender
Female 4,666 38.3 32.7 40.5 22.0 ≤5.0 25.2 93.1 5.6Male 7,514 61.7 31.1 38.8 24.1 ≤5.0 28.5 93.3 5.6Not Coded 1 0.0 * * * * * * *
EthnicityAmerican Indian 257 2.1 14.0 28.4 47.1 9.7 56.8 ≥95.0 ≤5.0Asian 376 3.1 33.2 38.8 22.6 ≤5.0 25.8 89.9 8.0Black 4,154 34.1 26.6 40.4 26.3 5.3 31.6 94.8 ≤5.0Hispanic 3,747 30.8 43.7 34.9 17.4 ≤5.0 19.4 88.7 9.9Multi-Racial 151 1.2 25.2 43.7 20.5 8.6 29.1 ≥95.0 ≤5.0White 3,496 28.7 26.3 43.9 24.4 ≤5.0 28.5 ≥95.0 ≤5.0
Not Exceptional4 3,831 31.5 44.9 34.3 16.9 ≤5.0 18.8 87.8 10.8All Students with Disabilities 8,349 68.5 25.6 41.8 26.2 ≤5.0 31.2 ≥95.0 ≤5.0
Behaviorally-Emotionally Disabled 323 2.7 29.1 40.9 22.9 6.2 29.1 93.8 5.6Hearing Impaired 124 1.0 27.4 46.0 21.0 ≤5.0 25.8 ≥95.0 ≤5.0Educable Mentally Disabled 4,813 39.5 25.3 41.5 27.2 ≤5.0 32.1 ≥95.0 ≤5.0Specific Learning Disabled4 1,030 8.5 22.8 42.5 26.2 5.5 31.7 94.5 ≤5.0
Learning Disabled-Reading 1,183 9.7 23.1 41.8 27.6 5.3 32.9 ≥95.0 ≤5.0Learning Disabled-Mathematics 1,048 8.6 23.1 42.8 27.6 ≤5.0 32.1 ≥95.0 ≤5.0Learning Disabled-Written Expression 913 7.5 24.2 42.4 26.8 ≤5.0 31.4 ≥95.0 ≤5.0Learning Disabled-Other 85 0.7 35.3 47.1 16.5 ≤5.0 17.6 90.6 9.4
Speech-Language Impaired 43 0.4 27.9 51.2 11.6 7.0 18.6 ≥95.0 ≤5.0Visually Impaired 21 0.2 19.0 52.4 23.8 ≤5.0 28.6 ≥95.0 ≤5.0Other Health Impaired 684 5.6 27.8 39.8 25.3 6.3 31.6 ≥95.0 ≤5.0Orthopedically Impaired 85 0.7 28.2 43.5 21.2 ≤5.0 25.9 ≥95.0 ≤5.0Traumatic Brain Injury 55 0.5 23.6 50.9 18.2 7.3 25.5 ≥95.0 ≤5.0Autistic 541 4.4 29.9 40.3 24.0 ≤5.0 27.4 ≥95.0 ≤5.0Severely/Profoundly Mentally Disabled 7 0.1 14.3 57.1 28.6 ≤5.0 28.6 85.7 14.3Multihandicapped 162 1.3 19.1 45.7 26.5 ≤5.0 31.5 ≥95.0 ≤5.0Deaf-Blind 3 0.0 * * * * * * *Trainable Mentally Disabled 437 3.6 26.3 44.2 26.1 ≤5.0 28.8 ≥95.0 ≤5.0Section 504 21 0.2 23.8 38.1 28.6 ≤5.0 33.3 ≥95.0 ≤5.0
Limited English Proficient (LEP) 3,839 31.5 43.9 34.9 17.2 ≤5.0 19.1 88.1 10.3Not Served by Title I 6,731 55.3 31.8 40.7 22.0 ≤5.0 25.7 93.3 5.4Schoolwide Title I Program 5,110 42.0 31.2 37.9 25.2 ≤5.0 29.6 93.5 5.5Targeted Assistance 182 1.5 37.4 40.7 14.8 ≤5.0 18.7 85.7 13.7Migrant 523 4.3 33.1 39.6 25.2 ≤5.0 26.6 91.0 8.8
Assigned Grade3 1,880 15.4 40.2 40.5 16.2 ≤5.0 18.2 93.5 5.74 2,175 17.9 35.8 39.4 21.0 ≤5.0 23.8 94.8 ≤5.05 2,030 16.7 30.3 37.4 26.7 ≤5.0 30.9 94.2 ≤5.06 1,898 15.6 32.3 39.3 22.7 ≤5.0 26.8 91.7 7.27 1,754 14.4 28.1 40.9 24.3 ≤5.0 29.2 93.8 ≤5.08 1,637 13.4 25.5 39.3 27.0 6.5 33.5 92.9 5.69 2 0.0 * * * * * * *
10 805 6.6 23.2 40.1 28.7 ≤5.0 32.7 88.7 8.8
Notes: 1Combines total number of NCAAAI students in on-level and off-level mathematics including those students without a score for growth. 2Total number of students assessed for mathematics. Not all students were scored for growth. 3"Percent of All Students" within a category may not add up to 100.0 percent due to rounding or blanks. 4Inconsistencies in numbers reported are due to errors in coding on student answer sheets.
*Performance data are not reported when number of students is fewer than five. Performance data that are less than or equal to 5.0 percent, or greater than or equal to 95.0 percent, are not displayed.
When summed, subgroup N counts may not match the "All Students" N count because of incomplete coding on some student answer sheets. The total of "All Students with Disabilities" includes Section 504 but not those in the "Not Coded" category. Prepared by the NCDPI Division of Accountability Services/North Carolina Testing Program.
Table 6. 2003-04 NCAAAI1 Statewide Student Performance in On-Level and Off-Level Mathematics Combined
23

Report of Student Performance on the North Carolina Alternate Assessments, 2003-04
CategoryNumber of
Students2
Percent of All
Students3Percent at
Level IPercent at Level II
Percent at Level III
Percent at Level IV
Percent At or Above Level III
Percent Achieving Growth
Percent Not Achieving Growth
All Students 4,224 100.0 52.7 34.6 10.7 ≤5.0 11.7 83.5 16.5Gender
Female 1,615 38.2 53.1 33.9 11.0 ≤5.0 12.2 85.0 15.0Male 2,609 61.8 52.5 35.1 10.5 ≤5.0 11.5 82.6 17.3
EthnicityAmerican Indian 132 3.1 40.2 31.8 28.0 ≤5.0 28.0 76.5 23.5Asian 186 4.4 50.0 37.6 9.1 ≤5.0 10.8 90.9 9.1Black 1,300 30.8 48.3 35.8 13.2 ≤5.0 15.2 84.5 15.5Hispanic 1,506 35.7 57.7 33.1 7.8 ≤5.0 8.4 84.4 15.6Multi-Racial 38 0.9 50.0 31.6 15.8 ≤5.0 18.4 92.1 7.9White 1,062 25.1 53.3 35.3 9.5 ≤5.0 10.3 80.3 19.6
Not Exceptional4 1,574 37.3 56.2 33.4 8.7 ≤5.0 9.5 85.4 14.6All Students with Disabilities 2,650 62.7 50.7 35.4 11.8 ≤5.0 13.1 82.4 17.5
Behaviorally-Emotionally Disabled 107 2.5 37.4 37.4 23.4 ≤5.0 25.2 86.9 13.1Hearing Impaired 56 1.3 50.0 42.9 5.4 ≤5.0 5.4 83.9 16.1Educable Mentally Disabled 1,447 34.3 51.4 36.0 10.7 ≤5.0 11.5 83.8 16.1Specific Learning Disabled4 444 10.5 34.9 44.6 17.8 ≤5.0 20.5 87.6 12.2
Learning Disabled-Reading 485 11.5 38.4 43.5 16.3 ≤5.0 17.9 86.0 13.8Learning Disabled-Mathematics 311 7.4 37.9 45.3 14.8 ≤5.0 16.1 88.7 10.9Learning Disabled-Written Expression 450 10.7 36.0 44.0 17.8 ≤5.0 19.6 86.9 12.9Learning Disabled-Other 27 0.6 40.7 48.1 11.1 ≤5.0 11.1 85.2 14.8
Speech-Language Impaired 24 0.6 58.3 33.3 8.3 ≤5.0 8.3 83.3 16.7Visually Impaired 3 0.1 * * * * * * *Other Health Impaired 185 4.4 55.7 29.2 13.0 ≤5.0 14.1 84.3 15.7Orthopedically Impaired 25 0.6 60.0 28.0 12.0 ≤5.0 12.0 84.0 16.0Traumatic Brain Injury 11 0.3 45.5 9.1 27.3 9.1 36.4 81.8 18.2Autistic 151 3.6 55.0 35.1 8.6 ≤5.0 9.3 76.8 23.2Severely/Profoundly Mentally Disabled 2 0.0 * * * * * * *Multihandicapped 45 1.1 71.1 22.2 ≤5.0 ≤5.0 ≤5.0 73.3 26.7Deaf-Blind 2 0.0 * * * * * * *Trainable Mentally Disabled 136 3.2 83.8 13.2 ≤5.0 ≤5.0 2.9 50.7 49.3Section 504 12 0.3 50.0 8.3 33.3 8.3 41.7 * *
Limited English Proficient (LEP) 1,563 37.0 56.9 33.1 8.3 ≤5.0 9.0 84.9 15.1Not Served by Title I 2,269 53.7 55.7 34.5 8.1 ≤5.0 8.9 83.9 16.1Schoolwide Title I Program 1,833 43.4 49.0 34.6 14.1 ≤5.0 15.7 82.4 17.5Targeted Assistance 57 1.3 59.6 40.4 ≤5.0 ≤5.0 ≤5.0 89.5 10.5Migrant 188 4.5 49.5 32.4 14.4 ≤5.0 14.9 88.3 11.7
Assigned Grade4 2,164 51.2 52.5 34.8 11.2 ≤5.0 12.0 84.1 15.97 1,703 40.3 53.4 34.1 10.3 ≤5.0 11.6 83.7 16.210 357 8.5 51.3 35.9 9.2 ≤5.0 10.9 78.7 21.3
Notes: 1Total number of NCAAAI students in writing; does not include thirty-one students who were tested off-level for writing (scores invalidated). 2Total number of students assessed for writing. 3"Percent of All Students" within a category may not add up to 100.0 percent due to rounding or blanks. 4Inconsistencies in numbers reported are due to errors in coding on student answer sheets.
*Performance data are not reported when number of students is fewer than five. Performance data that are less than or equal to 5.0 percent, or greater than or equal to 95.0 percent, are not displayed.
When summed, subgroup N counts may not match the "All Students" N count because of incomplete coding on some student answer sheets. The total of "All Students with Disabilities" includes Section 504 but not those in the "Not Coded" category. Prepared by the NCDPI Division of Accountability Services/North Carolina Testing Program.
Table 7. 2003-04 NCAAAI1 Statewide Student Performance in Writing
24

Statewide Performance
NCAAP and NCAAAI
2003-04
25

Report of Student Performance on the North Carolina Alternate Assessments, 2003-04
Percent Percent Percent Percent Percent Percent Percent Percent Percent Percent Percent Percent Not Number Percent of at at at at At or Above at at at at At or Above Achieving Achieving
Category of Students All Students1Level I Level II Level III Level IV Level III Level I Level II Level III Level IV Level III Growth Growth
All Students 3,417 100.0 10.9 18.1 36.5 33.8 70.3 13.5 11.5 44.2 30.1 74.3 ≥95.0 ≤5.0Gender Females 1,234 36.1 11.6 19.4 34.2 34.3 68.5 14.8 11.6 42.3 30.7 73.0 ≥95.0 ≤5.0 Males 2,178 63.7 10.5 17.4 37.9 33.4 71.3 12.9 11.4 45.3 29.7 75.0 ≥95.0 ≤5.0 Not Coded 5 0.1 20.0 * * 80.0 80.0 * 20.0 20.0 60.0 80.0 ≥95.0 ≤5.0Ethnicity American Indian 46 1.3 10.9 4.3 23.9 60.9 84.8 8.7 8.7 26.1 56.5 82.6 ≥95.0 ≤5.0 Asian 51 1.5 15.7 25.5 35.3 21.6 56.9 23.5 9.8 45.1 19.6 64.7 ≥95.0 ≤5.0 Black 1,415 41.4 11.4 18.4 35.6 33.9 69.5 12.8 11.6 44.6 30.4 75.0 ≥95.0 ≤5.0 Hispanic 130 3.8 8.5 20.0 44.6 26.9 71.5 16.9 15.4 48.5 19.2 67.7 ≥95.0 ≤5.0 Multi-Racial 62 1.8 8.1 22.6 33.9 33.9 67.7 14.5 6.5 45.2 32.3 77.4 ≥95.0 ≤5.0 White 1,674 49.0 10.6 18.0 37.3 33.4 70.7 13.9 11.5 44.0 29.9 73.9 ≥95.0 ≤5.0 Not Coded 39 1.1 12.8 5.1 28.2 53.8 82.1 7.7 7.7 41.0 43.6 84.6 ≥95.0 ≤5.027 All Students with Disabilities 3,414 99.9 10.9 18.1 36.5 33.8 70.3 13.5 11.5 44.2 30.1 74.3 ≥95.0 ≤5.0 Behaviorally-Emotionally Disabled 5 0.1 20.0 * 80.0 * 80.0 20.0 * 40.0 40.0 80.0 80.0 20.0 Hearing Impaired 8 0.2 ≤5.0 62.5 25.0 12.5 37.5 ≤5.0 25.0 62.5 12.5 75.0 ≥95.0 ≤5.0 Educable Mentally Disabled 264 7.7 10.2 14.0 38.6 34.8 73.5 12.1 9.8 41.3 34.5 75.8 ≥95.0 ≤5.0 Specific Learning Disabled 5 0.1 * * * 20.0 20.0 * * * 20.0 20.0 20.0 ≤5.0 Speech-Language Impaired 6 0.2 16.7 16.7 16.7 50.0 66.7 16.7 16.7 50.0 16.7 66.7 ≥95.0 ≤5.0 Visually Impaired 5 0.1 * 40.0 20.0 40.0 60.0 * * 60.0 40.0 ≥95.0 ≥95.0 ≤5.0 Other Health Impaired 96 2.8 12.5 15.6 37.5 33.3 70.8 15.6 13.5 39.6 30.2 69.8 ≥95.0 ≤5.0 Orthopedically Impaired 27 0.8 7.4 29.6 48.1 14.8 63.0 11.1 18.5 59.3 11.1 70.4 ≥95.0 ≤5.0 Traumatic Brain Injury 22 0.6 9.1 9.1 50.0 31.8 81.8 9.1 18.2 50.0 22.7 72.7 ≥95.0 ≤5.0 Autistic 813 23.8 8.9 18.0 38.9 33.3 72.2 10.0 11.7 49.7 27.7 77.4 ≥95.0 ≤5.0 Severely/Profoundly Mentally Disabled 398 11.6 17.6 18.1 32.9 31.4 64.3 23.9 13.6 37.4 25.1 62.6 ≥95.0 ≤5.0 Multihandicapped 588 17.2 16.3 19.0 30.3 34.0 64.3 20.6 13.1 40.1 25.9 66.0 ≥95.0 ≤5.0 Deaf-Blind 4 0.1 * * * * * * * * * * * * Trainable Mentally Disabled 1,173 34.3 7.6 18.6 38.2 35.5 73.7 9.4 9.8 45.2 35.5 80.6 ≥95.0 ≤5.0 Not Coded 3 0.1 * * * * * * * * * * * *Limited English Proficient (LEP) 62 1.8 11.3 21.0 46.8 21.0 67.7 12.9 19.4 51.6 16.1 67.7 ≥95.0 ≤5.0Not Served by Title I 2,437 71.3 10.8 18.3 37.1 33.0 70.1 13.3 11.7 44.1 30.3 74.4 ≥95.0 ≤5.0Schoolwide Title I Program 965 28.2 11.1 17.4 35.1 36.1 71.2 14.4 10.9 44.5 29.9 74.4 ≥95.0 ≤5.0Targeted Assistance 2 0.1 * * * * * * * * * * * *Migrant 11 0.3 ≤5.0 9.1 27.3 63.6 90.9 ≤5.0 ≤5.0 45.5 54.5 ≥95.0 ≥95.0 ≤5.0Notes 1"Percent of All Students" within a category may not sum to 100.0 percent due to rounding or blanks.
*Performance data are not reported when number of students is fewer than five. Performance data that are less than or equal to 5.0 percent, or greater than or equal to 95.0 percent, are not displayed. Data are not collected by subject for Section 504 or Specific Learning Disabled students. When summed, subgroup N counts may not match the "All Students" N count because of incomplete coding on some student answer sheets. Prepared by the NCDPI Division of Accountability Services/North Carolina Testing Program.
Table 8. 2003-04 NCAAP Statewide Student Performance at Each Achievement Level,Percent Achieving Growth, and Percent Not Achieving Growth,
Reading Mathematics
in Reading and Mathematics

Report of Student Performance on the North Carolina Alternate Assessments, 2003-04
Percent Percent Percent Percent Percent Percent Percent Number Percent of at at at at At or Above Achieving Not Achieving
Category of Students All Students1Level I Level II Level III Level IV Level III Growth Growth
All Students 1,422 100.0 20.1 16.2 22.5 39.2 61.7 ≥95.0 ≤5.0Gender Females 538 37.8 22.1 17.7 19.9 38.3 58.2 ≥95.0 ≤5.0 Males 882 62.0 18.9 15.3 24.1 39.8 63.9 ≥95.0 ≤5.0 Not Coded 2 0.1 * * * * * * *Ethnicity American Indian 16 1.1 18.8 12.5 ≤5.0 68.8 68.8 ≥95.0 ≤5.0 Asian 19 1.3 15.8 21.1 21.1 36.8 57.9 89.5 5.3 Black 614 43.2 21.5 16.0 22.0 37.9 59.9 ≥95.0 ≤5.0 Hispanic 51 3.6 19.6 13.7 31.4 35.3 66.7 ≥95.0 ≤5.0 Multi-Racial 31 2.2 6.5 22.6 22.6 48.4 71.0 ≥95.0 ≤5.0 White 678 47.7 19.9 16.2 23.0 39.5 62.5 ≥95.0 ≤5.0 Not Coded 13 0.9 ≤5.0 23.1 15.4 23.1 38.5 ≥95.0 ≤5.0All Students with Disabilities 1,421 99.9 20.1 16.2 22.5 39.3 61.8 ≥95.0 ≤5.0 Behaviorally-Emotionally Disabled 2 0.1 * * * * * * * Hearing Impaired 6 0.4 33.3 50.0 ≤5.0 16.7 16.7 ≥95.0 ≤5.0 Educable Mentally Disabled 127 8.9 16.5 14.2 23.6 44.1 67.7 ≥95.0 ≤5.0 Specific Learning Disabled 4 0.3 * * * * * * * Speech-Language Impaired 2 0.1 * * * * * * * Visually Impaired 1 0.1 * * * * * * * Other Health Impaired 39 2.7 20.5 23.1 17.9 38.5 56.4 ≥95.0 ≤5.0 Orthopedically Impaired 8 0.6 12.5 37.5 37.5 12.5 50.0 ≥95.0 ≤5.0 Traumatic Brain Injury 10 0.7 30.0 ≤5.0 30.0 40.0 70.0 90.0 10.0 Autistic 292 20.5 19.2 13.7 26.0 39.0 65.1 ≥95.0 ≤5.0 Severely/Profoundly Mentally Disabled 175 12.3 27.4 14.3 20.6 34.9 55.4 ≥95.0 ≤5.0 Multihandicapped 238 16.7 22.3 16.8 22.3 37.0 59.2 ≥95.0 ≤5.0 Deaf-Blind 3 0.2 * * * * * * * Trainable Mentally Disabled 514 36.1 17.9 17.7 21.2 42.0 63.2 ≥95.0 ≤5.0 Not Coded 1 0.1 * * * * * * *Limited English Proficient (LEP) 29 2.0 17.2 17.2 37.9 27.6 65.5 ≥95.0 ≤5.0Not Served by Title I 1,077 75.7 20.1 16.7 22.3 38.9 61.2 ≥95.0 ≤5.0Schoolwide Title I Program 338 23.8 20.7 14.2 23.4 40.8 64.2 ≥95.0 ≤5.0Targeted Assistance 0 0.0 * * * * * * *Migrant 6 0.4 ≤5.0 16.7 33.3 50.0 83.3 ≥95.0 ≤5.0
Notes: 1"Percent of All Students" within a category may not add up to 100.0 percent due to rounding or blanks. *Performance data are not reported when number of students is fewer than five. Performance data that are less than or equal to 5.0 percent, or greater than or equal to 95.0 percent, are not displayed. Data are not collected by subject for Section 504 or Specific Learning Disabled students. When summed, subgroup N counts may not match the "All Students" N count because of incomplete coding on some student answer sheets. Prepared by the NCDPI Division of Accountability Services/North Carolina Testing Program.
Table 9. 2003-04 NCAAP Statewide Student Performance at Each Achievment Level, Percent Achieving Growth, and Percent Not Achieving Growth,
in Writing
Writing
28

Report of Student Performance on the North Carolina Alternate Assessments, 2003-04
29
Prepared by the NCDPI Division of Accountability Services/North Carolina Testing Program.
Figure 7. 2002-03 to 2003-04 NCAAP Statewide Student Performance in Reading,Percent at Each Achievement Level,
2002-03 (N=3,146) and 2003-04 (N=3,417)
15.9
31.9 29.8
17.9
10.9
18.1
36.5 33.8
0
10
20
30
40
50
60
70
80
90
100
Percent at Level I Percent at Level II Percent at Level III Percent at Level IV
Perc
ent o
f Stu
dent
s
2002-03 2003-04

Report of Student Performance on the North Carolina Alternate Assessments, 2003-04
30
Prepared by the NCDPI Division of Accountability Services/North Carolina Testing Program.
Figure 8. 2002-03 to 2003-04 NCAAP Statewide Student Performance in Mathematics, Percent at Each Achievement Level,
2002-03 (N=3,146) and 2003-04 (N=3,417)
20.4 22.9
37.0
15.213.5 11.5
44.2
30.1
0
10
20
30
40
50
60
70
80
90
100
Percent at Level I Percent at Level II Percent at Level III Percent at Level IV
Perc
ent o
f Stu
dent
s
2002-03 2003-04
Report of Student Performance on the North Carolina Alternate Assessments, 2003-04
31
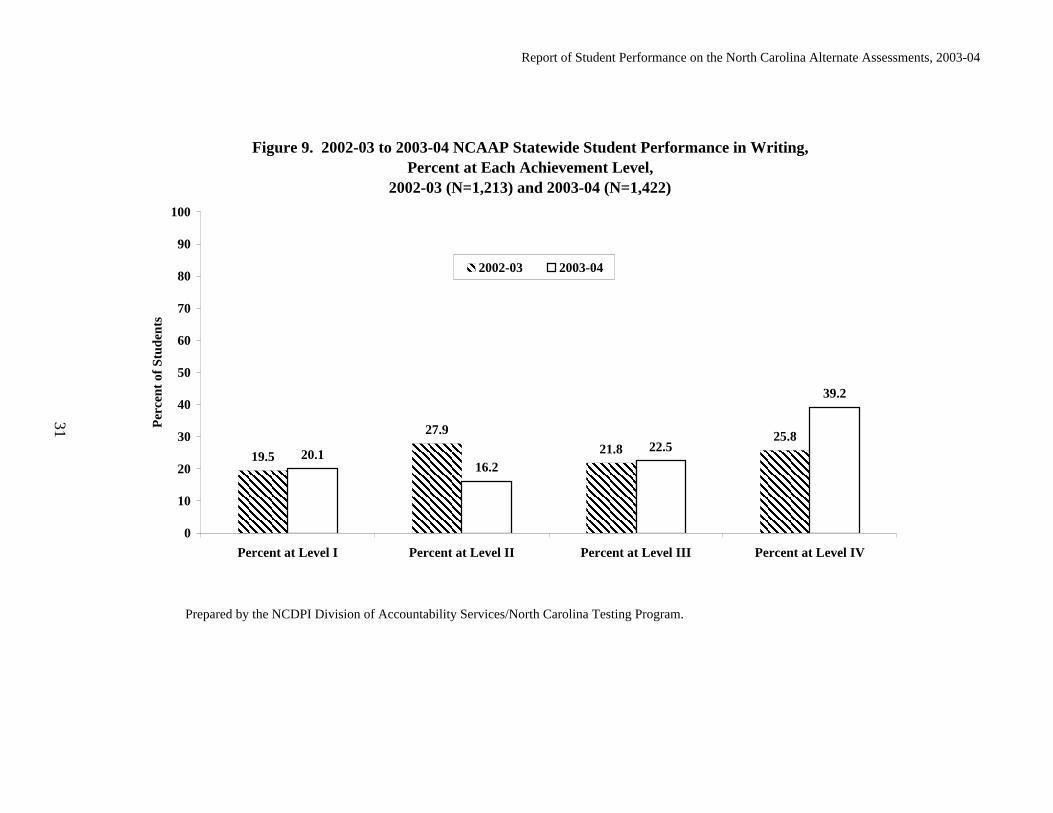
Prepared by the NCDPI Division of Accountability Services/North Carolina Testing Program.
Figure 9. 2002-03 to 2003-04 NCAAP Statewide Student Performance in Writing,Percent at Each Achievement Level,
2002-03 (N=1,213) and 2003-04 (N=1,422)
19.5
27.921.8
25.820.1
16.222.5
39.2
0
10
20
30
40
50
60
70
80
90
100
Percent at Level I Percent at Level II Percent at Level III Percent at Level IV
Perc
ent o
f Stu
dent
s
2002-03 2003-04

Report of Student Performance on the North Carolina Alternate Assessments, 2003-04
Category
Number of
Students2
Percent of All
Students3Percent at
Level IPercent at
Level IIPercent at Level III
Percent at Level IV
Percent At or Above Level III
Percent Achieving Growth
Percent Not Achieving Growth
All Students 4,086 100.0 42.3 33.2 21.4 ≤5.0 24.1 90.1 9.9Gender
Female 1,739 42.6 43.6 35.1 18.8 ≤5.0 21.0 90.9 9.1Male 2,347 57.4 41.4 31.8 23.3 ≤5.0 26.4 89.6 10.4
EthnicityAmerican Indian 186 4.6 5.4 26.3 61.3 7.0 68.3 ≥95.0 ≤5.0Asian 291 7.1 49.5 39.2 10.0 ≤5.0 10.7 90.4 9.6Black 540 13.2 19.6 22.2 48.9 9.3 58.1 93.1 6.9Hispanic 2,699 66.1 52.2 34.8 11.8 ≤5.0 12.6 88.3 11.7Multi-Racial 22 0.5 13.6 45.5 31.8 9.1 40.9 ≥95.0 ≤5.0White 348 8.5 17.0 35.9 41.1 5.5 46.6 ≥95.0 ≤5.0
Not Exceptional4 3,088 75.6 51.8 35.9 11.0 ≤5.0 11.9 88.3 11.7All Students with Disabilities 997 24.4 12.9 24.8 53.6 8.3 61.9 ≥95.0 ≤5.0
Behaviorally-Emotionally Disabled 41 1.0 17.1 22.0 53.7 7.3 61.0 90.2 9.8Hearing Impaired 14 0.3 57.1 7.1 35.7 ≤5.0 35.7 85.7 14.3Educable Mentally Disabled 465 11.4 12.7 25.4 54.4 7.5 61.9 94.8 5.2Specific Learning Disabled4 305 7.5 8.5 23.3 55.4 12.1 67.5 ≥95.0 ≤5.0
Learning Disabled-Reading 354 8.7 9.9 24.0 55.9 9.6 65.5 ≥95.0 ≤5.0Learning Disabled-Mathematics 186 4.6 11.3 27.4 55.4 5.4 60.8 94.6 5.4Learning Disabled-Written Expression 210 5.1 10.5 23.3 55.7 10.0 65.7 94.8 5.2Learning Disabled-Other 8 0.2 12.5 62.5 25.0 ≤5.0 25.0 ≥95.0 ≤5.0
Speech-Language Impaired 12 0.3 25.0 50.0 25.0 ≤5.0 25.0 ≥95.0 ≤5.0Visually Impaired 8 0.2 0.0 25.0 62.5 12.5 75.0 ≥95.0 ≤5.0Other Health Impaired 80 2.0 10.0 21.3 63.8 ≤5.0 67.5 ≥95.0 ≤5.0Orthopedically Impaired 3 0.1 * * * * * * *Traumatic Brain Injury 5 0.1 0.0 60.0 20.0 20.0 40.0 ≥95.0 ≤5.0Autistic 34 0.8 20.6 29.4 44.1 5.9 50.0 94.1 5.9Multihandicapped 5 0.1 0.0 60.0 40.0 ≤5.0 40.0 ≥95.0 ≤5.0Deaf-Blind 1 0.0 * * * * * * *Trainable Mentally Disabled 7 0.2 42.9 28.6 14.3 14.3 28.6 71.4 28.6Not Coded 1 0.0 * * * * * * *Section 504 17 0.4 47.1 11.8 35.3 ≤5.0 35.3 ≥95.0 ≤5.0
Limited English Proficient (LEP) 2,966 72.6 52.7 35.4 10.7 ≤5.0 11.5 88.0 12.0Not Served by Title I 1,794 43.9 47.6 37.5 13.2 ≤5.0 14.5 89.7 10.3Schoolwide Title I Program 2,089 51.1 36.2 30.1 29.4 ≤5.0 33.3 91.0 9.0Targeted Assistance 88 2.2 51.1 28.4 17.0 ≤5.0 19.3 81.8 18.2Migrant 399 9.8 51.1 28.3 19.5 ≤5.0 20.3 88.7 11.3
Assigned Grade3 702 17.2 40.3 29.3 28.8 ≤5.0 30.1 88.0 12.04 762 18.6 37.7 33.6 26.2 ≤5.0 28.5 91.1 8.95 684 16.7 38.2 32.6 25.6 ≤5.0 28.8 91.2 8.86 594 14.5 49.2 32.3 16.3 ≤5.0 18.4 90.6 9.47 628 15.4 46.7 35.7 15.1 ≤5.0 17.0 89.8 10.28 541 13.2 42.5 36.4 16.5 ≤5.0 20.5 92.2 7.810 175 4.3 48.0 33.7 9.7 8.6 18.3 82.9 17.1
Notes: 1On-level students are assessed at their assigned grade level. 2Total number of on-level students including those without a growth score. 3"Percent of All Students" within a category may not add up to 100.0 percent due to rounding or blanks 4Inconsistencies in numbers reported are due to errors in coding on student answer sheets.
*Performance data are not reported when number of students is fewer than five. Performance data that are less than or equal to 5.0 percent, or greater than or equal to 95.0 percent, are not displayed.
When summed, subgroup N counts may not match the "All Students" N count because of incomplete coding on some student answer sheets. The total of "All Students with Disabilities" includes Section 504 but not those in the "Not Coded" category. Prepared by the NCDPI Division of Accountability Services/North Carolina Testing Program
Table 10. 2003-04 NCAAAI1 Statewide Performance of On-Level Students1 in Reading
32

Report of Student Performance on the North Carolina Alternate Assessments, 2003-04
33
Notes: 1Performance data are not reported when membership is fewer than five. Performance data that are less than 5.0 percent, or greater tha or equal to 95.0 percent, are not displayed. Prepared by the NCDPI Division of Accountability Services/North Carolina Testing Program.
Figure 10. 2002-03 to 2003-04 NCAAAI Statewide Performance1 of On-Level Students in Reading, at Each Achievement Level,
2002-03 (N=5,857) and 2003-04 (N=4,086)
58.2
27.9
12.3
42.3
33.2
21.4
≤5 ≤50
10
20
30
40
50
60
70
80
90
100
Percent at Level I Percent at Level II Percent at Level III Percent at Level IV
Perc
ent o
f Stu
dent
s
2002-03 2003-04

Report of Student Performance on the North Carolina Alternate Assessments, 2003-04
CategoryNumber of Students2
Percent of All
Students3Percent at
Level IPercent at Level II
Percent at Level III1
Percent at Level IV1
Percent At or Above Level
III1
Percent Achieving Growth
Percent Not Achieving Growth
All Students 8,497 100.0 24.2 44.2 25.6 5.5 31.1 ≥95.0 ≤5.0Gender
Female 2,726 32.1 24.9 45.8 23.6 5.3 28.8 ≥95.0 ≤5.0Male 5,770 67.9 23.9 43.5 26.6 5.6 32.2 ≥95.0 ≤5.0
EthnicityAmerican Indian 130 1.5 16.9 37.7 36.9 8.5 45.4 ≥95.0 ≤5.0Asian 72 0.8 20.8 47.2 23.6 6.9 30.6 93.1 5.6Black 4,015 47.3 24.6 44.3 25.0 5.8 30.7 ≥95.0 ≤5.0Hispanic 591 7.0 25.5 44.5 24.2 5.2 29.4 ≥95.0 ≤5.0Multi-Racial 137 1.6 22.6 43.8 24.8 8.0 32.8 ≥95.0 ≤5.0White 3,552 41.8 24.0 44.4 26.2 ≤5.0 31.3 ≥95.0 ≤5.0
Not Exceptional4 57 0.7 57.9 29.8 8.8 ≤5.0 8.8 89.5 10.5All Students with Disabilities 8,439 99.3 24.0 44.3 25.7 5.6 31.3 ≥95.0 ≤5.0
Behaviorally-Emotionally Disabled 336 4.0 24.7 45.5 23.8 6.0 29.8 ≥95.0 ≤5.0Hearing Impaired 141 1.7 28.4 46.8 17.7 6.4 24.1 ≥95.0 ≤5.0Educable Mentally Disabled 4,534 53.4 23.4 44.4 26.6 5.2 31.8 ≥95.0 ≤5.0Specific Learning Disabled4 1,488 17.5 23.8 44.4 24.7 6.8 31.5 ≥95.0 ≤5.0
Learning Disabled-Reading 1,612 19.0 25.2 43.8 24.1 6.5 30.6 ≥95.0 ≤5.0Learning Disabled-Mathematics 1,033 12.2 26.1 43.9 24.5 5.1 29.6 ≥95.0 ≤5.0Learning Disabled-Written Expression 1,200 14.1 25.2 44.3 24.9 5.4 30.3 ≥95.0 ≤5.0Learning Disabled-Other 92 1.1 27.2 43.5 20.7 8.7 29.3 ≥95.0 ≤5.0
Speech-Language Impaired 37 0.4 29.7 45.9 21.6 ≤5.0 24.3 ≥95.0 ≤5.0Visually Impaired 16 0.2 37.5 37.5 18.8 6.3 25.0 ≥95.0 ≤5.0Other Health Impaired 672 7.9 24.0 44.2 25.0 6.7 31.7 ≥95.0 ≤5.0Orthopedically Impaired 75 0.9 25.3 53.3 18.7 ≤5.0 21.3 ≥95.0 ≤5.0Traumatic Brain Injury 51 0.6 19.6 49.0 23.5 5.9 29.4 ≥95.0 ≤5.0Autistic 494 5.8 28.7 40.5 25.3 5.1 30.4 ≥95.0 ≤5.0Severely/Profoundly Mentally Disabled 7 0.1 14.3 71.4 14.3 ≤5.0 14.3 ≥95.0 ≤5.0Multihandicapped 155 1.8 20.0 41.9 32.9 ≤5.0 37.4 ≥95.0 ≤5.0Deaf-Blind 2 0.0 * * * * * * *Trainable Mentally Disabled 425 5.0 24.9 44.9 25.2 ≤5.0 30.1 ≥95.0 ≤5.0Section 504 6 0.1 16.7 66.7 16.7 ≤5.0 16.7 ≥95.0 ≤5.0
Limited English Proficient (LEP) 434 5.1 23.7 47.7 23.0 ≤5.0 27.6 ≥95.0 ≤5.0Not Served by Title I 4,992 58.8 23.2 44.9 25.6 5.7 31.3 ≥95.0 ≤5.0Schoolwide Title I Program 3,370 39.7 25.5 43.1 25.9 5.3 31.2 ≥95.0 ≤5.0Targeted Assistance 110 1.3 31.8 49.1 17.3 ≤5.0 19.1 ≥95.0 ≤5.0Migrant 67 0.8 11.9 47.8 29.9 7.5 37.3 ≥95.0 ≤5.0
Assigned Grade3 1,294 15.2 40.7 47.4 10.2 ≤5.0 11.6 ≥95.0 ≤5.04 1,567 18.4 27.8 45.4 21.9 ≤5.0 26.5 ≥95.0 ≤5.05 1,496 17.6 19.4 41.2 31.1 7.9 39.0 ≥95.0 ≤5.06 1,338 15.7 22.1 44.5 28.4 ≤5.0 32.9 ≥95.0 ≤5.07 1,125 13.2 19.9 42.8 30.0 6.8 36.7 ≥95.0 ≤5.08 1,032 12.1 15.0 42.8 33.5 8.5 42.1 ≥95.0 ≤5.010 644 7.6 20.3 46.0 26.6 5.6 32.1 94.4 5.4
Notes: 1Off-level students are not assessed at their assigned grade level. Students assessed 3 or more grade levels below their assigned grade level are eligible for any achievement ranking based on alternate achievement standards.
2Total number of off-level students including those without a growth score. 3"Percent of All Students" within a category may not add up to 100.0 percent due to rounding or blanks. 4Inconsistencies in numbers reported are due to errors in coding on student answer sheets. *Performance data are not reported when number of students is fewer than five. Performance data that are less than or equal to 5.0 percent, or greater than or equal to 95.0 percent, are not displayed. When summed, subgroup N counts may not match the "All Students" N count because of incomplete coding on some student answer sheets. The total of "All Students with Disabilities" includes Section 504 but not those in the "Not Coded" category. Prepared by the NCDPI Division of Accountability Services/North Carolina Testing Program.
Table 11. 2003-04 NCAAAI Statewide Performance of Off-Level1 Students in Reading
34

Report of Student Performance on the North Carolina Alternate Assessments, 2003-04
35
Notes: *Performance data are not reported when membership is fewer than five. Performance data that are less than or equal to 5.0 percent, or greater than or equal to 95.0 percent, are not displayed. Prepared by the NCDPI Division of Accountability Services/North Carolina Testing Program.
Figure 11. 2002-03 to 2003-04 NCAAAI Statewide Performance of Off-Level Students in Reading at Each Achievement Level,
2002-03 (N=12,184) and 2003-04 (N=8,497)
54.0
45.1
24.2
44.2
25.6
5.5* *
0
10
20
30
40
50
60
70
80
90
100
Percent at Level I Percent at Level II Percent at Level III Percent at Level IV
Perc
ent o
f Stu
dent
s
2002-03 2003-04

Report of Student Performance on the North Carolina Alternate Assessments, 2003-04
CategoryNumber of
Students2
Percent of All
Students3Percent at
Level IPercent at
Level IIPercent at Level III
Percent at Level IV
Percent At or Above Level III
Percent Achieving Growth
Percent Not Achieving Growth
All Students 4,518 100.0 40.1 33.2 23.2 ≤5.0 26.2 90.1 9.9Gender
Female 2,043 45.2 40.4 35.0 21.8 ≤5.0 24.0 90.6 9.3Male 2,475 54.8 39.8 31.7 24.3 ≤5.0 28.0 89.6 10.4
EthnicityAmerican Indian 136 3.0 6.6 25.7 60.3 7.4 67.6 ≥95.0 ≤5.0Asian 306 6.8 34.0 39.2 23.5 ≤5.0 26.8 91.5 8.5Black 486 10.8 24.5 21.8 44.9 8.8 53.7 92.0 8.0Hispanic 3,267 72.3 45.7 34.7 17.2 ≤5.0 18.9 89.0 11.0Multi-Racial 26 0.6 26.9 46.2 19.2 7.7 26.9 100.0 ≤5.0White 297 6.6 26.6 31.3 36.4 ≤5.0 41.1 93.6 6.1
Not Exceptional4 3,725 82.4 45.4 34.8 17.3 ≤5.0 19.2 89.0 11.0All Students with Disabilities 792 17.5 15.2 25.5 51.1 7.8 59.0 94.8 5.1
Behaviorally-Emotionally Disabled 38 0.8 18.4 28.9 39.5 10.5 50.0 92.1 7.9Hearing Impaired 10 0.2 70.0 20.0 10.0 ≤5.0 10.0 90.0 10.0Educable Mentally Disabled 433 9.6 14.1 23.8 54.5 7.6 62.1 94.5 5.5Specific Learning Disabled4 151 3.3 9.9 25.2 53.6 9.9 63.6 ≥95.0 ≤5.0
Learning Disabled-Reading 197 4.4 8.6 27.4 53.8 8.6 62.4 ≥95.0 ≤5.0Learning Disabled- Mathematics 167 3.7 7.8 28.7 54.5 7.2 61.7 ≥95.0 ≤5.0Learning Disabled-Written Expression 125 2.8 11.2 26.4 52.0 8.0 60.0 93.6 6.4Learning Disabled-Other 5 0.1 40.0 40.0 20.0 ≤5.0 20.0 ≥95.0 ≤5.0
Speech-Language Impaired 9 0.2 11.1 55.6 33.3 ≤5.0 33.3 ≥95.0 ≤5.0Visually Impaired 7 0.2 14.3 57.1 28.6 ≤5.0 28.6 ≥95.0 ≤5.0Other Health Impaired 71 1.6 14.1 21.1 59.2 5.6 64.8 ≥95.0 ≤5.0Orthopedically Impaired 4 0.1 * * * * * * *Traumatic Brain Injury 3 0.1 * * * * * * *Autistic 35 0.8 22.9 34.3 31.4 11.4 42.9 91.4 8.6Severely/Profoundly Mentally Disabled 1 0.0 * * * * * * *Multihandicapped 4 0.1 * * * * * * *Deaf-Blind 1 0.0 * * * * * * *Trainable Mentally Disabled 10 0.2 40.0 30.0 30.0 ≤5.0 30.0 80.0 20.0Not Coded 1 0.0 * * * * * * *Section 504 16 0.4 25.0 31.3 37.5 6.3 43.8 ≥95.0 ≤5.0
Limited English Proficient (LEP) 3,466 76.7 45.7 34.5 17.4 ≤5.0 19.2 88.7 11.3Not Served by Title I 2,117 46.9 45.4 34.0 17.6 ≤5.0 19.9 89.8 10.2Schoolwide Title I Program 2,165 47.9 35.1 32.1 29.0 ≤5.0 32.6 90.7 9.2Targeted Assistance 101 2.2 35.6 36.6 18.8 ≤5.0 23.8 84.2 15.8Migrant 465 10.3 35.3 38.5 24.7 ≤5.0 25.8 90.3 9.7
Assigned Grade3 781 17.3 35.2 35.0 26.6 ≤5.0 29.4 89.8 10.24 848 18.8 39.0 32.1 25.9 ≤5.0 28.1 92.3 7.75 744 16.5 41.9 29.7 25.5 ≤5.0 27.8 89.2 10.86 688 15.2 44.0 32.7 19.5 ≤5.0 22.4 87.6 12.47 689 15.3 41.9 35.7 19.6 ≤5.0 22.2 91.7 8.18 618 13.7 40.0 35.3 18.8 5.3 24.1 90.8 9.2
10 150 3.3 36.0 30.0 30.0 ≤5.0 34.0 83.3 16.7
Notes: 1On-level students are assessed at their assigned grade level. 2Total number of on-level students including those without a growth score. 3"Percent of All Students" within a category may not add up to 100.0 percent due to rounding or blanks. 4Inconsistencies in numbers reported are due to errors in coding on student answer sheets.
*Performance data are not reported when number of students is fewer than five. Performance data that are less than or equal to 5.0 percent, or greater than or equal to 95.0 percent, are not displayed.
When summed, subgroup N counts may not match the "All Students" N count because of incomplete coding on some student answer sheets. The total of "All Students with Disabilities" includes Section 504 but not those in the "Not Coded" category. Prepared by the NCDPI Division of Accountability Services/North Carolina Testing Program.
Table 12. 2003-04 NCAAAI Statewide Performance of On-Level1 Students in Mathematics
36

Report of Student Performance on the North Carolina Alternate Assessments, 2003-04
37
Notes: 1Performance data are not reported when membership is fewer than five. Performance data that are less than or equal to 5.0 percent, or greater than or equal to 95.0 percent, are not displayed. Prepared by the NCDPI Division of Accountability Services/North Carolina Testing Program.
Figure 12. 2002-03 to 2003-04 NCAAAI Statewide Performance1 of On-Level Students in Mathematics at Each Achievement Level,
2002-03 (N=5,414) and 2003-04 (N=4,518)
50.1
31.6
15.6
40.1
33.2
23.2
≤5 ≤50
10
20
30
40
50
60
70
80
90
100
Percent at Level I Percent at Level II Percent at Level III Percent at Level IV
Perc
ent o
f Stu
dent
s
2002-03 2003-04

Report of Student Performance on the North Carolina Alternate Assessments, 2003-04
CategoryNumber of
Students2
Percent of All
Students3Percent at
Level IPercent at
Level IIPercent at
Level III1Percent at
Level IV1
Percent At or Above
Level III1
Percent Achieving Growth
Percent Not Achieving Growth
All Students 7,521 100.0 27.2 44.0 23.7 ≤5.0 28.4 ≥95.0 ≤5.0Gender
Female 2,566 34.1 27.2 45.6 22.6 ≤5.0 26.7 ≥95.0 ≤5.0Male 4,954 65.9 27.2 43.1 24.3 ≤5.0 29.2 ≥95.0 ≤5.0
EthnicityAmerican Indian 120 1.6 22.5 31.7 32.5 12.5 45.0 ≥95.0 ≤5.0Asian 62 0.8 33.9 41.9 19.4 ≤5.0 22.6 93.5 6.5Black 3,626 48.2 27.2 43.4 24.1 ≤5.0 29.0 ≥95.0 ≤5.0Hispanic 428 5.7 33.6 40.7 21.0 ≤5.0 25.5 ≥95.0 ≤5.0Multi-Racial 123 1.6 25.2 43.9 21.1 8.9 30.1 ≥95.0 ≤5.0White 3,162 42.0 26.5 45.6 23.4 ≤5.0 27.5 ≥95.0 ≤5.0
Not Exceptional4 50 0.7 58.0 32.0 ≤5.0 ≤5.0 6.0 92.0 8.0All Students with Disabilities 7,471 99.3 27.0 44.0 23.8 ≤5.0 28.5 ≥95.0 ≤5.0
Behaviorally-Emotionally Disabled 283 3.8 30.7 42.8 20.8 5.7 26.5 94.7 5.3Hearing Impaired 113 1.5 23.9 48.7 22.1 5.3 27.4 ≥95.0 ≤5.0Educable Mentally Disabled 4,344 57.8 26.6 43.6 24.6 ≤5.0 29.3 ≥95.0 ≤5.0Specific Learning Disabled4 853 11.3 25.8 46.9 22.2 ≤5.0 27.1 ≥95.0 ≤5.0
Learning Disabled-Reading 964 12.8 26.6 45.6 22.8 ≤5.0 27.6 ≥95.0 ≤5.0Learning Disable-Mathematics 865 11.5 26.5 46.4 22.9 ≤5.0 26.9 ≥95.0 ≤5.0Learning Disabled-Written Expression 774 10.3 26.7 45.7 23.3 ≤5.0 27.4 ≥95.0 ≤5.0Learning Disabled-Other 80 1.1 35.0 47.5 16.3 ≤5.0 17.5 90.0 10.0
Speech-Language Impaired 33 0.4 33.3 51.5 6.1 9.1 15.2 ≥95.0 ≤5.0Visually Impaired 14 0.2 21.4 50.0 21.4 7.1 28.6 ≥95.0 ≤5.0Other Health Impaired 609 8.1 29.6 42.2 21.5 6.4 27.9 ≥95.0 ≤5.0Orthopedically Impaired 78 1.0 29.5 44.9 20.5 5.1 25.6 ≥95.0 ≤5.0Traumatic Brain Injury 52 0.7 23.1 51.9 19.2 5.8 25.0 ≥95.0 ≤5.0Autistic 498 6.6 30.9 41.4 23.9 ≤5.0 26.7 ≥95.0 ≤5.0Severely/Profoundly Mentally Disabled 7 0.1 14.3 57.1 28.6 ≤5.0 28.6 85.7 14.3Multihandicapped 154 2.0 20.1 46.8 26.6 5.2 31.8 ≥95.0 ≤5.0Deaf-Blind 2 0.0 * * * * * * *Trainable Mentally Disabled 426 5.7 26.1 44.6 26.1 ≤5.0 28.9 ≥95.0 ≤5.0Section 504 5 0.1 20.0 60.0 ≤5.0 ≤5.0 ≤5.0 ≥95.0 ≤5.0
Limited English Proficient (LEP) 312 4.1 31.7 45.8 18.6 ≤5.0 21.8 ≥95.0 ≤5.0Not Served by Title I 4,524 60.2 26.0 44.5 24.4 ≤5.0 28.9 ≥95.0 ≤5.0Schoolwide Title I Program 2,895 38.5 28.9 42.9 22.8 5.1 28.0 ≥95.0 ≤5.0Targeted Assistance 79 1.1 40.5 46.8 10.1 ≤5.0 12.7 88.6 11.4Migrant 57 0.8 15.8 49.1 29.8 ≤5.0 33.3 ≥95.0 ≤5.0
Assigned Grade3 1,084 14.4 44.4 45.0 8.9 ≤5.0 10.4 ≥95.0 ≤5.04 1,312 17.4 34.1 44.5 18.1 ≤5.0 21.3 ≥95.0 ≤5.05 1,266 16.8 24.0 42.5 27.9 5.3 33.2 ≥95.0 ≤5.06 1,188 15.8 26.0 43.9 24.9 ≤5.0 29.9 ≥95.0 ≤5.07 1,041 13.8 19.6 45.3 27.9 6.5 34.4 ≥95.0 ≤5.08 993 13.2 16.9 42.8 32.4 7.5 39.9 ≥95.0 ≤5.0
10 635 8.4 20.9 43.8 29.3 ≤5.0 33.4 92.8 7.2
Notes: 1Off-level students are not assessed at their assigned grade level. Students assessed 3 or more grade levels below their assigned grade level are eligible for any achievement ranking based on alternate achievement standards.
2Total number of off-level students including those without a growth score.3"Percent of All Students" within a category may not add up to 100.0 percent due to rounding or blanks.4Inconsistencies in numbers reported are due to errors in coding on student answer sheets.
*Performance data are not reported when number of students is fewer than five. Performance data that are less than or equal to 5.0 percent, or greater than or equal to 95.0 percent, are not displayed.
When summed, subgroup N counts may not match the "All Students" N count because of incomplete coding on some student answer sheets. The total of "All Students with Disabilities" includes Section 504. Prepared by the NCDPI Division of Accountability Services/North Carolina Testing Program.
Table 13. 2003-04 NCAAAI Statewide Performance of Off-Level 1 Students in Mathematics
38

Report of Student Performance on the North Carolina Alternate Assessments, 2003-04
39
Notes: 1Performance data are not reported when membership is fewer than five. Performance data that are less than or equal to 5.0 percent, or greater 95.0 percent, are not displayed. *NCAAAI students were not tested at Levels III and IV in off-level reading or mathematics in 2002-03. Prepared by the NCDPI Division of Accountability Services/North Carolina Testing Program.
Figure 13. 2002-03 to 2003-04 NCAAAI Statewide Performance1 of Off-Level Students in Mathematics
at Each Achievement Level,2002-03 (N=10,783) and 2003-04 (N=7,521)
58.4
40.9
27.2
44.0
23.7
* * ≤50
10
20
30
40
50
60
70
80
90
100
Percent at Level I Percent at Level II Percent at Level III Percent at Level IV
Perc
ent o
f Stu
dent
s
2002-03 2003-04

Report of Student Performance on the North Carolina Alternate Assessments, 2003-04
Percent Percent Percent Percent Percent Percent Percent Number Percent of at at at at At or Above Achieving Not Achieving
Category of Students¹ All Students² Level I Level II Level III Level IV Level III Growth GrowthAll Students 4,224 100.0 52.7 34.6 10.7 ≤5.0 11.7 83.5 16.5Gender Females 1,615 38.2 53.1 33.9 11.0 ≤5.0 12.2 85.0 15.0 Males 2,609 61.8 52.5 35.1 10.5 ≤5.0 11.5 82.6 17.3Ethnicity American Indian 132 3.1 40.2 31.8 28.0 ≤5.0 28.0 76.5 23.5 Asian 186 4.4 50.0 37.6 9.1 ≤5.0 10.8 90.9 9.1 Black 1,300 30.8 48.3 35.8 13.2 ≤5.0 15.2 84.5 15.5 Hispanic 1,506 35.7 57.7 33.1 7.8 ≤5.0 8.4 84.4 15.6 Multi-Racial 38 0.9 50.0 31.6 15.8 ≤5.0 18.4 92.1 7.9 White 1,062 25.1 53.3 35.3 9.5 ≤5.0 10.3 80.3 19.6Not Exceptional³ 1,574 37.3 56.2 33.4 8.7 ≤5.0 9.5 85.4 14.6All Students with Disabilities 2,650 62.7 50.7 35.4 11.8 ≤5.0 13.1 82.4 17.5 Behaviorally-Emotionally Disabled 107 2.5 37.4 37.4 23.4 ≤5.0 25.2 86.9 13.1 Hearing Impaired 56 1.3 50.0 42.9 5.4 ≤5.0 5.4 83.9 16.1 Educable Mentally Disabled 1,447 34.3 51.4 36.0 10.7 ≤5.0 11.5 83.8 16.1
Specific Learning Disabled³ 444 10.5 34.9 44.6 17.8 ≤5.0 20.5 87.6 12.2 Learning Disabled-Reading 485 11.5 38.4 43.5 16.3 ≤5.0 17.9 86.0 13.8 Learning Disabled-Mathematics 311 7.4 37.9 45.3 14.8 ≤5.0 16.1 88.7 10.9 Learning Disabled-Written Expression 450 10.7 36.0 44.0 17.8 ≤5.0 19.6 86.9 12.9 Learning Disabled-Other 27 0.6 40.7 48.1 11.1 ≤5.0 11.1 85.2 14.8 Speech-Language Impaired 24 0.6 58.3 33.3 8.3 ≤5.0 8.3 83.3 16.7 Visually Impaired 3 0.1 * * * * * * * Other Health Impaired 185 4.4 55.7 29.2 13.0 ≤5.0 14.1 84.3 15.7 Orthopedically Impaired 25 0.6 60.0 28.0 12.0 ≤5.0 12.0 84.0 16.0 Traumatic Brain Injury 11 0.3 45.5 9.1 27.3 9.1 36.4 81.8 18.2 Autistic 151 3.6 55.0 35.1 8.6 ≤5.0 9.3 76.8 23.2 Severely/Profoundly Mentally Disabled 2 0.0 * * * * * * * Multihandicapped 45 1.1 71.1 22.2 ≤5.0 ≤5.0 ≤5.0 73.3 26.7 Deaf-Blind 2 0.0 * * * * * * * Trainable Mentally Disabled 136 3.2 83.8 13.2 ≤5.0 ≤5.0 ≤5.0 50.7 49.3 Section 504 12 0.3 50.0 8.3 33.3 8.3 41.7 ≥95.0 ≤5.0Limited English Proficient (LEP) 1,563 37.0 56.9 33.1 8.3 ≤5.0 9.0 84.9 15.1Not Served by Title I 2,269 53.7 55.7 34.5 8.1 ≤5.0 8.9 83.9 16.1Schoolwide Title I Program 1,833 43.4 49.0 34.6 14.1 ≤5.0 15.7 82.4 17.5Targeted Assistance 57 1.3 59.6 40.4 ≤5.0 ≤5.0 ≤5.0 89.5 10.5Migrant 188 4.5 49.5 32.4 14.4 ≤5.0 14.9 88.3 11.7
Assigned Grade4 2,164 51.2 52.5 34.8 11.2 ≤5.0 12.0 84.1 15.97 1,703 40.3 53.4 34.1 10.3 ≤5.0 11.6 83.7 16.2
10 357 8.5 51.3 35.9 9.2 ≤5.0 10.9 78.7 21.3
Notes: 1Total number of students including those without a growth score. 2"Percent of All Students" within a category may not add up to 100.0 percent due to rounding or blanks.
3Inconsistencies in numbers reported are due to errors in coding on student answer sheets. *Performance data are not reported when number of students is fewer than five. Performance data that are less than or equal to 5.0 percent, or greater than or equal to 95.0 percent, are not displayed. When summed, subgroup N counts may not match the "All Students" N count because of incomplete coding on some student answer sheets. Prepared by the NCDPI Division of Accountability Services/North Carolina Testing Program.
Table 14. 2003-04 NCAAAI Statewide Student Performance at Each Achievment Level, Statewide Student Performance in Writing
Writing
40

Report of Student Performance on the North Carolina Alternate Assessments, 2003-04
41
Notes: 1Performance data are not reported when membership is fewer than five. Performance data that are less than or equal to 5.0 percent, or greater than or equal to 95.0 percent, are not displayed. Prepared by the NCDPI Division of Accountability Services/North Carolina Testing Program.
Figure 14. 2002-03 to 2003-04 NCAAAI Statewide Student Performance1 in Writing at Each Achievement Level,
2002-03 (N=4,988) and 2003-04 (N=4,224)
58.9
32.7
7.1
52.7
34.6
10.7
≤5 ≤50
10
20
30
40
50
60
70
80
90
100
Percent at Level I Percent at Level II Percent at Level III Percent at Level IV
Perc
ent o
f Stu
dent
s
2002-03 2003-04

Report of Student Performance on the North Carolina Alternate Assessments, 2003-04
42
Prepared by the NCDPI Division of Accountability Services/North Carolina Testing Program.
Figure 15. 2002-03 to 2003-04 NCAAP Statewide Student Performance in Reading, Percent At or Above Level III,
by Ethnicity
64.7
49.2
37.4
46.2
84.8
69.5 71.5 70.7
49.0
54.956.9
67.7
0
10
20
30
40
50
60
70
80
90
100
American Indian Asian Black Hispanic Multi-Racial White
Perc
ent o
f Stu
dent
s
2002-03 2003-04

Report of Student Performance on the North Carolina Alternate Assessments, 2003-04
43
Prepared by the NCDPI Division of Accountability Services/North Carolina Testing Program.
Figure 16. 2002-03 to 2003-04 NCAAP Statewide Student Performance in Mathematics,Percent At or Above Level III,
by Ethnicity
70.6
53.549.6 50.1
82.6
75.0
67.7
73.9
62.7
51.0
64.7
77.4
0
10
20
30
40
50
60
70
80
90
100
American Indian Asian Black Hispanic Multi-Racial White
Perc
ent o
f Stu
dent
s
2002-03 2003-04

Report of Student Performance on the North Carolina Alternate Assessments, 2003-04
44
Notes: *Performance data are not reported when membership is fewer than five. Performance data that are less than or equal to 5.0 percent, or greater than or equalto 95.0 percent, are not displayed. Prepared by the NCDPI Division of Accountability Services/North Carolina Testing Program.
Figure 17. 2002-03 to 2003-04 NCAAP Statewide Performance of Students in Writing,Percent At or Above Level III,
by Ethnicity
48.6
37.0
47.0
59.9
66.762.5
* ***
71.0
*0
10
20
30
40
50
60
70
80
90
100
American Indian Asian Black Hispanic Multi-Racial White
Perc
ent o
f Stu
dent
s
2002-03 2003-04

Report of Student Performance on the North Carolina Alternate Assessments, 2003-04
45
Prepared by the NCDPI Division of Accountability Services/North Carolina Testing Program.
Figure 18. 2002-03 to 2003-04 NCAAAI Statewide Performance of Students in On-Level Reading,Percent At or Above Level III,
by Ethnicity
61.0
30.2
6.5
20.6
29.9
68.3
58.1
12.6
46.6
11.0
40.9
10.7
0
10
20
30
40
50
60
70
80
90
100
American Indian Asian Black Hispanic Multi-Racial White
Perc
ent o
f Stu
dent
s
2002-03 2003-04

Report of Student Performance on the North Carolina Alternate Assessments, 2003-04
46
Prepared by the NCDPI Division of Accountability Services/North Carolina Testing Program.
Figure 19. 2002-03 to 2003-04 NCAAAI Statewide Performance of Students in On-Level Mathematics, Percent At or Above Level III,
by Ethnicity
62.0
30.8
11.3
29.2
67.6
53.7
18.9
41.1
15.4
27.4 26.926.8
0
10
20
30
40
50
60
70
80
90
100
American Indian Asian Black Hispanic Multi-Racial White
Perc
ent o
f Stu
dent
s
2002-03 2003-04

Report of Student Performance on the North Carolina Alternate Assessments, 2003-04
47
Notes: *Performance data are not reported when membership is fewer than five. Performance data that are less than or equal to 5.0 percent, or greater than or equal to 95.0 percent, are not displayed. Prepared by the NCDPI Division of Accountability Services/North Carolina Testing Program.
Figure 20. 2002-03 to 2003-04 NCAAAI Statewide Student Performance in Writing,Percent At or Above Level III,
by Ethnicity
24.6
9.75.3
28.0
15.2
8.4 10.3
*
5.810.0
18.4
10.8
0
10
20
30
40
50
60
70
80
90
100
American Indian Asian Black Hispanic Multi-Racial White
Perc
ent o
f Stu
dent
s
2002-03 2003-04

Report of Student Performance on the North Carolina Alternate Assessments, 2003-04
48
Prepared by the NCDPI Division of Accountability Services/North Carolina Testing Program.
Figure 21. 2003-04 NCAAP and NCAAAI Statewide Student PerformancePercent At or Above Level III in All Subjects,
by Gender
68.5
58.2
21.0
28.824.0
26.7
71.3
63.9
26.4
32.228.0 29.2
12.1
73.0
11.5
75.0
0
10
20
30
40
50
60
70
80
90
100
Reading Mathematics Writing On-Level Reading Off-Level Reading On-LevelMathematics
Off-LevelMathematics
Writing
Perc
ent o
f Stu
dent
s
Females Males
NCAAP NCAAAI

Report of Student Performance on the North Carolina Alternate Assessments, 2003-04
49
Notes: *NCAAAI students were not tested at Levels III and IV in off-level reading or mathematics in 2002-03. Prepared by the NCDPI Division of Accountability Services/North Carolina Testing Program.
Figure 22. 2002-03 NCAAP and NCAAAI Statewide Student PerformancePercent At or Above Level III in All Subjects,
by Gender
45.943.8
11.116.0
48.9 49.9
14.918.2
**
7.6
51.0
**
7.2
53.0
0
10
20
30
40
50
60
70
80
90
100
Reading Mathematics Writing On-Level Reading Off-Level Reading On-LevelMathematics
Off-LevelMathematics
Writing
Perc
ent o
f Stu
dent
s
Females Males
NCAAP NCAAAI

Report of Student Performance on the North Carolina Alternate Assessments, 2003-04
50
Prepared by the NCDPI Division of Accountability Services/North Carolina Testing Program.
Figure 23. 2002-03 to 2003-04 NCAAP Statewide Student Performance in Reading,Percent At or Above Level III,
Students with Disabilities
46.845.1
43.6 44.7
52.2
73.5 72.2
64.3 64.3
73.7
49.4
70.8
0
10
20
30
40
50
60
70
80
90
100
Educable MentallyDisabled
Other Health Impaired Autistic Severely/ProfoundlyMentally Disabled
Multihandicapped Trainable MentallyDisabled
Perc
ent o
f Stu
dent
s
2002-03 2003-04

Report of Student Performance on the North Carolina Alternate Assessments, 2003-04
51
Prepared by the NCDPI Division of Accountability Services/North Carolina Testing Program.
Figure 24. 2002-03 to 2003-04 NCAAP Statewide Student Performance in Mathematics,Percent At or Above Level III,
Students with Disabilities
55.150.6
44.347.6
57.8
75.8 77.4
62.666.0
80.6
53.1
69.8
0
10
20
30
40
50
60
70
80
90
100
Educable MentallyDisabled
Other Health Impaired Autistic Severely/ProfoundlyMentally Disabled
Multihandicapped Trainable MentallyDisabled
Perc
ent o
f Stu
dent
s
2002-03 2003-04

Report of Student Performance on the North Carolina Alternate Assessments, 2003-04
52
Prepared by the NCDPI Division of Accountability Services/North Carolina Testing Program.
Figure 25. 2002-03 to 2003-04 NCAAP Statewide Student Performance in Writing,Percent At or Above Level III,
Students with Disabilities
42.945.4
47.9
43.1
52.4
67.765.1
55.459.2
63.2
45.2
56.4
0
10
20
30
40
50
60
70
80
90
100
Educable MentallyDisabled
Other Health Impaired Autistic Severely/ProfoundlyMentally Disabled
Multihandicapped Trainable MentallyDisabled
Perc
ent o
f Stu
dent
s
2002-03 2003-04

Report of Student Performance on the North Carolina Alternate Assessments, 2003-04
53
Prepared by the NCDPI Division of Accountability Services/North Carolina Testing Program.
Figure 26. 2002-03 to 2003-04 NCAAAI Statewide Student Performance in On-Level Reading,Percent At or Above Level III,
Students with Disabilities
30.8
42.345.1
42.1 41.4
52.4
61.0
67.565.5
60.8
65.7 67.5
44.3
38.1
61.9
50.0
0
10
20
30
40
50
60
70
80
90
100
Behaviorally-Emotionally
Disabled
EducableMentally Disabled
Specific LearningDisabled
LearningDisabled-Reading
LearningDisabled-
Mathematics
LearningDisabled-Written
Expression
Other HealthImpaired
Autistic
Perc
ent o
f Stu
dent
s
2002-03 2003-04
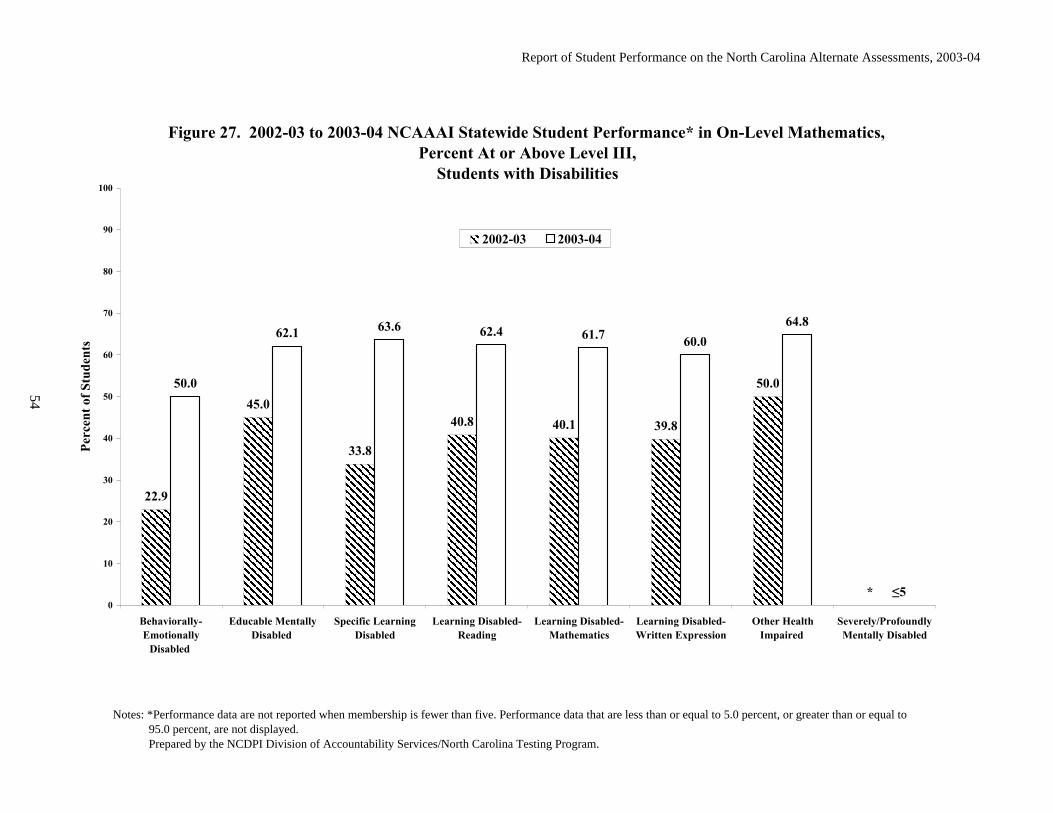
Report of Student Performance on the North Carolina Alternate Assessments, 2003-04
54
Notes: *Performance data are not reported when membership is fewer than five. Performance data that are less than or equal to 5.0 percent, or greater than or equal to 95.0 percent, are not displayed. Prepared by the NCDPI Division of Accountability Services/North Carolina Testing Program.
Figure 27. 2002-03 to 2003-04 NCAAAI Statewide Student Performance* in On-Level Mathematics,Percent At or Above Level III,
Students with Disabilities
22.9
33.8
40.8 40.1 39.8
50.050.0
63.6 62.4 61.7 60.064.8
45.0
*
62.1
≤50
10
20
30
40
50
60
70
80
90
100
Behaviorally-Emotionally
Disabled
Educable MentallyDisabled
Specific LearningDisabled
Learning Disabled-Reading
Learning Disabled-Mathematics
Learning Disabled-Written Expression
Other HealthImpaired
Severely/ProfoundlyMentally Disabled
Perc
ent o
f Stu
dent
s
2002-03 2003-04

Report of Student Performance on the North Carolina Alternate Assessments, 2003-04
55
Notes: *Performance data are not reported when membership is fewer than five. Performance data that are less than or equal to 5.0 percent, or greater than or equal to 95.0 percent, are not displayed. Prepared by the NCDPI Division of Accountability Services/North Carolina Testing Program.
Figure 28. 2002-03 to 2003-03 NCAAAI Statewide Student Performance in Writing,Percent At or Above Level III,
Students with Disabilities
8.8 7.6
12.213.7
11.614
8.6
25.2
11.5
20.517.9
16.119.6
*
12.0
7.3
* **
5.4
14.1
9.3
≤5 ≤50
10
20
30
40
50
60
70
80
90
100
Behaviorally-Emotionally
Disabled
Hearing Impaired Educable MentallyDisabled
Specific LearningDisabled
Learning Disabled-Reading
Learning Disabled-Mathematics
Learning Disabled-Written Expression
Other HealthImpaired
Autistic Multihandicapped Deaf-Blind Trainable MentallyDisabled
Perc
ent o
f Stu
dent
s
2002-03 2003-04

Report of Student Performance on the North Carolina Alternate Assessments, 2003-04
56
Notes: *Performance data are not reported when membership is fewer than five. Performance data that are less than or equal to 5.0 percent, or greater than or equal to 95.0 percent, are not displayed. Prepared by the NCDPI Division of Accountability Services/North Carolina Testing Program.
Figure 29. 2002-03 to 2003-04 NCAAP and NCAAAI Statewide Percent At or Above Level III
Performance of Limited English Proficient Students
37.4
47.3
36.4
6.9
13.1
5.4
67.7 67.7
11.5
27.6
19.221.8
9.0
***0
10
20
30
40
50
60
70
80
90
100
Reading Mathematics Writing On-LevelReading
On-LevelMathematics
Off-LevelReading
Off-LevelMathematics
Writing
Perc
ent o
f Stu
dent
s
2002-03 2003-04

Appendices
57

Appendix A
NCAAP
Sample
59

Report of Student Performance on the North Carolina Alternate Assessments, 2003-04
Student Name Student Grade (Circle) 3 4 5 6 7 8 10Student ID Number School School System Teacher Beginning Date
NORTH CAROLINA ALTERNATE ASSESSMENT PORTFOLIO
Public Schools of North Carolina www.ncpublicschools.org State Board of Education Department of Public Instruction Division of Accountability and Technology Services Division of Accountability Services/North Carolina Testing Program Raleigh, North Carolina 27699-6314
6
© 2004 All rights reserved. This document may not be reproduced by any means, in whole or in
permission from the North Carolina Department of Public Instruction, Raleigh, North C
Stock No. 903
part, without prior written arolina.

Report of Student Performance on the North Carolina Alternate Assessments, 2003-04
Final Evaluation Sheet
The Portfolio Development Designee is required to reference the NCAAP Administrative Guide as she/he completes the student portfolio. If an Administrative Guide is not included, the designee should notify the school test coordinator immediately.
Student Assessment History
Student Name Grade
School
Date Completed
School System
Student Information Sheet Accurately and Completely Coded Yes No Previous and Current IEPs Included in the Portfolio Yes No Comments: The signature below verifies that the Portfolio Development Designee attests that the enclosed materials and evidence are accurate, valid, and appropriate, and are a true representation of the student’s knowledge, skill, and performance. ©
200
4 N
CD
PI
© 2
004
NC
DPI
Portfolio Development Designee Date
Assigned Grade Level NC Testing Program Assessment Achievement Level
Grade 3 Grade 4 Grade 5 Grade 6 Grade 7 Grade 8 Grade 10

Report of Student Performance on the North Carolina Alternate Assessments, 2003-04
Principal Documentation
The North Carolina Alternate Assessment Portfolio is a yearlong assessment process. It provides information about what a student knows and is able to do. It documents progress that has been made in relation to tasks specified in the student’s Individual Education Program (IEP).
Testing Code of Ethics
The North Carolina Testing Code of Ethics addresses appropriate professional practices for central office and school administrators, test coordinators, test administrators, and proctors in the areas of securing tests, administering tests, and reporting and interpreting test results. Ethical practices ensure validity of the test results. School system personnel who participate in the use of the NCAAP are expected to use the same high standard of professional practices.
Ethics in Data Collection All data recorded in the portfolio must be accurate and true indications of a student’s response. The dates of student responses must be the actual dates that the student attempted the activity. Data that is found to be fabricated will be considered a testing violation. The NCDPI will render the appropriate actions that are consistent with violations of the Testing Code of Ethics.
Test Security
State Board of Education policy specifies that the North Carolina Alternate Assessment Portfolio is a secure test. Access to secure test materials is limited to school personnel who have a legitimate need. Persons who have access to secure test materials shall not use those materials for personal gain. The signature below verifies that the principal has reviewed this portfolio with the Portfolio Development Designee, and, to the best of his or her knowledge, the materials and evidence are complete, valid, accurate, and appropriate. The following items have been examined:
• Student Profile Complete □ Yes □ No • Three (3) tasks included for English/Language Arts □ Yes □ No • Three (3) tasks included for Mathematics □ Yes □ No • Writing task is designated for grades 4, 7, and 10 □ Yes □ No □ NA • All tasks aligned to Standard Course of Study Essences □ Yes □ No • Each task sheet contains only one task □ Yes □ No • Data reflect actual student responses and the appropriate dates □ Yes □ No • Required data sheets and task descriptions are included □ Yes □ No • IEP is current and included in portfolio □ Yes □ No • If student work is included, only three (3)
examples per task are submitted □ Yes □ No Principal Date
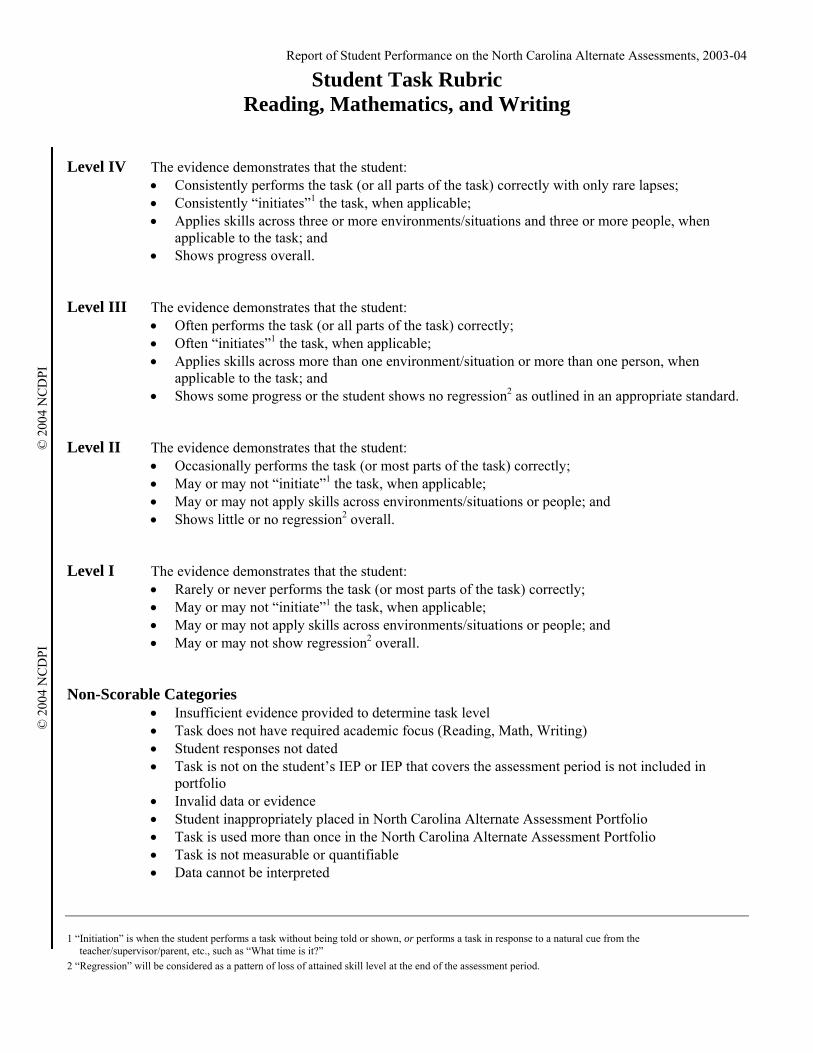
Report of Student Performance on the North Carolina Alternate Assessments, 2003-04
Student Task Rubric Reading, Mathematics, and Writing
© 2
004
NC
DPI
©
200
4 N
CD
PI
Level IV The evidence demonstrates that the student: • Consistently performs the task (or all parts of the task) correctly with only rare lapses; • Consistently “initiates”1 the task, when applicable; • Applies skills across three or more environments/situations and three or more people, when
applicable to the task; and • Shows progress overall.
Level III The evidence demonstrates that the student:
• Often performs the task (or all parts of the task) correctly; • Often “initiates”1 the task, when applicable; • Applies skills across more than one environment/situation or more than one person, when
applicable to the task; and • Shows some progress or the student shows no regression2 as outlined in an appropriate standard.
Level II The evidence demonstrates that the student:
• Occasionally performs the task (or most parts of the task) correctly; • May or may not “initiate”1 the task, when applicable; • May or may not apply skills across environments/situations or people; and • Shows little or no regression2 overall.
Level I The evidence demonstrates that the student:
• Rarely or never performs the task (or most parts of the task) correctly; • May or may not “initiate”1 the task, when applicable; • May or may not apply skills across environments/situations or people; and • May or may not show regression2 overall.
Non-Scorable Categories
• Insufficient evidence provided to determine task level • Task does not have required academic focus (Reading, Math, Writing) • Student responses not dated • Task is not on the student’s IEP or IEP that covers the assessment period is not included in
portfolio • Invalid data or evidence • Student inappropriately placed in North Carolina Alternate Assessment Portfolio • Task is used more than once in the North Carolina Alternate Assessment Portfolio • Task is not measurable or quantifiable • Data cannot be interpreted
1 “Initiation” is when the student performs a task without being told or shown, or performs a task in response to a natural cue from the teacher/supervisor/parent, etc., such as “What time is it?”
2 “Regression” will be considered as a pattern of loss of attained skill level at the end of the assessment period.

Report of Student Performance on the North Carolina Alternate Assessments, 2003-04
English/Language Arts
© 2
004
NC
© 2
004
NC
DPI
D
PI
Standard Course of Study Competency Goals and Essences
NC Standard Course of Study Competency Goals and Essences for Students with Significant Cognitive Disabilities
Standard Course of Study Competency Goal 1: The learner will develop and apply enabling strategies and skills to read and write.
Essence 1: The learner will develop strategies for communication. Standard Course of Study Competency Goal 2: The learner will develop and apply strategies and skills to comprehend text that is read, heard, and viewed.
Essence 2: The learner will develop and apply strategies and skills to comprehend outside stimuli.
Standard Course of Study Competency Goal 3: The learner will make connections through the use of oral language, written language, and media and technology.
Essence 3: The learner will make connections (react, relate, and generalize). Standard Course of Study Competency Goal 4: The learner will apply strategies and skills to create oral, written, and visual text.
Essence 4: The learner will produce expressive communication. Standard Course of Study Competency Goal 5: The learner will apply grammar and language conventions to communicate effectively.
Essence 5: The learner will convey a complete thought in a functional manner.
Reading Requirements for All Portfolios All portfolios require three student tasks addressing Reading. All tasks must come from a student’s IEP and must address at least two of the above Competencies.
Writing Requirements for All Students in Grades 4, 7, and 10 One of the three student tasks selected as a reading task must address Competency Goal 4 or Competency Goal 5. These are the writing competencies for grades 4, 7, and 10.

Report of Student Performance on the North Carolina Alternate Assessments, 2003-04
Student Task Sheet – English/Language Arts Student Name:___________________________________ Grade_________
Check the Standard Course of Study Competency Goal to which the student task is connected.
Standard Course of Study Competency Goal 1: The learner will develop and apply enabling strategies and skills to read and write. Essence 1: The learner will develop strategies for communication.
Standard Course of Study Competency Goal 2: The learner will develop and apply strategies and skills to comprehend text that is read, heard, and viewed. Essence 2: The learner will develop and apply strategies and skills to comprehend outside stimuli.
Standard Course of Study Competency Goal 3: The learner will make connections through the use of oral language, written language, and media and technology. Essence 3: The learner will make connections (react, relate and generalize).
Standard Course of Study Competency Goal 4: The learner will apply strategies and skills to create oral, written, and visual text. Essence 4: The learner will produce expressive communication.
Standard Course of Study Competency Goal 5: The learner will apply grammar and language conventions to communicate effectively. Essence 5: The learner will convey a complete thought in a functional manner.
Check box to indicate if task is to be scored for Reading (Grades 3–8 and 10) or Writing (Grades 4, 7, and 10 only)
One Student Task per Student Task Sheet Reading Task Writing Task — Applies to Competency Goal 4 or 5 only (Grades 4, 7, and 10 only)
Student Task:
Required Evidence 1. Data Sheets: A collection of the student responses must be provided on standardized forms called data sheets. The data sheets that are to be used in the portfolio must come from the data sheet set included in the portfolio or online at www.ncpublicschools.org/accountability/testing/alternate/. 2. Task Descriptions: Concise, focused teacher notes that provide an explanation of the task, how the task is presented to the student, and information about the student’s level of functioning, generalization, and/or initiation of the task.
Optional Evidence Work Samples: Examples of a student’s work — such as writing his/her name, making a mark on a paper, student produced picture sentences — may be submitted. Three work samples may be included in the portfolio for each task. The work samples must be 1) at the beginning of instruction, 2) at the midpoint of instruction, and 3) at the end of instruction. Generalization Notes: Notes describing a student’s ability with task performance in different locations and with different people may be included. Teacher Comments: Date: ____________

Report of Student Performance on the North Carolina Alternate Assessments, 2003-04
Mathematics Standard Course of Study Mathematics Strands and Essences
© 2
004
NC
DPI
©
200
4 N
CD
PI
NC Standard Course of Study Mathematics Strands and Essences for Students with Significant Cognitive Disabilities
Standard Course of Study Mathematics Strand 1: Number Sense, Numeration, and Numerical Operations
Essence 1: Representing and utilizing numbers Standard Course of Study Mathematics Strand 2: Spatial Sense, Measurement, and Geometry
Essence 2: Recognizing size, measurement, spatial orientation, and shape Standard Course of Study Mathematics Strand 3: Patterns, Relationships, and Functions
Essence 3: Sorting and patterning Standard Course of Study Mathematics Strand 4: Data, Probability, and Statistics
Essence 4: Collecting, sorting, organizing, displaying, and/or interpreting data over a period of time (usually two or more items of numerical information) in charts, graphs, and/or tables with correct labeling
Mathematics Requirements for All Portfolios
All portfolios require three student tasks addressing Mathematics. All tasks must come from a student’s IEP and must address at least two of the above competencies.

Report of Student Performance on the North Carolina Alternate Assessments, 2003-04
Student Task Sheet – Mathematics Student Name:___________________________________ Grade_________
Check the Standard Course of Study Mathematics Strand to which the student task is connected.
Standard Course of Study Mathematics Strand 1: Number Sense, Numeration, and Numerical Operations Essence 1: Representing and utilizing numbers
Standard Course of Study Mathematics Strand 2: Spatial Sense, Measurement, and Geometry Essence 2: Recognizing size, measurement, spatial orientation, and shape
Standard Course of Study Mathematics Strand 3: Patterns, Relationships, and Functions Essence 3: Sorting and patterning
Standard Course of Study Mathematics Strand 4: Data, Probability, and Statistics Essence 4: Collecting, sorting, organizing, displaying, and/or interpreting data over a period of time (usually two or more items of numerical information) in charts, graphs, and/or tables with correct labeling
One Student Task per Student Task Sheet
Student Task:
Required Evidence 1. Data Sheets: A collection of the student responses must be provided on standardized forms called data sheets. The data sheets
that are to be used in the portfolio must come from the data sheet set included in the portfolio or online at www.ncpublicschools.org/accountability/testing/alternate/.
2. Task Descriptions: Concise, focused teacher notes that provide an explanation of the task, how the task is presented to the student, and information about the student’s level of functioning, generalization, and/or initiation of the task.
Optional Evidence Work Samples: Examples of a student’s work — mathematics problems, cutting paper, time/money work — may be submitted. Three work samples may be included in the portfolio for each task. The work samples must be 1) at the beginning of instruction, 2) at the midpoint of instruction, and 3) at the end of instruction. Generalization Notes: Notes describing a student’s ability with task performance in different locations and with different people may be included. Teacher Comments: Date: ____________

Report of Student Performance on the North Carolina Alternate Assessments, 2003-04
Types of Tasks
Data System Definition What Teacher Scores and Charts Examples
Task Analysis The steps needed to complete a chained task
•
•
• • • •
Each step completed Number of steps correct
Will follow picture recipe Buys a soda Folds laundry from picture directions Collate papers following changing pattern
Repeated Trial Teacher-delivered teaching trials on one or more than one response in a set
• •
• •
•
•
Each trial correct Number correct or items correct
Reads sight words Will mark on a paper as an emerging signature Will identify sets using 1-1 correspondence Will identify coins
Repeated Opportunity
Responses taught throughout the day when they typically occur
•
•
• • • •
Each correct response Number or types of responses correct
Uses object schedule Signs name on each paper given Tells clock time at start of each lesson Utilizes augmentative communication device to answer comprehension questions
Frequency Count
Goal is to increase the number of times student uses this new response; may be throughout the day or in one lesson
•
•
•
• •
Tally number of times response is observed Total number of responses
Works: e.g., number of envelopes stuffed Uses picture to ask for help Lifts head to acknowledge that a story is being read
Duration/ Distance Recording
Total amount of time student engages in task
•
•
•
• •
•
Time seconds or minutes with stopwatch Total number of seconds or minutes
Works on a vocational task for specific time Maintains position for 7 seconds Performs seatwork in general ed class for specific time Ambulates 10 feet
Cumulative Recording
One discrete response with goal that it will be used consistently each day (may be used more than once daily)
•
•
• • • •
Yes/no response made each day Chart cumulative responses (total across days)
Uses picture to ask to “eat” at 11:30 Turns head toward reader Sets timer on microwave Lifts head on specific count

Appendix B
NCAAAI
Sample
61

NORTH CAROLINA ALTERNATE ASSESSMENT ACADEMIC INVENTORY (NCAAAI)
Student Name ________________________ Student ID ___________________________ School Name _________________________ School Code ___ ___ ___ ___ ___ ___ LEA Name ___________________________ Circle all that apply: EC LEP Test Cycle (check one): � Semester � Traditional � Year-Round � Quarter � Summer � Other
BIOLOGY
End-of- Course 2004-05
BIOLOGY SKILLS Description of Student Performance
Descriptors Description of Performance at Grade-Level
Distinguished 8 – High 7 – Low
The student: • demonstrates consistent mastery and performance beyond grade-level expectations • works independently • understands advanced concepts • applies strategies creatively • analyzes and synthesizes • justifies and elaborates responses • makes critical judgments • makes applications and extensions beyond grade-level; applies proficient level competencies
in more challenging situations
Proficient 6 – High 5 – Low
The student: • demonstrates consistent mastery and performance on grade-level academic
standard/expectations • shows conceptual understanding • applies strategies in most situations • responds with appropriate answer or procedure • completes tasks accurately • needs minimal assistance • exhibits fluency and applies learning • shows some flexibility in thinking • recognizes cause and effect relationships • applies and explains concepts
Apprentice 4 – High 3 – Low
The student: • demonstrates inconsistent mastery and performance of grade-level academic
standards/expectations • shows some evidence of conceptual understanding • has difficulty applying strategies or completing tasks in unfamiliar situations • responds with appropriate answer or procedure sometimes • requires teacher guidance frequently • demonstrates some proficient level competencies but is inconsistent
Novice 2 – High 1 – Low
The student: • demonstrates minimal or no mastery and performance of grade-level academic
standards/expectations • shows very limited evidence of conceptual understanding and use of strategies • responds with inappropriate answer and/or procedure frequently • very often displays lack of understanding of grade-level content • infrequently completes task appropriately and accurately • needs assistance and guidance continuously
0 - Not Yet • This objective has not yet been introduced. (Available for baseline and interim scores only.)
Policies and directions related to the completion of the NCAAAI are found in the NCAAAI Test Administrator’s Guide.
Melissa J. Doe 333-33-3333 East Mustang High School
2 2 2 2 2 2 Ford Schools
X
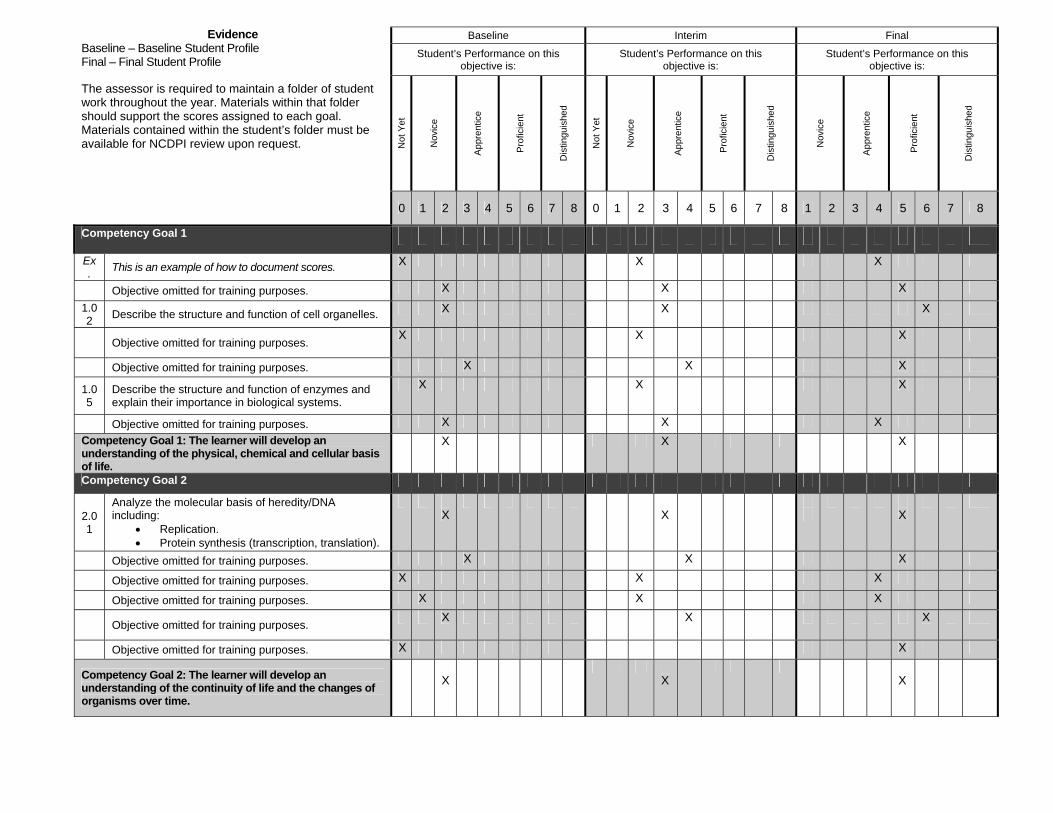
Baseline Interim Final
Student’s Performance on this objective is:
Student’s Performance on this objective is:
Student’s Performance on this objective is:
Not
Yet
Nov
ice
App
rent
ice
Pro
ficie
nt
Dis
tingu
ishe
d
Not
Yet
Nov
ice
App
rent
ice
Pro
ficie
nt
Dis
tingu
ishe
d
Nov
ice
App
rent
ice
Pro
ficie
nt
Dis
tingu
ishe
d
Evidence Baseline – Baseline Student Profile Final – Final Student Profile
The assessor is required to maintain a folder of student work throughout the year. Materials within that folder should support the scores assigned to each goal. Materials contained within the student’s folder must be available for NCDPI review upon request.
0 1 2 3 4 5 6 7 8 0 1 2 3 4 5 6 7 8 1 2 3 4 5 6 7 8
Competency Goal 1 Ex. This is an example of how to document scores. X X X
Objective omitted for training purposes. X X X 1.02 Describe the structure and function of cell organelles. X X X
Objective omitted for training purposes. X X X
Objective omitted for training purposes. X X X
1.05
Describe the structure and function of enzymes and explain their importance in biological systems.
X X X
Objective omitted for training purposes. X X X Competency Goal 1: The learner will develop an understanding of the physical, chemical and cellular basis of life.
X X X
Competency Goal 2
2.01
Analyze the molecular basis of heredity/DNA including:
• Replication. • Protein synthesis (transcription, translation).
X
X
X
Objective omitted for training purposes. X X X
Objective omitted for training purposes. X X X
Objective omitted for training purposes. X X X
Objective omitted for training purposes. X X X
Objective omitted for training purposes. X X
Competency Goal 2: The learner will develop an understanding of the continuity of life and the changes of organisms over time.
X
X
X

Competency Goal 3 3.01
Relate the variety of living organisms to their evolutionary relationships.
X X X
Objective omitted for training purposes. X X X
3.03
Determine the form and function of organisms including:
• Organ systems of animals. • Functional systems of plants, including
transport, reproduction, and regulation.
X
X
X
Objective omitted for training purposes. X X X Objective omitted for training purposes. X X X
Competency Goal 3: The learner will develop an understanding of the unity and diversity of life.
X X X
Competency Goal 4 Objective omitted for training purposes. X X X
Objective omitted for training purposes. X X X
4.03 Explain the flow of energy through ecosystems. X X X
Objective omitted for training purposes. X X X
Objective omitted for training purposes. X X X Competency Goal 4: The learner will develop an understanding of ecological relationships among organisms.
X X X
Competency Goal 5 5.01
Evaluate the survival of organisms and suitable adaptive responses to environmental pressures.
X X X
5.02
Assess and examine plant tropisms and other responses.
X X X
Objective omitted for training purposes. X X X Objective omitted for training purposes. X X X Objective omitted for training purposes. X X X Competency Goal 5: Students will develop an understanding of the behavior of organisms, resulting from a combination of heredity and environment.
X
X
X
0 1 2 3 4 5 6 7 8 0 1 2 3 4 5 6 7 8 1 2 3 4 5 6 7 8
Baseline Interim Final
Date scoring was completed for each scoring period Baseline Date: 8/26/04 Interim Date: 1/13/05 Final Date: 4/29/05

SUMMARY OF FINAL SCORES Directions: Transfer assigned final scores for each competency goal to the corresponding boxes below. Use these scores to assign a final score for the year based on this student’s overall performance in Biology. 1 2 3 4 5 6 7 8Competency Goal 1: The learner will develop an understanding of the physical, chemical and cellular basis of life. X Competency Goal 2: The learner will develop an understanding of the continuity of life and the changes of organisms over time.
X
Competency Goal 3: The learner will develop an understanding of the unity and diversity of life. X Competency Goal 4: The learner will develop an understanding of ecological relationships among organisms. X Competency Goal 5: Students will develop an understanding of the behavior of organisms, resulting from a combination of heredity and environment.
X
OVERALL BIOLOGY SCORE (Refer to the EOC percentages) X Did the student achieve
growth in Biology? ο YES ο NO
EOC Percentages: Biology
Goal 1 = 19% Goal 2 = 31% Goal 3 = 18% Goal 4 = 19% Goal 5 = 11%
TRANSFER INFORMATION TO BE COMPLETED BY ORIGINAL SCHOOL IF STUDENT TRANSFERS: If student has been enrolled for at least 30 days, the baseline scoring must be completed by the original school. If the student transfers within the last six weeks of school, the original school must complete the inventory. Date of enrollment: ____________ School Name __________________________ Date of withdrawal/transfer: ___________ LEA Name __________________________ I verify that this inventory is accurate and complete to date. ____________________________ ______ __________________________ _______ Assessor’s Signature Date Principal’s Signature Date Date of enrollment: ____________ School Name __________________________ Date of withdrawal/transfer: ___________ LEA Name __________________________ I verify that this inventory is accurate and complete to date. ____________________________ ______ __________________________ _______ Assessor’s Signature Date Principal’s Signature Date If additional listings are required, a Transfer Form is to be completed as specified in the Test Administrator’s Guide.
FINAL EVALUATION
TO BE COMPLETED AT THE END OF THE YEAR: I verify that this inventory and enclosed Student Profiles are an accurate, valid, appropriate, complete, and true representation of the student’s performances. ______________________________________ ___________ Assessor’s Signature Date ______________________________________ ___________ Principal’s Signature Date An optional Principal’s Checklist is located in the NCAAAI Test Administrator’s Guide and is available at.
X
Paula J. Penny 4/29/05
James A. Doe 4/29/05

Appendix C
List of North Carolina
Charter Schools
2003-04
63

Report of Student Performance on the North Carolina Alternate Assessments, 2003-04
A Child's Garden School (K-5) Lincoln Charter School (K-11)Alpha Academy (6-9) Magellan Charter School (4-8)American Renaissance Charter School (K-5) Maureen Joy Charter School (K-6)American Renaissance Middle School (6-8) Metrolina Regional Scholars' Academy (K-8) Ann Atwater Community School (4-9) Millennium Charter Academy (K-5)Arapahoe Charter School (K-8) Mountain Discovery Charter (K-6)Arts Based Elementary (K-4) New Century School (9-12)ArtSpace Charter School (formerly named Cheshire) (K-7) Omuteko Gwamaziima (K-8) Bethany Community Middle School (6-8) Orange Charter School (K-8)Bethel Hill Charter School (K-6) Phoenix Academy (K-6)Brevard Academy (K-8) Piedmont Community School (K-8)Bridges Charter School (K-8) PreEminent Charter School (K-8) Cape Fear Center for Inquiry (K-8) Provisions Academy (6-12)Cape Lookout Marine Science High School (9-12) Quality Education Academy (3-8)Carter Community Charter School (K-9) Queen's Grant Community Schools (K-5)Casa Esperanza Montessori (K-4) Quest Academy (K-8)Charter Day School (K-5) Raleigh Charter High School (9-12)Chatham Charter School (K-8) Research Triangle Charter Academy (K-8)CIS Academy (6-8) River Mill Academy (formerly River Mill Charter) (K-12)Clover Garden (K-10) Rocky Mt. Prep. Sch. (formerly Rocky Mount Charter) (K-10)Community Partners Charter High School (9-12) Rowan Academy (K-5)Crossnore Academy (1-12) Sallie B. Howard School (K-8)Crossroads Charter High (9-12) Sandhills Theatre Arts Renaissance School (STARS) (K-5)Dillard Academy (K-3) SPARC Academy (K-8)East Wake Academy (K-12) Sterling Montessori Academy (K-8)East Winston Primary School (K-6) Success Institute (K-8)Engelmann School of the Arts and Sciences (K-5) Sugar Creek Charter School (K-8)Evergreen Community Charter School (K-8) Summit Charter School (K-8)Exploris Middle School (6-8) The Academy of Moore County (formerly MAST) (6-8)Forsyth Academies (K-8) The Carter G. Woodson School of Challenge (K-12)Francine Delany New School for Children (K-8) The Central Park School for Children (K-2)Gaston College Preparatory (GCP) (5-7) The Children's Village Academy (K-6) Grandfather Academy (K-12) The Community Charter School (K-5)Gray Stone Day School (9-11) The Downtown Middle School (5-8)Greensboro Academy (K-8) The East Winston Primary School (K-6)Guilford Charter School (formerly Guilford-SABIS) (K-8) The Franklin Academy (K-10)Haliwa-Saponi Tribal (K-8) The Laurinburg Homework Center Charter School (8-12)Healthy Start Academy Charter Elementary School (K-6) The Learning Center (K-5)Highland Charter Public School (K-2) The Mountain Community School (K-8)Hope Elementary School (K-5) The New Dimensions School (K-5)Imani Institute Charter School (6-8) The Woods Charter School (K-12)John H. Baker Jr. High School (9-12) Thomas Jefferson Classical Academy (6-12)Kennedy Charter School (6-12) Tiller School (K-6)Kestrel Heights School (6-10) Torchlight Acad. (formerly N.E. Raleigh Charter Acad.) (K-5)Lake Norman Charter School (5-8) Union Academy (K-7)Lakeside School (6-12) Vance Charter School (K-8)Laurinburg Charter School (9-12) Washington Montessori-A Public Charter School (K-6)
List of North Carolina Charter Schools, 2003-04
71