report of investments 2020
TRANSCRIPT

REPORT OF INVESTMENTS 2020
Report of Investments 2020 | 1
16Alternative Assets (Illiquid)
17 Venture Capital
18 Private Equity
19 Real Estate
20 Natural Resources
22daily and monthly
portfolios/short term poolAsset Allocation
Investment Performance
23veritas
Asset Allocation Investment Performance
25 conclusion
28 benchmark definitions
1introduction
4long term portfolio
Background
6Asset Allocation
7 Model Portfolio
10 Investment Performance
12 Marketable Securities
13 Market Traded Equities
14Fixed Income
15Absolute Return
Cover image:The Community of Culture Festival, part of the UMich200 Spring Festival program, celebrates U-M’s diversity of culture, art, and social advocacy through more than 25 cultural student organizations including: La Salud, Maize Mirchi, Assisting Latinos to Maximize Achievement, Michigan Refugee AssistanceProgram, Students of Color in Public Policy, and more.
Inside cover image: Hanging pride flag above the Rubik’s Cube at Mechanical Engineering in the GG Brown building.

Report of Investments 2020 | 1
INTRODUCTION
The university invests its financial assets in pools with distinct risk and liquidity characteristics based on specific needs, with the large majority of its financial assets invested in two such pools. The university’s endowment is invested in an equity-oriented strategy that seeks to maximize total return over the long term, while the university’s working capital primarily is invested in relatively short duration liquid assets and less liquid fixed income absolute return and private equity investments. Other investment pools are invested according to their individual needs and requirements.
This report discusses the asset allocation and investment performance of the three largest categories of funds: endowment funds, working capital funds, and
Veritas reserves. Each category is invested according to its individual risk profile. Below is a chart that illustrates the relative size of the three categories of funds.The page that follows contains a short description of each fund category discussed in this report.
The market value of the university’s combined cash, investments and unexpended bond proceeds totaled $16.2 billion at June 30, 2020, as compared to $14.9 billion at June 30, 2019, primarily reflecting an increase in unexpended bond proceeds from a June 2020 general revenue bond issuance.
This chart shows the market value of the university’s financial assets. The previous year’s values are shown in light blue.
UNIVERSITY CASH, INVESTMENTS, AND UNEXPENDED BOND PROCEEDS AS OF JUNE 30, 2020
( ) Other includes assets that cannot be commingled in the University’s investment pools, including unexpended bond proceeds, long-term disability benefit reserves, life income trusts, Metro Health cash and investments, and other reserves.
Endowment Funds
Working Capital Funds
Veritas
Other [a]
$0 $2,000 $4,000 $6,000 $8,000 $10,000 $12,000 $14,000
$ 2,048
$ 12,477
$ 240
$ 1,445
June 30, 2020
June 30, 2019
Millions of Dollars
a

Report of Investments 2020 | 2
Endowment funds were valued at $12.5 billion at June 30, 2020 as compared to $12.4 billion at June 30, 2019. This change in market value reflects investment income and new endowments, offset by endowment spending rate distributions.
The majority of the university’s endowment funds are pooled in the unitized University Endowment Fund, which consists of approximately 12,000 separate funds. The university’s endowment ranks as the ninth largest endowment among institutions of higher learning in the country and the third largest endowment of a public university, after two university systems1. It is invested for the long term, primarily through an investment vehicle called the Long Term Portfolio, which is a diversified, equity-oriented pool of investments.
The university’s $2.0 billion of working capital funds, which principally are used for operating activities and capital projects, are invested substantially in relatively short duration fixed income instruments and value-add credit related investments through the Daily and Monthly Portfolios.
The university’s wholly-owned insurance company, Veritas, has $240 million of reserves that are primarily invested in the Daily and Monthly Portfolios and the Long Term Portfolio in an allocation reflective of Veritas’ liability structure and regulatory requirements.
This report follows the format established over the past several years and examines the asset allocation and investment return of each of the university’s investment pools. The asset allocation and performance for the university’s primary endowment investment vehicle, the Long Term Portfolio, are discussed in detail over the next pages, followed by a review of the asset allocation and performance of the university’s Daily and Monthly Portfolios, the Short Term Pool, and Veritas reserves.
1 Based on a June 30, 2019 comparison, as FY 2020 comparative results are not yet available. At that time, the largest public university endowment was the University of Texas system followed by the Texas A&M system.Source: NACUBO
The following chart shows the growth of the University’s Endowment Funds over the past 25 years.
$0
$2
$4
$6
$8
$10
$12
2.3
3.64.2
4.9
5.7
7.17.6
6.0
8.4
9.710.0
9.7
6.6
7.8 7.7
3.53.43.5
2.52.0
1.6
10.9
$14
Dol
lars
in B
illio
ns
11.9
’96 ’97 ’98 ’99 ’99 ’01 ’02 ’03 ’04 ’05 ’ 06 ’07 ’08 ’09 ’10 ’11 ’12 ’13 ’14 ’15 ’16 ’17 ’18 ’19 ’20
12.4
ENDOWMENT FUNDS — END OF FISCAL YEAR FAIR VALUE
12.5
LONG TERM PORTFOLIO
U-M staff (left and center) talk to a student (right) on the U-M Central Campus Diag.
Report of Investments 2020 | 3
Report of Investments 2020 | 4
BACKGROUNDThe university’s endowment funds are invested for the long term, primarily through an investment vehicle called the Long Term Portfolio (LTP). The LTP is a pool of financial assets which the university invests primarily in equity oriented strategies to maximize expected returns. The assets in the LTP include pooled (unitized) endowment funds of the university and affiliates, and an endowment established for the core portion of the deposits of university departments, as well as a portion of the university’s insurance reserves and gift annuity and charitable remainder trust programs.
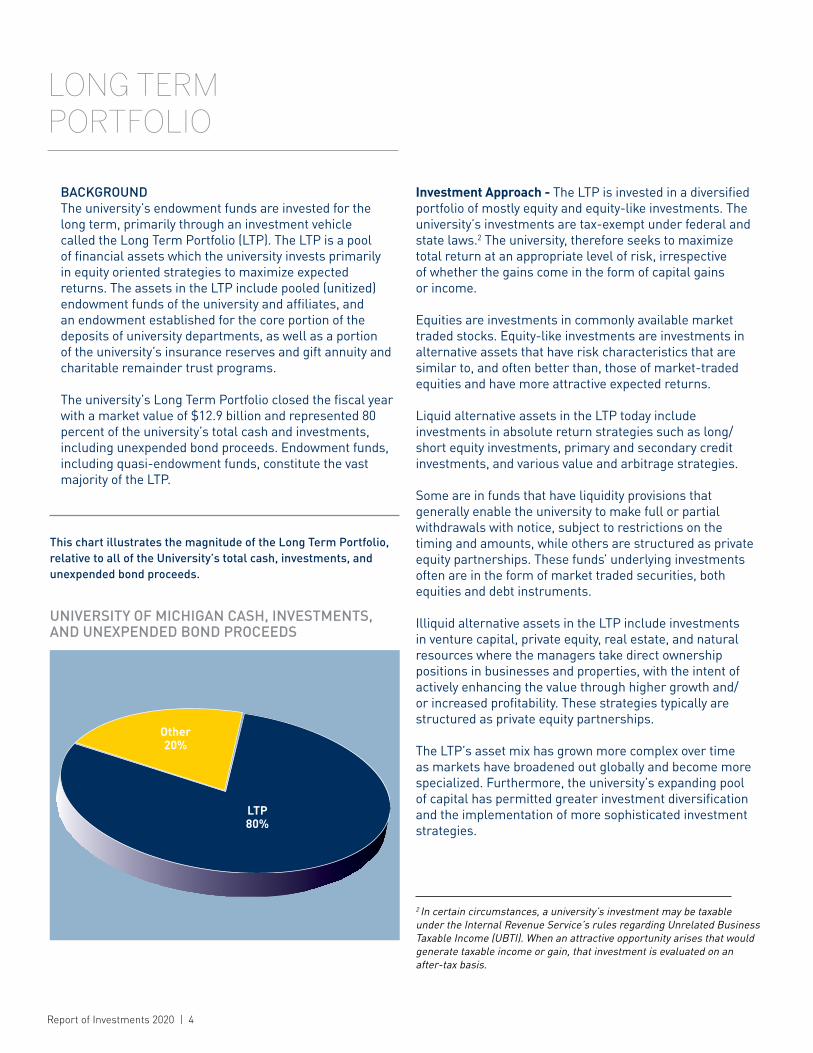
The university’s Long Term Portfolio closed the fiscal year with a market value of $12.9 billion and represented 80 percent of the university’s total cash and investments, including unexpended bond proceeds. Endowment funds, including quasi-endowment funds, constitute the vast majority of the LTP.
Investment Approach - The LTP is invested in a diversified portfolio of mostly equity and equity-like investments. The university’s investments are tax-exempt under federal and state laws.2 The university, therefore seeks to maximize total return at an appropriate level of risk, irrespective of whether the gains come in the form of capital gains or income.
Equities are investments in commonly available market traded stocks. Equity-like investments are investments in alternative assets that have risk characteristics that are similar to, and often better than, those of market-traded equities and have more attractive expected returns.
Liquid alternative assets in the LTP today include investments in absolute return strategies such as long/ short equity investments, primary and secondary credit investments, and various value and arbitrage strategies.
Some are in funds that have liquidity provisions that generally enable the university to make full or partial withdrawals with notice, subject to restrictions on the timing and amounts, while others are structured as private equity partnerships. These funds’ underlying investments often are in the form of market traded securities, both equities and debt instruments.
Illiquid alternative assets in the LTP include investments in venture capital, private equity, real estate, and natural resources where the managers take direct ownership positions in businesses and properties, with the intent of actively enhancing the value through higher growth and/ or increased profitability. These strategies typically are structured as private equity partnerships.
The LTP’s asset mix has grown more complex over time as markets have broadened out globally and become more specialized. Furthermore, the university’s expanding pool of capital has permitted greater investment diversification and the implementation of more sophisticated investment strategies.
UNIVERSITY OF MICHIGAN CASH, INVESTMENTS, AND UNEXPENDED BOND PROCEEDS
This chart illustrates the magnitude of the Long Term Portfolio, relative to all of the University’s total cash, investments, and unexpended bond proceeds.
LONG TERM PORTFOLIO
2 In certain circumstances, a university’s investment may be taxable under the Internal Revenue Service’s rules regarding Unrelated Business Taxable Income (UBTI). When an attractive opportunity arises that would generate taxable income or gain, that investment is evaluated on an after-tax basis.
Other20%
LTP80%

Report of Investments 2020 | 5
a flexible manner. Distributions were managed towards the 4.5 percent rate by keeping quarter to quarter distributions per share unchanged when the amount of per share distributions would otherwise increase under the prior distribution rate policy. The distribution rate reached 4.5 percent during FY 2014.
Limiting the amount that can be spent to a level that approximates the real rate of return of an equity-oriented portfolio preserves the value of the unitized endowment funds. Basing the distribution rate on a trailing average market value instead of the current market value insulates the University’s operations from temporary market swings and thereby facilitates prudent planning. It also results in distributions representing a lower percentage of current market value in a typical rising market. In a declining market, distributions are limited to 5.3 percent of current fair value to protect the endowment from over distribution.
The LTP is invested in a diversified portfolio of mostly equity and equity-like investments. Equities are investments in commonly available market traded stocks. Equity-like investments are investments in alternative assets, both liquid and illiquid. Alternative assets have risk characteristics that are similar to, and often better than, those of market-traded equities and have more attractive expected returns.
Liquid alternative assets in the LTP today include investments in absolute return strategies such as long/ short equity investments, primary and secondary credit investments, and various value and arbitrage strategies. Some are in funds that have liquidity provisions that generally enable the University to make full or partial withdrawals with notice subject to restrictions on the timing and amounts, while others are structured as private equity partnerships. The underlying investments often are in the form of market traded securities, both equities and debt instruments.
Illiquid alternative assets in the LTP include investments in venture capital, private equity, real estate and natural resources where the managers take direct ownership positions in businesses and properties with the intent of actively enhancing the value through higher growth and/ or increased profitability. These strategies typically are structured as private equity partnerships.
The LTP’s asset mix has grown more complex over time as markets have broadened out globally and become more specialized. Furthermore, the University’s expanding pool of capital has permitted greater investment diversification and the implementation of more sophisticated investment strategies.
The following sections review the portfolio’s current asset allocation and performance and discuss each of the groups of assets that constitute the Long Term Portfolio in greater detail.
XXXXXXXXXXXXXXXXXXXXXXXXXXDistribution Policy - The university’s Board of Regents established a distribution policy for its unitized endowment funds to insulate the operating budget from the market volatility that historically has accompanied equity and equity-like investments. This policy provides for a stable and growing stream of distributions from the endowment funds in a manner that protects their value over time and preserves intergenerational equity.
Under the university’s distribution policy, a distribution rate is applied to the one-quarter lagged moving average market value of unitized University Endowment Fund shares. The Board of Regents has made some important adjustments to the distribution policy over time to reduce the volatility of distributions to university departments for operations and to better preserve, in real terms, the corpus of the unitized University Endowment Funds and grow the distributions they provide.
In June 2006, the Board of Regents extended the moving average period to seven years by extending the averaging period from three years to four years, and then adding one quarter each subsequent quarter until the averaging period reached the targeted 28 quarters, or seven years. In July 2010, the Board lowered the distribution rate to4.5 percent from 5.0 percent, while maintaining the seven year averaging period, to more effectively protect the
purchasing power of the university’s endowments and thedistributions they provide. The lowering of the distribution rate was implemented gradually over a number of years in a flexible manner. The distribution rate reached 4.5 percent during fiscal year 2014.
Limiting the amount that can be spent to a level that approximates the real rate of return of an equity-oriented portfolio preserves the value of the unitized University Endowment Funds. Basing the distribution rate on a trailing average market value instead of the current market value insulates the university’s operations from temporary market swings and thereby facilitates prudent planning. It also results in distributions representing a lower percentage of current market value in a typical rising market. In a declining market, distributions are limited to 5.3 percent of current fair value to protect the endowment from over distribution.
The portfolio’s current asset allocation and performance are reviewed and discussed in greater detail in the sections that follow.
DEI’s “Community Conversations for Staff” featured vice provost for equity and inclusion and CDO Robert Sellers and other DEI staffers, who provided
updates on U-M’s five year Diversity, Equity, and Inclusion Strategic Plan.

Report of Investments 2020 | 6
ASSET ALLOCATIONThe table below shows the asset allocation at the end of fiscal year 2020 and fiscal year 2019. The largest change during fiscal year 2020 was a decrease in the allocation to Market Traded Equities offset by an increase in the allocation to Cash and Venture & Private Equity. The section that follows describes the asset class exposures in further detail.
Asset classes in this report are categorized according to the underlying investments of each strategy or fund and will differ from those described in the university’sannual financial report which also considers the liquidity characteristics of each fund. Market Traded Equities includes investments in publicly traded stocks listed in the U.S. and abroad that exhibit a high correlation to the overall market and are held either through a fund or directly owned by the university. Fixed Income is investments in debt instruments of high credit quality. Absolute Return is a collection of investments in funds pursuing non-traditional investment strategies that, inaggregate, are designed to exhibit low correlation to the
direction of overall markets while generating returns over the long term that are competitive with equities.
Venture and Private Equity were combined into one allocation called Venture & Private Equity last year to reflect the increasingly blurred line between the two historically distinct asset classes. Investments in Venture & Private Equity range from funds that invest in newly created companies, primarily in technology and life sciences in the U.S., China, and to a lesser extent, India and Europe, to investments in funds that invest in existing, predominantly private companies in the U.S. or abroad, where the fund managers seek to improve performance either through growth or enhanced profitability.
Real Estate is investments in funds that invest in properties in various sectors such as residential, office, retail, hotel, and industrial, predominantly located in the U.S., Europe, and Asia.
Natural Resources is investments in companies located primarily in the U.S. that produce oil and natural gas,and companies that service those industries, as well as non-energy related investments in minerals, mining, and wetland restoration.
ASSET ALLOCATION FOR LONG TERM PORTFOLIO MARKETABLE SECURITIES3 6/30/2020 6/30/2019Market Traded Equities 11.8% 21.7%
Fixed Income 3.7 4.6
Cash 6.7 1.1Total Traditional Assets 21.1 27.4
Absolute Return 23.2 22.6
TOTAL MARKETABLE SECURITIES 45.3% 50.0%
ALTERNATIVE ASSETS (IllIquId) 6/30/2020 6/30/2019Venture & Private Equity 36.1% 30.8%
Real Estate 10.6 10.0
Natural Resources 8.1 9.1
TOTAL ALTERNATIVE ASSETS (IllIquId) 54.7% 50.0%
TOTAL LONG TERM PORTFOLIO 100.0% 100.0%
3 Marketable Securities include some investments in funds that have liquidity provisions which enable the university to make full or partial withdraw-als, with notice, subject to restrictions on the timing and amounts and illiquid private equity structures in which the underlying investments are in the form of Market Traded Securities.
This chart shows the LTP’s 2020 and 2019 fiscal year end asset allocations. The largest changes in asset allocation reflect decreases in the allocations to Market Traded Equities and increases in the allocations to Cash and Venture & Private Equity.
Totals may not sum due to rounding.
Report of Investments 2020 | 7
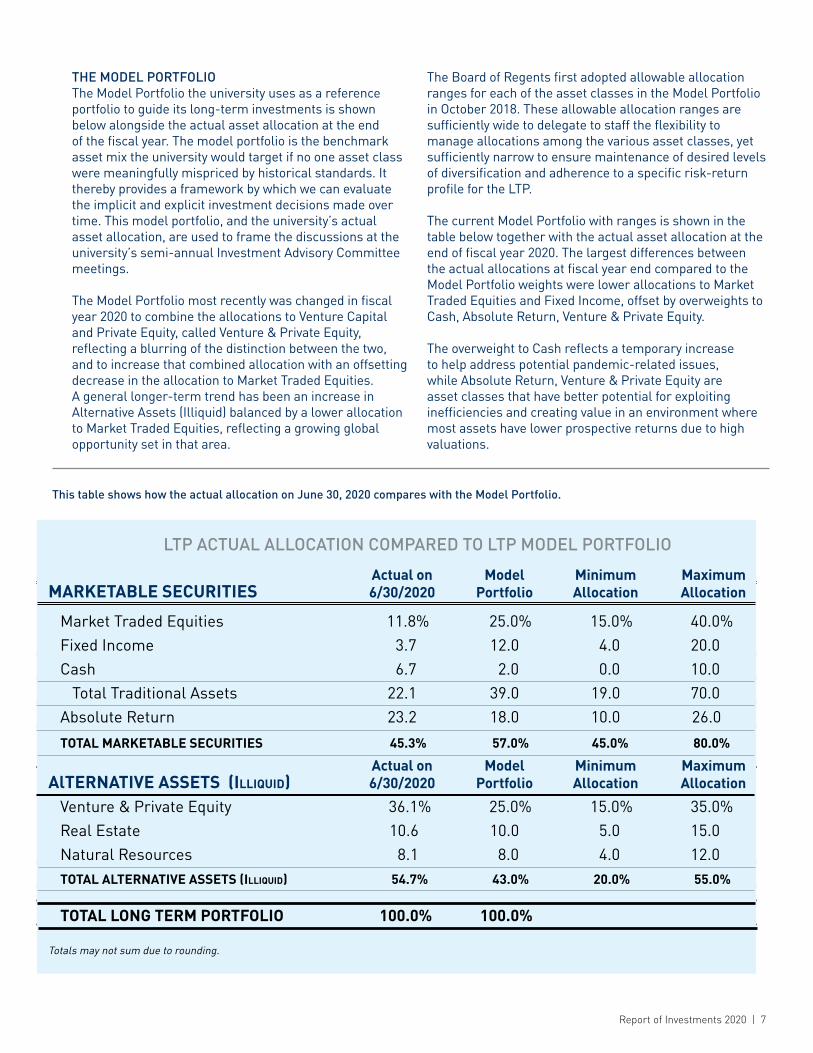
THE MODEL PORTFOLIO The Model Portfolio the university uses as a reference portfolio to guide its long-term investments is shown below alongside the actual asset allocation at the end of the fiscal year. The model portfolio is the benchmark asset mix the university would target if no one asset class were meaningfully mispriced by historical standards. It thereby provides a framework by which we can evaluate the implicit and explicit investment decisions made over time. This model portfolio, and the university’s actual asset allocation, are used to frame the discussions at the university’s semi-annual Investment Advisory Committee meetings.
The Model Portfolio most recently was changed in fiscalyear 2020 to combine the allocations to Venture Capitaland Private Equity, called Venture & Private Equity, reflecting a blurring of the distinction between the two, and to increase that combined allocation with an offsetting decrease in the allocation to Market Traded Equities. A general longer-term trend has been an increase in Alternative Assets (Illiquid) balanced by a lower allocation to Market Traded Equities, reflecting a growing global opportunity set in that area.
The Board of Regents first adopted allowable allocation ranges for each of the asset classes in the Model Portfolio in October 2018. These allowable allocation ranges are sufficiently wide to delegate to staff the flexibility to manage allocations among the various asset classes, yet sufficiently narrow to ensure maintenance of desired levels of diversification and adherence to a specific risk-return profile for the LTP.
The current Model Portfolio with ranges is shown in the table below together with the actual asset allocation at the end of fiscal year 2020. The largest differences between the actual allocations at fiscal year end compared to the Model Portfolio weights were lower allocations to Market Traded Equities and Fixed Income, offset by overweights to Cash, Absolute Return, Venture & Private Equity.
The overweight to Cash reflects a temporary increase to help address potential pandemic-related issues, while Absolute Return, Venture & Private Equity are asset classes that have better potential for exploiting inefficiencies and creating value in an environment where most assets have lower prospective returns due to high valuations.
LTP ACTUAL ALLOCATION COMPARED TO LTP MODEL PORTFOLIO MARKETABLE SECURITIES Actual on 6/30/2019 Model PortfolioMarket Traded Equities 21.7% 21.7% 21.7% 28.0%
Fixed Income 4.6 12.0
Cash 1.1 2.0
Total Traditional Assets 27.4 42.0
Absolute Return 22.6 18.0
TOTAL MARKETABLE SECURITIES 50.0% 60.0%
ALTERNATIVE ASSETS (IllIquId) Actual on 6/30/2019 Model PortfolioVenture Capital 18.1% 10.0%
Private Equity 12.7 12.0
Real Estate 10.0 10.0
Natural Resources 9.1 8.0
TOTAL ALTERNATIVE ASSETS (IllIquId) 50.0% 40.0%
TOTAL LONG TERM PORTFOLIO 100.0% 100.0%
This table shows how the actual allocation on June 30, 2020 compares with the Model Portfolio.
LTP ACTUAL ALLOCATION COMPARED TO LTP MODEL PORTFOLIO
Actual on Model Minimum Maximum MARKETABLE SECURITIES 6/30/2020 Portfolio Allocation Allocation
Market Traded Equities 11.8% 25.0% 15.0% 40.0%Fixed Income 3.7 12.0 4.0 20.0 Cash 6.7 2.0 0.0 10.0 Total Traditional Assets 22.1 39.0 19.0 70.0Absolute Return 23.2 18.0 10.0 26.0
TOTAL MARKETABLE SECURITIES 45.3% 57.0% 45.0% 80.0%
Actual on Model Minimum Maximum AlTERNATIVE ASSETS (IllIquId) 6/30/2020 Portfolio Allocation Allocation
Venture & Private Equity 36.1% 25.0% 15.0% 35.0%Real Estate 10.6 10.0 5.0 15.0Natural Resources 8.1 8.0 4.0 12.0 TOTAL ALTERNATIVE ASSETS (IllIquId) 54.7% 43.0% 20.0% 55.0%
TOTAL LONG TERM PORTFOLIO 100.0% 100.0%
Totals may not sum due to rounding.
Report of Investments 2020 | 8
The following are observations about the Model Portfolio:
• The Model Portfolio includes all major asset classes.
• Marketable Securities represents the majority of assets with a model allocation of 57 percent.
• Market Traded Equities and Venture & Private Equity are the largest asset classes with a model weights of 25 percent as they have the longest histories of proven high returns.
• Fixed Income is used as a deflation hedge with a meaningful model allocation of 12 percent.
• The allocation to Absolute Return of 18 percent is sufficiently large to enhance returns during average to weak equity markets.
• The Model Portfolio allocation to Cash reflects the ongoing need to carry a certain level of transactional cash in the portfolio in order to properly manage the large and mature alternatives investment program which creates strong and uneven cash distributions and demands for contributions.
• The allocations to Real Estate and Natural Resources are sufficiently large to add diversification and enhance returns in periods of rising inflation.
At the end of fiscal year 2020, the actual-to-model portfolio allocations within Marketable Securities reflected underweights to Market Traded Equities and Fixed Income. This was due to concerns over high valuations and therefore low prospective returns from investments in these asset classes, as well as a temporary increase in Cash sourced primarily from Market Traded Equities to help address potential COVID-19 related issues. The higher allocation to Absolute Return reflects a view that these investments have a higher return potential than Fixed Income, while preserving some of Fixed Income. Venture & Private Equity has the largest overweight, reflecting above average appreciation and the potential for significant value creation in these investments.
The lower exposure to Market Traded Equities reflected the university’s view that stock valuations are at a level where the average stock offers limited return potential unless already high earnings continue to grow or high multiples continue to expand. A stronger case can be made for investments in equity-related illiquid assets, such as Venture & Private Equity, where there typically is greater opportunity to create additional value through active management and in Absolute Return strategies where fund managers take advantage of inefficiencies.
The allocation to Fixed Income is less than that of the Model Portfolio because of today’s low interest rate environment. Going forward, this likely will result in muted future returns from traditional fixed income securities due to low starting yields and potential mark-to-market losses if interest rates increase. Although lower than that of the Model Portfolio, the allocation to Fixed Income remains an important portfolio stabilizer and deflationary hedge. Additionally, the traditional fixed income securities in the portfolio are high quality with an average rating of AA, and substantially all those securities are rated investment grade. This allocation also includes a convertible arbitrage strategy.
The overweight exposure to Cash reflects a temporary increase to address potential COVID-19 related issues. The university in general seeks to hold a low level of cash in order to minimize the drag on aggregate performance from cash holdings, as cash is the lowest performing asset class over long investment periods.
The Absolute Return allocation is above that of the Model Portfolio as this asset class has higher prospective returns than traditional stocks and bonds given the elevated valuations of equities and fixed income securities while preserving some of the diversifying properties of Fixed Income. The strategies within this portfolio include long/short equity investments, primary and secondary credit investments, and other strategies that in aggregate are designed to exhibit low correlation to the direction of the overall market. The Absolute Return strategies substitute managers’ ability to identify and profit from security specific trades for exposure to the market in general.
Absolute Return managers generally outperform stocks in a weak equity market, are competitive with equities in a normal market environment, and lag stocks in strongequity markets. Some of the Absolute Return investments are in funds that have liquidity provisions that enable the university to make full or partial periodic withdrawals subject to restrictions on prior notice, while others are structured as private equity partnerships. The underlying investments in these funds often are in the form of market traded securities, both equities and fixed income, or privately negotiated debt instruments.
The allocation to Venture Capital was combined with that of Private Equity into one asset class called Venture & Private Equity last year, reflecting the increasingly blurred line between these two asset classes that historically had been more distinct.

Report of Investments 2020 | 9
The higher than model weight is a result of the performance of this asset class which has outpaced that of the University’s other investments, as well as a recent trend among investee companies to raise private capital at high valuations and delay going public.
The allocation to Private Equity reflects a focused effort to build the University’s exposure to this asset class on a global basis, consistent with our philosophy of seeking to invest with only the best performers in the industry. The University has made a number of commitments over the past decade and has created a global private equity program with long term returns well ahead of the public market counterparts. The allocation to this asset class has decreased in recent years as a result of assets sales that have outpaced new investments and is now in line with the Model Portfolio.
Real Estate and Natural Resources continue to play important roles in the portfolio as diversifying assets with inflation protecting characteristics and performance drivers that historically have been different from those of equities.
The approach to investing in these asset classes is to emphasize opportunities to add value over pure asset class exposure. The University has actively sought out real estate investment opportunities globally and has built a portfolio that is broadly diversified geographically and by property type.
While the natural resources portfolio historically has been dominated by investments in proven oil and natural gas reserves, today it is more balanced between those types of investments, and investments in companiesthat service the oil and gas industry. In addition, the University has broadened its investments beyond the energy sector to also include investments in minerals and mining and wetland restoration.
The lower-than-model portfolio weights in these two asset classes reflect the secondary sale of a portion of the real estate portfolio last fiscal year and the recent weak absolute performance of natural resources due to low oil prices.
The section that begins on the next page discusses the performance of the Long Term Portfolio, starting with overall information followed by further detail for each of the individual asset classes.
The higher allocation to Venture and Private Equity reflects impacts of strong performance and muted distributions. Performance of Venture & Private Equity has outpaced performance of other asset classes in recent years. This performance dynamic, coupled with relatively longer holding periods of venture capital investments, hasresulted in an increased allocation to Venture & PrivateEquity. While performance of venture capital can bepotentially volatile in the short term, it has been one ofthe best performing areas of investment over the longterm. The Venture & Private Equity asset class reflects afocused effort on building global exposure to the best fundmanagers in the industry. The university’s global Venture& Private Equity investments have generated long-termreturns well ahead of the public market counterparts.
Real Estate and Natural Resources continue to play important roles in the portfolio as diversifying assets with inflation protecting characteristics and performance drivers that historically have been different from those of equities.
The approach to investing in these asset classes is to emphasize opportunities to add value over pure asset class exposure. The university has actively sought out real estate investment opportunities globally and has built a portfolio that is broadly diversified geographically and by property type.
While the natural resources portfolio historically was dominated by investments in proven oil and natural gas reserves, today it is more balanced between those types of investments and investments in companies that service the oil and gas industry. In addition, the University has broadened its investments beyond the energy sector to also include investments in minerals and mining and wetland restoration.
The section that begins on the next page discusses the performance of the Long Term Portfolio, starting with overall information followed by further detail for each of the individual asset classes.
A Chinese folk dance demonstration by Inner Action Dance, a Beijing performing art company, which has been training dancers in Michigan since 2009. The event was part of UMSI’s Lunar New Year celebration in 2019.

Report of Investments 2020 | 10
INVESTMENT PERFORMANCE4
Fiscal year 2020 was dominated by the COVID-19 crisis which peaked, with respect to financial markets, in March. The Long Term Portfolio posted a 2.3 percent return for the year and ranked above the median when compared to the performance of other college and university endowments and foundations, where the median performance is estimated to be 1.1 percent5. The Long Term Portfolio’s performance was largely driven by strong absolute returns in Venture & Private Equity and Fixed Income, with the 19.0 percent return by the venture capital component of Venture & Private Equity providing the most significant contribution. Natural Resources and Marketable Equities detracted from returns.
The LTP’s investment return of 2.3 percent last year lagged the 2.6 percent return of the custom benchmark, which is designed to measure the success of the implementation of the university’s long-term diversified investment strategy. The LTP outperformed the 1.4 percent return of the Blended Passive Benchmark(b) over the same period. This index is a representation of an alternative, passive, investable portfolio strategy for a large investment pool such as the university’s LTP. Performance over the long term is above both benchmarks.
In the third quarter of the fiscal year, the global pandemic resulted in a sharp decline in economic activity across both developed and emerging economies. Rapid monetary and fiscal intervention by governments reduced both the immediate and long-term impact on global GDP. Global markets declined rapidly in the face of growing concerns about the effect of COVID-19 on the world’s economies but
recovered quickly in response to government intervention. The government intervention to support economic activity in the face of the global pandemic continues the now decade old accommodative monetary policy, which is pursued by most of the world’s main central banks, that has served to drive asset prices higher and future returns lower. U.S. interest rates are still higher than those of most other developed economies even after the decline this last fiscal year, but by a smaller margin. Until recently, relatively high interest rates combined with relatively strong economic growth has supported the U.S. dollar, helped keep inflation low, and depressed returns from non-U.S. investments. Going forward, we do not expect this support to be as strong.
The equity investments within Alternative Assets, represented by Venture & Private Equity, performed well last year with returns much higher than that of public equities. Fixed Income was the overall best performer as yields collapsed globally. Going forward, the environment has become much less benign for financial markets as most of the world’s developed market central banks have little room to stimulate further and limited monetary tools available to react to any slowdown in economic activity.
The LTP has generated an annualized return of 7.4 percent over the past 20 years, which compares well to the 5.9 percent annualized return of its benchmark and the 5.9 percent annualized return of the S&P 500 stock index assuming dividends were reinvested in the index.
The table below shows the Long Term Portfolio’s investment performance compares favorable relative to the benchmark over all periods.
4 Investment returns are shown net of manager fees, expenses, and carried interest throughout this report. 5 Cambridge Associates, LLC.
PERFORMANCE SUMMARY | PERIODS ENDING JUNE 30, 2020
LONG TERM PORTFOLIOFair Value
(in millions) 1 Year 3 Year(a) 5 Year(a) 10 Year(a) 20 Year(a)
TOTAL LONG TERM PORTFOLIO $ 12,860.5 2.32% 6.40% 6.22% 8.57% 7.39%Benchmark for Long Term Portfolio(b) 2.57 6.10 5.63 8.21 5.88Blended Passive Benchmark (b) 1.37 5.28 5.55 7.86 3.98
(a) Annualized (b) For periods longer than two years, the return of the Blended Passive Index is combined with the 80/20 Benchmark that the university previously used as a passive alternative. All benchmarks are described on pages 28-32.

Report of Investments 2020 | 11
The chart below shows the performance in the portfolio last year. Strong investment returns in Venture & Private Equity and Fixed Income contributed most to the LTP’s 2.3 percent investment return last year.
Performance on an absolute basis was strongest in Venture & Private Equity and Fixed Income while the rest of the portfolio lagged. Fixed Income returns were driven higher when global central banks reduced interest rates to record low levels following the onset of last year’s pandemic. The return in Venture & Private Equity reflects the strong fundamentals of the portfolio’s underlying companies and their revaluation to catch up with their publicly traded comparables. The high multiples currently being paid for equity and equity-like investments imply that long-term future returns will likely be lower in these asset classes in coming years.
FISCAL YEAR 2020 PERFORMANCE BY ASSET CLASS
Prices for investments within the Fixed Income asset class have been high for some time. It is therefore surprising that Fixed Income generated the second highest return. Most of the return to Fixed Income this year resulted from an increase in already high bond prices. Higher bond prices result in lower yields, implying that this asset class may generate low returns for the foreseeable future.
Marketable Securities Alternative Assets (Illiquid)
-16.5%-15%
-20%
FY ’2
0 Re
turn
-4.5%
14.9%
2.2% 0.9%
-3.8%
Total FY ’20 Return: 2.3%
20%
15%
10%
5%
0%
-5%
-10%
15.8%
Venture & Private Equity
Absolute Return
CashFixed Income
Equities Real Estate
NaturalResources
Report of Investments 2020 | 12
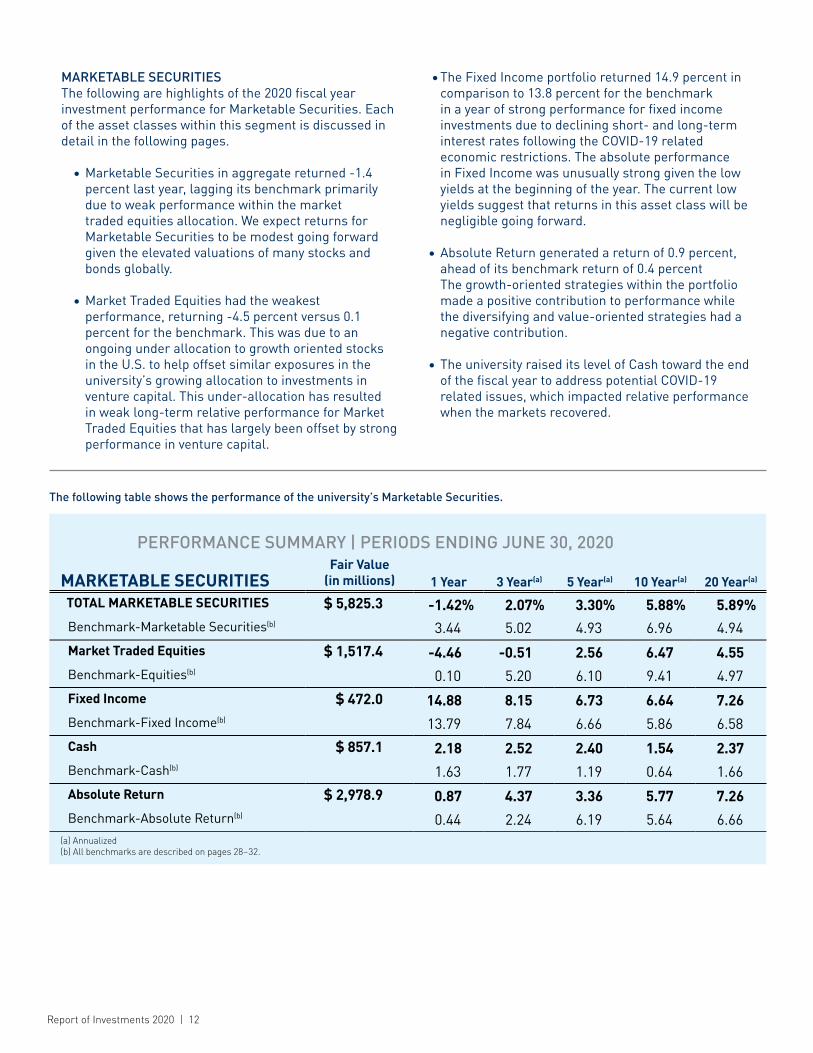
MARKETABLE SECURITIESThe following are highlights of the 2020 fiscal year investment performance for Marketable Securities. Each of the asset classes within this segment is discussed in detail in the following pages.
• Marketable Securities in aggregate returned -1.4 percent last year, lagging its benchmark primarily due to weak performance within the market traded equities allocation. We expect returns for Marketable Securities to be modest going forward given the elevated valuations of many stocks and bonds globally.
• Market Traded Equities had the weakest performance, returning -4.5 percent versus 0.1 percent for the benchmark. This was due to an ongoing under allocation to growth oriented stocks in the U.S. to help offset similar exposures in the university’s growing allocation to investments in venture capital. This under-allocation has resulted in weak long-term relative performance for Market Traded Equities that has largely been offset by strong performance in venture capital.
• The Fixed Income portfolio returned 14.9 percent in comparison to 13.8 percent for the benchmark in a year of strong performance for fixed income investments due to declining short- and long-term interest rates following the COVID-19 related economic restrictions. The absolute performance in Fixed Income was unusually strong given the low yields at the beginning of the year. The current low yields suggest that returns in this asset class will be negligible going forward.
• Absolute Return generated a return of 0.9 percent, ahead of its benchmark return of 0.4 percent The growth-oriented strategies within the portfolio made a positive contribution to performance while the diversifying and value-oriented strategies had a negative contribution.
• The university raised its level of Cash toward the end of the fiscal year to address potential COVID-19 related issues, which impacted relative performance when the markets recovered.
The following table shows the performance of the university’s Marketable Securities.
PERFORMANCE SUMMARY | PERIODS ENDING JUNE 30, 2020
MARKETABLE SECURITIESFair Value
(in millions) 1 Year 3 Year(a) 5 Year(a) 10 Year(a) 20 Year(a)
TOTAL MARKETABLE SECURITIES $ 5,825.3 -1.42% 2.07% 3.30% 5.88% 5.89%Benchmark-Marketable Securities(b) 3.44 5.02 4.93 6.96 4.94 Market Traded Equities $ 1,517.4 -4.46 -0.51 2.56 6.47 4.55Benchmark-Equities(b) 0.10 5.20 6.10 9.41 4.97Fixed Income $ 472.0 14.88 8.15 6.73 6.64 7.26Benchmark-Fixed Income(b) 13.79 7.84 6.66 5.86 6.58Cash $ 857.1 2.18 2.52 2.40 1.54 2.37Benchmark-Cash(b) 1.63 1.77 1.19 0.64 1.66Absolute Return $ 2,978.9 0.87 4.37 3.36 5.77 7.26Benchmark-Absolute Return(b) 0.44 2.24 6.19 5.64 6.66
(a) Annualized (b) All benchmarks are described on pages 28–32.
Report of Investments 2020 | 13
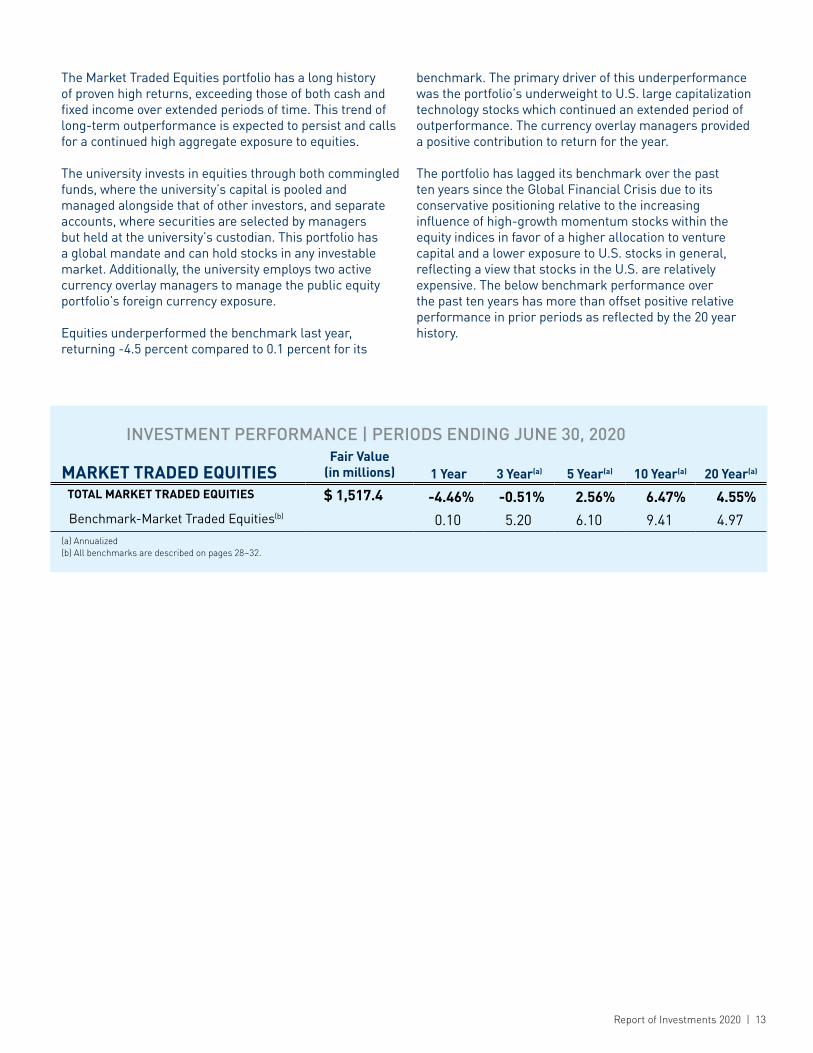
The Market Traded Equities portfolio has a long history of proven high returns, exceeding those of both cash and fixed income over extended periods of time. This trend of long-term outperformance is expected to persist and calls for a continued high aggregate exposure to equities.
The university invests in equities through both commingled funds, where the university’s capital is pooled and managed alongside that of other investors, and separate accounts, where securities are selected by managers but held at the university’s custodian. This portfolio has a global mandate and can hold stocks in any investable market. Additionally, the university employs two active currency overlay managers to manage the public equity portfolio’s foreign currency exposure. Equities underperformed the benchmark last year, returning -4.5 percent compared to 0.1 percent for its
benchmark. The primary driver of this underperformance was the portfolio’s underweight to U.S. large capitalization technology stocks which continued an extended period of outperformance. The currency overlay managers provided a positive contribution to return for the year.
The portfolio has lagged its benchmark over the past ten years since the Global Financial Crisis due to its conservative positioning relative to the increasing influence of high-growth momentum stocks within the equity indices in favor of a higher allocation to venture capital and a lower exposure to U.S. stocks in general, reflecting a view that stocks in the U.S. are relatively expensive. The below benchmark performance over the past ten years has more than offset positive relative performance in prior periods as reflected by the 20 year history.
INVESTMENT PERFORMANCE | PERIODS ENDING JUNE 30, 2020
MARKET TRADED EQUITIESFair Value
(in millions) 1 Year 3 Year(a) 5 Year(a) 10 Year(a) 20 Year(a)
TOTAL MARKET TRADED EQUITIES $ 1,517.4 -4.46% -0.51% 2.56% 6.47% 4.55%Benchmark-Market Traded Equities(b) 0.10 5.20 6.10 9.41 4.97
(a) Annualized (b) All benchmarks are described on pages 28–32.

Report of Investments 2020 | 14
Fixed Income is included in the LTP as a portfolio stabilizer and a deflation hedge. While the volatility of the return pattern of high quality fixed income investments tends to be low, the approximately 2.6 percent real return generated by this asset class over the very long run5 is the lowest of any of the major asset classes, except cash, and is not expected to be able to sustain the university’s 4.5 percent distribution rate.
Fixed Income’s role as a deflation hedge, however, remains important as falling interest rates boost the performance of these investments. With that as an objective, it is important to maintain high credit quality in order to preserve the bonds’ primary role of deflation protection and allow risk to be assumed for a higher return elsewhere in the portfolio.
For many years, the LTP’s fixed income portfolio has maintained a longer duration than the commonly used fixed income benchmarks. On June 30, 2020, the Fixed Income portfolio’s effective duration was 12.9 years, while the duration of the commonly used Bloomberg Barclays U.S. Aggregate Bond Index was 6.0 years. For comparison, the duration of the custom benchmark used for the university’s fixed income portfolio was 11.4 years.
An emphasis on high-quality, long-duration bonds enhances the portfolio’s ability to serve as a hedge against deflation. Longer duration bonds should provide higher returns than shorter duration bonds over time while they will experience greater volatility in returns over shorter periods of time. Longer duration bonds outperform shorter duration bonds during periods of flat or declining interest rates and lag when interest rates rise.
The Fixed Income portfolio returned 14.9 percent in comparison to 13.8 percent for the benchmark in a year of rapidly declining interest rates following the COVID-19 related economic shut down. The portfolio is ahead of its benchmark over all time horizons as shown in the table below. Prospective fixed income returns are low and fixed income has been a source of capital for more attractive investments in recent years.
5 Average inflation adjusted return of long term corporate bonds from 1926 to 2019. Source: 2020 SBBI Yearbook.
INVESTMENT PERFORMANCE | PERIODS ENDING JUNE 30, 2020
FIXED INCOMEFair Value
(in millions) 1 Year 3 Year(a) 5 Year(a) 10 Year(a) 20 Year(a)
TOTAL FIXED INCOME $ 472.0 14.88% 8.15% 6.73% 6.64% 7.26%Benchmark-Fixed Income(b) 13.79 7.84 6.66 5.86 6.58
(a) Annualized (b) All benchmarks are described on pages 28–32.

Report of Investments 2020 | 15
Absolute Return includes strategies that provide exposure to equities and equity-like returns with reduced exposure to the aggregate market. This category of investments includes long/short equity investments, primary and secondary credit investments, and other strategies designed to exhibit low correlation to the direction of equity markets. Often focusing on security specific transactions as opposed to market trends, these strategies have more active management risk and less market risk and, therefore, require a high level of care in manager selection.
These strategies may involve the use of derivative instruments and leverage. The university’s Absolute Return investments typically are made through limited partnerships and other structures that limit liability to the dollars committed. Some are in funds that have liquidity provisions which enable the university to make full or partial withdrawals with notice subject to restrictions on the timing and amounts, while others are structured as private equity partnerships. The underlying investments often are in the form of market traded securities in both equities and fixed income instruments or private debt instruments.
Absolute Return strategies are expected to be competitive with public market equities in a normal return environment and to outperform stocks in a weak market. They also generally lag in periods of unusually strong equity markets.
The Absolute Return portfolio posted a 0.9 percent gain and compared favorably to the 0.4 percent return of its benchmark. The portfolio’s growth oriented equity and credit investments contributed positively to both absolute and relative performance, while the diversifying and value-oriented strategies within the portfolio detracted from performance.
The portfolio has outperformed its benchmark over almost all periods. Absolute Return has lagged equities’ strong performance over the past ten years but still compares favorably over the 20-year horizon.
INVESTMENT PERFORMANCE | PERIODS ENDING JUNE 30, 2020
ABSOLUTE RETURNFair Value
(in millions) 1 Year 3 Year(a) 5 Year(a) 10 Year(a) 20 Year(a)
TOTAL ABSOLUTE RETURN $ 2,978.9 0.87% 4.37% 3.36% 5.77% 7.26%Benchmark-Absolute Return(b) 0.44 2.24 6.19 5.64 6.66Domestic Stocks-S&P 500 Index 7.51 10.73 10.73 13.99 5.91
(a) Annualized (b) All benchmarks are described on pages 28–32.

Report of Investments 2020 | 16
ALTERNATIVE ASSETS (Illiquid)The university has built its portfolio of illiquid alternative assets over the past 30 years, starting with investments in real estate, expanding to natural resources investments, and then finding opportunities in venture capital and private equity.
Investments in these alternative assets are typically in the form of limited partnerships and similar pooled vehicles, each managed by a general partner that primarily makes privately negotiated investments in non-public companies and properties. As there is far greater dispersion of returns among these managers than among equity and fixed income managers, the university seeks to remain aligned with top-tier management groups.
These are long-term illiquid investments. Typically, a partnership is structured so that the university makes an initial dollar commitment and contributes capital to make investments over time. The investments usually take years to mature, with proceeds distributed when companies or properties are refinanced or sold.
Historically, alternative assets have been a source of strength for the Long Term Portfolio. The university’s portfolio of illiquid alternative assets generated a return of 5.8 percent last year, outperforming the custom benchmark by 4.6 percentage points. The alternative assets portfolio has significantly outperformed both the long-term, 20-year benchmark and the short-term, one- and three- year benchmarks. Unusually strong performance of U.S. equities which underlies the longer
term alternative assets benchmark(b) largely explains the relatively lower than benchmark performance over the past five and ten years. Below are asset class highlights for fiscal year performance.
• Venture Capital posted the most substantial gains with a return of 19.0 percent, followed by Private Equity’s 11.4 percent and Real Estate’s -3.8 percent return. Natural Resources posted a -16.5 percent return for the fiscal year.• The strong returns of the Venture Capital portfolio
were driven by investments in technology and software companies.
• Within the Private Equity portfolio, domestic invest-ments generated returns well above the benchmark and Non-U.S. investments produced returns slightly below, resulting in overall performance above the benchmark.
• While the domestic real estate assets continued to exhibit relative strength compared to Non-U.S. assets, returns in the entire Real Estate portfolio were impacted by decreased demand and a deflationary environment due to COVID-19.• Natural Resources posted a -16.5 percent return for the year, materially outperforming the performance of the benchmark. Energy-focused private equity and exploration and production funds struggled amid falling oil and gas prices following a substantial drop in demand due to COVID-19 related economic restrictions, while funds focused on other strategies, such as mining-related and wetland restoration, were the strongest performers.
The following table shows the performance of the university’s Illiquid Alternative Assets.
PERFORMANCE SUMMARY | PERIODS ENDING JUNE 30, 2020
ALTERNATIVE ASSETS (IllIquId)Fair Value
(in millions) 1 Year 3 Year(a) 5 Year(a) 10 Year(a) 20 Year(a)
TOTAL ALTERNATIVE ASSETS (IllIquId) $ 7,035.1 5.77% 10.94% 9.38% 11.65% 9.86%Benchmark-Alternative Assets(b) 1.22 7.57 12.54 16.23 8.68Venture Capital 2,773.3 18.95 21.39 14.26 17.70 6.78Benchmark-Venture Capital(b) 13.19 16.17 12.54 16.23 8.68Private Equity 1,863.0 11.43 13.42 12.84 14.01 10.58Benchmark-Private Equity(b) 6.24 10.92 12.54 16.23 8.68Real Estate 1,358.0 -3.75 3.34 4.87 7.68 7.15Benchmark-Real Estate(b) -1.22 4.69 5.82 9.73 8.34Natural Resources 1,040.9 -16.49 -3.10 -0.85 2.97 15.04Benchmark-Natural Resources(b) -19.95 -5.38 12.54 16.23 8.68
(a) Annualized (b) All benchmarks are described on pages 28–32.
Report of Investments 2020 | 17
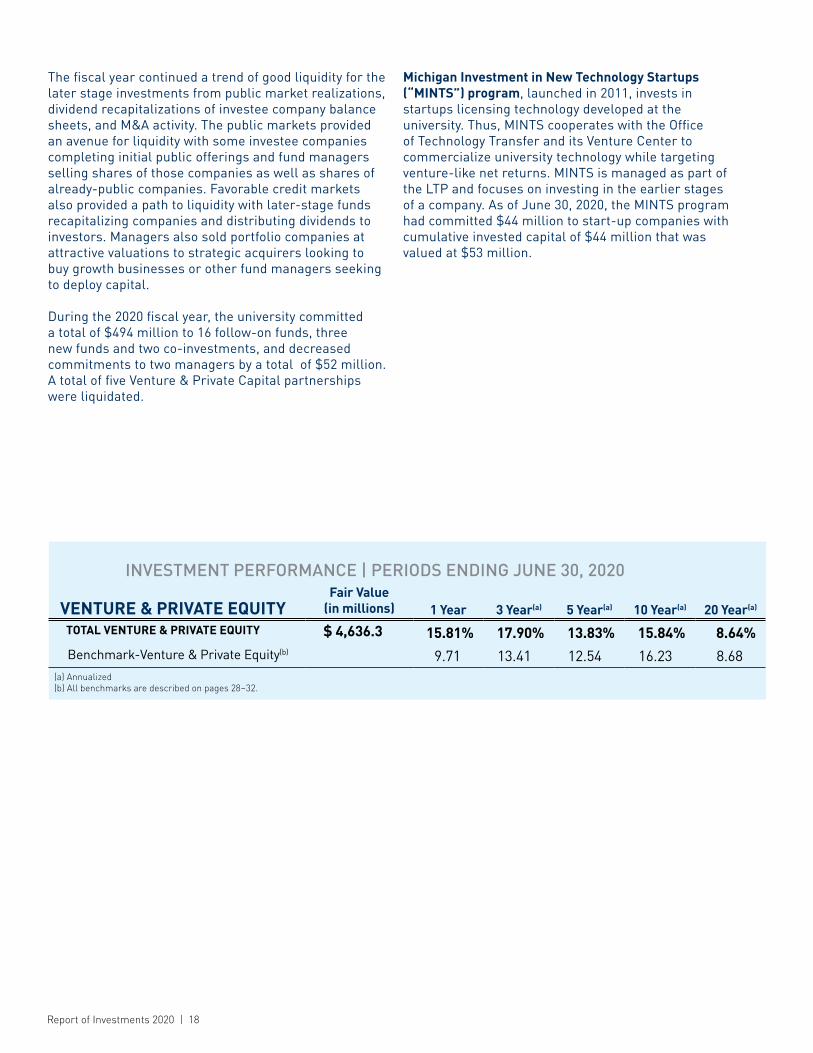
The university combined the Venture Capital and Private Equity allocations last year into one allocation called Venture & Private Equity. This change recognizes the trend for venture capital sponsored companies to stay private longer and for traditional venture capital fund managers to raise later stage growth funds, while private equity managers increasingly include growth stage investments in their funds. The Venture & Private Equity portfolio includes investments ranging from early stage investments in newly established companies mainly in the U.S., Asia, and Europe that are focused on driving innovation across the economy to investments in established companies where the fund managers seek to improve performance either through growth or enhanced profitability.
Venture & Private Equity returned 15.8 percent for the year and outperformed the benchmark return of 9.7 percent. The university’s Venture & Private Equity portfolio outperformed its one- and three- year benchmarks. These short-term benchmarks are based on the pooled aggregate performance of all funds in this asset class included in the benchmark universe. The portfolio also outperformed its longer term five- year benchmark, but underperformed its ten- year benchmark and slightly underperformed its 20-year benchmark. These long-term benchmarks are based on the performance of the U.S. equity market plus an appropriate premium to account for the added risks associated with these long-lived, illiquid investments.
The performance for earlier stage investments was generally strong across all sectors and geographies. Performance by U.S. focused funds was notable, with returns exceeding 20 percent. Global- and China-related investments dominated the returns of non-U.S. funds.
The number of initial public offerings of earlier stage investments increased compared to the prior fiscal year, with several of these initial public offerings in the enterprise software sector. The university’s fund managers generated meaningful distributions from shares of companies that went public as well as the sale of companies to strategic and financial acquirers. Among later stage funds, domestic investments produced stronger performance than non-U.S. investments, where the portfolio’s largest exposures were to Europe and Asia. While currency and other macro factors played a role in returns generated from non-U.S. investments, the differential between the U.S. and international exposures appears to be rooted in micro factors related to performance of individual companies. The portfolio’s largest later stage exposures are in the consumer discretionary, information technology, and health care sectors. The largest industry sector exposures are similar across U.S. and non-U.S. focused funds, implying that returns across geographies are more tied to micro or company-specific factors than macro factors.
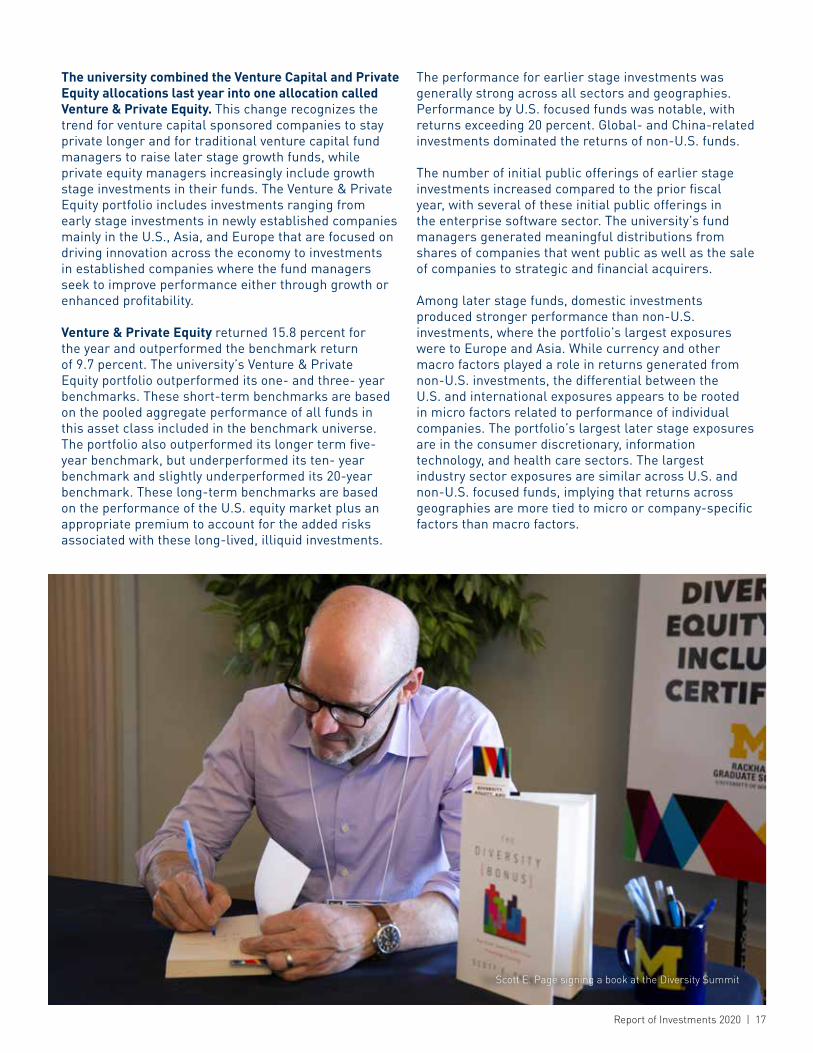
Scott E. Page signing a book at the Diversity Summit
Report of Investments 2020 | 18
INVESTMENT PERFORMANCE | PERIODS ENDING JUNE 30, 2020
VENTURE & PRIVATE EQUITYFair Value
(in millions) 1 Year 3 Year(a) 5 Year(a) 10 Year(a) 20 Year(a)
TOTAL VENTURE & PRIVATE EQUITY $ 4,636.3 15.81% 17.90% 13.83% 15.84% 8.64%Benchmark-Venture & Private Equity(b) 9.71 13.41 12.54 16.23 8.68
(a) Annualized (b) All benchmarks are described on pages 28–32.
The fiscal year continued a trend of good liquidity for the later stage investments from public market realizations, dividend recapitalizations of investee company balance sheets, and M&A activity. The public markets provided an avenue for liquidity with some investee companies completing initial public offerings and fund managers selling shares of those companies as well as shares of already-public companies. Favorable credit markets also provided a path to liquidity with later-stage fundsrecapitalizing companies and distributing dividends to investors. Managers also sold portfolio companies at attractive valuations to strategic acquirers looking to buy growth businesses or other fund managers seeking to deploy capital.
During the 2020 fiscal year, the university committed a total of $494 million to 16 follow-on funds, three new funds and two co-investments, and decreased commitments to two managers by a total of $52 million. A total of five Venture & Private Capital partnerships were liquidated.
Michigan Investment in New Technology Startups (“MINTS”) program, launched in 2011, invests in startups licensing technology developed at the university. Thus, MINTS cooperates with the Office of Technology Transfer and its Venture Center to commercialize university technology while targeting venture-like net returns. MINTS is managed as part of the LTP and focuses on investing in the earlier stages of a company. As of June 30, 2020, the MINTS program had committed $44 million to start-up companies with cumulative invested capital of $44 million that was valued at $53 million.

Report of Investments 2020 | 19
Real Estate returned -3.7 percent for the year, underperforming the benchmark return of -1.2 percent. U.S. focused funds significantly outperformed non-U.S. strategies, with emerging market real estate performance significantly lagging overall developed market real estate. Roughly three quarters of the real estate portfolio is invested in funds that focus on the U.S. with the remainder focused on Europe, South America, and Asia. The portfolio emphasizes managers with significant operating expertise, frequently in a single property type.
The Real Estate portfolio is designed to protect against unanticipated inflation. COVID-19 has been highly deflationary and has negatively impacted real estate demand globally.
Property valuations were robust prior to COVID-19. The unexpected impact of COVID-19 and related economic restrictions reduced global real estate demand in many sectors and slowed property transaction activity dramatically on a global basis because value uncertainty translates into a large bid-ask spread between buyers and sellers.
There was significant variation in performance by property type last year that was reflected in the university’s real estate portfolio, with multifamily and industrial real estate assets performing better than office, retail and hospitality assets that are more directly exposed to COVID-19 factors.
During the 2020 fiscal year, the university committed $298 million to five follow-on funds, an increased commitment to a co-investment, and one investment with a new manager. Four partnerships were liquidated and two reduced unfunded commitments.
INVESTMENT PERFORMANCE | PERIODS ENDING JUNE 30, 2020
REAL ESTATEFair Value
(in millions) 1 Year 3 Year(a) 5 Year(a) 10 Year(a) 20 Year(a)
TOTAL REAL ESTATE $ 1,358.3 -3.75% 3.34% 4.87% 7.68% 7.15%Benchmark-Real Estate(b) -1.22 4.69 5.82 9.73 8.34
(a) Annualized (b) All benchmarks are described on pages 28–32.
Report of Investments 2020 | 20
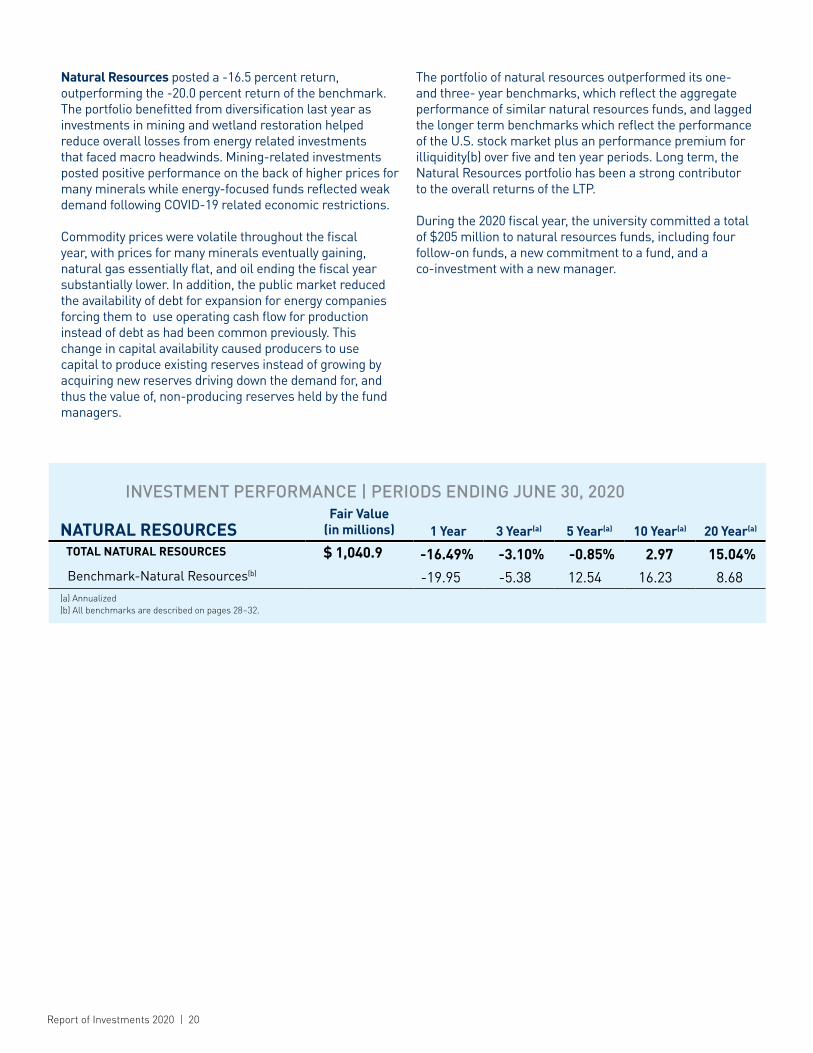
Natural Resources posted a -16.5 percent return, outperforming the -20.0 percent return of the benchmark. The portfolio benefitted from diversification last year as investments in mining and wetland restoration helped reduce overall losses from energy related investments that faced macro headwinds. Mining-related investments posted positive performance on the back of higher prices for many minerals while energy-focused funds reflected weak demand following COVID-19 related economic restrictions.
Commodity prices were volatile throughout the fiscal year, with prices for many minerals eventually gaining, natural gas essentially flat, and oil ending the fiscal year substantially lower. In addition, the public market reduced the availability of debt for expansion for energy companies forcing them to use operating cash flow for production instead of debt as had been common previously. This change in capital availability caused producers to use capital to produce existing reserves instead of growing by acquiring new reserves driving down the demand for, and thus the value of, non-producing reserves held by the fund managers.
The portfolio of natural resources outperformed its one- and three- year benchmarks, which reflect the aggregate performance of similar natural resources funds, and lagged the longer term benchmarks which reflect the performance of the U.S. stock market plus an performance premium for illiquidity(b) over five and ten year periods. Long term, the Natural Resources portfolio has been a strong contributor to the overall returns of the LTP.
During the 2020 fiscal year, the university committed a total of $205 million to natural resources funds, including four follow-on funds, a new commitment to a fund, and a co-investment with a new manager.
INVESTMENT PERFORMANCE | PERIODS ENDING JUNE 30, 2020
NATURAL RESOURCESFair Value
(in millions) 1 Year 3 Year(a) 5 Year(a) 10 Year(a) 20 Year(a)
TOTAL NATURAL RESOURCES $ 1,040.9 -16.49% -3.10% -0.85% 2.97 15.04%Benchmark-Natural Resources(b) -19.95 -5.38 12.54 16.23 8.68
(a) Annualized (b) All benchmarks are described on pages 28–32.

Report of Investments 2020 | 21
DAILY AND MONTHLY PORTFOLIOS SHORT TERM POOL VERITAS
Students from the The Michigan Engineering Zone(MEZ) program.
Report of Investments 2020 | 22
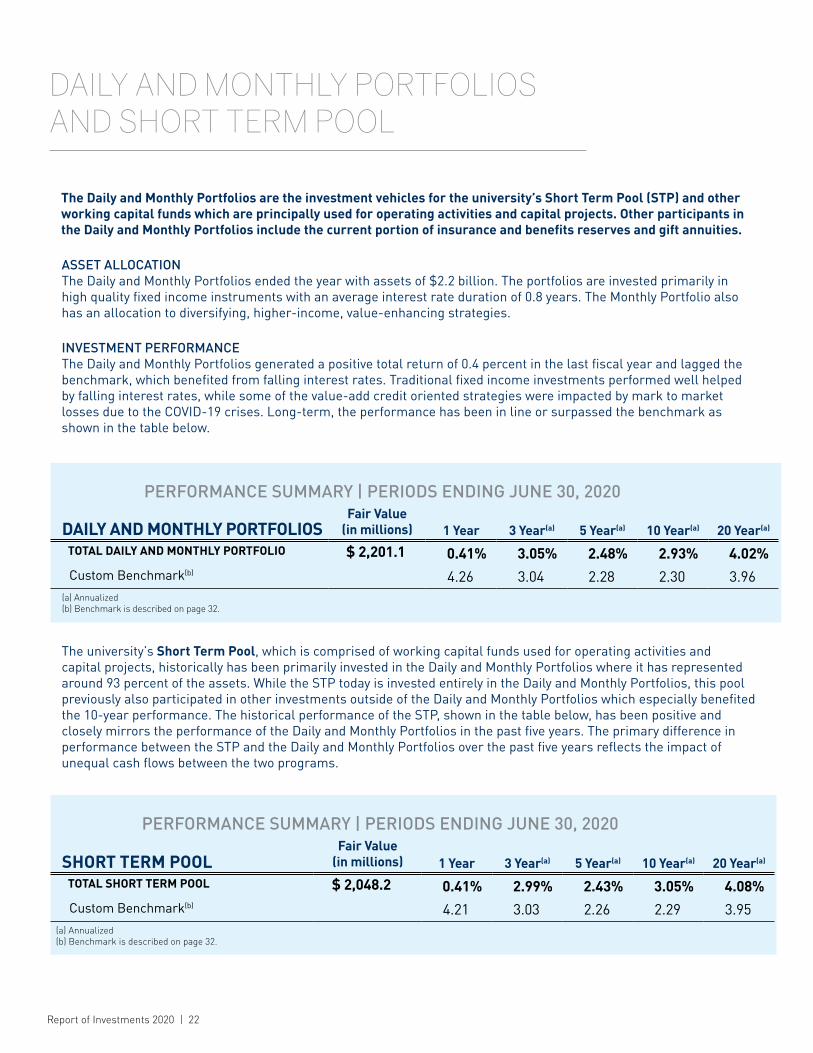
ASSET ALLOCATIONThe Daily and Monthly Portfolios ended the year with assets of $2.2 billion. The portfolios are invested primarily in high quality fixed income instruments with an average interest rate duration of 0.8 years. The Monthly Portfolio also has an allocation to diversifying, higher-income, value-enhancing strategies.
INVESTMENT PERFORMANCEThe Daily and Monthly Portfolios generated a positive total return of 0.4 percent in the last fiscal year and lagged the benchmark, which benefited from falling interest rates. Traditional fixed income investments performed well helped by falling interest rates, while some of the value-add credit oriented strategies were impacted by mark to market losses due to the COVID-19 crises. Long-term, the performance has been in line or surpassed the benchmark as shown in the table below.
The university’s Short Term Pool, which is comprised of working capital funds used for operating activities and capital projects, historically has been primarily invested in the Daily and Monthly Portfolios where it has represented around 93 percent of the assets. While the STP today is invested entirely in the Daily and Monthly Portfolios, this pool previously also participated in other investments outside of the Daily and Monthly Portfolios which especially benefited the 10-year performance. The historical performance of the STP, shown in the table below, has been positive and closely mirrors the performance of the Daily and Monthly Portfolios in the past five years. The primary difference in performance between the STP and the Daily and Monthly Portfolios over the past five years reflects the impact of unequal cash flows between the two programs.
DAILY AND MONTHLY PORTFOLIOS AND SHORT TERM POOL
The Daily and Monthly Portfolios are the investment vehicles for the university’s Short Term Pool (STP) and other working capital funds which are principally used for operating activities and capital projects. Other participants in the Daily and Monthly Portfolios include the current portion of insurance and benefits reserves and gift annuities.
PERFORMANCE SUMMARY | PERIODS ENDING JUNE 30, 2020
DAILY AND MONTHLY PORTFOLIOSFair Value
(in millions) 1 Year 3 Year(a) 5 Year(a) 10 Year(a) 20 Year(a)
TOTAL DAILY AND MONTHLY PORTFOLIO $ 2,201.1 0.41% 3.05% 2.48% 2.93% 4.02%Custom Benchmark(b) 4.26 3.04 2.28 2.30 3.96
(a) Annualized (b) Benchmark is described on page 32.
PERFORMANCE SUMMARY | PERIODS ENDING JUNE 30, 2020
SHORT TERM POOLFair Value
(in millions) 1 Year 3 Year(a) 5 Year(a) 10 Year(a) 20 Year(a)
TOTAL SHORT TERM POOL $ 2,048.2 0.41% 2.99% 2.43% 3.05% 4.08%Custom Benchmark(b) 4.21 3.03 2.26 2.29 3.95
(a) Annualized (b) Benchmark is described on page 32.

Report of Investments 2020 | 23
ASSET ALLOCATIONVeritas’ reserves were $239.9 million at June 30, 2020. The reserves generally are invested in the Daily and Monthly Portfolios and in the Long Term Portfolio in a 50/50 allocation at the beginning of each fiscal year, and then the allocations are allowed to vary with performance and cash flows during the year.
INVESTMENT PERFORMANCEThe Veritas portfolio ended the fiscal year 2020, with a negative return of 0.7%. The performance for the year was behind the benchmark and was impacted by the COVID-19 crisis. Veritas, as a pool participant, is subject to Long Term Portfolio’s “lagged” performance methodology, and has its own specific cash flows. Veritas’ portfolio lagged the benchmark over the one to five year periods, and outperformed the benchmark over the longer periods shown in the table below.
VERITAS
Veritas is the university’s wholly-owned insurance company. Its investment structure is designed to meet Veritas’ particular liquidity needs, liability structure, and regulatory requirements.
PERFORMANCE SUMMARY | PERIODS ENDING JUNE 30, 2020
VERITASFair Value
(in millions) 1 Year 3 Year(a) 5 Year(a) 10 Year(a) 20 Year(a)
TOTAL VERITAS $ 239.9 -0.72% 3.95% 4.02% 5.61% 5.65%
Custom Benchmark(b) 3.54 4.53 4.27 5.41 3.31(a) Annualized (b) Benchmark is described on page 32.
ASSET ALLOCATION | AS OF JUNE 30, 2020
VERITASFair Value
(in millions)Percent of
Total Vermont Statutory Reserve $ 0.3 0.1%Daily and Monthly Portfolio 112.6 46.9Long Term Portfolio 127.0 52.0
Total Veritas $ 239.9 100.0%

The MESA table at Festifall on the Diag.
Report of Investments 2020 | 24

Report of Investments 2020 | 25
CONCLUSION
Investment Directors and Managers:
Rafael Castilla, JD, CFA, Director of Investments and StructuringFelicia David-Visser, CFA, Senior Manager of InvestmentsDaniel Feder, JD, CFA, Managing Director of InvestmentsFrancois Gagnon, PhD, Managing Director of InvestmentsMegan Hammond, Managing Director of InvestmentsMichael Haessler, Managing Director of InvestmentsLauren Thorne, Chief of Staff
(1) Assuming dividends were reinvested in the index. (2) As measured by Cambridge Associates, LLC.
Fiscal year 2020 was a year where the onset of a global pandemic turned a strong economy into the weakest economy since the Great Depression. Record low unemployment turned into record unemployment and emerging inflationary pressures with rising interest rates turned into deflation and record low interest rates. The performance of the Long Term Portfolio reflected this change with strong performance in investments in areas seen as benefitting from the crisis offset by weak performance in investments tied to the real economy. Companies in the new digital, stay-at-home economy and biotech showed strong gains while companies in the traditional economy and natural resources-related investments recorded losses. Overall, the Long Term Portfolio returned 2.3 percent for the year, with strong absolute returns in Venture Capital, Private Equity, and Fixed Income, which benefitted from falling rates, offsetting losses in Market Traded Equities and Natural Resources.
The 20-year annualized return of 7.4 percent compares well with the 5.9 percent annualized return of the S&P 500 index(1) and places U-M in the top decile for long-term investment performance among university endowments(2). The university’s long-term investment strategy, combined with its endowment distribution policy, continues to provide a steady stream of endowment funding. Distributions from the university’s pooled endowment to benefit the university’s core missions and affiliated organizations grew again last year to $391 million, marking the 22nd year of consecutive growth and now total nearly $5 billion over that time.
There are many reasons to be cautious in today’s markets. Many parts of the equity market are fully valued while other segments remain impacted by continued low economic activity. Record low interest rates has pushed up prices and lowered yields on fixed income investments along with many long duration financial assets. An environment of low prospective returns due to high starting valuations and lower starting yields places a greater significance on the ability to generate additional performance by identifying and investing in emerging demand and exploiting mispricings and inefficiencies. We remain confident that our investment strategy, coupled with the endowment distribution rule, will continue to provide for steady and growing distributions to support the mission of the university.
Respectfully submitted,
L. Erik Lundberg, CFA Kevin P. HegartyChief Investment Officer Executive Vice President and Chief Financial Officer

Report of Investments 2020 | 26

BENCHMARK DEFINITIONS
Report of Investments 2020 | 27
“Paws for a Cause” assistant dogs, therapy Dogs, and pups in training mingle with students on the Diag.

Report of Investments 2020 | 28
LONG TERM PORTFOLIO (LTP)The custom benchmark for the Long Term Portfolio is constructed by using individual benchmarks tailored to each of the asset classes and combining them in a manner consistent with their importance to the total portfolio. This benchmark captures the nuances of our strategies and helps us gain valuable insight into the drivers of portfolio performance.
This section describes the benchmarks the university used to evaluate the performance of its investment programs through fiscal year 2020. Due to benchmark modifications over time, the stated performance for periods longer than a year may be different than the performance of current composites.
The table below shows the custom benchmark for the Long Term Portfolio.
LONG TERM PORTFOLIO | CUSTOM BENCHMARK
ASSET CLASS Model Weight Benchmark Index <_ 3 yrs Benchmark Index >3 yrs
Market Traded Equities 25%45% Russell 3000 45% MSCI1 EAFE Net 10% MSCI1 EM Net
45% Russell 3000 45% MSCI1 EAFE Net 10% MSCI1 EM Net
Fixed Income 1250% Barclays U.S. Aggregate/50% Barclays U.S. Long Duration Gov’t/Credit
50% Barclays U.S. Aggregate/50% Barclays U.S. Long Duration Gov’t/Credit
Absolute Return 18 HFRI2 Fund of Funds Index 3-Month T-Bills + 500 bps
Cash 2 3-Month T-Bills 3-Month T-Bills
Venture & Private Equity 25 CA3 Venture Capital & Private EquityEqual Weighted
Russell 3000 Index + 250 bps
Real Estate 10 CA3 Real Estate IndexEqual Weighted
CA3 Real Estate Index
Natural Resources 8CA3 Energy PE Index/CA4 Energy Upstream and Royalties Equal Weighted
Russell 3000 Index + 250 bps
TOTAL The benchmark for the total LTP is the weighted average performance of the above asset class specific benchmarks for periods <_ 3 yrs.
1 Morgan Stanley Capital International 2 Hedge Fund Research, Inc.3 Cambridge Associates, LLC
BENCHMARK DEFINITIONS

Report of Investments 2020 | 29
The university uses a Blended Passive Benchmark composed of investable asset class benchmarks as a representation of an alternative, passive, investable portfolio appropriate for a large investment pool such as the university’s Long Term Portfolio.
The Blended Passive Benchmark is derived from a portfolio modeled on the mean allocation for large endowments recast in a Role Based Portfolio framework. The mean portfolio weights are as follows:
Return enhancers are represented by the MSCI ACWI, a broad passive global opportunity set for investing globally in listed equities that is the most commonly used benchmark for global equity strategies.
Inflation hedges include investments in both real estate and natural resources.
Real estate is represented by an index that combines the MSCI U.S. REIT Index and the MSCI World REIT Index in a 50/50 manner. The latter index includes U.S. and non-U.S. exposure, leaving the combined index with an aggregate geographic exposure of roughly two-thirds U.S. and one-third non-U.S. The global index is included to reflect the global approach to investing in real estate among large endowments today. There is no good representative index for only non-U.S. REITs.
Natural resources is represented by the MSCI World Energy Sector Index, as energy is by far the largest component of this asset class. The MSCI World Energy Sector Index recognizes the global nature of the energy markets. It represents companies in developed markets only, as emerging market energy companies have a country-risk premium embedded.
The Barclays U.S. Aggregate Index is a commonly used fixed income benchmark and remains a good representation of the opportunity set for deflation hedges.
With no proven investable analogs for the diversifiers, these investments are allocated to other asset classes. Potential but non-investable benchmarks for diversifiers, such as the HFRI Fund of Funds Index or the Dow Jones Credit Suisse Hedge Fund Index, have exhibited approximately the same risk as a portfolio comprised of 75 percent of the Barclays U.S. Aggregate Index and 25 percent of the MSCI ACWI over the past 10 years. Applying these proportions to the 16 percent allocated to diversifiers will add 4 percentage points to equity and 12 percentage points to fixed income to the final benchmark.
PORTFOLIO ROLE Asset Class Weight
Return Enhancers Equities 60%
Hedges (Inflation) Real Estate Natural Resources
8 4
Hedges (Deflation) Fixed Income 12
Diversifiers Absolute Return 16
PASSIVE BENCHMARK COMPONENT Weight
MSCI1 ACWI 64%Barclays U.S. Aggregate Index 24MSCI1 U.S. REIT Index 4MSCI1 World REIT Index 4MSCI1 World Energy Sector Index 4
TOTAL Weighted average performance of the above, asset class specific benchmarks
1 Morgan Stanley Capital International
Report of Investments 2020 | 30
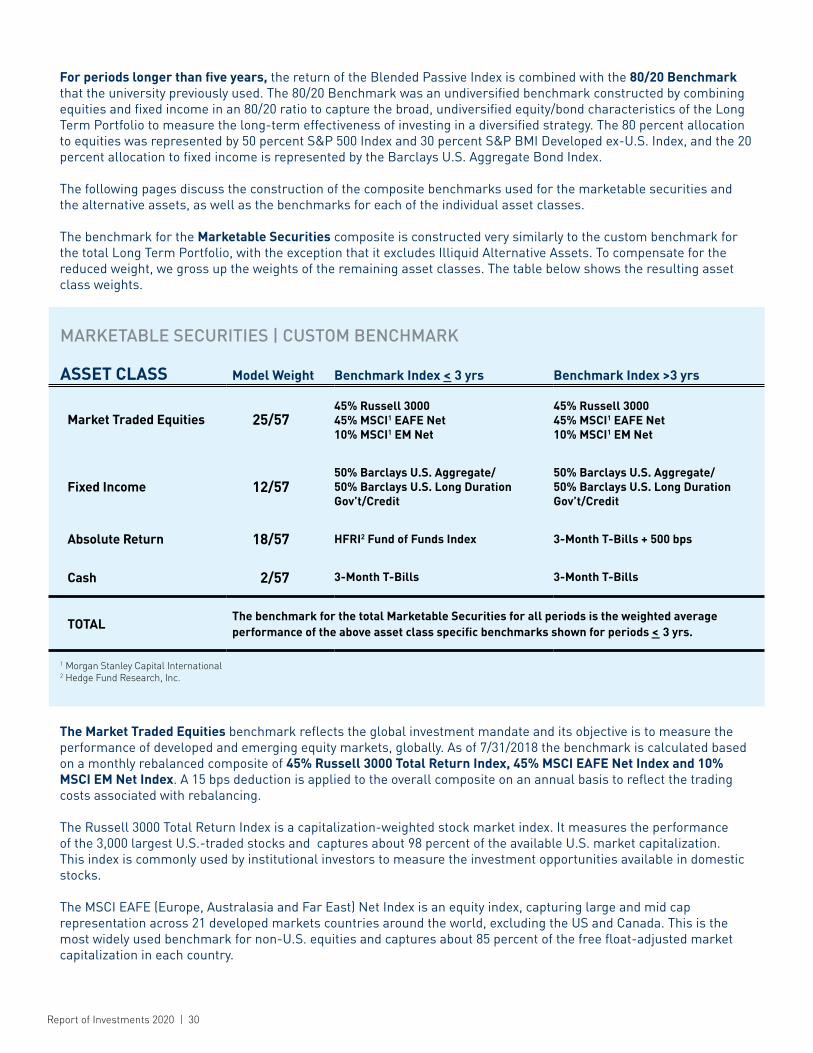
For periods longer than five years, the return of the Blended Passive Index is combined with the 80/20 Benchmark that the university previously used. The 80/20 Benchmark was an undiversified benchmark constructed by combining equities and fixed income in an 80/20 ratio to capture the broad, undiversified equity/bond characteristics of the Long Term Portfolio to measure the long-term effectiveness of investing in a diversified strategy. The 80 percent allocation to equities was represented by 50 percent S&P 500 Index and 30 percent S&P BMI Developed ex-U.S. Index, and the 20 percent allocation to fixed income is represented by the Barclays U.S. Aggregate Bond Index.
The following pages discuss the construction of the composite benchmarks used for the marketable securities and the alternative assets, as well as the benchmarks for each of the individual asset classes.
The benchmark for the Marketable Securities composite is constructed very similarly to the custom benchmark for the total Long Term Portfolio, with the exception that it excludes Illiquid Alternative Assets. To compensate for the reduced weight, we gross up the weights of the remaining asset classes. The table below shows the resulting asset class weights.
The Market Traded Equities benchmark reflects the global investment mandate and its objective is to measure the performance of developed and emerging equity markets, globally. As of 7/31/2018 the benchmark is calculated based on a monthly rebalanced composite of 45% Russell 3000 Total Return Index, 45% MSCI EAFE Net Index and 10% MSCI EM Net Index. A 15 bps deduction is applied to the overall composite on an annual basis to reflect the trading costs associated with rebalancing.
The Russell 3000 Total Return Index is a capitalization-weighted stock market index. It measures the performance of the 3,000 largest U.S.-traded stocks and captures about 98 percent of the available U.S. market capitalization. This index is commonly used by institutional investors to measure the investment opportunities available in domestic stocks.
The MSCI EAFE (Europe, Australasia and Far East) Net Index is an equity index, capturing large and mid cap representation across 21 developed markets countries around the world, excluding the US and Canada. This is the most widely used benchmark for non-U.S. equities and captures about 85 percent of the free float-adjusted market capitalization in each country.
MARKETABLE SECURITIES | CUSTOM BENCHMARK
ASSET CLASS Model Weight Benchmark Index <_ 3 yrs Benchmark Index >3 yrs
Market Traded Equities 25/5745% Russell 3000 45% MSCI1 EAFE Net 10% MSCI1 EM Net
45% Russell 3000 45% MSCI1 EAFE Net 10% MSCI1 EM Net
Fixed Income 12/5750% Barclays U.S. Aggregate/50% Barclays U.S. Long Duration Gov’t/Credit
50% Barclays U.S. Aggregate/50% Barclays U.S. Long Duration Gov’t/Credit
Absolute Return 18/57 HFRI2 Fund of Funds Index 3-Month T-Bills + 500 bps
Cash 2/57 3-Month T-Bills 3-Month T-Bills
TOTAL The benchmark for the total Marketable Securities for all periods is the weighted average performance of the above asset class specific benchmarks shown for periods <_ 3 yrs.
1 Morgan Stanley Capital International 2 Hedge Fund Research, Inc.

Report of Investments 2020 | 31
The MSCI EM Net Index is an equity index capturing large and mid cap representation across 26 emerging markets (EM) countries, covering approximately 85% of the free float-adjusted market capitalization in each country. This is the most widely used benchmark for emerging markets.
The longer duration designed into Michigan’s Fixed Income portfolio is captured by blending the commonly used 5 year duration Barclays U.S. Aggregate Bond Index with the 14 year duration Barclays U.S. Long Duration Government/ Credit Index in a 50/50 mix. The Barclays U.S. Aggregate Bond Index includes taxable, U.S. dollar denominated bonds in the government, U.S. corporate, foreign corporate, mortgage pass-through and asset-backed sectors. The BarclaysU.S. Long Duration Government/Credit Index includes taxable, U.S. dollar denominated bonds in the government, U.S. corporate and foreign corporate sectors with a maturity in excess of 10 years.
The benchmark for Absolute Return strategies is the Hedge Fund Research Fund of Funds Index (HFRI FOF), a database of over 400 funds. A fund of funds index captures the aggregate result of knowledgeable investors faced with a similar objective and similar investment opportunities. The Hedge Fund Research Index (HFRI FOF) broadly reflects the experience of the university’s portfolio of absolute return investments over shorter time periods, both in intent and performance.
The university also uses a long term performance hurdle of 3-Month Treasury Bills plus 5 percent per annum for this portfolio. This hurdle represents the performance premium of U.S. equities over 3-Month Treasury Bills for the past 40 years and captures the equity-like level of risk targeted by these strategies.
The benchmark for the Alternative Assets (Illiquid) composite is constructed very similarly to the composite benchmarks for the total Long Term Portfolio, with the exception that it excludes marketable securities.
To compensate for the reduced weight, we gross up the weights of the remaining asset classes. The table above shows the resulting asset class weights.
Longer term, alternative assets in aggregate are expected to generate a premium over public market equities to compensate for the higher risk and illiquidity inherent in these strategies. A performance hurdle of 2.5 percent per
ALTERNATIVE ASSETS (ILLIQUID) | CUSTOM BENCHMARK
ASSET CLASS Model Weight Benchmark Index <_ 3 yrs Benchmark Index >3 yrs
Venture & Private Equity 25/43 CA1 Venture Capital & Private Equity Equal Weighted
Russell 3000 Index + 250 bps
Real Estate 10/43 CA1 Real Estate Index Equal Weighted
CA1 Real Estate Index
Natural Resources 8/43CA1 Energy PE Index/CA1 Energy Upstream and Royalties Equal Weighted
Russell 3000 Index + 250 bps
TOTALThe benchmark for the total Alternative Assets (Illiquid) is the weighted average performance of the above asset class specific benchmarks for periods <_ 3 yrs and the Russell 3000 Index + 250 basis points for periods > 3 yrs.
1 Cambridge Associates, LLC
Report of Investments 2020 | 32
year above U.S. public market equities, as measured by the Russell 3000 Index, appropriately captures this higher level of risk. This benchmark is useful over long periods. This is the 5-, 10-, and 20-year benchmark numbers used for the alternative assets composite.
Both Venture Capital and Private Equity are expected to offer a premium over public markets equities to compensate for the higher risk and illiquidity inherent in these strategies.
A performance hurdle of 2.5 percent per year above U.S. public market equities, as measured by the Russell 3000 Index, appropriately captures this higher level of risk. This benchmark is useful over long periods. This is the longer term,5-, 10- and 20-year benchmarks shown for venture capital and private equity.
A weakness of this approach is that it does not reflect the specific market cycles associated with these asset classes. This limits the usefulness of such a benchmark, as there will be times when the returns of private equity and venture capital bear little relationship to those of marketable equities.
The university’s investment consultant, Cambridge Associates LLC (CA), tracks the performance of an extensive universe of venture capital and private equity partnerships and compiles an aggregate performance number for each category that assumes capital was allocated the same way as the overall market. The CA universe-based benchmarks are more reflective of the university’s investment strategy and are used to gauge the effectiveness of these programs over shorter periods of time. This is the benchmark used as reference for one- and three-year performance.
The Cambridge Associates Real Estate Index tracks the performance of an extensive universe of real estate partnerships available for institutional investing. It is a commonly used benchmark for real estate investing. The index includes over 800 global and domestic Real Estate funds from 1986 through Q2 2020. Property types include apartment, industrial, office, hotel, and retail.
Natural Resources is treated in a manner similar to private equity because our investing approach emphasizes managers’ ability to add value over exposure to the asset class. Because this asset class still consists mostly of energy- related investments, we use the Cambridge Associates’ underlying universe for Energy Specialty PE funds and the CA Energy Upstream & Royalties for Exploration & Production funds. The return for each of these indices is weighted by the university’s actual allocation to each of the two segments. The weights are adjusted quarterly.
Longer term, these investments are expected to generate a premium over public market equities to compensate for the higher risk and illiquidity inherent in these strategies. Similar to private equity and venture capital, a performance hurdle of 2.5 percent per year above U.S. public market equities, as measured by the Russell 3000 Index, is applied to capture this higher level of risk. This benchmark is useful over long periods. This is the longer term, 5-, 10-, and 20- year benchmark numbers shown for natural resources.
Equal Weighted vs. Pooled Mean - CA recently developed an alternative to the historical pooled mean methodology of capturing the performance of the managers within their universes. This new methodology of equal weighting the underlying funds adjusts for the size bias inherent with the pooled mean methodology, where larger funds are more heavily weighted than smaller funds, and better reflects the university’s allocation philosophy. The university began using benchmarks based on the CA equal weighted methodology for all the asset classes within Alternative Assets (Illiquid) beginning with FY 2017.
THE DAILY AND MONTHLY PORTFOLIOS AND SHORT TERM POOLThe Daily Portfolio benchmark is the 3-Month Treasury Bill less investment management fee and the Monthly Portfolio benchmark is the Barclays U.S. Government/Credit 1-5 Year Index.
The benchmark for the Short Term Pool (“STP”) is calculated as a value-weighted composite of the underlying Daily and Monthly Portfolio benchmarks.
VERITASThe benchmark for the Veritas portfolio is a composite of the benchmarks for the Daily and Monthly Portfolios and the Long Term Portfolio weighted by the respective allocations.

Office of Academic Multicultural Initiatives La Celebracion Latina graduation.
Report of Investments 2020 | 33

© 2020 Regents of the University of Michigan
Jordan B. Acker, Huntington WoodsMichael J. Behm, Grand BlancMark J. Bernstein, Ann ArborPaul W. Brown, Ann ArborShauna Ryder Diggs, Grosse PointeDenise Ilitch, Bingham FarmsRon Weiser, Ann ArborKatherine E. White, Ann ArborMark S. Schlissel, ex officio
MC210069
