report no. aaa25-cm cameroon agricultural...
TRANSCRIPT

June 30, 2008
Document of the World Bank
Report N
o. AA
A25-C
M
Cam
eroon A
gricultural Value C
hain
Report No. AAA25-CM
CameroonAgricultural Value Chain
Agricultural and Rural Development UnitSustainable Development DepartmentCountry Department AFCC1Africa Region
Competitiveness StudyPub
lic D
iscl
osur
e A
utho
rized
Pub
lic D
iscl
osur
e A
utho
rized
Pub
lic D
iscl
osur
e A
utho
rized
Pub
lic D
iscl
osur
e A
utho
rized
Pub
lic D
iscl
osur
e A
utho
rized
Pub
lic D
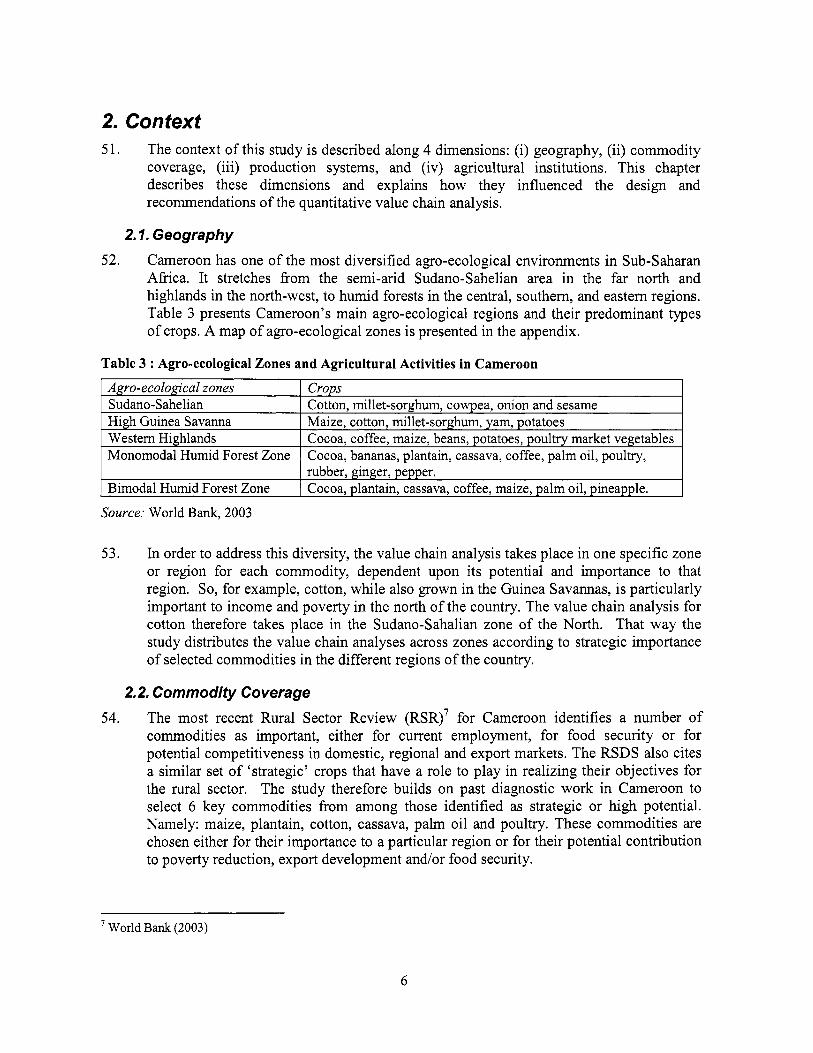
iscl
osur
e A
utho
rized
Pub
lic D
iscl
osur
e A
utho
rized
Pub
lic D
iscl
osur
e A
utho
rized
Document of
The World Bank
CAMEROON AGRICULTURAL VALUE CHAIN COMPETITIVENESS STUDY
Final Report June 30,2008
Agriculture and Rural Development (AFTAR)
Sustainable Development Network (SDN)
Africa Region
Vice President: Obiageli Katryn Ezekwesili Country ManagedDirector: Mary A. Barton-Dock Sector Manager: Karen McConnell Brooks Task Team Leader: Ousmane Seck

Acronyms
ACP ADB AGI C A M CCAA C D C D C C E M A C C I C A M CIF C I R A D C N A P A C O M DVA EPA EU FAM FAM high FAM l o w FA0 FFB FOB FONADER GDP ha I C A C IFAD IPM IRAD
km M A I S C A M MIDENO MIDEVIV MINAGRI MINEPIA MT NGO NPK NPMB PAMOL PNDRT PNEVA P N V R A SABC S A F A C A M SOCAO
kg
African Caribbean and Pacific Asian Development Bank Agribusiness Mvog-Betsi Poultry Farming Compound Competitive Commercial Agriculture in Africa Customs Duty Cameroon Development Corporation Central African Economic and Monetary Community Cameroon Industrial Cotton Corporation Cost, Insurance, and Freight International Cooperation Center for Agricultural Research National Commission for the Certification o f Agricultural Pesticides Commercial Farm Domestic Value Added Economic Partnership Agreement European Union Family Farmer Family Farmer using improved inputs Family Farmer featuring l o w input use Food and Agriculture Organization Fresh Fruit Bunch Free on Board National Rural Development Fund Gross Domestic Product Hectare International Cotton Advisory Committee International Fund for Agricultural Development Integrated Pest Management Institute o f Agricultural Research for Development Ki logram Kilometer Cameroon Maize Corporation North-West Province Development Authority Seedlings and Foodstuff Development Authority Ministry o f Agriculture Ministry o f Livestock and Fishing Metric Ton Non-Governmental Organization Nitrogen Phosphorus and Potassium Fertilizer National Produce Marketing Board Palm Oil Corporation National Program for the Development o f Roots and Tubers National Program for Agricultural Extension and Training National Program for Agricultural Extension and Research Cameroonian Breweries Corporation Ago-industrial Farms o f Cameroon Western Poultry Farmers Cooperative
i
SOCAPALM SODECOTON SOWEDA SPC sv TT UCB USD XAF, BEAC
Cameroon Palm O i l Corporation Cameroon Cotton Development Corporation South-West Development Authority Cameroonian Provenderies Shipment Value Temporary Tax Cameroonian Breweries Union United States Dollar Central Afncan Franc, Bank of the Central African States
11
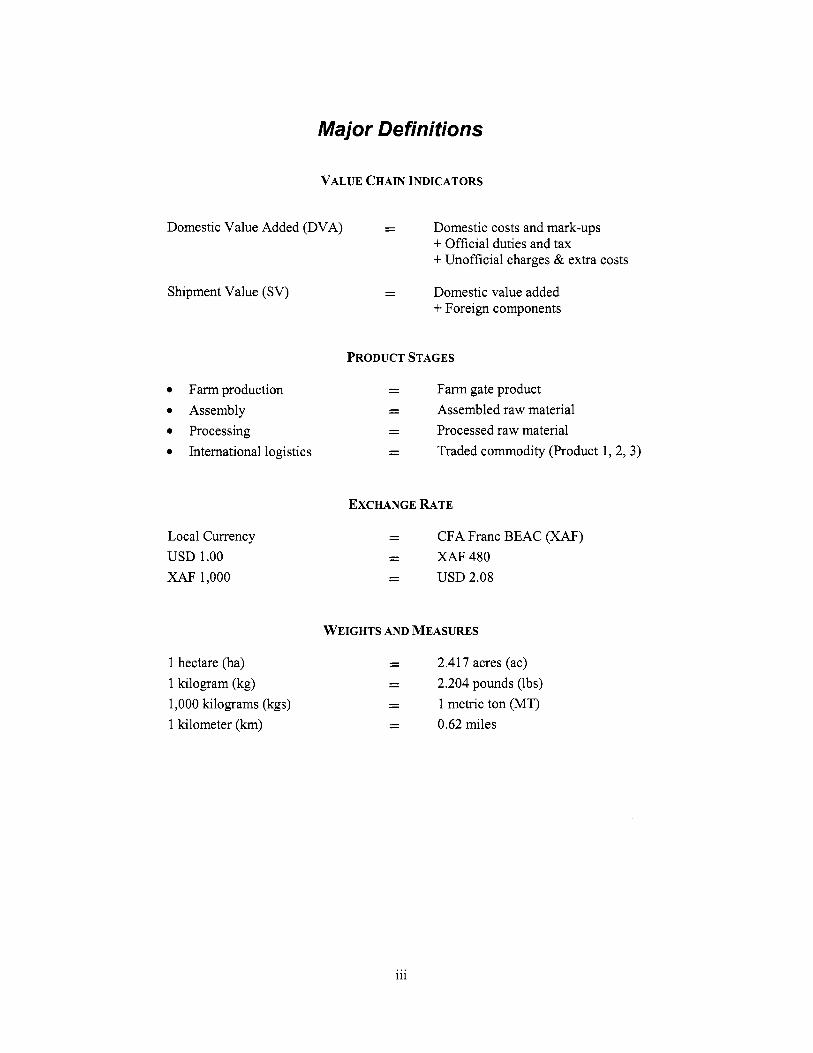
Major De fin itio ns
VALUE CHAIN INDICATORS
Domestic Value Added (DVA) - - Domestic costs and mark-ups + Off ic ia l duties and tax + Unoff ic ia l charges & extra costs
Shipment Value (SV)
0 Farm production 0 Assembly 0 Processing 0 International logistics
Local Currency U S D 1.00 XAF 1,000
1 hectare (ha) 1 kilogram (kg) 1,000 kilograms (kgs) 1 kilometer (km)
- - Domestic value added + Foreign components
PRODUCT STAGES
- - Farm gate product - - Assembled raw material - - Processed raw material - - Traded commodity (Product 1,2,3)
EXCHANGE RATE
- - C F A Franc B E A C (XAF) XAF 480
- - U S D 2.08 - -
WEIGHTS AND MEASURES
- - 2.417 acres (ac) - - 2.204 pounds (lbs) - - 1 metric ton (MT) - - 0.62 miles
... 111

Acknowledgements
This Cameroon Agricultural Value Chain Competitiveness Study was carried out by the Wor ld Bank, the FA0 and a team o f consultants. The Wor ld Bank task team included Ousmane Seck (Task Team Leader and Senior Rural Development Specialist, AFTAR), Loraine Ronchi (Economist, AFTAR), Anke Reichhuber (Economist, AFTAR), Francois Mkouanga (Rural Development Specialist), Germaine Mafougong (Program Assistant, AFTAR), and Irene Marguerite Nnomo Ayinda-Mah (Team Assistant, AFCC1). The Consultant team included John Keyser, Tania Rajadel, Arsene Nkama. Marc Moens (FAO) provided an excellent assessment o f the poultry sector. The Wor ld Bank would l ike to acknowledge the excellent collaboration with Dr. Yankam on the behalf o f the Ministry o f Agriculture and Rural Development (MINADER). The participants o f a stakeholder feedback workshop held in Cameroon in February 2008 are thanked for their substantive comments and feedback. Grahame Beaumont Richard Dixie (Senior Agricultural Specialist, SASDA), Stephen Mink (Lead Economist, AFTSN) and Abdoulaye Seck (Senior Economist, AFTP3) served as Peer Reviewers. Renato Nardello (Senior Operations Officer, AFTAR) provided advice and comments. Mary Barton-Dock (Country Director, AFCCl), Karen McConnell Brooks (Sector Manager, AFTAR), and Francois L e Gall (Program Coordinator, AFTAR) supported the study and ensured that resources were available for i t s implementation. The team would also l ike to acknowledge the financial support provided by the Afr ica Agricultural Markets Trust Fund (DfID).
1v

Table of Contents
Acronyms ....................................................................................................................................................... i Major Definitions ........................................................................................................................................ 111
Acknowledgements ...................................................................................................................................... iv
. . .
Table of Contents .......................................................................................................................................... v L i s t of Figures ................................................................................................................................................ L i s t o f Tables .............................................................................................................................................. vii Executive Summary .................................................................................................................................. viii 1 . Introduction ........................................................................................................................................... 1 1.1. Role o f Agriculture in Cameroon ...................................................................................................... 1 1.2. Global food and fertilizer prices ........................................................................................................ 2 1.3. Study Objectives ............................................................................................................................... 4 2 . Context .................................................................................................................................................. 6 2.1. Geography ......................................................................................................................................... 6
. . .
2.2. Commodity Coverage ........................................................................................................................ 6 2.3. Production systems ............................................................................................................................ 8
Quantitative Value Chain Analysis ..................................................................................................... 15
Procedures and Assumptions., ......................................................................................................... 17 4 . Inputs ................................................................................................................................................... 20
Factors Affecting Prices o f Imported Goods ................................................................................... 20 Domestic Transportation Costs ....................................................................................................... 22
4.3. Fertilizer analysis ............................................................................................................................ 22
2.4. Agriculture Institutions ...................................................................................................................... 9 3 . 3.1. Analytical Framework ..................................................................................................................... 15 3.2.
4.1. 4.2.
4.4. Cost Composition o f other Inputs ................................................................................................... 23 5 . Cassava ................................................................................................................................................ 25 5.1. Fresh Cassava .................................................................................................................................. 27 5.2. Cassava into Bobolo ........................................................................................................................ 29 5.3. Cassava into Fufu ........................................................................................................................... -31 6 . Cotton .................................................................................................................................................. 33 7 . Maize ................................................................................................................................................... 39 7.1 . Farm Production .............................................................................................................................. 41 7.2. Maize for Grain ............................................................................................................................... 42 7.3. Maize for Brewer’s Grits ................................................................................................................. 44 8 . Palm ..................................................................................................................................................... 46 8.1. Farm Production .............................................................................................................................. 48 8.2. Costs at Assembly, Processing, and Distribution ............................................................................ 50 8.3. Final Competitiveness o f Palm O i l ................................................................................................. 51 9 . Plantain ................................................................................................................................................ 52 9.1 . Farm Production .............................................................................................................................. 54 9.2. Assembly and Marketing ................................................................................................................. 55 10 . Poultry ............................................................................................................................................. 57 10.1. AGIHatchery ............................................................................................................................. 59 10.2. COM Broiler Production 60 10.3. FAM-level Village Chickens -63 1 1 . 11.1. 1 1.2.
............................................................................................................ ....................................................................................................
Conclusions ..................................................................................................................................... 65 Increasing access and use of inputs and high-yielding planting material by family farmers ..... 67 Reducing assembly to market cost for small farmers ................................................................ 68
V
1 1.3. 11 .4 .
Reduce transport cost ................................................................................................................. 7 1
Bibliographie ............................................................................................................................................... 73 Appendix. ............................................................................................................... 74
Issues to be explored .................................................................................................................. 71
List of Figures Figure 1: Growth of Cameroon's Economy ................................................................................................... 1
Figure 4: Global fertilizer prices ................................................................................................................... 3
Figure 7: Stages of Agriculture Value Chain .............................................................................................. 15 Figure 8: Composition o f Transport Costs Using the Roadside and Direct System ................................... 22 Figure 9: Fertilizer Financial and Value Chain Price Build-up ................................................................... 23 Figure 10: Value Chain Price Components o f Selected Inputs ................................................................... 24 Figure 11: Cassava Price Trends ................................................................................................................. 25 Figure 12: Cassava Value Chain Diagram .................................................................................................. 26 Figure 13: Cassava, Composition of Farm Gate SV ................................................................................... 28
Figure 16: Cotton Value Chain Diagram .................................................................................................... 35 Figure 17: Cotton, Composition o f Farm Gate SV (I MT seed cotton before assembly) ........................... -36 Figure 18.Cotton, Total Value Chain Costs by Production Stage and Farm Sector ................................... 38
Figure 20: Maize Value Chain Diagram ..................................................................................................... 40 Figure 2 1 : Maize, Composition o f Farm Gate SV before assembly ........................................................... 42
Figure 2: Agricultural Exports Composition (2000.2006) ............................................................................ 2 Figure 3: Global food prices ......................................................................................................................... - 3
Figure 5: Cameroon's Rural Sector Strategy Objectives .............................................................................. 4
Figure 14: World Cotton Prices in USD/kg ................................................................................................ 33 Figure 15: Evolution of World Prices in USD and FCFA ........................................................................... 33
Figure 19: Maize world market prices in USD/ton ..................................................................................... 39
Figure 22: Maize Grain, Composition o f Total Value Chain SV (1 MT grain after assembly) .................. 43 Figure 23: Maize Grits SV by Stage ........................................................................................................... 44 Figure 24: Palm o i l world market prices ..................................................................................................... 46 Figure 25: Palm Oi l Value Chain Diagram ................................................................................................. 47 Figure 26: Palm, Composition o f Farm Gate SV (1 MT FFB before delivery to factory) .......................... 49 Figure 27: Phlm SV by Value Chain Stage ................................................................................................. 50 Figure 28: Palm Total SV at Final Market .................................................................................................. 51 Figure 29: Prices o f Plantain in Selected Urban Centers in Cameroon (XAF per lulogram) ...................... 52 Figure 30: Plantain Value Chain Diagram .................................................................................................. 53 Figure 3 1 : Plantain, Composition o f Farm Gate SV (per Ha and per MT before Assembly) ..................... 55 Figure 32: Plantain, Total SV 1 MT Plantain at Assembly Market ............................................................ 56 Figure 33: Global Poultry Price Trends ...................................................................................................... 57
Figure 35: Poultry, Composition o f Hatchery Gate SV for AGI-level 1-day Chicks (per bird) ................. 60 Figure 36: Poultry, Composition o f Farm Gate SV for COM-level Broiler Chickens (per live bird) ......... 61 Figure 37: Poultry, Composition o f Farm Gate SV for FAM-level Village Chickens (per live bird) ......... 63
Figure 34: Poultry Value Chain Diagram .................................................................................................... 58
vi
List of Tables Table 1 : Cross-cutting recommendations ...................................................................................................... x Table 2: Commodity specific recommendations.. .................................................................................... xvii
Table 4: L i s t o f Farm-Level Variations Analyzed ..................................................................................... -18
Table 6: Selected Import Tariffs and other Tax Rates in Cameroon ........................................................... 21
Table 8: Fresh Cassava, Farm-level Financial Costs and Profits ................................................................ 27
Table 3: Ago-ecological Zones and Agricultural Activities in Cameroon ................................................... 6
Table 5: Sea Passage and Port Costs for Fertilizer f rom Ukraine ............................................................... 20
Table 7: Cassava, M a i n Value Chain Assumptions .................................................................................... 27
Table 9: Cassava, Value Chain Indicators for Fresh Cassava at Urban Wholesale Market ........................ 29 Table 10: Cassava into Bobolo, Financial Indicators for Processing and Distribution ............................... 30 Table 11: Cassava into Fufu, per MT Assembly Level Costs and Profitability for Roadside and Direct Transport Networks over 30km Delivery Distance ..................................................................................... 31
Table 13: Cotton, M a i n Value Chain Assumptions ..................................................................................... 35 Table 14: Cotton, Farm-level Financial Costs and Profits .......................................................................... 36 Table 15: Cotton, Financial Indicators for Assembly, Processing, and Distribution .................................. 37
Table 12: Cassava into Fufu, Processing-level Financial Indicators ........................................................... 32
Table 16: Maize, M a i n Value Chain Assumptions ..................................................................................... 41 Table 17: Maize, Farm-level Financial Indicators ...................................................................................... 41 Table 18: Maize, per MT Financial Indicators for AGI Production ............................................................ 44 Table 19: Maize Grits, Competitiveness Gap ............................................................................................. 45 Table 20: Palm, M a i n Value Chain Assumptions ....................................................................................... 48 Table 2 1 : Palm, Farm-level Financial Indicators ........................................................................................ 49 Table 22: Palm AGI Financial Indicators per MT Traded Crude Oil ......................................................... 50 Table 23 : Plantain, M a i n Value Chain Assumptions .................................................................................. 54 Table 24: Plantain, Farm-level Financial Indicators ................................................................................... 54 Table 25 : Poultry, M a i n Value Chain Assumptions .................................................................................... 59 Table 26: Poultry, C O M Financial Indicators at Farm-level ....................................................................... 60 Table 27: Poultry, Summary of Final SV at Distribution after Slaughter per Bird and per MT ................. 61
and U S D per MT raw meat) ........................................................................................................................ 62
meat). ............................................................................................................................................ ............. 62 Table 30 .Poultry, FAM Financial Indicators at Farm-level ....................................................................... 63 Table 3 1 : Competitiveness of 6 selected value chains per production system ........................................... -65 Table 32: M a i n bottlenecks of 6 selected value chains per production system ........................................... 66 Table 33 : M a i n cross-cutting recommendations ......................................................................................... 70
Table 28: Poultry, Calculation o f the “Competitiveness Gap” between Total SV and Import Parity (XAF
Table 29: Poultry, Detailed Break-down of Value Chain Cost Components (XAF and U S D per MT raw
vii
Executive Summary Objectives and Approach
1. This study aims to assist in the realization o f the Government’s rural sector objectives through the specific avenue o f improved commercial agricultural competitiveness. I t explores the concrete constraints and potential for domestic, regional, and/or international competitiveness o f six agricultural value chains that involve family, commercial, and large ago-industrial enterprises in different regions o f Cameroon. The selected chains are cassava, cotton, maize, palm, plantain, and poultry. The immediate objective o f the competitiveness study i s to identify products and farm systems that are currently competitive or have the potential o f becoming competitive in domestic, regional, or global markets. More specifically, the Government has asked the Bank to provide support for i t s growing agricultural program. This Economic and Sector work is expected to inform the preparation o f a new lending operation for the agricultural sector in Cameroon.
2. Rapidly rising international grain prices have fed into higher prices for staple foods, leading to severe hardships for the poor in numerous areas, a cut in the standard o f living o f the urban middle class, and social unrest in Cameroon. There are a number o f longer- term trends underlying these price rises suggesting that while the highest peaks may come down, staple grain prices are unlikely to recover in the foreseeable f i ture their relatively l ow and stable levels that characterized the second hal f o f the 1980s until about two years ago. Governments can respond to the hike in prices through short, medium, and long-term measures. Policy interventions can be divided into three broad classes: (i) interventions to ensure household food security by strengthening targeted safety nets; (ii) interventions to lower domestic food prices through short-run trade pol icy measures or administrative action, and (iii) interventions to enhance longer-term food supply. The investment and pol icy recommendations following from this report for food crops belong to the third class o f interventions.
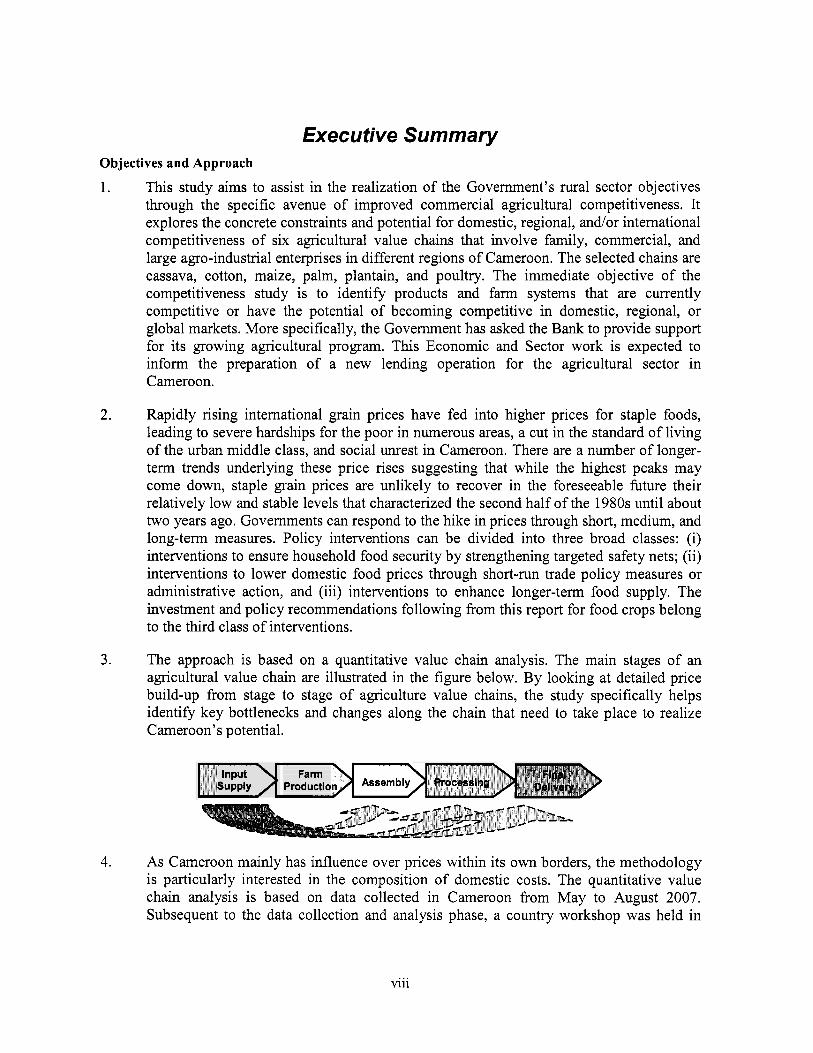
3. The approach i s based on a quantitative value chain analysis. The main stages o f an agricultural value chain are illustrated in the figure below. By looking at detailed price build-up from stage to stage o f agriculture value chains, the study specifically helps identify key bottlenecks and changes along the chain that need to take place to realize Cameroon’s potential.
input Farm Supply >’ Productio
4. As Cameroon mainly has influence over prices within i t s own borders, the methodology i s particularly interested in the composition o f domestic costs. The quantitative value chain analysis i s based on data collected in Cameroon from M a y to August 2007. Subsequent to the data collection and analysis phase, a country workshop was held in
viii
YaoundC in February 2008 to validate the draft results and seek feedback on major bottlenecks and recommendations for improvement.
Cameroon’s potential
5. The first conclusion to be drawn from the analysis i s that Cameroon has good potential to become a major food supplier to the region because o f i t s competitiveness in cassava, maize, and plantain. Investments in these three sectors would not only improve food security but also lead to higher incomes.
6. This conclusion i s especially relevant in light o f the recent hike in food prices. I t is, however, most l ikely not realistic to expect a significant sustainable supply response from family farms to rising food prices in the short-term. I t wi l l take longer-term efforts to achieve sustainable increases in smallholder agricultural productivity and production levels, al l which require a combination o f services and investments such as extension and technology transfer, access to affordable inputs and credit, access to markets, etc. The short-term sustainable supply response for food crop production could come most realistically from Cameroon’s commercial farming sector which already has the necessary capacity to adapt to market opportunities.
7. Significant growth in income and increased trade competitiveness could also be achieved in the palm o i l sector. For poultry the conclusion i s less straightforward. There i s certainly good reason to expand the production o f village chicken by family farmers with important benefits for food security and poverty reduction in rural areas. The future o f the commercial poultry sector, however, depends on continued trade protection for the medium to long term. Cotton has some potential for competitiveness gains, but l ow global market prices are a major threat to the sustainability o f the sector.
Cross-cutting results
8. Interventions are needed to increase access and use o f inputs and high-yielding planting material by family farmers. The graduation o f family farmers from low-input production to more intensive systems i s important for the competitiveness o f commercial agriculture in Cameroon. In nearly every case, the analysis shows that the increased use o f inputs, high-yielding planting material and better on-farm management including SLM best practices could have a direct positive impact on rural incomes and trade competitiveness. Smallholders rarely have access to inputs and high yielding planting material because they are not affordable or locally not available.
9. Interventions are necessary to reduce the cost o f inputs and planting material. The analysis highlights several options for possible actions. An important result o f the input price analysis highlights the impact o f different procurement methods. Whi le the fertilizer used by FAM and COM-level farmers must pass through the local wholesale and retail network the AGIs import directly. Taken together, the fertilizer price analysis suggests there may be good potential for reducing the cost o f this important input through investments that help streamline the distribution system. One option would be to move
ix
toward coordinated procurement o f farmers. Customs duties, import taxes, and VAT are a second major determinant o f agriculture input prices and should be revisited.
10. A second set o f interventions would strengthen the supply system. A reform o f the fertilizer sector i s currently under preparation and aims at improving small farmers' access to fertilizer. In regards to improving the legal framework, the Seed Act (Loi Semenciere) promulgated in 2001 and the Fertilizer Act (Loi sur les Engrais) promulgated in 2003 to improve regulation o f the market, should be revisited in order to determine why the implementing decrees (de'crets d 'application), which are necessary for any Act to be enforced have not yet been issued.
11. A third set o f interventions to increase access and use o f inputs and high-yielding planting material would increase input use efficiency and the dissemination o f new technologies. Possible actions could build on experience and lessons learnt o f The National Program for Agricultural Extension and Research (PNVRA), adopted in 1998, which was designed to develop agricultural research and revitalize agricultural extension services.
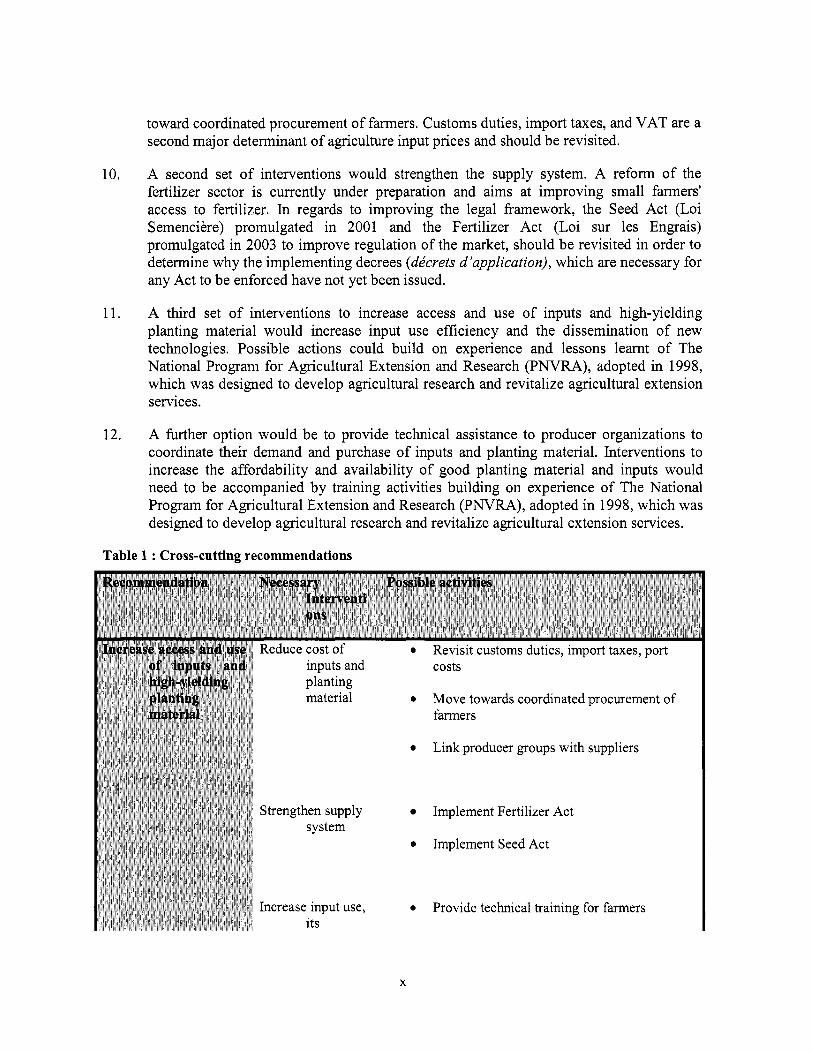
12. A hrther option would be to provide technical assistance to producer organizations to coordinate their demand and purchase o f inputs and planting material. Interventions to increase the affordability and availability o f good planting material and inputs would need to be accompanied by training activities building on experience o f The National Program for Agricultural Extension and Research (PNVRA), adopted in 1998, which was designed to develop agricultural research and revitalize agricultural extension services.
Table 1 : Cross-cutting recommendations
0 Move towards coordinated procurement o f farmers
Link producer groups with suppliers 0
Strengthen supply Implement Fertilizer A c t
0 Implement Seed A c t
Increase input use, 0 Provide technical training for farmers
X
xi
13.
14.
15.
Assembly
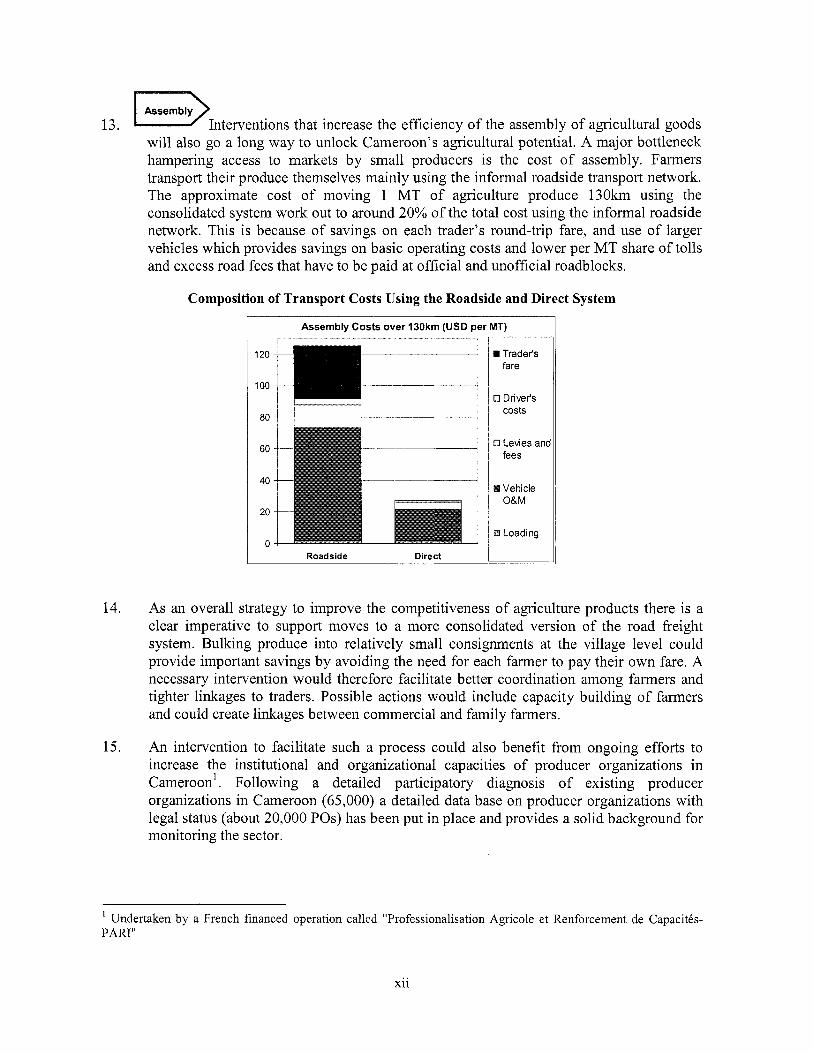
will also go a long way to unlock Cameroon's agricultural potential. A major bottleneck hampering access to markets by small producers i s the cost o f assembly. Farmers transport their produce themselves mainly using the informal roadside transport network. The approximate cost o f moving 1 M T o f agriculture produce 130km using the consolidated system work out to around 20% o f the total cost using the informal roadside network. This i s because o f savings o n each trader's round-trip fare, and use o f larger vehicles which provides savings on basic operating costs and lower per MT share o f tolls and excess road fees that have to be paid at official and unofficial roadblocks.
I) Interventions that increase the efficiency o f the assembly o f agricultural goods
Composition of Transport Costs Using the Roadside and Direct System
1 Assembly Costs over 130km (USD per MT) I
I Roadside Direct
rn Trader's fare
0 Driver's costs
0 Levies and fees
~
As an overall strategy to improve the competitiveness o f agriculture products there i s a clear imperative to support moves to a more consolidated version o f the road freight system. Bulking produce into relatively small consignments at the village level could provide important savings by avoiding the need for each farmer to pay their own fare. A necessary intervention would therefore facilitate better coordination among farmers and tighter linkages to traders. Possible actions would include capacity building o f farmers and could create linkages between commercial and family farmers.
An intervention to facilitate such a process could also benefit from ongoing efforts to increase the institutional and organizational capacities o f producer organizations in Cameroon'. Following a detailed participatory diagnosis o f existing producer organizations in Cameroon (65,000) a detailed data base on producer organizations with legal status (about 20,000 POs) has been put in place and provides a solid background for monitoring the sector.
Undertaken by a French financed operation called "Professionalisation Agricole et Renforcement de CapacitCs- 1
P A R I "
xi i
16. The success of tighter horizontal and vertical value chain linkages depends on a transparent and secure trading environment which would allow producers and traders to compare prices and reduce transaction costs o f coordination and negotiation. Participants at the stakeholder feedback workshop specifically mentioned the lack o f trust and information as barriers to coordination. Bringing up to date price information to small farmers i s therefore an imperative for closer market linkages. Hence, a second area o f interventions would aim to increase farmer’s access to market information. For that purpose the potential o f institutional innovations l ike market and price information services via cell phone text messages could be explored. While experience from Ghana and Zambia shows that the private sector tends to be very successful in providing these services initial start-up support from the public sector may be necessary.
17. To firther reduce the cost o f assembly investments would be necessary to improve physical marketing infrastructure. Currently farmers complain about inadequate storage and processing facilities for maize, cassava and other crops. Such investments could therefore be an important area for public-private cooperation. Investments in wholesale markets are a further option to create a more transparent and secure trading environment which would allow producers and traders to compare prices and reduce transaction costs o f coordination and negotiation.
18. Any program to improve the competitiveness o f Cameroon’s agriculture would also need a component focusing o n rural roads linking producers to nearby markets and major transport routes. The poor state o f rural roads leads to high cost o f moving goods around Cameroon and represents a bottleneck to commercialization. I t i s recommended that such a component also reforms the current system o f official and unofficial road blocks and police controls, which pose a heavy burden on agricultural trade in Cameroon.
Commodity specific results
19. Cassava. The results for cassava products (fresh tubers, bobolo, and fufu) are encouraging. They show that Cameroon already enjoys a high degree o f competitiveness and i s well situated to grow in domestic and regional markets. There are opportunities to increase profitability o f family farmers through better soil management and increased use o f improved inputs such as new cultivars and fertilizer. At the higher management levels, per ton cost o f growing cassava decrease showing that farm investments are not only a route to improved incomes, but also enhanced trade competitiveness.
20. Assembly costs are a major bottleneck. Family farms mainly use the informal roadside trade network, whose chaotic nature and high cost o f transporting small quantities o f produce are a significant burden for primary producers. Because the roadside network is a much higher cost operation, the total value chain cost o f fresh cassava in the commercial value chain works out about 49% lower compared with family farm production distributed through the roadside network. If family farmers had access to a similar trade network, they too would enjoy a much stronger competitive advantage and could capture much more o f the total value available in the cassava chain.
... Xll l

21 Cotton. The cotton sector operates in a very difficult international environment, characterized by decreasing prices and tough competition. The thin margin between total value chain costs and export parity prices i s an important concern for long-term sustainability o f the sector. There i s however some potential for competitiveness gains. I t appears that an important development strategy for Cameroon would be to help low-input farmers adopt improved technologies. In practice, this i s l ikely to come down to investments in farmer extension, input packages and pricing that rewards the use of inputs on cotton compared with diverting inputs to other crops. Beyond farm level improvements significant gains in competitiveness could also be achieved via reduced transport cost.
22. Maize. Family and commercial farmers producing maize at an improved level in Adamaoua and Northern Provinces are competitive with global imports as far south as YaoundC or even Douala. Because Cameroon i s not self-sufficient in grain, therefore, this result shows that investments in improved food production are not only strategically important for food security, but also make good business sense.
23. Similar to Cassava, investments to help family farmers improve from low-input production using recycled seed towards more intensive farming with modern inputs are important. The figure below illustrates the total cost o f maize production before assembly for the different production systems. Measures that would help these low-input farmers improve and achieve lower costs per MT would include improving access to better seed technology, development o f improved input supply systems for compound fertilizers and herbicides, and training in more effective use o f manure fertilizers.
Maize, Composition of total Farm Gate cost before assembly
Make, Total Costs (XAF per MT, farm gate) I 140,000
120.000
100,000
80,000
60,000
40,000
20,000
FAM-IOW FAM-hlgh COM
I.
0 I. I O
Total labor
Packing /delivery to factory
Animal hire / machineryO&M
Fertilizer & chem
Seed
DeDreciation.
24. With respect to the agribusiness sector and i t s production and marketing o f processed maize gr i ts used by the brewing industry, the analysis shows that a relatively minor change in tax or other process improvement could be enough to displace imported gr i ts as far south as Douala.
25. Palm oil. Cameroon i s highly competitive with imports o f palm o i l and enjoys a robust trade advantage measured by the gap between total value chain costs and import parity price. O n the export side, commercial farmers and agribusiness are not competitive at
xiv

global prices but the competitiveness gap i s quite small and could be overcome with the right type o f investment.
Plantain at Yield Per Ha Per MT Farm Gate (MTIHa) Costs Profit costs Profit
FAM-low 10.0 160,864 489,136 16,086 48,914 FAM-high 18.0 569,095 600,905 31,616 33,384 COM 25.0 959.642 665.358 38.386 26.614
26. By global standards, per hectare yields in Cameroon are low. Independent growers usually cannot access the right type o f material and/or lack specialized sk i l ls needed to propagate their own trees to maintain high production. One area for project intervention could be to develop a system to certify o i l palm seedlings together with better training o f independent farmers in tree spacing and other aspects o f plantation management
Rate of Return
3.04 1.06 0.69
27. Family and commercial farmers are much lower cost producers than agribusiness, but the method o f delivering the produce to the industrial mill i s quite often informal roadside transport and has a major bearing on total profits and returns. Unl ike cassava, plantain and maize, a more efficient assembly and transport system may be relatively easier to develop for the palm o i l industry. The industry proposes to work together with FAM and C O M farmers to set up production basins or extended collection networks which would provide a higher price to farmers and a higher and more reliable supply o f raw material to the mills, thereby increasing overall efficiency o f the sector. The process could be supported by targeted capacity building and technical assistance to help define the institutional design o f the vertical linkages and geographical boundaries.
28. Plantain. Cameroon i s highly competitive in plantain. Most marketed plantain i s sold domestically in urban centers. Small quantities are also exported to Gabon and Equatorial Guinea where demand i s high. Looking to the future, the Congo Republic and Chad also have excess demand and represent potential export markets for Cameroon.
29. Per hectare and per ton cost and profitability data for plantain at the farm gate are summarized below. As shown, good potential exists for significant improvement in per hectare profits from better management based on the use o f improved cultivars and fertilizer, but the cost o f achieving these improvements are extremely high. Although the rate o f return for FAM-high management i s s t i l l extremely good, an additional XAF 408,231 (USD 850) total spending i s required per hectare to achieve this level o f profitability.
30. The greatest area o f spending for family farmers wishing to move from low- to high-input management relate to crop establishment, fertilizer, and chemicals. Measures that help reduce these costs and/or simply increase the physical availability o f these inputs in the rural areas, therefore, could be the most effective way to facilitate better plantain management and help farmers realize the potential for increased incomes indicated above.
xv
3 1. Similar to the results for other commodities, the choice o f transport method has a major bearing on the final competitiveness results for plantain. Specifically, because FAM plantain i s easy to market, the savings from direct transport could be taken as additional profit. Indeed, because FAM plantain has a lower SV at the farm level than C O M production before transport, efforts to promote family farmer access to direct transport could be especially beneficial as a leverage point for increased income and trade competitiveness.
32. Poultry. The domestic poultry sector benefits from a high degree o f import protection through mercurial pricing. Domestic demand i s projected to increase rapidly and self- sufficiency wil l be a real challenge at current growth rates. Government, therefore, faces a dilemma: provide l o w cost imported chicken to l ow income urban consumers or protect domestic production with a med iud long term objective o f improving local capacity to meet consumer demand on a sustainable and competitive bases. Private investment by the commercial sector i s currently held back due to the uncertainty about future trade protection. I f government decides to maintain current protection policy, a f i rst step to improve the investment climate could be some kind o f public-private agreement describing the medium or long te rm maintenance o f the current protection mechanisms and a private sector commitment to invest.
33. Commercial and village chicken are treated as differentiated products as village chicken are not internationally traded, have a different flavor, and only 10% i s sold in urban markets. Commercial poultry production does not appear competitive in Cameroon and the thin edge that domestic producers sometimes enjoy depends entirely on trade protection. The competitiveness gap for large commercial producers i s relatively narrow and could be overcome through measures aiming at better management, improved feed conversion, and reduced costs mainly in poultry feed and day-old chicks. Availability o f feed i s a major bottleneck and backward linkages to the maize and soy sectors should be improved to ensure steady supply. Improving competitiveness and help small commercial producers transition to large commercial producers would therefore be among the main priorities.
34. For family farmers the story i s very different as traditional village chickens are very competitive and i t appears that investments in improved production and marketing could offer a good opportunity for increased rural incomes. The challenge in this case would be to develop new collection systems and provide training in the benefits o f routine vaccination, animal shelters, and small amounts o f supplemental feed. N e w distribution systems for feed and veterinary medicines would likely be required for farmers to access the required inputs for improved production.
xvi
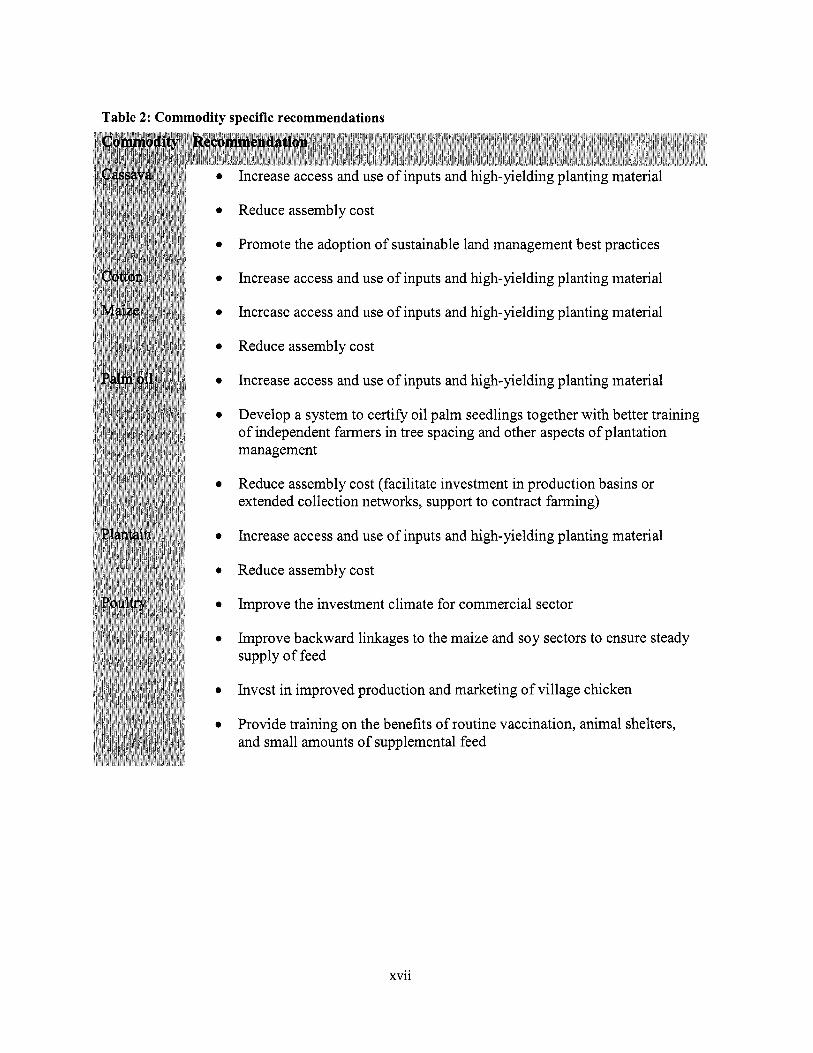
Table 2: Commodity specific recommendations
e
e
e
e
e
e
e
e
e
e
e
e
e
e
e
Increase access and use o f inputs and high-yielding planting material
Reduce assembly cost
Promote the adoption o f sustainable land management best practices
Increase access and use o f inputs and high-yielding planting material
Increase access and use o f inputs and high-yielding planting material
Reduce assembly cost
Increase access and use o f inputs and high-yielding planting material
Develop a system to certify o i l palm seedlings together with better training o f independent farmers in tree spacing and other aspects o f plantation management
Reduce assembly cost (facilitate investment in production basins or extended collection networks, support to contract farming)
Increase access and use o f inputs and high-yielding planting material
Reduce assembly cost
Improve the investment climate for commercial sector
Improve backward linkages to the maize and soy sectors to ensure steady supply o f feed
Invest in improved production and marketing o f village chicken
Provide training on the benefits o f routine vaccination, animal shelters, and small amounts o f supplemental feed
xvii

1. Introduction 1.1. Role of Agriculture in Cameroon
35. Agriculture contributes around 20% to GDP and i t s evolution i s critical for the economy in terms o f j ob creation, diversification, poverty reduction, overall growth and exports. Real GDP growth in Cameroon i s estimated at 2.9% for 2007. Economic growth remained weak because the adverse impact o f high o i l prices on the non-oil sector outweighed the positive impact on the o i l sector. Sti l l , the agriculture sector grew by 3.3% in 2007. The main products with positive volume growth in 2007 are cocoa (4.7
Figure 1 : Growth of Cameroon's Economy
Cameroon's Economy: Annual Growth Rates
percent), coffee (l%), rubber (6.9%), andpalm o i l (8.3%).
Source: World Development Indicators 2007
8
6 * E p n 2
0
Year
-+-Agriculture, mlue added (annual % growth) GDP growth (annua YO)
36. Food crops form the basis o f agricultural production, amounting to over two-thirds o f agricultural GDP. The livestock sub-sector stands at 12 percent o f agricultural GDP. Cash crops contribute to 8 percent o f the agriculture sector's GDP. Finally, the fishing and forestry sub-sectors each account for less than 6 percent o f agricultural GDP. Available statistics for food production, which are based o n broad estimates from field-based staff o f the Ministry o f Agriculture show that food production has increased by approximately 3 percent per year between 2005 and 2007.
37. Agriculture outstrips al l other sectors in Cameroon, including oil, in terms o f export revenues. Cocoa beans, cotton, coffee, and fresh bananas are the main agricultural commodities exported by Cameroon and together they accounted for 90 percent o f agricultural exports between 2000 and 2006 (see Figure 2). Furthermore, almost 60% o f the economically active population in Cameroon is employed by the rural sector and agriculture remains the predominant feature o f rural households: Around 50% o f the population lives in rural areas and fully 90% o f al l rural households are to some degree engaged in agriculture. O f these, approximately one third earn their living from export crops.
1
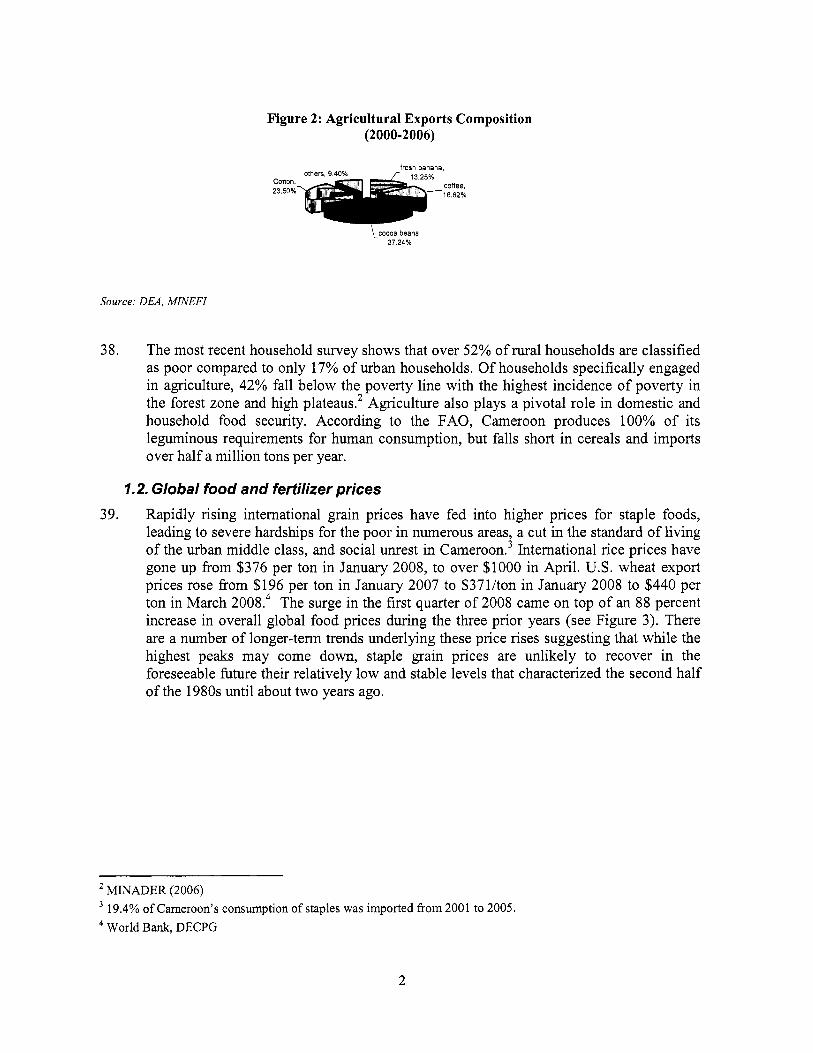
Figure 2: Agricultural Exports Composition (2000-2006)
[cocoa beans, 37.24%
Source: DEA. MINEFI
38. The most recent household survey shows that over 52% o f rural households are classified as poor compared to only 17% o f urban households. O f households specifically engaged in agriculture, 42% fall below the poverty l ine with the highest incidence o f poverty in the forest zone and high plateaw2 Agriculture also plays a pivotal role in domestic and household food security. According to the FAO, Cameroon produces 100% o f its leguminous requirements for human consumption, but falls short in cereals and imports over hal f a mi l l ion tons per year.
1.2. Global food and fertilizer prices 39. Rapidly rising international grain prices have fed into higher prices for staple foods,
leading to severe hardships for the poor in numerous areas, a cut in the standard o f living o f the urban middle class, and social unrest in C a m e r ~ o n . ~ International rice prices have gone up from $376 per ton in January 2008, to over $1000 in April. U.S. wheat export prices rose from $196 per ton in January 2007 to $371/ton in January 2008 to $440 per ton in March 20OfL4 The surge in the f i rs t quarter o f 2008 came on top o f an 88 percent increase in overall global food prices during the three prior years (see Figure 3). There are a number o f longer-term trends underlying these price rises suggesting that while the highest peaks may come down, staple grain prices are unlikely to recover in the foreseeable future their relatively l ow and stable levels that characterized the second hal f o f the 1980s until about two years ago.
MINADER (2006) 19.4% o f Cameroon’s consumption o f staples was imported from 2001 to 2005. World Bank, DECPG
3
2

Figure 3: Global food prices
Food prices (Nominal 8 Index, Jan 1995=100)
250 I
50 ............................................................. I
40. Increased consumer demand due to rising incomes in many parts o f the developing world has steadily increased demand over the past two or three decades for more convenient and value-added food products, including grain-based livestock products. More recently, increased demand for the raw materials that go into bio-fbels, such as sugarcane, maize, soybean, and palm oil, have led to increased competition for cropland, and have contributed to increased demand for grain. Fuel and fertilizer prices have also risen sharply due to rising o i l prices, which has increased agricultural costs. The surge in fertilizer prices since January 2007, shown in Figure 4, i s o f particular concern with respect to i t s likely discouragement o f smallholder farmers who supply the brunt o f the food in Cameroon.
I
Figure 4: Global fertilizer prices Fertilizer Prices (FOB Bulk), January 2000 - April 2008
1400
1100
1000
1 0
Y 400 1 0 I/; - - ,
AprllwoII -.+
DAP, U.S. 0"lf 3
Source: International Center for Soil Fertility and Agricultural Development (IFDC)
i
41. Governments can respond to the hike in prices through short, medium, and long-term measures. Policy interventions can be divided into three broad classes: (i) interventions to ensure household food security by strengthening targeted safety nets; (ii) interventions to lower domestic food prices through short-run trade policy measures or administrative action, and (iii) interventions to enhance longer-term food supply. The investment and
3
policy recommendations following from this report for food crops belong to the third class o f interventions.
7.3. Study Objectives 42. Given the Government’s expressed priority o f poverty r e d u c t i ~ n , ~ agriculture clearly has
a central role in the country’s economic growth and poverty reduction strategies. Despite the recent peak in o i l prices, o i l production in the country has been on the decline for some years. The recent Interim Strategy Note (ISN) for Cameroon therefore indicates that “the mobilization o f non-oil revenues wil l be essential” to the resource strategy for Cameroon. For poverty alleviation, growth, and food security, therefore, agriculture is- and wil l continue to be-of significant importance to the country’s development goals.
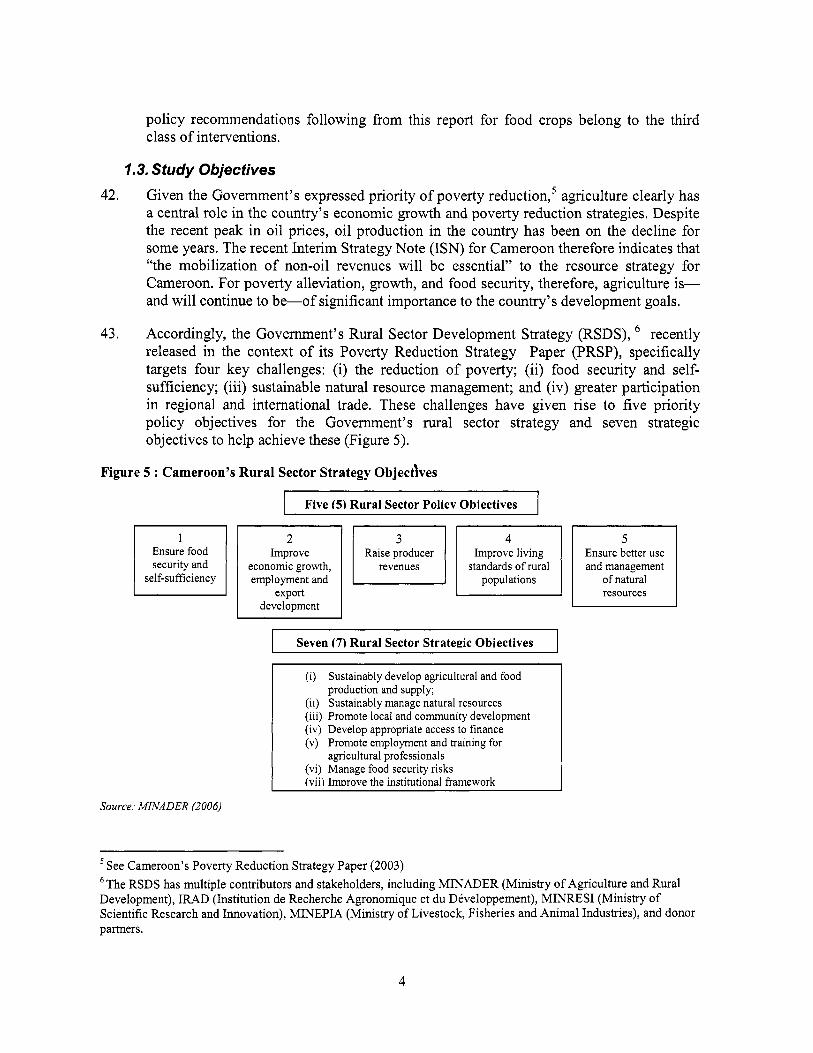
43. Accordingly, the Government’s Rural Sector Development Strategy (RSDS), recently released in the context o f its Poverty Reduction Strategy Paper (PRSP), specifically targets four key challenges: (i) the reduction o f poverty; (ii) food security and self- sufficiency; (iii) sustainable natural resource management; and (iv) greater participation in regional and international trade. These challenges have given rise to five priority pol icy objectives for the Government’s rural sector strategy and seven strategic objectives to help achieve these (Figure 5).
Figure 5 : Cameroon’s Rural Sector Strategy Objecdves
Ensure food security and
self-sufficiency
Source: MINADER (2006)
1 Five (5) Rura l Sector Policv Obiectives I ~ ~~ ~ ~~ ~
economic growth, rev en u e s standards o f rural and management employment and populations o f natural
export resources development
Seven (7) Rura l Sector Strategic Obiectives
(i)
(ii) Sustainably manage natural resources (iii) Promote local and community development (iv) Develop appropriate access to finance (v) Promote employment and training for
agricultural professionals (vi) Manage food security risks (vii’l Immove the institutional framework
Sustainably develop agricultural and food production and supply;
See Cameroon’s Poverty Reduction Strategy Paper (2003) The RSDS has multiple contributors and stakeholders, including MINADER (Ministry o f Agriculture and Rural
Development), IRAD (Institution de Recherche Agronomique et du Dkveloppement), M I N R E S I (Ministry o f Scientific Research and Innovation), M I N E P I A (Ministry o f Livestock, Fisheries and An ima l Industries), and donor partners.
4
44.
45 *
46.
Overall, the agriculture strategy o f Government-and i t s donor par tnersdal ls for a more ‘pragmatic approach’ in achieving the country’s development objectives. This, in turn, demands better information about where interventions can have the most impact and which ones hold the most potential for meeting the ambitious objectives for agriculture development in Cameroon.
This study aims to assist in the realization o f the Government’s rural sector objectives through the specific avenue o f improved commercial agricultural competitiveness. I t explores the concrete constraints and potential for domestic, regional, and/or international competitiveness o f six agricultural value chains that involve family, commercial, and large agro-industrial enterprises in different regions o f Cameroon.
The overall objective o f the study i s to inform on the potential, the investments and the policies for growth o f commercial agriculture in Cameroon in ways that:
(a) achieve broad-based poverty reduction;
(b) increase exports; and
(c) contribute to food security.
47.
48.
49 9
50.
The immediate objective o f the competitiveness study i s to identify products and farm systems that are currently competitive or have the potential o f becoming competitive in domestic, regional, or global markets. More specifically, the Government has asked the Bank to provide support for i t s growing agricultural program. This Economic and Sector Work is therefore expected to inform the preparation o f a new lending operation for the agricultural sector in Cameroon.
By looking at detailed price build-up from stage to stage o f agriculture value chains, the study specifically helps identify key bottlenecks and changes that need to take place to realize competitiveness potential. As Cameroon mainly has influence over prices within i t s own borders, the methodology i s particularly interested in the composition o f domestic costs. If some cost accounts for a large share o f total value, or i s significantly higher than an equivalent international benchmark, then new policies or investments focused on reducing that cost would likely be an effective strategy for enhanced competitiveness.
In addition, the concept note had envisioned to explore possible social and environmental impacts o f any commercialization development. However, due to budget and time constraints it was not possible to analyze these aspects. Similarly, the potential o f niche markets o f the selected commodities had been identified as an important question in the concept note, but due to resource constraints this question could not be pursued further.
This report i s organized into 11 chapters. The next chapter describes the context of Cameroon’s Agricultural Sector. The third chapter gives an introduction to the methodology o f quantitative value chain analysis. Chapters 4 to 10 are dedicated to inputs and the six commodities Cassava, Cotton, Maize, Palm, Plantain, and Poultry. The eleventh chapter concludes offering some reflections on pol icy and investment recommendations. Detailed data tables and price assumptions, maps, and minutes o f the stakeholder feedback workshop are given in appendices 1 , 2, and 3.
5
2. Context
Agro-ecological zones Sudano-Sahelian High Guinea Savanna Western Highlands Monomodal Humid Forest Zone
Bimodal Humid Forest Zone
5 1. The context o f this study i s described along 4 dimensions: (i) geography, (ii) commodity coverage, (iii) production systems, and (iv) agricultural institutions. This chapter describes these dimensions and explains how they influenced the design and recommendations o f the quantitative value chain analysis.
Crops Cotton, millet-sorghum, cowpea, onion and sesame Maize, cotton, millet-sorghum, yam, potatoes Cocoa, coffee, maize, beans, potatoes, poultry market vegetables Cocoa, bananas, plantain, cassava, coffee, pa lm oil, poultry, rubber, ginger, pepper. Cocoa, plantain, cassava, coffee, maize, pa lm oil, pineapple.
2.1. Geography 52. Cameroon has one o f the most diversified agro-ecological environments in Sub-Saharan
Aiiica. It stretches from the semi-arid Sudano-Sahelian area in the far north and highlands in the north-west, to humid forests in the central, southern, and eastern regions. Table 3 presents Cameroon’s main ago-ecological regions and their predominant types o f crops. A map o f agro-ecological zones i s presented in the appendix.
Table 3 : Agro-ecological Zones and Agricultural Activities in Cameroon
Source: World Bank, 2003
53. In order to address this diversity, the value chain analysis takes place in one specific zone or region for each commodity, dependent upon i t s potential and importance to that region. So, for example, cotton, while also grown in the Guinea Savannas, i s particularly important to income and poverty in the north o f the country. The value chain analysis for cotton therefore takes place in the Sudano-Sahalian zone o f the North. That way the study distributes the value chain analyses across zones according to strategic importance o f selected commodities in the different regions o f the country.
2.2. Commodity Coverage 54. The most recent Rural Sector Review (RSR)’ for Cameroon identifies a number o f
commodities as important, either for current employment, for food security or for potential competitiveness in domestic, regional and export markets. The RSDS also cites a similar set o f ‘strategic’ crops that have a role to play in realizing their objectives for the rural sector. The study therefore builds on past diagnostic work in Cameroon to select 6 key commodities from among those identified as strategic or high potential. Namely: maize, plantain, cotton, cassava, palm o i l and poultry. These commodities are chosen either for their importance to a particular region or for their potential contribution to poverty reduction, export development and/or food security.
’ World Bank (2003)
6

55.
56.
57.
58.
59.
Grains, for example, account for h l l y one third o f caloric requirements and are therefore important to food security. In Cameroon, maize single-handedly provides around 20% o f the country’s caloric and protein requirements, Cameroon, however, i s only 70% self- sufficient in grain production and imports are required to cover the gap. In addition to food security objectives, the Government has articulated important export objectives for grains, envisioning a ten-fold increase in export volumes from 2001 to 2015.*
Plantain and Cassava are considered strategic commodities for food security in Cameroon. Together they provide 21% o f the country’s caloric requirements and 27% o f i t s protein. Cameroon is currently self-sufficient in the production o f plantain and cassava, and has strong potential for regional export. Indeed, since the early 1990s’ plantain exports to neighboring Gabon and Equatorial Guinea have grown over 500%.9 Furthermore, plantain and cassava are primarily smallholder crops, important for employment and poverty reduction through, for example, contractual arrangements with larger-scale distributors. Both have important gender elements, given that primary processing and cross-border transport (to Gabon and Equatorial Guinea) i s dominated by women.
Cotton i s one o f six agricultural commodities” that account for the lions’ share o f Cameroon’s export revenues. Produced primarily in the Sudano-Sahalian and High Guinea Savannas o f the northern part o f the country, the production o f cotton i s an important source o f income for the relatively poorer Northern provinces. Together with coffee and cocoa, the production o f cotton provides revenue for over a third o f the agricultural population nationwide due to i t s domination by smallholder production. Cotton therefore represents a value chain wi th important potential impacts on poverty reduction, as well as export development.
As the third biggest producer ofpa lm oil in Africa, Cameroon assigns a strong role to this tree crop in the country’s strategy for achieving economic growth, employment and export development. In addition to its place in the nation’s export and growth strategy, palm o i l i s a basic food commodity in which Cameroon i s not currently self-sufficient. In terms o f poverty reduction and employment, l ike most tree crops, palm o i l holds strong potential for smallholder cultivation. While smallholders already represent some 40% o f plantation acreage (and over a quarter o f national production), the potential for further growth and employment i s strong, given that the capacity for surface extension o f the larger agro-industrial model is limited.
Poultry, for both meat and eggs, has important employment and rural income implications, particularly in the West and the relatively poorer Northern provinces. Traditional smallholder poultry farming makes up 70% o f the nation’s poultry population. Traditional production co-exists with medium scale semi-intensive and larger industrial production, mainly centered on the nation’s cities. In terms o f food, poultry provides over a quarter o f the country’s meat consumption (second to beef, which
* MINADER (2006), p. 14
lo With cocoa, coffee, banana, pa lm oi l and rubber CIRAD (2006)
7

accounts for 50%). Given i t s importance for employment and potential in providing good opportunities for linkages both upstream (e.g. feed) and downstream (e.g. packaging), exploring the competitiveness o f Cameroon’s poultry chain can contribute importantly to the government’s manifold objectives for the rural sector, as well as fostering urban linkages.
2.3. Production systems 60. A variety o f production systems co-exist in Cameroon. Broadly speaking, these can be
classified as smallholder farming, mediudlarge-scale farming and ago-industry. ’’ Smallholder farming covers a broad spectrum o f farm models, including traditional agriculture systems, improved rain-fed cultivation, intensive irrigated agricultural systems, pastoralism, and agro-pastrolism. There are over 1 mi l l ion smallholder production units in Cameroon, producing a wide variety o f grains and other foodstuffs, as wel l as dominating poultry production in Cameroon.
61. Mediudlarge scale farming i s usually mono-cultural and has some degree o f integration with downscale agri-business. They tend to be run as agricultural enterprises, by professional managers or skilled producers, sometimes employing wage labor. They have better access to finance and land than smallholders and may use higher degrees o f mechanization and inputs.
62. The final category o f farm system i s the ago-industrial production system. There are only 20 or so in existence in Cameroon and they represent large, plantation-style production, primarily in export crops and livestock. They use wage labor and depend heavily on agricultural inputs. They are a m i x o f private and public enterprises, with the rate o f privatization accelerating in recent years.
63. Taking into account this diversity the analysis i s based around a continuum o f indicative production possibilities. At the farm level, the spectrum begins with very low-input family farmers (FAM-low) and extends to cover improved smallholder management systems (FAM-high), larger-scale and even more advanced commercial (COM) production systems, and finally very large-scale agri-industrial (AGI) enterprises. In al l cases, i t was decided to cover at least two levels o f FAM management to illustrate potential food security and income benefits Cameroon could receive from investing in improved farm management. Some defining characteristics o f this spectrum are illustrated below.
l1 World Bank (2003)
8
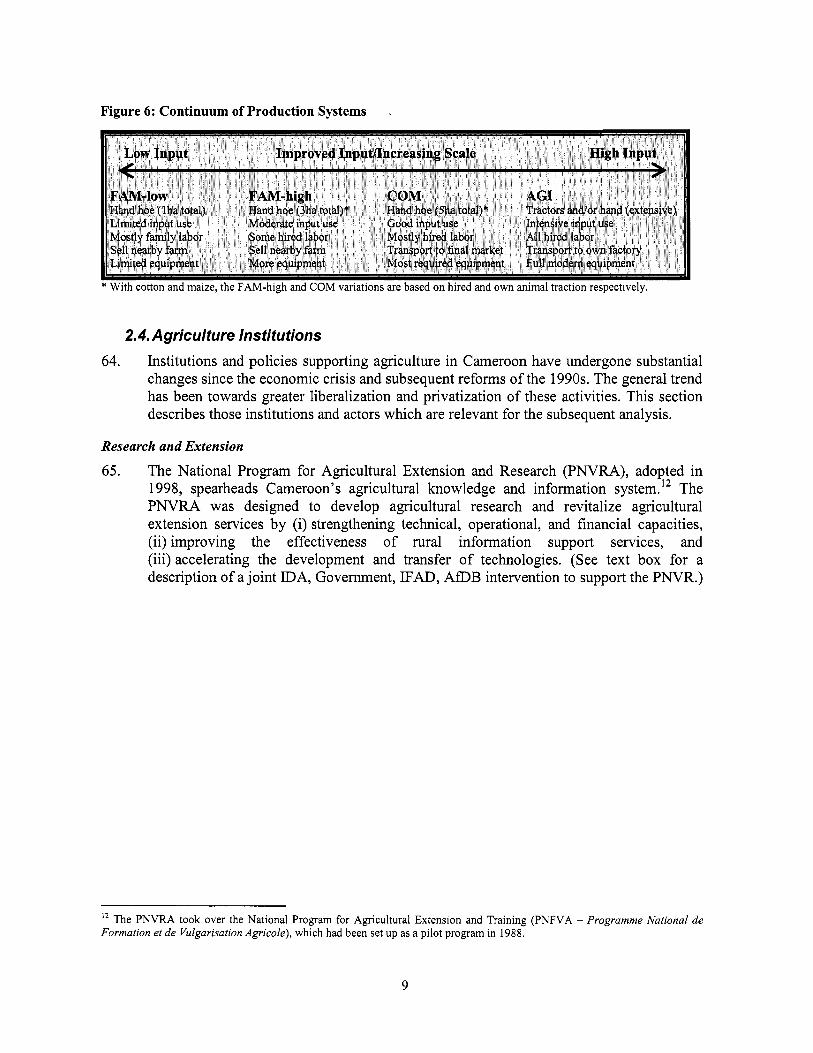
Figure 6: Continuum of Production Systems .
* With cotton and maize, the FAM-high and COM variations are based on hired and own animal traction respectively.
2.4. Agriculture Institutions 64. Institutions and policies supporting agriculture in Cameroon have undergone substantial
changes since the economic crisis and subsequent reforms o f the 1990s. The general trend has been towards greater liberalization and privatization o f these activities. This section describes those institutions and actors which are relevant for the subsequent analysis.
Research and Extension
65. The National Program for Agricultural Extension and Research (PNVRA), adopted in 1998, spearheads Cameroon’s agricultural knowledge and information system. l2 The P N V R A was designed to develop agricultural research and revitalize agricultural extension services by (i) strengthening technical, operational, and financial capacities, (ii) improving the effectiveness o f rural information support services, and (iii) accelerating the development and transfer o f technologies. (See text box for a description o f a joint IDA, Government, IFAD, AfDB intervention to support the PNVR.)
~ ~ _ _ _ _ _
l2 The PNVRA took over the National Program for Agricultural Extension and Training (PNFVA - Programme National de Formation et de Vulgarisation Agricole), which had been set up as a pilot program in 1988.
9

66
As a follow-on intervention to the National Project for Agricultural Extension (PNVA), the National Agricultural Extension and Research Program Support Project (PNVRA) undertook to finance - I D A j o i n t l y with Government, IFAD and ADB- the implementation o f the national agricultural extension policy and agricultural research in the entire country f rom 1999 to 2004. The development objective o f the National Agricultural Extension and Research Program Support Project was to contribute to improving agricultural productivity and incomes in Cameroon in a sustainable way. The outcome o f the overall project towards which the IDA Credit contributed was satisfactory, largely because most o f the expected results at the end were reached or exceeded, in some cases substantially. The components which supported agriculture extension and producer organizations provide interesting lessons learnt:
The original tasks of the Producer Organizations Component were to support the efforts o f the farmer-organization and private sector specialists (SOASPs) to develop formal and informal contacts between producer groups and associations o n the one hand, and private sector suppliers o f agricultural inputs and crop processing equipment, traders, and industrial purchasers o f agricultural products on the other hand. At mid-term, a pi lot activity covering provision o f small equipment and productive infrastructure grants for producer organizations (POs) was introduced. The new approach introduced in 2002 for promoting producer organizations through “micro projects” created a lo t o f enthusiasm among the producers. One reason for this enthusiasm could have been that the approach implied that there would be grant funds available to implement some of the priorities identified by the farmers.
The objectives of the Agricultural Extension Component were to continue supporting a country- wide extension system, to increase the number o f farmers in contact with the extension service f rom 15 percent to 30 percent o f a l l the farm families in Cameroon by the year 2002, to have 1,690 agricultural extension agents (Agent de Vulgarisation de Zone--A VZ) in post, with 200 o f them being women, and to increase the overall adoption rates o f technical messages in contact groups from 40 to 62 percent. At midterm the project activities were reoriented so that the agricultural extension agents became more l ike rural development facilitators in assisting POs in planning and implementation o f their “micro projects”, consisting o f activity plans for productive small infrastructure and equipment, and the delivery o f related agricultural extension advisory services as requested by farmers. The reorientation o f the farmer support f rom a mass-extension system, to a more targeted and comprehensive approach o f advisory assistance to registered producer groups init ially reduced the number o f benefiting families, because the producer groups, with their multitude o f needs, require more o f the support agent’s time. I t also may seem contradictory to the Government’s goal and obligation to look after a l l the rural population. However, under a tight budget constraint the new approach appears to offer a way o f making people and their organizations take over rural development efforts in phases (the groups assisted f irst will “graduate” to develop their members’ economies without the Government’s assistance, at which time the available funds can be transferred to the second set o f producer groups, etc.).
Wor ld Bank (2004)
Relevant ministries such as the Min is t ry o f Agriculture (MINAGRI) or the Ministry o f Livestock, Fisheries, and An imal Industries (MINEPIA) coordinate their actions through the PNVRA. Currently, extension services are also delivered by regional institutions such as the North-West Province Development Author i ty (MIDENO) or the South-West
10

Development Authority (SOWEDA) as wel l as by parastatal enterprises (e.g. S ODECOTON).
67. The Institute o f Agricultural Research for Development (RAD) i s virtually the only organization undertaking varietal selection in Cameroon. I t also produces pre-foundation and foundation seeds for maize, millet, sorghum, rice, cowpeas, groundnuts, tubers, roots, cotton, fruit trees, and palm oil.
Private sector and marketing
68. Following the shutdown in 1990 o f the Seedlings and Foodstuff Development Authority (MIDEVIV) and the National Rural Development Fund (FONADER), which was responsible for the import and distribution o f subsidized fertilizers, the private sector has invested in the marketing o f inputs. I t i s however only partially successful in supplying farmers with affordable quality inputs.
69. Small and medium-scale enterprises have invested in the production and marketing o f improved seed varieties. Farmers, however, complain about the insufficient supply o f seeds as well as about the poor quality o f seeds sold on the market despite high prices, and the misuse o f “Certified Seed” labels. The government hence promulgated a Seed Act (Loi Semenciire) in 2001 to improve regulation o f the market. Implementing decrees (dkcrets d ’application), which are necessary for any Act to be enforced have however not yet been issued.
70. Currently two private importers supply over 90percent o f the fertilizer market. The product must pass through the local wholesale and retail network until it reaches the farmers. Prices o f fertilizer are very high. Quality issues have also arisen. A reform o f the fertilizer sector i s being undertaken since 1994 with USAID support under the so called “Programme de Refonnes du Sous Secteur Engrais-PRSSE” to facilitate importation and marketing o f fertilizers. A follow-up program i s currently under preparation with the South African Merchant Bank and aiming at improving small farmers’ access to fertilizers.
71. Prior to the liberalization o f the agriculture sector, the MIDEVIV was directly involved in the distribution and trade o f foodstuffs on the domestic market, purchasing and collecting agricultural produce from farmers before transporting i t for sale to local markets. The National Produce Marketing Board (NPMB) played a similar role to the MIDEVIV, for agricultural exports. Both organizations were liquidated in the early 1990s and commercialization o f agricultural output was liberalized. Until now the private sector has not been able to fully fill the vacuum lef t by these two institutions and the linkages between producers and output markets are generally weak.
Producer organizations
72. In 1990, government reformed the legal framework o f associations and cooperatives and put in place legal measures including a new law, “the freedom o f association act”. Several institution building measures were also put in place, e.g. the Projet d’appui aux stratkgies paysannes et ri la professionalisation de 1 ’agriculture (ASPPA), and the
11
Cellule de promotion de I 'organisation professionnelle agricole (PROMOPA), an organization with a specific mandate to promote professionalism among smallholder producers. An early outcome o f these measures was the emergence o f large numbers o f grassroots and umbrella organizations, with a wide range o f business activities, and broad geographical coverage at the village, district, department, province or national level. Many POs came from informal ethnic or village-based support systems. Sometimes local leaders seek to position themselves strategically in order to benefit from newly created opportunities in the development assistance business.
73. Most POs are perceived by their members as an instrument to respond to organizational and representational problems. In particular, members see the PO as an interface between them and institutional support arrangements, local governments, private sector, other national organizations (churches, NGOs) and external organizations (donors, NGOs, churches, etc.); they expect PO to act as intermediaries between them and markets; they perceive PO as consensus building structures, relaying requests from producers in the areas o f training, information and technological innovation, organizational support and management. They also expect PO to play important roles in the promotion o f savings, and financing instruments o f micro-projects, for instance as guarantors o f contracted credits, as well as assisting in the recovery o f debt from their members.
Cooperating partners
74. AFD financed an operation called "Professionalisation Agricole et Renforcement de CapacitCs-PARI" which strengthened the institutional and organizational capacities o f producer organizations in Cameroon. The project was launched in 2004 and i s planned to be closed in December 2008. Ma in outputs o f the project include the following: (i) setting up o f a comprehensive institutional and organizational framework for producers at the provincial as well as at the national levels, following a detailed participatory diagnosis o f existing producer organizations al l over the country (65,000), (ii) setting up o f a consultative platform "Cadre Paritaire de Concertation", in each o f the ten provinces, and (iii) putting in place a detailed data base on producer organizations with legal status (about 20,000 POs).
75. Continued support i s expected to be provided under the C2D (Bilateral French HIPC funds) which wil l include three operations: (i) Improving the Competitiveness o f small agropastoral farms; (ii) Reviving the agricultural and livestock professional training centers, and (iii) Strengthening the statistical and Monitoring and Evaluation capacities o f concerned line Ministries (the Ministry o f Agriculture and the Ministry o f Livestock).
76. The EU implemented value chain analyses: (i) Coffee; (ii) Cocoa, and (iii) milk. The analysis for (i) and (ii) i s being completed, while (iii) i s largely initiated. In total, nine commodities are being analyzed. The EU i s also financing the EU-A11 ACP Agricultural Commodities Programme (AAACP). The objective o f this € 45 mi l l ion program i s to strengthen stakeholders' capacities in selected ACP countries to develop and implement sustainable commodity strategies, with a view at improving producers' livelihood and incomes, and to reducing vulnerability at both producer and macro levels. 1/3 o f the
12
Program’s hnding (€15 M) has been earmarked for cotton related activities. This program i s being implemented by five International Organizations: the World Bank (both S D N Africa and C R M G are involved), FAO, the International Trade Center (ITC), U N C T A D and the Common find for Commodities (CFC). A consultative Kick-of f workshop for the Central African Countries was held in Cameroon in May 2008.
77. Cameroon, in partnership with the International Fund for Agricultural Development (IFAD), launched a National Program for the Development o f Roots and Tubers (PNDRT) in 2004 in order to enhance the productivity and commercialization o f roots and tubers. This program notably aims at promoting the adoption o f improved production techniques amongst the poorest producers, developing producers’ organizations, and improving access to markets. Two new investment programs are also being initiated which aim at (i) improving the productivity and competitiveness o f the rice subsector and (ii) improving producers’ access to credit through strengthened rural finance institutions.
Non governmental organizations
78. NGOs are involved in several sub-sectors. Extension services are timidly contracted out to NGOs. NGOs also support producer organizations. Access to information and lack o f skilled staff are the two main constraints to NGO operations. Many NGOs get involved in some sectors or activities without sufficient expertise and information base. Thus, concentration in some sectors reflects more the availability o f financing or donors’ interest than NGOs’ experience with the issues. The extent o f their logistics determines the extent o f their outreach in country. However, only few have important logistics resources available. Most NGOs are not equipped at all.
Regional Institutions
79. Cameroon i s a member o f the Central African Economic and Monetary Community (CEMAC). The other community members are the Central African Republic, Chad, the Republic o f the Congo, Equatorial Guinea and Gabon. The common external tariff o f the CEMAC was established at i t s creation in 1994. Since 1998, customs duty i s officially nil within the CEMAC, essentially producing a free-trade zone. Due to their o i l resources and historical reasons Cameroon’s neighbors and CEMAC partners emphasize less agricultural development. The absence o f custom’s duty within C E M A C therefore creates an important advantage for Cameroon to expand i t s agricultural exports to these countries. To that end, the recent unprecedented multi-donor effort in the region aims to improve transport infrastructure through the three-country Transit Trade Project with the objective to facilitating regional trade among the CEMAC member states and improving the countries’ access to world markets. A regional automatic payment facility i s being developed as wel l to facilitate the use o f credit cards for trade transactions in any o f the CEMAC countries.
80. After the expiration o f the LomC IV Convention, the Cotonou Agreement introduced radical changes in the economic partnership between African Caribbean and Pacific (ACP) countries and the European Union (EU). Non-reciprocal advantages, which were the foundation o f the LomC Conventions, were no longer compatible with Wor ld Trade
13
Organization rules. ACP countries wi l l hence maintain their current preferential access to the European market, but wil l have to reciprocate by opening progressively their own markets to European products. As planned in the Cotonou Agreement, an Economic Partnership Agreement (EPA) i s currently under negotiation between CEMAC countries and the EU. Cameroonian tariffs are thus expected to decrease substantially in the upcoming years. Cameroon has currently a high import protection o f his poultry sector through mercurial pricing. Being a member o f CEMAC, it i s uncertain whether Cameroon can maintain the protection once the EPA i s signed.
14
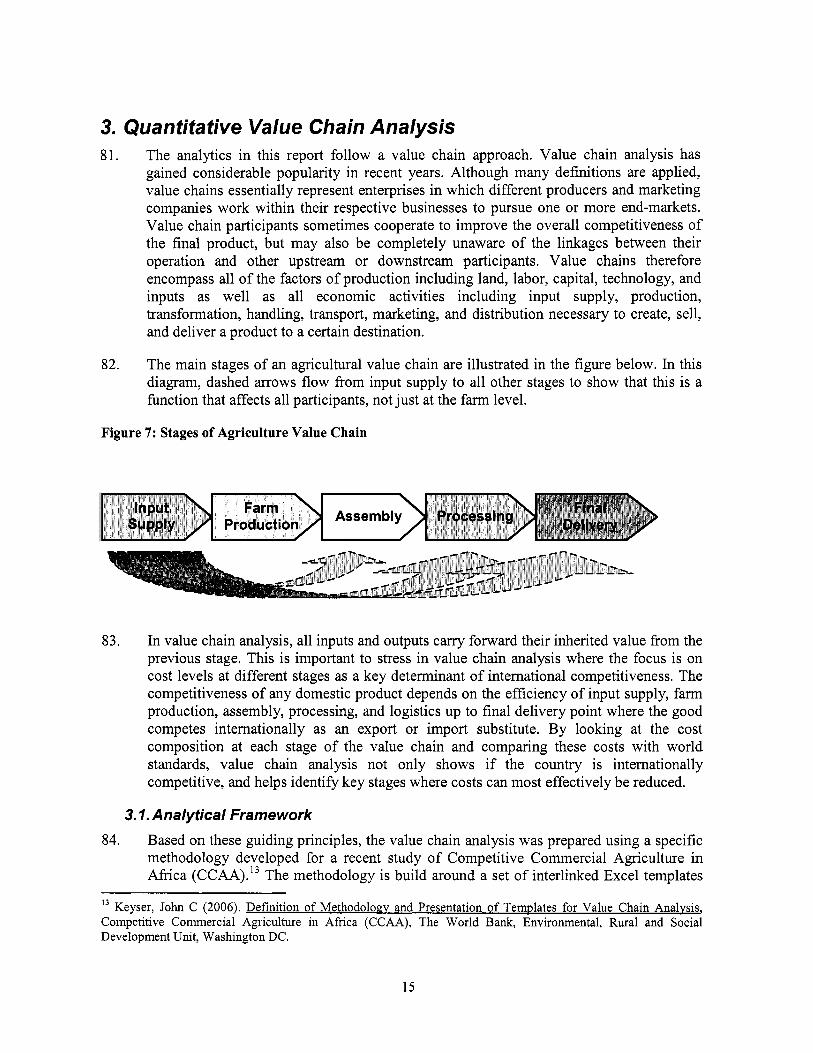
3. Quantitative Value Chain Analysis 81. The analytics in this report follow a value chain approach. Value chain analysis has
gained considerable popularity in recent years. Although many definitions are applied, value chains essentially represent enterprises in which different producers and marketing companies work within their respective businesses to pursue one or more end-markets. Value chain participants sometimes cooperate to improve the overall competitiveness o f the final product, but may also be completely unaware o f the linkages between their operation and other upstream or downstream participants. Value chains therefore encompass al l o f the factors o f production including land, labor, capital, technology, and inputs as wel l as al l economic activities including input supply, production, transformation, handling, transport, marketing, and distribution necessary to create, sell, and deliver a product to a certain destination.
82. The main stages o f an agricultural value chain are illustrated in the figure below. In this diagram, dashed arrows flow from input supply to a l l other stages to show that this i s a function that affects al l participants, not just at the farm level.
Figure 7: Stages of Agriculture Value Chain
83. In value chain analysis, al l inputs and outputs carry forward their inherited value from the previous stage. This i s important to stress in value chain analysis where the focus i s on cost levels at different stages as a key determinant o f international competitiveness. The competitiveness o f any domestic product depends on the efficiency o f input supply, farm production, assembly, processing, and logistics up to final delivery point where the good competes internationally as an export or import substitute. By looking at the cost composition at each stage o f the value chain and comparing these costs with world standards, value chain analysis not only shows if the country i s internationally competitive, and helps identify key stages where costs can most effectively be reduced.
3.1. Analytical Framework 84. Based on these guiding principles, the value chain analysis was prepared using a specific
methodology developed for a recent study o f Competitive Commercial Agriculture in Africa (CCAA).13 The methodology i s build around a set o f interlinked Excel templates
l3 Keyser, John C (2006). Definit ion o f Methodology and Presentation o f Templates for Value Chain Analvsis, Competitive Commercial Agriculture in Afr ica (CCAA), The W o r l d Bank, Environmental, Rural and Social Development Unit, Washington DC.
15

85.
86.
87.
88.
designed to calculate standard indicators o f costs and profitability at each major stage o f the production cycle. By filling in the elements o f each template for individual commodities and farm systems, the methodology offers a practical way to establish benchmark prices that can be compared with international standards and identify specific areas where costs can most effectively be reduced through pol icy change or other investment.
According to the methodology, total costs are measured in terms o f Domestic Value Added (DVA) and Shipment Value (SV), which constitute the main value chain indicators as follows.
Domestic Value Added (DVA) = Domestic costs and mark-ups PI + Official duties and tax + Unofficial charges and extra costs
Shipment Value (SV) = Domestic Value Added + Foreign components
Because countries mainly have influence over prices within their own borders, the methodology i s particularly interested in the composition o f DVA as a leverage point for enhanced competitiveness. These costs include legitimate business costs and mark-ups, official customs duties and taxes, and any number o f unofficial payments and bribes that sometimes have to be made to facilitate a particular operation. If some cost accounts for a large share o f total value, or i s significantly higher than an equivalent international benchmark, then new policies or investments focused on reducing that cost would likely be an effective strategy for enhanced competitiveness.
For cross-commodity and international comparisons, the final calculation o f SV including foreign components i s the most comprehensive measure o f actual and potential competitiveness. For any given commodity, trade competitiveness i s determined by comparing SV at the final market with an equivalent parity price (either a FOB price for exports or CIF price for import substitutes). By looking at the build-up o f SV (and DVA) from stage to stage, the methodology therefore reveals the competitiveness o f individual participants. If one stage accounts for a disproportionately large share o f final shipment value, interventions focused on that part o f the value chain likely also have a disproportionately large impact on the overall competitiveness o f the chain.
The methodology chosen allows for comparisons o f production cost and other aspects o f value chain performance with the C C A A study countries for three commodities, cassava, maize, cotton, and inputs. In Africa the C C A A study was undertaken in Mozambique, Nigeria, and Zambia. To establish international benchmarks o f successful development, a parallel analysis o f value chain performance was also carried out in Brazi l and Thailand. W h i l e the comparison produces some interesting results the approach has limitations due to data and modeling challenges, which are explained more in detail in the synthesis of the CCAA study14. Moreover the methodology cannot be used to say that farm
l4 Keyser, John C (2008). Competitive Commercial Agriculture in Africa (CCAA) Synthesis o f Ouantitative Results. The World Bank, Environmental, Rural and Social Development Unit, Washington DC.
16

production or assembly should cost a certain amount, or that one country i s above the so- called benchmark, because conditions naturally vary between countries for many good and inherent reasons. This study therefore highlights these comparisons whenever they add value to the analysis but does not consistently throughout the study report the other countries’ benchmark indicators.
89. Another important distinction in the methodology is that agriculture commodities take on different forms at each stage o f the value chain. In the most basic sense, this can be the difference between a recently harvested farm product with high moisture content and one that has been assembled in a warehouse and dried for several months. Agriculture raw materials may also be processed into one or more finished goods. Seed cotton, for example, i s processed into lint and seed while cassava can be traded fresh or as a processed food ingredient or industrial raw material. DVA and SV are therefore measured according to equations [ 11 and [2] on a per ton basis for the following product forms.
Farm production Farm gate product Assembly Assembled raw material Processing Processed raw material International logistics Traded commodity (Product 1,2, 3)
90. Finally, the value chain analysis is also interested in the private costs and returns that accrue to individual participants. Agriculture production, processing, and marketing begins with the decisions private investors make and it i s important to have a sense o f the underlying financial costs and profitability o f competing enterprises to f i rst determine if the system i s viable and second to identify opportunities for poverty reduction. Because the methodology i s constructed around enterprise budgets, these measurements are easy to make. At the farm level, private costs and returns are measured in per hectare and per ton terms; at later stages, values are measured in per MT terms only. From these indicators, calculations showing the rate o f return to variable and fixed expenditure, total investment requirements, demand for labor, and other components o f private and social importance can be made.
3.2. Procedures and Assumptions 91. In preparing the analysis for Cameroon, the main objective was to provide an indicative
picture o f value chain costs and returns. Farmers and al l other value chain participants naturally produce according to their own objectives and resource limitations. The value chain analysis therefore cannot identify optimal cropping patterns or investment strategies for individuals, and i s instead structured around a broad spectrum o f management possibilities. This approach i s most useful for understanding major trade- offs associated with different production decisions, transport arrangements, processing methods, and delivery distances specifically needed at the early stage o f planning an agriculture investment program.
92. Data collection was carried out in Cameroon from M a y to August 2007 and mainly involved key informant interviews, a br ief literature review, and sourcing from statistical abstracts. Subsequent to the data collection and analysis phase, a country workshop was
17
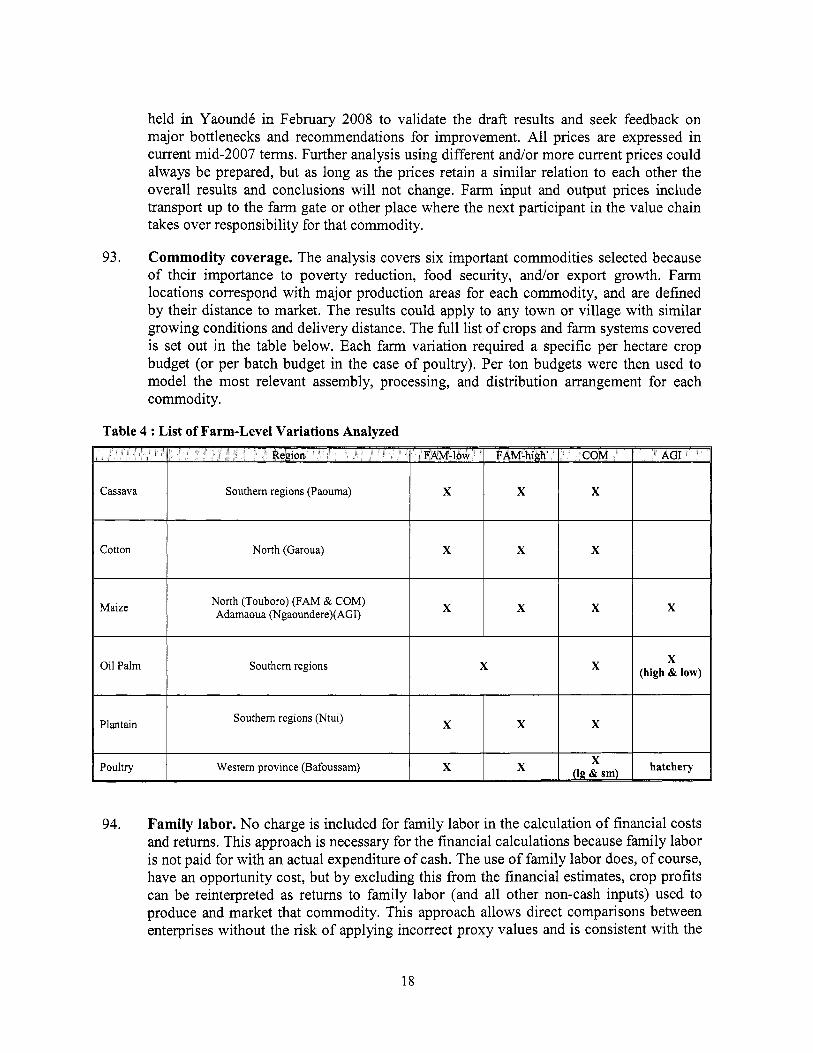
held in Yaoundk in February 2008 to validate the draft results and seek feedback on major bottlenecks and recommendations for improvement. All prices are expressed in current mid-2007 terms. Further analysis using different and/or more current prices could always be prepared, but as long as the prices retain a similar relation to each other the overall results and conclusions wil l not change. Farm input and output prices include transport up to the farm gate or other place where the next participant in the value chain takes over responsibility for that commodity.
93. Commodity coverage. The analysis covers six important commodities selected because o f their importance to poverty reduction, food security, and/or export growth. Farm locations correspond with major production areas for each commodity, and are defined by their distance to market. The results could apply to any town or village with similar growing conditions and delivery distance. The full l i s t o f crops and farm systems covered i s set out in the table below. Each farm variation required a specific per hectare crop budget (or per batch budget in the case o f poultry). Per ton budgets were then used to model the most relevant assembly, processing, and distribution arrangement for each commodity.
Table 4 : List of Farm-Level Variations Analyzed
Southern regions (Paouma)
North (Garoua)
Oil Palm Southern regions X
Plantain Southern regions (Ntui) X X X
Western province (Bafoussam)
94. Family labor. No charge i s included for family labor in the calculation o f financial costs and returns. This approach is necessary for the financial calculations because family labor i s not paid for with an actual expenditure o f cash. The use o f family labor does, o f course, have an opportunity cost, but by excluding this from the financial estimates, crop profits can be reinterpreted as returns to family labor (and al l other non-cash inputs) used to produce and market that commodity. This approach allows direct comparisons between enterprises without the risk o f applying incorrect proxy values and i s consistent with the
18

standard definition o f an opportunity cost which states that the value o f family labor i s the income foregone by not engaging in the next most profitable activity.
95. For the calculations o f DVA and SV, however, a different approach i s needed. At this level, the value chain analysis is interested in the total cost o f al l factors used in the production and marketing o f an agricultural commodity. Because family labor often accounts for a large share o f total costs for FAM systems in particular, some proxy value needed to be applied. For this reason, a ru le o f thumb estimate was applied by charging family labor at 60% o f the rate for casual farm labor. FAM farmers rarely have the opportunity to se l l their labor at the full wage rate every day o f the year and this approach i s at least a clear and simple way to recognize the value o f this input.15 In al l cases, the quantity o f family labor was estimated on the basis o f a five member household with proportionate adjustments for tasks that must be carried out over a limited number o f days, in which case hired labor must be used.
96. Transport methods. The cost o f moving agriculture raw materials from the farm to the place o f final competition i s a significant feature o f the value chains analysis. Similar to the approach o f analyzing a range o f farm systems, two types o f transport methods are also considered. The f i rst system i s the so-called roadside trade network in which small vehicle operators sell space on their trucks and charge passengers a fare to ride with the produce. Because individual sellers usually carry only a small amount o f produce this system results i s very high per MT transport costs. The second transport system by contrast i s termed the direct transport network and involves hauling larger consignments without the need for individual traders to ride with the goods. The potential cost savings with improved transport i s significant and i s described in more detail in the next section on major input costs.
Further analysis could always l ook at the effects o f different fami ly wage rate assumptions, but the basic outcome 15
i s easy to predict since labor costs and final estimated shipment values are directly related.
19
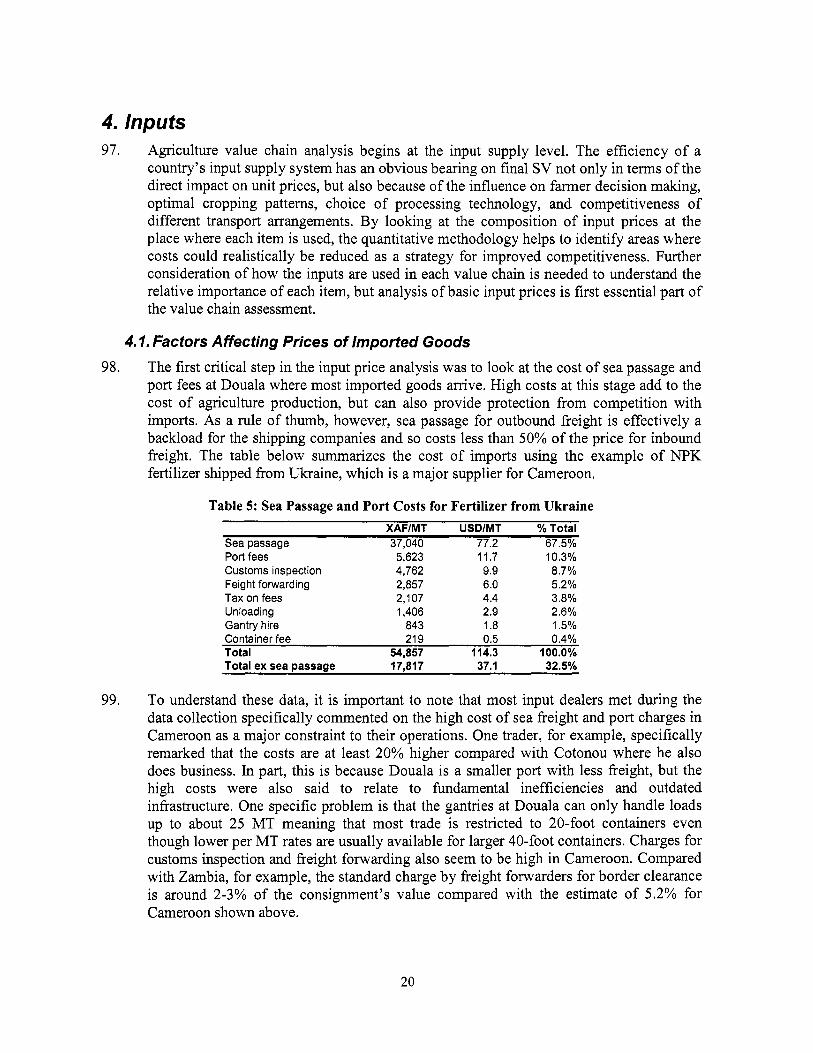
4. Inputs 97. Agriculture value chain analysis begins at the input supply level. The efficiency o f a
country’s input supply system has an obvious bearing on final SV not only in terms o f the direct impact on unit prices, but also because o f the influence on farmer decision making, optimal cropping patterns, choice o f processing technology, and competitiveness o f different transport arrangements. By looking at the composition o f input prices at the place where each item i s used, the quantitative methodology helps to identify areas where costs could realistically be reduced as a strategy for improved competitiveness. Further consideration o f how the inputs are used in each value chain is needed to understand the relative importance o f each item, but analysis o f basic input prices is f i rst essential part o f the value chain assessment.
4.1. Factors Affecting Prices of Imported Goods 98. The f i rst critical step in the input price analysis was to look at the cost o f sea passage and
port fees at Douala where most imported goods arrive. High costs at this stage add to the cost o f agriculture production, but can also provide protection from competition with imports. As a ru le o f thumb, however, sea passage for outbound freight i s effectively a backload for the shipping companies and so costs less than 50% o f the price for inbound freight. The table below summarizes the cost o f imports using the example o f NPK fertilizer shipped from Ukraine, which i s a major supplier for Cameroon.
Table 5: Sea Passage and Port Costs for Fertilizer f rom Ukraine XAFIMT USDIMT % Total
Sea passage 37,040 77.2 67.5% Port fees 5,623 11.7 10.3% Customs inspection 4,762 9.9 8.7% Feight forwarding 2,857 6.0 5.2% Tax on fees 2,107 4.4 3.8% Unloading 1,406 2.9 2.6% Gantry hire 843 1.8 1.5% Container fee 21 9 0.5 0.4% Total 54,857 114.3 100.0% Total ex sea passage 17,817 37.1 32.5%
99. To understand these data, it i s important to note that most input dealers met during the data collection specifically commented on the high cost o f sea freight and port charges in Cameroon as a major constraint to their operations. One trader, for example, specifically remarked that the costs are at least 20% higher compared with Cotonou where he also does business. In part, this i s because Douala i s a smaller port with less freight, but the high costs were also said to relate to fundamental inefficiencies and outdated infrastructure. One specific problem i s that the gantries at Douala can only handle loads up to about 25 M T meaning that most trade i s restricted to 20-foot containers even though lower per M T rates are usually available for larger 40-foot containers. Charges for customs inspection and freight forwarding also seem to be high in Cameroon. Compared with Zambia, for example, the standard charge by freight forwarders for border clearance i s around 2-3% o f the consignment’s value compared with the estimate o f 5.2% for Cameroon shown above.
20

100. Customs duties, import taxes, and VAT are a second major determinant o f agriculture input prices. Details o f these charges for selected inputs are set out in the table below. In addition to customs duty, other taxes including a computer tax, regional integration tax, and Ohada tax equal to a combined 2.45% o f the CIF price are added to al l imports from outside the CEMAC region. V A T in Cameroon i s also significant at 19.25%. Since the value chain analysis was prepared, a recent policy change exempted al l agriculture inputs from VAT. The pol icy change does not extend to other value chain inputs l ike vehicles used for commodity transport, steel to manufacture farm tools, processing equipment, and office supplies that ultimately account for a large share o f total value at the final distribution point.I6 In the case o f day old chicks, for example, the VAT reduction was figured to equal around XAF 2.00 per bird, which i s less than 1% o f total SV at the hatchery gate.
Table 6: Selected Impor t Tariffs and other T a x Rates in Cameroon Customs Other taxes VAT
Duty on CIF* (incl CAC) Fertilizer 5% 2.45% 0% Agrl-chemicals
Insecticides 20% 2.45% 19.25% Herbicides, other 5% 2.45% 0%
Light truck (2.5mt) 20% 2.45% 19.25% Heavy truck (15mt) 10% 2.45% 19.25%
Grain bags 30% 2.45% 19.25% Hand tools 20% 2.45% 19.25% Steel (for local tools) 20% 2.45% 19.25% Knapsack sprayer 10% 2.45% 19.25%
Vehicles
Farm Equipment
Tractors 8 Attachments Tractors (new) 10% 2.45% 0.00% Tractors (used) 10% 2.45% 19.25% Machine attachments 10% 2.45% 19.25%
Breeder chicks 5% 2.45% + phyto 19.25% Vaccinations 5 % 2.45% 0% Curative treatments 0% 2.45% 0%
Poultry Inputs
Poultry incubators 10% 2.45% 19.25% Applies to all imports from outside CEMAC.
101. Even with the change in VAT policy, Cameroon may s t i l l be regarded as having a relatively high tax structure. Fertilizer, for example, did not attract VAT in the original policy framework, but other domestic taxes including customs duty, excess charges on non-CEMAC imports, taxes o n transportation, and taxes on dealer prof i t margins meant that the total tax burden worked out to 43% to 59% o f DVA depending on the distribution channel and final place o f use. By comparison, calculations for the C C A A study in Nigeria, Mozambique, and Zambia study shows that tax as a share o f DVA works out to just 5%, 11%, and 18% re~pective1y.l~
The effects o f the pol icy change o n VAT could not be fully accounted for in the value chain analysis since the announcement was made some months after the quantitative work was complete. Table 4 s t i l l reflects the o ld VAT regime.
Keyser, John C (2008). ComDetitive Commercial Agriculture in Afr ica fCCAA) Synthesis o f Quantitative Results. The Wor ld Bank, Environmental, Rural and Social Development Unit, Washington DC.
16
17
21
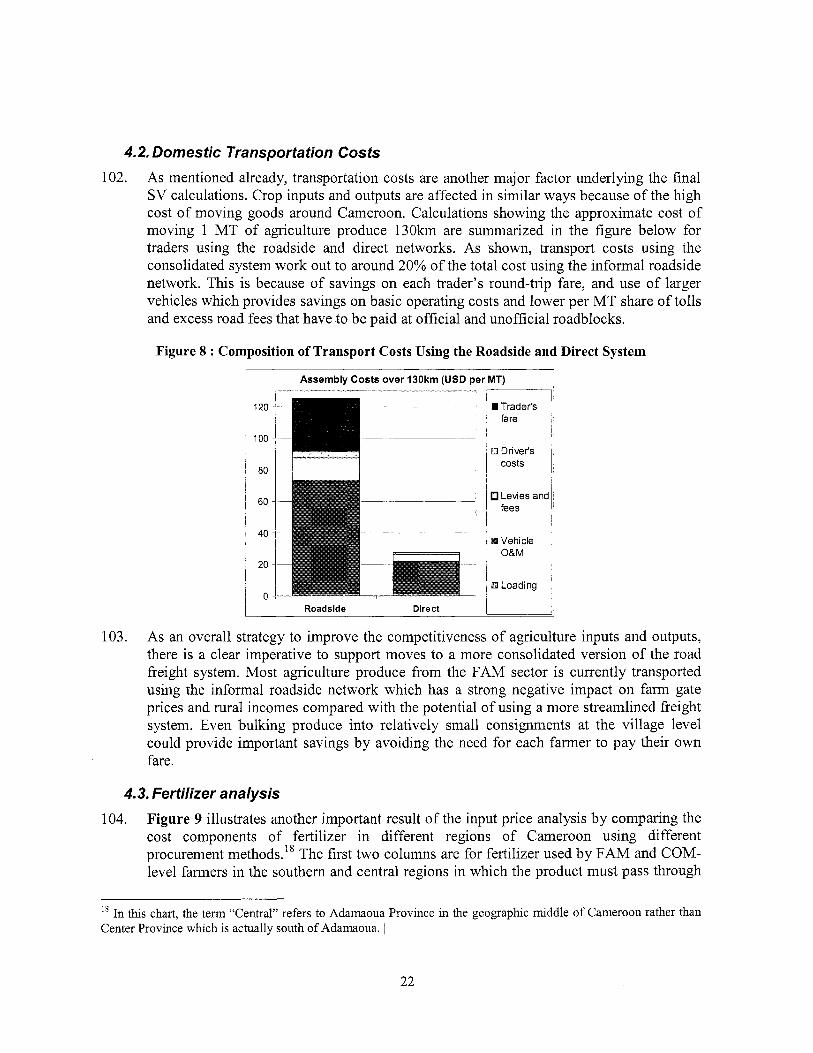
4.2. Domestic Transportation Costs 102. As mentioned already, transportation costs are another major factor underlying the final
SV calculations. Crop inputs and outputs are affected in similar ways because o f the high cost o f moving goods around Cameroon. Calculations showing the approximate cost o f moving 1 MT o f agriculture produce 130km are summarized in the figure below for traders using the roadside and direct networks. As shown, transport costs using the consolidated system work out to around 20% o f the total cost using the informal roadside network. This i s because o f savings on each trader’s round-trip fare, and use o f larger vehicles which provides savings on basic operating costs and lower per MT share o f tolls and excess road fees that have to be paid at official and unofficial roadblocks.
Figure 8 : Composition o f Transport Costs Using the Roadside and Direct System
Assembly Costs over 130km (USD per MT)
’ i 8 0 H - i -
I Roadside Direct
- I Trader‘s
fare
0 Driver’s costs
Levies and fees
Vehicle
$3 Loading
103. As an overall strategy to improve the competitiveness o f agriculture inputs and outputs, there i s a clear imperative to support moves to a more consolidated version of the road freight system. Most agriculture produce from the FAM sector i s currently transported using the informal roadside network which has a strong negative impact on farm gate prices and rural incomes compared with the potential o f using a more streamlined freight system. Even bulking produce into relatively small consignments at the village level could provide important savings by avoiding the need for each farmer to pay their own fare.
4.3. Fertilizer analysis 104. Figure 9 illustrates another important result o f the input price analysis by comparing the
cost components o f fertilizer in different regions o f Cameroon using different procurement methods.” The f i rst two columns are for fertilizer used by FAM and COM- level farmers in the southern and central regions in which the product must pass through
In th i s chart, the term “Central” refers to Adamaoua Province in the geographic middle o f Cameroon rather than 18
Center Province which i s actually south o f Adamaoua. 1
22

the local wholesale and retail network and the last three columns look at the cost o f direct imports by an AGI.
105. Taken together, the fertilizer price analysis suggests there may be good potential for reducing the cost o f this important input through investments that help streamline the distribution system. Although individual wholesalers and retailers reported charging relatively modest mark-ups o f only 2-5%, the number o f middle-men involved in the distribution chain results in much higher costs compared with direct imports by large- scale AGIs. As shown, the estimated price o f fertilizer imported by SODECOTON and transported 1,200km from Douala to Garoua in the north works out about the same compared to fertilizer bought from a small retailer in southern Cameroon.
Figure 9 : Fertilizer Financial and Value Chain Price Build-up
Fertilizer Price Build-up (USD per MT) i 700 Dealer Mark-
600
500
400
300
200
100
n
South Central AGI- AGI- Cotton FAWCOM south central
700
600
500
400
300
200
100
0
Fertilizer Price Build-up (USD per MT) I
South Central AGI- AGI- Cotton FAWCOM south central
3 Duties and tax
I Domestic
4.4. Cost Composition of other Inputs 106. The next table shows the relative price build-up o f different agriculture inputs in percent
terms. This analysis helps focus attention on areas where changes in policy or investment in new distribution systems could have the greatest impact on final consumer prices. Because foreign costs are largely beyond Cameroon’s capacity to control, i t i s particularly interesting to look at the top portion o f each bar in the graph below where components o f DVA are measured.
107. A s shown, foreign costs, account for the majority o f total value for each o f the inputs analyzed. With respect to insecticides, farm machinery, and vehicles, however, domestic costs and mark-ups, duties and tax, and are s t i l l important and account for 30-40% o f total SV as shown. Investments that help reduce these costs (such as the elimination o f V A T on insecticides) could therefore contribute to improved competitiveness by making inputs more affordable and helping farmers improve to more advanced management levels.
23
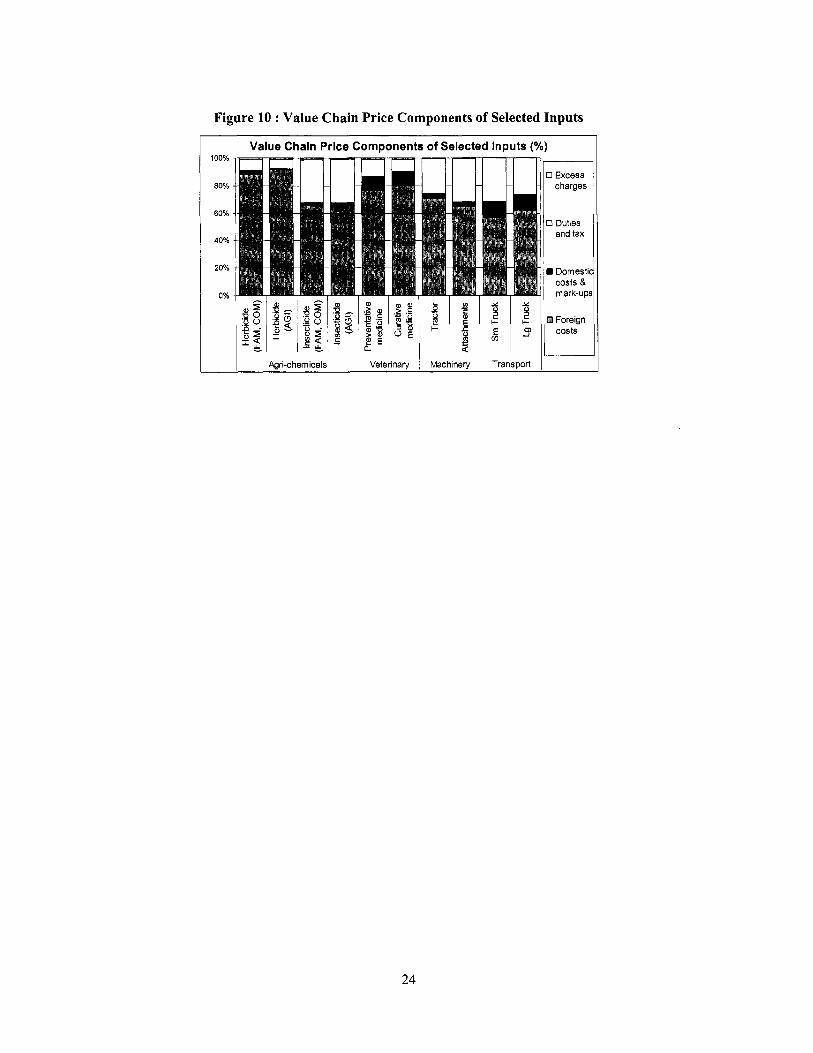
Figure 10 : Value Chain Price Components o f Selected Inputs
100%
80%
60%
40%
20%
Value Chain Price Components of Selected Inputs (%)
Agn-chemicals eterinary Machinery Transport
24
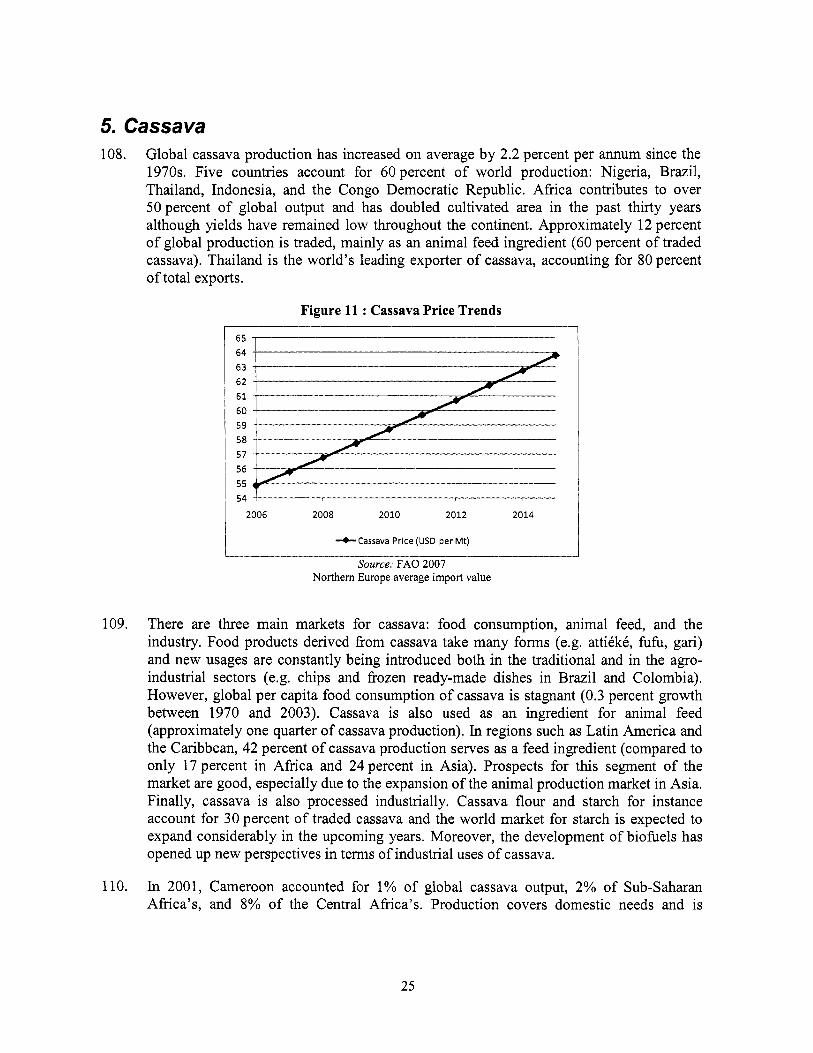
5. Cassava 108. Global cassava production has increased o n average by 2.2 percent per annum since the
1970s. Five countries account for 60 percent o f wor ld production: Nigeria, Brazil, Thailand, Indonesia, and the Congo Democratic Republic. Afr ica contributes to over 50percent o f global output and has doubled cultivated area in the past thirty years although yields have remained low throughout the continent. Approximately 12 percent o f global production i s traded, mainly as an animal feed ingredient (60 percent o f traded cassava). Thailand i s the world’s leading exporter o f cassava, accounting for 80 percent o f total exports.
Figure 11 : Cassava Price Trends
65 64 63 62 61 60 59 58 57 56 55 54
2006 2008 2010 2012 2014
+Cassava Price (USD per Mt)
Source: FA0 2007 Northern Europe average import value
109. There are three main markets for cassava: food consumption, animal feed, and the industry. Food products derived from cassava take many forms (e.g. attikkC, fuh, gari) and new usages are constantly being introduced both in the traditional and in the agro- industrial sectors (e.g. chips and frozen ready-made dishes in Brazi l and Colombia). However, global per capita food consumption o f cassava is stagnant (0.3 percent growth between 1970 and 2003). Cassava i s also used as an ingredient for animal feed (approximately one quarter o f cassava production). In regions such as Latin America and the Caribbean, 42 percent o f cassava production serves as a feed ingredient (compared to only 17 percent in Afr ica and 24 percent in Asia). Prospects for this segment o f the market are good, especially due to the expansion o f the animal production market in Asia. Finally, cassava i s also processed industrially. Cassava flour and starch for instance account for 30 percent o f traded cassava and the world market for starch i s expected to expand considerably in the upcoming years. Moreover, the development o f biofbels has opened up new perspectives in terms o f industrial uses o f cassava.
110. In 2001, Cameroon accounted for 1% o f global cassava output, 2% o f Sub-Saharan Africa’s, and 8% o f the Central Africa’s. Production covers domestic needs and i s
25

currently increasing despite soil degradation and productivity de~1 ine . l~ At 9-1 5 tons per hectare, average FAM yields are not particularly low in Cameroon compared to other African countries: average per hectare yields reported by the C C A A amount to 3 tons in Nigeria, 1.33 in Mozambique, and 4 tons in Zambia for family farmers. However, as the models from each country are based on tubers with different (and mostly unspecified) moisture content, the yield estimates and cost per ton figures need to be treated with caution. To improve production, Cameroon launched a National Program for the Development o f Roots and Tubers (PNDRT) in 2004 to enhance returns to the production o f crops such as cassava.
......................................
independent Traders or farmers (3)
(4)
j ASSEMBLY i
11 1. Small farmers (FAM low) produce approximately 63 percent o f domestic cassava output. Larger-scale producers (COM) contribute to about 20 percent o f total production and medium-scale farmers (FAM high) to the remaining 17 percent. Both medium and large- scale producers tend to use improved inputs, such as new cultivars developed by the DUD, contrary to smallholders. In addition to services provided by public institutions, some NGOs supply extension services promoting new varieties o f cassava plants and processing techniques. Cassava production i s predominantly home-consumed and transformed on-farm through traditional methods. However, medium and, to a lesser extent, small-scale farmers sell part o f their production either themselves on local markets or through intermediaries when the end market i s urban centers. Large-scale farmers trade the bulk o f their output to intermediaries who in turn sell the produce to factories which process cassava industrially. Figure 12 displays Cameroon’s cassava value chain.
Figure 12 : Cassava Value Chain Diagram
...................................... 1-1 ...........................................
112. Because Cameroon’s neighbors have not invested in agriculture production to the same extent, there are particularly good export opportunities for traditional food products like bobolo which are in strong demand in Gabon, Equatorial Guinea, and Central Afr ica
l9 FA0
26
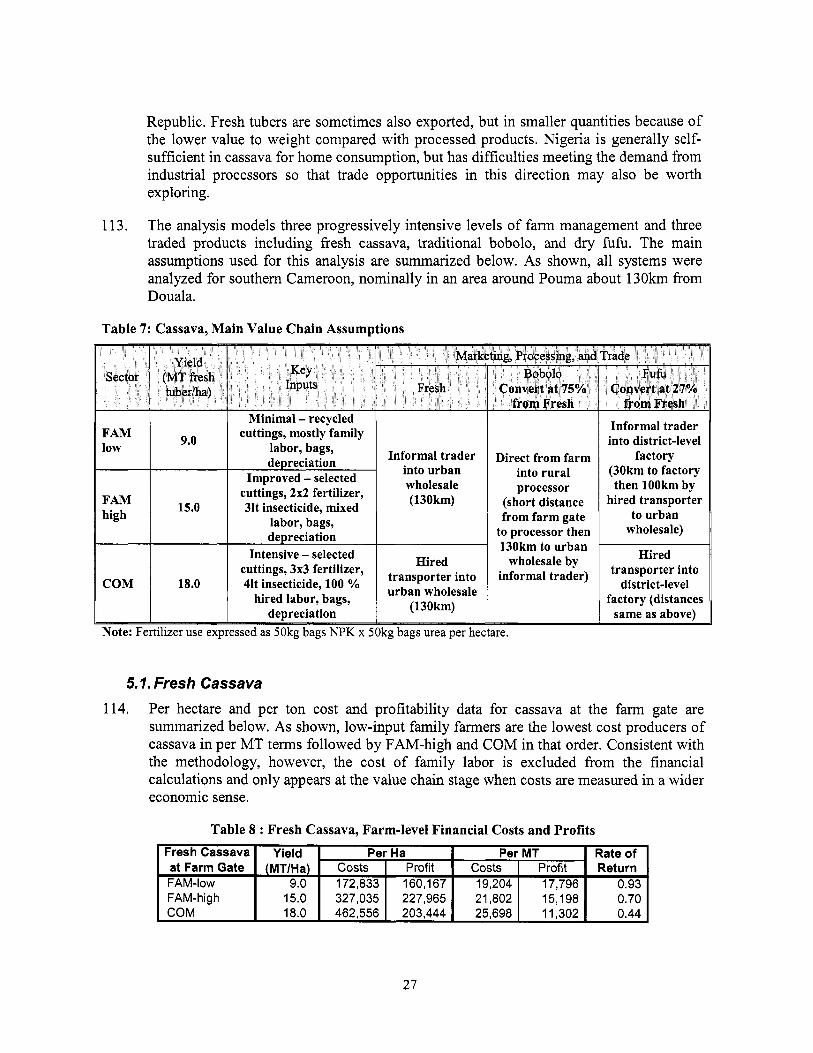
Republic. Fresh tubers are sometimes also exported, but in smaller quantities because of the lower value to weight compared with processed products. Nigeria i s generally self- sufficient in cassava for home consumption, but has difficulties meeting the demand from industrial processors so that trade opportunities in this direction may also be worth exploring.
Fresh Cassava at Farm Gate FAM-low FAM- h i g h COM
113. The analysis models three progressively intensive levels o f farm management and three traded products including fresh cassava, traditional bobolo, and dry fufu. The main assumptions used for this analysis are summarized below. As shown, al l systems were analyzed for southern Cameroon, nominally in an area around Pouma about 13Okm from Douala.
Yield Per Ha Per MT Rate of (MTIHa) Costs Profit costs Profit Return
9.0 172,833 160,167 19,204 17,796 0.93 15.0 327,035 227,965 21,802 15,198 0.70 18.0 462,556 203,444 25,698 11,302 0.44
Table 7: Cassava, Main Value Chain Assumptions
In fo rmal trader into u rban wholesale (130km)
M in ima l - recycled 1 cuttings, mostly family
labor, bags, depreciation
Improved - selected cuttings, 2x2 fertilizer,
15.0 31t insecticide, mixed labor, bags,
II depreciation
9.0 FAM low
II
PAM h igh
H i red transporter into urban wholesale
(130km)
Intensive - selected cuttings, 3x3 fertilizer, 41t insecticide, 100 YO
hired labor, bags, depreciation
COM 18.0
Note: Ferti l izer use expressed as 50kg bags NPK x 50kg bags urea per=
5.7. Fresh Cassava
Direct f r o m f a r m into r u r a l processor
(short distance f rom f a r m gate
to processor then 130km to u rban
wholesale by informal trader)
re.
In fo rmal trader into district-level
factory (30km to factory then lOOkm by
hired transporter to u rban
wholesale)
Hired transporter into
district-level factory (distances
same as above)
114. Per hectare and per ton cost and profitability data for cassava at the farm gate are summarized below. As shown, low-input family farmers are the lowest cost producers o f cassava in per MT terms followed by FAM-high and C O M in that order. Consistent with the methodology, however, the cost o f family labor i s excluded from the financial calculations and only appears at the value chain stage when costs are measured in a wider economic sense.
27
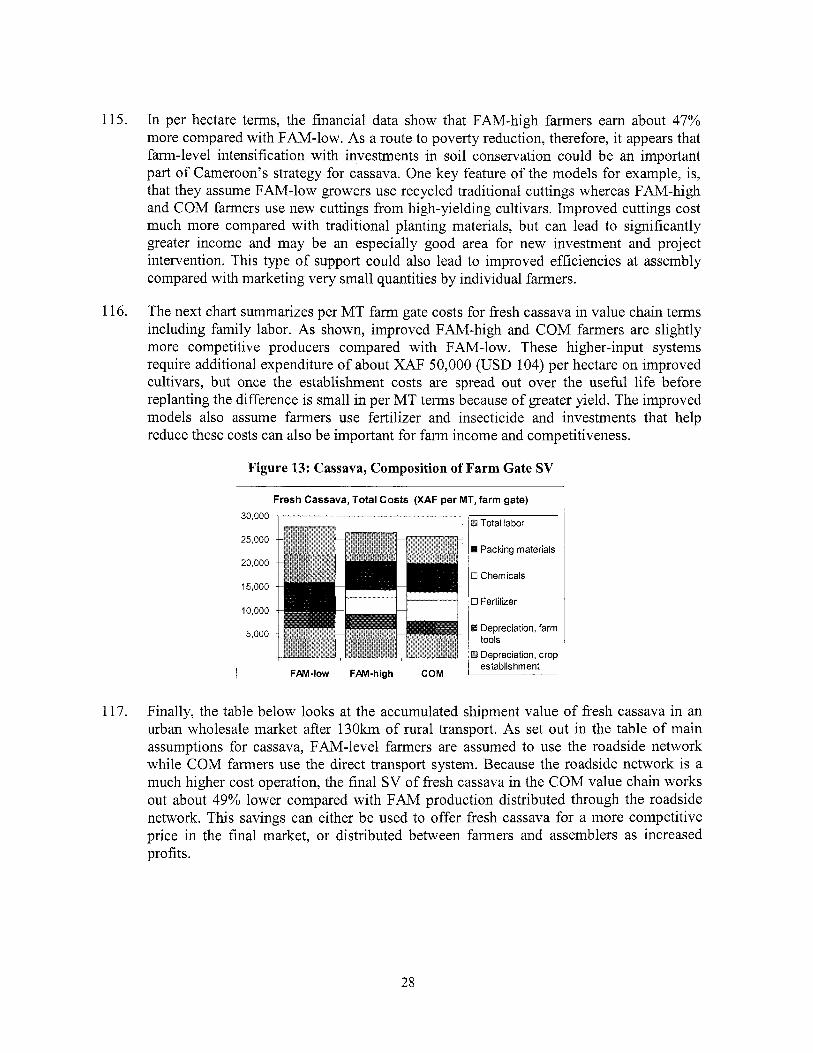
115. In per hectare terms, the financial data show that FAM-high farmers earn about 47% more compared with FAM-low. As a route to poverty reduction, therefore, i t appears that farm-level intensification with investments in soil conservation could be an important part o f Cameroon's strategy for cassava. One key feature o f the models for example, is, that they assume FAM-low growers use recycled traditional cuttings whereas FAM-high and C O M farmers use new cuttings from high-yielding cultivars. Improved cuttings cost much more compared with traditional planting materials, but can lead to significantly greater income and may be an especially good area for new investment and project intervention. This type o f support could also lead to improved efficiencies at assembly compared with marketing very small quantities by individual farmers.
116. The next chart summarizes per MT farm gate costs for fresh cassava in value chain terms including family labor. As shown, improved FAM-high and C O M farmers are slightly more competitive producers compared with FAM-low. These higher-input systems require additional expenditure o f about XAF 50,000 (USD 104) per hectare on improved cultivars, but once the establishment costs are spread out over the useful l i fe before replanting the difference i s small in per MT terms because o f greater yield. The improved models also assume farmers use fertilizer and insecticide and investments that help reduce these costs can also be important for farm income and competitiveness.
Figure 13: Cassava, Composition of Farm Gate SV
117.
Fresh Cassava, Total Costs (XAF per MT, farm gate) 1 Packing materials
Chemicals
Fertilizer
Depreciation, farm tools Depreciation, crop
30,000
25,000
20,000
15,000
10,000
5,000
I FAM-low FAM-high COM
Finally, the table below looks at the accumulated shipment value o f fresh cassava in an urban wholesale market after 130km o f rural transport. As set out in the table o f main assumptions for cassava, FAM-level farmers are assumed to use the roadside network while C O M farmers use the direct transport system. Because the roadside network i s a much higher cost operation, the final SV o f fresh cassava in the C O M value chain works out about 49% lower compared with FAM production distributed through the roadside network. This savings can either be used to offer fresh cassava for a more competitive price in the final market, or distributed between farmers and assemblers as increased profits.
28
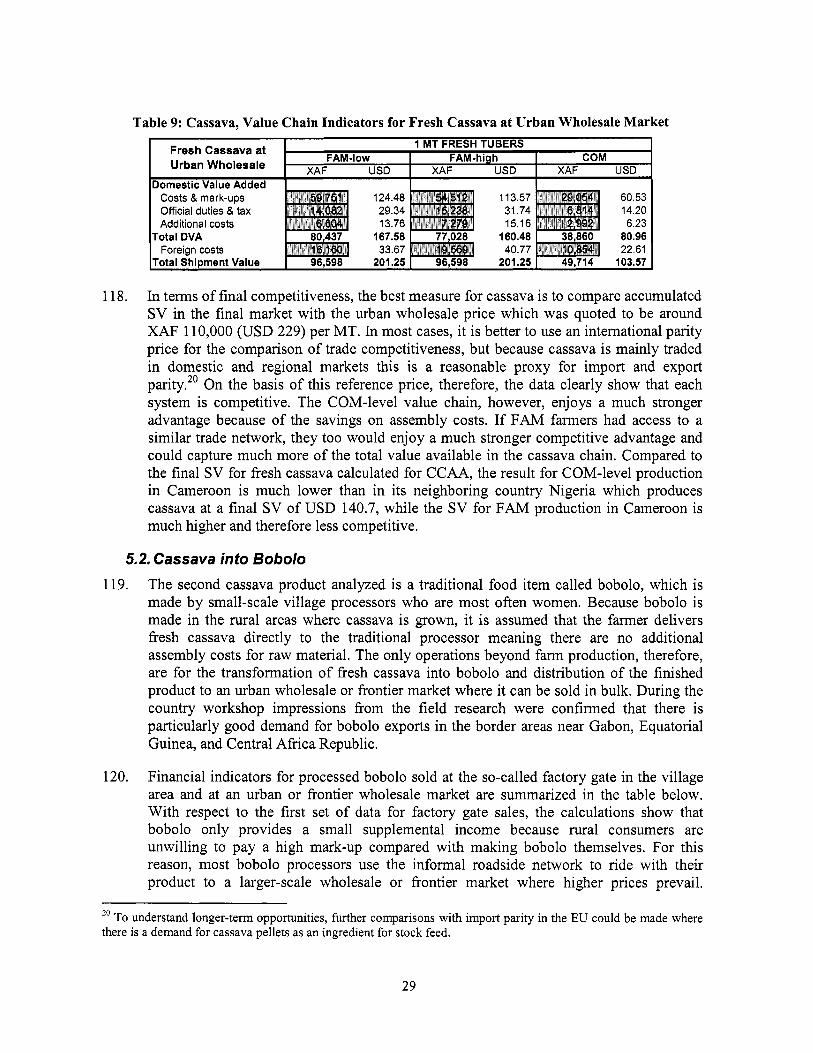
Table 9: Cassava, Value Chain Indicators for Fresh Cassava at Urban Wholesale Market
Total Shiament Value
118. In terms o f final competitiveness, the best measure for cassava i s to compare accumulated SV in the final market with the urban wholesale price which was quoted to be around XAF 110,000 (USD 229) per MT. In most cases, i t i s better to use an international parity price for the comparison o f trade competitiveness, but because cassava i s mainly traded in domestic and regional markets this i s a reasonable proxy for import and export parity.20 On the basis o f this reference price, therefore, the data clearly show that each system i s competitive. The COM-level value chain, however, enjoys a much stronger advantage because o f the savings on assembly costs. If FAM farmers had access to a similar trade network, they too would enjoy a much stronger competitive advantage and could capture much more o f the total value available in the cassava chain. Compared to the final SV for fresh cassava calculated for CCAA, the result for COM-level production in Cameroon i s much lower than in its neighboring country Nigeria which produces cassava at a final SV o f U S D 140.7, while the SV for FAM production in Cameroon i s much higher and therefore less competitive.
5.2. Cassava into Bobolo 119. The second cassava product analyzed i s a traditional food item called bobolo, which i s
made by small-scale village processors who are most often women. Because bobolo i s made in the rural areas where cassava i s grown, i t i s assumed that the farmer delivers fresh cassava directly to the traditional processor meaning there are no additional assembly costs for raw material. The only operations beyond farm production, therefore, are for the transformation o f fresh cassava into bobolo and distribution o f the finished product to an urban wholesale or frontier market where it can be sold in bulk. During the country workshop impressions from the field research were confirmed that there i s particularly good demand for bobolo exports in the border areas near Gabon, Equatorial Guinea, and Central Afr ica Republic.
120. Financial indicators for processed bobolo sold at the so-called factory gate in the village area and at an urban or frontier wholesale market are summarized in the table below. With respect to the f i rst set o f data for factory gate sales, the calculations show that bobolo only provides a small supplemental income because rural consumers are unwilling to pay a high mark-up compared with making bobolo themselves. For this reason, most bobolo processors use the informal roadside network to ride with their product to a larger-scale wholesale or frontier market where higher prices prevail.
2o To understand longer-term opportunities, further comparisons with import parity in the EU could be made where there i s a demand for cassava pellets as an ingredient for stock feed.
29
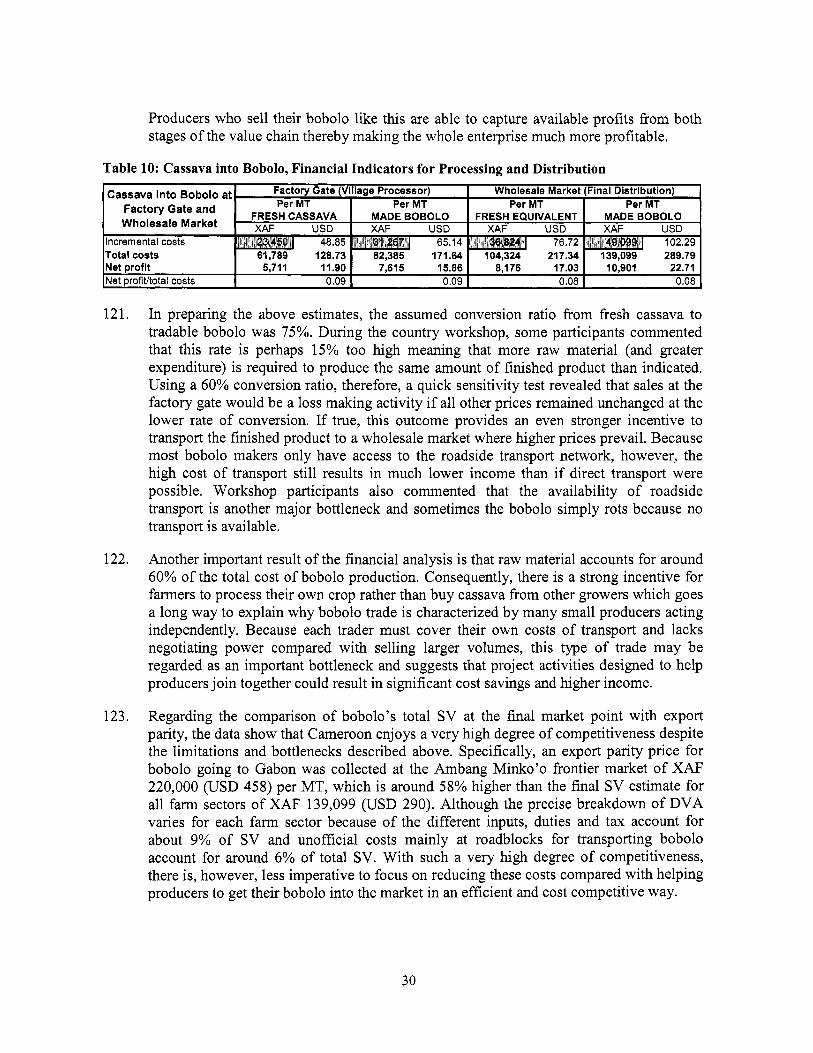
Producers who sell their bobolo l i ke this are able to capture available profits from both stages o f the value chain thereby making the whole enterprise much more profitable.
Table 10: Cassava into Bobolo, Financial Indicators for Processing and Distribution
Cassava into Bobolo at 1 2 Factory Gate and Wholesale Market
Incremental costs Total costs Net profit I 5,711 11.90 I 7,615 15.86 I 8,176 17.03 I 10,901 22.71 Net orofitltotal costs 0.09 I 0.09 I 0.08 I 0.08
121.
122.
123.
In preparing the above estimates, the assumed conversion ratio from fresh cassava to tradable bobolo was 75%. During the country workshop, some participants commented that this rate i s perhaps 15% too high meaning that more raw material (and greater expenditure) i s required to produce the same amount o f finished product than indicated. Using a 60% conversion ratio, therefore, a quick sensitivity test revealed that sales at the factory gate would be a loss making activity if al l other prices remained unchanged at the lower rate o f conversion. If true, this outcome provides an even stronger incentive to transport the finished product to a wholesale market where higher prices prevail. Because most bobolo makers only have access to the roadside transport network, however, the high cost o f transport s t i l l results in much lower income than if direct transport were possible. Workshop participants also commented that the availability o f roadside transport i s another major bottleneck and sometimes the bobolo simply rots because no transport i s available.
Another important result o f the financial analysis i s that raw material accounts for around 60% o f the total cost o f bobolo production. Consequently, there i s a strong incentive for farmers to process their own crop rather than buy cassava from other growers which goes a long way to explain why bobolo trade i s characterized by many small producers acting independently. Because each trader must cover their own costs o f transport and lacks negotiating power compared with selling larger volumes, this type o f trade may be regarded as an important bottleneck and suggests that project activities designed to help producers j o i n together could result in significant cost savings and higher income.
Regarding the comparison o f bobolo’s total SV at the final market point with export parity, the data show that Cameroon enjoys a very high degree o f competitiveness despite the limitations and bottlenecks described above. Specifically, an export parity price for bobolo going to Gabon was collected at the Ambang Minko’o frontier market o f XAF 220,000 (USD 458) per MT, which i s around 58% higher than the final SV estimate for a l l farm sectors o f XAF 139,099 (USD 290). Although the precise breakdown o f DVA varies for each farm sector because o f the different inputs, duties and tax account for about 9% o f SV and unofficial costs mainly at roadblocks for transporting bobolo account for around 6% o f total SV. With such a very high degree o f competitiveness, there is, however, less imperative to focus on reducing these costs compared with helping producers to get their bobolo into the market in an efficient and cost competitive way.
30

5.3. Cassava into Fufu 124. The third cassava product analyzed here is dry fufu. In this case, the value chain analysis
includes assembly o f fresh cassava at a small, modem factory in a district town, transformation o f cassava into fufu, and distribution o f the final product to an urban wholesale market or other final location.
125. The f i rst assembly operation for fresh cassava i s based on a 30km delivery distance in which FAM farmers use the roadside trade network and C O M farmers hire a less expensive dedicated transporter because they are assumed to have larger volumes they have to sell. Per MT cost and profitability data are summarized below and show that assembly using the informal i s a loss-making activity at prices paid by the factory. Long- term, o f course, these losses are not sustainable and factory managers met during data collection reported that one o f their biggest problems i s acquiring sufficient raw materials due to the high cost o f local transport. To attract more raw materials the factory either needs to increase its price or invest in new assembly arrangements based on consolidated COM-type collection.
Table 11 : Cassava into Fufu, per MT Assembly Level Costs and Profitability for Roadside and Direct Transport Networks over 30km Delivery Distance
FAM-low and Assembly of Fresh Cassava for Fufu
126. From the financial perspective, therefore, there i s l i t t le doubt that crop assembly i s one o f the most important bottlenecks to the viability o f district-level fuh production and an important area where strategic investment could make a real difference to this value chain. Obviously, one o f the f i rst requirements for any factory to succeed is to ensure a steady supply o f raw material, and investments in this part o f the value chain for fifu appear to be critically important.
127. The next part o f the value chain for fufu i s the actual processing operation. Data for this part o f the analysis were provided by a small factory in Pouma that was established as a women’s project with help from a UN development agency. In addition to dry hfu, the plant also produces gari and starch. Cost estimates for fufu were extrapolated from financial data provided by the factory managers but it was sometimes difficult to distinguish which costs applied to what product.*l With this limitation in mind, per MT financial costs and profitability data for fufu are summarized below based o n an outturn ratio o f 27%.
Any future project to support to fufu processing would want to consider these costs in much better detail. 21
31

Table 12: Cassava into Fufu, Processing-level Financial Indicators
I I Per MT I Per MT i Cassava into Fufu
Net profit I 54,903 114.38 I 203,344 423.63 Net profitltotal costs 0.94 I 0.94
128. As shown, fufu production appears to be extremely profitable in per MT terms. Although the cost assumptions should be validated with more caref i l research, the rough data used here appear to suggest that plant managers could offer higher price for fresh tubers to solve the problem o f having enough thru-put to sustain their operation. Indeed, without sufficient tubers, very different processing costs would apply. Salaries and other fixed overheads, for example, were found to account for around 60% o f the factory’s total expenditure and the enterprise could easily become a loss-maker without enough thru-put to cover these costs.
129. In terms o f final competitiveness, the SV for made fufu works out to XAF 427,964 (USD 892) per MT at an urban or frontier wholesale market before the final vendor’s prof i t margin. As with other commodities, this value is the same for each sector because the commodity i s bought and sold for the same price regardless o f whether the cassava was grown by the FAM or C O M sector. This SV figure can be compared with the selling price o f fufi in the Douala wholesale market, which was found to be around XAF 500,000 (USD 1,041) per M T or about 17% greater than the estimated shipment value showing that the value chain is reasonably competitive. O f the S V figure, foreign costs only account for 7- 10% o f total costs suggesting there is good potential for improving the competitiveness situation by focusing on domestic policies and process improvements alone. Taxes only equal 8-10% o f final DVA and most domestic cost are for labor, trader profit margins, and fares during roadside transport which are in turn the areas that could be improved or streamlined to achieve better value chain performance.
32

6. Cotton 130. World cotton production has increased steadily over the past few decades. According to
the FAO, average output grew from 14.4 mi l l ion tons in 1979-1980 to 24.1 million in 2004-2005. This sharp increase i s due in large part to the adoption o f new biotech varieties in some countries which boosted yields, but also from subsidy policies o f large producing countries such as the United States, China, and the European Union. Cotton prices underwent a downward trend in the past few decades.22 The FA0 does not foresee a substantial increase in prices, mostly because o f the expected expansion o f the global production area and because o f the price competitiveness o f synthetic fibers. A price forecast by the World Bank i s depicted in Figure 14.
Figure 14 : World Cotton Prices in USD/kg
13 1. The largest impact on cotton prices in West Afr ica has had the appreciation o f the CFA franc against the USD. As shown in Figure 15, the world price in FCFA declined substantially between 2000 and 2006, almost 50%.
Figure 15: Evolution of World Prices in USD and FCFA
I I 1400
1200
1000
2 800
2 600
400
200
0
300
250
200 3 c _I USD/FCFA exchange rate 1
22 "Cotton: International Commodity Profile" (FA0 2007)
33
132. The five leading African producers are Benin, Burkina Faso, Mali, Cote d’Ivoire, and Cameroon. In Cameroon, seed cotton production amounted to over 100,000 MT in 2003 and 2004 and cotton exports represented between 20-25% o f total agriculture exports between 2000 and 2006. China absorbed about 30% o f Cameroon’s cotton exports and is, by far, i t s most important partner, followed by Pakistan (12%), Indonesia (7%), Bangladesh and India (6% each). In June 2006 Cameroon joined Benin, Burkina Faso, Mali, Chad, Cote d’Ivoire, Ghana, and Togo in a program to promote transgenic cotton in Africa to increase cotton output and help build an African textile industry. Cameroon has also piloted a program on organic cotton.
133. Production in Cameroon mainly takes place in the North and Far North provinces where the cotton system i s managed as a more or less vertically integrated enterprise by the parastatal firm, SODECOTON. 23 Although SODECOTON itself does not engage in direct field production, the firm enjoys official monopoly status on the purchase, processing, and marketing o f al l cotton in Cameroon and has important responsibilities for farmer extension, input procurement, and input distribution. Under this system, participating farmers receive improved seeds, pesticides, and fertilizer for use on cotton and the cost i s deducted by SODECOTON from the farmer’s payment. Cotton i s not irrigated in Cameroon and picking i s exclusively by hand.
134. After the farm stage, seed cotton is collected and transported by SODECOTON from one o f i t s mobile depots or storage points to a ginnery. Many farmers belong to village associations which are responsible for the collection o f output and i t s sale to SODECOTON. SODECOTON maintains nine ginneries in total and achieves a very satisfactory outturn o f lint at around 41%. Nigeria, by contrast, has a ginning outturn (GOT) o f only 37% and the rate in Mozambique i s just 35%. In Zambia, the GOT i s around 40.5%. After ginning, baled lint i s transported around 1,200km to the port o f Douala where it i s exported on the world market.24 Cottonseed and cottonseed o i l are consumed domestically as cake for animal feed or o i l for human consumption. Figure 16 shows the country’s cotton value chain.
23 A decision to privatize SODOCOTON was first taken by the Government in 1994, but has not been implemented until now. Although the privatization i s s t i l l on the agenda o f the Government no new decision has yet been made on the procedure or on the schedule. 24 Some smal l quantities are also used as an import substitute to supply Cameroon’s leading textile firm CICAM, Cotonnidre Industrielle du Cameroun.
34
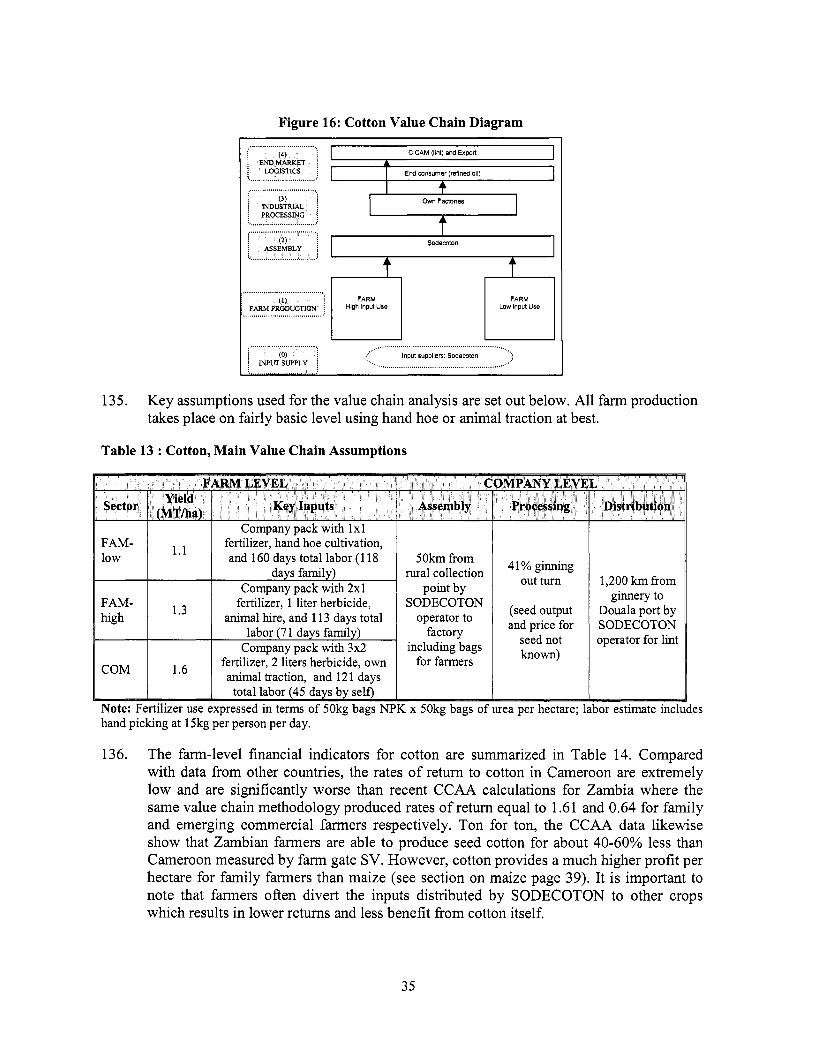
Figure 16: Cotton Value Chain Diagram
ClCAM (lint) and Export
End mnsumer (reflned oil) A
4 Orm Facfones
t Sodemton I
t t ...............................
.......................................
........................................................................
Low inpuf Use u 135. Key assumptions used for the value chain analysis are set out below. All farm production
takes place on fairly basic level using hand hoe or animal traction at best.
Table 13 : Cotton, Main Value Chain Assumptions
rural collection
SODECOTON
Note: Fertilizer use expressed in t e r n o f 50kg bags N P K x 50kg bags o f urea per hectare; labor estimate includes hand p ick ing at 15kg per person per day.
4 1 % ginning out turn
(seed output and price for
seed not known)
I
1,200 km from ginnery to
Douala port by SODECOTON operator for lint
136. The farm-level financial indicators for cotton are summarized in Table 14. Compared with data from other countries, the rates o f return to cotton in Cameroon are extremely l o w and are significantly worse than recent C C A A calculations for Zambia where the same value chain methodology produced rates o f return equal to 1.61 and 0.64 for family and emerging commercial farmers respectively. Ton for ton, the C C A A data likewise show that Zambian farmers are able to produce seed cotton for about 40-60% less than Cameroon measured by farm gate SV. However, cotton provides a much higher profit per hectare for family farmers than maize (see section on maize page 39). I t i s important to note that farmers often divert the inputs distributed by SODECOTON to other crops which results in lower returns and less benefit from cotton itself.
35
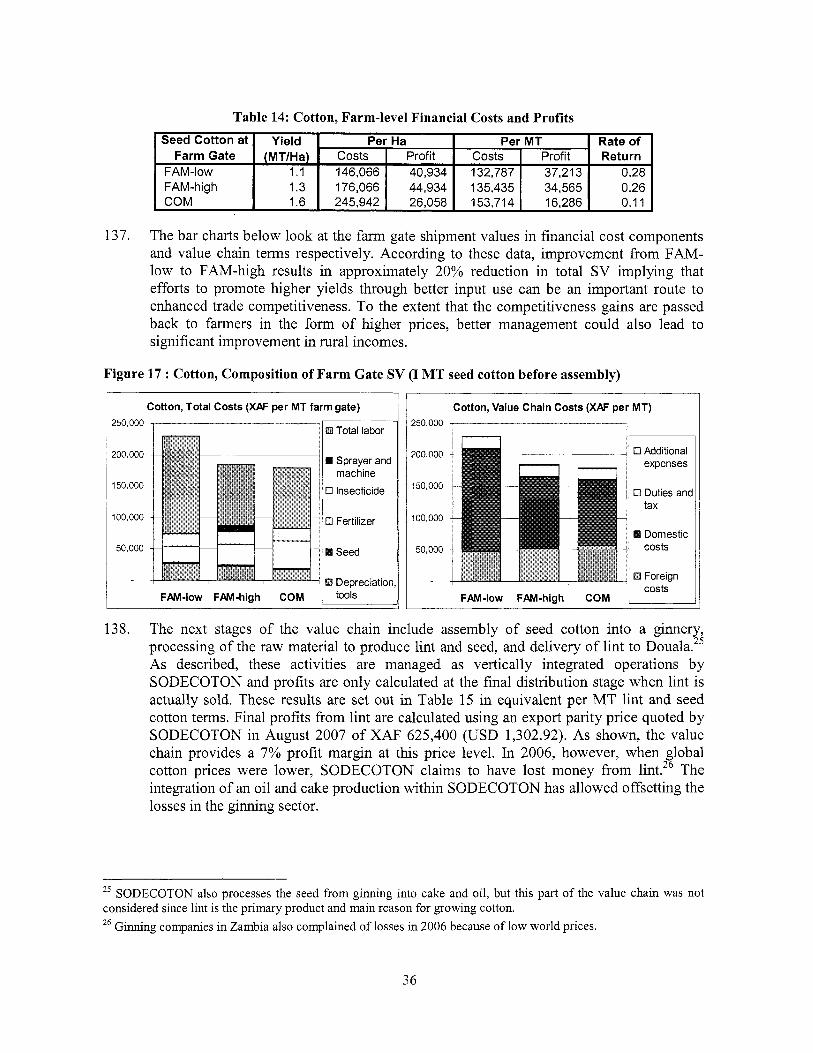
Table 14: Cotton, Farm-level Financial Costs and Profits
Return I
FAM-high 176,066 44,934 135,435 34,565 0.26 COM 245,942 26,058 153,714 16,286 0.1 1 I
137. The bar charts below look at the farm gate shipment values in financial cost components and value chain terms respectively. According to these data, improvement from F A M - low to FAM-high results in approximately 20% reduction in total SV implying that efforts to promote higher yields through better input use can be an important route to enhanced trade competitiveness. To the extent that the competitiveness gains are passed back to farmers in the form of higher prices, better management could also lead to significant improvement in rural incomes.
Figure 17 : Cotton, Composition o f Farm Gate SV (I M T seed cotton before assembly)
250,000
200,000
150,000
100,000
50,000
Cotton, Total Costs (W per MT farm gate) ~
Total labor
Sprayer and machine Insecticide
Fertilizer
Seed
GI Depreciation, I FAM-low FAM-high COM I 11
Cotton, Value Chain Costs (XAF per MT) 250,000
200,000
150,000
100,000
50,000
FAM-low FAM-high ' COM ' 1 138. The next stages o f the value chain include assembly o f seed cotton into a ginnery,
processing o f the raw material to produce lint and seed, and delivery o f lint to D ~ u a l a . ~ ~ As described, these activities are managed as vertically integrated operations by SODECOTON and profits are only calculated at the final distribution stage when lint i s actually sold. These results are set out in Table 15 in equivalent per MT lint and seed cotton terms. Final profits from lint are calculated using an export parity price quoted by SODECOTON in August 2007 o f XAF 625,400 (USD 1,302.92). As shown, the value chain provides a 7% profi t margin at th i s price level. In 2006, however, when global cotton prices were lower, SODECOTON claims to have lost money from lint.26 The integration o f an o i l and cake production within SODECOTON has allowed offsetting the losses in the ginning sector.
2s SODECOTON also processes the seed f rom ginning into cake and oil, but this part o f the value chain was not considered since lint i s the primary product and ma in reason for growing cotton. 26 Ginning companies in Zambia also complained o f losses in 2006 because o f l o w wor ld prices.
36

139. The deterioration in C F A prices for cotton has clearly put the financial sustainability of SODECOTON at risk. Another recent reportz7 prepared for the World Bank even argues that the sustainability o f the cotton sector in Cameroon depends on, i f world prices remain low, a downward adjustment o f producer prices. A decline o f producer prices wi l l however result in reduced investment in cotton production by farmers and increased poverty in the North o f Cameroon.
Table 15: Cotton, Financial Indicators for Assembly, Processing, and Distribution.
Note: At 41% ginning outturn, the value lint includes the value f rom 2.44 MT o f seed cotton.
140. Given Cameroon’s vulnerability to global prices, the data above are particularly u s e h l to identify possible leverage points to protect from this risk. Notwithstanding the potential for change at the farm level, the estimated breakdown o f costs for SODECOTON show that ton for ton more money i s spent on the delivery o f lint to Douala than any other stage. A relatively small reduction in transport costs, therefore, could have a greater impact on final competitiveness compared to investing in other operations. The importance o f primary assembly and ginning, however, are also critical to Cameroon’s final trade competitiveness and have a major bearing on the prices SODECOTON can afford to pay to farmers. As shown, ginning costs are the next significant after distribution and there may be immediate potential for improvement by investing in new equipment that i s cheaper to operate and/or results in an even higher GOT.
141. The next chart summarizes the total SVs for each cotton value chain at the farm gate, assembly, out o f factory, and distribution stages. Although these data show that the total SV o f lint delivered to the Port o f Douala eventually works out the same for al l farm sectors once the selling price o f that product i s taken into account, C O M and FAM-high farmers s t i l l appear to be the most competitive because o f the lower total SV at the assembly and processing stages. One strategy to cope with l o w global market prices, therefore, appears to be to help low-input farmers adopt improved technologies that more closely resemble the FAM-high and or C O M models instead. In practice, this is likely to come down to investments in farmer extension and input packages. The introduction o f G M O cotton could also be considered2*.
27 Nicolas Gergely, Cameroon Country Study, prepared for Multi-Country Review o f the Impact o f Cotton Sector Reform in Sub-Saharan Africa, M a r c h 2007 28 GMO cotton was not analyzed in this study, but could be a direct route to increased incomes by providing higher yield at lower cost (less sensitive to planting time, reduced vulnerabil ity to drought, less need for insecticides, etc).
37

Figure 18: Cotton, Total Value Chain Costs by Production Stage and F a r m Sector
Cotton, Total Value Chain Costs (XAF per MT product shown) - . ".__^ - -__I 600,000
500,000
400,000
300,000
200,000
100,000
I FAM-Low 1 FAM-high 1 COM
142. In terms o f the final parity price comparison, the final SV o f cotton lint at the Douala works out to XAF 582,485 (USD 1,215.51) per M T which i s just 7% less than the current parity price o f XAF 625,400 (USD 1,302.92) reported by SODECOTON. This result shows that Cameroon i s competitive at global prices, but with a very thin margin between total SV and export parity. I t i s interesting to note, that compared to the African C C A A countries Cameroon's competitiveness edge o f U S D 87.41 i s relatively large. Mozambique, Nigeria, and Zambia are al l below that with respective margins o f USD 85, USD 30, and U S D 40 between final SVs and export parity prices.
38
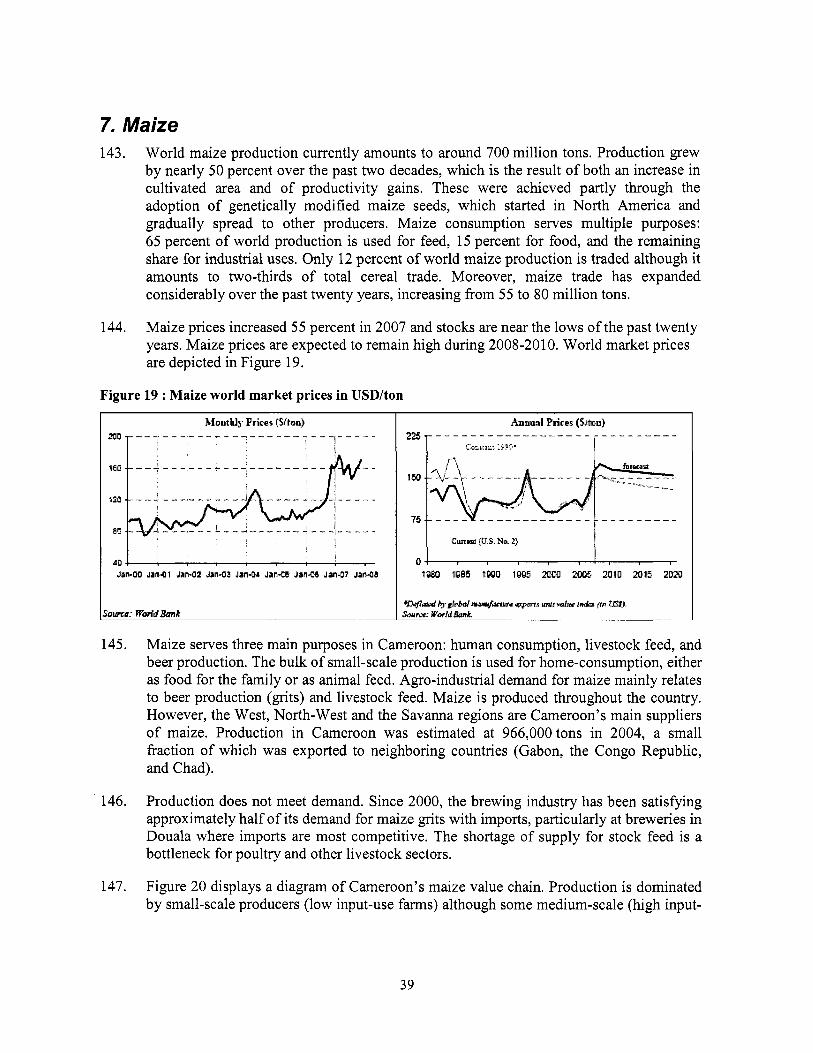
7. Maize 143. World maize production currently amounts to around 700 mi l l ion tons. Production grew
by nearly 50 percent over the past two decades, which i s the result o f both an increase in cultivated area and o f productivity gains. These were achieved partly through the adoption o f genetically modified maize seeds, which started in North America and gradually spread to other producers. Maize consumption serves multiple purposes: 65 percent o f world production i s used for feed, 15 percent for food, and the remaining share for industrial uses. Only 12 percent o f wor ld maize production i s traded although it amounts to two-thirds o f total cereal trade. Moreover, maize trade has expanded considerably over the past twenty years, increasing from 55 to 80 million tons.
144. Maize prices increased 55 percent in 2007 and stocks are near the lows o f the past twenty years. Maize prices are expected to remain high during 2008-2010. World market prices are depicted in Figure 19.
Figure 19 : Maize world market prices in USD/ton
145.
146.
147.
Maize serves three main purposes in Cameroon: human consumption, livestock feed, and beer production. The bulk o f small-scale production i s used for home-consumption, either as food for the family or as animal feed. Agro-industrial demand for maize mainly relates to beer production (grits) and livestock feed. Maize i s produced throughout the country. However, the West, North-West and the Savanna regions are Cameroon’s main suppliers o f maize. Production in Cameroon was estimated at 966,000 tons in 2004, a small fraction o f which was exported to neighboring countries (Gabon, the Congo Republic, and Chad).
Production does not meet demand. Since 2000, the brewing industry has been satisfying approximately half o f i t s demand for maize gr i ts with imports, particularly at breweries in Douala where imports are most competitive. The shortage o f supply for stock feed i s a bottleneck for poultry and other livestock sectors.
Figure 20 displays a diagram o f Cameroon’s maize value chain. Production i s dominated by small-scale producers (low input-use farms) although some medium-scale (high input-
39
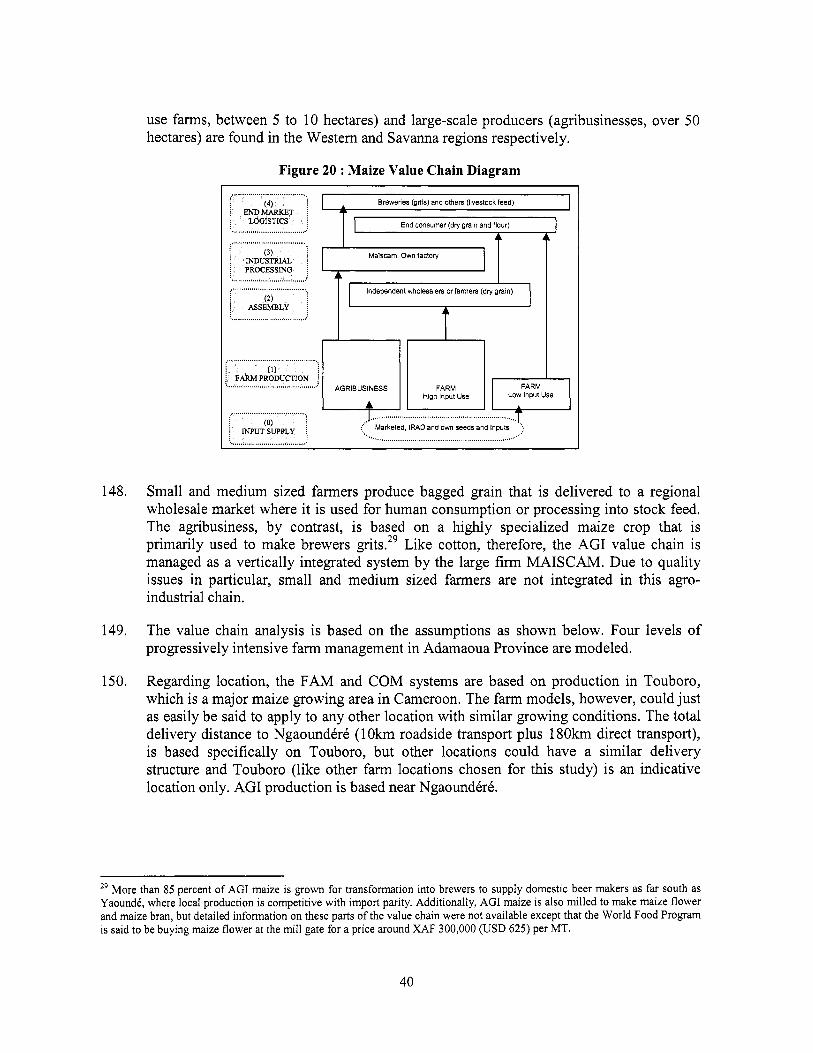
use farms, between 5 to 10 hectares) and large-scale producers (agribusinesses, over 50 hectares) are found in the Western and Savanna regions respectively.
..............................................
Figure 20 : Maize Value Chain Diagram
Breweries (grits) and others (livestock feed)
T I End consumer (dry grain and flour)
Maiscam: Own factory
Independent wholesalen or farmers (dry grain)
.........................
J
1
148. Small and medium sized farmers produce bagged grain that i s delivered to a regional wholesale market where i t i s used for human consumption or processing into stock feed. The agribusiness, by contrast, i s based on a highly specialized maize crop that i s primarily used to make brewers grits.29 Like cotton, therefore, the AGI value chain i s managed as a vertically integrated system by the large firm M A I S C A M . Due to quality issues in particular, small and medium sized farmers are not integrated in this agro- industrial chain.
149. The value chain analysis i s based on the assumptions as shown below. Four levels o f progressively intensive farm management in Adamaoua Province are modeled.
150. Regarding location, the FAM and C O M systems are based o n production in Touboro, which i s a major maize growing area in Cameroon. The farm models, however, could just as easily be said to apply to any other location with similar growing conditions. The total delivery distance to Ngaoundkrk (1 O k m roadside transport plus 180km direct transport), i s based specifically on Touboro, but other locations could have a similar delivery structure and Touboro (like other farm locations chosen for this study) i s an indicative location only. AGI production i s based near NgaoundCre.
29 More than 85 percent o f AGI maize i s grown for transformation into brewers to supply domestic beer makers as far south as Yaounde, where local production i s competitive with import parity. Additionally, AGI maize i s also milled to make maize flower and maize bran, but detailed information on these parts o f the value chain were not available except that the World Food Program i s said to be buying maize flower at the mill gate for a price around XAF 300,000 (USD 625) per MT.
40
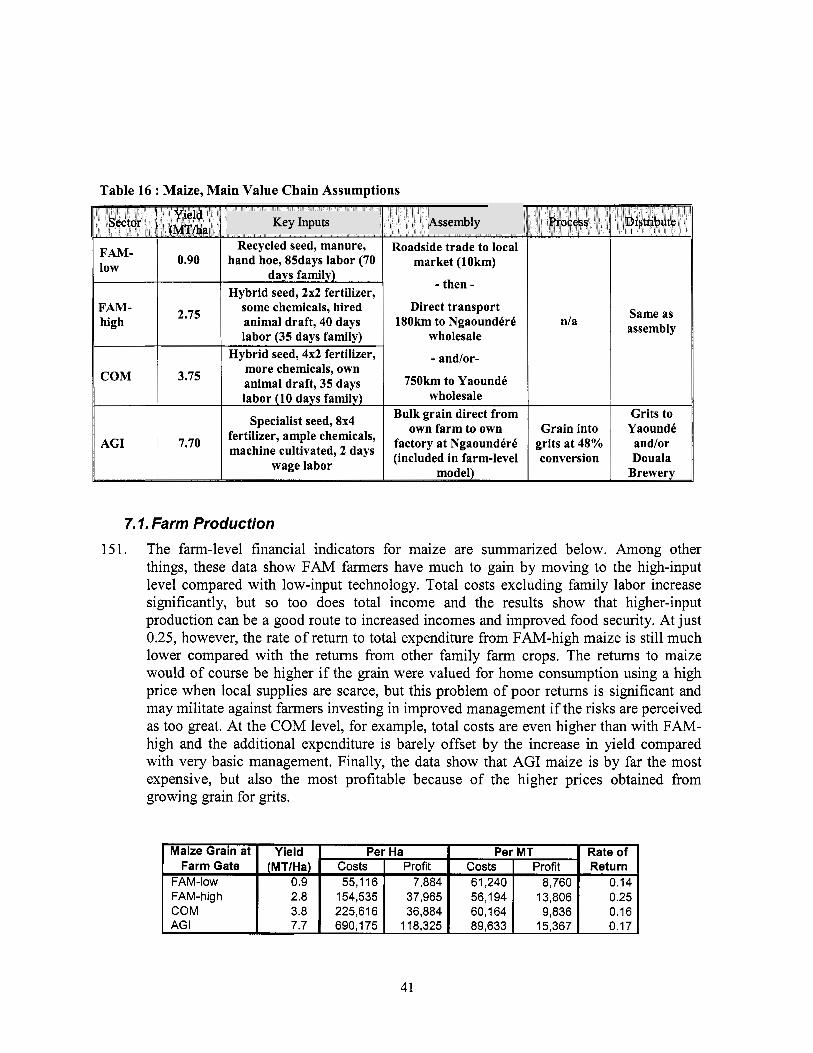
Table 16 : Maize, Main Value Chain Assumptions
Maize Grain at Farm Gate
FAM-low FAM-hig h COM AG I
~~ Yield
Yield Per Ha Per MT Rate of Profit Return
0.9 55,116 7,884 61,240 8,760 0.14 2.8 154,535 37,965 56,194 13,806 0.25 3.8 225,616 36,884 60,164 9,836 0.16 7.7 690,175 118,325 89,633 15,367 0.17
(MTIHa) Costs Profit costs
FAM- 1 0.90 low
I 2'75
CoM I 3.75
AGI 7.70
Key Inputs
Recycled seed, manure, hand hoe, 85days labor (70
days family) Hybrid seed, 2x2 fertilizer,
some chemicals, hired animal draft, 40 days labor (35 days family)
Hybrid seed, 4x2 fertilizer, more chemicals, own animal draft, 35 days labor (10 days family)
Specialist seed, 8x4 fertilizer, ample chemicals, machine cultivated, 2 days
wage labor
Assembly
Roadside trade to local market (1 0 km)
- then - Direct transport
180km to Ngaoundere wholesale
- andlor-
750km to Yaounde wholesale
nla Same as assembly
Bulk grain direct from own farm to own
7. I , Farm Production 151. The farm-level financial indicators for maize are summarized below. Among other
things, these data show FAM farmers have much to gain by moving to the high-input level compared with low-input technology. Total costs excluding family labor increase significantly, but so too does total income and the results show that higher-input production can be a good route to increased incomes and improved food security. At just 0.25, however, the rate o f return to total expenditure from FAM-high maize i s s t i l l much lower compared with the returns from other family farm crops. The returns to maize would o f course be higher if the grain were valued for home consumption using a high price when local supplies are scarce, but this problem o f poor returns i s significant and may militate against farmers investing in improved management if the r isks are perceived as too great. At the COM level, for example, total costs are even higher than with FAM- high and the additional expenditure i s barely offset by the increase in yield compared with very basic management. Finally, the data show that AGI maize i s by far the most expensive, but also the most profitable because o f the higher prices obtained from growing grain for grits.
41
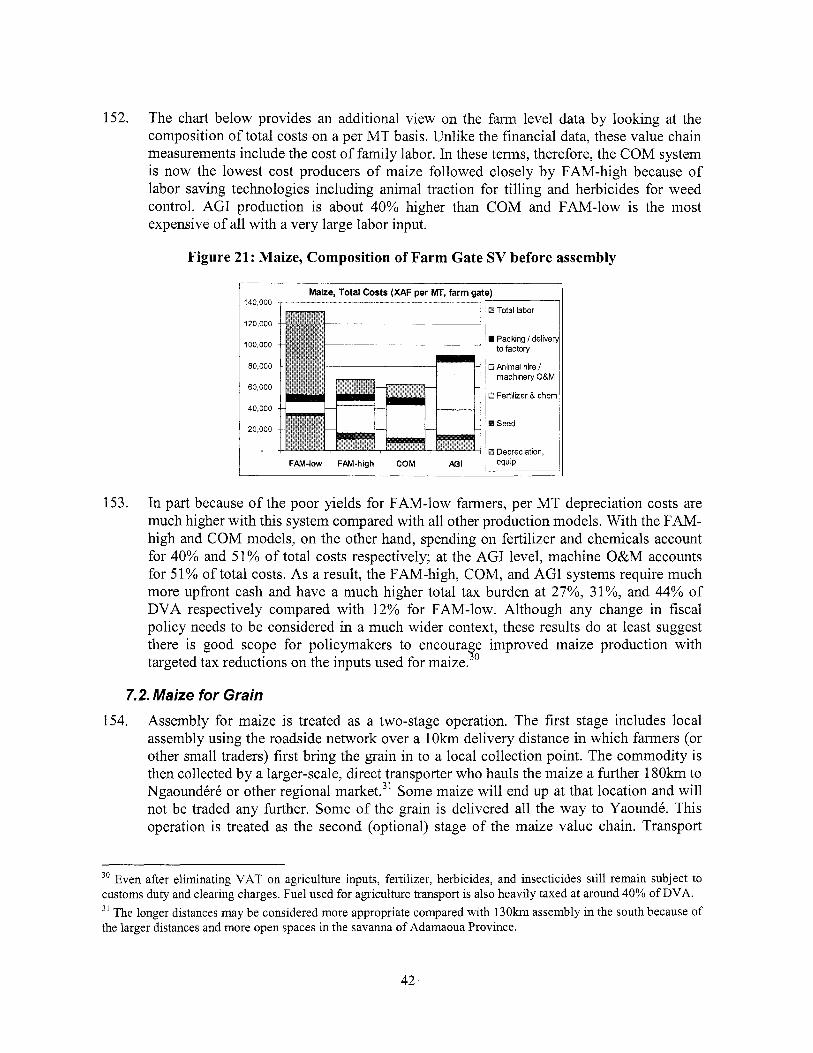
152. The chart below provides an additional view on the farm level data by looking at the composition o f total costs on a per M T basis. Unlike the financial data, these value chain measurements include the cost o f family labor. In these terms, therefore, the C O M system i s now the lowest cost producers o f maize followed closely by FAM-high because o f labor saving technologies including animal traction for tilling and herbicides for weed control. AGI production i s about 40% higher than C O M and FAM- low i s the most expensive o f al l with a very large labor input.
Figure 21 : Maize, Composition of F a r m Gate SV before assembly
140,000
120,000
100,000
80,000
60,000
40,000
20,000
Maize, Total Costs (XAF per MT, farm gate)
Packing /delivery
0 Animal hire /
0 Fertilizer & chem
0 Depreciation,
153. In part because o f the poor yields for FAM-low farmers, per MT depreciation costs are much higher with this system compared with al l other production models. With the FAM- high and C O M models, on the other hand, spending on fertilizer and chemicals account for 40% and 51% o f total costs respectively; at the AGI level, machine O & M accounts for 51% o f total costs. As a result, the FAM-high, COM, and AGI systems require much more upfront cash and have a much higher total tax burden at 27%, 3 1%, and 44% o f DVA respectively compared with 12% for FAM-low. Although any change in fiscal policy needs to be considered in a much wider context, these results do at least suggest there i s good scope for policymakers to encoura e improved maize production with targeted tax reductions o n the inputs used for maize. $0
7.2. Maize for Grain 154. Assembly for maize i s treated as a two-stage operation. The f i rs t stage includes local
assembly using the roadside network over a l O k m delivery distance in which farmers (or other small traders) f i rs t bring the grain in to a local collection point. The commodity i s then collected by a larger-scale, direct transporter who hauls the maize a further 180km to Ngaoundere or other regional market.31 Some maize wil l end up at that location and wil l not be traded any further. Some o f the grain is delivered al l the way to Yaounde. This operation i s treated as the second (optional) stage o f the maize value chain. Transport
Even after eliminating VAT o n agriculture inputs, fertilizer, herbicides, and insecticides s t i l l remain subject t o customs duty and clearing charges. Fuel used for agriculture transport i s also heavily taxed at around 40% o f DVA. 3' The longer distances may be considered more appropriate compared with 130km assembly in the south because of the larger distances and more open spaces in the savanna o f Adamaoua Province.
30
42
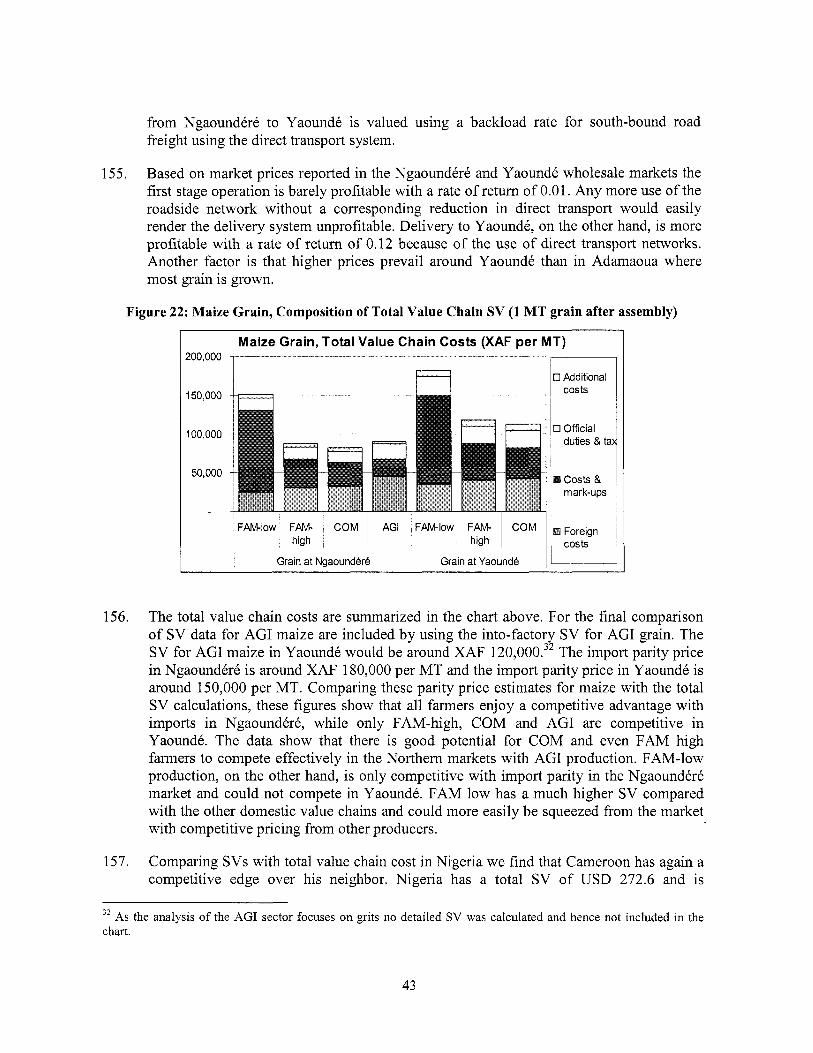
from Ngaounderk to Yaounde i s valued using a backload rate for south-bound road freight using the direct transport system.
GrainatYaounde 1
155. Based on market prices reported in the Ngaoundkrk and Yaounde wholesale markets the f i rs t stage operation i s barely profitable with a rate o f return o f 0.01. Any more use o f the roadside network without a corresponding reduction in direct transport would easily render the delivery system unprofitable. Del ivery to Yaounde, on the other hand, i s more profitable with a rate o f return o f 0.12 because o f the use o f direct transport networks. Another factor i s that higher prices prevail around Yaounde than in Adamaoua where most grain i s grown.
,
Figure 22: Maize Grain, Composition of Total Value Chain SV (1 MT grain after assembly)
!00,000
I50,OOO
I00,000
50,000
Maize Grain, Total Value Chain Costs (XAF per MT) "."l ...... - - ~ ..... ... " I
10 Additional
FAMlow FAM high
COM AGI
Grain at Ngaoundbre
FAMlow FAM high
156. The total value chain costs are summarized in the chart above. For the final comparison o f SV data for AGI maize are included by using the into-factory SV for AGI grain. The SV for AGI maize in Yaounde would be around XAF 120,000.32 The import parity price in Ngaounderk is around XAF 180,000 per MT and the import parity price in Yaounde i s around 150,000 per MT. Comparing these parity price estimates for maize with the total SV calculations, these figures show that al l farmers enjoy a competitive advantage with imports in NgaoundCrk, while only FAM-high, C O M and AGI are competitive in Yaounde. The data show that there i s good potential for C O M and even FAM high farmers to compete effectively in the Northern markets with AGI production. FAM-low production, on the other hand, i s only competitive with import parity in the Ngaoundkre market and could not compete in YaoundC. FAM low has a much higher SV compared with the other domestic value chains and could more easily be squeezed fi-om the market with competitive pricing from other producers.
157. Comparing SVs with total value chain cost in Nigeria we find that Cameroon has again a competitive edge over h i s neighbor. Nigeria has a total SV o f USD 272.6 and i s
~~
32 As the analysis o f the AGI sector focuses o n grits no detailed SV was calculated and hence not included in the chart.
43
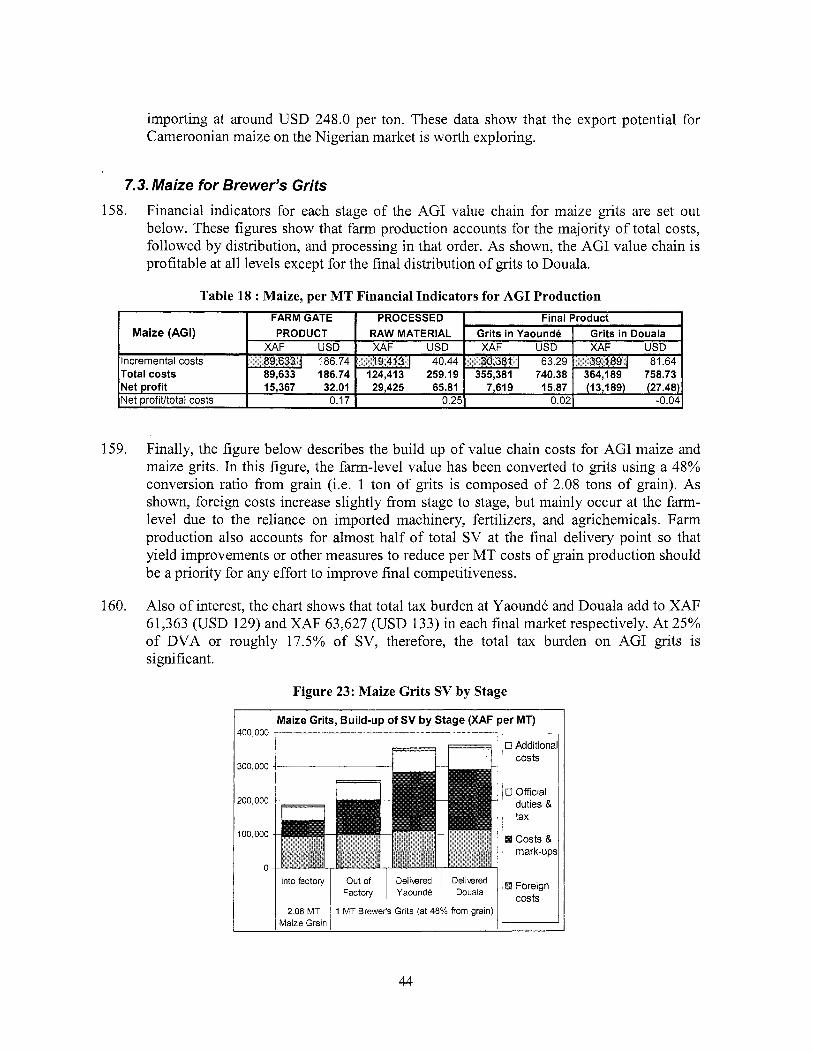
importing at around USD 248.0 per ton. These data show that the export potential for Cameroonian maize on the Nigerian market i s worth exploring.
7.3. Maize for Brewer's Grits 158. Financial indicators for each stage o f the AGI value chain for maize grits are set out
below. These figures show that farm production accounts for the majority o f total costs, followed by distribution, and processing in that order. As shown, the AGI value chain i s profitable at al l levels except for the final distribution o f gr i ts to Douala.
Table 18 : Maize, per MT Financial Indicators for A G I Production Final Product I
ITotal costs 186.74 1124,413- Net profit I 15,367 32.01 1 29,425 65.81 I 7,619 15.87 I (13,189) (27.48) Net profitltotal costs I 0.17 I 0.25) 0.021 -0.04
159.
160.
Finally, the f igure below describes the build up o f value chain costs for AGI maize and maize grits. In this figure, the farm-level value has been converted to grits using a 48% conversion ratio from grain (Le. 1 ton o f gr i ts i s composed o f 2.08 tons o f grain). As shown, foreign costs increase slightly from stage to stage, but mainly occur at the farm- level due to the reliance on imported machinery, fertilizers, and agrichemicals. Farm production also accounts for almost hal f o f total SV at the final delivery point so that yield improvements or other measures to reduce per MT costs o f grain production should be a priority for any effort to improve final competitiveness.
Also o f interest, the chart shows that total tax burden at Yaounde and Douala add to XAF 61,363 (USD 129) and XAF 63,627 (USD 133) in each final market respectively. At 25% o f DVA or roughly 17.5% o f SV, therefore, the total tax burden on AGI grits i s significant.
Figure 23: Maize Grits SV by Stage
I Maize Grits, Build-up of SV by Stage (XAF per MT) I
0 Addition; ~ costs
300,000
200,000
100,000
0 Into factory
2.08 MT Maize Grain
Out of Deliwred Del iwed Factory 1 Yaounde ~ Douala
1 MT Brewer's Grits (at 48% from grain)
0 Official duties & tax
costs & mark-up
0 Foreign costs
44
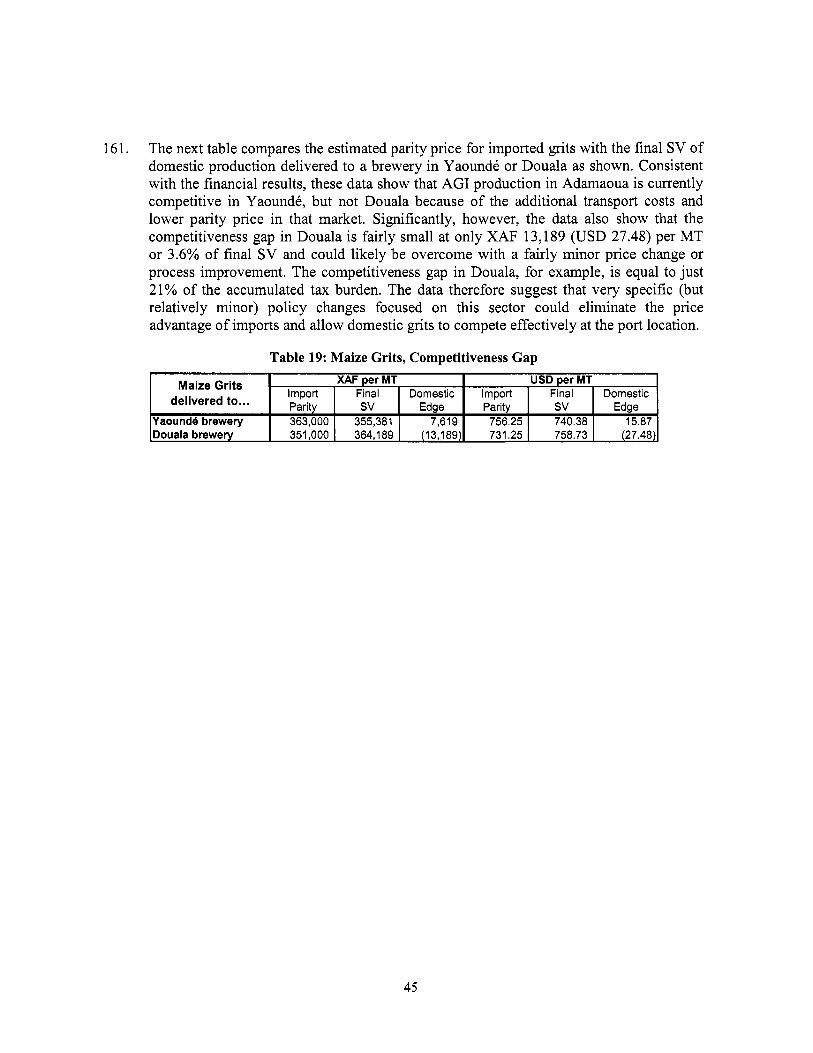
161. The next table compares the estimated parity price for imported gr i ts with the final SV o f domestic production delivered to a brewery in YaoundC or Douala as shown. Consistent with the financial results, these data show that AGI production in Adamaoua i s currently competitive in Yaoundk, but not Douala because o f the additional transport costs and lower parity price in that market. Significantly, however, the data also show that the competitiveness gap in Douala is fairly small at only XAF 13,189 (USD 27.48) per MT or 3.6% o f final SV and could l ikely be overcome with a fairly minor price change or process improvement. The competitiveness gap in Douala, for example, i s equal to just 21% o f the accumulated tax burden. The data therefore suggest that very specific (but relatively minor) pol icy changes focused on this sector could eliminate the price advantage o f imports and allow domestic grits to compete effectively at the port location.
Maize Grits delivered to.. .
Yaou nd6 brewery Douala brewery
XAF per MT USD per MT Import Final Domestic Import Final Domestic Parity SV Edge Parity SV Edge 363,000 355,381 7,619 756.25 740.38 15.87 351,000 364,189 (13,189) 731.25 758.73 (27.48)
45
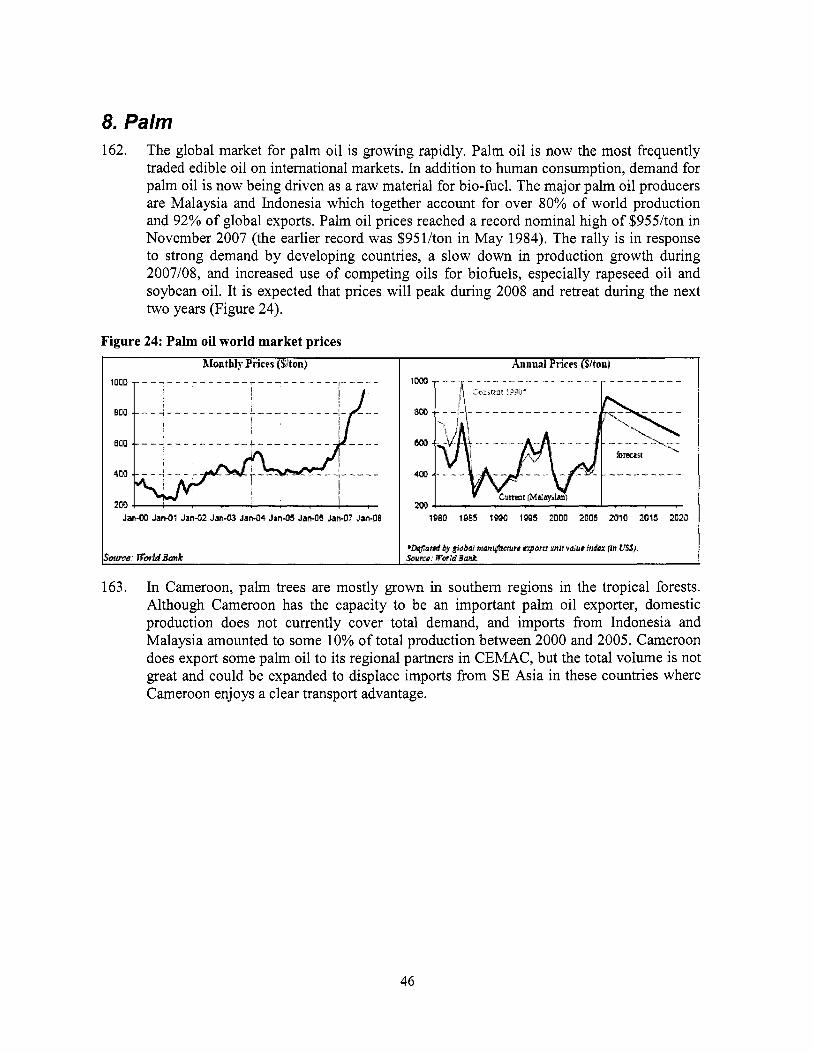
8. Palm 162. The global market for palm o i l i s growing rapidly. Palm o i l i s now the most frequently
traded edible o i l on international markets. In addition to human consumption, demand for palm o i l i s now being driven as a raw material for bio-fuel. The major palm oi l producers are Malaysia and Indonesia which together account for over 80% o f world production and 92% o f global exports. Palm o i l prices reached a record nominal high o f $955/ton in November 2007 (the earlier record was $951/ton in May 1984). The ral ly i s in response to strong demand by developing countries, a slow down in production growth during 2007/08, and increased use o f competing oils for biofuels, especially rapeseed o i l and soybean oil. I t i s expected that prices wil l peak during 2008 and retreat during the next two years (Figure 24).
Figure 24: Palm oil world market prices
163. In Cameroon, palm trees are mostly grown in southern regions in the tropical forests. Although Cameroon has the capacity to be an important palm o i l exporter, domestic production does not currently cover total demand, and imports from Indonesia and Malaysia amounted to some 10% o f total production between 2000 and 2005. Cameroon does export some palm o i l to i t s regional partners in CEMAC, but the total volume i s not great and could be expanded to displace imports from SE Asia in these countries where Cameroon enjoys a clear transport advantage.
46
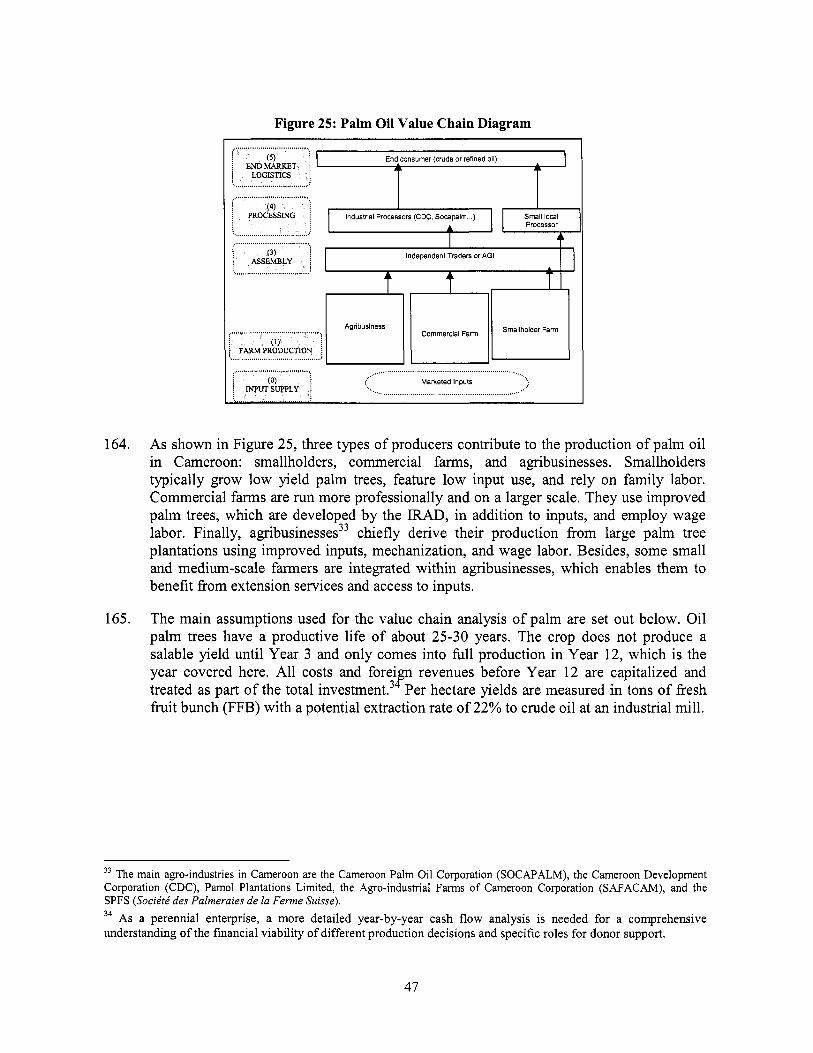
Figure 25: Palm Oil Value Chain Diagram
lndustnal Processors (CDC, Socapalm ... ) A
Small local Processor
I Agnbuslnebs 1 1 Commercial Farm lu Smallho'der
...................................... .......................................................................... .... Marketed Inputs .... ..............................................................................
164. As shown in Figure 25, three types o f producers contribute to the production o f palm oi l in Cameroon: smallholders, commercial farms, and agribusinesses. Smallholders typically grow low yield palm trees, feature l o w input use, and rely on family labor. Commercial farms are run more professionally and on a larger scale. They use improved palm trees, which are developed by the IRAD, in addition to inputs, and employ wage labor. Finally, agr ibusine~ses~~ chiefly derive their production from large palm tree plantations using improved inputs, mechanization, and wage labor. Besides, some small and medium-scale farmers are integrated within agribusinesses, which enables them to benefit from extension services and access to inputs.
165. The main assumptions used for the value chain analysis o f palm are set out below. O i l palm trees have a productive l i f e o f about 25-30 years. The crop does not produce a salable yield until Year 3 and only comes into full production in Year 12, which i s the year covered here. All costs and foreign revenues before Year 12 are capitalized and treated as part o f the total i n ~ e s t m e n t . ~ ~ Per hectare yields are measured in tons o f fresh fruit bunch (FFB) with a potential extraction rate o f 22% to crude o i l at an industrial mill.
33 The main ago-industries in Cameroon are the Cameroon Palm Oi l Corporation (SOCAPALM), the Cameroon Development Corporation (CDC), Pamol Plantations Limited, the Ago-industrial Farms o f Cameroon Corporation (SAFACAM), and the SPFS (Sociktk des Palmeraies de la Ferme Suisse).
As a perennial enterprise, a more detailed year-by-year cash flow analysis i s needed for a comprehensive understanding o f the financial viabi l i ty o f different production decisions and specific roles for donor support.
34
47
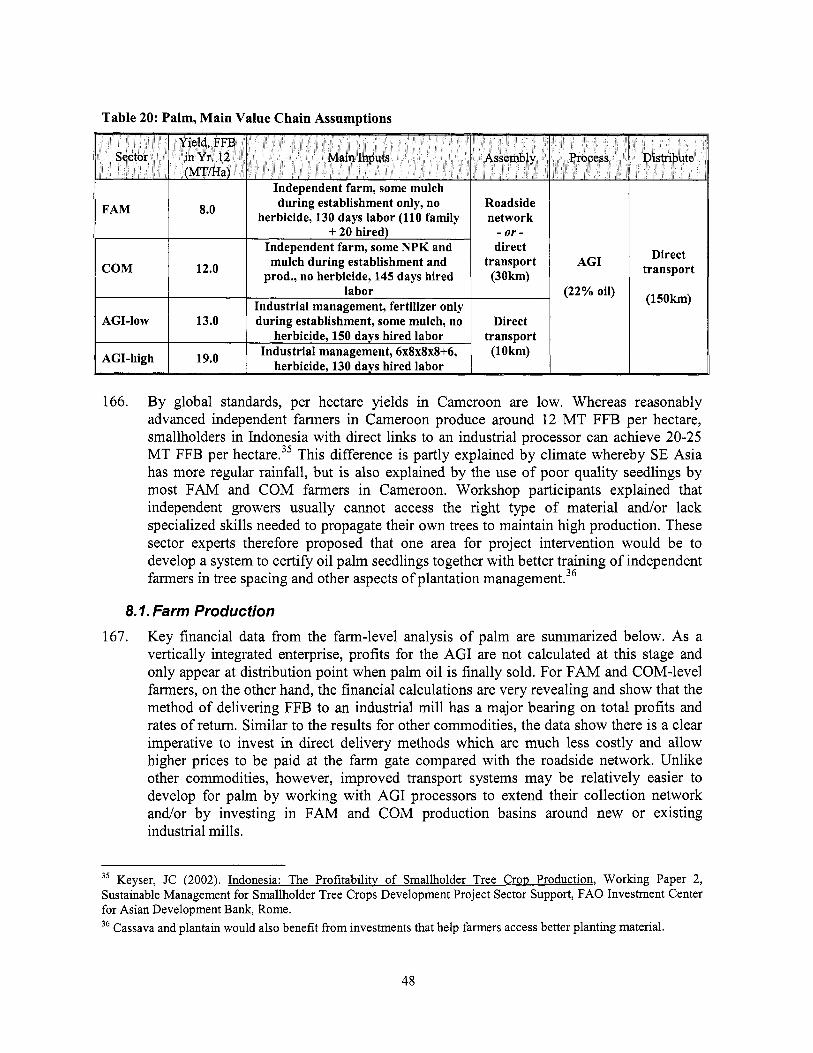
Table 20: Palm, Main Value Chain Assumptions
FAM
COM
8.0
12.0
Independent farm, some m u l c h during establishment only, no
herbicide, 130 days l abo r (110 fami ly + 20 hired)
Independent farm, some NPK and m u l c h during establishment and
prod., no herbicide, 145 days h i red ~ _ _
Indus t r i a l management, fert i l izer on l y
Roadside n e t w o r k
- or - d i rect
t ranspor t (30km)
I Di rec t
t ranspor t (10km)
AGI
(22% oil)
D i rec t t ranspor t
(150km)
166. By global standards, per hectare yields in Cameroon are low. Whereas reasonably advanced independent farmers in Cameroon produce around 12 M T FFB per hectare, smallholders in Indonesia with direct l i n k s to an industrial processor can achieve 20-25 MT FFB per hectare.35 This difference i s partly explained by climate whereby SE Asia has more regular rainfall, but i s also explained by the use o f poor quality seedlings by most FAM and C O M farmers in Cameroon. Workshop participants explained that independent growers usually cannot access the right type o f material and/or lack specialized sk i l ls needed to propagate their own trees to maintain high production. These sector experts therefore proposed that one area for project intervention would be to develop a system to certify o i l palm seedlings together with better training o f independent farmers in tree spacing and other aspects o f plantation management.36
8.7. Farm Production 167. Key financial data from the farm-level analysis o f palm are summarized below. As a
vertically integrated enterprise, profits for the AGI are not calculated at this stage and only appear at distribution point when palm o i l i s finally sold. For FAM and COM-level farmers, on the other hand, the financial calculations are very revealing and show that the method o f delivering FFB to an industrial mill has a major bearing on total profits and rates o f return. Similar to the results for other commodities, the data show there i s a clear imperative to invest in direct delivery methods which are much less costly and allow higher prices to be paid at the farm gate compared with the roadside network. Unl ike other commodities, however, improved transport systems may be relatively easier to develop for palm by working with AGI processors to extend their collection network and/or by investing in FAh4 and C O M production basins around new or existing industrial mills.
35 Keyser, JC (2002). Indonesia: The Profitabil itv o f Smallholder Tree Crot, Production, Work ing Paper 2, Sustainable Management for Smallholder Tree Crops Development Project Sector Support, FA0 Investment Center for Asian Development Bank, Rome. 36 Cassava and plantain would also benefit f r o m investments that help farmers access better planting material.
48

Table 21: Palm, Farm-level Financial Indicators
FAM COM AGI-low AGI-high
168. Another reason to give priority to transportation o f FFB in the palm sector i s that the high cost o f roadside transport currently leads independent farmers to deliver to a local pressoiv where the extraction rate i s only 10-14% o i l compared with 20-24% o i l at an AGI mill. Although the o i l from apvessoir has a unique taste and enjoys good demand as an ingredient in traditional food, the loss o f total revenue as a result o f the lower extraction i s significant and represents a clear bottleneck to improved sector performance.
I
169. The next chart summarizes the composition o f total farm costs per MT FFB. As shown, labor accounts for the majority o f production costs in al l farm systems except AGI-high where fertilizer and chemicals are also important. In terms o f investment priorities, therefore, i t appears that changes in input price pol icy are unlikely to have a major impact on overall profitability o f palm o i l compared with investments in improved planting material and labor saving technologies.
Figure 26: Palm, Composition of Farm Gate SV (1 MT FFB before delivery to factory).
40,000
30,000
20,000
10,000
Palm, Total Costs (XAF per MT FFB, farm gate) __ - - -I I
7 CIS Family labor
E Hired labor
0 Fertilizer & chem
e9 Depreciatior (incl. trees)
170. The chart also shows that FAM and COM-level production results in FFB with much lower SV at the farm gate compared to AGI production. Although the cost o f assembling FFB from more distant FAM and C O M plantations offsets some o f this advantage at the final distribution point, the data clearly show that FAM and C O M farmers have an important strategic role to play as a source o f competitiveness for Cameroon’s palm o i l sector. Investments that specifically help these farmers to improve their production and/or establish closer t ies with a well-hnctioning industrial mill should therefore be accorded high priori ty in future development policy.
49

8.2. Costs at Assembly, Processing, and Distribution 171. Figure 27 looks at the total cost build up for palm by value chain stage. At distribution,
the values have been converted to FFB equivalent so that the prices for each stage can be compared directly. As shown, FAM-low is the most competitive value chain followed by AGI-high, COM, and AGI-low in that order. For the FAM and COM systems, assembly method makes the greatest difference total SV whereas the priority for the AGI sector should be to recover from AGI-low to AGI-high. In al l systems, farm production accounts for the majority o f total value followed by processing, which was estimated to cost around XAF 15,000 (USD 31.25) per M T FFB. Other than the potential to reduce assembly costs by moving from the roadside to direct model, therefore, investments focused on improved farm production and savings at the processing stage should be the next most important areas for sector investment.
AGI Palm Oil at Final AGI-low Market XAF USD
Total costs 271,430 565.48
Figure 27 : Palm SV by Value Chain Stage
AGI-high XAF USD
255,353 531.98
172.
Palm, Build-up of SV by Value Chain Stage (XAF per MT FFB or FFB Equivalent)
50,000
1 FAM 1 COM 1 AGI
Distribution
0 Processing
Assembly
0 Farm
Financial indicators for the AGI systems are summarized in the next table. As shown, the AGI-low system actually works out more expensive in finished product terms because o f the higher per ton costs o f growing FFB at the farm-level. Low-input management, therefore, helps the AGI save money in per hectare terms at the farm-level, but i s counterproductive in the larger sense when the values from all stages are measured per MT traded product. For this reason, investments that help struggling AGIs currently trapped at the low-input level because o f accumulated debt and/or other management problems should be a priority for the o i l palm sector.
Net profit I 138,932 289.44 I 155,009 322.94 Net profitltotal costs I 0.51 I 0.61
50
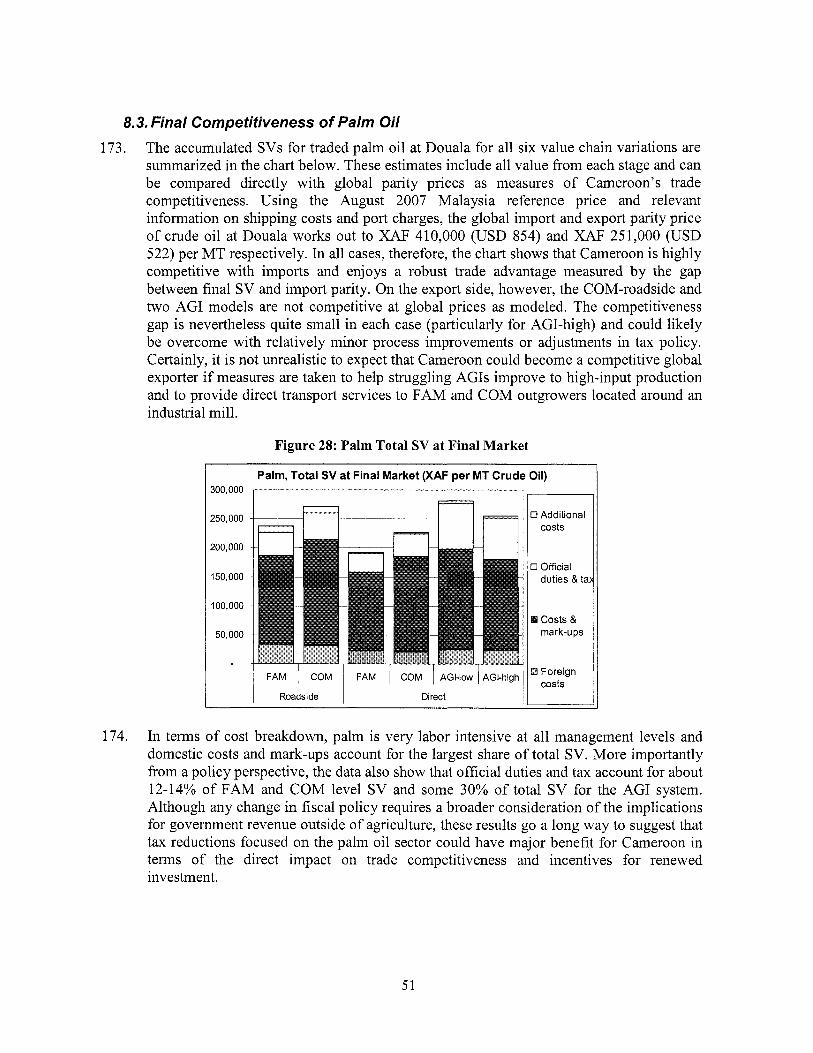
8.3. Final Competitiveness of Palm Oil 173. The accumulated SVs for traded palm o i l at Douala for al l six value chain variations are
summarized in the chart below. These estimates include al l value from each stage and can be compared directly with global parity prices as measures o f Cameroon's trade competitiveness. Using the August 2007 Malaysia reference price and relevant information o n shipping costs and port charges, the global import and export parity price o f crude o i l at Douala works out to XAF 410,000 (USD 854) and XAF 251,000 (USD 522) per MT respectively. In al l cases, therefore, the chart shows that Cameroon i s highly competitive with imports and enjoys a robust trade advantage measured by the gap between final SV and import parity. O n the export side, however, the COM-roadside and two AGI models are not competitive at global prices as modeled. The competitiveness gap is nevertheless quite small in each case (particularly for AGI-high) and could likely be overcome with relatively minor process improvements or adjustments in tax policy. Certainly, i t is not unrealistic to expect that Cameroon could become a competitive global exporter if measures are taken to help struggling AGIs improve to high-input production and to provide direct transport services to FAM and C O M outgrowers located around an industrial mill.
Figure 28: Palm Total SV at Final Market
300,000
250,000
200,000
150,000
100,000
50,000
Palm, Total SV at Final Market (XAF per MT Crude Oil)
FAM 1 COM 1 AGI-low 1 AGI-high
Roadside Direct
174. In terms o f cost breakdown, palm i s very labor intensive at a l l management levels and domestic costs and mark-ups account for the largest share o f total SV. More importantly from a pol icy perspective, the data also show that official duties and tax account for about 12-14% o f FAM and C O M level SV and some 30% o f total SV for the AGI system. Although any change in fiscal pol icy requires a broader consideration o f the implications for government revenue outside o f agriculture, these results go a long way to suggest that tax reductions focused o n the palm o i l sector could have major benefit for Cameroon in terms o f the direct impact on trade competitiveness and incentives for renewed investment.
51
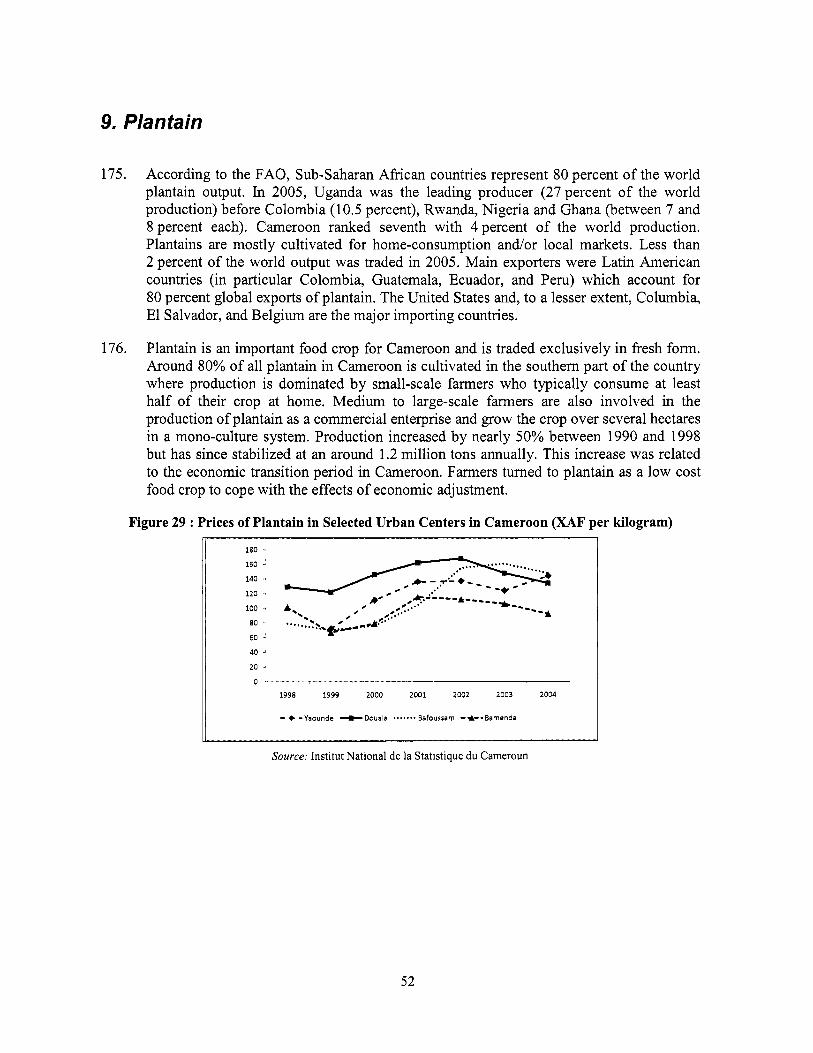
9. Plantain
175. According to the FAO, Sub-Saharan African countries represent 80 percent o f the world plantain output. In 2005, Uganda was the leading producer (27percent o f the world production) before Colombia (10.5 percent), Rwanda, Nigeria and Ghana (between 7 and 8 percent each). Cameroon ranked seventh with 4 percent o f the wor ld production. Plantains are mostly cultivated for home-consumption and/or local markets. Less than 2 percent o f the world output was traded in 2005. Ma in exporters were Lat in American countries (in particular Colombia, Guatemala, Ecuador, and Peru) which account for 80 percent global exports o f plantain. The United States and, to a lesser extent, Columbia, El Salvador, and Belgium are the major importing countries.
176. Plantain i s an important food crop for Cameroon and i s traded exclusively in fresh form. Around 80% o f al l plantain in Cameroon i s cultivated in the southern part o f the country where production i s dominated by small-scale farmers who typically consume at least hal f o f their crop at home. Medium to large-scale farmers are also involved in the production o f plantain as a commercial enterprise and grow the crop over several hectares in a mono-culture system. Production increased by nearly 50% between 1990 and 1998 but has since stabilized at an around 1.2 mi l l ion tons annually. This increase was related to the economic transition period in Cameroon. Farmers turned to plantain as a low cost food crop to cope with the effects o f economic adjustment.
Figure 29 : Prices of Plantain in Selected Urban Centers in Cameroon (XAF per kilogram)
40 - 20 - 0
1998 1999 2000 2001 2002 2003 2004
- + -Yaounde - - C D o u a l a . . . - . . e Bafoussarn -*--Barnenda
Source: Institut National de la Statistique du Cameroun
52

Figure 30: Plantain Value Chain Diagram
.............................................
t (3) Independent Traders or Contractual Middlemen ASSEMBLY 1
........................................ t
1 I I ............................................
(0) I 1 INPUTSUPPLY ,
Mediuwlarge scale
Smallholder
................................................................................. .... IRAD and Own Inputs
.........................................................................................
177. Most marketed plantain is sold domestically in urban centers where there i s good demand. Small quantities are also exported to Gabon and Equatorial Guinea where demand i s high. Looking to the future, the Congo Republic and Chad also have excess demand and represent potential export markets for Cameroon. Demand for plantain in Europe and other higher-value markets does exist, but these outlets are not presently realistic for Cameroon and would require substantial coordinated investments in new varieties, improved quality control systems, and efficient cool chains to be remotely possible.
178. The main assumptions used for the value chain analysis are summarized below. As shown, the analysis o f plantain ends at the assembly level with bulk delivery to an urban or frontier wholesale market. The assumed delivery distance i s 130km in which FAM farmers use the roadside network and C O M farmers use the more consolidated direct transport system. Value chains with a shorter delivery distance would, o f course, have a lower final SV and be more competitive than shown while those with a longer delivery distance would have a higher SV and be less competitive. As a perennial crop, the establishment costs for plantain have been annualized and spread over the full l i f e cycle o f the trees.
53

Table 23: Plantain, Main Value Chain Assumptions
3km by head Unimproved suckers, some compost, minimum care Roadside trade
Plantain at Yield Per Ha Per MT Farm Gate (MTIHa) Costs Profit costs Profit
FAM-low 10.0 160,864 489,136 16,086 48,914 FAM-high 18.0 569,095 600,905 31,616 33,384 COM 25.0 959,642 665,358 38,386 26,614
I Improved suckers, 350kg fert, some chem., better care
3km by own push cart I( FAM-high I 18.0 I 3 I
Rate of Return
3.04 1.06 0.69
9.1. Farm Production 179. Per hectare and per ton cost and profitability data for plantain at the farm gate are
summarized below. As shown, good potential exists for significant improvement in per hectare profits from better management based on the use o f improved cultivars and fertilizer, but the cost o f achieving these improvements are extremely high. Although the rate o f return for FAM-high management i s s t i l l extremely good, an additional XAF 408,231 (USD 850) total spending i s required per hectare to achieve this level o f profitability.
180. As a plantain expert met at the Plantain Research Station near Limbe explained, the major differences in farm management depend on the amount o f cash at the farmer’s disposal and capacity to use hired labor and other improved inputs. The value chain indicators support this assessment directly and point out that the f i rst major bottleneck to improved production are the high costs o f investing in improved cultivars and other advanced inputs. Compared with cotton, maize, and palm, however, the per hectare profitability o f plantain even at the low-input management level i s st i l l very attractive and show that farmers with reliable market access can expect to make a good income from plantain.
54
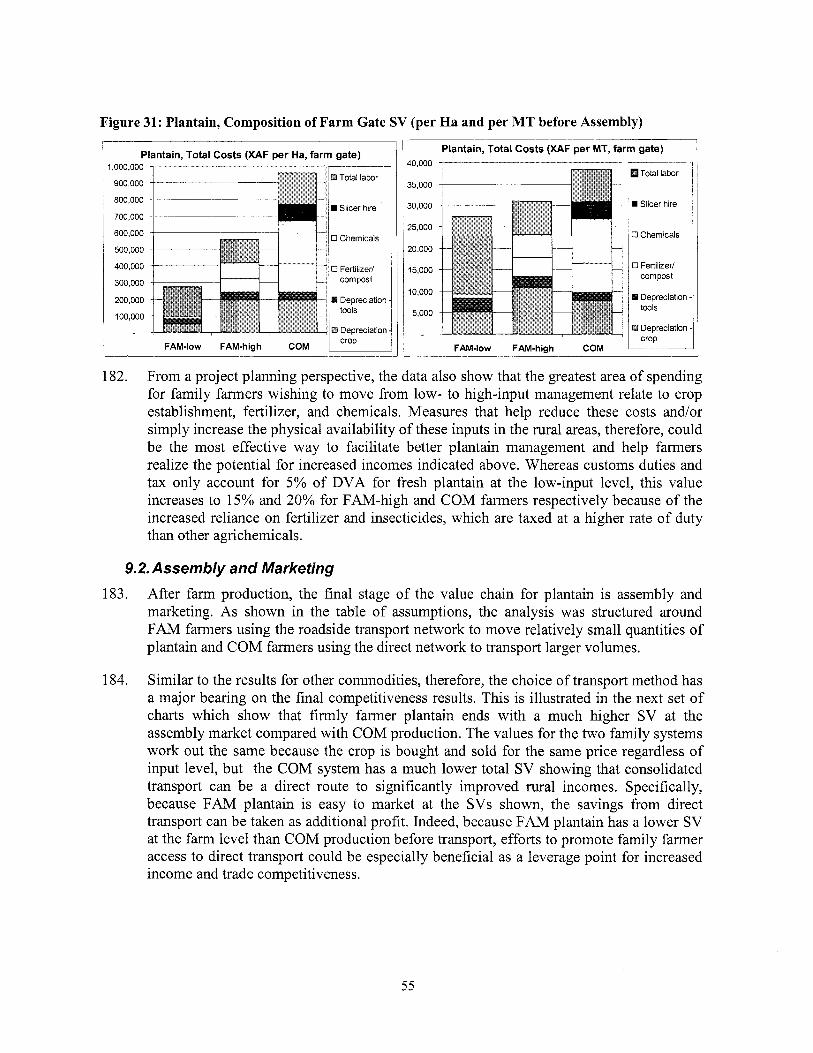
Figure 31: Plantain, Composition of Farm Gate SV (per H a and per MT before Assembly)
Plantain, Total Costs (XAF per Ha, farm gate) - - _ _ l000000 1 - 900,000
800,000
700,000
600,000
500,000
400,000
0 Chemicals
300,000
200,000
100,000
FAM-low FAM-high COM 1 crop
40,000
35,000
30,000
25,000
20,000
15,000
10,000
5,000
Plantain, Total Costs (XAF per MT, farm gate)
Total labor
H Slicer hire
' U Chemicals
0 Fertilizer/ compost
FAM-low FAM-hiah COM
182. From a project planning perspective, the data also show that the greatest area o f spending for family farmers wishing to move fi-om low- to high-input management relate to crop establishment, fertilizer, and chemicals. Measures that help reduce these costs and/or simply increase the physical availability o f these inputs in the rural areas, therefore, could be the most effective way to facilitate better plantain management and help farmers realize the potential for increased incomes indicated above. Whereas customs duties and tax only account for 5% o f DVA for fresh plantain at the low-input level, this value increases to 15% and 20% for FAM-high and C O M farmers respectively because o f the increased reliance on fertilizer and insecticides, which are taxed at a higher rate o f duty than other agrichemicals.
9.2. Assembly and Marketing 183. After farm production, the final stage o f the value chain for plantain is assembly and
marketing. As shown in the table o f assumptions, the analysis was structured around FAM farmers using the roadside transport network to move relatively small quantities o f plantain and C O M farmers using the direct network to transport larger volumes.
184. Similar to the results for other commodities, therefore, the choice o f transport method has a major bearing o n the final competitiveness results. This is illustrated in the next set o f charts which show that firmly farmer plantain ends with a much higher SV at the assembly market compared with C O M production. The values for the two family systems work out the same because the crop i s bought and sold for the same price regardless o f input level, but the C O M system has a much lower total SV showing that consolidated transport can be a direct route to significantly improved rural incomes. Specifically, because FAM plantain i s easy to market at the SVs shown, the savings from direct transport can be taken as additional profit. Indeed, because FAM plantain has a lower SV at the farm level than C O M production before transport, efforts to promote family farmer access to direct transport could be especially beneficial as a leverage point for increased income and trade competitiveness.
55
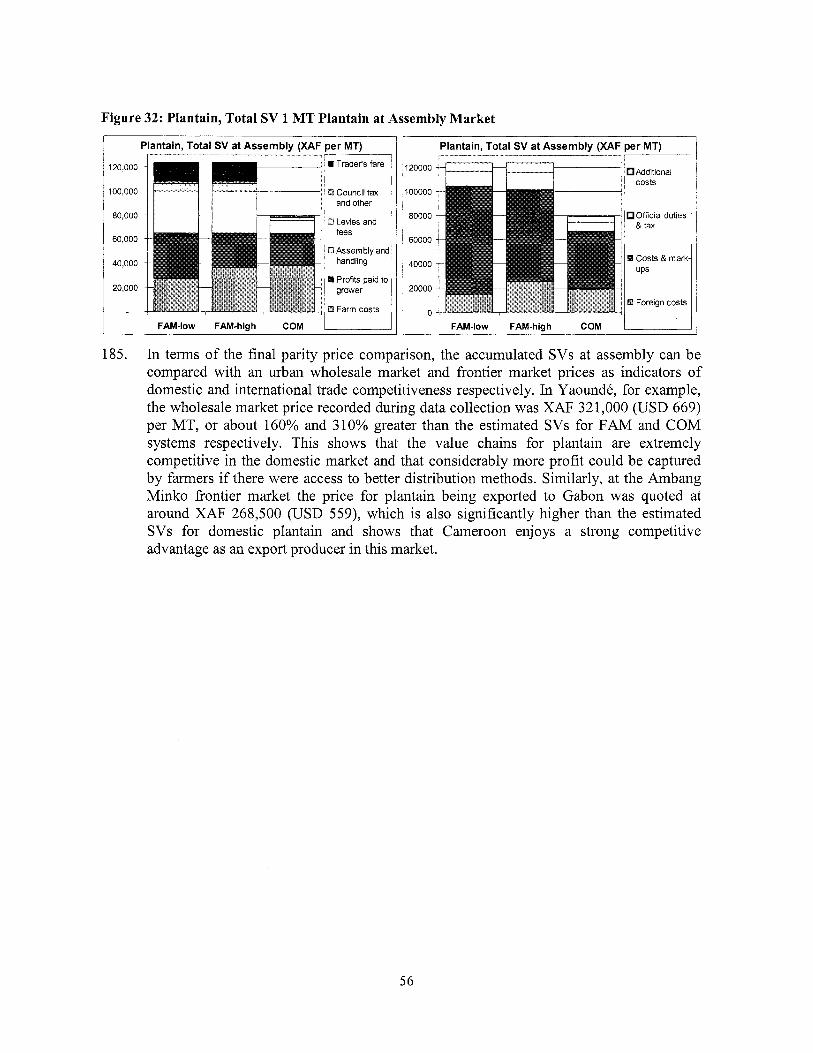
Figure 32: Plantain, Total SV 1 MT Plantain at Assembly Market
120,000
100,000
80,000
60,000
40,000
20,000
Plantain, Total SV at Assemblv lXAF Der MT) i ~ m Trader's fare I 1
FAM-low FAM-high COM
120000
100000
80000
60000
40000
20000
0
Plantain, Total SV at Assembly (XAF per MT) - - - - I - I
j Addltlonal i I
Official duties
Costs & mark-
FAM-low FAM-high COM - 185. In terms of the final parity price comparison, the accumulated SVs at assembly can be
compared with an urban wholesale market and frontier market prices as indicators o f domestic and international trade competitiveness respectively. In Yaoundk, for example, the wholesale market price recorded during data collection was XAF 32 1,000 (USD 669) per MT, or about 160% and 3 10% greater than the estimated SVs for FAM and C O M systems respectively. This shows that the value chains for plantain are extremely competitive in the domestic market and that considerably more profi t could be captured by farmers i f there were access to better distribution methods. Similarly, at the Ambang Minko frontier market the price for plantain being exported to Gabon was quoted at around XAF 268,500 (USD 559), which i s also significantly higher than the estimated SVs for domestic plantain and shows that Cameroon enjoys a strong competitive advantage as an export producer in this market.
56
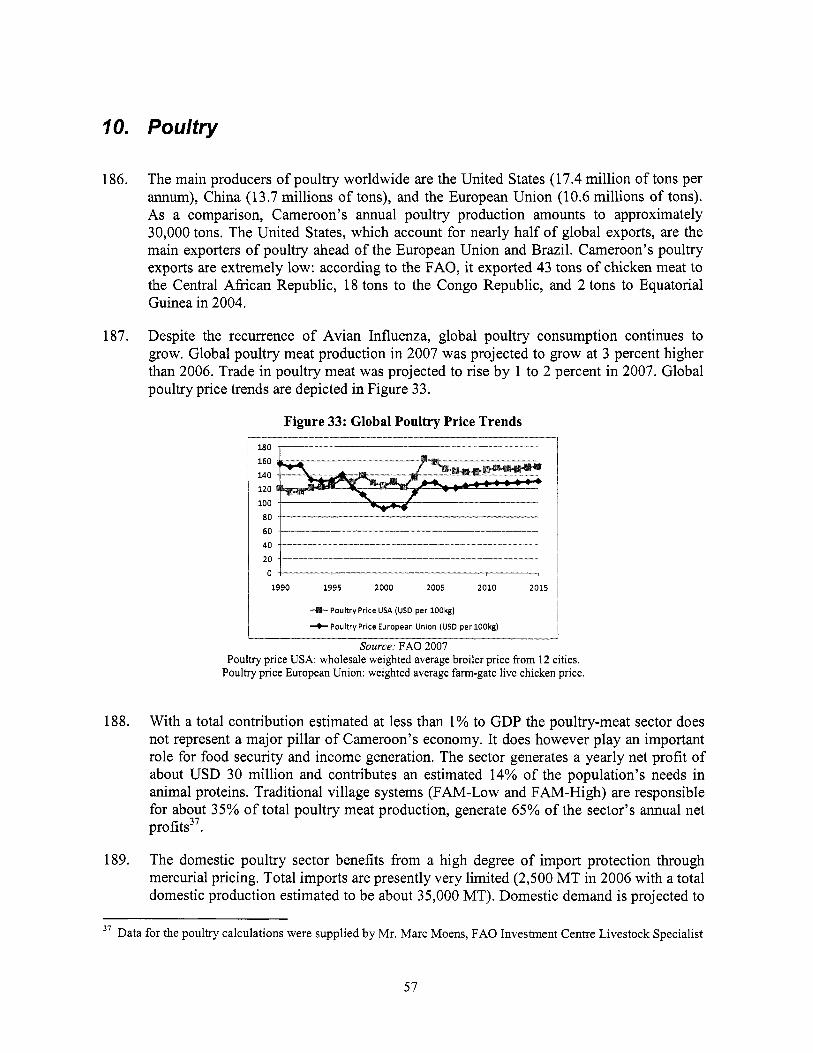
I O .
186.
187.
188.
189.
The main producers o f poultry worldwide are the United States (17.4 mi l l ion o f tons per annum), China (13.7 millions o f tons), and the European Union (10.6 millions o f tons). As a comparison, Cameroon's annual poultry production amounts to approximately 30,000 tons. The United States, which account for nearly hal f o f global exports, are the main exporters o f poultry ahead o f the European Union and Brazil. Cameroon's poultry exports are extremely low: according to the FAO, i t exported 43 tons o f chicken meat to the Central African Republic, 18 tons to the Congo Republic, and 2 tons to Equatorial Guinea in 2004.
Despite the recurrence o f Avian Influenza, global poultry consumption continues to grow. Global poultry meat production in 2007 was projected to grow at 3 percent higher than 2006. Trade in poultry meat was projected to rise by 1 to 2 percent in 2007. Global poultry price trends are depicted in Figure 33.
Figure 33: Global Poultry Price Trends
I 180 , 160 1 140 120
1 4o 4 .... I" " .............. I" .I........._.I.I "."ll "lllil"
1 1990 1995 2000 2005 2010 2015
4%- Poultry Price USA (USD per 100kg)
+Poultry Price European Union (USD per 100kg)
Source: F A 0 2007 Poultry price USA: wholesale weighted average broiler price from 12 cities.
Poultry price European Union: weighted average farm-gate live chicken price.
With a total contribution estimated at less than 1% to GDP the poultry-meat sector does not represent a major pillar o f Cameroon's economy. I t does however play an important role for food security and income generation. The sector generates a yearly net prof i t o f about USD 30 mi l l ion and contributes an estimated 14% o f the population's needs in animal proteins. Traditional village systems (FAM-Low and FAM-High) are responsible for about 35% o f total poultry meat production, generate 65% o f the sector's annual net profits37.
The domestic poultry sector benefits from a high degree o f import protection through mercurial pricing. Total imports are presently very limited (2,500 MT in 2006 with a total domestic production estimated to be about 35,000 MT). Domestic demand i s projected to
37 Data for the poultry calculations were supplied b y Mr. Marc Moens, FA0 Investment Centre Livestock Specialist
57
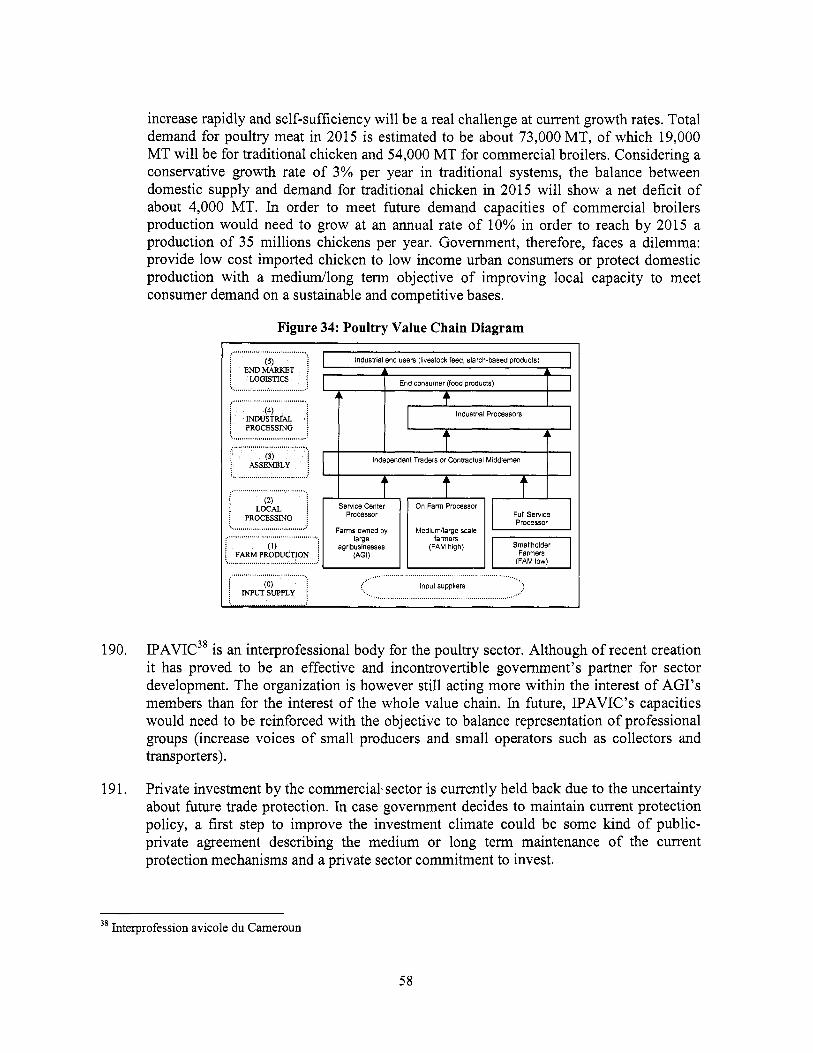
increase rapidly and self-sufficiency wil l be a real challenge at current growth rates. Total demand for poultry meat in 2015 i s estimated to be about 73,000 M T , o f which 19,000 M T wil l be for traditional chicken and 54,000 M T for commercial broilers. Considering a conservative growth rate o f 3% per year in traditional systems, the balance between domestic supply and demand for traditional chicken in 2015 wil l show a net deficit o f about 4,000 M T . In order to meet future demand capacities o f commercial broilers production would need to grow at an annual rate o f 10% in order to reach by 2015 a production o f 35 millions chickens per year. Government, therefore, faces a dilemma: provide l ow cost imported chicken to low income urban consumers or protect domestic production with a med iud long term objective o f improving local capacity to meet consumer demand on a sustainable and competitive bases.
Figure 34: Poultry Value Chain Diagram .......................................
.......................................
........................................ ............................................................................ Input suppliers
..." (0) INPUT SUPPLY .....................................................................................
190. P A V I C 3 8 is an interprofessional body for the poultry sector. Although o f recent creation it has proved to be an effective and incontrovertible government's partner for sector development. The organization i s however s t i l l acting more within the interest o f AGI's members than for the interest o f the whole value chain. In future, IPAVIC's capacities would need to be reinforced with the objective to balance representation o f professional groups (increase voices o f small producers and small operators such as collectors and transporters).
191. Private investment by the commerciabsector i s currently held back due to the uncertainty about fbture trade protection. In case government decides to maintain current protection policy, a first step to improve the investment climate could be some kind o f public- private agreement describing the medium or long te rm maintenance o f the current protection mechanisms and a private sector commitment to invest.
38 Interprofession avicole du Cameroun
58
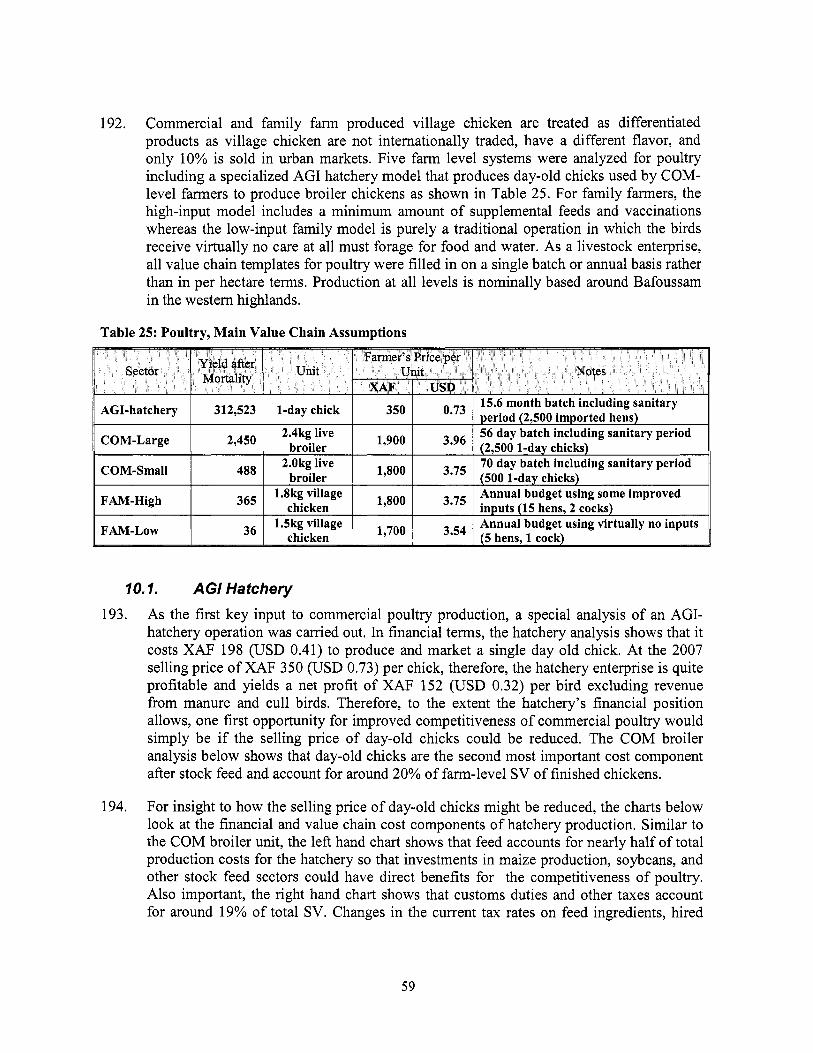
192. Commercial and family farm produced village chicken are treated as differentiated products as village chicken are not internationally traded, have a different flavor, and only 10% i s sold in urban markets. Five farm level systems were analyzed for poultry including a specialized AGI hatchery model that produces day-old chicks used by COM- level farmers to produce broiler chickens as shown in Table 25. For family farmers, the high-input model includes a minimum amount o f supplemental feeds and vaccinations whereas the low-input family model i s purely a traditional operation in which the birds receive virtually no care at a l l must forage for food and water. As a livestock enterprise, a l l value chain templates for poultry were filled in on a single batch or annual basis rather than in per hectare terms. Production at a l l levels i s nominally based around Bafoussam in the western highlands.
Table 25: Poultry, Main Value Chain Assumptions
193.
194.
70.7, AGI Hatchery As the first key input to commercial poultry production, a special analysis o f an AGI- hatchery operation was carried out. In financial terms, the hatchery analysis shows that i t costs XAF 198 (USD 0.41) to produce and market a single day old chick. At the 2007 selling price o f XAF 350 (USD 0.73) per chick, therefore, the hatchery enterprise i s quite profitable and yields a net prof i t o f XAF 152 (USD 0.32) per bird excluding revenue from manure and cul l birds. Therefore, to the extent the hatchery’s financial position allows, one f i rs t opportunity for improved competitiveness o f commercial poultry would simply be if the selling price o f day-old chicks could be reduced. The C O M broiler analysis below shows that day-old chicks are the second most important cost component after stock feed and account for around 20% o f farm-level SV o f finished chickens.
For insight to how the selling price o f day-old chicks might be reduced, the charts below look at the financial and value chain cost components o f hatchery production. Similar to the C O M broiler unit, the le f t hand chart shows that feed accounts for nearly ha l f o f total production costs for the hatchery so that investments in maize production, soybeans, and other stock feed sectors could have direct benefits for the competitiveness o f poultry. Also important, the right hand chart shows that customs duties and other taxes account for around 19% o f total SV. Changes in the current tax rates on feed ingredients, hired
59

labor, imported breeder chicks could therefore have more immediate effects on the trade competitiveness o f poultry and should also be explored.
Poultry
COM-small COM-large
Figure 35 : Poultry, Composition of Hatchery Gate SV for AGI-level 1-day Chicks (per bird)
Per Bird Live Per Year Rate of costs Profit costs Profit Return
1,782 18 869,526 8,874 0.01 1,776 124 4,350,422 304,578 0.07
Cost Components at AGI Hatchery
El Wages and benefits 1
XPF per chick
Utilities
0 Vaccinations
0 Feed
Day-old breeders
Iz1 Fixed investments
Value Chain Components at AGI Hatchery 200 --- 175 1-
XAF per chick
0 Additional expenses
Duties and tax
Domestic costs
Foreign costs
10.2. COM Broiler Production 195. The next step o f the analysis for poultry was to look at large- and small-scale broiler
production using day-old chicks produced by the hatchery. Financial indicators from this stage o f the value chain are set out below and show that large-scale COM production is far more profitable than a small-scale unit. This i s not only true on an annual basis because o f the scale o f the operation, but i s also true on an individual per bird basis. Nevertheless, despite the apparent advantages o f large-scale production, the rates o f return from both units are extremely poor and any adverse change in input and/or output prices could easily render both systems unprofitable.
196. In terms o f cost structure, the charts below show that there i s very l i t t le difference between the large and small-scale commercial systems. Poultry feed and day-old chicks account for the overwhelming bulk o f costs in both systems and are the two areas where project interventions could have the greatest impact on farmer profitability and trade competitiveness. The total tax burden for large- and small-scale broiler production i s almost identical at 23.7 and 24.1% o f DVA respectively. Given that day-old chicks and stock feed together account for around two-thirds o f total costs, taxes on these inputs are by far the most important and so represent the areas where pol icy change could have the greatest effect.
60

Figure 36: Poultry, Composition of Farm Gate SV for COM-level Broiler Chickens (per live bird)
to yield IMT raw meat
714.29
Poultry, Total Cost COM Brolers at Farm-level
Slaughter per bird I per MT
2,149 I 1,534,720
(XAF per live bird) 1,800
1,600
1,400 1,200 1 000
800
600
COM-Small COM -1arae
buildings m Utilities
Vaccinations
0 Feed
fn l d a y chicks
0 Fixed investments
Poultry, Value Chain Cost COM Broilers (XAF per live bird)
exoenws
, _ _ __ __̂ I_
...
u DutNes and tax
Dornesr,c costs
o Foreign costs
COM-large COM-SNI~II
197.
198.
At assembly, live broilers are transported some 290km from Bafoussam to Yaounde or Douala where they are sold in an urban wholesale market. Both COM-large and COM- small farmers are assumed to se l l through an independent broker who charges a commission o f XAF 15 (USD 0.03) per bird to arrange the transaction. Live birds are collected at the farm gate and are carried in a small truck directly to an urban wholesale location where they are traded as assembled raw material. The birds are then sold to a retailer and are eventually taken by the consumer to an informal butcher for slaughter and dressing.
The final SV calculations for C O M poultry after assembly, distribution, and butchering are summarized below using a standard killing-out ratio o f 70%. Because COM-large farmers are assumed to produce a bigger bird, minor differences in SV from farm production now become much more significant in per MT deadweight terms. As shown, the large-scale unit i s now almost 13% more competitive than small-scale poultry production measured by the difference in per MT SV.
Table 27: Poultry, Summary of Final SV at Distribution after Slaughter per Bird and per MT.
I I Live weight I Dead weight I Birds needed I Final SV after I I POULTRY I Der bird I Der bird
ICOM-large I 2.4 I 1.68 595.24 I 2,249 I 1,338,451 I
199. Having calculated per M T estimates o f total SV for each system, the last stage o f the value chain analysis i s to compare these figures with an equivalent parity price for imported chicken, In this case, because Cameroon mainly imports frozen dark meat pieces from Europe where local demand i s stronger for white meat, a 10% premium has been added to the import price to give an approximate parity value for whole chickens produced domestically. Moreover, to protect the domestic poultry industry, Cameroon calculates al l import duties and official taxes on a mercurial basis using a minimum value o f XAF 1,000 per kg (USD 2.08). This procedure adds an estimated XAF 225,147 per ton (USD 469) to the final import parity price thus affording local fanners a substantial degree o f tariff protection.
61
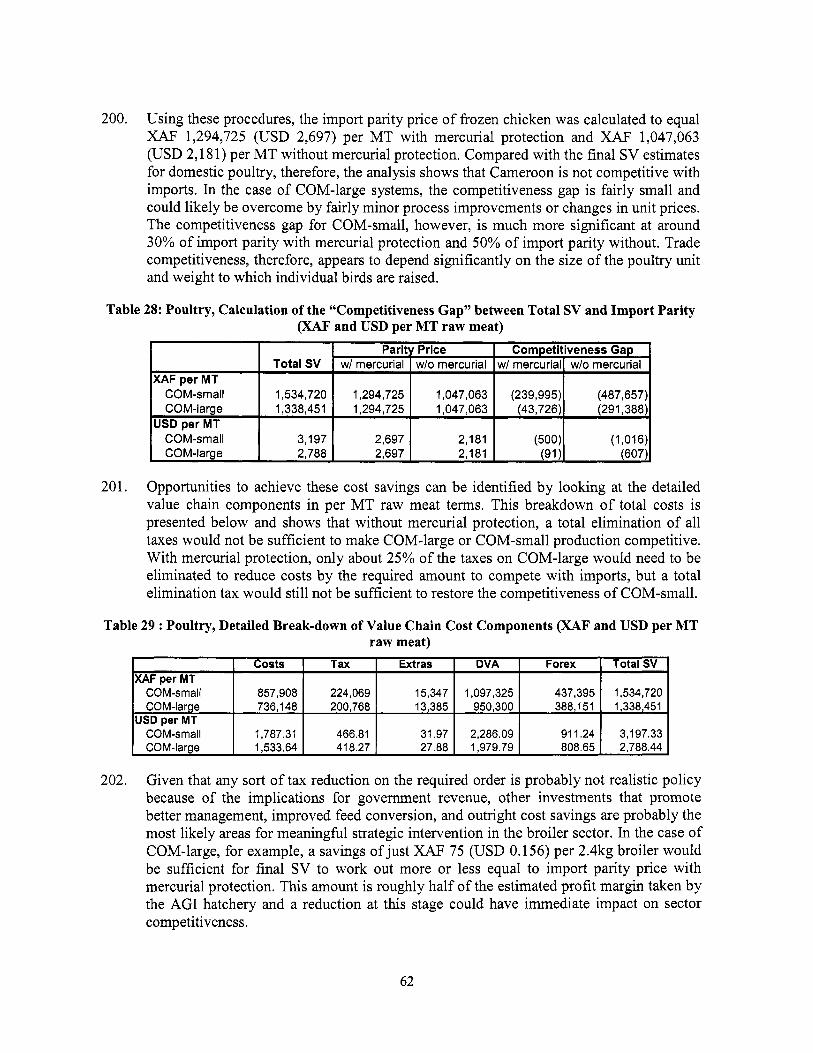
200. Using these procedures, the import parity price o f frozen chicken was calculated to equal XAF 1,294,725 (USD 2,697) per MT with mercurial protection and XAF 1,047,063 (USD 2,18 1) per MT without mercurial protection. Compared with the final SV estimates for domestic poultry, therefore, the analysis shows that Cameroon i s not competitive with imports. In the case o f COM-large systems, the competitiveness gap i s fairly small and could l ikely be overcome by fairly minor process improvements or changes in unit prices. The competitiveness gap for COM-small, however, i s much more significant at around 30% o f import parity with mercurial protection and 50% o f import parity without. Trade competitiveness, therefore, appears to depend significantly on the size o f the poultry unit and weight to which individual birds are raised.
XAF per MT
Table 28: Poultry, Calculation of the “Competitiveness Gap” between Total S V and Impor t Parity (XAF and U S D per MT raw meat)
Parity Price Competitiveness Gap Total SV w/ mercurial I w/o mercurial w/ mercurial1 w/o mercurial
I COM-small COM-large
USD per MT COM-small COM-large
1,534,720 1,294,725 1,047,063 (239,995) (487,657) 1,338,451 1,294,725 1,047,063 (43,726) (291,388)
3,197 2,697 2,181 (500) (1,016) 2,788 2,697 2,181 (91 1 (607)
201. Opportunities to achieve these cost savings can be identified by looking at the detailed value chain components in per MT raw meat terms. This breakdown o f total costs i s presented below and shows that without mercurial protection, a total elimination o f al l taxes would not be sufficient to make COM-large or COM-small production competitive. With mercurial protection, only about 25% o f the taxes on COM-large would need to be eliminated to reduce costs by the required amount to compete with imports, but a total elimination tax would s t i l l not be sufficient to restore the competitiveness o f COM-small.
XAF per MT COM-small COM-large
USD per MT COM-small COM-large
costs Tax Extras DVA Forex Total SV
857,908 224,069 15,347 1,097,325 437,395 1,534,720 736,148 200,768 13,385 950,300 388,151 1,338,451
1,787.31 466.81 31.97 2,286.09 91 1.24 3,197.33 1,533.64 41 8.27 27.88 1,979.79 808.65 2,788.44
202. Given that any sort o f tax reduction on the required order is probably not realistic pol icy because o f the implications for government revenue, other investments that promote better management, improved feed conversion, and outright cost savings are probably the most likely areas for meaningfbl strategic intervention in the broiler sector. In the case o f COM-large, for example, a savings o f just XAF 75 (USD 0.156) per 2.4kg broiler would be sufficient for final SV to work out more or less equal to import parity price with mercurial protection. This amount i s roughly ha l f o f the estimated profi t margin taken by the AGI hatchery and a reduction at this stage could have immediate impact on sector competitiveness.
62

70.3. FAM-level Village Chickens 203. To provide further insight to the opportunities and constraints for poultry production in
Cameroon a simple analysis o f FAM-level village chickens was also carried out. In this case, the key distinctions in management are that FAM-high farmers begin with 15 hens and 2 cocks compared with 5 hens and 2 cocks for FAM-low. The FAM-high model also includes some supplemental feed, vaccinations, and shelter for the birds. The financial indicators from this analysis are summarized below.
Per Bird Live Per Year costs Profit costs Profit Poultry
FAM-IOW 116 1,484 4,189 53,411 FAM-high 122 1,578 44,636 575,864
Rate of Return
12.75 12.90
204. Unlike the COM-level data, these results are extremely promising and show that poultry can provide outstanding rates o f return to smallholder farmers who are able to find a market for their product. Bird for bird, FAM-high i s slightly more expensive than FAM- low, but the high-input system clearly provides far more income due to the size o f the production unit. As a strategy for increased rural incomes and domestic food security, therefore, improvements in village chicken production would appear to be a very worthwhile area to support. The challenge in this case would be to develop new collection systems and provide training in the benefits o f routine vaccination, animal shelters, and small amounts o f supplemental feed. New distribution systems for feed and veterinary medicines would likely be required so that farmers can access the required inputs for improved production.
Figure 37 : Poultry, Composition of Farm Gate SV for FAM-level Village Chickens (per live bird)
Poultry, Total Cost FAM Village Chickens at Farm Level (XAF per live bird)
I " l_x_-- - -.- Ix I _I
FAM-IOW FAM -high
Total labor
R&M buildings
D Vaccinations
Feed
u Inmtment in birds and buildings
205. Presently, it i s not realistic for the same brokers who handle the distribution o f COM- level broilers to deal in village chickens. With increased production and coordination between FAM-high farmers, however, this situation could change. Numerous consumers regard village chickens as having a much better flavor than C O M broilers and indications are that there i s good demand in the urban areas for this type o f bird. Because o f vastly lower costs per bird at the farm level, FAM farmers could easily be competitive with
63

C O M producers in supplying the domestic market if the required distribution channels existed.
206. Because o f the extreme difference in farm gate SV compared to C O M broilers, and because village chickens are not an internationally traded product, parity price comparisons were not carried out for this commodity. It can however be noted that final competitiveness would depend significantly on the profits paid to farmers and efficiency o f village level collection and distribution systems. For lack o f any better basis for comparison, i t could be assumed that the birds travel through the same COM-level distribution system in which case, final competitiveness would depend directly on the price per k i lo paid to the farmer. Because o f the extremely favorable profits for FAM farmers, therefore, prices could easily be reduced as a strategy for trade competitiveness and st i l l provide excellent returns.
64
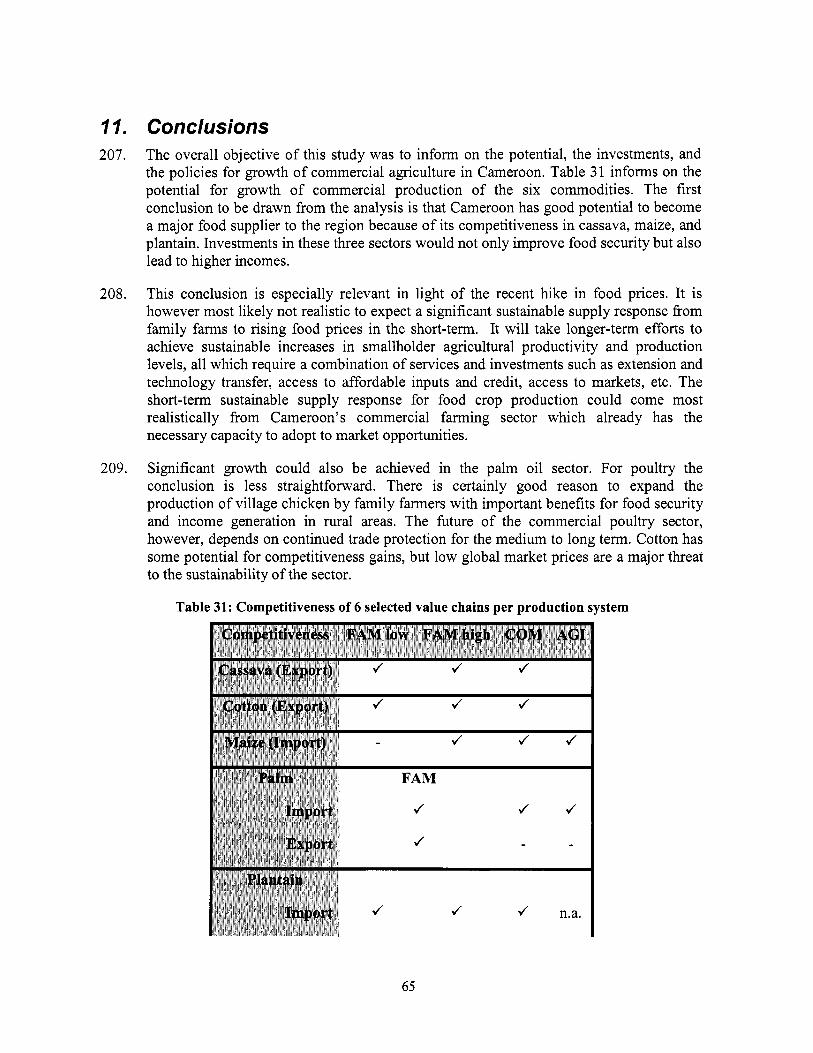
11. Conclusions 207. The overall objective o f this study was to inform on the potential, the investments, and
the policies for growth o f commercial agriculture in Cameroon. Table 31 informs on the potential for growth o f commercial production o f the six commodities. The f i rs t conclusion to be drawn from the analysis i s that Cameroon has good potential to become a major food supplier to the region because o f its competitiveness in cassava, maize, and plantain. Investments in these three sectors would not only improve food security but also lead to higher incomes.
208. This conclusion is especially relevant in light o f the recent hike in food prices. It i s however most likely not realistic to expect a significant sustainable supply response from family farms to rising food prices in the short-term. I t wil l take longer-term efforts to achieve sustainable increases in smallholder agricultural productivity and production levels, al l which require a combination o f services and investments such as extension and technology transfer, access to affordable inputs and credit, access to markets, etc. The short-term sustainable supply response for food crop production could come most realistically from Cameroon’s commercial farming sector which already has the necessary capacity to adopt to market opportunities.
209. Significant growth could also be achieved in the palm o i l sector. For poultry the conclusion i s less straightforward. There i s certainly good reason to expand the production o f village chicken by family farmers with important benefits for food security and income generation in rural areas. The future o f the commercial poultry sector, however, depends on continued trade protection for the medium to long term. Cotton has some potential for competitiveness gains, but low global market prices are a major threat to the sustainability o f the sector.
Table 31: Competitiveness o f 6 selected value chains per production system
65
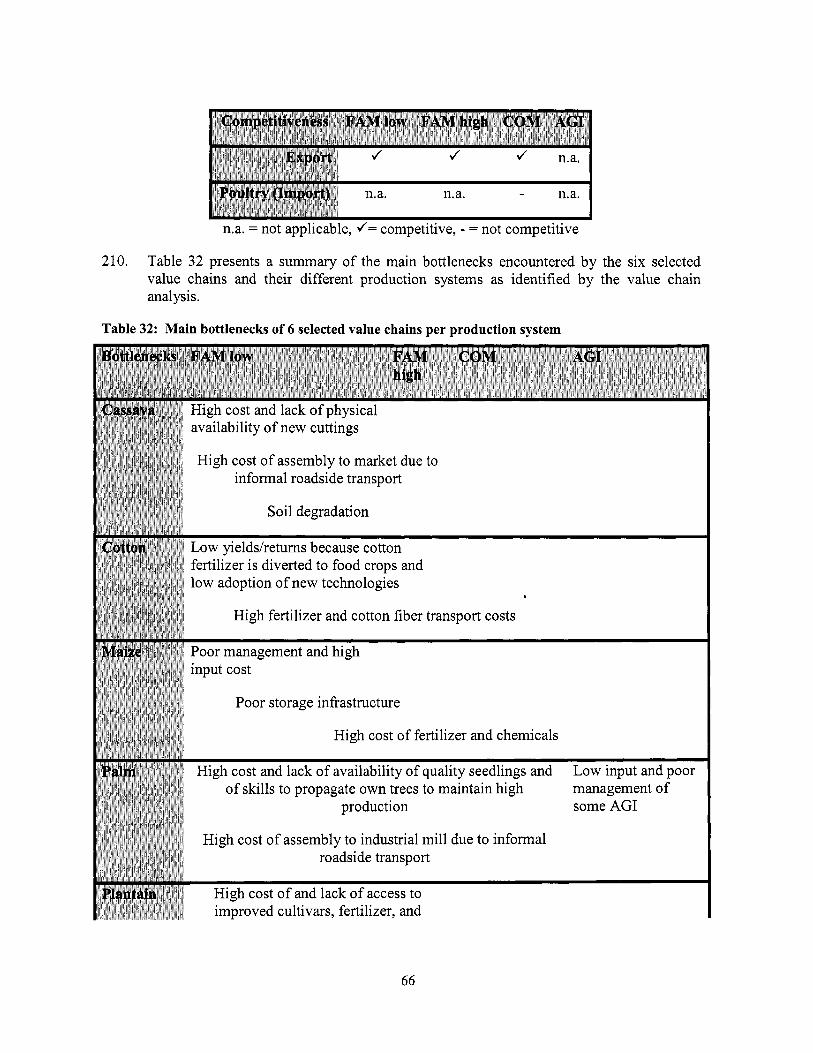
n.a. = not applicable, J= competitive, - = not competitive
210. Table 32 presents a summary o f the main bottlenecks encountered by the six selected value chains and their different production systems as identified by the value chain analysis.
Table 32: Main bottlenecks of 6 selected value chains per production system
66
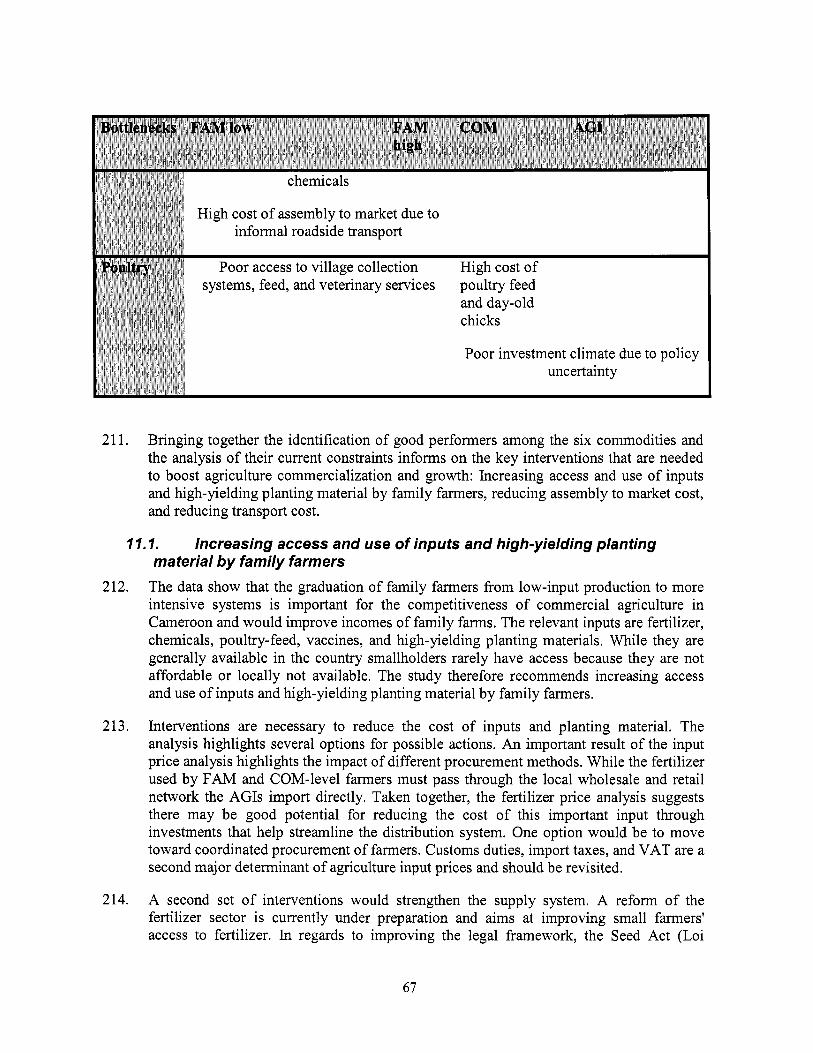
21 1. Bringing together the identification o f good performers among the six commodities and the analysis o f their current constraints informs o n the key interventions that are needed to boost agriculture commercialization and growth: Increasing access and use o f inputs and high-yielding planting material by family farmers, reducing assembly to market cost, and reducing transport cost.
11.7, Increasing access and use of inputs and high-yielding planting material by family farmers
212.
213.
214.
The data show that the graduation o f family farmers from low-input production to more intensive systems i s important for the competitiveness o f commercial agriculture in Cameroon and would improve incomes o f family farms. The relevant inputs are fertilizer, chemicals, poultry-feed, vaccines, and high-yielding planting materials. While they are generally available in the country smallholders rarely have access because they are not affordable or locally not available. The study therefore recommends increasing access and use o f inputs and high-yielding planting material by family farmers.
Interventions are necessary to reduce the cost o f inputs and planting material. The analysis highlights several options for possible actions. An important result o f the input price analysis highlights the impact o f different procurement methods. While the fertilizer used by FAM and COM-level farmers must pass through the local wholesale and retail network the AGIs import directly. Taken together, the fertilizer price analysis suggests there may be good potential for reducing the cost o f this important input through investments that help streamline the distribution system. One option would be to move toward coordinated procurement o f farmers. Customs duties, import taxes, and VAT are a second major determinant o f agriculture input prices and should be revisited.
A second set o f interventions would strengthen the supply system. A reform o f the fertilizer sector i s currently under preparation and aims at improving small farmers' access to fertilizer. In regards to improving the legal framework, the Seed Act (Loi
67

Semencibre) promulgated in 2001 and the Fertilizer Act (Loi sur les Engrais) promulgated in 2003 to improve regulation o f the market, should be revisited in order to determine why the implementing decrees (de'crets d 'application), which are necessary for any Act to be enforced have not yet been issued.
215. A third set o f interventions to increase access and use o f inputs and high-yielding planting material would increase input use efficiency and the dissemination o f new technologies. Possible actions could build on experience and lessons learnt o f The National Program for Agricultural Extension and Research (PNVRA), adopted in 1998, which was designed to develop agricultural research and revitalize agricultural extension services. A follow-on intervention, the National Agricultural Extension and Research Program Support Project - financed jo int ly by IDA, Government, IFAD and AfDB- implemented the national agricultural extension policy and agricultural research in the entire country. The development objective o f the National Agricultural Extension and Research Program Support Project was to contribute to improving agricultural productivity and incomes in Cameroon in a sustainable way. The outcome o f the overall project was satisfactory. Moreover, the PNVRA successfully created a new approach to support POs through micro-projects, including small grants, advisory services and market linkages. One lesson learnt by that intervention i s that a more targeted, demand-driven and comprehensive approach o f advisory assistance to registered producer groups initially reduces the number o f benefiting families because i t i s more expensive, but i t may also be more effective.
17.2. Reducing assembly to market cost for small farmers 216. A major bottleneck hampering access to markets by small producers i s the cost o f
assembly. Farmers transport their produce themselves mainly using the informal roadside transport network. The approximate cost o f moving 1 MT o f agriculture produce 130km using the consolidated system work out to around 20% o f the total cost using the informal roadside network. This i s because o f savings on each trader's round-trip fare, and use o f larger vehicles which provides savings on basic operating costs and lower per MT share o f tolls and excess road fees that have to be paid at official and unofficial roadblocks. As an overall strategy to improve the competitiveness o f agriculture products there i s a clear imperative to support moves to a more consolidated version o f the road freight system. Bulking produce into relatively small consignments at the village level could provide important savings by avoiding the need for each farmer to pay their own fare. A necessary intervention would therefore facilitate better coordination among farmers and tighter linkages to traders. Possible actions would include capacity building o f farmers and could create linkages between commercial and family farmers.
68
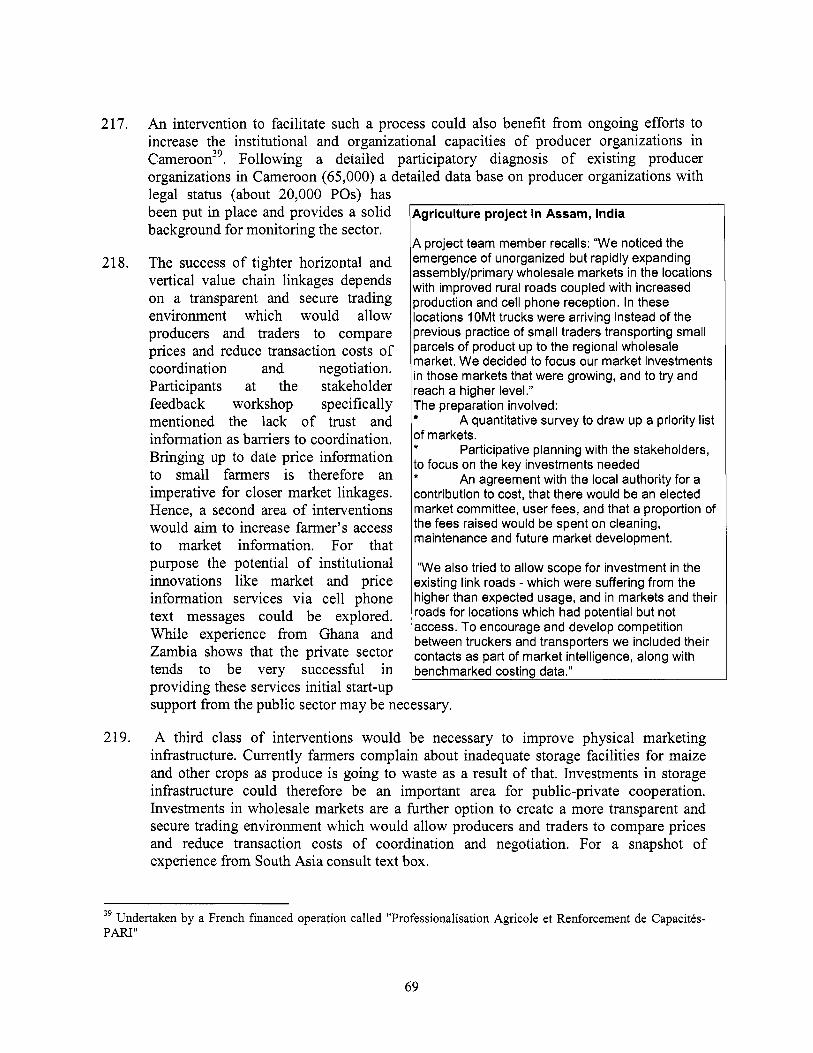
217.
218.
219.
An intervention to facilitate such a process could also benefit from ongoing efforts to increase the institutional and organizational capacities o f producer organizations in Cameroon39. Following a detailed participatory diagnosis o f existing producer organizations in Cameroon (65,000) a detailed data base on producer organizations with legal status (about 20,000 POs) has been put in place and provides a solid background for monitoring the sector.
The success o f tighter horizontal and vertical value chain linkages depends o n a transparent and secure trading environment which would allow producers and traders to compare prices and reduce transaction costs o f coordination and negotiation. Participants at the stakeholder feedback workshop specifically mentioned the lack o f trust and information as barriers to coordination. Bringing up to date price information to small farmers is therefore an imperative for closer market linkages. Hence, a second area o f interventions would aim to increase farmer’s access to market information. For that purpose the potential o f institutional innovations l i ke market and price information services v ia cell phone text messages could be explored. W h i l e experience from Ghana and Zambia shows that the private sector tends to be very successful in providing these services initial start-up
Agriculture project in Assam, India
A project team member recalls: “We noticed the emergence of unorganized but rapidly expanding assemblylprimary wholesale markets in the locations with improved rural roads coupled with increased production and cell phone reception. In these locations 10Mt trucks were arriving instead of the previous practice of small traders transporting small parcels of product up to the regional wholesale market. We decided to focus our market investments in those markets that were growing, and to try and reach a higher level.” The preparation involved:
of markets.
to focus on the key investments needed An agreement with the local authority for a
contribution to cost, that there would be an elected market committee, user fees, and that a proportion of the fees raised would be spent on cleaning, maintenance and future market development.
‘We also tried to allow scope for investment in the existing link roads - which were suffering from the higher than expected usage, and in markets and their roads for locations which had potential but not access. To encourage and develop competition between truckers and transporters we included their contacts as part of market intelligence, along with benchmarked costing data.”
A quantitative survey to draw up a priority list
* Participative planning with the stakeholders,
*
support from the public sector may be necessary.
A third class o f interventions would be necessary to improve physical marketing infrastructure. Currently farmers complain about inadequate storage facilities for maize and other crops as produce i s going to waste as a result o f that. Investments in storage infrastructure could therefore be an important area for public-private cooperation. Investments in wholesale markets are a further option to create a more transparent and secure trading environment which would allow producers and traders to compare prices and reduce transaction costs o f coordination and negotiation. For a snapshot o f experience from South Asia consult text box.
39 Undertaken by a French financed operation called “Professionalisation Agricole et Renforcement de Capacites- PARI “
69
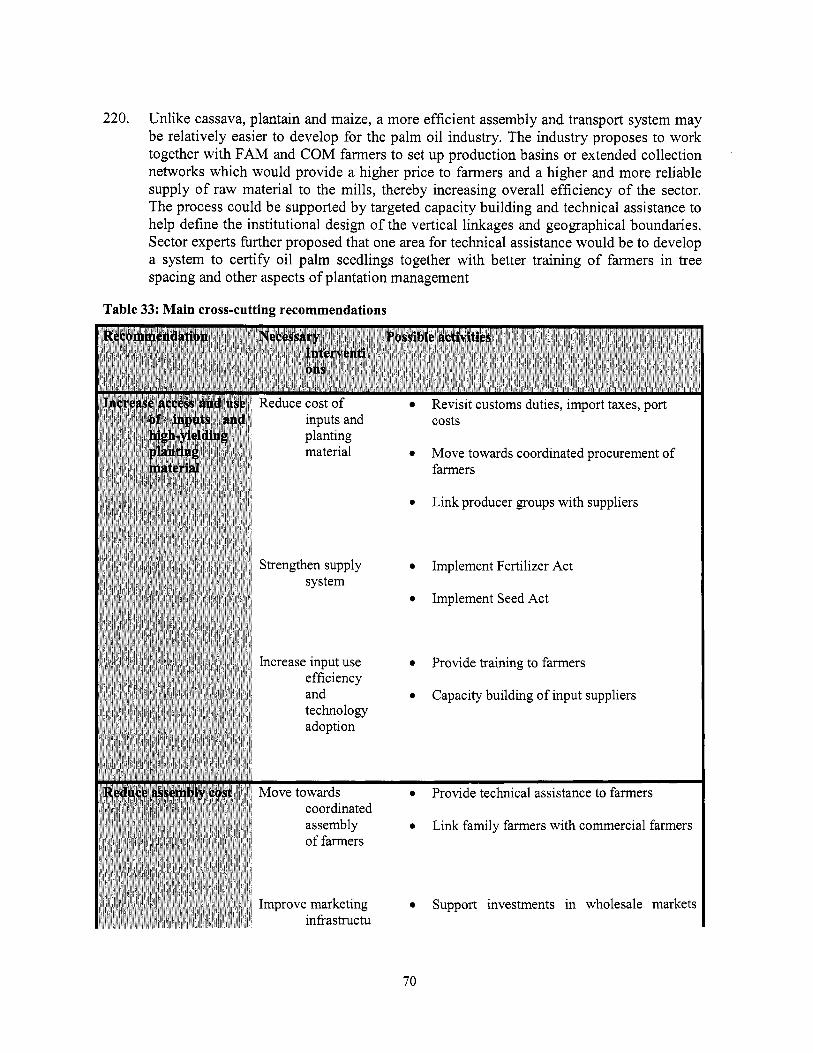
220. Unlike cassava, plantain and maize, a more efficient assembly and transport system may be relatively easier to develop for the palm o i l industry. The industry proposes to work together with FAM and COM farmers to set up production basins or extended collection networks which would provide a higher price to farmers and a higher and more reliable supply o f raw material to the mills, thereby increasing overall efficiency o f the sector. The process could be supported by targeted capacity building and technical assistance to help define the institutional design o f the vertical linkages and geographical boundaries. Sector experts further proposed that one area for technical assistance would be to develop a system to certify o i l palm seedlings together with better training o f farmers in tree spacing and other aspects o f plantation management
Table 33: Main cross-cutting recommendations
Reduce cost o f Revisit customs duties, import taxes, port inputs and costs planting material 0 Mnve tnwsrdq cnnrdinsted nrnciirement nf
Strengthen supply 0 Implement Fertilizer A c t system
Move towards 0 Provide technical assistance to farmers coordinated assembly 0 Link family farmers with commercial farmers o f farmers
Improve marketing 0 Support investments in wholesale markets infiastructu
70

r e
0 Support investments in storage facilities (PPP)
Increase access to 0 Investigate the potential of institutional innovations l ike market and price information services via cel l phone text messages
0 Reform the current system o f official and unofficial road blocks
11.3. Reduce transport cosf 22 1. Transportation costs are a major factor underlying al l final competitiveness calculations.
Crop inputs and outputs are affected in similar ways. The poor state o f rural roads leads to high cost o f moving goods around Cameroon and represents an important bottleneck to commercialization. During the rainy season, many production areas are inaccessible leading to heavy losses o f produce before reaching the market. Any program to improve the competitiveness o f Cameroon’s agriculture sector would therefore need a component focusing on rural roads linking producers to nearby markets and major transport routes.
222. I t i s recommended that such a component reforms the current system o f official and unofficial road blocks and police controls, which poses a heavy burden on agricultural trade in Cameroon. In the case o f plantain for example, transport operators reported 12 to 15 police controls from Ntui center to Mfoundi Market, a distance o f about 120 km, bearing in mind that each control represents an equivalent o f 1000 to 3000 CFA francs o f non official payments.
11.4. Issues to be explored 223. An important constraint was mentioned during the stakeholder feedback workshop but
does not fol low directly from the quantitative results. This constraint i s access to financial services for small farmers. The quantitative results show good potential for increased incomes from better and more intensive management. To realize this potential, greater expenditure and ability to cover up-front cash costs i s required. Commercialization wil l also lead to increased demand for saving deposits. Workshop participants reported that
71

the current rural financial system was not sufficiently developed to provide these services as needed. Investments were needed to strengthen the rural financial sector.
224. The cotton sector operates in a very difficult international environment, characterized by decreasing prices and tough competition. The thin margin between total value chain costs and export parity prices i s an important concern for long-term sustainability o f the sector. W h i l e there i s some potential for competitiveness gains through investments in farmer extension and transport, a medium term strategy should explore the potential o f G M O cotton. I t could be a direct route to increased incomes by providing higher yield at lower cost (less sensitive to planting time, reduced vulnerability to drought, less need for insecticides, etc). GMO cotton was not analyzed in this study and data on costs and benefits o f GMO inputs and impact on competitiveness should be collected.
72
Bibliograp hie
Cameroun (2008). Etude sur la competitivitk des f i l ihes agricoles. Filiere volailles - Poulet de chair. Document de travail. Version provisoire. Div is ion du Centre d’hvestissement de l a FAO.
“Cotton: International Commodity Profile” (FA0 2007)
Gergely, Nicolas (2007) Cameroon Country Study, prepared for Multi-Country Review o f the Impact o f Cotton Sector Reform in Sub-Saharan Africa, The Wor ld Bank, Agriculture and Rural Development Afr ica Region, Washington D C
Keyser, JC (2002). Indonesia: The Profitability o f Smallholder Tree Crop Production, Working Paper 2, Sustainable Management for Smallholder Tree Crops Development Project Sector Support, FA0 Investment Center for Asian Development Bank, Rome.
Keyser, John C (2008). Competitive Commercial Agriculture in Afr ica (CCAA) Synthesis o f Quantitative Results. The Wor ld Bank, Environmental, Rural and Social Development Unit, Washington DC.
Keyser, John C (2006). Definit ion o f Methodology and Presentation o f Templates for Value Chain Analysis, Competitive Commercial Agriculture in Afr ica (CCAA), The Wor ld Bank, Environmental, Rural and Social Development Unit, Washington DC.
Wor ld Bank (2004) Cameroon - National Agricultural Extension and Research Program Support Project, Implementation Completion and Results Report, The Wor ld Bank, Environmental, Rural and Social Development Unit, Washington DC.
73
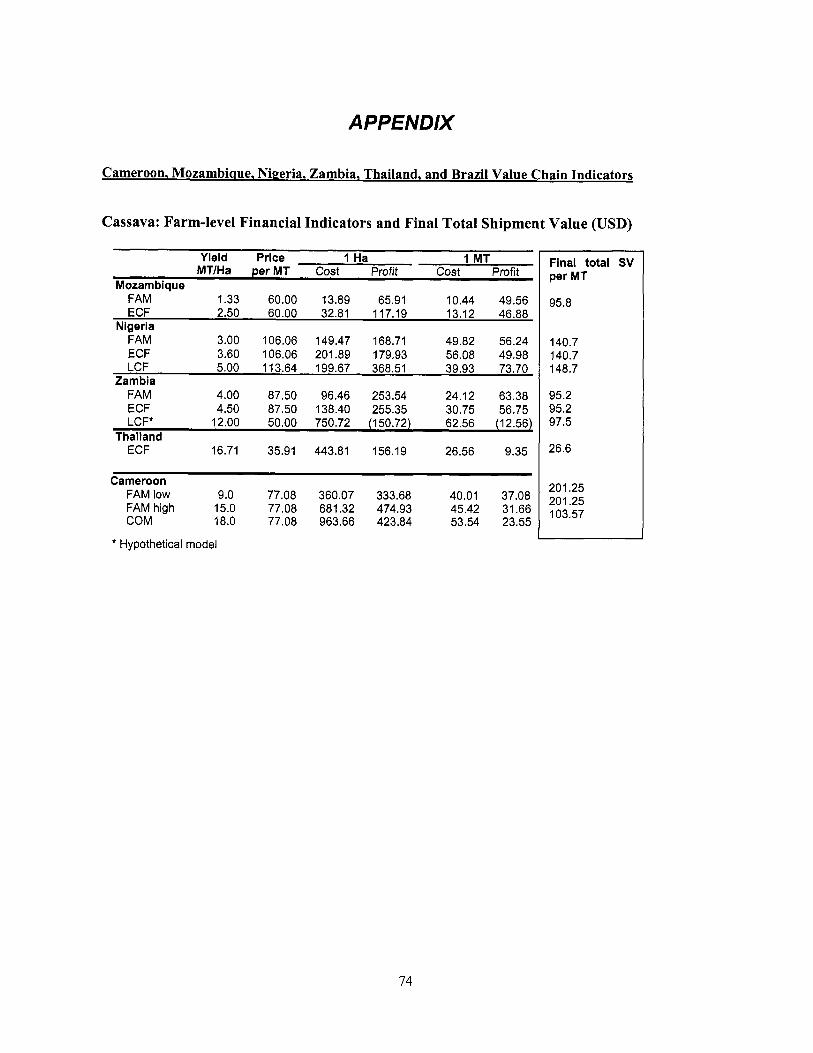
APPENDIX
1 MT Yield Price 1 Ha MT/Ha per MT Cost Profit Cost Profit
Moram bique FAM 1.33 60.00 13.89 65.91 10.44 49.56 ECF 2.50 60.00 32.81 117.19 13.12 46.88
FAM 3.00 106.06 149.47 168.71 49.82 56.24 ECF 3.60 106.06 201.89 179.93 56.08 49.98 LCF 5.00 113.64 199.67 368.51 39.93 73.70
FAM 4.00 87.50 96.46 253.54 24.12 63.38 ECF 4.50 87.50 138.40 255.35 30.75 56.75 LCF* 12.00 50.00 750.72 (150.72) 62.56 (12.561
ECF 16.71 35.91 443.81 156.19 26.56 9.35
Nigeria
Zambia
Thailand
Cameroon FAM low 9.0 77.08 360.07 333.68 40.01 37.08
COM 18.0 77.08 963.66 423.84 53.54 23.55 FAM high 15.0 77.08 681.32 474.93 45.42 31.66
* Hypothetical model
Cameroon, Mozambiaue, Nigeria, Zambia, Thailand, and Brazil Value Chain Indicators
Final total SV per MT
95.8
140.7 140.7 148.7
95.2 95.2 97.5
26.6
201.25 201.25 103.57
Cassava: Farm-level Financial Indicators and Final Total Shipment Value (USD)
74
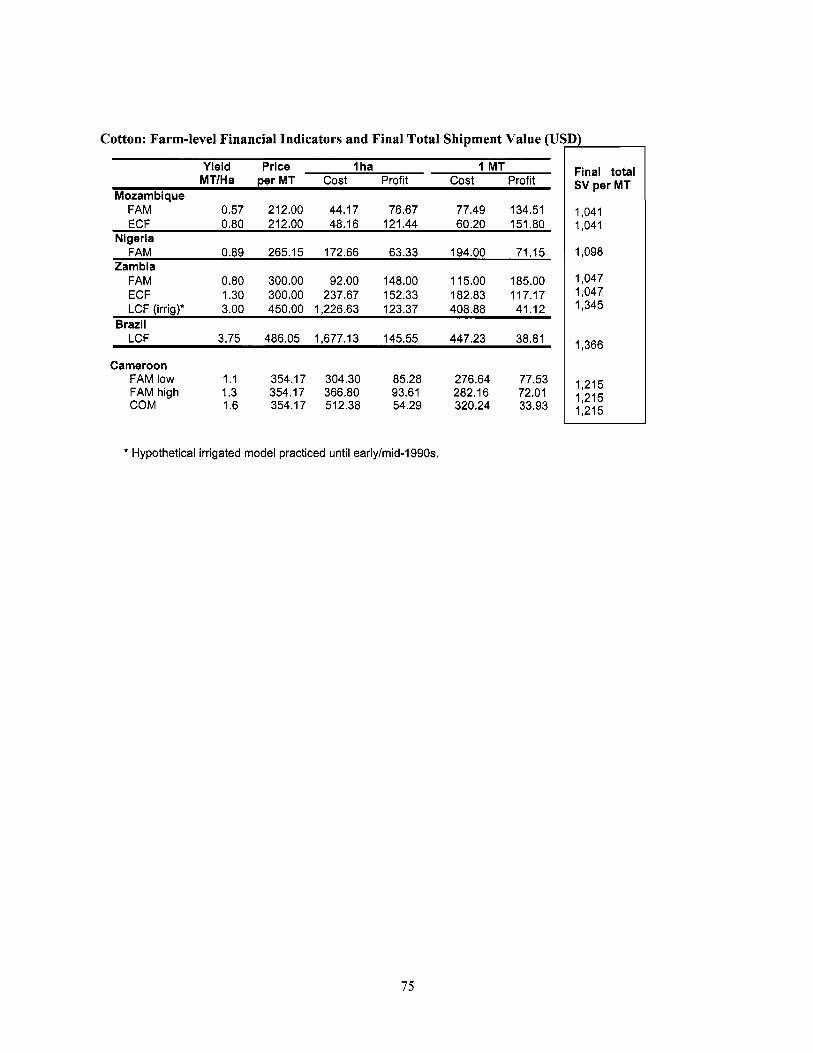
Cotton: Farm-level Financial Indicators and Final Total Shipment Value (USD)
Yield Price I h a 1 MT MTlHa perMT Cost Profit cost Profit
Mozambique FAM 0.57 212.00 44.17 76.67 77.49 134.51 ECF 0.80 212.00 48.16 121.44 60.20 151.80
FAM 0.89 265.15 172.66 63.33 194.00 71.15
FAM 0.80 300.00 92.00 148.00 1 15.00 185.00 ECF 1.30 300.00 237.67 152.33 182.83 117.17 LCF (irrigy 3.00 450.00 1,226.63 123.37 408.88 41.12
LCF 3.75 486.05 1,677.13 145.55 447.23 38.81
Nigeria
Zambia
Brazil
Cameroon FAM low 1 .I 354.17 304.30 85.28 276.64 77.53 FAM high 1.3 354.17 366.80 93.61 282.16 72.01 COM 1.6 354.17 512.38 54.29 320.24 33.93
* Hypothetical irrigated model practiced until earlylmid-1990s.
Final total sv per MT
1,041 1,041
1,098
1,047
1,215 1,215 1,215
75
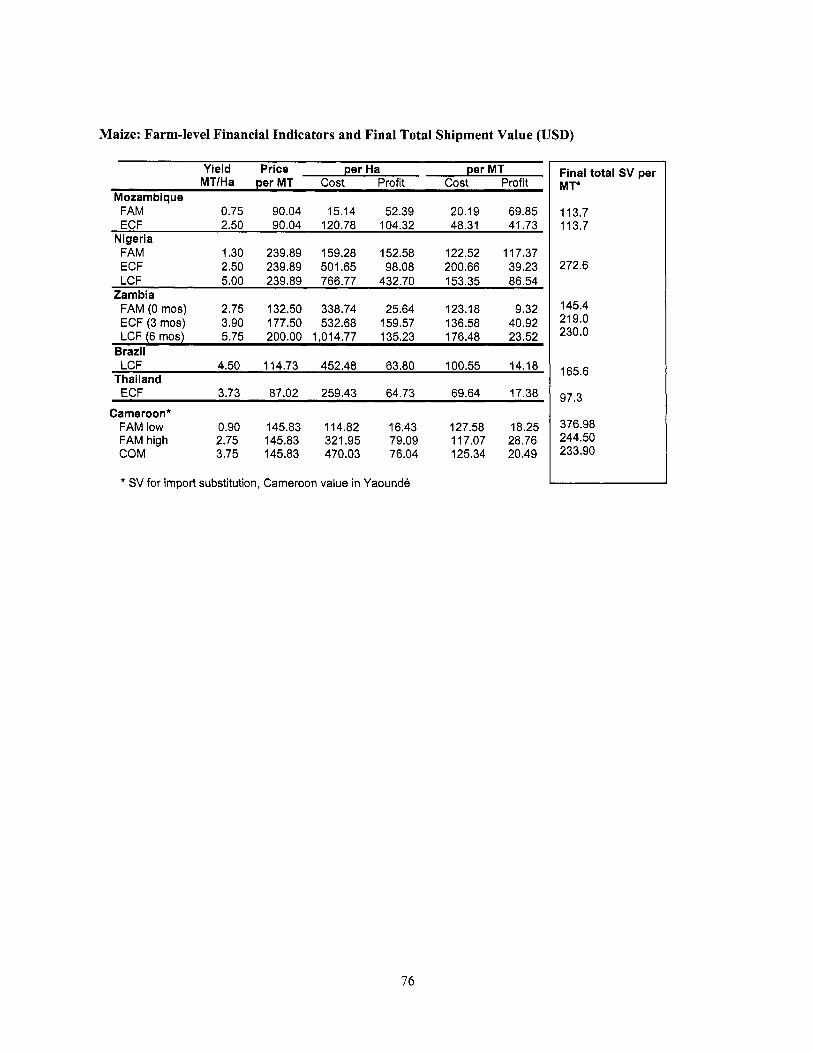
Maize: Farm-level Financial Indicators and Final Total Shipment Value (USD)
FAM 0.75 90.04 15.14 52.39 20.19 69.85 ECF 2.50 90.04 120.78 104.32 48.31 41.73
FAM 1.30 239.89 159.28 152.58 122.52 117.37 ECF 2.50 239.89 501.65 98.08 200.66 39.23 LCF 5.00 239.89 766.77 432.70 153.35 86.54
FAM (0 mos) 2.75 132.50 338.74 25.64 123.18 9.32 ECF (3 mos) 3.90 177.50 532.68 159.57 136.58 40.92 LCF (6 mos) 5.75 200.00 1,014.77 135.23 176.48 23.52
LCF 4.50 114.73 452.48 63.80 100.55 14.18
ECF 3.73 87.02 259.43 64.73 69.64 17.38
FAM low 0.90 145.83 114.82 16.43 127.58 18.25 FAM high 2.75 145.83 321.95 79.09 117.07 28.76 COM 3.75 145.83 470.03 76.04 125.34 20.49
Nigeria
Zambia
Brazil
Thailand
Cameroon*
Yield Price per Ha per MT Final total SV per MTlHa per MT Cost Profit cost Profit
Mozambique 113.7 113.7
272.6
145.4 219.0 230.0
165.6
97.3
376.98 244.50 233.90
* SV for import substitution, Cameroon value in Yaounde
76


EXTREME
NORD
N O R D
A D A M A O U A
E S T
C E N T R E
S U D
LITTORAL
S U D -
O U E S T
NORD -OUEST
O U E S T
SUDANO-SAHELIAN(COTTON)
(MAIZE, COTTON)
(MAIZE, POULTRY)
(PLANTAIN,CASSAVA,PALM OIL,POULTRY)
(PLANTAIN, CASSAVA, MAIZE, PALM OIL)
HIGH GUINEA SAVANNA
WESTERN
HIGHLANDS
MONOMODAL
BIMODAL HUMID FOREST
HUMID
FOREST
Benue
Niger
Uele
Congo
Mungo
Nyong
Ntem
Dja
Ngoko
Sang
ha
Boumba
Doume
Kade
i
Lom
Djerem
LakeAssomMbam
Faro
Vina
Mbe
re
Benoué
Mayo Kebi Lagone
Chari
Lake Chad
Gulf of Guinea
12° 14° 16°
12°
10°
8°
6°
4°
2°
14°12°10°
2°
4°
6°
8°
10°
This map was produced by the Map Design Unit of The World Bank. The boundaries, colors, denominations and any other information shown on this map do not imply, on the part of The World Bank Group, any judgment on the legal status of any territory, or any endorsement or acceptance of such boundaries.
0 40 80 120 160 KILOMETERS
0 20 40 60 80 100 MILES
CHAD SUDAN
NIGER
MALI
BENIN
NIGERIA
CAMEROON
CENTRAL AFRICAN REP.
EQUATORIALGUINEA
GABONCONGO
DEM. REP.OF
CONGO
SÃO TOMÉAND PRÍNCIPE
10°
0°
10° 20°
0°
10°
10° 20°
12°
10°
Yaounde
C A M E R O O N
AGRICULTURE COMPETITIVENESS
SELECTED TOWNS
PROVINCE CAPITALS
NATIONAL CAPITAL
PAVED ROADS
UNPAVED ROADS
RAILROADS
RIVERS
PROVINCE BOUNDARIES
INTERNATIONAL BOUNDARIES
AGRO-ECOLOGICAL ZONE LIMITS(COMMODITIES PRODUCED IN ZONE AND COVERED BY ESW)
EQUATORIALGUINEA
G A B O NC O N G O
C E N T R A L
A F R I C A N
R E P U B L I C
C H A D
N I G E R I A
BIOKO
R I O M U N I
(MAIZE)
IBRD 36100
APRIL 2008
Kribi Ebolowa
Mbalmayo
Moloundou
Yokadouma
Ndelélé
BatouriBertoua
Bélabo
Ndokayo
Baroua Boulai
MeidougouMalarba
Tibati
Banyo
Nkambe
Kumbo
Foumban
Dschang
MamfeBamenda
Bafoussam
Nbengwi
Wumo
Nguti
SupéNkongsamba
Bafang Bangangté
Kumba
Yabassi
Idenao
Mundemba
BueaDouala
LimbeEdéa
Monatélé
Ntuj
BafiaNanga Eboko
Tignére Ngaoundere
Mounguel
TcholliréGuibjibaPoli
Garoua
Guider
Kaélé
Yagoua
BogoMaroua
Mokolo
Mora
Kousséri
Sangmélima
Yaounde Akonolinga
Abong Mbang
Lomié
Foumbot
Obala
Mbouda
TikoPouma
Touboro