report no. 20991 -ind indonesia accelerating recovery in ... filebapepam badan pengawas pasar modal...
TRANSCRIPT

Report No. 20991 -IND
IndonesiaAccelerating Recovery in Uncertain TimesBrief for the Consultative Group on Indonesia
October 13, 2000
Poverty Reduction and Economic Management UnitEast Asia and Pacific Region
Document of the World Bank
Pub
lic D
iscl
osur
e A
utho
rized
Pub
lic D
iscl
osur
e A
utho
rized
Pub
lic D
iscl
osur
e A
utho
rized
Pub
lic D
iscl
osur
e A
utho
rized

CURRENCY EQUIVALENTS(As of October 9, 2000)
Currency Unit = Rupiah (Rp.)US$l= Rupiah 8800
ABBREVIATIONS AND ACRONYMS
ADO Automative Diesel Oil JPS Jaringan Pengaman SosialAMC Asset Management Company (Social Safety Net)APEC Asia-Pacific Conference JSX Jakarta Stock ExchangeBAPEPAM Badan Pengawas Pasar Modal KKN Korupsi, Kolusi, Nepotisme
(Capital Market Supervisory Board) (corruption, collusion, and nepotism)BI Bank Indonesia Keppres Keputusan President, PresidentialBIS Bank International Settlements DecreeBPS Badan Pusat Statistik (Central Bureau KORPRI Korps Pegawai Republik Indonesia
of Statistics) (Civil Servants Association)CAP Corrective Action Plan LOI Letter of IntentCFAA Country Financial Accountability MIGA Multilateral Investment Guarantee
Assessment AssociationCIEC CIEC Data Company Ltd. MOF Ministry of FinanceCGI Consultative Group Indonesia MPR Majelis Pernusyawaratan RakyatCPAR Country Procurement Assessment (People's Consultative Assembly)
Review MSAA Master Settlement Asset AgreementCPI Consumer Price Index NGO Non-Governmental OrganizationDPOD Dewan Penasehat Otonomi Daerah NPL Non-performing Loans
(Regional Autonomy Advisory Board) OPK Operasi Pasar Khusus (Special MarketEAP East-Asia Pacific Operation)FDI Foreign Direct Investment PER Public Expenditure ReviewFSPC Financial Sector Policy Committee PLN Perusahaan Listrik Negara, Indonesia'sFY Fiscal Year national power companyGDP Gross Domestic Product PP Perusahaan Pemerintah, GovernmentGFS Government Finance Statistics regulationsGOLKAR Golongan Karya (Functional Group) SAKERNAS Survey Angkatan Kerja NasionalIBRA Indonesia Bank Restructuring Agency (National Labor Forces Survey)IBRD International Bank for Reconstruction SIMA Statistical Informnation Management &
and Development Analysis SystemIDA International Development Agency SME Small Medium EnterprisesIMF International Monetary Fund SUSENAS Survey Sosial Ekonomi NasionalIPP Independent Power Producers (National Socio-economic Survey)IUCN International for the Conservation of US United States
Nature VAT Value Added TaxJIBOR Jakarta Inter Bank Offer Rate WATSAL Water Sector Adjustment LoanJITF Jakarta Initiative Task Force WDR World Development Report
WTO World Trade Organization
FISCAL YEAR:April 1-March 31 till 2000
FY2000 is 9 months, Apr. I to Dec. 31Same as CY from 2001 onwards
Regional Vice President: Mr. Jemal-ud-din Kassum, EAPVPCountry Director: Mr. Mark BairdChief Economist: Mr. Masahiro Kawai, EAPVPSector Director: Mr. Homi Kharas, EASPRTask Team Leader: Mr. Bert Hofman, EASPR

Acknowledgements
This report was written by a team led by Bert Hofman, and consisting of Keiko Kubota, ShanGooptu, and Magda Adriani. Vikram Nehru was lead advisor. Contributors were MichaelEdwards, Ruth Neyens, Paula Perttunen, Dara Lengkong, William Peter Mako, Thomas Walton,Teddy Herman, Sarwar Lateef and Anthony Toft. Helpful comments were received from HiroKawai, Tim Buehrer, David Ray, Sandy Lieberman. Document processing and Editorial supportwas provided by Cynthia Abidin, Nina Herawati, Christina Setiadi, Adele Rosi and MurielGreaves. Peer reviewers were: Adam Schwarz, Anggito Abimanyu, Joshua Felman, and ZiaQureshi. Overall guidance was provided by Homi Kharas and Mark Baird. The findings of thisreport were conveyed to government officials on October 5, 2000.

INDONESIA
ACCELERATING RECOVERY IN UNCERTAIN TIMES
BRIEF FOR THE CONSULTATIVE GROUP ON INDONESIA
Table of Contents
Pages
EXECUTIVE SUMMARY ................................................................. i
CHAPTER 1: RECOVERING AMIDST UNCERTAINTY ................................................................ 1Growing again, modestly ...............................................................1IRecovering wages, declining poverty ................................................................ 1Shrinking deficits ............................................................... 3Inflation under control ................................................................ 4Strong current account, fleeing private capital ............................................................... 5Politics and financial markets ............................................................... 6
CHAPTER 2: ACCELERATING BANK AND CORPORATE RESTRUCTURING .............................9Back from the abyss ................ 9................................................9Remaining challenges are mounting ............................................................... 10IBRA performance ............................................................... 13Improving speed and quality of IBRA's operation ............................................................... 14Corporate Restructuring ............................................................... 16Accelerating restructuring ............................................................... 17
CHAPTER 3: MAINTAINING FISCAL SUSTAINABILITY ............................................................... 20Deeply in debt ............................................................... 20Development spending under pressure ............................................................... 22The fiscal impact of decentralization ............................................................... 24Policy options for fiscal sustainability ............................................................... 25The role of the donors ............................................................... 28
CHAPTER 4: ATTACKING POVERTY ............................................................... 30Assessing Poverty ............................................................... 30Constructing a strategy for the future ............................................................... 32
CHAPTER 5: GOVERNING INDONESIA ............................................................... 36The political transition ............................................................... 36Legal and judicial reforms ............................................................... 37Priorities for civil-service reform ............................................................... 38The war against corruption ............................................................... 41Managing the governance agenda ............................................................... 43
TABLES IN TEXTTable 1.1: Regional growth forecasts ............................................................... 7Table 2.1: Before and after ............................................................... 9Table 2.2: Resolution of IBRA credits, 30 September 2000 ............................................................... 14Table 2.3: Debtors and creditors ............................................................... 16

Table 2.4: Selected debt restructuring transactions ...................................................... 16Table 2.5: Illustrative restructuring measures ...................................................... 17Table 3.1: Budget fiscal year 00 and draft budget fiscal year 01 ...................................................... 27Table 5.1: Public sector employment comparatives for Indonesia per capita ........................ ................ 40
FIGURESFigure 1.1: Indonesia's fragile recovery ........................................................ 2Figure 1.2: No pressure ........................................................ 4Figure 1.3: Foreign dis-investment in Indonesia.... the odd man out in former crisis countries . 6Figure 1.4: Less vulnerable, but not safe .................................. 6Figure 1.5: Fledgling consumer confidence .................................. ,.7Figure 2.1: Indonesia: banking system loan assets .................................. 10Figure 2.2: The bottom line .................................. 10Figure 2.3: Basically bonds ................................... 11Figure 2.4: Diminishing expectations .................................. 13Figure 3.1: Mounting debt ..................... 20Figure 3.2: Budgetary pressures ...................... . . . . . . . . .21Figure 3.3: Historically high ..................... 22Figure 3.4: Not taxing ..................... 26Figure 3.5: Falling short ..................... 28Figure 5.1: Governance matters ..................... 37
BOXESBox 1.1: Where did all the imports go? .3Box 1.2: Indonesia's booming economy .5Box 3.1: Contingent liabilities: the case of PLN .22Box 3.2: Using aid for sector reforms and investment: the example of WATSAL .28Box 4.1: Many different poverty lines; many different poverty measures .31Box 4.2: Measuring vulnerability .32Box 4.3: Local capacity for collective action in Indonesia .33Box 5.1: The National Law Commission .38Box 5.2: Forestry - governance issues in a microcosm .40
STATISTICAL ANNEXES .................. 45
ii

Executive Summary
Indonesia is staging a modest economic recovery. Market uncertainty was also fed by policyFor the country's first democratically elected slippage. The new administration was quick to putgovernment since the 1950s, the recovery was the together a comprehensive reform program, but didgood news, and the rapid decline in poverty gave not live up to implementing it. Whilecomfort. But it was a trying year for those who macroeconomic policy remained largely on track,expected a radical change in the way Indonesia is structural policy reforms were implemented onlygoverned. Issues ranging from the unity of after long delay. To its credit, the government didIndonesia and the cabinet to the role of the military raise domestic fuel prices in October, 2000, butin politics and society consumed much of the this was some six months late. Similarly, crucialcountry's energy, leaving policy makers little time steps in bank and enterprise restructuring tookfor a serious debate on development strategy and inordinately long, thereby postponing thepolicy. Perhaps too little time, as the recovery can resumption of credit needed to nurture thestill be derailed byjittery markets, fleeing investors recovery. Finally, reversals in trade policy (inand fragile consumer confidence. Investors and particular the rice and sugar tariffs) and new limitsconsumers need to be assured that, although on foreign investment put in doubt Indonesia'ssetbacks may occur, in the end the right policies longstanding commitment to open markets.will prevail. Providing that confidence is thechallenge for the new cabinet. It is hardly surprising, then, that the economic
recovery is still far from secure. VolatileRecovery in uncertain times consumer confidence may yet suppress
consumption growth. Concerns with fiscalIndonesia's recovery has so far proved resilient to sustainability will constrain government spending.the political turmoil of the first year of the Wahid And to continue expanding, investment andadministration. Growth took hold, and its base has exports will need more credit than the bankingexpanded beyond consumption. Inflation is under system currently extends. Moreover, maintainingcontrol, real wages are rising again, and poverty current growth rates is not nearly enough. GDPhas declined from a punishing peak of over 23 growth of four percent will only bring per-capitapercent (as estimated by BPS using its new poverty income back to pre-crisis levels in 2007, threeline). Rapid export growth and high oil prices years after the next elections. Four percent growthwere enough to offset capital outflows, and also pales in comparison with pre-crisis rates ofIndonesia's cushion of international reserves over seven percent, and is unimpressive whenincreased. Higher oil prices and incomes raised compared to such crisis-hit countries as Korea andgovernment revenues, lowered the deficit and Malaysia. And faster growth is needed to help thelimited financing needs. And the first results in poor and protect the vulnerable.bank and corporate restructuring emerged, albeitafter long delays. The agenda ahead
Financial markets were not convinced by the The agenda ahead is formidable. The newdevelopments in the real economy. Political Coordinating Minister's "Ten Point Program toturmoil, regional unrest, and periodic outbursts of Accelerate the Recovery" is an encouraging start.violence drove the Rupiah and the stock market The program recognizes the need to calm financialdown, interest rates up, and foreign investors away. markets, and continue cooperation with theDevelopments in East, and then West Timor hurt international community. And it promises to makeIndonesia's standing in international fora, and a difference for ordinary Indonesians by focusingdistracted further from the economic agenda. on agriculture and small and medium enterprises.Allegations of corruption affecting various parts of The challenge now is to translate the program fromgovernment and slow progress in the prosecution a statement of objectives into a developmentof corruption cases rocked the belief that a new agenda that elicits broad support at home andgovernment would be one free of KKN. abroad.
i

In the short run, the Government can best restore existing owners are not rewarded, the returns tomarket confidence by acting decisively on three taxpayers are acceptable, and the Government'spressing issues that could derail growth and reputation is not damaged. A set of principlesstability: bank and enterprise reform, next year's should guide IBRA in all its restructuring deals tobudget, and decentralization. The larger agenda ensure that the interests of the state are protectedincludes a fundamental revamp of governance and and the economy recovers quickly. At a minimum,institutions, and mainstreaming poverty reduction these principles should consider: the role of IBRAobjectives in all govemment policies, programs, given its existing mandate; the importance ofand projects. ensuring transparency at all times; the
consequences for asset recovery and theAccelerating bank and enterprise restructuring. implications for govemment debt and contingentAccelerating bank and enterprise restructuring is a liabilities; and protection of government's share inmust, because without new credit and investment, any future upward revaluation of assets.the recovery will run out of steam. After muchdelay, and an extremely costly bank The hesitant progress of bank and corporaterecapitalization program, there has been some reforms points to the urgent need for a consensusprogress. Banks have largely been recapitalized - on the long-run goals of the financial and corporatealbeit only to a four percent capital adequacy ratio. sectors. In particular, there needs to be broadSome banks have renewed lending on a modest agreement on a strategic vision for the financialscale, and some are even showing profits again. system and a thorough debate on the policiesIBRA's external governance and the pace of its needed to get there. Implementation will be helpedrecovery operations have improved. Voluntary immensely if a frank dialogue betweensettlements of debt - through the JITF and government, parliament, donors, civil society, anddirectly between debtor and creditor - have sector representatives address such key issues as:picked up as well, showing that there is life after the future role of state banks and the mechanismsdebt for corporate Indonesia. for privatizing them, principles goveming the
restructuring of IBRA's assets, the role of foreignThe tenuous beginnings in corporate and bank investment, the importance of a strong bankrestructuring must be nurtured. To start lending supervision agency, and the relationship betweenagain in earnest, banks must regain profitability banks and non-bank financial institutions.and build their capital adequacy ratio beyond fourpercent and toward international standards. For Achieving fiscal sustainability. Next year's draftthis to happen, the Government must complete budget focuses on fiscal sustainability. In contrastbank recapitalization, while moving aggressively to previous years, there is neither need for fiscalin restructuring and divesting state banks. stimulus in a recovering economy, nor is therePrivatization of state banks is a priority, as no budgetary room for one. Debt service, rising civilfinancial sector can thrive if over 70 percent of the service salaries, and politically sensitive fueldeposit base is in the hands of the state. The recent subsidies are squeezing development spending, anddecision to postpone the planned divestments of will do so for some time to come. The silver liningtwo banks unfortunately runs counter to this to this particular cloud is that it forces thestrategic direction, and Govemment could best Government to focus on increasing efficiency inlimit damage by bringing this part of the program development spending. One way is to betterback on track quickly. allocate scarce public resources and emphasize
programs and projects aimed at poverty reduction.To maximize asset recovery, and minimize For example, savings from cuts in fuel subsidiesopportunities for graft, IBRA's asset sales should could be used to boost deserving social programs.proceed according to a transparent and competitive The Government must therefore create the politicalprocess. The Government could deflect allegations climate that allows for further cuts in fuel subsidiesof fire sales by sharing in the upward potential of - by exposing their highly regressive nature andthe assets sold, as was done in Thailand and Korea. the enormous waste involved, and by pointing outWhen IBRA restructures its loans, it must ensure the alternative uses of the money. Donors woulddebtors commit to restructuring operations, welcome and support a more cogent and strategic
ii

public expenditure program that rests on an as smooth progress in policy reforms over a broadunderlying framework of poverty reduction and spectrum - from govemance to gas, from povertygood govemance. to PLN.
Higher efficiency can also be achieved through Managing Decentralization. Decentralization canbetter budget processes, stronger financial make or break Indonesia. It is a strong politicalmanagement, and strict observation of procurement imperative for the country, and makes goodrules based on intemational best practice. This economic sense, since Indonesia is unusuallywill be especially important as Indonesia moves centralized for a country of its size and diversity.toward a decentralized govemment structure. But if managed badly, the transition to aGood financial management will require that the decentralized Indonesia could destabilize thesame fiduciary standards apply to all levels of economy, disrupt govemment services, and evengovernment. This would mean training and hamper intemal trade. The August 2000 MPRdissemination of infonmation on an unprecedented session called for a gradual process ofscale. It would also mean the involvement of decentralization. But three months before the startcommunities, civil society organizations, NGOs, of implementation, few know what this entails.and universities in monitoring the performance of The law requires the central govemment to transferpublic institutions, blowing the whistle when a substantial amount of revenues to the regions;improprieties are observed, and even being but if these transfers are not matched with ainvolved in designing and implementing selected devolution of expenditure responsibilities, thepublic programs and projects. Donors will be center will find itself short of resources. Theeager to support these initiatives if they see serious sharing of natural resource revenues will puteffort by govemment - because it would enable pressure on the budget and distribute fiscalthem to increasingly support decentralized resources unequally between regions. It isoperations and improve aid effectiveness at the important that general transfers from the center tosame time. For their part, donors could build the regions help rectify this, at least partially.flexibility into project designs to matchimplementation capacity in different regions. The Government intends to limit borrowing by
regions, thereby eliminating a key fiscal risk ofTo regain fiscal sustainability, the Govemment decentralization. But local governments should bemust also raise tax collections - first and foremost allowed to borrow resources from the center inby improving tax administration. And asset accordance with strict rules and procedures so theyrecovery must contribute to financing the deficit, can invest in high priority sectors; such as, healtheven though revenues from IBRA assets will be far and education. Such arrangements would alsobelow book value. As these measures take hold, facilitate financial support from donors whosethe Government can again shift towards rebuilding statutes require them to lend only to the centrala public investment program that reflects its government. The center could on-lend these fundspriorities, and an appropriate role for the state. to local governments for their intended purposes
using subsidiary loan agreements.Next year's draft budget already includes measuresto raise more revenues, and makes a start to reduce The best insurance against fiscal risks or afuel subsidies. The budget deficit is therefore disruption in service delivery is orderlyexpected to decline from 4.8 percent of GDP this implementation of decentralization. In the shortyear to 3.7 percent in FY2001. Privatization and time left, the Government will need to focus notIBRA asset recovery will cover some 2.3 only on finishing regulations, but also on achievingpercentage points of this, but the rest will need to broad agreement with the regions onbe financed from abroad. Together with implementation timing and strategy, and onamortization - still kept relatively low by the ensuring that civil servants get transferred - andagreement reached with the Paris Club - gross paid. To reduce uncertainty, the Government mustfinancing needs from the CGI will be in the range widely disseminate as much information asUS$4.5-5 billion. Achieving this target will possible to all stakeholders. But even with perfectrequire accelerated project implementation, as well planning, things will probably go wrong;
iii
fortunately, the draft budget includes some money making, and implementation capacity. Indeed, ato meet such contingencies. Parliament would be poverty agenda is a govemance agenda. After all,well advised to leave it there. it is the poor who are hurt most by misdirection of
scarce budgets, by monopolies that killMainstreamingPovertyAlleviation. Government's opportunities for small enterprises, and by illegaloverarching medium-term objective continues to fees that keep kids out of school. In this context,be poverty alleviation. The President reinforced decentralization should be used as an opportunitythis objective in his August 2000 speech to the to improve public services for the poor. InMPR. Fortunately, economic recovery and lower addition, better education, health care, and basicfood prices have helped lower the poverty rate infrastructure that gives access to markets will befrom its crisis peaks. But over half the population important. And land titling that gives access toremains vulnerable to poverty, and many lack land and collateral will assist rural investment,access to essential services. Now that the crisis is incomes, and employment.subsiding, the Govemment must move beyond asocial safety net, and mainstream poverty Finally, there will be a continuing need for safetyalleviation in all its activities. In doing so, there is nets that assist the poorest in coping with harda need to acknowledge the multidimensional nature times. This would not be a dominant part of theof poverty and design programs and interventions overall poverty strategy, but will be aimed ataccordingly. In addition, Indonesia's new reaching the ultra-poor and those who suddenlydemocratic and decentralized system will demand fall on hard times.the govemment does three things well: ensureadequate information on development programs, Improving governance. Despite setbacks, thegive voice to the poor, and ensure officials are held govemance agenda has seen some progress. Theaccountable for their actions. police was separated from the military, and the
latter was put under civilian control. VariousA poverty strategy for the future should emerge watchdogs of the Govemment and the judiciaryfrom a reflective, factually informed dialogue were appointed, a law reforrn commission tookamong all stakeholders. Two areas of actions will office, some judges were charged with corruption,figure prominently. The first is the policy and a few courts even handed down bankruptcyenvironment for reducing poverty and judgements. Emerging political debates inside andvulnerability. This would include policies in outside parliament promise more such actions tosupport of rapid and sustainable growth, economic come. But the rule of law in Indonesia is still farempowerment of the poor, and a public from assured. The govemment must change theexpenditure program that is pro-poor. way Indonesia govems itself - from its political
process, to its legal system and its civil service,The second area of action is the delivery of from the role of the military to the way theeffective services that reach the poor. Experience Govemment handles its finances. No one expectshas shown that it is not just what government does these profound changes to happen overnight, but aor how much it spends, but also how well it credible, comprehensive plan is due, with strongprovides services. To do this, the government will leadership, and early actions that signalneed to improve local govemance, decision commitment.
iv

Chapter 1. Recovering amidst uncertainty
1.1. Indonesia's nascent recovery proved collapsed, both exports and imports are now growingremarkably resilient to the political turmoil of vigorously, and the latter perhaps more than shown inthe first year of the Wahid administration. the statistics (see Box 1.1). Exports benefited fromGrowth took hold and the expansion is no longer buoyant world trade, which grew by 11 percent innarrowly based on consumption. Inflation 2000, twice as fast as the previous year. Onlyremains well under control despite a recent inventories still show a decline, but this is a statisticaluptick, and poverty has continued to drop thanks artifact rather than reality."' In all of this, Indonesia'sto lower food prices and recovering real wages. pattern of growth now looks similar to other crisis-hitBut the transition from the law of the ruler to the countries - albeit at a lower level of growth.rule of law has not been a smooth one, nor can itexpected to be. The accompanying political 1.4. The Government's projection of 3-4 percentuncertainty, policy reversals, and sectarian GDP growth for the year 2000 is well within reach.violence affected repeatedly financial markets, But this target is modest, and Indonesia is still bottomdriving interest rates up, consumer confidence of the class of the East Asian crisis countries. Southdown, and foreign investors away at a time when Korea is in the lead, projecting a whopping 8.7the recovery has only just begun. percent growth this year. And even the Philippines
- never a rapid grower, and less hurt by the crisis -Growing again, modestly raked up 4.2 percent growth in the second quarter, a
sliver ahead of Indonesia. The output gap caused by1.2. The nascent recovery the Wahid the crisis is nowhere as large as in Indonesia: theadministration inherited gained strength during country's GDP is some 30 percent below what itthe past year. Gross Domestic Product (GDP) would have been if pre-crisis trend growth hadexpanded by 4.1 percent over the year up to the prevailed (Figure 1.1). For Korea - the champion ofsecond quarter of 2000, a sharp contrast with the recovery - the gap is barely 10 percent. And at14 percent output loss in 1998, and no growth in Indonesia's current pace of growth it will take up to1999. The recovery is also becoming broader seven years before GDP per capita will return to itsbased: with the exception of agriculture, all pre-crisis level.sectors contributed to growth, with construction,transportation and communication doing Recovering wages, declining povertyparticularly well. Individual manufacturingindustries such as motorbikes and cars saw 50- 1.5. The recovery has been decidedly pro-poor.100 percent growth in their outputs, but these Wage increases and improving employmentrates look less impressive once the low level of prospects contributed to the rapid reduction in thecapacity utilization is considered. The cement number of income poor. An important factor was theindustry output is now at pre-crisis levels, and sharp decline in food prices - especially rice, whichelectricity is even a remarkable 20 percent above benefits most the poor who spend disproportionallythat level.' Agriculture did less well in 2000, but on food. The 20 percent decline in the price of riceeven so, output remained well above the since January 1999 added some nine percent to realdisastrous El-Nino years 1997 and 1998, and spending power of the poor.1'i The headcount ratio ofabundant supply aided food prices to fall this poor came down from the 23 percent of theyear. population at the peak of the crisis (Chapter 4). The
crisis also slightly improved Indonesia's income13. All demand factors are now growing as distribution, confirming that higher income earnerswell. Fixed investment growth has taken over were hit harder by the crisis than low incomethe lead from consumption, which in Indonesia earners.iV But despite these improvements, more thannever fell as deep during the crisis as in other half of Indonesians are vulnerable, and risk a returncountries. Consumption continues to grow, but to poverty.at a slower pace in part because of fledgingconsumer confidence. In contrast to 1998 and 1.6. Wages are recovering from their crisis lows.early 1999, when exports declined but imports Real manufacturing wages are now only 12 percent

Figure 1.1: Indonesia'sfragile recovery
Indonesia's real recovery is taking hold... .. .and the recovery is broadening.,.(GDP growth, YOY) (Contribution to GDP growth by expenditure category,
percentage point)P-tq. _ .
l ~~~~~~~~~~~~~~~~~~~~~~~~~~Pnnoent.ae point10 Percent 5 .
Prin.t Cearonsptlen_NO Tr_d.
-5.aQ10 Fixed'~~~~~~~ l"' ;sll!ElWlj:/P#~~~~~~~~~~~~~~~~~~~~~~~~~~ll*S,ltt
-10 15
20 Cotwnpue.
-25 Change In In-ettonhi*21) -30 -- - _ _ _ _ _ _ _ _ _ _
1 0Q3 Q1 03 Q1 Q3 Q0 01 03 Q1 03 Q1 Q3 01
1997 198 19S9 2m 1997 1998 1999 2000
... inflation remains under control ... ... and incomes are rebounding.(Percentage change in CPI and Food Price Index, YOY) (Real manufacturing wages and consumption, Index
1996:QI=100)In,pI-, In(Actuad-
Rupiat, . 120-
90 Foodt Price- /ie
11000 - .Wvo
650i 100 \
4Ct / ~~~~GertwtalCP 0
90 8~~~~~~~~~~~~~~~~~~~~00
15 \ 8000 Red0rINct
jarF97 JUF-97 Jan98 Ju1-98 JaJ99 JUF-99 Jan-00 Jut-00 Mar-96 Sep-96 Mar-97 Sep97 Mar-Se Sap-98 Mar-99 Seel99 Mar-0
But politics still jitter thle markets .... .......... ... and output remains well below capacity.(JSE Ixdex, and Dollar per Rupiah, Index 10-10-99=100) (Atual and simulated output, Rp Tr., 1993 prices)
130 - Ouadeted GDP (rillion RP, 1993 pnrMs)
120 130,000
70 . . , t so ooo I~~~~~~~~~~~~~~~~~~~~~~~~~................. . ........ .......
10 1037S I/YdII01 031 t/0 3Q 2C0710 . IQQ30Q10Q30Q10Q30Q10Q30Q1Q31Q31
1894 1995 1996 1997 1998 1999 20(00
Note: Pre-crisis growth trend is a Hodrick-Prescott filter for quarterly GDP 1984:1-1997:3.Source: BPS, Bl, CIEC, Staff estimates.
2

Box 1.1: Where did all the imports go? informal sector, or return to their village and work onfamily farms. During the crisis, agricultural
Indonesia's imports are growing again. In employment swelled by some four million people.fact they may be growing faster than official statistics Now, that trend has reversed. Agriculture shed oversuggest. The data of major exporters to Indonesia I .show about double the amount of exports to Indonesiathan the country reports in imports (figure). The recovery is creating jobs. But perhaps not enoughdifference has always been there, but became jobs: the labor force is growing by 2.7 percent perparticularly pronounced since the crisis. Whether this year - that is roughly 2.5 million additional peopleis a statistical artifact, a case of rampant smuggling, or seeking jobs each year. Four percent growth barelyimports into free trade zones remains to be seen. Butthe extra imports could explain the large residual in the employs these new entrants at the prevailing wage,national accounts which now shows up as strongly let alone absorb the unemployed back to work whendeclining inventory: it could be imports instead. the historical labor productivity increase of some 1.2
Box figure; Imports to Indonesia percent per year is factored in.
(USS million) 1.9. The wages and employment numbers over
US$m,,,.OD the crisis suggest Indonesia has a highly flexible30s0 labor market. This flexibility is a strength, as it
2500 allows for temporary shocks to be absorbed in wages
2000 1 "1 J v 6\ _Z lil \L) Mr.iotradtng rather than unemployment. This may change:/ ""''K fvt I <XX |Vsuppressed in the past, unions are now flexing their
i500 / zZ'\-, /t 0 \ fi \ X /muscles, and labor unrest to reinforce wage demandshas become more apparent. If done in an orderly
1I00 - O m^n V vfashion, and in line with labor productivity, higher500, wages seem hardly a problem as some - admittedly
weak - data suggest that the wage share of GDPJan-90 Oct-95 Jul-96 Ap,-97 Jan-98 Oct.98 Juk99 Apr-00 could be as low as 25 percent of GDP."' Moreover,
Source: CIEC, staff estimates. some institutionalized framework for labor relationscould prove useful since the market may havedifficulties in accommodating the size of shocks as
below their pre-crisis level-up from minus 33 Indonesia experienced during the crisis.in the fall of 1998-and are rising at an annualrate of 17 percent. Shrinking deficits
1.7. The Government has also increased 1.10. Government spending contributed to growthminimum wages. On average, minimum wages over the past fiscal year. However, anyone that waswere increased by some 20 percent country-wide expecting a large fiscal deficit to stimulate thein this February, with regional variations. This economy was again disappointed. The FY 1999/00came on top of the 20 percent increase in deficit which was planned at 6.8 percent of GDPFebruary 1999. The minimum wage in Jakarta turned out at only 1.5 percent of GDP. But unlike inarea increased further by 25 percent in July previous fiscal years, the cause was not so much a2000. Now this minimum - if paid at all - shortfall in spending as it was high oil revenues. Lastcloses in on the average wage in manufacturing. year's budget assumed an oil price of US$10 perCivil servants came off best: after several barrel, but the actual price proved to be twice asincreases their average pay is now some 19 much. Not all of that difference is a windfall to thepercent higher in real terms than before the treasury, however, because higher oil prices and fixedcrisis.V fuel prices mean higher fuel subsidies than budgeted.
Nevertheless, the net effect was a lower deficit by1.8. Official unemployment is at 6.40 some two percent of GDP. Other factors at work inpercent. But this is a misleading number. The FY 1999/00 were higher than expected personaltruth is that few Indonesians can afford to income tax revenues due to high interest rates onremain unemployed for long. So laid-off easily taxable bank accounts, and higher trade taxesworkers tend to find low wage jobs in the and VAT.
3

1.11. The FY 2000 budget looks like a replay increases on October 1, 2000, and despite lowerof last year. The oil price was set at US$20 per revenues due to the Government's policy reversal onbarrel, before it was increased to US$22 by Batam Island's tax exemption. The lower deficitsparliament. The outcome is likely to be closer to over the last and current fiscal year substantiallyUS$28, but much of the windfall leaked away reduced the Government's financing requirements.through higher fuel subsidies. These will be This was fortunate, because financing fell far short assome Rp.45 trillion this fiscal year, larger than well. Privatization and asset recovery remainedthe development budget, twice as large as CGI below target in FY 1999/00, and this is likely to besupport to Indonesia,. and an astonishing ten case this fiscal year for privatization as well. Foreigntimes the disbursements on the social safety net. financing fell short because the Government failed toBarely one-tenth of the fuel subsidies benefit the meet the policy conditions that could have promptedpoorest fifth of Indonesians. budget support. On the positive side, the lower-than-
planned deficits are in line with the MPR guidelines1.12. Government debt service is rising to the Government which call for a reduction insharply in the course of bank recapitalization. deficits and debt.Interest payments took almost six percent ofGDP in FY 2000, on total government debt of Inflation under controlsome US134 billion"' or 84 percent of GDP atthe end of FY 1999/00.""V Foreign debt as a 1.14. Inflation remains well under control. In theshare of GDP declined over the last two years first quarter of 2000 prices actually fell compared tobecause the Rupiah recovered in real terms from the year before. But the CPI climbed 4.35 percent inthe crisis lows, and disbursements remained the second quarter, and six percent in August 2000modest. All of the increase in domestic debt compared to the year before. Administrative pricewas for bank recapitalization. Govermment debt increases are in part to blame: the April electricityis likely to peak at some 92 percent of GDP price increase added some 0.6 percentage point toupon completion of the recapitalization program inflation, whereas price increases in transportationlater this year. Whether debt to GDP ratio will and telecommunications added a full percentagedecline by much thereafter depends largely on point. And the Rupiah depreciation of some 20the Government's fiscal management, and percent since the beginning of 2000 may add somegrowth (Chapter 3). 2.3 percentage points to inflation over time.'x The
upcoming fuel price increases could add another 0.2-1.13. It is too early to predict this year's 0.3 percentage point to inflation directly, and asdeficit. It may lie anywhere between 2.5 and 3.9 much as one percentage point indirectly. Bankpercent of GDP, even if the Government forges Indonesia therefore expects that it can no longer keepahead with the planned civil service salary its end-of-year target of 5-7 percent inflation.
Figure 1.2: No pressureMonetary policy is slightly off track But velocity is on trend
(Base money target and actuals) (Velocity of currency and M2)Velocty of Curency Velcity of M2
100 A 31 Velocity of Curency I' Actual 1\29 . (left scale) 3.3
90 27 _Trend 3\ .1-------- ~~~~~~~~~~~~~~2.9
estimated J:I-55 Jan-99 JuJ-55 Jan-00 1
'~Ju1400 2990 199OCIIY2 219 19 1
Note: Velocity is defined as nominal GDP divided by M2 or currency in circulation The plotted trend is an Hodrick-Prescott filterestimated over 1983:Q2-2000:Q2. 1.
Source: BI, IMF, WB estimates.
4

1.15. Although Bank Indonesia failed to meet Strong current account, fleeing private capitalthe indicative targets for reserve money, littleinflationary pressure seems to be building. The 1.17 Indonesia's recovery was strongly supportedrise in reserve money reflects in part excess by a booming world economy. World output willreserves that banks tend to stack up in the central grow by more than four percent this year, and worldbank due to a lack of creditworthy borrowers. trade even faster, by some 11 percent.xl' Indonesia'sThe other part of reserve money, currency in traditional openness paid off handsomely: during thecirculation, surged at the end of last year when first half of 2000, exports in US dollar terms were uppeople took out extra cash for Idul Fitri, by 34 percent over the same period in 1999. High oilChristmas and Y2K. This cash was flowing prices contributed, but the bulk of the increase cameback in the banks this spring, but growing from the buoyant non-oil exports - and most of it inuncertainty increased the demand again in the volume.x"I Textiles, furniture, and electricalrun-up to the MPR. Nevertheless, the velocity equipment did particularly well while agriculturalof money which has a tendency to rise if the and non-oil mineral exports actually fell. Importspublic expects inflation continues to register a recovered also, although much more slowly thancomforting decline (Figure 1.2). In the future, exports, and are still about a third below the pre-crisiswith further administrative price increases level (but see Box 1.1). Leading the recovery ofahead, the authorities should probably focus on imports are raw materials, while consumer goodscore inflation for policy, especially if the central imports have stayed fairly stable even during thebank moves to inflation targeting. crisis. Capital goods imports are still down by 77.6
percent from the pre-crisis height of June 1996, but1.16. Bank lending shows some encouraging they too are recovering as investment picks up.- if early - recovery. On the back ofrecovering interest margins, recapitalization, and 1.18. Indonesia fared far worse on the capitalrenewed profits, new lending has resumed at a account. In contrast with other recovering Asianmodest pace. Bank Indonesia reported that new countries, private capital outflow continues to putlending in June and July alone was some Rp. 12 pressure on the balance of payments. Some of thetrillion - or six percent of assets,' and short-term outflows is likely to reflect the hesitationfurthermore a survey of 15 IBRA banks found of exporters to repatriate their export earnings. Andnew lending to be almost Rp. 16 trillion in the some foreign debt is being paid off or settled withfirst semester of 2000, or a 5.8 percent growth creditors abroad. In total, there was approximatelyover the first semester last year.Xl A significant US$4 billion worth of net private capital outflow inpart of the new credit seems to go, without FY 1999/00 - about the same amount as donors andgovernment incentives, to SMEs rather than to multilateral agencies disbursed to Indonesia.the traditional, large borrowers that are still Portfolio investors are cutting their exposure todeeply in debt. Indonesia - and luring them back is proving
difficult, especially now that they can get similarreturns in the US high yield market.(lv
Box 1.2: Indonesia's booming economy
A consensus among Indonesian experts has it that the country's economic recovery remains fragile becausepolitical uncertainty affects the market confidence adversely. Yet a visit to an industrial estate near Jakarta reveals thatneither fragility nor low confidence permeates the economy uniformly. The estate houses over a hundred manufacturingfirms, mostly but not exclusively in export business, whose products vary from automobile, electronics, metal to plastic andchemical products. According to a survey conducted in September 2000, the output at the estate is up on average by 50%from the pre-crisis peak. The production capacity increased by 1 07,000m2, or twenty average-sized factories in the first eightmonths of 2000. The estate is dominated by subsidiaries of foreign firms, and to them, setting up new operations is a breeze:financing comes mostly from the parent companies abroad; obtaining appropriate permits and licenses from the governmentis no problem; unofficial fees levied by the authorities are unheard of. "Indonesia with its abundant, smart, and inexpensivelabor force is a great place to locate a factory" says one of the satisfied tenants. The experiences the occupants of the estatehave had are in sharp contrast to the plight reportedly suffered by small-scale entrepreneurs who struggle against obstacles,both financial and otherwise, to set up and run their businesses.
5

Figure 1.3: Foreign dis-investment in Politics andfinancial marketsIndonesia....
(FDI and Portfolio Flows, US$ million) 1.21. Indonesia's recovering economy was notU Smw reflected in improved conditions on the financial3,=20 markets. The Rupiah which strengthened to below20ro. 1 7000 to the US dollar right after the presidentialoo hi m L t L lelections hit a low of 9500 to the dollar briefly before
IfODO q w the MPR August session - a 35 percentAM :ol / depreciation. It then strengthened to 8000 per dollar,2,0 F only to be toppled by the unrest and killings in West
Timor and the bomb attack on the Jakarta Stock-s.or IrrVeS____I Exchange building. The capital markets fared little4.W02 better. The Jakarta Stock exchange drifted off its1 02 03 04 c1 02 03 0c 01 02 03 04 or (c2 03 04 1 02 post-crisis peaks in October 1999, and was 30 percent
.....the odd man out informer crisis countries. below that level at the time of writing. Similarly,(private capital flows, US$ million, selected countries) Indonesia's risk premium in international markets
,% ,reversed its decline, and is now 650 basis points over90 Kora US treasuries, comparable to Russia. Domesticso interest rates followed suit, and by the summer of this
Thalad 1 \year, the prospects for rapid interest rate declines had20y1Llhj l w1{tt l|f dl |h/| dall but disappeared. Politics rather than economics
00 ~~~~~~~~~~~drove the markets, so it seemed.
4 0 1.22. In a democratic Indonesia, politics do matter.The days are gone that a small group of technocratsdetermined the economic policies after a nod of the
.1001 President. But the new rules of the game in9701 9703 9801 9£ 9901 #KI 0001
Souce:BI 9EC. Om sow ODIndonesia are - not surprisingly - far from clearSource: Bl, CIEC. yet, and any events that could shed light on these new
1. 19. The downturn of FDI into Indonesia is a rules move the markets.concern (Figure 1.3). In other countries, and
mos stikiglyin Korea, FDI inflows not only 1.23. The first Wahid cabinet did not present amost strikingly vnKra D nlw o ny ision for the country's development and economicstrengthened the currency, but also accelerated vcorporate restructuring, and allowed an infusion management that would put investors at ease. In partof new technology and management. InIndonesia, even the existing FDI is declining, as Figure 1.4: Less vulnerable, but not safeforeign head offices reduce credits to their (Short-term external debt as a percent ofIndonesian subsidiaries. international reserves)
1.20. Despite the net capital outflow, the 250
strong current account, donor money, andrescheduling allowed for a further build-up of 200 1997
reserves. In addition, the Paris club agreed in 150
April to reschedule another US$5.8 billion inrepayments due over the next two years, thereby 100 March
further helping reserve build-up. Indonesia's net 50
reserves of US$18.9 billion dollars can nowcover a comfortable eight month of imports. But o _ _ _ _ _ _Indonesia is still more vulnerable than other EastAsian countries given the size of its short-termdebt (Figure 1.4). Source: BIS.
6

this was because the cabinet was not united, in Figure 1.5: Fledgling consumer confidencepart because bigger issues ranging from the (Index; above 50 indicates positive/optimist)unity of Indonesia to the role of the military in 70
politics and society have consumed much of thecabinet's energy, leaving policy makers little eatime for serious debates on economic policies.The markets were also hit by allegations thatquestioned the probity of this government, 64
sometimes at the highest levels, which castdoubts on whether the Government would take 62
the mandate to eradicate KKIV as seriously as Bothe Indonesian people did when they voted theprevious Government out of office. 58
Od- 99 N0*99 Deo99 Jan4- Feb40 M;rO .w-J A0 May-SO SarO Ai.
1.24. Slow implementation of the structuralreforms also depressed market confidence. The Source: Danareksa Research Institute
new administration was quick to commit toreforms in January 2000 LOI, but was slow in administration's handling of the ongoing disputeimplementing the agreed reforms. Among between the state-owned telecommunications firm,others, the Government hesitated on actions to PT Telekomunikasi, and its five foreign joint-accelerate bank and enterprise reforms, operating partners could further affect investorpostponed the fuel price increases and phase-out confidence, as did the stalemate on the IPPs - anof tax exemptions, and reversed its stance on issue that now comes back to haunt the new cabinet,rice and import tariffs. To its credit, among the as a paid-up claim from one of the US partners in anfirst decisions of the new cabinet was the IPP has become a claim of a foreign investmentincrease of fuel prices on October 1 (Chapter 3). guarantee corporation.xv And several regional
governments infringed on the rights of foreign1.25. On top of the slow structural reforms mining companies. These disputes were ultimatelycame several policy decisions that ruffled settled, but hardly inspired trust for a decentralizingforeign investors. Among them was a July 2000 Indonesia.presidential decree to ban or restrict foreigninvestment in various sectors including 1.26. Policies are also affecting Indonesia'stelecommunications and multimedia. The consumers. Consumer confidence boomed after theGovernment partially reversed the decision amid Presidential elections October last year, and quicklya chorus of complaints but it remains to be seen spilled over into spending on consumer durables, thuswhether investors perceive the government's boosting manufacturing. Now, consumers are noflip-flop as unwelcome capriciousness or longer so sure (Figure 1.5). More Indonesians thinkencouraging responsiveness to their voice. The they are likely to be in a recession than any of their
Table 1.1: Regional growthforecasts(percentage change in GDP)
2000 2001
1999 World Bank IMF Consensus World Bank IMF ConsensusChina i 7.1 7.0 7.9 6.5 7.8
Indonesia 0.2 4.0 3.0 3.9 4.0 4-5 4.1Korea 10.7 8.5 7.0 8.5 6.5 6.5 6.0Malaysia 5.6 8.0 6.0 8.1 6.0 5.8 6.4
Philippines 3.3 4.0 3.4 4.6 3.7Thailand 4.2 4.5 4.5 5.2 4.5 5.0 4.8Note: Forecast dates are: IMF World Economic Outlook, September 2000; IMF Staff Report Indonesia, September 2000; ConsensusForecasts August 2000; World Bank, September 2000.
7

East Asian neighbors.x"' Things may not turn as Endnotesbad as that, but pundits around the world expectIndonesia's growth to remain modest 4-5 Electricity output and consumption is somewhat of a puzzle. Except for
a few quarters in 1998, they never declined, and are now well above theirpercent of GDP in 2001 - still the bottom of pre-crisis levels. In part this could reflect a certain lumpiness in
the class of former crisis countries (Table 1.1). consumption - one still has to light the factory, even if production is
1.27. Among the first duties of the new down. In part, however, this could reflect a structural shift in reaction tothe crisis, which benefited tradable goods such as manufacturing, a large
cabinet is to restore confidence of markets, electricity consumer. Electricity per unit of manufacturing has remained
investors, and consumers alike. The new remarkably constant.off to a good start: "Unlike in other countries, inventory build-up is the residual category in
economic team is off to a good start: Indonesian statistics. The large negative contribution of this factor
Coordinating Minister Ramli's Ten Point reflects the quality of statistics rather than factories and shops running out
Program is the first statement of a of goods to sell. Unfortunately, the statistical discrepancy is larger thanall of investment's contribution to growth, causing casual observers to
comprehensive economic policy in new decide that the recovery is not supported by new investments.
Indonesia. The program was smoothly integrated According to SUSENAS data, spending on rice constitutes some 44
in the Letter of Intent to the IMF, which was percent of the total expenditures for the lowest."The Gini coefficient fell from 0.36 before the crisis to 0.32 in Februaryapproved by the Board on September 14, 2000. 1999. But the measured Gini also suggest that Indonesia's Gini is equal
But the challenge is now to turn the statement of to that of the Netherlands - a statistical fact in sharp conflict with casualobservation - and the numbers should be interpreted with care.
objectives into a strategy and - more The calculation is based on the averge wage bill per worker. The
importantly - to take those actions that lend increases include wage drift of some five percent per year, and structural
credibility to the program. increases. In April 1998, while former-President Suharto was still inoffice, civil servants were awarded a 15% across-the-board increase.Under President Habibie, in April 1999, a flat Rp.155,250 per month was
1.28. In the short-term, two issues are crucial granted to all civil servants. Since taking office, President Wahid has
to the Government's goal of accelerating the approved three increases: an across-the-board Rp. 64,750 per month as ofApril 1, 2000; an increase in functional and structural allowances as of
recovery: April 1, 2000, which was amended in June 1, 2000 in response to popularprotests; and an already approved Rp.65,000 per month for all civilservants as of October 1, 2000.
* intensifying bank and enterprise reforms. v, Again, caution should be taken with these numbers - as under-Chapter 2 reports on recent progress in bank reporting may be a big problem in the statistics. The labor share of GDP
and corporate restructuring, identifies the is calculated by adding up all wage income as reported by BPS for theformal sector, and then extrapolating it to the informnal sector. The lowerremaining bottlenecks, and sketches the estimate in the text is found by assuming that all informal workers eam
emerging agenda for Indonesia's financial minimum income; the higher estimate results when average income isreforms. assumed. In general, the labor's share in developing economies is about
sector reforms. 1/3. For developed economies it fluctuates around 2/3. If the method
described is used for the United States, a labor share of 0.45 results, but
Y maintaining fiscal sustainability. Chapter 3 labor taxes and social security should be added to this. Source: BPS,Keadaan Pekerja/Karyawan Di Indonesia (Labor/Employees situation in
describes the budgetary pressure stemming Indonesia) various issues.
from debt and decentralization, and '..At the prevailing exchange rate of Rp.7000 per Dollar.
identifies the difficult choices government Vl. Excluding Bank Indonesia debt to the IMF.identifie the dificult chices govmment i.The contribution of electricity price increases is calculated on the basisfaces in maintaining fiscal sustainability of electricity's share in GDP, and is therefore to be seen as an upper
while managing debt and decentralization. bound. The impact of transport prices is taken from the actualcontribution of transport prices from the CPI index. The contribution ofthe Rupiah depreciation is based on elasticities estimated by the
In the medium-term, Government faces two Partnership for Economic Growth, Bappenas office.
critical issues: 'Jakarta Post, September 14, 2000.This figure is overstated, as it includes rolled over and restructured
credits , and the number may be influenced by the effect a weakening
* First, it must shift poverty alleviation from Rupiah has on loans denominated in foreign currencies.id World Bank, Global Economic Prospects, August 2000, Washington.
providing a social safety net to a focused Xfll' See Peter Rosner, 2000, Indonesia's non-oil export performance
strategy for attacking poverty in Indonesia's during the crisis: distinguishing price trends from quantity trends.Bulletin
(Chapter 4). for Indonesia Economic Studies, forthcoming.x.v The US high yield market index now offers a yield of some 650 basispoints over Treasury-about the same as Indonesia, and up from less than
* Second, to consolidate democracy, and to set 500 at the beginning of this year. Source: The World Bank.the conditions for sustainable growth, it " Indonesia also became the first country for which MIGA, the World
must change the way Indonesia is governed Bank Group's private investment guarantee arm, paid out a claim ofU~S$15 million, also related to an IPP.
(Chapter 5). x World Economic Forum, quoted in The Economist, September 9, 2000.
8

Chapter 2. Accelerating Bank and Corporate Restructuring
2.1. After long delays, bank and corporate 2.3. The crisis has had a profound impact on therestructuring has begun to show progress. Banks banking system. Since the start of the crisis no lesshave largely been recapitalized, have renewed than 68 out of 237 banks were closed, and anotherlending on a modest scale, and some are even 12 banks nationalized in an effort to stabilize theshowing profits again. Corporate restructuring banking system. Now, Indonesia has 161 domestichas shown some early results, spurred by the banks after some mergers and creation of a newnascent recovery, and by a few favorable court export-import bank (Table 2.1). In the course of thejudgements. But these tenuous beginnings are crisis, deposits migrated from private banks to theunder threat from insufficient operational state banking sector in a flight to perceived safety.restructuring of banks and superficial corporate As the dust settles, the Government is directly inrestructuring. If this situation prevails, the banks control of fully 70 percent of the deposits in thewill continue to lose money. They will neither be banking system, compared to 40 percent in Korea,able to rebuild capital nor lend. Their corporate and 23 in Thailand. These deposits are held in 42clients will remain vulnerable to shocks, and risk Government-owned banks, four of which werebecoming a burden on the banks, and ultimately state-owned pre-crisisi, 12 are newly nationalized,on the government budget once again. To and 26 are regional development banks (Table 2.1).safeguard the taxpayers and the economic In addition, the Government also holds significantrecovery the Government must (i) ensure further stakes in the private recapitalized banks as a resultoperational restructuring of banks; (ii) balance of the recapitalization program.speed and quality in corporate restructuring; (iii)accelerate sales of assets IBRA cannot or will not 2.4. The bank recapitalization program has beenrestructure; and (iv) remove tax and legal extremely costly. A total of about Rp.650 trillion ofimpediments against efficient corporate sovereign bonds have been issued. Of this amount,restructuring. approximately Rp.268 trillion has been used for the
State Banks and an additional Rp.18 trillion will beBackfrom the abyss needed to complete the program ii. Rp.218 trillion
was used to honor the government guarantee,2.2. More than two years after the economic including reimbursement of the liquidity supportcrisis decapitalized the nation's domestic banks, provided by Bank Indonesia at the height of thethere are modest signs of a banking recovery: the crisis."' Despite the costs, banks were onlybanks' non-performing loans (NPLs) have recapitalized to four percent of (risk-weighted)dropped because of transfers to IBRA, lending has assets, half of the international minimum standardresumed on a modest scale, interest margins have of eight percent.been widening, and a small number of banks havereturned to profitability.
Table 2.1: Before and after(The structure of Indonesia's banking system)
Number of Banks Share of Deposits(percent)
June1997 June 2000 June1997 June 2000State Owned * 34 43 37 70
Private 160 79 57 18Foreign and Joint Venture 43 39 6 12
Total 237 161 100 100
* Include nationalized banks, regional development banks, and the export-import bankSource: BI and World Bank staff estimates.
9
2.8. On aggregate, the banking system still(Rp. Trillion) recorded a loss in the first half of 2000. This is
unlikely to improve any time soon, as rising market11DR.0111- ~~~~~~~interest rates caused a deterioration in interestNonperfoming Transfered toBRA D margins in the third quarter. Most deposits are in
sooeo r dl*\ rate-sensitive 30 day time deposits which react0 pe0oPrbloans I faster than lending rates to changes in market
conditions. Moreover, the still substantial non-30000 performing loan portfolio contributes nothing to200 00 i 2 011 23 l l linterest margins. But the biggest drain on
profitability remain high operating costs due to theoo00 0 lack of meaningful operational restructuring.
1 *7 De Dc.9 JW.00
Remaining challenges are mountingSource: Bl and IBRA.
2.9. Signs of early progress notwithstanding,2.5. The banking system's non-performing much remains to be done to restore viability of theloans (NPLs) dropped sharply after some Rp.256 financial sector. Indonesia's banks are stilltrillion of them (as of June 2000) were transferred considered to be among the weakest in the Eastto IBRA (Figure 2.1). Even after the transfer, Asia region and the world, even afterthey still stand at 30 percent of the loan portfolio, recapitalization (Figure 2.2). Indonesia certainlyand few banks have been able to reduce them by cannot afford another banking crisis, not even onethemselves. Provisions for loan losses stand at 94 that is an order of magnitude smaller than the one itpercent of NPLs, but the banks' thin capitalization is currently emerging from - which may prove toleaves little cushion against any further be the most expensive in history in terms of GDP.deterioration in their portfolios. In the short run, restoring profitability to the
banking sector, improving supervision, and shaping2.6. Banks are beginning hesitantly to lend up governance of state banks are the core agenda.again. Bank Indonesia's June 2000 lending In the medium-term, the Government must developsurvey of fifteen banksiv representing 75 percent and implement a strategy to reduce the State'sof total bank deposits found that Rp.15.8 trillion involvement in the financial sector.of new loans have been extended since thebeginning of 2000- a modest 5.7 percent year- Figure2.2: The bottom lineto-date growth. However, as this figure includes (Bank rating various countries; 6=highest, O=lowest)both renewed and restructured loans, genuinely 6
new lending is likely to be less than reported. 5 _ %
2.7. Interest margins have been widening but 4.
not enough to generate profits for all. Decliningdeposit interest rates and fewer non-performing 3 P=p, . I
loans boosted the banks' net interest margins - 2-
the difference in interest they receive from theirloans and what they pay on deposits. -d. - -…
Consequently, most banks are reporting positive I7 ;9 l8 . Ol-| F. 97 J-97 Ocl97 F.b 9a J -- 98 Oct-9S F.b99 Ju-99 Oc{-99 F D J-n00interest margins, and some even reported
operating profits in the first six months of the Iyear. Source: Moody's.
10

2.10. Restoring bank profitability. Globally,commercila banks derive their income from tlnree Fiur 2 *3 Baialod(Bank asset composition, percent of deposits)
primary sources: (i) interest from loans; (ii) fees -140
from services rendered, such as foreign exchangetransactions; and (iii) income from investments.Their costs are operational costs of the bank itself, 10 S51s Bonds
the interest they pay on deposits and other /liabilities, and the provisions on non-performing **loans. W*
2.11. In the near termn, operational restructuring 0is key for restoring profitability. Bank lending M will continue to be constrained by the lack ofcreditworthy borrowers. Thus, the best hope for e096 D9 D. D
profits comes from operational restructuringwhich cuts operational costs and reduces the drain Source: BIon profits by resolving non-performing loans.Such restructuring must entail further 2.14. For these reasons, the Government isrationalizing of branches and personnel as well as currently contemplating issuing short-term treasuryreinforcing of debt work-out units to enable them bonds to replace the longer term recapitalizationto deal with non-performing loans. bonds. These bonds could be made more attractive
than the current recapitalization bonds, and2.12. Over time, corporate restructuring is therefore more liquid, but possibly at the expense oflikely to take hold, and new credits would taxpayers. Moreover, for the banking system as acontribute to profitability. However, they will do whole, liquidity does not seem to be the problem.vso only if the banks have developed sound internal And if some banks need further capital, therisk management procedures and a commercial Government may want to make such a decision in acredit culture by then. If these fail to emerge, the transparent process.new loans could turn bad quickly, and freshcapital injections from the Government may 2.15. Balance sheet management will notbecome necessary, at the expense of tax payers. substitute for operational restructuring. Banks must
engage in serious restructuring to reduce their2.13. Banks could also improve their bottom operating costs to an internationally competitiveline though higher returns on their investment level. The central bank should take a keen interestportfolio. As a result of the crisis, the banks' in restructuring as the supervisor, and shouldbalance sheets are now dominated by continue to build the capacity for an in-depthrecapitalization bonds. (Figure 2.3). But the review of risk management, credit processes, andinterest rate on these bonds is too low compared accounting systems of banks. But the Governmentto the one banks have to pay on deposits. Deposit should take an interest as well, not only to protectrates closely follow the interbank rate JIBOR, taxpayers, but because it owns the bulk of thebecause this rate is approximately the maximum banking system.at which the Government guarantees the deposit.JIBOR in turn follows closely central bank 2.16. State-owned bank reforms. Although thecertificate rates. Since the interest on the recapitalization of the state banks is nearrecapitalization bonds equals the central bank completion, their financial condition continues to becertificate rate, they barely contribute to interest extremely fragile. Like the rest of the banks, statemargins. These bonds therefore sell at a discount- banks are slowly beginning to report positiveAnd if they were valued at the market rate, some interest margins, but their overall profitabilitybanks would no longer meet the minimum capital remains very low or negative due to continuedadequacy ratio. losses on loans and the lack of meaningful
11

operational restructuring to reduce costs and broadened to encompass all aspects of governance,rationalize their activities. For instance, only including performance contracting and monitoring,about 300 branches have been closed out of a total standards for audits and audit firm selection, andof over 1800 since December 1997. procedures to select the management and
Commissioners.2.17. The dominance of state banks in the marketis a cause for concern. These banks may be 2.20. In the short run, strong management isconsidered 'too big to fail,' and the central bank, critical. Each state-owned bank should have athe regulator, and the Government, the owner and quorum of Directors and Commissioners withthe protector of taxpayers, are both responsible to international banking experience, supported bywork closely with bank commissioners and accountants and professional bank managers. Thedirectors to prevent the recurrence of past Ministry of Finance must be particularly vigilant topractices that led to these banks' insolvency. The prevent the return of political interference and otherstate banks have historically had weak internal related past practices-not just as a shareholder, butand external controls, failed to provide the as the ultimate guarantor of deposits.stakeholders with regular access to essentialfinancial information, and have been burdened 2.21. It is urgent that the Government determinewith excessive operating costs. Much more is what role each state bank should play, and establishrequired to strengthen the banks' governance a formal divestiture schedule accordingly.structure, develop a strong credit culture, and Privatization is the most certain means of preparingupgrade risk controls and operations state-owned banks for the increasing pressures ofinfrastructure. Governance and intemal controls globalization and making them. better capitalizedremain unchanged substantially in many areas of and nimbler. The Government has little time tobank operations, and most of the banks' senior waste. It must develop a comprehensive financialstaffs have been replaced with current or former sector strategy, without delay.state bank employees.
2.22. Coordinating Minister's "Ten Point2.18. With the exception of Mandiri, state banks Economic Recovery Acceleration Program" is ahave not taken the opportunity provided by the useful start for building a financial sector strategy.crisis to rethink and rebuild their business Implemented as a joint government and industrystrategies and their operations. International effort, a comprehensive strategy could serve toexperience shows that post-crisis competition is expand access to financial services if the followinglikely to be fierce, particularly from those banks issues are addressed:that have undergone rigorous operationalrestructuring to correct past weaknesses and to * The future role and structure of the bankingrefocus their activities on core businesses. The system including:winners within the sector will be those institutionsthat have built a service culture, and can deliver * a plan for a market-led consolidation offinancial products and services at lower costs Indonesia's remaining 161 banks.while managing and pricing their risksappropriately. * a definition of the roles of state-owned
banks that allows them to target their2.19. Changes in governance are at the heart of customer profile most efficiently.state bank reforms. The Government, as theowner of these banks, is responsible for exercising + a divestment policy for state-owned banksproper oversight and governance through the to optimize the use of scarce public capital,MOF. To this end, the recent establishment of a and reduce the risk of future bailouts.Monitoring and Governance Unit within the MOFrepresents a welcome first step. To be truly * A clarification of the role of foreign banks.effective, however, the Unit's mandate should be
12

* A broadening of access to financial services Rp.130 trillion, and claims on former bank owners,through: Shareholder Assets, add up to Rp.127 trillion.
Given this huge concentration of assets, a well-* deepening capital markets, so as to reduce performing IBRA is paramount for sustainable
enterprise dependency on debt financing; economic recovery in Indonesia.
* developing a secondary market for 2.25. The pace of IBRA's asset disposition hassovereign bonds, so as to provide the been slow. Between its inception and Septemberrecapitalized banks with liquidity 2000, IBRA generated approximately Rp.35 trillionnecessary to lend; in revenues or only eight percent of its average total
asset value. Since a part of this is dividend and
* reforming the pension and insurance interest rather than revenues from asset sales, assetindustries, so the Indonesians can benefit sales themselves were even lower. IBRA's recoveryfrom a more secure future-and the target for the nine month FY 2000 is Rp.18.9Government can reduce its liabilities; trillion, of which Rp.12 trillion was realized as of
the end of September.
+ integrating the roles of finance companiesand pawnshops, which provide important 2.26. The key reason for slow recovery has beenalternative sources of financing for many the Government's reluctance to recognize the lossmicro borrowers; and of value that will necessarily occur. IBRA's assets
are currently valued at their book value or
* rationalizing thousands of rural banks. estimated transfer values. But the bulk of them arethe most impaired assets of the banking system, and
* The design of a limited deposit insurance book values seriously overstate the realizable value.scheme that incorporates market discipline, Realized value on the sales to date give somelimits moral hazard and reduces fiscal costs. indication of future revenues. The recovery rate for
limits morahaard,andreduesiscacthe (partially restructured) retail and corporate loans
* The improvement of regulatory and disposed to date is about 57 percent, but the onlysupervsoy o t of te esale of bank shares (BCA) yielded a mere 13
supervisor. ovrihto h etr innilpercent of book value. Estimating the returns onthe pledged shareholder assets may well disappointalso, as many of the pledged assets have lost
2.23. Even with a well-implemented financialsector strategy, however, no banking system can significant value. IBRA is currently conducting anbe healthy without healthy corporate clients,. in-depth valuation of individual assets, though the
Accelerating corporate restructuring is thereforekey to the future of the banking system. Again, Figure 2.4: Diminishing expectationsthe Goveyment carries a heavy load here, (Transfer value and market value of IBRA assets)
because IBRA is by far the largest creditor inIndonesia. Its performance will be a decisive 60
factor in determining the future health ofcorporate Indonesia. 0qlty in Banks
40
IBRA performance 30 Ssmt
2.24. The assets IBRA controls have a nominal 20
value of about Rp.546 trillion, or 57 percent of _ , n \ \
GDP: non-performing loans and other assetstransferred from the banking system amount to O _Rp.289 trillion; equity investments in BTO T-W., V.1- EWti,.d M.,K.t V.1-u
(nationalized) and recapitalized private banks are Source: IBRA and IMF, July 2000 estimates
13

Chairman of IBRA recently estimated that 2.30. Less progress has been made with therecovery would be between 30-40 percent."' This remaining Top 200 (i.e., the "22-200") debtors.may still be too optimistic, because experience These mid-tier corporations (loans with a combinedshows that assets rapidly lose value when they book value of about Rp.140 trillion) have receivedremain warehoused in asset management little attention, and with its capacity constraints,companies. IBRA is unlikely to be able to add significant value
through restructuring.2.27. In recognition of this, IBRA has recentlyaccelerated disposition. Beginning second quarter Improving speed and quality of IBRA 's operationof 2000, the agency has committed to a newaggressive schedule of asset sales to ensure that 2.31. IBRA is central to the Govemment's effortsthe FY 2000 budget targets would be met. It to restructure corporate Indonesia. In managing itstherefore has begun to outsource or sell smaller assets, it must balance several, sometimesloan portfolios. But BCA and Bank Niaga were conflicting, objectives. Speed of asset resolution ispart of the disposition plan. Under pressure from very important, because delays in corporateParliament, the Government recently reversed its restructuring could undermine the recovery. At thelong-stated aim to privatize these banks. same time, the Government is reluctant to sellTherefore, revenues may fall short. assets at significant losses. In addition, the
revenues derived from its asset sales are essential2.28. IBRA has outsourced commercial loans for financing the budget, and losing out on revenues(borrowers between Rp.5-50 billion) to local is a serious fiscal risk. Furthermore, irrespective offinancial institutions to be better able to service the way IBRA handles its assets, corporatethe 2,000+ debtor accounts. While the loans restructuring must be ensured to reinvigorate theremain on IBRA's books, it is envisaged that recovery, and limit future risks to the bankinggreater value can be derived from aggressive system. Finally, the way IBRA and thecollection and restructuring activities prior to their Government handle the disposition of largeanticipated sale in October 2001. IBRA also amounts of assets is a key determinant ofplans to dispose of its entire small and medium- Indonesia's reputation in international markets.sized enterprise (SME) and retail loan books by Juggling these diverse interests is no easy matter -the end of 2000. For the small loans under Rp.5 and it is even more difficult in an environment inbillion, IBRA has launched an expedited which weak courts could preclude the route ofsettlement scheme, wherein SME and retail bankruptcy proceedings. But holding on to theborrowers who pay the full principal balance due assets is no option, as they will lose value quickly.will receive a waiver of all interest and fees'".Concurrently, IBRA has concluded its first loansales: (i) two groups of non-performing residential Table 2.2: Resolution of IBRA credits, 30 September 2000mortgage loans; and (ii) a small group of larger, (Rp trillion and percent)
restructured commercial loans. Each of these Group of Early Middle Late Total
sales has been subject to a competitive public Obligors Stage Stage Stagetender. Top 21 8.3 16,5 62,3 87,1
(9) (19) (72) (100)
2.29. IBRA has been focussing its restructuring 22-200 21.7 52.1 13.1 86.9efforts on the Top 21 obligors, the largest and (25) (60) (15) (100)most influential borrowers, and has committed to Top 200 30.0 68.5 75.4 173.9completing the restructuring of 70 percent of these (17) (40) (43) (100)
Note: Numbers in brackets percent of total. Early Stage includes (0) noloans by the end of December. According to action, (I) initial negotiation, and (2) standstill agreement, or (10) legal
IBRA, over 70 percent of the debt was in the late process not initiated. Middle Stage includes (3) assignments of advisors, (4)due diligence, and (5) restructuring negotiations. Late Stage includes (6)
stage of resolution by the end of September - finalization of restructuring MOU, (7) implementation, and (8) full payment
either through an agreement or legal action (Table or (It) commencement of legal action.
2.2), but far fewer have documented, signed andimplemented the agreements.
14

2.32. Those assets for which IBRA has neither and many market observers are once againthe time nor the capacity to manage, sale is the questioning the government's commitment tobest alternative. Thus, aggressive sales for the reform and to introduce market discipline throughloan portfolio of the "22-200" debtors is the best accelerating the restructuring and sale of IBRA'sway forward. For the smaller loans this holds a assets holdings. The lack of a framework withinfortiori, as IBRA simply cannot deal with the which these decisions were made, and to somerestructuring of so many debtors within the time extent sparse information on the agreementsthe legislator has given the organization. For once themselves caused a controversy and a negativethose loans are sold, corporate restructuring will reaction from the financial markets.be done by the buyers, and IBRA can focus on thelarger deals. To guarantee transparency, the best 2.36. Therefore, a set of principles should guidepossible price, and buyers most capable of IBRA in all its restructuring deals that ensure therestructuring, sales should be done by competitive interests of the state are protected and the economytenders. Like in Korea and Thailand, IBRA could recovers quickly. At a minimum, these principlesstructure the sales such that it can share in the should consider: the role of IBRA given its existingupward potential of any assets sold, thereby mandate, the importance of ensuring transparencydefusing public and/or parliamentary criticisms of at all times, the consequences for asset recoverylow sales prices. and the implications for government debt and
contingent liabilities, and protection of2.33. If IBRA decides to further outsource loans, government's share in any future upwardit must ensure that the best possible buyer is revaluation of assets. Once agreed, these criteriaattracted. IBRA is responsible for finding the should be clear to everyone, and all deals should beagent who is capable of restructuring the loan. subject to public scrutiny so as to determineThe structure of the outsourcing package is of the whether the criteria are met.essence, and IBRA should consider making thepackages big enough to attract reputable and 2.37. IBRA governance. The Government hasexperienced buyers. begun to strengthen IBRA's corporate governance.
The newly-created IBRA Oversight Committee (or2.34. IBRA has decided to handle the largest OC) is composed of nine members, seven of whomdebtors itself. In doing so, it has taken on the are independent of the Government.viiiresponsibility for the quality of restructuring.Deep restructuring would not only optimize the 2.38. External oversight is inherently reactive,revenues for the budget, but would also minimize and the nature of IBRA's business demands strongthe risk that future credit from the banking system internal controls as well. Asset disposition givesis misdirected. This is important to give a fair many opportunities for "rent seeking," and as thechance to more deserving creditors, such as small process picks up, IBRA's internal controls willenterprises, for acquiring credit. IBRA will also become increasingly important. Although riskbe under intense public scrutiny in settling these management and internal audit divisions have beenlarge debts with the high-profile debtors and established, the agency has not yet been able toaccusations of insider deals are a large mitigate its transactional and treasury related risksreputational risk for Government. properly, as shown by a recent audit.Ix In response
to the audit, IBRA has developed a robust2.35. The Government must therefore be Corrective Action Plan ("CAP") to address thescrupulous in concluding restructuring deals. In numerous audit findings. In the interim, an auditearly October, the Financial Sector Policy firm has been engaged to begin the mid-year 2000Committee (FSPC) approved that IBRA enter into audit of IBRA's operations. IBRA has also adopteda complex, long-term equity relationship with two a number of key measures to shore up its financialof its largest borrowers in lieu of robust debt and reporting and record keeping. Going forward, theoperational restructuring. These decisions could focus should shift to strengthening the agency'shave a direct impact on the Indonesian taxpayers, internal policies, procedures, and processes to
15

ensure any existing loopholes for undue influence Table 2. Selected debt restructuring transactionsare closed. (US$ billion)
Amount of Debt 8.2Corporate restructuring
Troubled Debt Restructuring: 8.0Rate reduction, term extension, and/or grace 4.7
2.39. Corporate Indonesia is still deeply in debt, periodbut restructuring has started to take off. However, Conversion to equity or convertible bonds 3.1the quality of restructuring has fallen short of Write off 0.2
expectations, and tax and legal impediments Corporate Self-Help: 3.1
continue to hinder restructuring. Deeper Debtasset swaps 1.4
restructuring will require massive efforts of debtor New equity 0.1and creditor alike, but this is a price well worth Other 0.6
paying for a healthy and growing corporate Note: Selected cases consist of II IBRA transactions involving US$Indonesia. 3.1 billion in IBRA credits and 23 JITF cases involving US$ 5.1
billion in debts.
2.40. Indonesian business debt at the end of Source: Staff estimates.
June 2000 amounted to at least US$120 billion -US$85 billion for large private corporations andUS$35 billion for state-owned enterprises and percent shareholdings in a number of well-knownSMEs (Table 2.3).' Of the total, 49 percent was companies as a result of debt/equity conversions.owed by foreign creditors and 72 percent wasdenominated in foreign currencies. Of the large 2.42. New procedures have given an impetus tocorporate debt, three-quarters is distressed and in the Jakarta Initiative Task Force (JITF). As of midneed of restructuring. September, 51 companies with aggregate debt of
US$9.38 billion were actively involved in JITF2.41. Restructuring volume. Some debtors and mediation. To date, 25 cases, with a total debt ofcreditors have started to reach agreements on US$5.17 billion, have concluded bindingcorporate debt restructuring. As noted, IBRA has restructuring agreements between creditors andresolved tentatively 40 percent of its credits to its debtors with JITF's assistance. The new structuredTop 21 obligors, either through an agreement on mediation procedures and referral of cases to JITFrestructuring or through initiation of legal action. by the FSPC have allowed JITF to settle moreCorporate foreign debt also shows encouraging cases. The new procedures, which have been insigns - The new Coordinating Minister recently place since April 2000, pennit the FSPC to imposenoted that some US$10 billion was resolved '"' sanctions on uncooperative debtors, includingForeign banks indicate that agreements with referral to the Attorney General Office for initiationseveral large debtors have either been reached or of bankruptcy proceedings. JITF's regulatoryare imminent. Creditors will end up with 20-40 facilitation role has also been strengthened through
increased coordination with BAPEPAM, BankTable 2.3: Debtors and creditors Indonesia, the Ministry of Finance, and the stock
(US$ billion) exchanges.State IBRA other Foreign Securitie Totalbank AMC local banks s holders 2.43. Quality of Restructuring. Analysis of a
s inc.BTO sample of IBRA and JITF debt-restructuring cases
State 3.5 1.7 0.5 5.3 1.0 12.1 raises questions about the adequacy of operationalenterprises restructuring and reduction of debt to sustainableLarge 4.0 22.9 3.4 50.7 4.1 85.0private levels. For these thirty-four cases (Table 2.4),corporations US$8 billion in distressed debt was restructured asSMEs 7.2 4.2 8.3 2.4 0.5 22.6 follows: 59 percent through rate reductions, termTotal 14.7 28.8 12.2 58.4 5.6 119.7 extensions, and/or grace periods on repayment; 38Source: JITF, staff estimates. percent through conversions of debt into equity; and
only three percent through debt write-offs.
16

Exclusion of one transaction involving a US$1.1 improve this ratio to 266 percent. An additional 20-billion debt/equity conversion would increase the 25 percent increase in equity and use of all proceedsuse of debt rescheduling technique to 68 percent. to retire debt is required to bring the ratio down toThe reliance on debt rescheduling, especially 200 percent.grace periods on interest payments on US$1.3billion in debt (i.e., one-sixth of the total), is 2.45. This example shows that there is life afterworrisome. Tlhe concem is whether corporate debt, but not for all. Most Indonesian corporationsdebt has been reduced enough through debt/equity could emerge from the crisis fairly intact, but onlyconversions and write-offs and whether operating with massive efforts. Without such restructuring,cash flows will suffice to service remaining debt these companies will remain in a weakened andat market rates and terms when grace periods and vulnerable condition, and corporate Indonesia isother concessions expire. If not, Indonesian unlikely to sustain, let alone accelerate a recovery.corporations could fall back into distress. The Govenmment must therefore make every effort
to remove the remaining impediment to2.44. The 135 highly-indebted JSX-listed non- restructuring.financial companies illustrate the magnitude ofefforts that are required to return distressed Accelerating restructuringIndonesian corporations back to sustainable debtlevels. At the end of 1999, these 135 companies 2.46. Lack of "sticks." The lack of reliablehad a cumulative liabilities to equity ratio of 1046 means to impose losses on debtors or force theirpercent-i.e., liabilities are more than 10 times cooperation continues to bedevil corporatethe equity. A 20 percent assets/debt swap and restructuring. Bankruptcy petitions by IBRA weredebt/equity conversion giving creditors 25 percent until recently rejected consistently by the courtsiiownership reduces cumulative liabilities/equity The most recent decisions and the appointment ofratio only to 588 percent -- still much too high several ad hoc judges in bankruptcy cases give(Table 2.5). A more drastic additional step of some hope. Nevertheless, even relativelyliquidating companies with negative equity and straightforward measures to protect creditor rightssettling/writing-off associated liabilities would have not been effective, and taking control over
Table 2.5: Illustrative restructuring measures(Example of 135 Highly-Indebted JSX-Listed Non-Financial Companies, Rp. trillions)
Restructuring Measure Assets Debt Equity Debt-EquityRatio
Actual at end-1999 275 251 24 10.5
Swap of 20 percent of assets for debt (55) (55)
Subtotal 220 196 24 8.2Debt/equity conversions (at 1:1 exchange; to give (8) 8creditors 25 percent ownership)
Sub-total 220 188 32 5.9Liquidation of 44 companies with negative (59) (71) 12equity
Sub-total 161 117 44 2.6
improved earnings and new capital used to retire (10) 10debt
Final Result 161 107 54 2.0Note: The restructuring measures shown in the left column are typical measures taken in a corporate restructuring. Some of these measureshave already been taken in ongoing restructuring in Indonesia. Highly Indebted is defined here as companies with liabilities/equity ratios of200 percent of more. Attainment of a 200 percent liabilities/equity ratio within 18 months vwas one benchmark imposed on Korea's largestchaebols by that country's Financial Supervisory Commission (FSC). Liabilities/equity is a relatively simplistic measure and it would bedesirable to consider additional measures for Indonesian corporations (e.g., profitability, retums on investment, interest coverage), butcurrently available JSX data do not permit this analysis. Source: Jakarta Stock exchange, World Bank estimates.
17

collateral remains fraught with difficulties. And * par value restrictions on the issuance of newcreditors that hold shares as collateral have found equity;it difficult to sell these shares without the approvalof existing shareholders. * a BI requirement for banks to sell converted
equity within 5 years, or within 2 years if the2.47. Additional "stick-strengthening" company is profitable;measures should include the appointment of moread hoc judges to insolvency cases; more technical * concerns about "intentional" LLL violations if aassistance for insolvency judges, an Attorney bank with diminished capital enters into aGeneral's Office/Joint Investigative Team restructuring agreement;presence at insolvency hearings and promptinvestigation ofjudges who make dubious rulings, * possible JSX de-listing, which would make itgreater use by IBRA of its PP-17 powers, and more difficult to sell converted equity;withdrawal of permits - e.g., to do business withthe Government, access to Government credits, . limits on the ability of IBRA to take losses onlisting on the JSX - for recalcitrant debtors. debt restructuring; andRecent history suggests, however, that reform ofIndonesia's legal system will take time and in the . restrictions on foreign financial institutions inmeantime, efforts to promote corporate obtaining good title to collateral.restructuring cannot assume the availability of arobust bankruptcy/foreclosure option. 2.49. The Government has committed to
addressing many of the aforementioned2.48. Tax and regulatory impediments. impediments and various agencies (e.g., BI,Numerous tax, and regulatory impediments to BAPEPAM, JSX, Revenue, and JITF) are workingcorporate restructuring still prevail. Of these, the together to provide regulatory relief. The newmost important ones are: economic team has a clear opportunity to ensure
that these barriers to restructuring are actuallye requirement for tax withholding on accrued removed.
but unpaid interest;
2.50. Availability of bank loans. Diminished- creation of a VAT liability in the case of access to financing is a final problem facing
debt/asset swaps; Indonesian companies. Money is now available fortrade finance, and some companies have overseas
* transfer duties on debt/asset swaps involving funds for working capital. But several factors stillreal estates; limit access to financing; e.g., the weak capital
positions of local banks, reluctance by foreign. recognition of income to the debtor upon banks to increase their Indonesia exposure, and
cancellation of indebtedness in the course of a mistrust in existing corporate management and thecash settlement, debt/asset swap, or Indonesian legal system and opaque capitaldebt/equity conversion; and structures. Especially in cases where existing
corporate management have acted in bad faith,* limits on the carry-forward of net operating foreign creditors insist that they will sell converted
losses. equity as soon as possible and no commercially-motivated creditor will lend to these corporations
Regulatory impediments include: anytime soon. On the other hand, foreign bankersexpect that lending will pick up again once
* a BAPEPAM requirement for a tender offer to memories dim and a sufficiently compellingall existing shareholders if a proposed perception of recovery gains momentum. Access todebt/equity conversion involves more than 20 new loans is likely to be the strongest incentive forpercent of a company's equity; restructuring, and the Government, private
18
investors, and the IFIs should work together tomaximize this incentive.
Endnotes
i The four state-owned banks comprising 50 percent of the bankingsystem are banks Mandiri, BNI, BRI and BTN.iBRI, BTN, and Bank Bali have not yet been recapitalized fully.
The bonds to the central bank reimbursed Bank Indonesia for theliquidity support given to banks during the crisis, and to recoup thelosses on various Govemment credit and guarantee programs.v The banks are BNI, BRI, Mandiri, BCA, Danamon, BII, Lippo,Panin, Bukopin, BPD DKI, Buana, NISP, Ekonomi, StandardChartered and Deutsche Bank.V In fact, excess reserves of banks in the central bank, and the overRplOO trillion in SBIs outstanding suggest ample liquidity.VI Adam Schwarz, Pain in the assets an interview with Cacuk,Asiawise daily, September 28."' This expedited settlement scheme is not available to auto, home orcredit card borrowers.vi The three stipulated tasks are: (i) uphold corporate govemance andtransparency at IBRA, including monitoring policy compliance; (ii)monitor the performance of IBRA; and (iii) offer recommendationsto IBRA and the FSPC to further the success of IBRA.' The first independent audit of IBRA's 1998 and 1999 financialstatements was issued with a disclaimer of opinion due to the auditexceptions identified.x These do not include any credits from non-bank financialinstitutions, penalties, or accrued interest, or trade payables.x This number is consistent with BI data on foreign corporate debt.BI data show a decline in offshore loans to private companies fromUS$61 billion at the end of 1998 to US$49 billion by May 2000."x For example, six separate bankruptcy petitions (including two byIBRA) against Ometraco have been rejected by the courts.Reportedly, however, a hurried May 2000 court decree authorizescontrolling shareholders to self-liquidate and oversee the sale ofassets in settlement of a US$400 million debt. On July 27, 2000,IBRA did prevail in its first bankruptcy petition - against PTLandasan Terus Sentosa for failure to repay a Rp270 billion debt. Itremains to be seen whether bankruptcy rulings by the courts willshow consistent improvement going forward.
19

Chapter 3. Maintaining Fiscal Sustainability
3.1. Indonesia's economic recovery has put (Figure 3.1). These debt levels suggest that anyfiscal sustainability center stage. The recovery benefits from running higher deficits to prop upreduces the need to stimulate the economy, but the demand are now outweighed by the damage extragovernment debt accumulated during the crisis will debt does to Indonesia's risk rating and investors'dominate the budget for the foreseeable future. perception. The good news is that with economyDebt service together with politically sensitive fuel recovery, the need for such a stimulus has alsosubsidies and the growing wage bill have reduced abated. The recovery itself also makes achievingdevelopment spending, and decentralization may fiscal sustainability more feasible (Figure 3.2).add to these pressures. To retain fiscal But debt aggravates the task of fiscal consolidationsustainability while maintaining essential as ordered by the MPR.development spending, Government must firstfocus on the efficiency of spending by improving 3.3. Debt features prominently in the budget.budget management. It must also raise revenues Interest payments took about 5.8 percent of GDPthrough better tax administration, phase out fuel of the FY 2000 budget - a third of governmentsubsidies with time, recover assets at the best revenues - and will not take much less next year.'possible price, and deliver on its program to Even after rescheduling foreign debt, theaccelerate growth. When these measures take Government has to repay about 1.1 percent of GDPhold, the Government can rebuild development this year and next. Debt service will rapidlyspending to underpin sustainable growth. To focus increase in 2002 and subsequent years, whenthis spending on priorities and limit waste, the budget-support loans from the crisis years andGovernment should work with donors to develop a bank recapitalization bonds become due, andnew generation of projects and improve financial rescheduling agreements phase out. The high debtmanagement and procurement. also increases the vulnerability of the state's
finances, especially to shocks in domestic interestDeeply in debt rates, as more than half the government debt is
domestic." A one-percentage point increase in the3.2. The crisis left the Government deeply in real interest rate will cost the Government aboutdebt. After completing the bank recapitalization 0.3 percent of GDP more in interest payments.iiiprogram, government debt will add up to a With debt already very high, the Government cantowering 94 percent of GDP, up from a pre-crisis ill-afford' any further unplanned demands on itsfigure of 23 percent of GDP. Indonesia is now coffers, even if they are an order of magnitudeamong the larger government debtors in the world, smaller than those triggered by the banking crisiswhereas before the crisis it ranked only modestly (Box 3.1).
Figure 3.1: Mounting debt(Government debt as a percent of GDP, selected countries)
1996 Latestcbqio Dnns =_ _Se1lzr n
Cm~~~~~~~Cdh~~C
Jord.m _ m el
H.sP,y ON .f
Sri 1 l.
.
Zsin b = pw Spain B-41a
~~ vi,~~~~ U.dtod Kinodo ~ ~ ~ ~ UWk Ki9oPola.d g Indonesia's government debt Indonesia's government debt
Alb. 00 was small before the crisis U S_ was large after the crisisNrr Td.o Uhld 58lo
Nte:. Laet aa oLIdnei Mrhd00
C-~~~~~~~~~0
Coloolsi.~~~~~~~~~~~~~~~aai
0.00 50 00 100 00 150 00 200 00 2500 OD 0300 00 0 D 20.00 40 00 80500 80.00 10000 D 52000 140.00 10D00 1000
Note. Latest data for Indonesia March 2000.Source: World Development Indicators 2000, World Bank (2000) Indonesia: Managing Governmnent debt and its risks.
:iU

Figure 3.2: Budgetary pressures
Indonesia's government is deeply in debt ... . . .interest payments and subsidies squeeze(Government debt, US$ billion, March 2000) development spending
(share of total spending, percent)USS billion. P..cOni ol to ml sponding
100%
l20 / bO% 0 | | | | | | |~~~~~~~~~ *Dnvnloprnenl
100 1 / 70X -M* * * * * * e *P.rso..l.
8c0 . X Dom0ti so% | | | P P i a OMatenrals
80 debt 50%~~~~~~~~~~~~~~~~~~~~~~~~~~~~~~~~~~~~~~~~~Ow.,tkri,90 40% i ,nsin,o
30% *ln,,rn-t
20% O S,,blid,o
20 ~~~~~~~~~~~~~~~~~~10%
1994/95 1990/99 1996/97 1997198 1998/99 1999/00 1994195 1995/98 199,/97 1997/98 1990/99 1999/00 FY2000
... and debt repayment is about to increase ... ... .shortchanging social, infrastructure, and agriculture(Government debt service US$ billion) (Development spending, constant 1993/94 prices)
US$ Billion Rp. Billion., Conslant 1993194 prices18 30.00-
19
14 ~~~~~~~~~~~~~~~~~~~~~~~~~25.000 12 20.ODO -
Principal 15.000~~~~~~~~~~~~~~1990
Ff99/99 FYYW/00 2000 2001 2002 FY99/99 FY99197 0y7l97/9 FY99/99 FY99/00 072000'
Rut Indonesia has a history offiscaiprudenSesAnd with f scal adjus ment and growth,(deficits and primary surpluses as a percent of GDP) debt remains sustainable
(Debt as a percent of GDP, projections)
Goveonniont~~~~~~~~~~~~~~~~~~iriato
1 ~~~~~~~~~PBrimary Bat nco00, -0
3 -rr(non-inf.r nt) fi---
9,002- other [ $ 0 \7
3 lt*30 -/'3
-4 Onnern Fiscln 20 l2
0 B.Ionc. 10- 1
94/95 F95/96 95/97 97199 9/99 99/00 20002 ° 8 97 O S S O 00 8
Note: The fiscal sustainability projections are based on scenarios for future growth, inflation, interest rates and deficits. In theexpected performance, the key assumption is four per cent real growth. In the poor performance scenario this drops to three per cent,whereas in the strong performance scenario growth increases to 5.5 per cent.Source: World Bank (2000) Managing Government Debt and its Risks. MOF, Bl.
3.4. Debt is hardly the Government's only amount that is more than the combined spending inheadache. The single largest item on the budget one year of all of Indonesia's officially poor.t"after interest payments is fuel subsidies. This year, Repeated attempts to cut subsidies -even whilethese subsidies are 4.5 percent of GDP - an protectingthepoor-haveprovedtobepolitically
21

Box 3.1: Contingent liabilities: the case of PLN
The state electric company, PT Perusahaan Listrik Negara (PLN), recently announced a twelve-fold increase inlosses of up to Rp. 11.58 trillion (US$1.4 billion and equivalent to about one percent of GDP) in the first six months of 2000compared to Rp.974 billion for the same period last year. This occurred despite a 30 percent increase from last year in netrevenues. The primary reason for this was the currency depreciation that resulted in a doubling of debt service payments (toRp.5.3 trillion in the first half of 2000 compared to Rp.2.9 trillion during the same period last year), and surging operatingcosts (to Rp.12.3 trillion between Jan-June 2000 compared to Rp.8.76 trillion during the same period last year). The companysuffered Rp.3.5 trillion in foreign exchange losses during this period. Because PLN is a wholly state-owned entity, thesefinancial losses will impose a fiscal burden on the Govemment - eitier through explicit budget support, or through reducedrevenues from PLN.
Source: Jakarta Post, September 1, 2000.
difficult with the May 1998 riots still fresh in Development spending underpressurepeople's minds. The necessary price increaseshave also become too steep to handle in one go. At 3.7. Development spending has seen betteran oil price of US$28, the price of ADO would days. Its share of the total budget has declinedhave to go up by 150 percent, and the price of from almost half in 1996 to what is now less than akerosene by as much as 400 percent. The new quarter. In real terms, spending has been cut bycabinet has now made the brave decision to make a almost a third between FY 1994/95 and FYstart, and increased fuel prices by an average 12 1999/00. The decline was partly due to the crisis,
percent on October 1. which compressed all spending except subsidiesand interest payments. Moreover, the crisis may
3.5. The third item that looms increasingly have reduced the need for development spending,large on the budget is personnel spending. After which is complementary to private investment. Inthis year's 30 percent increase, the wage bill - fact, public sector investment fell less sharply thanwhich also covers civil service pensions - will top private investment during the crisis' vi Finally,five percent of GDP.' The amount spent on compared to other countries in the region,personnel could change over time with civil Indonesia's development spending has beenservice reforms (Chapter 5), but in the short run, historically high, and despite its decline during theeven if the Government refrains from further wage crisis, spending is now at Korea's pre-crisis levelincreases, most of this spending is fixed. In fact, - hardly a sign of gross neglect (Figure 3.3).the wage bill will increase automatically by about True, Indonesia as a developing country may havefive percent a year due to promotions, aging and more government investment needs, but thethe changing family circumstances of civil question is whether current fiscal circumstancesservants.)i allow for them.
3.6. Taken together, interest payments, Figure 3.3: Historically high
subsidies, and personnel spending absorb more (Capital spending average 1995-98, percent of total and of GDP)
than four-fifths of government revenues. They put P=tsevere pressure on the budget, and it is particularly VW-evident in the development budget, which has Thd
decreased by more than a third in real terms since b -
the onset of the crisis. This pressure may well -R
increase when decentralization begins next year.This chapter, therefore, first addresses the questionwhether the cuts in development spending are . rotal
undermining sustainable development. It thenassesses the fiscal impact of decentralization, andconcludes with outlining fiscal policy options that 0o0 5s '00 Iso a 00 a 30.0 M5, 00
can resolve the dilemma of development spending Source: World Bank SIMA.
and fiscal sustainability.
22

3.8. Intemational comparisons are hard to these funds were diverted regularly frommake, because Indonesia mixes development reforestation.spending with expenditures that other countriesconsider recurrent. Wage elements such as 3.11. Military spending has traditionally takenhonoraria and project management fees are only a modest share of the development budget.included in the development budget, and routine But appearances deceive: the military has hadmaintenance is often "projectized" and put on the access to substantial off-budget funds, mainlydevelopment budget. Donor funded projects - through the business interests of the foundationsfully included in the development budget - under its control."x Thus, although budgetaryregularly finance recurrent spending such as books spending on the military and the police combinedand medicine. Defense spending, which by is only about Rp.10 trillion, or barely one percentinternational convention should be included in the of GDP, independent observers estimated the truerecurrent budget, shows up largely as development amount to be closer to three percent of GDP (aboutspending in Indonesia. Finally, there is a general 0.5 percentage point higher than the average in theimpression that part of the development budget is East Asia region).X Even that is not a huge sum,used less than efficiently.viv though, and it is probably decreasing, because like
any business, military firms suffered during the3.9. Despite these difficulties, there is little crisis. The downside of this funding squeeze is thedoubt that development spending declined. Within increasing reports of extortion by military unitsthis shrinking pie, spending on infrastructure across the country.'" On the upside, there is a waysuffered the most, sometimes at high costs. For for the Government to pay all militaryinstance, the 500-volt transmission network has expenditures from the budget, in exchange forgaps that prevent power suppliers from hooking which the military would have to give up controlup, forcing PLN to pay for expensive power that of its business interests. Revenue from thesecannot enter the grid. And the inadequate and businesses would then finance the military's extrapoorly maintained rural infrastructure is on-budget spending, or better still, these businessundermining the Government's efforts to reduce interests could be sold to reduce state debt'x" Inpoverty (Chapter 4). The Government's emphasis 1998, such a deal was struck between China'son community-based infrastructure therefore seems government and its military, and the signs are thatappropriate. the deal sticks.
3.10. The declines in the social sector spending 3.12. The decline in the development budgetis of concern. While the Government managed to notwithstanding, it still contains various shades ofchannel funds towards a social safety net, overall white elephant, with more waiting in the wings.social spending in the development budget For instance, the Government still invests in portsdropped. This fiscal year, it is about 40 percent and airports, an activity that could be left to thebelow spending in FY 1995/96 in real terms. True, private sector. Instead of concentrating on thebecause of large physical expansion in the past less provision of a sound regulatory framework tophysical expansion in schools and hospitals is allow such investment to happen. The same goesneeded now. And despite lower spending, school for telecommunications, and indeed, theattendance has hardly come down - in part Government has already taken up plans to thisbecause of the Government's scholarship program. extent. Expensive and large infrastructure projectsBut maintenance, material, and equipment costs should be shelved at the current state of theare usually paid for from the development budget economy and the budgettoo, and continued low funding could thereforeaffect the quality of social services. Agriculture, 3.13. In sum, it is hard to say whetherforestry and irrigation spending dropped even more development spending falls short of needs onin real terms - about 50 percent since FY aggregate.'"" But some sectors have been1994/95. And the reality is even harsher: the particularly hit during the last several years,figures for the last two fiscal years include whereas in others there is still "fat." This suggestcommitments from the reforestation fund for this that the best way forward is re-allocating scarcesector. However, a recent audit confirmed that budgetary resources towards those sectors essential
23
for sustainable growth, and to save on the cost of projects; approvals by the MOF are required forinvestment by better budget implementation (see foreign loans.below). However, now is not the time for a rapidexpansion of the development budget- especially 3.17. The Government's decentralizationwhen decentralization may make budgetary program carries significant risks for both statepressures worse before they get better. budget deficit and service delivery. The
fundamental reason for the risks is that despiteThe fiscal impact of decentralization high expectations in the regions, decentralization
will initially be a zero-sum game at best. The3.14. Indonesia is on the verge of major existing government apparatus and most ongoingdecentralization. If managed well, the archipelago projects must be financed after decentralizationstands to gain much, because it is unusually also. Moreover, there will be less fiscal means forcentralized for a country of its size and diversity. the general government, because the deficit is setMoreover, there is a strong political imperative to to shrink according to commitments in the LOI.decentralize, to counter the centrifugal forces Only over time will resources free up because ofwithin the country. Laws 22 and 25 of 1999 retiring civil servants, closing projects or largerstipulate a drastic increase in the regional share of government revenues. However, most regionsgeneral government spending. Estimates suggest want the money now, preferably without thethat when decentralization is fully implemented, expenditure responsibilities that come with it.the regions will spend about eight to nine percentof GDP, or well over 40 percent of general 3.18. The coincidence of administrative andgovernment spending, and more than double what fiscal decentralization is also problematic. Thethey spend now. Three hundred and fifty plus center's deficit tends to widen if more revenue thandistricts and cities will control the bulk of this, expenditure is decentralized, or if the revenue isbecause the provinces will play only a minor role. allocated to regions that do not receive equally
large expenditure. If more expenditure than3.15. In contrast to the increase in regional revenue is decentralized, services may fail due tospending, the regions' own revenues will rise only lack of funding. On aggregate, the minimumslightly. Revenue sharing, a general grant, and transfer to the regions - about 5.3 percent of GDPspecific grants will make up the difference - is not particularly large because it is already 3.7between the two. Revenue sharing will be percent. Nevertheless, the risk of a shortfall issignificant, but is largely for the few lucky regions possible for two reasons. Firstly, only a fewthat have natural resources. Benefits will mainly regions receive significant resource revenue shares,accrue to six provinces, and eight districts within and these are unlikely to be matched by an equalthose provinces, which have abundant natural amount of spending obligations - for example,resources - particularly oil and gas.xIv Other Riau is unlikely to take on external debt service.minor sources of revenue sharing include mining,forestry and the real estate transfer tax. Together 3.19. Secondly, the general grant allocation willthey will take up about 1.3 percent of GDP next be distributed by a formula, which by law shouldyear. equalize fiscal capacity across the country, based
on objective indicators of needs. This is sound in3.16. The main source of revenue for most principle, but the resulting distribution of fundsregions will be the general grant. This grant will across regions may not match the distribution ofbe a minimum of 25 percent of 'domestic' expenditures resulting from administrativerevenues'v and about four percent of GDP. On top decentralization. Those regions that receive moreof that, central government can award special revenue than spending obligations will use thegrants, but the amount will have to be small in the extra money for other things. Those that receivecurrent budget environment'v" Regional too little will come back to the center for more,governments will also be allowed to borrow, but backed by a guarantee in the law that decentralizedthere will be a ceiling for the total debt and debt functions should be financed. Moreover, resourceservice for each region. Law 25 reserves revenue sharing is likely to put a limit toborrowing for revenue-generating infrastructure equalization.
24
3.20. At this point in time, a major change in the consider whether restricting regional borrowingdecentralization plans no longer seems to be an should be limited to infrastructure projects withoption.x"i However, next year's budget suggests financial rates of return only, as Law 25/99that not all spending will be decentralized in one prescribes. And the Government should develop ago. The Government should now focus its efforts framework that gives regions access to donoron containing the risks of decentralization. Firstly, finance, as the regions will become responsible fora proper strategy is essential to devolve the the functions that the donors traditionally finance.administration in an orderly way. The moreexpenditure responsibilities the center can devolve, 3.25. Finally, the Government should plan forthe less the risk of a larger deficit; and the more implementation setbacks. It should have crisisorderly the devolution, the less danger of service units in the line ministries and core agencies; suchbreakdown. Agreement with the regions on such a as, MOF and Home Affairs, to respond quickly tostrategy can be reached through the DPOD, an major or minor hiccups in the decentralizationimportant consultative body that has only recently process. It will also need to allocate resources tobecome operational. build capacity at a local level. And it should
budget for contingencies to ensure sufficient funds3.21. Secondly, the regions should be briefed are available when needed. Such contingencythoroughly on the decentralization plans, the new allocation will further limit the funds at theregulatory framework, and the expenditure disposal of the development budget, but it will beresponsibilities and funding that they can expect money well spent.next year. It is urgent that the Governmentorganizes meetings among districts, cities, and Policy options for fiscal sustainabilityprovinces to sort out any uncertainty aboutresponsibilities, to arrange for a process to re- 3.26. The Government can maintain fiscaldelegate district functions to provinces, and to sustainability while safeguarding the spendingagree on joint operations of functions with large necessary for sustainable development. Beyondspill-overs across districts. implementing the policies that accelerate growth, it
-must do more by improving budget management,3.22. Thirdly, the Government should ensure raise revenues, and cut wasteful spending.that the regions' financial accountability is in Privatization and asset recovery will help reduceplace. The devolution of large amounts of state the need for foreign financing, and will, thereforeresources to a level of government that has had reduce foreign debt and financing in time But forlittle past experience risks the money being abused. now, for financing in time.Establishing strict internal and external financial now, donor financing remains crucial.reporting rules - including sanctions on non- 3.27. Improving fiscal management. Improvingcompliance - enhances the chance for auditors fiscal management would not only save taxpayersand the civil society alike to limit such abuses. money, but would also contribute greatly to better
movenneybuwol (Calsor conriut gReatlys to better3.23. Fourthly, regional finance should be put goverance (Chapter 5). Reforms in budgetonto a firmer footing. The reliance on transfers processes, financial management and procurementont afirerfoomg Te rllnceontrasfrsare all urgently needed. The analyticalfrom the center is devastating for accountability, unerpinningsnare neede d The Goveytmentbecause the regions can always blame Jakarta for hadaready are implementing them several
sending toolittle mone. Expandingthe regions has already started implementing them: severalsending too lttle money. a Expanding the regions draft budget-management laws have been inown tax base and allowingemth circulation for some time now, and Keppreschange tax rates are therefore urgent. 18/2000 aimed at improving the rules and
3.24. The Govemment should carefully consider regulations for govemment procurement.However, both fall short of what is needed to reach
the regulatory framework for regional borrowing. international standards.Macroeconomic concerns would call for controlover total regional borrowing in addition to the 3 28. Particularly in the case of procurement,affordability constraints on borrowing by iidvdarein. Th Goemn shul als intemnational standards are playing an increasing
role in agreements ranging from WTO to APEC,
25

and the Government should prepare to meet them. risks to the budget such as contingent liabilities inInternational standard procurement rules - such banks and state enterprises should be monitoredas those laid down by the World Bank - allow for and managed. A well-resources debt unit couldequity considerations, like the ones Indonesia has take on that task as well.for small enterprises. But they do so in a non-distortionary manner, by giving generic preference 3.30. Raising revenues. Excluding oil revenues,to domestic firms through a price margin, for Indonesia's tax take of the economy is too modest.example. Even so, experience in intemational With about 11 percent of GDP in taxes, the countrycompetitive bidding shows international or large is out of line with the region (Figure 3.4) --andfirms are generally eager to tie-up with smaller, consequently appears to have the potential to raiselocal firms, and provide capital and technology more taxes. The Government has already passedtransfer in the process. Limiting certain contracts revisions to several tax laws that can increasefor small, domestic firms, on the other hland, is revenues by broadening the tax base.xIx At themerely an invitation for inefficiency, and same time, the measures to phase out Batamsometimes graft. Transparency and civil society Island's tax advantages have been delayed, andoversight should become part and parcel of plans to expand rather than limit tax-free zonesprocurement to avoid the latter. continue to be under debate. Indonesia's low taxes
are probably not a decisive factor for investors at3.29. The sheer size of the government debt has this point in time. Instead of generating furthermade its management a crucial part of fiscal investment, granting generous exemptions willmanagement. In the short run, the Government lead to a windfall for those who had alreadyfaces issues of liquidity of recap bonds, fiscal risks decided to invest - or worse, for foreignentailed in the debt, and the exposure to further treasuries.contingent liabilities. Over time, it must addressthe huge task of (partially) refinancing the debt, for 3.31. For now, rate increases are not necessarywhich it will need a thriving market for for raising revenues. The weak link in Indonesia'sgovernment bonds. The Government has already efforts to raise revenues is administration. Takecreated a debt management unit in the MOF to personal income tax: the Government's assessmenthandle these and other issues. Staffing and is that out of a potential 20 million income-taxequipping such a unit is a priority, as well as payers, only a pitiful 1.3 million are actuallylinking its activities to fiscal policy, the treasury registered - half of whom are untraceable becauseand cash management. In addition to debt, the their listed addresses are incorrect'Y Some of the
tax dodgers are found in the best circles: the taxauthorities revealed that hundreds of MPR
Figure 3.4: Not taxing members did not pay their taxes. For those that do(Tax revenues GDP, average latest available 5 years) ppay taxes, the administration IS a nuisance: If one
25.0 of GDP dares to ask for a perfectly justified refund, one ismost likely to be audited - and frequently end up
20.0 having to pay the auditor rather than the treasury.'
1.0. 3.32. The state of the tax administration makesthe current plans for a tax amnesty a risky one.
10.0 Rather than raising more revenue, the amnesty mayactually reduce it, as those paying taxes now may
5.0 stop doing so, if they know they obtain anamnesty. Only if the tax administration is ready to
0.0 perform, and is serious about penalizing taxTax revenue. percent of GDP dodgers, would there be an incentive to pay up
but, in that case, no amnesty is required.Note: Indonesia includes tax revenue on oil and gas, but excludes
resource rents. 3.33. Phasing out subsidies. The Governuent iskeenly aware of the burden fuel subsidies place on
26
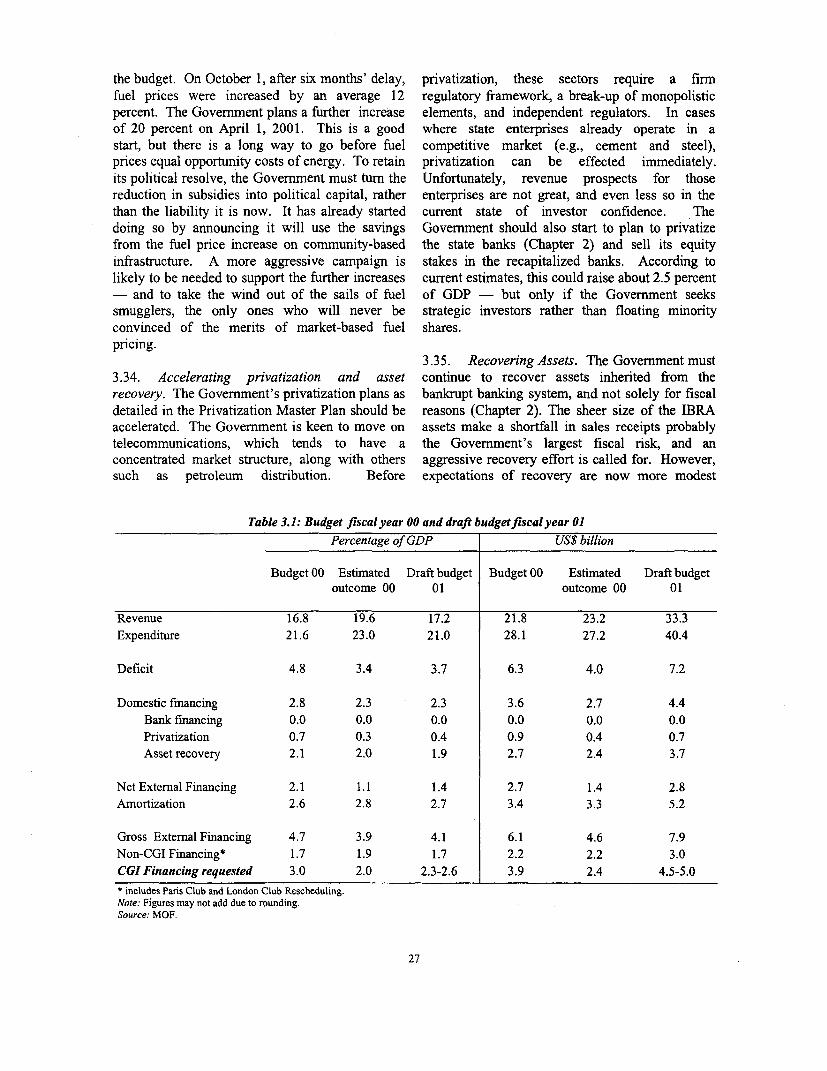
the budget. On October 1, after six months' delay, privatization, these sectors require a firmfuel prices were increased by an average 12 regulatory framework, a break-up of monopolisticpercent. The Government plans a further increase elements, and independent regulators. In casesof 20 percent on April 1, 2001. This is a good where state enterprises already operate in astart, but there is a long way to go before fuel competitive market (e.g., cement and steel),prices equal opportunity costs of energy. To retain privatization can be effected immediately.its political resolve, the Government must turn the Unfortunately, revenue prospects for thosereduction in subsidies into political capital, rather enterprises are not great, and even less so in thethan the liability it is now. It has already started current state of investor confidence. Thedoing so by announcing it will use the savings Government should also start to plan to privatizefrom the fuel price increase on community-based the state banks (Chapter 2) and sell its equityinfrastructure. A more aggressive campaign is stakes in the recapitalized banks. According tolikely to be needed to support the further increases current estimates, this could raise about 2.5 percent- and to take the wind out of the sails of fuel of GDP - but only if the Government seekssmugglers, the only ones who will never be strategic investors rather than floating minorityconvinced of the merits of market-based fuel shares.pricing.
3.35. Recovering Assets. The Government must3.34. Accelerating privatization and asset continue to recover assets inherited from therecovery. The Government's privatization plans as bankrupt banking system, and not solely for fiscal
detailed in the Privatization Master Plan should be reasons (Chapter 2). The sheer size of the IBRAaccelerated. The Government is keen to move on assets make a shortfall in sales receipts probablytelecommunications, which tends to have a the Government's largest fiscal risk, and anconcentrated market structure, along with others aggressive recovery effort is called for. However,such as petroleum distribution. Before expectations of recovery are now more modest
Table 3.1: Budget fiscal year 00 and draft budget fiscal year 01Percentage of GDP US$ billion
Budget 00 Estimated Draft budget Budget 00 Estimated Draft budgetoutcome 00 01 outcome 00 01
Revenue 16.8 19.6 17.2 21.8 23.2 33.3
Expenditure 21.6 23.0 21.0 28.1 27.2 40.4
Deficit 4.8 3.4 3.7 6.3 4.0 7.2
Domestic financing 2.8 2.3 2.3 3.6 2.7 4.4Bank financing 0.0 0.0 0.0 0.0 0.0 0.0Privatization 0.7 0.3 0.4 0.9 0.4 0.7Asset recovery 2.1 2.0 1.9 2.7 2.4 3.7
Net External Financing 2.1 1.1 1.4 2.7 1.4 2.8Amortization 2.6 2.8 2.7 3.4 3.3 5.2
Gross External Financing 4.7 3.9 4.1 6.1 4.6 7.9Non-CGI Financing* 1.7 1.9 1.7 2.2 2.2 3.0CGI Financing requested 3.0 2.0 2.3-2.6 3.9 2.4 4.5-5.0
* includes Paris Club and London Club Rescheduling.Note: Figures may not add due to rounding.Source: MOF.
27

than last January, when the World Bank still Figure 3.5: Falling shortanticipated total recovery to be above Rp.200 (Pledges and actuals of project and program finance,trillion. First and foremost, this is due to the FY98/99-FYOO, US$ billion)
sizable debt forgiveness implicit in recent IBRA us$deals with its large debtors. It is also caused by the godeterioration of the medium-sized loan assets held so pgby the AMC, as well as shareholders' assets 70 |
pledged in the MSAAs, which have proved to be soworth much less than expected. The Government is 4 _still contemplating who should make up for the Program
difference. 3 'L20
The role of the donors o .
FY IS1 F 19SIW FY 2W-
3.36. Donors have supported the Government *'preliminary outcome.
through the crisis and on into recovery. Through Source: World Bank, MOF, BI
project and program finance and rescheduling,such support has prevented a collapse of the money played its role as a line of credit thedevelopment budget, and enabled a quick return to Government could draw on in times of need. Thismacroeconomic stability, because of the non- helped to stabilize the markets.inflationary nature of foreign financing. Yet, moreoften than not, the Government has not used all the 3.37. Even with significant fiscal policysupport pledged at CGI meetings (Figure 3.5). This measures to reduce the deficit, foreign financingwas partly due to the rather chaotic budget remains crucial. Next year, the deficit is budgetedimplementation during FY 1997/98 and FY to be about 3.7 percent of GDP (Table 3.1), lower1998/99, which led to a dip in project than the FY 2000 budget, although roughly thedisbursement. Project disbursement has much same as this year's expected outcome. Thisimproved since then, but the shortfall in program projection, which is based on a conservative oilfinancing remains. In part, there was simply less price estimate of US$22/barrel, includes aneed for it over the last 18 months, because of the contingency of about 0.5 percent of GDP, both forwindfall in oil, but the Government also did not decentralization and for uncertainties in the budget.meet all the policy objectives that would have Asset recovery and privatization are expected totriggered financing. Nevertheless, the committed
Box 3.2: Using aidfor sector reforms and investment: the example of WA TSAL
To improve the fiscal, economic, environmental and social performance of its vital water resources and irrigationsector, Indonesia is undertaking a comprehensive policy paradigm shift and sector management institution reform as part ofIBRD balance-of-payments support commitment. The principles of the reform are transparent sector governance, greateragency accountability, and public-private partnerships, community participation.
The reform agenda includes: (a) a national water resources and irrigation policy; (b) a new water resources law anda new sector legal and regulatory framework; (c) redefinition of the roles, mandates, organization, financing mechanismsand, management control and information systems of national, provincial, river basin and district level agencies; (d)integrated inter-govemmental decision-support and data networks; (e) improving water pollution control to include financialand fiscal regulatory instruments; (f) transferring irrigation network management to autonomous, legally empowered andself-financing water user associations their federations; (g) stakeholder participation in all provincial and river basin policy-making bodies including a National Water Resources Council; and (h) sector adjustment to administrative and fiscaldecentralization legislation.
Based on public consultations, the reforms are being prepared by an inter-governmental and NGO task force underthe Coordinating Minister for Economy and Finance with support from several donors. The donors will collaborate with theGovernment in preparing a national water sector management program which will consolidate the new policies andinstitutions emphasizing sustainable sector management over infrastructure development. The program will consist ofindividual donor projects, all following common program principles and strategies under joint oversight.
28
raise about the same share of GDP as this year'sexpected outcome. Net foreign financing needs, i According to WDR 2000/01, the poorest 10 percent of the
therefore, amounts to 1.4 percent of GDP, or population spends about 3.6 percent of all household expenditures inlndonesia.US$2.8 billion. Amortization will be US$5.2 vlncludingpensions and personnel transfers to the regions.
billion next year, resulting in a gross financing vi For next year, however, the Govemment has decided to consolidate
need of US$7.6 billion. However, Indonesia will some allowances with the base wage. Because family allowance isthe benefit of rene ed rescdefined over base wage, this causes an extra increase in personnel
enjoy the benefits of renewed rescheduling of spending.US$2.8 billion under the Paris Club, and US$0.3 v Whereas over 1993-1997, the public share of domestic investment
billion under the London Club. The CGI financing declined from 25 percent to less than 21 percent, it shot back up toalmost 35 percent in 1999. Source: BPS, Staff estimates.needs will therefore be to the order of US$4.5-5 viii This impression is confirmed by findings of the World Bank
billion. The higher number is slightly more than (March 2000) Country Procurement Assessment Report. The newthe fgurepleded fo FY 000,but nxt fscalyear economic team also buys into this perception: the "Ten Pointt f r l e o 2f l y Program" states that by cutting waste in the development budget, the
will comprise 12 months, instead of only nine in same results with less spending can be achieved.
FY 2000. it The Yayasan are: I)Armed Forces (TNI-AD): Yayasan Kartika EkaPaksi, Yayasan Kesejahteraan Korps Baret Merah (KOBAME), IndukKoperasi AD-INKOPAD, Primer Koperasi AD-PRIMKOPAD; 2) Air
3.38. For donors, improving budgetary Forces (TNI-AU): Yayasan Adi Upaya, Yayasan Dirgantara, Induk
processes and project management takes on a Koperasi AU-INKOPAU, Primer Koperasi AU-PRIMKOPAU; 3)Navy Forces (TNI-AL): Yayasan Bhumyamca (Yashbum), Induk
particular importance. Now that the crisis is Koperasi AL-INKOPAL; 4) Police Department: Yayasan
abating, donor contributions will shift from budget Bhayangkara, Yayasan Brata Bhakti Polri, Induk Koperasi Polisi-support back to project financing Inthe course of INKOPPOL, Primer Koperasi Polisi-PRIMKOPPOL, Yayasan
supprt bck t proectfinancing. In tecusof Keluarga Besar POLRI; 5) The Headquarters: YayasanMarkas Besar
fiscal consolidation, more room for a revamped ABRI (YAMABRI); 6) Department of Defense & Security: Yayasan
development budget will open up. The WATSAL Sudirman, Yayasan Maju Kerja, PT. Asuransi Sosial ABRI(ASABRI). 7) Ground Forces-Strategy Commando (Komando
is a fine example of how Government, civil Strategi Angkatan Darat-KOSTRAD): Yayasan Darma Putra
society, and donors can work together to change KOSTRAD; 8) Special Ground Forces (Komando Pasukan Khusus-policy, programs, and project management to best KOPASSUS): Yayasan Kobame. An informal review of 88 Yayasan
firms reveals that they have a tumover of Rp.2.9 trillion 1998 or 1999meet Indonesia's needs (Box 3.2). Improved (0.2 percent of GDP). Profits, however, are low, and some 21
financial management and procurement processes companies closed down over the crisis.and ciil soiety mnitorng shuld enure tat, ,Source: The World Bank SIMA, based on IISS data.and civil society monitoring should ensure that, xi Michael Ross: Civil conflict and natural resources-The case of
once allocated, the money gets spend as intended. Indonesia, mimeo, World Bank.
Donors are eager to work with Government to 'i The military foundations have recently been audited, but at the timeof writing no details of the audit were available. BPK did not release
support all of these elements of a sound the total amount of funds available in the foundations, but did publicly
development program. give its stamp of approval over the use of funds by Kostrad, thestrategic arny reserve. Jakarta Post, September 20, 2000."' Judging the adequacy of spending would be aided greatly by
3.39. Indonesia can matntain fiscal information on ex-post rates of retum on completed projects but,
sustainability, but it will be hard work. The unfortunately, the Govemment has no such data - nor for that matterGovernment must increase spending efficiency, maintains data on the impact of spending on the poor.
Govemmentmust incrase spening efficency' ."Fifteen percent of non-tax on-shore oil revenues is shared with the
reduce wasteful subsidies and raise more taxes. It producing region, three percentage point of which go to the province,should also contain the fiscal risks of six to the producing district and six to the other districts in the
region. For gas, the figures are 30, 6, 12, and 12 respectively.decentralization, state-enterprise operations and the xv Apparently, 25 percent of revenues before revenue sharing. This
banking system. But perhaps the decisive factor in effectively increases all sharing rates.
the short run is IBRA's asset recovery and xv Some of the development spending of the central govemmentimplemented at the regional level should be considered an alokasi
enterprise restructuring. Not only should this khusus.maximize government income, but it should also 'vs In the previous CGI brief, the World Bank suggested a phased
* ~~~~~~~~~~~~~~~~~approach to decentralization.achieve the enterprise restructuring necessary for aprchtdenrlito.achieve xv""' See the various IMF Technical assistance reports on budgetmore rapid growth. And rapid growth is the management, the World Bank (April 2000) Public Spending in a TimeGovernment's best hope for fiscal sustainability. of Change, the (draft) Country Financial Accountability Assessment,
and the (draft) Country Procurement Assessment Report."' One of these changes is likely to affect donors to some extent.
Endnotes Whereas contractors on donor funded projects were previouslyincome-tax exempt, PP No. 43/2000 suggest this is no longer the case.At this point, it is unclear whether the various bilateral aid treabes
' The expected decline in interest rates will be offset by the higher Indonesia has signed with donors override this PP.level of debt due to the completion of the recapitalization program this Based on statements of the Director General of Taxation, MOF, asyear. . quoted in the Jakarta Post, July 31, 2000.Oil revenues provide a hedge against fluctuations in the Rupiah. -i Investnment Coordinating Board, Directorate General of Taxes andThe World Bank 2000, Public Spending in a Time of Change. The Joint Chamber Forum, August 30, 2000.
29
Chapter 4. Attacking Poverty
4.1 The previous chapters focused on short- 4.5 And then the crisis hit. The deficiencies ofterm challenges to growth and stability. With this Indonesia's development approach, which hadchapter,' we proceed to Indonesia's medium-term been praised by many including the World Bank,challenges. And where better to begin than with were exposed to increasing scrutiny and criticism.poverty reduction the most important challenge This forced a critical re-evaluatiop of Indonesia'sfacing Indonesia. All other efforts: approach to development, and most especially itsdecentralization, civil service reform, bank policies toward the poor and near poor.restructuring, debt management, macroeconomicpolicy, education reform and even political reforms 4.6 The economic crisis raised fears of large-will, and should be, judged by the extent to which scale social unrest, creating an imperative forthey contribute to raising the broad standard of action. In response, the government launchedliving of Indonesians, especially the poorest. several "social safety net" (JPS) programs.
Experience from these programs reveals pattemsAssessing Poverty which also shed light on the strengths and
weaknesses of the development approach that had4.2 Poverty is often described in terms of contributed so much in the past, but had come upmaterial deprivation based on measurements of short. In particular, it shows:expenditures (Box 4.1). While this providesinsight into one of poverty's dimensions, it does * that government has the capacity to bring tonot do justice to the daily realities of life faced by scale quickly and implement reasonably wellmany Indonesians, who confront a wide range of programs that have simple objectives and clear,deprivations, including: inadequate shelter, health, easily communicable, benefits (for example,nutrition, and education; lack of access to safe OPK- Special Rice Operation);water; inadequate means of mobility; extremevulnerability to ill health, economic dislocation, * the implementation of programs that requireand natural disasters; social exclusion and quality of service, institutional commitment,exposure to ill treatment by institutions of the state complex objectives, and local discretion wasand society; and powerlessness to influence key much more problematic because sociallydecisions affecting their lives." Losing a job, a legitimate decision-making and accountabilityproblem with health, a family emergency all of mechanisms are not in place; andthese can make even the well-off vulnerable topoverty. * government programs did not work in synchrony
with the variety of "informal" safety nets, as4.3 Once the multi-dimensional breadth and individuals, communities, and groups galvanizeddynamics of poverty are acknowledged, poverty is themselves to help each other cope with thea reality that, in one form or another, confronts consequences of the crisis.more than half of all Indonesians (Box 4.2) andhence must be of concern to all Indonesians as 4.7 Even before the crisis, limitations in thewell as those aspiring to support Indonesia's govemment's strategy and capacity were apparent.development. Government programs, whether financed from own
resources or by donors, were chronically:4.4 In the thirty years between 1967 and 1997,Indonesia's growth rate was among the most rapid * underfunded for routine operations and reliantin the world. That rapid growth had broad-based on the development budget - creatingbenefits and was accompanied by enormous incentives to use informal mechanisms forimprovements in living standards of the raising funds;population. Poverty by most standards felldramatically, infant mortality declined, school . unresponsive to local needs - programs wereenrollments climbed, and the provision of basic top down in design with no one accountable;infrastructure (water, roads, electricity) increased.
30

Box 4.1: Many different poverty lines: many different poverty measures
Different institutions use different poverty lines, based on different methodologies, for different purposes.
The poverty line used by the World Bank when making comparisons across countries is expressed in US$a day - say, US$1.50 per person per day. To ensure strict comparability, the poverty line is based on a
purchasing power parity (PPP) exchange rate anchored in 1993 prices which adjusts for different relative pricesacross countries. This is appropriate because the resulting poverty measures for different countries is useful
information when allocating development resources across the developing world.
In the case of Indonesia, the national poverty line is calculated by BPS (Central Bureau of Statistics).BPS' poverty line is set lower than the international poverty line set by the World Bank. Not surprisingly, thepoverty rate calculated from the BPS poverty line is lower than the World Bank's estimate using its internationalpoverty line. National poverty lines are set when analyzing poverty within countries. They are useful because
they provide a national reference point based on some socially-accepted norm of when a person or family is
considered poor. These poverty lines allow countries to identify the poor - where they live, what they do, and
how they can be reached - so that development programs can be designed accordingly.
But even national poverty lines yield different estimates of poverty rates, because different surveys lead todifferent results. While a large number of surveys are available for the crisis period, they are not all comparablewith one another. We are reasonably certain that the poverty rate peaked sometime in late 98-early 99 and hasdeclined since. Here we show estimates based only on SUSENAS data but even so, there are issues ofcomparability between the mini SUSENAS and the full SUSENAS surveys, both on account of sample size andunknown effects of seasonality. So while it is reasonable to conclude that poverty levels have declined betweenDecember 1998 and August 1999 based on the mini SUSENAS, it is not possible to specify the magnitude of thedecline since the last full SUSENAS was only in February 1999.
Boxfigure: Trends in the poverty rate(Using BPS' revised poverty line)
Poverty rate (%) Mini-Susenas
24 24.2
23 Full Susenas
22
21
20-
19
18 - 18.217.6 ~~~~~~~~~~Mini-Susenas
17 -Full Susenas
16
1996 1997 1998 1999
31

Box 4.2: Measuring vulnerability
Half of the Indonesian population is at risk of falling into material poverty.
Measuring a "vulnerability-to-poverty rate" that is directly comparable to the more standard headcount measureof the poverty rate has never really been done before. But a draft World Bank report: Poverty Reduction in Indonesia.Constructing a New Strategy tries to do just this. It defnes a household's level of vulnerability as the risk a householdfaces of seeing its expenditures drop below a pre-defined poverty line. We define a household as vulnerable to povertyif this measure of risk exceeds 0.5 over a three-year horizon. In other words, a household is defined to be vulnerable ifthe probability of its expenditures falling below the poverty line over three years is greater than 50-50.
The key innovation was to use data that tracked individual household expenditures over time and measure theirvariability. Remember that such a measure of expenditure variability already accounts for whatever "smoothing" ofincomes that households do - through informal insurance, savings, and other coping mechanisms. Despite suchsmoothing, expenditures of households are very variable, and this is confirmed in a variety of surveys. The bottom lineis that over half of Indonesia's households are vulnerable to poverty over a three-year horizon
The concept of vulnerability applies to other dimensions of poverty as well. The health of household members,or the education status of children in a household, can suddenly change. Even the social situation of households canalter over time, for better or worse. Unfortunately, data on these different dimensions are scarce, and the World Bankreport does not measure these characteristics of vulnerability.
These dynamics means that it does not make sense to think of "the poor" as a distinct group. Those who areexperiencing poverty are a very fluid group, changing from year to year while most households face some substantialrisk of experiencing poverty at some time and hence will at some time find themselves 'poor."'
* inflexible with government officials possessing credit to privileged firms, seize communal landslittle discretion at the "client" level and for "development" projects, and manipulatereceiving little support; and contracts.
* uncooperative with pre-existing community Constructing a strategy for the futuregroups: instead of harnessing local initiative,government efforts to co-opt or supplant local 4.9 Poverty is most successfully addressedgroups resulted in duplicate efforts. when there is a coherent strategy a broad
consensus of purpose about the range of actions4.8 One might conclude that the government's that need to be undertaken and how they fittop-down approach was needed because it together. A poverty strategy should emerge from acompensated for a lack of capability at the local reflective, factually informed dialogue of alllevel. But the reality is different. Indonesia's stakeholders, including national and sub-nationalvillages have vibrant, resilient and resourceful civil governments, religious organizations, labor unions,societies (Box 4.3). Centralized control, top-down universities, research institutes, women's groups,orientation of local government, and replacement producer groups, other civil society organizations,of traditional social groups by vertically oriented and donor agencies. Most important of all, the"interest" groupings all these changed social and dialogue should include the poor themselves whopolitical relationships at the local level and are seeking to exercise control over their ownreinforced central control in the interest of destiny."nationalization" and stability. Centralized powerand accountability helped in some ways but hurt in 4.10 Indonesia needs a new poverty strategy forothers. It helped provide schools in every village, two reasons. First, it needs to acknowledge theextend electricity, and build roads. But it was also broader, multidimensional, more dynamic realityused to form marketing monopolies, channel bank of poverty that includes the broad array of
32

deprivations, vulnerabilities, and risks people face. multiple channels of communication about theAlleviating poverty means creating economic and content of programs, the resources allocated tosocial conditions that empower Indonesians to use them, and those who are accountable for theirtheir own assets and skills, live free from fear of effective implementation.material deprivation, and take an active part in thesocial and political life of their community and * second, it must give voice to the poor. Withnation. "voice", the poor can affect outcomes of
programs that are of greatest importance to4.11 Second, the country needs a new strategy them. Where there is only one supplier of abecause times are changing. Indonesians have public good such as police services or roadslaunched into a historic political transition from a the participation of citizens should be ancentralized, authoritarian system to a democratic integral part of monitoring their performanceand decentralized government. Over the next few and providing feedback. Where there could beyears the fundamental structure of government in more than one supplier of a public good orIndonesia is going to change. To combat poverty service, the participation of citizens shouldeffectively, Indonesia's new democratic and ensure that the chosen supplier is selecteddecentralized system will need to do three things transparently for the maximum welfare of thewell: community. One voice that is often excluded
is that of women. And yet women are an* first, it must ensure adequate information on integral part of poverty reduction responsible
development programs before and during for a significant portion of earnings in additionimplementation. The government's monopoly to playing their traditional role within familiesover information will need to be replaced by and households.
Box 4.3: Local capacityfor collective action in Indonesia
Despite the tendency of the Suharto regime in Indonesia to centralize development efforts and ignore localorganizations, capacity at the local level has remained quite high. A study of local institutions found that:
4 more than 80 percent of respondents had participated at least once in commnunity activities to meet collectiveneeds during the last year;
4 communities had initiated 38 percent of all development activities, far more than outside groups or NGOs, andnot that many fewer than government (53 percent);
4 most religious facilities (83 percent) are the result of community effort; more striking is that many credit (53percent), infrastructure (47 percent) and public facilities projects (36 percent) are the result of local initiative;
4 only 67 percent of government-initiated projects were found to be reaching their intended beneficiaries, whilefor locally-initiated projects, the proportion was 83 percent;
4 community infrastructure projects are better maintained; 85 percent of all community infrastructure projectsthat had created facilities were still in use, whereas this was true for only slightly more than half of government-funded facilities.
Of course, capacity across villages and communities varies widely. Unsurprisingly, those with more capacitytend to have more, more diverse, and better quality projects. Moreover, although community projects weregenerally better than government-initiated activities, failed community efforts pointed to the same persistentproblems: lack of information, skills, poor design, and intermittent and unpredictable funding.
33

* third, is accountability. Officials should be the concerns of employers; reforming theheld accountable for their actions so they react system for allocating timber concessions;to feedback with better service. Indonesia's promoting best practice land policies includingnew democratic institutions and processes titling; and removing distortions in formalfrom the capital of the country to its thousands credit markets.of villages will need to develop suchmechanisms in due course, and an integral part * Poverty focused public expenditures. Fiscalof this development will be the establishment constraints mean tough choices. For theof a functioning legal and judicial system. government budget to benefit the poor, the
government needs to: reduce fuel and credit4.12 As Indonesia constructs a poverty subsidies that go largely to the non-poor;strategy, the World Bank is preparing a reporl?`1 reallocate the savings to expenditure programsaimed at providing factual analysis, presenting that are pro-poor; design regional transfersthemes and areas of action that are important, and that are sensitive to the needs and capacity ofpointing to a process for making further decisions. the poorest regions; and ensure the pattern ofThe report highlights two areas of action: spending across and within sectors at all levels
of government benefits the poor, recognizing4.13 The policy environment. For the most part, that program design is more important than thefamilies and individuals will escape poverty and level of resources allocated.reduce their vulnerability through their ownefforts. The government's economic policies can 4.14 Effective public services that reach theeither stymie or assist these individual efforts. In poor. For long-term and sustained povertyparticular, there are three elements of a policy reduction, the government will inevitably beframework: involved in community development, supporting
rural strategies for raising rural incomes (for• Resumption of rapid sustainable growth. example, through agricultural extension), health
Policies that lead to a growing economy with and education, infrastructure, and safety nets. Thisrising real wages, expanding employment, and second area of action for poverty strategy thereforelimited inflation will create an environment for includes:poverty reduction. Creating a just andcompetitive economy will need to go beyond * Improving local governance, decision making,the standard prescriptions for growth, and and implementation capacity. Next fiscal yearinclude other initiatives of special importance onward, public service delivery and regionalto Indonesia such as eliminating "policy" and development will become the responsibility ofpetty corruption, keeping open internal trade, sub-national governments. Though closer toand enabling small and medium-sized the people, these sub-national governments areenterprises to thrive. still far removed from interactions between
service providers-teachers, health workers,* Economic empowerment of the poor. For planners, policemen, local officials-and
growth to be effective in reducing poverty, the citizens. So even in a decentralized setting,poor need to be able to have equitable access improving public service delivery will requireto, and fair returns for, their assets and that basic ingredients of good governanceproducts. Policies governing markets for information, voice, and accountability be builtlabor, capital (finance, savings), land, and into policy choices, budget processes, andnatural resources will help. This is not an program design.agenda for redistributing assets; rather it meanspolicies that actively work for the poor: such * Basic health and education. The crisis broughtas enforcing protective legislation for labor, into sharp relief the achievements andincluding prevention of abusive child labor problems in existing policy packages. It alsopractices; allowing labor unions to bargain highlighted the need for reforms in educationcollectively on an equal basis so that the and health to assist the poor (and theinterests of workers can be balanced against population overall). Social safety net
34

programs introduced complaint resolution and from the poor. In this context, the experiencecommunity involvement approaches that with formal sector social insurance inshould be retained. Future programs will need developing countries has not been promisingto improve capacity - raise the quality of civil but, as Indonesia develops, the evolution ofservants through training, provide workers social protection schemes must eventually bemore professionally demanding tasks and addressed.adequate facilities, provide adequatecompensation for those that perform, 4.15 In each of these areas experience hasencourage service-users to give service- shown that it is not just what the government does,providers feedback, and help the poor to nor just how much the government spends, butarticulate their needs. how well these services are provided.
Basic infrastructure, mobility and access. Thepublic sector finances the provision of services Endnotesthat support the ability of the poor to make aliving. But funds are wasted when iThis chapter borrows heavily from: World Bank (September 2000).
Poverty Reduction in Indonesia: Constructing a New Strategy (draft).infrastructure, or other investments to improve ii World Bank 2000. Attacking Poverty: World Development Reportmobility and access, are not what people want, 2000/2001 (New York: Oxford University Press).
or poor materials and shoddy workmanship are World Bank (September 2000), ibid.
used, or if the intended beneficiaries areincapable of maintaining services provided.Indeed, top-down approaches have often led tothese outcomes. To turn around the situationwill require greater community involvementfrom planning to implementation, betterincentives for maintenance, and strongersupport for user groups.
* Safety nets for the poorest and coping withshocks. Even with all of the above, there willbe individuals, groups, and regions, that cannotcope and need assistance. These types ofdirectly targeted transfer programs (like thecrisis SSN programs) are not the dominantpart, but are an important component of anoverall poverty strategy. There are four majorissues with safety nets. First, it is now time toend the "crisis" programs and refocus on safetynets that can be sustained while mainstreamingpoverty concerns through longer-term sectoralagendas. Second, the ultra poor will still needto be reached with special long-term programsaimed at the basics: food and nutrition, healthcare, and shelter through community leveltargeting and expanded participation of non-government organizations in program delivery.Third, programs will be needed to help thosewho fall on hardship but who can recover andspring back. Finally, pressure from anincreasingly vocal and affluent urban middleclass for "social protection" must be resisted orit could draw attention and resources away
35
Chapter 5. Governing Indonesia
5.1. Governance appears to have received only media is exercising its new freedom,scant attention by the new Government, and subjecting the political process to closeseveral scandals and disputed personnel decisions scrutiny.have shed doubt on the Government's eamestnessto deliver on the anti-KKN agenda that put it in * Civil society is broadening and deepening,office. Although some initiatives have advanced, a with a rapid proliferation of non-governmentlack of coordination and haphazard follow-through organizations, which are spreading thehas yielded the impression that no progress has democratic web, and making themselves heardbeen made at all. The Government must change on issues such as human rights, corruption, andthis perception, committing to an explicit strategy the role of the military.of improving governance, and following throughwith concrete actions. * Forthcoming regional autonomy is making
local governments increasingly active, andThe political transition local legislatures are starting to control their
executive branches.5.2. Indonesia's transition from the personaland authoritarian rule of the New Order regime to 5.3. These changes are not easily received,a rules-based democratic society continues its however, and there have been setbacks. Theturbulent path forward. Such a transition is military's political role was extended until at leastinherently chaotic because the country requires a the end of the decade, and a constitutionaldramatic transformation of various institutions. amendment reduced the chances of its prosecutionThe scope of the changes involved equals those for past wrongdoings. Resistance from parts of thefaced by Eastern European and former Soviet armed forces and the police is compounding theUnion states. Its unruliness is in stark contrast to Government's difficulties in curbing the communalthe order of the Soeharto regime, but this is the violence in Maluku and militia activities in Westcost of building democracy, and the Indonesian Timor. Long-repressed secessionist movementspeople and the international community alike must are becoming increasingly active in Aceh and Irianbe patient. Some progress has been made: Jaya. Deterioration in law and order is also a
consequence of the vacuum created by reducinge The supremacy of civilian authority over the the role of the military before civilian law
armed forces is being increasingly asserted: the enforcement has obtained a firm hold." Self-role of the military in political life has policing has yet to accompany the new-founddeclined; the Minister of Defense is now a freedom of the press, and there are no penalties forcivilian; military personnel in civilian positions poor or distorted reporting. And the entrenchedhave resigned their commissions or returned to bureaucracy and judiciary systems stymie casesactive duty; and the police has been separated involving corruption and human rights abuses.from the armed forces.
5.4. As noted in the last CGI brief,iii the sheer* The power of the executive branch has been magnitude of reforms required makes the
curbed by a more assertive legislature. The governance agenda daunting. But fulfilling thisPresident is now truly held accountable, as agenda is essential for a Govemment brought intowitnessed at the lively annual session of the office on an anti-KKN platform. Moreover, betterconsultative assembly in August 2000. The governance pays off in terms of higher growthrole of the Presidency itself is also evolving. (Figure 5.1). In this chapter, we focus on the
efforts to improve governance, particularly in the* Operating without the over-powering influence legal and judicial system and the civil service, and
of the abolished information ministry, the review the progress of the anti-corruption agenda.
36
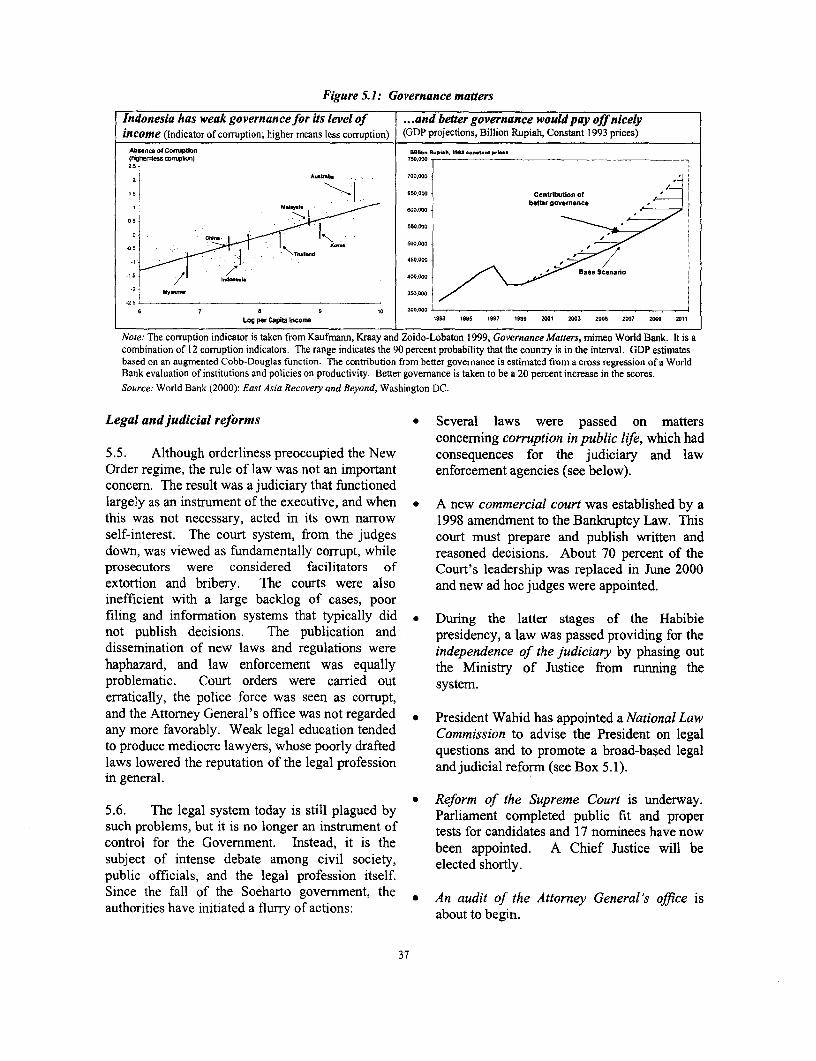
Figure 5.1: Governance matters
Indonesia has weak governance for its level of ...and beiter governance would pay off nicelyincome (Indicator of corruption; higher means less corruption) (GDP projections, Billion Rupiah, Constant 1993 prices)
Absence of CoruptIon BI5n. Rupish. 1595 .on..n... pl.a.(oher--Iess corrupbon) 750,000
20 CNn.al 1 . .:. 70,00.000
8 < | 7i lsnd ~~~~~~~~ ~~~~4COCCC Bae Scnario
Ms.nOb 350,000
.25
6 T 8l 9 10 300.000
Log per Capita Incoms 1693 1680 1557 19S9 2001 0003 2005 2007 2006 2011
Note: The corruption indicator is taken from Kaufmann, Kraay and Zoido-Lobaton 1999, Governance Mauers, mimeo World Bank. It is acombination of 12 corruption indicators. The range indicates the 90 percent probability that the country is in the interval. GDP estimatesbased on an augmented Cobb-Douglas function. The contribution from better governance is estimated from a cross regression of a WorldBank evaluation of institutions and policies on productivity. Better govemnance is taken to be a 20 percent increase in the scores.Source. World Bank (2000): East Asia Recovery and Beyond, Washington DC.
Legal and judicial reforms * Several laws were passed on mattersconcerning corruption in public life, which had
5.5. Although orderliness preoccupied the New consequences for the judiciary and lawOrder regime, the rule of law was not an important enforcement agencies (see below).concern. The result was a judiciary that functionedlargely as an instrument of the executive, and when * A new commercial court was established by athis was not necessary, acted in its own narrow 1998 amendment to the Bankruptcy Law. Thisself-interest. The court system, from the judges court must prepare and publish written anddown, was viewed as fundamentally corrupt, while reasoned decisions. About 70 percent of theprosecutors were considered facilitators of Court's leadership was replaced in June 2000extortion and bribery. The courts were also and new ad hoc judges were appointed.inefficient with a large backlog of cases, poorfiling and information systems that typically did * During the latter stages of the Habibienot publish decisions. The publication and presidency, a law was passed providing for thedissemination of new laws and regulations were independence of the judiciary by phasing outhaphazard, and law enforcement was equally the Ministry of Justice from running theproblematic. Court orders were carried out system.erratically, the police force was seen as corrupt,and the Attorney General 's of fice was not regarded . President Wahid has appointed a National Lawany more favorably. Weak legal education tended Commission to advise the President on legalto produce mediocre lawyers, whose poorly drafted questions and to promote a broad-based legallaws lowered the reputation of the legal profession and judicial reform (see Box 5.1).in general.
*Reform of the Supreme Court is underway.5.6. The legal system today is still plagued by Parliament completed public fit and propersuch problems, but it is no longer an instrument of tests for candidates and 17 nominees have nowcontrol for the Government. Instead, it is the been appointed. A Chief Justice will besubject of intense debate among civil society, elected shortly.public officials, and the legal profession itself.Since the fall of the Soeharto government, the . An audit of the Attorney General's office isauthorities have initiated a flurry of actions: about to begin.
37

Box 5.1: The National Law Commission
The National Law Commission has established six sub-commissions to set national priorities in the following areas:
. Administration of justice focusing on tackling the problem of corruption in the judiciary.
. An integrated criminal justice system focusing on restoring cooperative relationships between the courts, theprosecution system and the police and, in particular, between the Supreme Court, the Attomey General and the NationalPolice, as well as further defining the role of the National Police.
. The role of the legislatures, both national and provincial, focusing on the development of capabilities for research andlegal drafting.
* A disciplinary system for the private legal profession focusing on the implementation and policing of a standard code ofethics and entry requirements into the profession, and ongoing legal education.
. The role of law in economic recovery focusing on the role of the Commercial Courts and other legal institutions in debtrestructuring.
. Good govemance and administrative law focusing on the role of law-enforcement bureaus in government departmentsand the reform of administrative procedures in public services.
0Each sub-commission will supervise a number of working groups comprising the Government, NGOs and legal
professions. The Commission is conducting public hearings on each of the six areas, and national priorities are to be ratifiedby the Govemment by the end of 2000.
5.7. These important initiatives are both court system to settle disputes and protect theirwelcome and necessary, but considerable mistrust rights. However, a country aspiring to become aof the legal and judicial system persists, fed fully-fledged democracy needs a credible judicialregularly by erratic court decisions. At the heart of system so that its citizens respect the rule of law.this mistrust is the failure to indict - until And a country that is already integrated heavilyrecently- any judge suspected of bribery, and the into the global economy needs a legal system thatslow progress of the Soeharto trial and his meets international standards, attracts foreignsubsequent acquittal. investors, and is capable of handling bank and
enterprise restructuring efficiently.5.8. Inadequate progress in addressing theproblems with the courts, the Attorney General's 5.10. Indonesia must adopt a comprehensiveoffice, and the police has led to ineffective law time-bound program of legal and judicial reforms.enforcement. A Joint Investigating Team aimed at The Law Reform Commission's work provides aimproving coordination between the investigative good basis for moving forward, but it is notand prosecutable arms of the Government, empowered to implement its recommendations asfocusing initially on corruption in the judiciary, has an advisory body. Strong leadership from thenow been in existence for six months but has had highest level and better coordination among thelimited success so far.'v Corruption in the Attorney key players under the direction of the CoordinatingGeneral's office and the police is compounded by a Minister for Political and Social Affairs are cruciallack of capacity to effect successful prosecutions. for making headway with the Commission'sPoor coordination among the various arms of the agenda and translating it into a plan of action forlegal and judicial systems - the Ministry of reform.Justice, the Attorney General's office, the judiciaryand the police - has thwarted efforts by the Prioritiesfor civil service reformNational Law Commission to push the reformagenda. And the independence of the judiciary has 5.11. The rhetoric of civil service reform hashad the unfortunate effect of giving judges with the been on Indonesia's development agenda for years.least interest in judicial reforns a large say in But in the past, high growth and a dramaticthem. reduction in poverty masked the problems of the
inefficient and unaccountable civil service. There5.9. After 30 years without an effective legal was consequently little incentive to reform the waysystem, the Indonesian people rely on informal the Govemrnent worked. That has all changednetworks and personal connections rather than the since the crisis, which exposed weaknesses in the
38

civil service and the social costs of mediocre or well thought through retrenchment policy thatcorrupt governance. While the civil service had would be implemented in the wake ofeffectively delivered top-down services to the decentralization, and to get a clear idea of thepublic, the crisis revealed it had failed to deliver number of public employees through a betterthe services needed to support a rapidly globalizing information system on public employment.middle-income economy. Democratic reformshave made the top-down, control-orientated 5.15. The logistics of civil serviceapproach no longer acceptable, and have increased decentralization are highly complicated. Up to 2.7the demands for transparency, accountability and million civil servants will have to changeperformance. Finally, fiscal constraints have affiliation, about 700,000 will have to work inforced higher levels of cost-effectiveness. different organizations, and an unknown number
will have to relocate. Ensuring this happens with a5.12. The new Civil Service Law 43/99 reflects minimum disruption to service delivery is difficultthis change. The law emphasizes the goal of at the best of times.vi And it is risky to combine itcreating a civil service that is law-abiding, with simultaneous fiscal decentralization, becausecivilized and democratic. The civil service is to be there is a danger that certain civil servants will nota servant of the people, providing just and get paid. Time is running out. However, it is stillequitable services, free from the practices of possible for the Government to agree with regionalcorruption, collusion and nepotism.' Whether govemments on various principles forthese objectives will be met will depend on how decentralization. These should include thethe civil service is reformed in response to the law. acceptance by the regions of existing civil servantsThe Government has committed to such reforms in in exchange for guaranteed funding for at least thethe latest LOI, and should have a strategy ready by first couple of years. And the Government shouldthe end of the year. Moreover, decentralization allocate the budget to make it work (Chapter 3).will fundamentally change the nature of the civilservice. The Government must therefore define 5.16. In time, the Government must consider thewhat kind of civil service it needs in a extent of centralization in its civil service. Mostdecentralized administrative environment. decentralized countries do not run a single, unified
civil service, but some countries consider it a tool5.13. How large should the civil service be? for nation building and for delivering a minimumGovernment data shows there are four million civil standard of service across the country. Theservants on the payroll, plus 650,000 members of Government has already concluded that a centrallythe armed services - not particularly numerous by managed civil service would conflict withinternational standards, but this number is larger decentralization, but it could still maintain somethan the more populous countries in the region unity through common training and shared(Table 5.1). Moreover, there is considerable standards for particular posts. It could evenevidence that many full- or part-time workers, continue - on a voluntary basis - to makefunded from the development budget at the central civil servants available for regional duties.regional level, do not show up on the Maintaining common salary levels andGovernment's books. There is also allegedly a employment conditions throughout the country islarge number of workers associated with the likely to be counter-productive, because it wouldmilitary or the education sector, who are not listed negate potential cost savings resulting fromin government records. varying wage levels across the regions. Moreover,
it would result in unfunded mandates in the regions5.14. Decentralization is likely to create if the capital decided on a wage increase.significant staffing redundancies, becausefunctions now carried out centrally will overlap 5.17. Is the civil service really underpaid? Thewith those working in local and regional size and structure of public-sector employment isgovernments. Certain local governments are closely related to the question of civil servicehesitant to absorb staff from the capital, and some salaries. The prevailing view, held by manycentrally located staff do not want to move out of including the World Bank, has contended thatJakarta. This suggests the urgent need to develop a Indonesia's civil service is poorly paid, especially
39

Table 5.1: Public sector employment comparatives forlndonesia per capita
Ref. year Central Subnational(government Per capita Population government government Education Health Police Generalemployment GDP 1998 1998 (percent of (percent of (percent of (percent of (percent of civilian
Country figures) (US$) (million) population) population) population) population) population) government
India 1998 439 979,673 0.3 0.6 0.3 0.1 0.1 1.3Indonesia 1999 462 203.678 0.8 0.2 0.9 0.1 0.1 2.0Pakistan 1997 482 131,582 0.5 0.3 0.7 0.1 0.2 1.8China 1997 774 1,238,599 0.8 0.8 0.1 1.7
Source: World Bank (2000) Priorities for civil service reforms, processed, Washington DC, September.
at higher levels, compared to the private sector. A differentials are likely to have been eliminatedrecent World Bank studyvil suggests that since then, due to the large pay increases in theinappropriate methodologies may have led to this public sector, especially when wages for mostconclusion: the relative wage differentials between Indonesians were only improving slowly after thegovemment and private employment have been crisis. Moreover, official govemment wages dobased on comparative surveys of limited pay (also not reflect the substantial opportunities civilcited in our last report to the CGI). These surveys servants sometimes appear to enjoy - both legalof the highest paying enterprises in Indonesia paint and illegal - which provide additional income toa biased picture of overall market opportunities for their salaries.ixwork and, therefore, cannot be used for calculatingthe true opportunity cost of government workers. 5.19. This suggests that any further wage
increases should wait until a more systemic study5.18. The Sakemas workforce survey suggests has been carried out. Moreover, the reassignmentthat even in 1998, prior to the large government of a large number of staff and functions associatedpay increases of the last two years, the average with decentralization will make it necessary to re-government worker eamed more than his or her evaluate jobs, which in tum will requirecounterpart in the private sector, with slight adjustments to wages. In the meantime, theshortfalls in the upper level.v"ii Even modest Govemment needs to develop:
Box 5.2: Forestry - governance issues in a microcosm
Illegal logging is flourishing in Indonesia's forests. With an estimated annual volume of 30 cubic meters of roundwood,it is a bigger business than legal logging. The combined logging volume is three times the sustainable yield of the naturalforests. The immediate impact is at least US$650 million losses a year in royalty and Reforestation Fund payments. Illegallogging contributes to deforestation, for which the Ministry of Agriculture and Forestry now calculates the average rate to be1.8 million hectares a year. It degrades forest quality: the Ministry now defines the area of productive forest as 46.7 millionhectares (62 million was reported in pre-1999 statistics), and considers 14.2 million of that amount is damaged or cleared.The volume of logs harvested from timber concessions has shown a steady decline since 1994. lUCN's latest "Red Book"ranks Indonesia as the country with the greatest number of threatened mammal and bird species - testimony to the amazingbiodiversity and the rate at which it is being lost. In the protection and conservation of forests, 20 percent of the 29.8 millionhectares is deforested.
Good govemance is fundamental to any solution, because illegal logging is rooted in governance failure:
* Wood-processing industries have expanded beyond the limits of sustainable log supply, abetted by favorable regulationsthat insulated them from market forces. The gap between log supply and demand is 37 million cubic meters. Strongdemand for illegal timber is one result.
* Past government policies and procedures for forest use have alienated forest communities. The resulting discontent andpoverty within such communities ensure there is a supply of labor for illegal logging.
* Illegal logging is big business: it attracts investors with ample capital, and the means and influence to protect themselvesfrom prosecution.
* Public officials are involved not only as protectors but also patrons and investors. Of 23 unlicensed sawmills locatednear Bukit Tigapuluh National Park, at least 18 had the backing of officials: 12 were backed by the army, three by theprovincial Forestry Department, two by the Kabupaten Department of Public Works, one by the police. A large sawmillthat buys wood from Tanjung Puting National Park belongs to a member of the MPR.
40

* A capable and institutional infrastructure for * A law (Law 28/1999) that requires state
an ongoing wage policy formulated through a officials to report their assets on a regular basispay determination unit or commission. to a new independent body (The Committee
for the Audit of Assets of State Officials).
* A systematic methodology for determiningappropriate salary standards for civil servants * A Steering Committee to oversee the
that rewards merits and performance, and takes establishment of an Independent Anti-into account market alternatives, competition Corruption Agency, which must come intofor government positions, the turnover in the effect by August 2001, as required under Law
civil service, and the value of relative jobs. 31/1999.
* A consolidated budget classification system for * A Joint Team for the Eradication of Criminalcivil service wages to ensure a single Acts of Corruption, also known as the Jointtransparent source of funds for civil service Investigating Team, which was establishedremuneration. pursuant to the Anti-Corruption Law intended
to serve both as an investigating and
* An awareness among civil servants that parity prosecuting agency, and as a testing ground for
between private- and public-sector the Independent Anti-Corruption Agency. Inremuneration is the exception rather than the August 2000, it questioned three sitting judgesrule in developing and industrial countries. of the Supreme Court.
Perhaps most importantly, wage increases must * A National Ombudsman Commission focusingwait for credible actions against corruption. on corruption in the judiciary has beenWithout them, informal and illegal levies can established to handle claims from the generalcontinue unabated, and wage increases are likely to public.stir public resentment against the civil service.
- Fit and proper tests, which have been appliedThe war against corruption to a selection of heads of state-owned
enterprises, banks and the Supreme Court by5.20. Much of the justification for the recent the Ministry of State Enterprises, Banklarge salary increases for the courts and the civil Indonesia and Parliament.service has been the assumption that corruption ismotivated by poor compensation. This assumption 5.22. All these initiatives have been largely adis not supported by experience in advanced hoc and often overlap. They have also falteredcountries. Corruption is often a response to an because of inadequate or no funding. To addressopportunity rather than to low pay, and it is likely these issues, the Attorney General has taken theto thrive if the risk of getting caught and initiative to ask the Governance Partnership to helppunishment is minimal. Pay increases do little to initiate a national dialogue on an anti-corruptionchange that equation, and are only one factor in the strategy. Although this process is now under way,overall policy package needed to improve civil its success depends on strong leadership andservice ethics. responsibility from the Government for a set of key
actions. These actions would bear results over the5.21. The Government has moved on a wide medium to long term, as well as scoring a fewfront to attack corruption, going far beyond the strategic "quick wins" to build political support forcivil service. These measures include: the agenda. Priorities include reducing the
opportunities for corruption, strengthening* A new anti-corruption law (Law 31/1999), accountability in the public sector through better
which significantly increases the penalties for government procurement, and financialcorruption and eases the burden of proof to be management and audit.met by the prosecution.
41

5.23. Reducing opportunities for corruption. prone to misuse and reduces the value of publicThere are several ways in which the opportunities funds. A multiplicity of legal instrumentsfor corruption can be reduced. establishes confusing and overlapping
jurisdictions, and there is no single agency that* Reducing the role of the state. The financial formulates and monitors compliance with the
crisis has inadvertently made the Government procurement policy. Weak compliance with rulesa substantial owner of industrial and financial and procedures, a lack of follow-up of complaints,assets in addition to the sizable public and poor management and capability combinedenterprises sector. Rapid progress in with competition-reducing rules make richprivatization - through a transparent and breeding grounds for corruption. Agenda forcompetitive process -and bank and financial reforms in this area would include:restructuring will remove the temptation theseassets present for corrupt government officials. * Enacting a public procurement law,
embodying the basic principles and policies to* Subjecting policy-making to more ensure a market-driven system that is
transparency. Corruption, particularly in the conducive to competition.late Soeharto period, often took the form ofpolicy decisions aimed at assisting a particular * Establishing a robust and credible complaintsgroup or groups in exchange for bribes. To review and sanctions mechanism.reduce the opportunity for this type ofcorruption, all major policy decisions with . Creating an independent public procurementfinancial implications must be subjected to (i) office to formulate policies and monitora cabinet review; (ii) a parliamentary review; compliance.and (iii) a public hearings process, which couldbe passed through Parliament and directly by * Enhancing transparency and competition bythe executive. While decisions will be made the wide dissemination of public procurementmore slowly under this procedure, they would opportunities and by removing competitionbe owned and supported by all participants, limits on the grounds of size and origin.and thus are likely to be more sustainable.
i Improving procedures and practices for* The systematic review of all regulations and selecting tender committees and project
controls to reduce the intrusiveness of the state managers, for certifying contractors andand eliminate excessive discretionary powers consultants, for standard bidding and contractof officials. These range from simple matters, documentation, and for disclosing evaluationsuch as extending the validity of official criteria.documents such as passports, driving licensesand national identity cards, to complicated * Building professional capacity throughissues such as land titles. The latter are an training and the creation of a cadre ofexample of an increasing source of lawlessness procurement practitioners.and abuse of those in a weak position.
* Strengthening enforcement through better5.24. Repairing the broken accountability internal controls, clear standards of ethics,mechanisms. Urgent action is needed to address the random ex-post and independent procurementcore accountability mechanisms of Indonesia's audits, annual corruption surveys ofpublic sector, which are in a serious state of contractors, suppliers, and consultants, and bydisrepair after years of ongoing abuse. Recent and working effectively with civil societyforthcoming World Bank reports on procurement, watchdogs.financial accountability and public expendituremanagement' provide clear agendas for change. 5.26. Financial Accountability. Indonesia's
control environment is weak. The budget process5.25. Procurement. The public procurement is inadequate, reflecting the lack of an integratedsystem is dysfunctional. Not market driven, it is
42

macro-framework, the absence of a unified responsibilities for the internal and externalframework for budgeting, the existence of audit functions.considerable off-budget funds, and the lack ofinterest in spending results. Budget execution and Managing the governance agendamonitoring remain weak, with considerable fundswasted due to corruption, collusion and nepotism. 5.28. Progress on governance has beenVarious unreconciled budget reports and annual handicapped by the lack of a clear focal point infinancial reports to Parliament are two years the Government, which sees itself as responsiblebehind schedule, disabling oversight from for these agenda. The agenda have been leftParliament. Accounting and financial management largely to a few key reformers, who have beensystems are fragmented and centralized payment moving forward in their respective spheres,controls are weak, as is internal monitoring at the garnering whatever political support they canlevel of spending ministry agency. Cash- muster from senior leaders. These initiativesmanagement functions are not well coordinated appear ad hoc and are floundering under resistanceacross the 27,000 plus official bank accounts - from well-entrenched vested interests. Inadequatenot counting unauthorized bank accounts where funding in the budget for some of the newoff-budget funds are kept. The independence of institutions is a measure of the lack of commitmentthe Auditor General is not assured, and his staff is and leadership in this area. With a new Cabinet,weak, whereas the various internal auditors which has much stronger coordinationconstitute a source of costly duplication, and mechanisms, this problem could and should besometimes abuse. addressed quickly. A top priority is the need for
the Government to articulate a clear statement of5.27. To overcome this state of affairs, actions vision and a strategy - of where it wants to go inare needed on several fronts: this area and how it wants to get there.?l
* Strengthening the control environment by 5.29. The Government must develop broadadopting a modern Budget Law; establishing a national ownership around the implementation of aParliamentary Public Accounts and Audit governance strategy, while exposing such aCommittee; and developing a professional civil strategy to international standards to benefit fromservice with a professional accounting and the positive and negative experiences of otherauditing stream. countries. Such a process would help to bring a
shared understanding among all the stakeholders of* Improving budget preparation and the complexity of the reform effort in this area and
management by adopting a unified budget its intrinsically long term nature, and enablebased on the IMF's GFS classification; coalescence around some "quick wins" that help toenhancing the political input into budget manage public expectations. The Governancepreparation; and moving to a performance- partnership - initiated at the January 2000 CGI -oriented budget. can be, and is, a vehicle for such a dialogue, with
broad support in the Government, civil society and* Strengthening financial management by the donor community.
consolidating responsibilities in an AccountantGeneral in the MOF; establishing a financial 5.30. A government endowed with bettercontroller in each spending unit; and capabilities and skills than Indonesia's governmentimproving treasury management through has at its disposal today would find the governanceclearly defined policies for the management of agenda forbiddingly large. Success will thereforebank accounts and cash. depend on strong leadership to steer a strategic
course and move decisively on the issues that* Strengthening the audit function by revising matter most, while laying the foundations for more
the current draft law; effecting the compulsory progress in other areas. Indonesia's governmentreport of an independent auditor general to a has little option but to try, and for its partners inwell-functioning parliamentary public accounts civil society, private sector and the donorcommittee; and clarifying the relative
43

community, there is little altemative but to try tohelp. The stakes are very high.
Endnotes
' For a useful account, see the report of a conference held in Tokyoentitled Transition Indonesia - Political Reform A Major Work InProgress, East Asian Institute, Columbia University, New York, April2000.i The deterioration manifests itself in incidents such as violenceaccompanying neighborhood crimes, land-grabbing, and industrialunrest.
See the chapter entitled Improving Governance in Indonesia, Seizingthe Opportunity, World Bank Office Jakarta, January 26, 2000.i The latest disappointment was a court-ordered halt to aninvestigation of the Joint Team into possible corruption of two judges.v The law ended the practice under the New Order regime thatrequired civil servants to be members of GOLKAR and KORPRI, acivil service organization founded by the New Order regime. Civilservants now cannot be members of any political party under penaltyof dismissal.n In 1994, South Africa went through a similar exercise when itcreated its seven provinces. However, it did so with a much smallercivil service, it already had an autonomous municipal level, and itwent through fiscal decentralization only three years later. Thus thecentet could target the money better.v' "Indonesia, Priorities for Civil Service Reform", The World Bank,East Asia and Pacific Region, Poverty Reduction and EconomicManagement Sector Unit, draft: mimeo August 26, 2000.
The survey reveals a pattern common to most countries, includingadvanced countries: lesser skilled govemment workers eam apremium over their private sector equivalents, while higher skilledworkers eam slightly less, with the average premium for those with auniversity degree at about 20%.i These include special fees and after-hours practice eamings ofmedical specialists, fees and bonuses associated with projects, etc.Illegal activities include surcharges on government-provided goodsand services, kickbacks on govemment purchases, per diem on travelnever undertaken, and payments made to evade taxes or import duties.
References to CPAR, CFAA, and the PER.The Partnership for Govemance Reform in Indonesia under the
sponsorship of the United Nations Development Program, the WorldBank and the Asian Development Bank provides a useful vehicle toadvance the govemance agenda. The Partnership brings together theGovemment, civil society, the media and Indonesia's intemationalpartners. A Govemance Fund can finance promising and innovativeinitiadves from the Govemment and civil society to promote goodgovemance. A Goveming Board consisting primarily of prominentIndonesians from all walks of life, together with the three sponsoringintemational organizations and six donor representatives leads thePartnership. Its activities will be formally launched a few days beforethe CGI.
44

Statistical Annex
STATISTICAL ANNEX a
List of Tables
Social Indicators
1. Selected Social Indicators 1990-19992. Key Social Indicators3. Poverty Line and Number of Population Below the Poverty Line4. Population and Growth Rates by Province, 1980-19995. Distribution of Population by Age Group and Sex, 1961-19996. Labor Force Participation by Province (%), 1980-19997. Employment by Main Industry, 1990-1999
National Income Accounts
8. Gross Domestic Product by Industrial Origin at Current Market Prices, 1990-20009. Gross Domestic Product by Industrial Origin at Constant Market Prices, 1990-200010. Gross Domestic Product by Expenditure Category at Current Market Prices, 1990-200011. Gross Domestic Product by Expenditure Category at Constant Market Prices, 1990-2000
International Trade & Balance of Payments
12. Balance of Payments, 1994-200013. Selected Non-oil Exports, 1990-200014. Value of Exports by Principal Country of Destination, 1990-200015. Value of Imports by Principal Country of Origin, 1990-2000
External Debt
16. External Public Debt Outstanding of December 31, 199817. Services Payments, Commitments, Disbursements and Outstanding Amounts of Total
External Debt, 1980- 201318. External Debt Outstanding December 1997 - March 2000
Public Finance
19. Central Govermnent Budget Summary, 1994/95-200020. Central Govermment Revenues, 1994/95-200021. Central Govermnent Expenditures, 1994/95-2000
a With the exception of the tables on Extemal Debt, the Statistical Annex is a compilation of official datafrom Govermnent sources. In some instances, these data may differ from data in the miain text due todifferent Bank definitions and methodologies in constructing the statistical series.
45

Sttistical Annex
Monetary Statistics
22. Money Supply (MI), 1991-200023. Changes in Factors Affecting Money Supply, 1990-200024. Consolidated Balance Sheet of the Monetary System, 1990-200025. Banking System Credits by Economic Sector, 1990-200026. Banking Credits Outstanding in Rupiah and Foreign Exchange by Group of Banks, 1990-200027. Commercial Banks' Outstanding Investment Credits in Rupiah and Foreign Exchange by
Economic Sector, 1990-200028. Conmmercial Banks' Outstanding Funds in Rupiah and Foreign Exchange by Group of Banks,
1990-200029. Interest Rates 1990-2000
Agricultural Statistics
30. Principal Agricultural Products by Subsectors, 1990-200031. Production of Major Crops by Type of Estate, 1990-200032. Rice-Area Harvested, Production and Yield, 1990-2000
Industrial Statistics
33. Production of Minerals, 1990-200034. Fuel Production by Company, 1990-1999
Prices
35. Domestic Sales of Petroleum Products, 1990-199936. Indonesia Wholesale Price Index, 1990-200037. Consumer Price Index, 1990-200038. Domestic Prices of Petroleum Products, 1986-2000
Investment Statistics
39. Approved Foreign Investrnent by Sector, 1990-200040. Approved Domestic Investment by Sector, 1990-2000
46

Table 1. Selected Social Indicators 1990 -1999
1990 1993 1996 1999
DemoeraphvPopulation (million) 179.5 189.1 198.3 206.5Population ages 0 - 14 yr old (%) 36.5 34.9 32.0 30.0Population ages 15 - 64 yr old (%) 59.6 61.3 63.8 65.3Population ages 65+ yr old (%) 3.9 3.8 4.2 4.7Population growth rate (%) 2.0 1.7 1.6 1.6Population density (per Km2) 94 99 103 107Urban population, % urban to total 30.9 34.0 37.1 39.4Gender ratio, male to 100females 99.5 99.5 99.1 99.1Dependency ratio (%) 67.8 63.4 57.0 53.1
EducationElementary school net enrollment ratio, % of relevant aged group 83.2 91.5 94.8 92.7Junior high school net enrollment ratio, % of relevant aged group 40.5 48.6 59.2Senior high school net enrollment ratio, % of relevant aged group 38.5Population > 10 yr old not completed primary school (%) 37.5 41.8 28.3 25.4Population > 10 yr old finished primary and Junior high school (%) 48.8 46.3 45.0 47.0Population > 10 yr old finished high school and college (%) 13.7 11.9 14.9 17.6Adult literacy rate 81.5 83.3 85.3 88.4
HealthLife expectancy tate 62.5 62.7 63.2 65.5Fertility rate, births per woman 3.1 2.9 2.8 2.6Infant mortality rate, per 1000 live births 63.5 58.1 56.0 46.0Mortality rate of children < 5 yr old, per 1000 86.4 78.1 70.4 59.6Children < 5 yr old that have good nutrition (%) 54.2 55.5 63.9 69.7Children < 5 yr old that had been immunized (%) 69.3 76.3 88.2 89.9Number of medical doctor per 100,000 population 10.4 10.7 11.0
Housine and SanitationHousehold with access to piped water (%) 12.9 14.7 16.7 18.6Household with access to own septic tank (%) 17.9 22.0 26.1 30.4Household with electricity (%) 46.8 55.3 72.2 83.7
Labor forceEmployed (%) 55.9 55.1 55.5 62.9Looking for work (%) 1.44 1.56 2.85 4.27Labor force participation (%) 57.3 58.0 58.3 67.2Open unemployment rate (%) 3.2 4.3 4.9 6.4Working children in 10-14 year old group (%) 9.5 10.8 7.9 6.9
Poverty and inequalityNumber of people under poverty line (million) 27.2 25.9 22.5 48.4 /aPopulation under poverty line (%) 15.1 13.7 11.3 23.5 /aExpenditure share of the lowest 40%, (%) 21.3 14.6 20.2 21.3Expenditure share of the middle 40%, (%) 36.8 41.6 35.0 37.0Expenditure share of the highest 20%, (%) 41.9 43.9 44.7 41.6Gini Coefficient 0.32 0.34 0.36 0.32
Data are not available/a Using Susenas 1998 definition of the poverty line (the "new" definition).
Source: Central Bureau of Statistics.
47

Table Z Key Social indicatom
Indicator Latest Period Previous Period Indicator Latest Period Previous Period
Poverty Rate (%) Feb-99 Feb-9 Literacy Rate(%) 1999 1998- National 27.1 15.7 National 88.4 87.9- Urban 16.3 7.2 - Urban 94.0 94.8- Rural 34.1 20.5 - Rural 84.5 83.9
Inequality (Gini Coefficient) Feb-99 Feb-96 School Dropout (%) 1999 Im- National 0.32 0.36 - Primary school 1.4 1.6- Urban 0.33 0.37 - Junior high school 2.2 2.6- Rural 0.25 0.28 - Senior high school 2.6 2.9
Mortality Rate 1999 1996 Health Facilities 1998 1996- Infant Mortality Rate 46.0 56.0 - Community Health Centers:- Mortality rate of children < 5 yr old 65.5 70.4 * Total number 36,307 35,425
* Per 100,000 population 17.8 17.8Nutritional Status of Children under Five Dec-98 Feb-95 - Hospitals:-Good (l/) 61.1 63.9 * Total number 1,112 1,074-Medium(%) 21.2 23.0 'Numnberofbeds 123,168 120,038-Bad(%) 16.6 13.1 *Bedsperl00,0OOpopulation 60.3 60.5
- Medical doctor per 100,000 population 11.0 10.7School Enrollment (%) 1999 1998-7-12 years old: Labor Force Participation 1999 1998
• National 95.3 95.2 - National 67.2 66.9Urban 97.5 97.6 - Urban 61.2 59.6
• Rural 94.2 94.1 -Rural 71.6 71.9-13-15 years old:
* National 79.0 77.2 Hourly Real Wages (1"98 Rp) 1999 1998• Urban 88.0 88.6 - Agriculture 1,157 1,210* Rural 73.6 70.6 - Mining 2,910 3,483
- 16-18 years old: -Manufacturing 1,514 1,370'National 51.1 49.3 -Utilities 3,057 2,577* Urban 68.8 67.7 - Construction 1,627 1,433* Rural 38.0 36.2 - Trade 1,595 1,449
- Transportation 1,947 1,758- Finance 3,407 2,939- Services 2,522 2,033
Source: Central Bureau of Statistics.

Table 3. Poverty Line and Number of People Below the Poverty Line
Year 1976- 1996
Poverty Line Number of Percentage ofYear (Rplcapita/month) People Below the Poverty Line Population Below the Poverty Line
(million) (%)Urban Rural Urban Rural Urban+Rural Urban Rural Urban+Rural
1976 4,522 2,849 10.0 44.2 54.2 38.8 40.4 40.11978 4,969 2,981 8.3 38.9 47.2 30.8 33.4 33.31980 6,831 4,449 9.5 32.8 42.3 29.0 28.4 28.61981 9,777 5,877 9.3 31.3 40.6 28.1 26.5 26.91984 13,731 7,746 9.3 25.7 35.0 23.1 21.2 21.61987 17,381 10,294 9.7 20.3 30.0 20.1 16.1 17.41990 20,614 13,295 9.4 17.8 27.2 16.8 14.3 15.11993 27,905 18,244 8.7 17.2 25.9 13.5 13.8 13.71996 38,246 27,413 7.2 15.3 22.5 9.7 12.3 11.3
Year 1996 - 1999 /a
Poverty Line Number of Percentage ofYear (Rp/capita/month) People Below the Poverty Line Population Below the Poverty Line
(in million ) (%)Urban Rural Urban Rural Urban+Rural Urban Rural Urban+Rural
1996 42,032 31,366 9.6 24.9 34.5 13.6 19.9 17.71998 /b 96,959 72,780 17.6 31.9 49.5 21.9 25.7 24.21999 /c 92,409 74,272 15.7 32.7 48.4 19.5 26.1 23.5
/a Using Susenas 1998 definition of the poverty line (the "new" definition)./b Based on Susenas of December 1998./c Based on Susenas of February (regular) 1999.
Source: Central Bureau of Statistics.
49

Table 4. Populatlon And Growth Rates by Province. 1980-1999
Region Population (thousand person) Average grow rate (percent per year)1971/a 1980 1990 1995/b 1996/b 1997/b 1998/b 1999/b 1971-80 1980-90 1990-99
Java 76.086 91,270 107.528 114.980 116.525 118076 119,631 121.193 2.0 1.7 1.3DKI Jakarta 4,579 6,503 8,225 9,144 9,259 9,374 9,489 9,605 4.0 2.4 1.7West Java 21,624 27,454 35,380 39,340 40,082 40,828 41,578 42,332 2.7 2.6 2.0Central Java 21,877 25,373 28,519 29,691 30,027 30,364 30,703 31,044 1.7 1.2 0.9DlYogjakarta 2,489 2,751 2,915 2,917 2,951 2,984 3,018 3,052 1.1 0.6 0.5EastJava 25,517 29,189 32,490 33,889 34,207 34,525 34,842 35,160 1.5 1.1 0.9
Sumatra 20,809 28 017 36.436 4098 41,727 42468 43.209 43.948 3.4 2.7 2.1Lampung 2,777 4,625 6,006 6,680 6,782 6,882 6,982 7,081 5.8 2.6 1.8Bengkulu 519 768 1,181 1,418 1,451 1,486 1,521 1,557 4.5 4.4 3.1South Sumatra 3,441 4,630 6,278 7,239 7,363 7,486 7,610 7,734 3.4 3.1 2.3Riau 1,642 2,169 3,283 3,923 4,014 4,106 4,198 4,291 3.1 4.2 3.0Jambi 1,006 1,446 2,016 2,383 2,434 2,486 2,538 2,590 4.1 3.4 2.8West Sumatra 2,793 3,407 4,001 4,334 4,401 4,466 4,531 4,595 2.2 1.6 1.6NorthSumatra 6,622 8,361 10,254 11,144 11,348 11,552 11,754 11,955 2.6 2.1 1.7Acch 2,009 2,611 3,417 3,863 3,934 4,005 4,075 4,145 3.0 2.7 2.2
Kalimantan 5,155 6723 9111 10520 10,738 10.957 i2 11.396 3.0 3.1 25West Kalimantan 2,020 2,486 3,237 3,650 3,724 3,798 3,871 3,943 2.3 2.7 2.2Central Kalimantan 702 954 1,398 1,636 1,669 1,703 1,737 1,771 3.5 3.9 2.7South Kalimantan 1,699 2,065 2,599 2,904 2,953 3,003 3,053 3,103 2.2 2.3 2.0EastKalimantan 734 1,218 1,877 2,330 2,392 2,454 2,516 2,579 5.8 4.4 3.6
Sulawesi 8 528 10.409 12.519 13775 14.023 14.271 14.520 14,768 2.2 1.9 1.9Central Sulawesi 914 1,290 1,705 1,946 1,991 2,036 2,083 2,129 3.9 2.8 2.5North Sulawesi 1,719 2,115 2,480 2,655 2,692 2,730 2,767 2,804 2.3 1.6 1.4South Sulawesi 5,181 6,062 6,983 7,578 7,706 7,834 7,962 8,090 1.8 1.4 1.6Southeast Sulawesi 714 942 1,351 1,596 1,633 1,671 1,708 1,745 3.1 3.7 2.9
Other Islands 8 630 11.071 1365 15035 15,308 15.582 15.857 15212 2.8 2.1 1.2Bali 2,120 2,470 2,779 2,900 2,938 2,976 3,014 3,053 1.7 1.2 1.0WestNusaTenggara 2,203 2,725 3,371 3,655 3,720 3,786 3,853 3,921 2.4 2.1 1.7EastNusaTenggara 2,295 2,737 3,270 3,588 3,654 3,719 3,785 3,850 2.0 1.8 1.8Maluku 1,089 1,410 1,853 2,095 2,128 2,161 2,192 2,223 2.9 2.8 2.0IrianJaya 923 1,174 1,631 1,954 2,006 2,058 2,112 2,165 2.7 3.3 3.2
Indonesia 119,208 147.490 179,248 195.294 198,320 201,353 204.393 206,517 2.39 1.97 1.59
/a Includes adjustment for the exclusion of rural Irian Jaya./b 1997, 1980, and 1990 based on Population survey, 1995-2005 based on population projection by province.
Source: Central Bureau of Statistics.
Population density at main island (thousand person/km2) Population average growth rate (percent)
1000 1 951 3.5
goo 9~~~~~~~~~~~~~14
80018 19 99 .
690 3.0 1
5376 /,600 ~~~~~~~~~~~~~~2.5 ~'
400
20-- lian -XSlws
20:1 4 S 11 2 9 77 6691 77 1.512 3 417
1971 1980 1990 1999 1.04ED Java FJ Sumsatera 0 Kalimantan [a Sulawesi U Irian Jays 91 18 90 19
-4-Java -4- Sumatera& Kalirnasin -X- Sulawesi
-*-Irian Jaya
50

Table 5. Distribution of Population by Age Group and Gender. 1961-1999('000)
1961 1971 1980 1990 1995 a/ I999/a
Age Group Male Female Total Male Female Total Male Female Total Male Female Total Male Female Total Male Female Total
0-4 8.529 8,649 17,178 9,675 9,560 19,235 10,872 10,422 21,294 10,766 10,120 20,887 9,992 9,630 19,622 10,912 10,527 21,440
5-9 7,744 7,701 15,445 9,593 9,302 18,895 10,889 10,446 21,335 11,791 11,290 23,081 10,758 10,243 21,002 9,863 9,514 19,376
10-14 4,353 3,892 8,245 7,406 6,875 14,281 9,179 8,525 17,704 10,998 10,438 21,437 11,921 11,457 23,378 10,916 10,402 21,318
15-19 3,865 3,905 7,770 5,627 5,779 11,406 7,552 7,806 15,358 9,553 9,367 18,920 10,434 10,424 20,859 11,754 11,373 23,127
20-24 3,480 4,373 7,853 3,627 4,461 8,088 6,010 7,055 13,065 7,662 8,486 16,148 8,479 9,267 17,746 9,980 10,133 20,113
25-34 7,392 8,610 16,002 7,722 9,226 16,948 9,685 9,920 19,605 13,962 14,770 28,732 15,262 16,553 31,814 15,737 17,408 33,145
35-44 5,765 5,406 11,171 7,062 7,119 14,181 7,876 8,172 16,048 9,778 9,475 19,253 12,903 12,485 25,387 14,070 14,313 28,383
45-54 3,587 3,511 7,098 4,360 4,213 8,573 5,761 5,856 11,617 7,036 7,284 14,320 8,154 7,598 15,752 9,541 8,939 18,480
55-64 1,913 1,865 3,778 2,224 2,373 4,597 3,297 3,354 6,651 4,615 4,887 9,502 5,364 6,117 11,481 6,003 6,272 12,275
65+ 1,183 1,245 2,428 1,450 1,539 2,989 2,200 2,593 4,793 3,213 3,749 6,962 3,926 4,329 8,255 4,458 5,321 9,779
Total 47.871 49.14 97,085 58.753 60A55 119.208 73332 74.158 147,490 89.376 89.872 179.248 97,193 98.102 195.294 103.233 104.203 207,436
Percentage distribution
0-4 17.8 17.6 17.7 16.5 15.8 16.1 14.8 14.1 14.4 12.0 11.3 11.7 10.3 9.8 10.0 10.6 10.1 10.3
5-9 16.2 15.6 15.9 16.3 15.4 15.9 14.8 14.1 14.5 13.2 12.6 12.9 11.1 10.4 10.8 9.6 9.1 9.3
10-14 9.1 7.9 8.5 12.6 11.4 12.0 12.5 11.5 12.0 12.3 11.6 12.0 12.3 11.7 12.0 10.6 10.0 10.3
15-19 8.1 7.9 8.0 9.6 9.6 9.6 10.3 10.5 10.4 10.7 10.4 10.6 10.7 10.6 10.7 11.4 10.9 11.1
20-24 7.3 8.9 8.1 6.2 7.4 6.8 8.2 9.5 8.9 8.6 9.4 9.0 8.7 9.4 9.1 9.7 9.7 9.7
25-34 15.4 17.5 16.5 13.1 15.3 14.2 13.2 13.4 13.3 15.6 16.4 16.0 15.7 16.9 16.3 15.2 16.7 16.0
35-44 12.0 11.0 11.5 12.0 11.8 11.9 10.7 11.0 10.9 10.9 10.5 10.7 13.3 12.7 13.0 13.6 13.7 13.7
45-54 7.5 7.1 7.3 7.4 7.0 7.2 7.9 7.9 7.9 7.9 8.1 8.0 8.4 7.7 8.1 9.2 8.6 8.9
55-64 4.0 3.8 3.9 3.8 3.9 3.9 4.5 4.5 4.5 5.2 5.4 5.3 5.5 6.2 5.9 5.8 6.0 5.9
65+ 2.5 2.5 2.5 2.5 2.5 2.5 3.0 3.5 3.2 3.6 4.2 3.9 4.0 4.4 4.2 4.3 5.1 4.7
Total 100.0 100.0 100.0 100.0 100.0 100.0 100.0 100.0 100.0 100.0 100.0 100.0 100.0 100.0 100.0 100.0 100.0 100.0
/a End year population figures projected based on 1995 Intercensal Population Survey (SUPAS '95).
Source: Central Bureau of Statistics.

Table 6. Labor Force Participation by Province (%. 1980-1999
Region 1980 1985 1990 1995 1996 1997 1998 1999
Java 50.9 53.1 56.8 56.1 57.7 58.0 65.5 66.7DKI Jakarta 42.3 42.6 44.3 48.6 51.2 53.1 58.2 60.2WestJava 45.4 48.2 51.6 51.8 52.5 51.7 60.4 61.9Central Java 54.9 57.1 62.2 60.2 62.5 61.4 71.2 72.2DI Yogjakarta 58.9 61.1 64.9 60.6 61.3 63.0 67.7 69.6East Java 53.0 56.4 60.9 59.4 60.9 60.8 69.8 69.8
Sumatra 50.2 52.7 57.2 55.9 58.2 57.8 68.4 66.9Lampung 50.2 53.4 59.3 57.8 60.6 57.5 71.6 68.5Bengkulu 55.1 58.8 66.4 60.8 65.3 63.4 74.9 74.1South Sumatra 51.9 53.2 56.2 55.1 57.3 57.5 68.4 69.8Riau 47.1 48.5 50.3 52.6 54.5 55.1 63.7 61.5Jambi 51.2 52.2 56.2 52.5 56.9 55.0 66.8 65.9West Sumatra 46.9 50.2 54.2 54.5 55.7 56.7 66.4 64.8North Sumatra 52.5 52.5 56.9 57.2 58.3 58.5 68.4 69.0Aceh 46.9 52.8 58.3 56.9 57.0 58.5 66.7 61.7
Kalimantan 53.0 56.0 60.0 59.7 62.1 61.3 69.5 69.4West KCalimantan 57.8 58.2 61.2 61.2 61.7 61.4 69.0 69.6Central Kalimantan 57.8 57.3 63.4 60.5 65.1 64.1 69.4 70.2South Kalimantan 51.8 56.7 60.0 61.0 64.5 65.5 72.9 73.0East Kalimantan 44.7 51.8 55.3 55.9 57.0 54.4 66.8 64.9
Sulawesi 44.7 50.4 55.6 55.6 57.6 57.7 65.2 65.1Central Sulawesi 45.3 48.4 54.9 55.0 55.8 55.5 60.1 61.0North Sulawesi 49.5 53.4 58.0 59.8 61.8 62.3 70.4 70.4South Sulawesi 39.4 42.9 49.2 50.0 54.1 52.5 61.5 60.2Southeast Sulawesi 44.9 57.0 60.3 57.4 58.7 60.7 68.9 68.9
Other IslandsBali 53.6 61.1 68.4 69.0 70.1 70.8 76.8 76.4WestNusaTenggara 50.1 51.6 61.1 61.8 63.5 65.5 70.8 72.1East Nusa Tenggara 53.0 61.2 67.3 64.1 65.4 65.3 74.1 73.4Maluku 42.2 58.7 49.8 50.1 55.0 53.8 64.8 67.3Irian Jaya 48.3 59.6 62.6 65.3 63.8 66.6 75.5 76.8
Indonesia 50.2 53.0 57.3 56.6 58.3 58.0 66.9 67.2
Source: Central Bureau of Statistics.
52

Table7. _mplo ment by Main Industr 11990-1999 /a
1990 1995 1996 1997 1998 1999Main Industry million % million % Million % million % rnilioT % million °/n
Agriculture, foresty, hunting & fishery 35.5 50. 1 35.2 44,0 37.7 44.0 35.8 41.2 39.4 45.0 38.4 43.2Mining and quarrying 0.7 1.0 0.6 0.8 0.8 0.9 0.9 1.0 0.1 0.8 0.7 0.8
Manufacturing 8.2 11.6 10.1 12.6 10.8 12.6 11.2 12.9 9.9 11.3 11.5 t3.0
Electicity,gas& water 0.1 0.1 0.2 0.3 0.2 0.2 0.2 0.3 0.1 0.2 0.2 0.2
Construction 2.8 4.0 3.8 4.7 3.8 4.4 4.2 4.S 3.5 4.0 3.4 3.8
Wholesaleandretailtrade&restaurnts 10.6 15.0 13.9 t7.3 6.1 18.8 7112 19.8 16.8 19.2 17.5 19.7
Tranaportation,storage&conmmunications 2.7 3.8 3.5 4.3 3.9 4.6 4.1 4.8 4.2 4.7 4.2 4.7Finance, itisurance, real estate & business srrv. 0.5 0.7 0.7 0.8 0.7 0.8 0.7 0.8 0.6 0.7 0.6 0.7Public services 9.7 13.7 12.1 15.1 11.7 13.7 12.6 14.5 12.4 14.1 12.2 13.8Others 0.0 0.0 0.3 0.0 0.0 0.0 0.0 0.0 0.0 0.0 0.0 0.0
Total 708 1000 801 100.0 SS7 1000 870 100 7.7 100.0 88.8 100.0
/a 1990-1998 data refer to population 10years of age and above who worked during the week previous to the census, while 1999refer topopulation 15 years.
Soure: Central Bureau of Statistics,
Percentage of em,ployment distribution by main industry (%/o)
60
so
40
30
20
10
1990 1 995 1996 1997 1998 1999
ISAgriCuture Emanufacturing UTraOe & restaurants f3fublic servces tDOthers
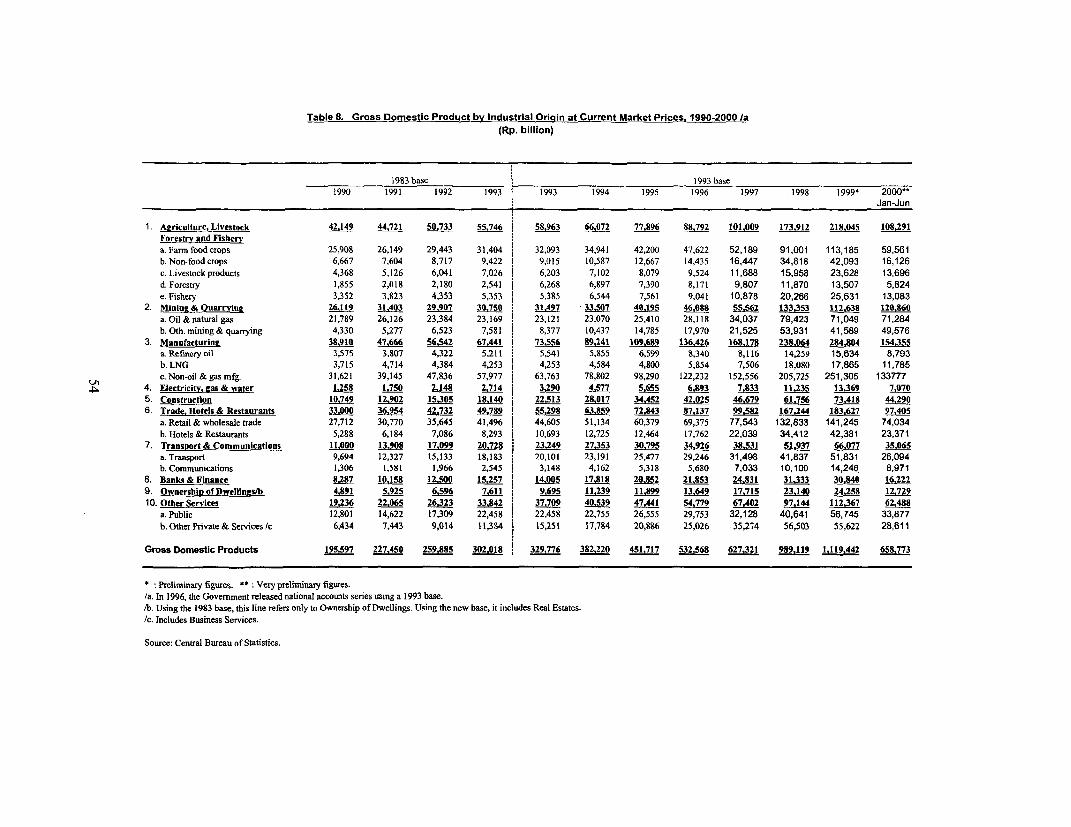
Table 8. Gross Domestic Product by Industrial Ori in at Curent Market Prices. 1990-2000 /a
(Rp. billion)
1983 base 1993 base1990 1991 1992 1993 1993 1994 1995 1996 1997 1998 1999* 2000**
Jan-Jun
1. Asriculture. Livestock 42.149 44721 50,733 55.746 58963 66.072 77.896 88_792 101,009 173,912 218,045 108,291
Forestry and Fisherya. Farm foodcrops 25,908 26,149 29,443 31,404 j 32,093 34,941 42,200 47,622 52,189 91,001 113,185 59,561
b. Non-foodcrops 6,667 7,604 8,717 9,422 9,015 10,587 12,667 14,435 16,447 34,818 42,093 16,126
c. Livestock products 4,368 5,126 6,041 7,026 1 6,203 7,102 8,079 9,524 11,688 15,958 23,628 13,696
d. Forestry 1,855 2,018 2,180 2,541 j 6,268 6,897 7,390 8,171 9,807 11,870 13,507 5,824
e. Fishery 3,352 3,823 4,353 5,353 5,385 6,544 7,561 9,041 10,878 20,266 25,631 13,083
2 Minins & Ouarrving 26,119 31A403 29.907 30.750 31,497 33.507 40,195 46,088 55.562 133353 112_638 120,860
a. Oil& natural gas 21,789 26,126 23,384 23,169 , 23,121 23,070 25,410 28,118 34,037 79,423 71,049 71,284
b. Oth. mining&quarrying 4,330 5,277 6,523 7,581 I 8,377 10,437 14,785 17,970 21,525 53,931 41,589 49,576
3. Manufacturine 38,910 47.666 56,542 67,441 1 73.56 89,241 109,689 136_426 168.178 238,064 284,804 154.355
a Refinery oil 3,575 3,807 4,322 5.211 1 5,541 5,855 6,599 8,340 8,116 14,259 15,634 8,793
b. LNG 3,715 4,714 4,384 4,253 ! 4,253 4,584 4,800 5,854 7,506 18,080 17,865 11,785
c. Non-oil & gas mfg. 31,621 39,145 47,836 57,977 63,763 78,802 98,290 122,232 152,556 205,725 251,305 133777
4. Electricity. zas & water 1258 1,750 2,148 2,714 ! 3.290 4.577 5.655 6.893 7.833 11235 13,369 7,070
5. Construction 10,749 12,go2 15,305 18,140 1 22,513 28.017 34,452 42.025 46,679 61.756 73,418 44,29
6. Trade, Hotels & Restaurants 33,000 36,954 42.732 49.789 55,298 63.859 72,843 87.137 99.582 167.244 183,627 97.405
a. Retail & wholesale trade 27,712 30,770 35,645 41,496 44,605 51,134 60,379 69,375 77,543 132,833 141,245 74,034
b. Hotels & Restaurants 5,288 6,184 7,086 8,293 10,693 12,725 12,464 17,762 22,039 34,412 42,381 23,371
7. Transport & Communications 11,000 13.908 17,099 20.728 , 23.249 27,353 30,795 3,26 38.531 51,937 66.077 35.065
a. Transport 9,694 12,327 15,133 18,1S3 20,101 23,191 25,477 29,246 31,498 41,837 51,831 26,094
b. Communications 1,306 1,581 1,966 2,545 j 3,148 4,162 5,318 5,680 7,033 10,100 14,246 8,971
8. Banks & Finance 8.287 10,158 125 15257 ! 14005 17.818 2e.852 21,853 24.831 31.333 30.840 16,222
9. OwnershiD of Dwellings/b 4,891 5,925 6.59 7,611 9.695 11,239 11.899 13,649 17.715 23.140 24.258 12.729
10. Other Services 19.236 22,065 26.323 33.842 37.709 40.539 47.441 54.779 67,402 97.144 112367 62,488
a. Public 12,801 14,622 17,309 22,458 22,458 22,755 26,555 29,753 32,128 40,641 56,745 33,877
b Other Private & Services /c 6,434 7,443 9,014 11,384 15,251 17,784 20,886 25,026 35,274 56,503 55,622 28,611
Gross Domestic Products 195,597 227.450 259,885 302,018 , 329,776 382.220 451717 532,568 627,321 989,119 1,119,442 658,773
*: Preliminary figures. **: Very preliminary figures./a. In 1996, the Government released national accounts series using a 1993 base./b. Using the 1983 base, this line refers only to Ownership of'Dwellings Using the new base, it includes Real Estates.
/c. Includes Business Services.
Source: Central Bureau of Statistics.
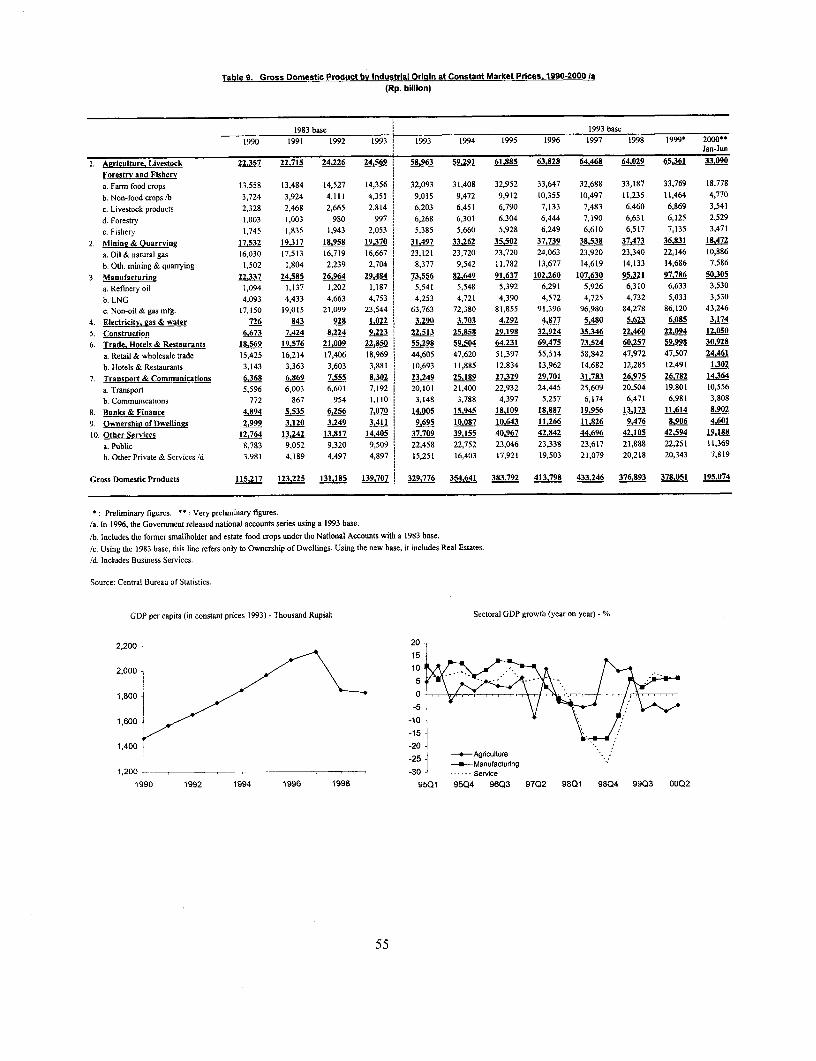
Table 9. Gross Domestic Product by Industrial Oricin at Constant Market Prices. 1990-2000 la
(Rp. billion)
1983 base 1993 base
1990 1991 1992 1993 . 1993 1994 1995 1996 1997 1998 1999' 2000"*Jan-Jun
1. Aericulture. Livestock 22.357 22.715 24,226 24,569 58,963 59,291 6 63,828 64,46S 64,029 65,361 33.090
Forestrv and Fisherv
a. Farm food CTOpS 13,558 13,484 14,527 14,356 32,093 31,408 32,952 33,647 32,688 33,187 33,769 18,778
b. Non-foodcrops b 3,724 3,924 4,111 4,351 9,015 9,472 9,912 10,355 10,497 11,235 11,464 4,770
c. Livestock products 2,328 2,468 2,665 2,814 6,203 6,451 6,790 7,133 7,483 6,460 6,869 3,541
d. Forestry 1,003 1,003 980 997 6,268 6,301 6,304 6,444 7,190 6,631 6,125 2,529
e. Fishery 1,745 1,835 1,943 2,053 5,385 5,660 5,928 6,249 6,610 6,517 7,135 3,471
2. Minine & Ouarrvin e 17,532 19,317 18,958 19370 31.497 33,262 35.502 37,739 38,538 37.473 36,831 18.472
a. Oil & natural gas 16,030 17,513 16,719 16,667 23,121 23,720 23,720 24,063 23,920 23,340 22,146 10,886
b. Oth. mining&quarrying 1,502 1,804 2,239 2,704 8,377 9,542 11,782 13,677 14,619 14,133 14,686 7,586
3 Manufacturino 22.337 24.585 26,964 29,484 73,556 82,649 91,637 102,260 107,630 95,321 97,786 50.305
a. Refunery oil 1,094 1,137 1,202 1,187 5,541 5,548 5,392 6,291 5,926 6,310 6,633 3,530
b. LNG 4,093 4,433 4,663 4,753 4,253 4,721 4,390 4,572 4,725 4,732 5,033 3,530
c. Non-oil & gas mfg. 17,150 19,015 21,099 23,544 63,763 72,380 81,855 91,396 96,980 84,278 86,120 43,246
4. Electricity, gas & water 726 843 928 1.022 3.290 3J703 4,292 4.877 5.480 5,623 6085 3.174
5. Construction 6,673 7,424 8224 9.223 22.513 25.858 29.198 32.924 35,346 22.460 22.094 12.050
6. Trade. Hotels & Restaurants 18,569 19,576 21.009 22.850 55,298 59,504 64,231 69,475 3,524 6 0.257 59,998 30,928
a. Retail & wholesale trade 15,425 16,214 17,406 18,969 44,605 47,620 51,397 55,514 58,842 47,972 47,507 24A 61
b. Hotels & Restaurants 3,143 3,363 3,603 3,881 10,693 11,885 12,834 13,962 14,682 12,285 12,491 1302
7. Transport & Communications 6,368 6,869 7.555 8,302 23.249 25.189 27.329 29,701 31,783 26.975 26.782 14,364
a. Transport 5,596 6,003 6,601 7,192 20,101 21,400 22,932 24,445 25,609 20,504 19,801 10,556
b. Communications 772 867 954 1,110 3,148 3,788 4,397 5,257 6,174 6,471 6,981 3,808
8. Banks & Finance 4,894 5,535 6,256 7,070 14005 15945 18,109 18,887 19,956 13.173 11,614 8,902
9. Ownership of Dwellings 2,999 3,120 3,249 3.411 9.695 10,087 10.643 11.266 11.826 9,476 8.906 4.601
10. Other Services 12,764 13,242 13,817 1 37,709 39.155 40,967 42,842 44,696 42,105 42,594 19,188
a. Public 8,783 9,052 9,320 9,509 22,458 22,752 23,046 23.338 23,617 21,888 22,251 11,369
b. OtherPrivate&Services/d 3,981 4,189 4,497 4,897 15,251 16,403 17,921 19,503 21,079 20,218 20,343 7,819
Gross Domestic Products 115,217 123,225 131.185 139.707 329,776 354.641 383.792 413,798 433.246 376,893 378.051 195.074
: Preliminary figures. ":Very prelirninary figures.
la. In 1996, the Govemrnent released national accounts series using a 1993 base.
b. Includes the former smallholder and estate food crops under the National Accounts with a 1983 base.
/c. Using the 1983 base, this line refers only to Ownership of Dwellings. Using the new base, it includes Real Estates.
/d. Includes Business Services.
Source: Central Bureau of Statistics.
GDP per capita (in constant prices 1993) - Thousand Rupiah Sectoral GDP growth (year on year) - %
2,200 20 20
2,000 , 1 -0 - ec
15
1,600
1,400 2-.--- Agriculture
25 -a---Manufactuting1,200 -3 ... Service
1990 1992 1994 1996 1 998 950 1 9504 9603 9702 98101 9804 99Q3 0002
55

Table 10. Gross Domestic Product by Exienditure Category at Current Market Prices. 1990 - 2000 /a(Rp. billion)
1983 base I 1993 base1990 1991 1992 1993 1993 1994 1995 1996 1997 1998 1999* 2000**
Jan-Jun
1. Pnvate consumption 106,312 125,036 135,880 158,342 ' 192,959 228,119 279,876 332,094 387,171 644,539 811,681 420,256
2. Govemmentconsumption 17,573 20,785 24,731 29,757 1 29,757 31,014 35,584 40,299 42,952 54,416 72,631 44,515
3. Gross fixed investment 55,633 63,894 70,820 78,243 1 86,667 105,381 129,218 157,653 177,686 243,043 237,664 146,151
4. Changes in stock /b 15,072 16,848 22,405 28,286 | 10,546 13,327 15,900 5,800 21,615 -45,573 -91,440 -65,845
5. Exports of goods andnonfactorservices 51,953 62,264 76,384 85,454 88,231 101,332 119,593 137,533 174,871 506,245 390,560 226,536
6. Less: Imports of goods andnonfactor services 50,946 61,376 70,337 78,065 78,383 96,953 125,657 140,812 176,600 413,058 301,654 164,397
Gross Domestic Product 195.597 227.450 259,885 302.018 329.776 382,220 454,514 532.568 627.695 989,61Z 1,119.442 607.216
* Preliminary figures. ** Very preliminary figures./a. In 1996, the Govemment released national accounts series using a 1993 base, based on an up-date of the 1990 Input-Output Table and refined estimates of some sub-sectors.lb. Residuals.
Source: Central Bureau of Statistics.

Table 1I. Gross Domestic Product by Expenditure Cateaory at Constant Market Prices, 1990 - 2000 la(Rp. billion)
1983 base 1993 base1990 1991 1992 1993 1993 1994 1995 1996 1997 1998 1999* 2000"
Jan-Jun
1. Private consumption 62,053 66,584 68,485 72,476 192,958 208,062 215,798 257,016 277,116 259,619 269,181 137,373
2. Govemmentconsumption 11,317 12,113 12,819 12,830 29,757 30,443 31,476 31,681 31,701 26,828 27,014 14,504
3. Gross fixed investment 32,732 34,867 36,589 38,671 f6,667 98,589 114,022 128,699 139,726 93,605 74,887 42,857
4. Changes in stock /b 3,303 1,990 2,314 3,404 I 10,546 14,836 23,435 5,873 3,342 -5,465 -6,607 -12,055
5. Exports of goods andnonfactor services 28,863 34,600 39,675 42,297 88,231 97,002 102,975 112,391 121,158 134,707 92,124 53,573
6. Less: Imports of goods andnonfactor services 23,050 26,929 28,697 29,971 78,383 94,291 103,938 121,863 139,796 132,401 78,546 41,179
Gross Domestic Product 115.217 123.225 131.185 139.707 329.776 354.641 383,768 413,798 433,246 376.93 378.051 195,074
* : Preliminary figures. ** : Very preliminary figures.Ia. In 1996, the Government released national accounts series using a 1993 base, based on an asp-date of the 1990 Input-Output Table and refined estimates of some sub-sectors./b. Residuals.
Source: Central Bureau of Statistics.
Quarterly GDP: Year on year and quarterly growth (%) Domestic demand: GDP, consumption, and investment index,Ql 1995=100
14 160
10 ro 2 Quarterly Private6 0 growtth 140 -
-2 P- * ' * WA | . /u | *, t 100
{ 14 U Ygrowth Y 60 - Investment \
-18] 40- , , . . - . . . ................ .
95Q1 95Q4 96Q3 9702 98Q1 98Q4 99Q3 00Q2 9501 9504 96Q3 97Q2 9801 98Q4 99Q3 00Q2
57

Table 12. Balance of Payments 1994 - 2000(USS million)
Items 1994 1995 1996 1997 1998 1999 2000 /d
I Non oil/gas (net)/a 1,595 -96 -1,849 3,129 13,864 14,355 14,1702 Oil (net) 2,329 2,851 3,122 2,266 1,518 1,975 2,8333 Gas (net) 2,755 6,644 5,896 4,679 3,047 4,314 6,0684 Current account -2,960 -6,760 -7,801 -5,001 4,097 5,783 5,912
a. Exports, fob 40,223 47,454 50,188 56,297 50,371 51,243 58,440b. Imports, fob -32,322 40,921 -44,240 -46,223 -31,942 -30,599 -35,369c. Services, net -10,861 -13,293 -13,749 -15,075 -14,332 -14,861 -17,159
5 Ofcial Capital 307 336 -522 2,880 9,971 5,353 6,504a. Inflows 5,838 5,785 5,693 7,594 7,414 6,560 6,750
IGGI 3,908 5,635 5,093 7,594 5,897 6,560 6,750Special assistance 268 226 165 92 0 0 0Program aid/b 0 0 0 3,036 1,821 3,870 3,740Food aid 0 0 0 0 160 273 61Project aid 3,640 5,409 4,928 4,466 3,916 2,417 2,949
ODA 2,493 3,591 3,274 2,601 1,718 1,686 1,934Non-ODA 1,147 1,818 1,654 1,865 2,198 731 1,015
Commercial loan 141 150 600 0 1,517 0 0b. Amortization -5,390 -5,449 -6,215 -4,714 -3,765 -4,070 -4,344c. Exceptional financing 0 0 0 3,036 6,322 2,863 4,098
IMF and Japan swap 0 0 0 3,036 5,761 1,373 1,792Refinancing & reschedulling 0 0 0 0 561 1,490 2,306
6 Private Capital 3,701 10,252 11,511 -338 -13,846 -9,923 -10,409a. Foreign direct invesment 2,108 4,345 6,194 4,677 -356 -2,745 -5,321
Inflow 3,412 5,975 8,154 10,005 6,986 3,702 3,718Outflow -1,304 -1,630 -1,960 -5,328 -7,342 -6,447 -9,039
b. Others 1,593 5,907 5,317 -5,015 -13,490 -7,178 -5,0887 Capital account (5+6) 4,008 10,588 10,989 2,542 -3,875 -4,570 -3,9058 TOTAL(4+5+6) 1,048 3,828 3,188 -2,459 222 1,213 2,0079 Errors& omission -(4+7+10) -242 -2,312 1,263 -1,986 2,122 2,079 1,03310 Monetary movements/c -806 -1,516 -4,451 4,445 4,910 -3,292 -3,040
/a Gross exports less imports of goods and services of the oil and LNG sector respectively.ib Since Quarter I of 1998/99 Program Aid has included disbursements of BOP supports, excluding IMF loan./c Since 1998 Monetary Movement is based on Gross Foreign Assets (GFA) replacing Official Reserves.
Since 2000, based on change reserve assets replacing GFA. A negative amount refers to an accumulation of assets./d Projection
Source: Bank Indonesia.
Trade balance and current account in US$ billion Private and official capital in US$ billion
25 15-_ Current account ..
20 - - Trade balance 10 -
15- 5-
-- -10- FD I.
-5 r r r -15 -- Official Capital i- - a - - Private Captal
-10 - -20
1994 1995 1996 1997 1998 1999 2 0 00p 1994 1995 1996 1997 1998 1999 2000p
58

Table 13. Selected Non - oil ExDorts. 1990 -2000(USS million)
1990 1991 1992 1993 1994 1995 1996 1997 1998 1999 2000
Jan-Jun
1. Rubber 885 924 1,039 959 1,268 1,986 1,894 1,505 1,010 855 4262. Coffee 372 355 236 333 750 622 598 583 607 474 1433. Palmoil&Cemel 253 335 465 535 878 973 1,017 1,662 816 1,170 5594. Rattan 275 275 307 333 354 374 324 204 11 16 15. Foodstuff 308 382 467 455 603 670 747 881 923 904 2976. Shrimps, Lobster, Tuna 705 811 802 902 1,056 1,093 1,058 1,097 1,768 1,607 7087. Tin 176 146 148 92 121 240 310 277 260 242 1078. Copper 400 146 687 646 879 1,551 1,397 1,548 1,749 1,077 7499. Nickel 319 512 269 304 334 410 374 233 165 219 18610. Aluminum 216 304 214 165 204 354 320 280 200 135 11711. Iron Steel 367 172 381 464 454 522 608 660 990 772 37512. Plywood 2,690 2,772 3,219 4,128 3,650 3,452 3,544 3,477 2,327 2,254 1,04613. Textiles 1,084 2,772 2,470 2,311 2,517 2,908 2,683 3,390 3,461 3,086 1,56314. Handicraft 346 1,539 541 663 978 655 526 1,027 2,089 612 28915. Electrical app. 237 379 1,017 1,301 1,774 2,724 3,593 3,261 2,813 3,401 2,91016. Garment 1,570 2,203 3,212 3,395 3,096 3,324 3,187 4,181 3,817 3,777 1,86517. Pulp and Paper 250 312 401 483 782 1,504 1,369 1,953 2,469 2,646 1,534
Others 4,305 3,716 7,748 8,612 10,172 12,854 13,499 16,914 16,383 16,261 9,176
TotalNon-oilExMorts i.!758 1.054 23624 26.00 2980 36.24 37,04 43.133 41.859 39.510 22051
Source: Bank Indonesia.
Oil and non-oil export (US$ million) Non-oil export by main group (US$ million)
35,000
45,000 - Non-oil and gas 30,000
25,000 -35,000
20.000
25,000150
Oil and ga 10,000
15,000 5.000
59000 - 1993 1994 1995 1996 1997 1998 1999
l *~~~~~~~~~~~~~~~~~~~~Agriculture 0 Mining 0 Manufacturing
59

Table 14. Value of Exgorts by Principal Country of Destination. 1990-2000(USS million)
1990 1991 1992 1993 1994 1995 1996 1997 1998 1999
Asean 2.516 3,197 4.361 4,746 5.704 6.070 7,212 8,648 8.762 7.802Malaysia 253 342 488 586 738 987 1,110 1,506 1,359 1,336Thailand 189 267 353 468 401 703 823 847 943 813Philippines 161 168 181 285 365 590 689 793 708 695Singapore 1,902 2,410 3,314 3,372 4,150 3,767 4,565 5,462 5,718 4,931Brunei 11 10 25 35 50 24 27 40 36 28Vietnam 172 196 264 337 390 351 332Cambodia 40 442 80 60 70 65 69
Hong Kong 618 703 881 901 1.321 1.657 1.625 1.778 1.865 1.330Japan 10.3 10,767 10761 11,172 10.929 1 125 12.461 9.116 10397Other Asia 4,035 5,540 6,567 6,768 7,405 8.725 9,554 10.743 9,413 10,145
Africa 199 394 419 463 638 621 639 771 908 1,063
USA 3.365 3,509 4.419 5.230 5.829 6.322 6,795 7,113 7,031 6.896Canada 139 172 289 304 322 359 368 398 412 354Other America 102 184 328 469 562 759 758 950 927 830
Australia 403 628 746 774 705 915 1,216 1,511 1 533 1485Other Oceania 84 39 53 78 67 156 71 69 121 142EEC 3.029 3,743 4.844 5.391 59 6 615 7446 7,848 7.544 6 869o/w UnitedKingdom 517 654 844 1,005 1,038 1,129 1,193 1,231 1,143 1,176
Netherlands 723 838 1,100 1,086 1,324 1,452 1,667 1,835 1,512 1,544Germany 750 907 978 1,178 1,263 1,382 1,489 1,459 1,401 1,234Belgium & Luxemburg 210 258 401 366 409 539 682 788 877 695France 286 386 495 500 426 520 564 497 547 503Italy 276 382 583 615 661 784 744 823 859 656Spain 152 169 255 333 454 535 813 886 869 742
Soviet Union 81 40 70 125 91 134 134 65 43 34Others in Europe 183 229 231 288 417 452 714 627 756 847
Total 25,77 29,45 33.969 36,710 34.049 45,074 49,417 52984 48432 48194
Source: Central Bureau of Statistics.
Export value by country destnation in 1993, 1996, and 1999
1993 1996 1999
I ~~~~~~AseanAsean Asean others Asean 16%
oter 13%C oter 15'14% 14% ~~~~~~~~~~~~~~~14%
E-EC C Japan EECJapan 15% Japan 15% 22% 14%30% 26%
60

Table 15. Value of Imports by Principal Country of Origin. 1990-2000(US$ million)
1990 1991 1992 1993 1994 1995 1996 1997 1998 1999
Asean 2,430 2,465 2,593 2,603 2.928 3.953 4.885 5.276 4.129 4.764Malaysia 326 407 525 517 579 767 824 865 627 589Thailand 183 278 345 235 407 737 1,095 867 842 933Philippines 649 81 52 57 65 81 90 127 65 56Singapore 1,272 1,699 1,670 1,793 1,877 2,368 2,875 3,411 2,596 2,526Brunei 0 0 1 1 0 1 1 6 0 38
Hong Kong 273 232 229 247 241 275 262 325 264 228Japan 5,300 6,327 6.014 6.248 7,734 9.217 8504 8,252 4.293 2,913Other Asia 4.633 5.156 5.496 5,972 6,870 8.376 8,662 8,171 5.463 5,972
Africa 170 195 213 140 332 608 643 684 428 573
USA 2,520 3,397 3.822 3 255 3,594 4.756 5.060 5,441 3.515 2.839Canada 407 354 459 410 497 811 786 682 496 421Other America 519 597 488 625 755 1,088 1.089 926 515 584
Australia 1186 1,378 1.413 1399 1542 2,016 2.535 2,427 1.761 1.460Other Oceania 115 118 136 161 186 206 245 234 166 117
EEC 4.060 4,705 5.400 5.651 5,827 7,253 7.880 7.191 5.176 3.801United Kingdom 440 603 719 782 710 902 1,1 18 1,084 920 511Netherlands 550 505 507 626 564 842 493 566 338 347Germany 1,502 2,061 2,141 2,072 2,473 2,819 3,001 2,629 2,337 1,399Belgium & Luxemburg 232 254 324 340 292 401 394 339 277 178France 643 544 816 853 786 1,064 1,006 1,016 568 372Denmark 61 49 124 158 106 105 191 159 50 38Ireland 74 13 23 21 22 41 39 35 25 31Italy 410 536 558 523 670 791 1,212 918 480 277Greece 6 5 8 12 26 61 76 52 19 25Portugal 6 4 2 2 4 8 5 23 2 2Spain 136 131 178 262 174 219 345 370 160 206
Othersin Euroae 764 899 969 1,517 1.264 2,070 2.000 2.071 1,024 332
Total 22.430 28325 31.990 41.06 42,929 41.967 277 24.03
Source: Central Bureau of Statistics.
Import value by country destination in 1993, 1996, and 1999
1993 1996 I 1999
Asean otesAsean others Aseanothers 9% USA others 11% USA 40% 20%
12%EC , _ E z 5 j _ t2°bC EE
Japan Japan ia2% EE%22% 20%
61

Table 16. External Public Debt Outstandina as of December 31.1998(USS thousand)
Type of creditor/ Debt outstanding Presentcreditor country Disbursed Undisbursed Total Value
Suppliers' CreditsJapan 1,238,923 1,767 1,240,690 1,265,516
Total suppliers' credits 1,238,923 1,767 1,240,690 1,265,516
Financial InstitutionsAustralia 3,852 2,242 6,094 6,073Austria 112,676 53,123 165,799 196,548Belgium 3,630 577 4,207 4,332France 169,921 66,485 236,406 288,464Germany, Fed.Rep.Of 4,324 99 4,423 3,610Hong Kong 471,351 150,000 621,351 621,248Japan 438,090 196,600 634,690 482,577Multiple Lenders 8,127,433 - 8,127,433 8,150,532Netherlands 61,287 28,445 89,732 86,013Norway 27,233 13,890 41,123 29,866Singapore 1,000,000 - 1,000,000 837,435Spain 7,139 - 7,139 6,649Switzerland 3,109 - 3,109 2,650United Kingdom 455,360 263,516 718,876 697,356
Total financial institutions 10,885,405 774,977 11,660,382 11,413,353
BondsMultiple Lender 765,000 - 765,000 951,240United States 426,000 - 426,000 462,164
Total bonds 1,191,000 - 1,191,000 1,413,404
NationalizationNetherlands 39,814 - 39,814 35,555
Total nationalization 39,814 - 39,814 35,555
Multilateral LoansASDB Soft Window 653,462 184,035 837,497 423,617Asian Dev. Bank 5,476,837 4,193,295 9,670,132 9,529,359EEC 3,865 - 3,865 2,137European Dev. Fund 770 1,563 2,334 1,890IBRD 10,691,735 4,284,130 14,975,865 16,211,335IDA 694,088 - 694,088 413,383Intl. Fund Agr. Dev. (IFAD) 95,581 44,337 139,919 103,333Islamic Dev. Bank 62,353 67,828 130,181 133,856Nordic Invest Bank 200,281 21,418 221,699 198,141Nordic Invest. Fund 13,158 - 13,158
Total multilateral loans 17,892,130 8,796,607 26,688,737 27,017,051
Source: IBRD Debtor Reporting Systemn, based on data provided by Bank Indonesia.
62

Table 17. Service Payments. Commitments. Dlsbursements and Outstanding Amounts of Total External Debt. 1980 - 2013(USS thousand)
Debt outstanding at Transactions during period Other Changes
end of periodDisbursed Including Commit- Disburse- Service Payments Cancel- Adjust-
only Undisbursed ments ments Principal Interest Total lations ment /a
Actual
1980 20,937,697 30,420,359 4,277,373 3,245,505 1,632,494 1,451,811 3,084,305 118,261
1981 22,761,139 33,805,826 5,008,002 3,845,429 1,784,995 1,707,127 3,492,122 163,286 325,746
1982 25,133,280 38,847,056 7,067,267 4,410,336 1,942,084 1,914,070 3,856,154 5,472 -78,480
1983 30,229,384 44,069,191 5,686,879 6,392,696 1,798,027 1,943,231 3,741,258 197,669 1,530,951
1984 32,025,604 46,152,969 4,816,038 4,840,324 2,270,173 2,575,904 4,846,077 26,707 -435,379
1985 36,715,241 52,664,318 4,583,947 4,170,204 3,421,579 2,401,135 5,822,714 514,815 5,863,7971986 42,916.411 60,291,399 4,104,406 4,829,475 3,285,238 2,698,512 5,983,750 184,999 6,992,912
1987 52,494,917 71,957,065 5,994,820 7,489,770 4,057,399 2,940,534 6,997,933 635,419 10,363,663
1988 54,078,473 72,944,387 6,087,327 8,179,570 5,296,940 3,345,242 8,642,182 511,210 708,1451989 59,401,728 78,040,191 7,643,407 9,008,916 5,993,871 3,839,209 9,833,080 307,264 3,753,532
1990 69,871,544 90,281,287 6,691,047 10,024,228 5,968,647 3,977,615 9,946,262 792,119 12,310,815
1991 79,547,725 100,178,464 8,811,427 11,758,429 6,857,771 4,617,488 11,475,259 2,102,942 10,046,463
1992 88,002,159 107,367,151 7,878,074 13,532,913 7,943,980 4,512,662 12,456,642 1,212,380 8,467,005
1993 89,171,878 109,869,339 8,136,637 8,084,176 9,137,539 4,951,220 14,088,759 428,180 3,931,270
1994 107,823,935 129,207,339 7,711,610 12,546,541 8,951,065 5,316,014 14,267,079 402,304 20,979,726
1995 124,398,325 149,421,280 10,954,145 13,628,469 10,196,992 6,219,010 16,416,002 568,988 20,021,412
1996 128,940,609 152,642,307 7,795,728 20,973,217 14,891,771 6,647,014 21,538,785 558,371
1997 136,173,090 155,527,125 3,431,603 22,462,352 13,009,502 6,726,343 19,735,844 451,022
1998 150,874,571 166,383,363 6,608,400 16,657,321 11,841,879 7,125,241 18,967,120 3,393,253
1999 /b 148,097,000 167,247,496 7,222,766 18,848,000 7,167,000 26,015,000
Projected2000 125,983,798 131,103,289 0 4,421,682 19,728,065 6,666,699 26,394,764 02001 109,300,467 111,642,851 0 2,777,132 19,460,464 5,898,661 25,359,125 0
2002 94,858,467 95,951,193 0 1,249,675 15,691,673 4,713,578 20,405,251 0
2003 84,674,111 85,143,472 0 623,406 10,807,761 3,891,641 14,699,402 0
2004 76,600,178 76,771,838 0 297,738 8,371,671 3,372,000 11,743,672 0
2005 67,947,370 67,960,190 0 158,938 8,811,746 2,849,925 11,661,672 0
2006 60,127,530 60,133,158 0 7,193 7,827,032 2,282,129 10,109,161 0
2007 51,682,151 51,683,457 0 4,321 8,449,700 4,114,805 12,564,505 0
2008 47,281,547 47,281,807 0 1,046 4,401,650 1,281,708 5,683,358 0
2009 43,731,070 43,731,329 0 0 3,550,477 1,074,929 4,625,406 0
2010 40,515,438 40,515,696 0 0 3,215,632 906,548 4,122,180 0
2011 37,844,994 37,845,251 0 0 2,670,444 755,735 3,426,179 0
2012 35,000,838 35,001,095 0 0 2,844,156 635,848 3,480,004 0
2013 32,668,160 32,668,417 0 0 2,332,677 492,979 2,825,656 0
/a This column shows the amount of arithmetic imbalances in the amount outstanding, including undisbursed, from one year to the next. The mostcommon causes of imbalance are changes in exchange rates and transfers of debts from one category to another in the table.
/b 1999 actual data are from Bank Indonesia.
Source: IBRD Debtor Reporting System, based on data provided by Bank Indonesia.

Table 1. External Debt Outstanding December 1997 - March 2000(USS million)
1997 1998 1999 2000December March June September December March June September December March
External Debt 125,817 131,587 135,005 136,299 145,599 146,448 141,296 142,764 144,798 140,725
Government 53,865 54,159 55,166 58,666 67,315 68,404 70,418 74,809 75,720 75,036 11ODA 38,162 37,853 38,672 40,803 48,421 49,788 52,091 55,445 56,453 56,316Non ODA 14,812 14,632 14,164 15,485 16,045 16,247 15,952 16,982 16,880 16,336Commercial 890 1,674 2,330 2,378 2,849 2,369 2,375 2,382 2,387 2,384
State Enterprises 3,995 3,842 4,008 3,850 4,153 4,123 4,121 4,020 5,004 4,937Pertamnina & Garmda 3,757 3,720 3,829 3,688 3,992 3,980 3,948 3,820 3,667 3,639Other state enterprises 239 122 179 162 161 143 173 200 1,337 1,298
Banks 14,364 12,826 12,622 10,817 10,769 11,748 10,631 10,384 10,836 10,379 /2State banks 5,910 5,024 4.967 4,360 4,744 4,872 4,926 4,732 4,705 4,667Private banks 8,454 7,802 7,655 6,457 6,025 6,876 5,705 5,652 6,131 5,712
Private non Banks 53,593 60,760 63,209 62,966 63,362 62,173 56,126 53,551 53,238 50,373 /2C>, Loan 49,179 52,628 55,584 55,376 55,954 54,718 49,161 46,902 46,909 44,1344b. Bonds 4,414 8,132 7,625 7,590 7,408 7,455 6,965 6,649 6,329 6,239
Domestic Securities Owned by non-residents 10,271 6,432 5,607 5,667 5,287 3,491 3,653 3,178 3,299 3,557
Denominated in Rupiah 2,858 1,187 740 724 656 422 795 399 589 710Bonds 322 170 102 98 99 56 96 72 90 104SBls 245 229 248 182 13 30 275 38 142 256MTNs 369 165 87 93 109 86 86 71 110 100CPs 11 10 6 6 9 4 9 8 10 2
CDs 1,088 240 51 30 24 0 18 0 0PNs 823 373 246 315 402 246 311 210 237 248FRNs 0 0 0 0 0 0 0 0
Denominated in USD 7,413 5,245 4,867 4,943 4,631 3,069 2,858 2,779 2,710 2,847PNs 5,297 3,708 3,731 3,525 3,295 1,839 1,693 1,610 1,661 1,817 /3MTNs 1,974 1,365 1,069 1,343 1,263 1,184 1,106 1,115 1,004 992 /3CPs 29 43 44 49 50 35 42 39 35 30Bonds 98 127 22 24 21 7 13 13 8 8FRNs 2 2 1 2 2 4 4 2 2
CDs 13
Total External Obligations 136,088 138,019 140,612 141,966 150,886 149,939 144,949 145,942 148,097 144,282
/1 Includes debt owed to IMF./2 Includes loans obtained by branches of Indonesian banks and affiliates of Indonesian companies abroad and channeled into Indonesia.
/3 Including securities JPY denomninated.
Source: Bank Indonesia.
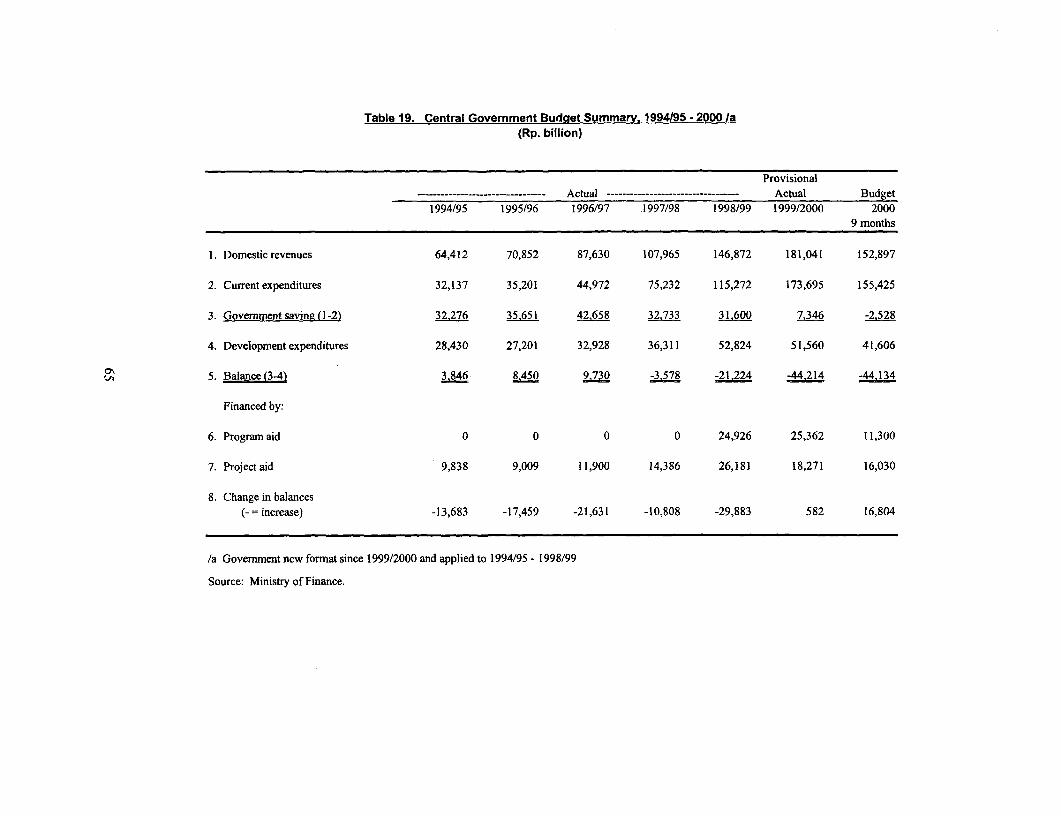
Table 19. Central Government Budget Summary. 1994/95 - 2000 Ia(Rp. billion)
Provisional--------------------------------- Actual ---------------------------------- Actual Budget
1994/95 1995/96 1996/97 1997/98 1998/99 1999/2000 20009 months
1. Domestic revenues 64,412 70,852 87,630 107,965 146,872 181,041 152,897
2. Current expenditures 32,137 35,201 44,972 75,232 115,272 173,695 155,425
3. Government savinz (1-2) 32276 35.651 42.658 32.733 31.60 7.346 -2.528
4. Development expenditures 28,430 27,201 32,928 36,311 52,824 51,560 41,606
5. Balance (3-4) 3.846 8,450 9.730 3 2444 4
Financed by:
6. Program aid 0 0 0 0 24,926 25,362 11,300
7. Projectaid 9,838 9,009 11,900 14,386 26,181 18,271 16,030
8. Change in balances(- = increase) -13,683 -17,459 -21,631 -10,808 -29,883 582 16,804
/a Government new format since 1999/2000 and applied to 1994/95 - 1998/99
Source: Ministry of Finance.

Table 20. Central Government Revenues. 1994495 - 2000 Ia(Rp. billion)
Provisional--------------------------------- Actual ---------------------------------- Actual Budget
1994/95 1995/96 1996/97 1997/98 1998/99 1999/2000 20009 months
State Revenues and Grants 64,412 70,852 87,630 107,965 146,872 181,041 152,897
S. Domestic Revenues 64,412 70,852 87,630 107,965 146,872 181,041 152,8971. Tax Revenues 49,175 54,258 64,422 81,752 118,795 117,381 101,437
a. Domestic Taxes 45,144 51,042 61,762 78,625 111,860 112,798 95,538i. Income Taxes 23,497 26,583 34,144 45,206 72,345 65,199 54,225-Non-Oil & Gas 18,764 21,012 27,062 34,388 55,944 54,941 44,189-Oil & Gas 4733 5571 7082 10818 16401 10,258 10,036ii. Sales tax (VAT) 16,545 18,519 20,351 25,199 27,803 32,982 27,002iii. Property taxes 1,647 1,894 2,413 2,641 3,565 3,650 2,901iv. Excises 3,153 3,593 4,263 5,101 7,733 10,399 10,272v. Othertaxes 302 453 591 478 413 569 1,139
b. Intemational Trade Taxes 4,031 3,216 2,660 3,127 6,936 4,583 5,899i. Import duties 3,900 3,029 2,579 2,999 2,306 3,748 4,976ii.Exporttaxes 131 186 81 129 4,630 835 923
2. Non Tax Receipts 15,237 16,595 23,209 26,213 28,076 63,660 51,460a. Natural Resources Revenues 8,804 10,483 13,055 15,431 15,431 46,045 40,082
i. Oil 7,603 9,093 11,235 10,701 10,701 34,552 25,311ii. Gas 1,201 1,391 1,821 4,730 4,730 11,493 7,918iii. Public Mining 0 0 0 0 0 0 619iv. Forestry 0 0 0 0 0 0 6,209v. Fishery 0 0 0 0 0 0 25
b. Profits of Public Enterprises 1,322 1,604 2,650 2,341 3,428 5,759 5,281c. Other Non-tax revenues (PNBP) 5,111 4,508 7,503 8,442 9,217 11,857 6,096
II. Grants 0 0 0 0 0 0 0
/a Govemment new format since 1999/2000 and applied to 1994/95 - 1998/99
Source: Ministry of Finance.
Central Government revenues as percentage of GDP
100% -
80% -El Oil + gas (tax + non tax)
60% U9 Income taxes (excudes
Oil gas)
40% *1 c > : c 'Trade
20% ~~~~~~~~OVAT
2E Others
94/95 95/96 96/97 97/98 98/99 99/00 2000
Budget
66

Table 21. Central Government Expenditures. 1994J95 - 2000 la(Rp. billion)
Provisional-------- Actual --------------------------- Actual Budget
1994/95 1995/96 1996197 1997/98 1998/99 1999/2000 20009 months
Total Expenditures 60,567 62,402 77,900 111,543 168,096 225,255 197,030
1. Current Expenditures 32.137 35,201 44.972 75.232 115.272 173.695 155.425
Personnel expenditures 12,596 13,001 14,455 17,269 23,216 33,622 30,682Wages and salaries 10,181 11,048 13,005 13,698 18,657 26,881 25,761Rice allowance 973 733 768 788 1,245 2,004 1,527Food allowance 756 560 101 1,174 1,547 2,289 1,585Other 368 370 480 671 1,073 1,438 1,014Extemal 317 290 103 938 695 1,011 795
Material expenditures 4,319 5,175 8,109 8,999 9,862 10,862 9,441
Transferstoregions 7,272 8,227 9,358 11,061 13,074 19,170 18,114
Debt Service 6,470 6,875 9,902 16,735 32,574 43,556 54,623Domestic 0 0 0 0 8,385 23,498 37,998Extemal 6,470 6,875 9,902 16,735 24,189 20,058 16,625
Subsidies 687 0 1,416 20,413 33,872 62,426 30,828Petroleum subsidies 687 0 1,416 9,814 28,607 40,923 22,462Other Subsidies non Petroleum 0 0 0 10,599 5,265 21,502 8,366
a. Food 0 0 0 10,599 1,535 12,939 2,232b. Electricity 0 0 0 0 1,930 4,552 3,928c. Interest Subsidies 0 0 0 0 1,192 3,253 1,930
Other Current Expenditures 793 1,923 1,733 756 2,674 4,059 11,737
IL Development Expenditures 28430 27201 32928 36311 5 4 51.560 41_606
1. Rupiah Financing 18,592 18,192 21,028 21,926 26,643 33,289 25,576a. Capital transfer to region 5,670 5,488 6,472 7,512 13,575 15,557 15,409b. Central Govemment Budget 12,922 12,704 14,556 14,414 13,068 17,732 10,167
2. Project Financingwith foreign loan 9,838 9,009 11,900 14,386 26,181 18,271 16,030
/a Govemment new format since 1999/2000 and applied to 1994/95 - 1998/99
Source: Ministry of Finance.
Central Govermment Expenditures as percentage of GDP
100% _
90% 80% D ODevelopment80% l { 1=2 { Expenditures70% - N - _ IdOthers Current60% - expenditure50% U Subsidies
40% IC Debt Service30% 20% - * Transfers to Regions
10% - - - - - - Material0%
__}4/95i ! 95il9 i9!16/97- 97/98 _ 9 _ _~ 2uet El Personnel
67

Table 22. Money SuDDly (Ml). 1991 - 2000(Rp. billion)
End of Period Total Currency Demand deposits Change over periodAmount (%) Amount (%/6) Amount (%)
1991 1 23,570 9,026 38 14,544 62 1,415 6.4II 24,609 8,824 36 15,785 64 1,404 6.1III 25,805 9,025 35 16,780 65 2,823 12.3IV 26,342 9,346 35 16,996 65 2,523 10.6
1992 1 27,318 11,025 40 16,293 60 3,748 15.9II 26,844 9,944 37 16,900 63 2,235 9.1III 27,626 10,440 38 17,186 62 1,821 7.1IV 28,779 11,478 40 17,301 60 2,437 9.3
1993 I 30,592 12,324 40 18,268 60 3,274 12.0II 31,563 12,386 39 19,177 61 4,719 17.6III 35,041 13,106 37 21,935 63 7,415 26.8IV 36,805 14,431 39 22,374 61 8,026 27.9
1994 1 37,908 15,340 40 22,568 60 7,316 23.9II 39,886 15,825 40 24,061 60 8,323 26.4111 42,195 17,555 42 24,640 58 7,154 20.4IV 45,374 18,634 41 26,740 59 10,333 29.5
1995 1 44,908 18,902 42 26,006 58 7,000 18.5II 47,045 19,186 41 27,859 59 7,159 17.9III 48,981 19,564 40 29,417 60 6,786 16.1IV 52,677 20,807 39 31,870 61 7,303 16.1
1996 1 53,162 21,121 40 32,041 60 8,254 18.411 56,448 21,271 38 35,177 62 9,403 20.0III 59,684 21,055 35 38,629 65 10,703 21.9IV 64,089 22,487 35 41,602 65 11,412 21.7
1997 1 63,565 23,312 37 40,253 63 10,403 19.6if 69,950 23,754 34 46,196 66 13,502 23.9III 66,258 23,916 36 42,342 64 6,574 11.0IV 78,343 28,424 36 49,919 64 14,254 22.2
1998 1 98,270 38,196 39 60,074 61 34,705 54.6II 109,480 44,924 41 64,556 59 39,530 56.5III 102,563 42,725 42 59,838 58 36,305 54.8IV 101,197 41,394 41 59,803 59 22,854 29.2
1999 1 105,705 44,682 42 61,023 58 7,435 7.611 105,964 43,530 41 62,434 59 (3,516) (3.2)III 118,124 46,424 39 71,700 61 15,561 15.2IV 124,633 58,353 47 66,280 53 23,436 23.2
2000 1 124,663 51,197 41 73,466 59 18,958 17.911 133,832 55,831 42 78,001 58 27,868 26.3
Source: Bank Indonesia.
Percentage change of MI (percent, YoY)
60
0 , ,, ,,, , ii,, g
-10 111 1 111 11111 iI11 1 1111 11111 11I 1 11 1 111 1
19.91 1992 1993 1994 1995 1996 1997 1998 1999 2000 j
68
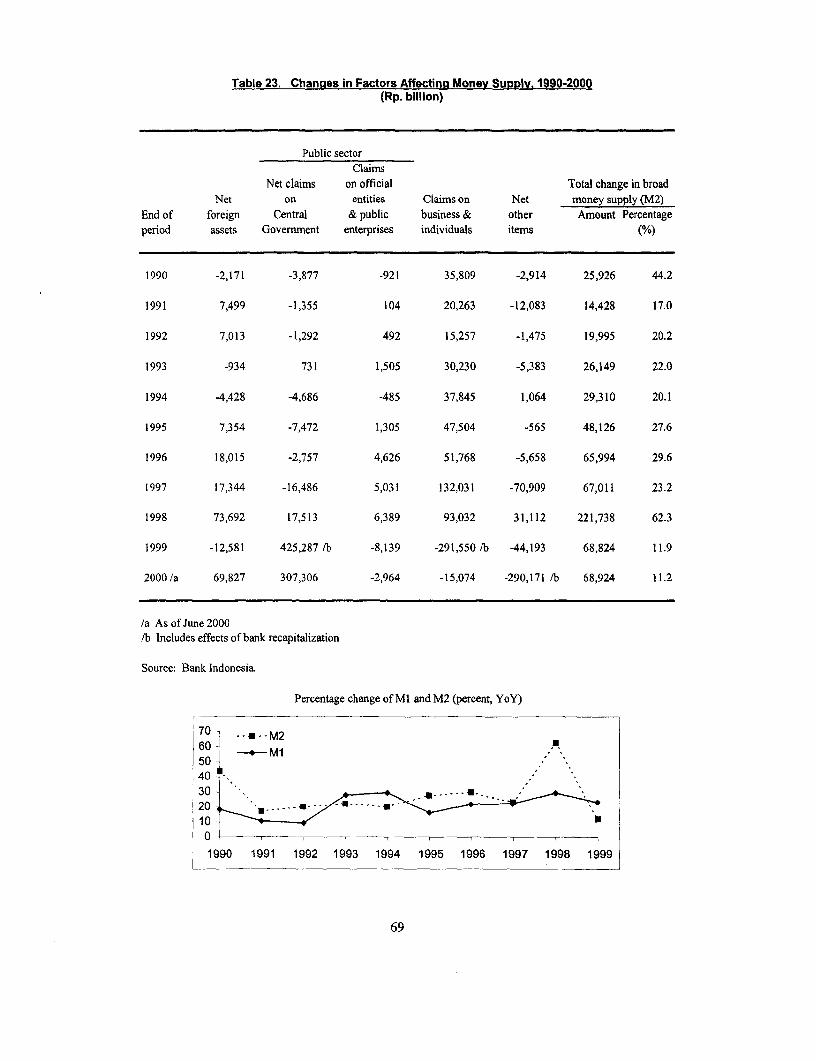
Table 23. Chanaes in Factors Affecting Money SuDpl,V 1990-2000(Rp. billion)
Public sectorClaims
Net claims on official Total change in broadNet on entities Claims on Net money supply (M2)
End of foreign Central & public business & other Amount Percentageperiod assets Government enterprises individuals items (%/6)
1990 -2,171 -3,877 -921 35,809 -2,914 25,926 44.2
1991 7,499 -1,355 104 20,263 -12,083 14,428 17.0
1992 7,013 -1,292 492 15,257 -1,475 19,995 20.2
1993 -934 731 1,505 30,230 -5,383 26,149 22.0
1994 -4,428 -4,686 -485 37,845 1,064 29,310 20.1
1995 7,354 -7,472 1,305 47,504 -565 48,126 27.6
1996 18,015 -2,757 4,626 51,768 -5,658 65,994 29.6
1997 17,344 -16,486 5,031 132,031 -70,909 67,011 23.2
1998 73,692 17,513 6,389 93,032 31,112 221,738 62.3
1999 -12,581 425,287 /b -8,139 -291,550 /b -44,193 68,824 11.9
2000/a 69,827 307,306 -2,964 -15,074 -290,171 /b 68,924 11.2
/a As of June 2000/b Includes effects of bank recapitalization
Source: Bank Indonesia.
Percentage change of Ml and M2 (percent, YoY)
7060 a =M2a
Ml
,40 -.
20 _
O- , 0
1990 1991 1992 1993 1994 1995 1996 1997 1998 1999
69

Table 24. Consolidated Balance Sheet of the Monetary System. 1990-2000(Rp. billion)
End of period 1990 1991 1992 1993 1994 1995 1996 1997 1998 1999 2000as of June
Net foreign assets 16.122 23,621 30.634 2970 72 32.626 50641 67.985 141.67 129096 181.90
Domestic credit 93.142 112.154 126611 159.07 19225 23308 284.507 404,396 521759 649.83 766809
Claims on public sectorCentral government -12,202 -13,581 -14,873 -14,142 -18,828 -26,300 -29,057 -45,543 -28,037 397,257 497,669Claims on public enterprises 7,904 8,008 8,500 10,005 9,994 10,955 13,363 17,707 24,532 18,862 269,140Govemment-blocked account -24 0 0 0 0 0 0 0 0 0 0
Claims on private enterwrisesand individuals 97464 117.727 132,984 163.4 01.059 248.43 300,201 43223 525.2 233.714 249.92
Assets = liabilities 109,264 135,775 157,245 188,777 217,497 265,714 335,148 472,381 663,436 778,929 948,713
Import deposits 1,048 966 890 1,699 1,541 1,779 2,099 1,419 2,417 1,658 2,840
Netotheritems 23,586 35,751 37,302 41,876 41,444 41,297 46,635 118,224 86,114 131,066 261,538
Money and quasi monev 84,630 99,058 119,053 145,202 174,512 222,638 288,632 355,643 577,381 646,205 684,335Money 23,819 26,341 28,779 36,805 45,374 52,677 64,089 78,343 101,197 124,633 133,832
Currency 9,094 9,346 11,478 14,431 18,634 20,807 22,487 28,424 41,394 58,353 55,831Demand deposits 14,725 16,995 17,301 22,374 26,740 31,870 41,602 49,919 59,803 66,280 78,001
Quasi money 60,811 72,717 90,274 108,397 129,138 169,961 224,543 277,300 476,184 521,572 550,503
Source: Bank Indonesia.

Table 25. Bankina System Credits by Economic Sector. 1990-2000 la(Rp. billion)
1990 1991 /f 1992 1993 /g 1994 1995 1996 1997 1998 1999 2000/h
Aericulture 7.176 8A65 10281 7 13,860 15525 17630 26.002 3 23.777 23332Inrupiah 6,884 7,979 9,173 10,368 12,026 13,661 15,158 20,340 29,430 21,139 20,066In foreign exchange 292 486 1,108 1,689 1,834 1,864 2,472 5,662 9,878 2,638 3,266
Mininu/b 615 743 762 777 799 913 1.693 5.316 5,909 3,697 5.516In rupiah 570 614 605 416 359 434 716 2,769 2,729 879 1,050In foreign exchange 45 129 157 361 440 479 977 2,547 3,180 2,818 4,466
Manufacturing industry/c 30502 33_131 37A58 51.432 6.1 72.088 78.850 111,679 171.668 84.259 90_026In rupiah 25,002 24,828 26,197 36,334 42,236 48,476 51,984 56,123 85,594 35,561 29,715In foreign exchange 5,500 8,303 11,261 15,098 17,975 23,612 26,866 55,556 86,074 48,698 60,311
Trade /d 29737 33.049 32 944 3779 44,372 54224 70.586 82.264 96.364 43288 46.708In rupiah 27,267 28,842 28,100 31,470 36,840 43,608 55,763 57,471 59,830 29,687 29,160In foreign exchange 2,470 4,207 4,844 6,324 7,532 10,616 14,823 24,793 36,534 13,601 17,548
Service rendering industry/e 17.897 20.066 25,899 35.824 50.806 66.584 91.655 113.569 139,124 43.161 43776In rupiah 14,943 16,683 21,979 30,167 42,453 57,432 78,392 85,598 101,129 26,332 24,000In foreign exchange 2,954 3,383 3,920 5,657 8,353 9,152 13,263 27,971 37,995 16,829 19,776
Others 11,769 17.371 15.574 12387 18.832 25.277 32.507 39.304 35.053 26951 30.777In rupiah 11,197 16,326 14,653 12,374 18,824 25,265 32,478 39,233 34,406 26,929 30,663In foreign exchange 572 1,045 921 13 8 12 29 71 647 22 114
Total 2Z926 112,825 122918 150.271 188.880 2 ,1 292.921 378.134 487,426 225.133 240.135Inrupiah 85,863 95,272 100,707 121,129 152,738 188,876 234,491 261,534 313,118 140,527 134,654In foreign exchange 11,833 17,553 22,211 29,142 36,142 45,735 58,430 116,600 174,308 84,606 105,481
/a Credits outstanding at end of period Includes investment credits, KIK and KMKP. Excludes interbank credits, credits to central government and to nonresidents,bridging finance credit, foreign exchange component of project aid, local cost of investment fund accounts, and credit extended to bank branches abroad.
/b Includes credits to PERTAMINA for repayment of foreign borrowing./c Processing of agricultural products is classified under manufacturing industry according to ISIC 1968/e Credits for electricity, gas and water supply are included in service-rendering industry sector./f Since 1991 excludes Bank Indonesia/g As of 1993 includes Conimercial Banks ex Non-Bank Financial Institutions./h As of June 2000
Source: Bank Indonesia.
Credit outstanding share by economic sector 1996 and June 2000 (percent)
1996 2000
Manufacturnng T d Manufacturnn
27% _t::::::::::::?si 38%
_ ~~~...........Trd TradeMining Mining _ .::*:*:.:: 19%
Agriculture
AgricuIue
31% 13% 5 ; * | Others 1e8i
71

Table 26. Bankina Credits Outstandina in Rupiah and Foreign Exchanae by GrOUD of Banks. 1990 - 20001a(Rp. billion)
1990 1991 1992 1993 1994 1995 1996 1997 1998 1999 2000/d
BankIndonesiadirectcredits/b 718 783 771 158 130 71 26 50 40 38 38Inrupiah 718 783 771 158 130 71 26 50 40 38 38In foreign exchange 0 0 0 0 0 0 0 0 0 0 0
State banks 55,826 59.861 68.236 71,760 80,010 93480 108925 153.26 220,747 112288 100,941Inrupiah 50,648 52,628 58,133 59,738 68,085 79,394 93,051 113,436 160,113 84,038 70,202In foreign exchange 5,178 7,233 10,103 11,805 11,925 14,086 15,874 39,830 60,634 28,250 30,739
Private national banks/c 34.975 44.452 45.352 63,995 9054 116,886 156.412 176.262 199,931 62.805 75.423In rupiah 31,458 39,467 39,685 55,076 76,506 99,466 130,194 135,475 139,155 46,047 52,696In foreign exchange 3,517 4,985 5,667 8,919 13,998 17,420 26,218 40,787 60,776 16,758 22,727
Foreien banks 6,177 8,512 9.330 34,733 18.366 24.245 27, 48,60 66,748 50.0 50490In rupiah 3,039 3,177 2,889 6,315 8,147 10,016 11,245 12,623 13,850 10,442 11,756In foreign exchange 3,138 5,335 6,441 8,418 10,219 14,229 16,339 35,983 52,898 39,304 44,147
Total 29769 113,608 123.68 150,429 189,010 234.682 292.947 3781844 48766 224,877 232.305In rupiah 85,863 96,055 101,478 121,287 152,868 188,947 234,516 261,584 313,158 140,565 134,692In foreign exchange 11,833 17,553 22,211 29,142 36,142 45,735 58,431 116,600 174,308 84,312 97,613
/a Credits outstanding at end of period. Includes investment credits. Excludes interbank credits, credits to Central Govemment and to non-residents,bridging finance credit, foreign exchange components of project aid, local cost of investment fund accounts and credits extended to bank branches abroad.
/b Excludes liquidity credits, includes credits to Pertamina for repayment for foreign borrowing./c Includes regional gevemment banks.Id As of June 2000.
Source: Bank Indonesia.
Banking credit outstanding share by group of banks 1996 and June 2000 (percent)
1996 2000
PrivateNational PrivateBanks Natonal
* 54% State banka s N45% Banks
.. *. 33%State banks *
Foreign ForeignBanks Banks
9% 22%
72

Table 27. Commercial Banks' Outstandina Investment Credits in Rupiah and Foreign Exchange bv Economic Sector, 1990-2000(Rp. billion)
End of period 1990 1991 1992 1993.0 1994 1995 1996 1997 1998 1999 2000/b
Credits outstanding/a 20734 25748 35.223 42.713 47.136 59.274 70.44 10073 145 1,46 57691 59.242Agriculture 4,520 5,450 7,050 8,730 9,865 10,564 11,737 14,629 17,250 11,615 12,318Mining 373 459 459 310 196 256 405 1,321 2,029 1,329 2,415Manufacturing industry 8,920 10,484 15,416 17,371 19,516 23,159 24,248 35,094 49,801 22,981 21,113Trade 2,157 3,372 4,099 7,192 6,154 8,468 11,891 17,928 24,299 7,107 7,765Servicerenderingindustry 4,307 5,032 7,150 9,110 11,405 16,827 22,162 31,763 48,085 14,659 15,631Others 457 951 1,049 0 0 0 0 0 0 0 0
/a Excludes Small Scale Investment Credits, investment credits to the Central Government and to non resident, bridging finance credit,foreign exchange components of project aid, and local cost of investment fund accounts and credit extended bank branches abroad.
/b As of June 2000.
Source: Bank Indonesia.
Investement Credit Outstanding share by economic sector, 1993, 1996 and 1999 (percent)
1993 1996 1999service Agriculture Agriculture ServiceService Agrnculture 17% 25%
21% _ / 20% Service l lll 1 Agriculturei iN | _ 31% j l _ ilill | l 113_~31 20%
Mining Mining1% ~~~~~~~~~~~~~~~~~~~~1 %Trd
Trae 1% *..Mining
17%~
nnufacturi Trade Manufactuni Manufacturing 17% 34% ng
41% 41%

Table 28. Commercial Banks' Outstanding Funds In Rupiah and Foreign Exchange bv GroUD of Banks. 1990-2000 ia(Rp. billion)
1990 1991 1992 1993 1994 1995 1996 1997 1999 1999 200DJan-Jun
DepositsState Banks 40,638 41,812 52,600 61,684 64,283 75,920 90,434 133,042 271,554 312,179 298,093
Private Banks 33,951 43,143 51,079 67,541 88,925 117,451 164,979 177,193 235,605 252,880 264,351
Regional Development Banks 2.550 3,228 3,697 4,773 6,183 7,812 8,522 8,796 10,932 14,017 15,72SForeignBanks 6,016 6,935 7,474 8,681 11,015 13,581 17,783 38,582 55,433 72,294 79,679
Total 83.155 95,118 114,850 142,679 170A06 214.764 281718 357,613 573,524 651370- 657,851
Share in Total DepositsState Banks 48.9 44.0 45.8 43.2 37.7 35.4 32.1 37.2 47.3 47.9 45.3PrivateBanks 40.8 45.4 44.5 47.3 52.2 54.7 58.6 49.5 41.1 38.8 40.2
Regional Development Banks 3.1 3.4 3.2 3.3 3.6 3.6 3.0 2.5 1.9 2.2 2.4Foreign Banks 7.2 7.3 6.5 6.1 6.5 6.3 6.3 10.8 9.7 11.1 12.1
Total 100.0 100.0 1o0 100.0 100.0 100.0 100.0 100 0 100.0 100.0 100.0
Annual (rowth Rate in DepositsState Banks 36.7 2.9 25.8 17.3 4.2 18.1 19.1 47.1 104.1 15.0Private Banks 72.7 27.1 18.4 32.2 31.7 32.1 40.5 7.4 33.0 7.3Regional Development Banks 52.3 26.6 14.5 29.1 29.5 26.3 9.1 3.2 24.3 28.2ForeignBanks 81.5 15.3 7.8 16.1 26.9 23.3 30.9 117.0 43.7 30.4Total 52 9 14.4 20.7 24.2 19 4 26.0 31.2 26.9 60.4 13.6
/a Demand, time and savings deposits including non resident and central government accounts
Source: Bank Indonesia.
Annual growth rate of total deposit (percent)
140
120
100 - -State Banks
80 -U-- Private Banks
40 ~- - -*Foreign Banks, , \60
10 1
1990 1991 1992 1993 1994 1995 1996 1997 1998 1999

Table 29. Interest Rates 1990-2000(Percent per year)
Time Deposits /a
Year Interbank State bank Private national bank /acall money SBI 1 3 6 12 24 1 3 6 12 24
/a /b mo mos mos mos mos mo mos mos mos mos
1990 14.27 16.2 21.2 20.6 19.4 18.1 18.5 22.6 21.4 20.5 19.8 21.0
1991 14.66 19.3 20.0 21.3 22.3 22.5 21.0 21.8 22.6 23.3 23.4 18.6
1992 11.87 15.8 17.4 18.6 19.8 20.9 21.0 19.2 20.4 21.2 21.7 18.7
1993 8.40 10.4 11.2 10.8 14.3 15.7 18.5 14.8 15.8 16.6 17.1 17.4
1994 9.97 10.4 9.7 9.9 11.6 12.1 14.1 13.6 13.8 13.8 14.0 17.8
1995 13.81 14.2 14.4 13.9 14.8 13.9 14.0 17.4 17.4 17.2 16.0 16.2
1996 14.04 13.8 15.2 14.9 16.3 16.0 15.4 17.5 17.8 17.7 17.3 16.6
1997 29.18 14.7 17.7 17.9 15.3 15.5 15.4 22.0 21.0 17.4 17.2 16.9
1998 63.30 52.0 47.4 38.5 25.6 22.3 15.9 49.7 40.3 26.9 21.4 19.0
1999 22.28 21.9 23.3 25.8 25.2 27.8 17.2 23.7 25.9 24.6 25.4 21.8
2000 /c 9.81 11.2 11.3 12.6 12.9 18.5 13.4 10.7 11.8 12.3 13.9 15.0
/a Weighted average rate. Overnight interest rate on Interbank Call Money tansactions recorded at the Jakarta Clearing House./b Thirty days Bank Indomesia Certificate transactions./c Weighted average rate January - June 2000.
Source: Bank Indonesia.
Private National Bank Time Deposite Yield Curve (percent per year)
70
60 1
50-
40 -
30 -
120 1995
20
1-day 1-mo 3-mos 6-mos 12-mos 24-mos
75

Table 30. Principal Aaricultural Products by Subsectors. 1990-1999(thousand tons)
1990 1991 1992 1993 1994 1995 1996 1997 1998 1999
Food cropsPaddy/a 45,179 44,689 48,240 48,181 46,641 49,744 51,101 49,377 49,200 50,855Corn 6,734 6,256 7,995 6,460 6,869 8,246 9,307 8,771 10,169 9,204Cassava 15,830 15,954 16,516 17,285 15,729 15,441 17,002 15,134 14,696 16,459Sweet potato 1,971 2,039 2,171 2,088 1,845 2,171 2,018 1,847 1,935 1,666Soya beans (shelled) 1,487 1,555 1,870 1,709 1,565 1,680 1,517 1,357 1,306 1,383Peanuts (shelled) 651 652 739 639 632 760 738 688 692 660
FishervSaltwater fish 2,370 2,505 2,692 2,886 3,080 3,293 3,384 3,613 3,490 3,950Freshwater fish 793 807 851 909 900 971 1,069 967 976 1,020
Cash cropsRubber 1,275 1,284 1,399 1,476 1,499 1,573 1,574 1,553 1,661 1,715Coconut/copra 2,332 2,337 2,455 2,588 2,649 2,704 2,761 2,704 2,778 2,789Coffee 413 419 437 439 450 458 459 428 514 511Cloves 66 84 73 67 78 90 89 59 67 68Tea 155 159 154 165 139 154 169 154 167 162Sugar 2,119 2,253 2,307 2,329 2,454 2,077 2,094 2,192 1,488 1,489Tobacco 156 161 112 121 130 140 151 210 105 105Pepper 70 69 65 66 54 59 52 47 65 65Cotton 33 14 13 14 14 8 8 7 6 7Palm oil 2,413 2,658 3,266 4,003 4,008 4,480 4,899 5,380 5,640 5,989
ForestryLog 24,409 25,312 23,892 28,267 26,848 24,027 24,850 26,069 29,520 19,027Sawn Timber 3,919 3,117 3,006 3,534 2,244 1,730 2,014 3,565 2,613 2,707Plywood 8,843 9,415 9,124 9,874 9,924 8,066 9,122 10,270 6,710 7,155
/a Dry husk paddy grain ready for milling./b In millions of liters./c In thousand cubic meters, and in GOI FY, April 1998 - March 1999.
Source: Central Bureau of Statistcs, Ministry of Agriculture, and Ministry of Forestry.
76

Table 31. Production of Malor Crops by Type of Estate. 1990-2000(thousand tons)
1990 1991 1992 1993 1994 1995 1996 1997 1998 1999 2000/a
SmaliholdersRubber 913 919 1,030 1,102 1,139 1,191 1,193 1,174 1,243 1,295 1,324Coconut/copra 2,313 2,317 2,426 2,558 2,601 2,662 2,687 2,620 2,690 2,700 2,688Coffee 384 390 409 410 422 430 436 396 470 466 466Cloves 64 82 70 66 76 88 87 57 65 66 66Tea 31 32 32 37 30 33 34 33 34 34 29Sugar 1,609 1,610 1,653 1,685 1,673 1,368 1,512 1,196 759 760 908Tobacco 152 157 110 119 128 137 148 206 102 102 102Pepper 70 69 65 66 54 59 52 47 64 65 65Cotton 33 13 13 14 14 8 8 7 5 7 5Palm oil 0 0 0 582 839 1,001 1,134 1,293 1,348 1,441 1,503
Private estatesRubber 145 146 163 166 172 182 179 190 226 224 228Coconut/copra 19 20 29 30 27 28 55 63 66 66 67Coffee 13 13 11 12 11 11 10 11 19 19 19Cloves 2 2 2 2 2 2 2 1 2 2 2Tea 29 30 28 33 31 34 39 33 42 40 39Sugar 204 257 178 251 272 287 265 630 424 512 612Tobacco 0 0 0 0 0 0 0 0 0 0 0Pepper 0 0 0 0 0 0 0 0 0 0 0Cotton 0 0 0 0 0 0 0 0 0 0 0Palm oil 789 884 1,077 1,370 1,597 1,864 2,058 2,287 2,435 2,553 2,658
Govemment estatesRubber 217 219 205 208 188 200 202 188 193 196 200Coconut/copra 0 0 0 18 21 15 19 21 22 22 23Coffee 16 16 17 17 18 17 13 21 26 26 26Cloves 0 0 0 0 0 0 0 0 0 0 0Tea 95 97 94 95 78 87 97 88 91 88 83Sugar 306 386 476 394 509 422 317 365 305 217 321Tobacco 4 4 2 2 2 3 3 3 2 2 2Pepper 0 0 0 0 0 0 0 0 0 0 0Cotton 0 0 0 0 0 0 0 0 0 0 0Palm oil 1,624 1,774 2,189 2,051 1,572 1,614 1,707 1,800 1,857 1,995 2,097
/a Projections.
Source: Central Bureau of Statistics and Ministry of Agriculture.
77

Table 32. Rice - Area Harvested, Production and Yield. 1990 - 2000
Area Average Paddy RiceYear harvested yield output output /a Growth
(thd. ha) (tons/ha) (thd. tons) (thd. tons) (%)
1990 10,502 4.30 45,179 29,366 1.0
1991 10,282 4.35 44,689 29,048 -1.1
1992 11,103 4.34 48,240 31,356 7.9
1993 11,013 4.38 48,181 31,318 -0.1
1994 10,734 4.35 46,641 30,317 -3.2
1995 11,439 4.35 49,744 32,334 6.7
1996 11,570 4.42 51,102 33,216 2.7
1997 11,141 4.43 49,377 32,095 -3.4
1998 11,716 4.20 49,200 31,980 -0.4
1999 11,963 4.25 50,855 33,056 3.4
2000 /b 11,523 4.35 50,069 32,545 -1.5
a/ Estimated on the basis of a conversion factor of 0.68 from paddy into rice for theyears prior to 1989, and 0.65 for the years 1989 and after.
b/ Projections.
Source: Central Bureau of Statistics.
Paddy production and average yield
TonsdHa Millon tons
4.5 52
4.4 ~~~~~~~~~~~~~~~50444424.3 48
4.3 ~~~~~~~~*46
42
4.1 -~~~~~~~~~~~~~~4
1990 1991 1992 1993 1994 1995 1996 1997 1998 1999 2000Paddy +- Y1eld /b
78

Table 33. Production of Minerals. 1990 -2000
Petroleum b Tin Copper ore Nickel Iron sand NaturalYear (mln bbls) concentrate concentrate ore Bauxite Coal concentrate Gold Silver gas< -------------------------------- Metric tons - ------ - ------- --- (kg) (kg) (mmscf)
1990 534 30 399 2,217 1,206 10,462 145 9,355 62,158 2,828
1991 581 30 657 2,300 1,406 14,143 173 13,889 77,897 2,462
1992 551 28 907 2,512 804 23,120 288 37,987 99,954 2,583
1993 547 30 928 1,976 1,320 27,605 341 42,097 90,301 2,662
1994 551 31 1,065 2,312 1,342 31,238 335 42,605 107,026 2,942
1995 547 38 1,517 2,513 899 41,517 348 62,818 265,222 2,999
1996 554 51 1,759 3,427 842 47,339 425 83,660 254,893 3,167
1997 549 55 1,841 2,830 809 52,074 487 89,979 270,392 3,189
1998 538 54 2,640 2,737 1,056 60,321 561 124,019 348,974 2,979
1999 495 51 2,904 3,037 1,125 65,277 559 138,110 348,730 3,068
Source: Central Bureau of Statistics.

Table 34. Fuel Production by Company. 1990-1999('thousand bbis)
Crude Oil Condensate Natural gas (000 MSCF)Pertamina Production sharing Contract Pertamina Production sharing Contract Pertamina Production sharing
Contract of Work Contract of Work Contract
1990 24,137 427,447 12,726 187 65,807 157 260,878 1,868,647
1991 24,816 479,698 10,166 192 65,832 135 256,290 2,118,336
1992 24,613 451,912 9,405 109 64,677 132 270,882 2,308,299
1993 27,196 450,736 7,213 54 62,134 97 283,329 2,380,557
1994 23,761 462,694 0 67 64,624 0 300,233 2,644,745
1995 20,656 465,812 0 273 60,155 0 329,675 2,675,683
00 1996 27,251 463,570 0 60 63,042 0 345,193 2,821,427
1997 31,423 454,159 0 95 59,034 0 340,451 2,747,548
1998 43,090 438,565 0 518 55,327 0 338,012 2,641,448
1999 41,161 399,183 0 209 53,972 0 327,584 2,740,238
Source: Directorate General of Oil and Gas.
Crude oil (thousand bbls) Condensate (thousand bbls) Natural gas (thousand MSCF)
600000 70000 3500000
101X60000 3000000
400000 50DD0 2500000
40000 2000000300000
200000 ~~~~~~~~~~~~~~~~~~300 1500000-
100000 200100010000 500000
1990 1991 1992 1993 1994 1995 1996 1997 1998 1999 2000 0*Pertamina 0 Production sharing * Contract 1990 199 1992 1993 1994 1995 1996 1997 1990 1999 20O0 1990 1991 1992 I993 1994 1911996 1997 1998 1999 2000EPertaTmina DProduction sharing EContract E Pertamina EflPrGduction sharing

Table 35. Domestic Sales of Petroleum Products, 1990-1999(thousand bbis.)
1990 1991 1992 1993 1994 1995 1996 1997 1998 1999
Aviation gas 59 58 54 51 50 51 51 46 35 35
Aviation turbo 4,607 4,889 5,315 6,039 10,188 10,969 7,206 7,325 4,980 4,081
Regular gasoline 39,005 43,023 45,308 46,733 52,463 57,798 63,747 67,700 68,576 71,978
Kerosene 49,472 50,573 53,850 54,242 56,110 58,188 61,656 62,302 63,407 74,550
Motor diesel 72,950 80,837 92,061 104,460 100,730 106,755 119,138 i36,509 122,967 125,942
Industrial diesel 10,720 10,806 11,318 11,445 11,174 10,069 8,679 8,821 7,950 9,491
Fuel oil 24,847 28,899 29,313 30,154 25,456 25,543 24,524 31,607 32,681 33,935
Total 202,707 219.085 237.219 253.124 256.171 269,373 285.000 314.311 300,594 320,013
Source: Ministry of Mines and Energy, Directorate General Oil and Gas.
Gasoline and motor diesel sales (thousand bbls) Kerosene and Industrial diesel sales (thousand bbis)
150000 80000
125000 - 60000 -
100000~~~~~~~~~~~~~~400
40000 -
750000 ,
25000 1990 1992 1994 1996 1998
- - - Regular gasoline v-Motor diesel -X-Kerosene -Industrial diesel

Table 36. Domestic Prices of Petroleum Products.1986 - 2000(Rp./liter)
Apr-i, 1985- Jul-10, 1986- May-25, 1990- Jul-l1, 1991- Jan-8, 1993- May-5, 1998- May-16, 1998- Oct-2000-Jul-9, 1986 May-24, 1990 Jul-10, 1991 Jan-7, 1993 May-4, 1998 May-16, 1998 Sep-2000 Present
Aviation gas 330 300 330 400 420 600 /b /b
Aviation turbo 330 300 330 400 250 600 /b lb
Premium gasoline 440 440 /a /a /a /a /a /a
Regular gasoline 385 385 450 550 700 1,200 1,000 1,150
Kerosene 165 165 190 220 280 350 280 350ootN)
Motor diesel 242 200 245 300 380 600 550 600
Industrial diesel 220 200 235 285 360 350 350 400
Fuel oil 220 220 220 220 240 350 350 350
/a Discontinued since May 20, 1990/b No longer regulated by the government since May 16, 2000
Source: Ministry of Mines and Energy, Directorate General Oil and Gas.

Table 37. Indonesia Wholesale Price Index. 1990-2000 la(1983 = 100) /b
Sectors lb 1990 1991 1992 1993 1994 1995 1996 1997 1998 i 1998 1999 2000/c
Agriculture (44) 191 206 225 251 298 355 400 445 750 298 410 447
Mining& quarrying (6) 169 188 201 218 237 266 296 318 396 173 214 229
Manufacturing (140) 176 194 206 218 231 256 265 275 455 217 268 273
Imports(53) 191 201 208 211 215 230 243 261 598 286 289 303
Exoorts (38) 159 153 159 157 157 178 203 238 592 417 366 422Excluding petroleum gas (34) 195 203 212 223 255 298 306 353 994 444 370 390Petroleum (4) 148 139 143 137 128 142 173 204 474 348 355 547
General index (281) 178 187 197 204 215 240 259 282 568 288 320 347General index excluding exports (243) 185 199 210 221 235 261 280 298 560 250 298 312General index excluding exports ofpetroleum (224) 182 198 211 227 250 285 303 326 588 284 311 322
00/a Figures show the average for the year./b 1998 - present based on 1993=100./c Average index of the first semester 2000.
Source: Central Bureau of statistics.
Wholesale price index of agriculture, mining and manufacturing sectors Wholesale price index of non-oil export and import commodities1993=100 1993=100
500 480
450 -.
400-/ 3803- 80
350 - /. '
300 - ^/.280
250 -~2 wl
200-
150 - 180
100
1990 1992 1994 1996 1998 2000e-Agriculture - - Mining ad Quarrying 1990 1992 1994 1996 1998 2000
Manufacturing +Import -* -Non-oil export

Table 38. Consumer Price Index. 1990 - 2000 la /b
End of Foodstuff Housing Clothing Education Prepared food Health Transport and Others Total Changeperiod and beverages Communication (percent) /c
1990 109.3 107.8 111.2 - - - - 112.37 112.42 5.6
1991 118.3 128.2 117.1 - - - - 126.68 123.02 9.4
1992 127.4 136.8 124.1 - - - 137.65 131.85 7.2
1993 136.3 154.9 135.7 - - - - 150.71 145.07 10.0
1994 151.1 170.1 144.5 - - - - 158.31 157.42 8.5
1995 171.2 185.1 153.8 - - - - 168.40 172.27 9.4
1996 187.4 194.8 164.2 - - - - 184.60 185.92 7.9
1997 /b 108.66 105.22 105.47 104.23 108.52 109.12 103.70 - 106.15 6.1
1998 209.22 173.93 141.72 191.66 179.50 147.02 145.09 - 168.23 58.5
1999 261.53 215.93 164.76 230.74 218.10 165.33 169.37 - 202.79 20.5
2000/c 250.44 171.58 241.93 173.41 223.88 224.53 177.87 - 206.65 2.1
/a Consumer price index average of the year/b Before 1997 using base period (April 1988-March 1989 = 100). Starting 1997 using new base period (1996=100), and classified into 7 components/c Average index of the first semester 2000.
Source: Central Bureau of Statistics.
Domestic inflation - 12 month percent change in consumer Real food prices index
and food price index
115 2,4j Cookingoil Flour
90- , , 200
65 A 025Prke
40 ,tic
15-
-10 8- , . ._
Jan-97 Jul-97 Jan-98 Jul-98 Jan-99 Jul-99 Jan-00 Jul-00 Jan-97 Jul-97 Jan-98 Jul-98 Jan-99 Jul-99 Jan-00
84

Table 39. Approved Foreiqn Investment by Sector. 1990-2000 /a(US$ million)
Sector 1990 1991 1992 1993 1994 1995 1996 1997 1998 1999 2000 /b
Agriculture 117 4 138 690 1153 1306 437 965 413 17
Forestry 20 1 138 22 0 0 136 0 0 9 5
Fisher 20 11 28 0 40 231 80 27 33 70 10
Mining & guarryin2 116 0 2.312 0 0 0 1697 2 0 14 0
Manufacturin 5s822 3.970 5.669 3.423 18[739 30.441 1984 23017 8.388 6.929 824
Food 99 382 213 141 1,235 1,332 691 573 342 681 127
Textiles&leather 1,094 532 591 419 396 471 515 373 217 240 235
00 Wood & wood products 218 62 34 50 68 263 101 70 71 113 39
Paper&paperproducts 730 822 686 202 5,120 2,540 2,907 5,353 41 1,412 18
Chemicals & Pharmaceutical 1,991 923 2,342 1,171 7,743 19,368 7,362 12,376 6,179 3,268 200
Nonmetallicminerals 125 133 841 98 632 289 793 1,457 237 11o 8
Basic metals 825 197 47 186 2,082 292 651 357 394 501 32
Metal products 460 856 863 1,114 1,423 2,258 2,939 2,332 891 593 165
Others 281 62 52 42 40 3,628 3,925 127 17 10 2
Construction 77 26 41 97 77 206 297 307 198 153 27
Hotels 874 4.019 919 394 344 999 1.717 463 451 229 12
Transport & commnunications 803 167 14 85 145 5,539 695 5.900 79 103 103
Real estateand business services 902 570 1.136 3,292 3.604 1.314 4.076 1.398 1,271 179 54
Total 9.493 8.934 1j 8,144 23.724 .231 29.929 3 3 8.133 1.233
/a Intended Capital Investment. Amount represents original approvals plus expansions minus cancellations./b Preliminary data January to June 2000.
Source: Investment Coordinating Board.

Table 40. Approved Domestic Investment by Sector. 1990-2000 /a(Rp billion)
Sector 1990 1991 1992 1993 1994 1995 1996 1997 1998 1999 2000 /b
Agriculture, fisheryand livestock 6A442 3.468 1.952 2,835 7,140 82 16026 14.642 4.772 1.659 245
Forestry 593 310 534 258 262 1.476 46 166 543 749 0
Mining 155 182 236 69 112 205 460 126 116 174 245
Manufacturine 39.850 27,624 19.079 24.037 31933 43.2 62.703 79.334 44.90 46.745 6,999Textiles 12,561 3,646 2,546 3,539 5,518 7,177 3,366 6,831 1,138 2,562 1,533Chemicals 7,894 8,425 3,299 7,689 5,150 8,740 13,335 22,497 15,583 2,480 701Electrical goods 0 0 0 5 12 620 3,486 11,639 3,469 70 1,143
00 Other manufacturing 19,395 15,553 13,235 12,804 21,253 27,425 42,517 38,367 24,718 41,633 2,448
Construction 87 275 215 187 731 848 1.550 877 1.992 395 344
Hotels 4.703 3 895 3.115 3,051 4.342 3.792 5.019 2.588 1.150 1.380 4
Real estate 1.783 2.633 536 3.049 3336 4.659 8688 4.301 .54S 996 226
Others 2,898 1.785 3,675 5.965 5.434 6.290 6.224 15.251 4570 72 941
Total 561 41,078 29.342 39.450 2S 69.53 100.715 119.87 6 53.549 9.003
/a Figures refer to intended capital investments, and represent original approvals plus approved expansion minus cancellations./b Preliminary data January to June 2000.
Source: lnvestment Coordinating Board.