report no. 15808-mor kingdom of morocco impact evaluation ... · report no. 15808-mor kingdom of...
TRANSCRIPT
Report No. 15808-MOR
Kingdom of Morocco Impact Evaluation Report Socioeconomic influence of Kurd Roads Fourth Highway Project !I O~II L.?S-LM( )iii
June 28,1996
0 !
Document of the World Bank

Currency Equivalents
Currency Unit = Dirham (Dh) US$I = 8.63 Dh
Abbreviations and Acronyms
douors DRCR GDP HDM MLSS MPW qx SUNABEL voc
Hamlet or section of a larger village Directorate of Road and Road Traffic Gross Domestic Product Highway Design Mode9 Morocco Living Standards Survey Ministry of Public. Works 100 Kilograms Sugar Factory Vehicle Operating Costs

The World Bank waahington, O.C. 20433
U.S.A.
OmCe of the Dkector-General Opedons Evaluahn
June 28,1996
MEMORANDUM TO THE EXECUTIVE DIRECTORS AND THE PRESIDENT
suB3EcT: Impact Evaluation Report on Morocco Sxioeconomic Influence of Rural Roads Fourth Highway Project (Loan 22%MOR)
Attached is the Impact Evaluation Report (IER) on the Morocco Fourth Highway project (Loan 2254, approved in FY 83). The main objective of the impact evaluation was to understand the impact of rural roads, five to ten years after completion of the improvements carried out under the project. The study focused on impacts on: (i) transport infrastructure and services; (ii) agriculture; (iii) social services; and (iv) the environment. The impact study also assessed the economic benefits of the improvements and their sustainability. The study focused on four of the ten rural roads improved under the project; the sample roads were geographically distributed in the North, Center and Center-South of the country to represent a variety of climate, agricultural, and economic conditions. The study was conducted during 1995.
The impact study compared present conditions in the areas of project roads to the situation prior to the improvements, and to conditions in comparison roads located nearby and which were not subject to improvements during the project period. The study’s main finding is that the benefits of paving rural roads extend considerably beyond making traffic easier, lowering the cost of operating cars, trucks and other vehicles, and improving the quality of transport services. The extended benefits include triggering major changes in the agricultural economy, including higher outputs; transformation of the agricultural output mix, for example, from low-value cereals to high-value fruit orchards; increased use of modem inputs, especially fertilizers. Improved access to health and education facilities increased enrollment rates in rural education as well as frequency of visits to health care services, and allowed to recruit professional personnel to staff schools and health facilities. The biggest impact was on girls’ enrollment in primary education, which more than trebled in the project zones during the study period. Women also benefited as the existence of paved roads sharply increased the affordability of butane for cooking and heating, dramatically reducing women’s daily chores for the collection of fuelwood. In preparing the IER, surveys were conducted at the household and village levels, followed by focus groups in each of the villages covered by the study. In January 1996, as part of the preparation of the study’s final report, an OED mission, together with personnel from the Ministry of Public Works, attended meetings in the road areas which included local officials from all economic sectors as well as elected, county-level representatives. These meetings were essential to interpret data and draw conclusions.
The study also showed that economic benefits were substantial, resulting in satisfactory economic returns, and that the investments were not premature. The transport, agriculture, and social impacts are likely to be sustainable.
/
Attachment


1
Contents
Preface ............................................................................................................................................. 3 Evaluation Summary ....................................................................................................................... 5
1. The Project and the Socioeconomic Setting ........................................................................... 9
Fourth Roads Project: Rural Roads Component ....................................................................... 9
2. Study Methodology ................................................................................................................. 11
Hypotheses for Testing ........................................................................................................... 11 Selection of Project and Control Roads .................................................................................. 12
Characteristics of the Roads (Map IBRD 27809) ............................................................ 12 Comparison Between Project and Control Zones and Over Time .......................................... 14 Other Methodological Aspects ................................................................................................ 15
3. Impact on Transport Infrastructure and Services .............................................................. 17
Rationale for the Impact .......................................................................................................... 15 Key Features of Morocco’s Road Transport System ............................................................... 17
Road Conditions Before the Project ................................................................................. 18 Main Findings ......................................................................................................................... 18
Traffic: National Trends .................................................................................................. 18 Traffic: Project Roads ...................................................................................................... 19 Transport Costs and Services ........................................................................................... 19 Motorization ..................................................................................................................... 20 Improved Access to Market and Services ........................................................................ 21 Household Transport Expenditures .................................................................................. 22
4. Impact ou Agriculture.. .............. ;. .......................................................................................... 23
Rationale for the Impact .......................................................................................................... 23 Key Features of the Sector ..................................................................................................... .23
Main Findings ......................................................................................................................... 24 Other Related Economic Impacts ............................................................................................ 27
5. Impact on Social Services ....................................................................................................... 29
Rationale for the Impact .......................................................................................................... 29 Accessibility to Social Services ............................................................................................... 29 Education 29 . .................................................................................................................................
Key Features of the Sector ................................................................................................ 29 Main Findings ................................................................................................................... 30
.
This report was prepared by Mr. Heman Levy (Task Manager), in collaboration with Mrs. Claudine Voyadzis (Consultant) with input by Mr. Claudio Volonte (Consultant). Mrs. Maqvonne Mauprivez provided administrative assistance. Local consultants-Morocco Trade and Development Services (MTDS)-prepared an interim assessment. The report was issued by the Infrastructure and Energy Division (Mr. Yves Albouy, Chief), of the Operations Evaluation Department (Mr. Francisco Aguirre-Sacasa, Director).
2
He&h ........................ ..~...........................................................................................~.........~ ...... 33 Key Features of the Sector ................................................................................................ 33 Main Findings ................................................................................................................... 33
Impact on Women ................................................................................................................... 36 Rationale for the Impact ................................................................................................... 36 Gender Indicators: A National Perspective ..................................................................... 36 Main Findings ........................................................................................................ 37
Other Impacts .......................................................................................................................... 38
6. Impact on the Environment ................................................................................................... 41
Expected Impacts .................................................................................................................... 41 Main findings .......................................................................................................................... 41
Types of Impacts ............................................................................................................... 41
7. Economic Analysis .................................................................................................................. 45
Economic Analysis at Project Appraisal ................................................................................. 45 Findings of Importance to Economic Analysis ....................................................................... 45 Project Benefits ....................................................................................................................... 46
Traffic ............................................................................................................................... 46 Design of Rural Roads ...................................................................................................... 49
8. Sustainability of the Impacts ................................................................................................. 51
The Roads ............................................................. ..~~................................~....................; ......... 51 The Socioeconomic Impacts ................................................................................................... 52
9. Conclusions and Recommendations ....................................................................................... 55
Conclusions ............................................................................................................................. 55 Recommendations ................................................................................................................... 57
Annexes
A. Study Hypotheses .................................................................................................................... 59 B. National Trends in Agriculture, Roads, Health, and Education ............................................. .6 I C. Study Methodology ................................................................................................................. 65 D. Survey Results Aggregated by Region, Project and Control Zones, 1985-1995 ................... .68
E. Calculation of Agricultural Value-Added, Northern Region (Chefchaouen) ........................ -80
F. Economic Analysis of Road Improvements ............................................................................ 83 G. Summary of Impacts ................................................................................................................ 86
Bibliography
Maps IBRD Nos. 21809 and 27810
Preface
This is an Impact Evaluation Report (IER) of rural roads fmanced under the Bank’s Fourth Highway Project (Loan 2254-MOR, for US$SS million, approved in March 1983 and closed in December 1990) in Morocco. This evaluation aims to understand the impact of rural roads on transport infrastructure and services, as well as on the region’s economy and social welfa, five to ten years after completion of the improvements carried out under the project.
Two main reasons prompted the Operations Evaluation Department (OED) to undertake this study. First, rural roads account for a significant proportion of Bank clients’ rural infrastructure programs, and of Bank lending for roads, thus, better understanding of the impact of these operations would be of wide interest. Second, Morocco has launched a large program to improve rural roads, and the Government expressed strong support for conducting the study. In addition, the study would be of interest to countries that are undergoing fast urbanization and that are seeking to better comprehend the cost-effectiveness of infrastructure investments to improve living conditions in the rural milieu.
The study was started in Morocco in January 1995, with the recruitment of a team of local consultants. A study launch workshop in May 1995, attended by central and local government officials, the consultants, and OED staff, initiated the field work. Subsequent OED missions to Morocco reviewed, together with the Ministry of Publics Works’ Road Directorate (MPWRD), the progress in the consultants’ work, and discussed with central and provincial and county-level officials the study’s findings.
The study selected for analysis four out of the ten roads whose paving was financed by the project. These four roads, located in three distinct regions of Morocco-Northern, Central and Central-Southern-were chosen to maximize diversity in agro-climatic conditions, economic characteristics of the zones, and economic function of the roads. For each project road, a control road, located nearby, was selected, which had not been subject to improvement during the study period. Socioeconomic data for the project and the control roads was collected mainly through live types of surveys, of which three were at household and village levels, one at provincial level for public works, and one at local level for agriculture. In addition, focus groups were carried out in each of the villages covered by the study. Once the interim consultants’ report was ready, an OED/MPWRD mission conducted meetings in the field in January I996 that included representatives from all economic sectors and elected county-level representatives; these meetings were essential to interpret data and to refine or correct the consultants’ findings.
Copies of the draft IER were sent to the relevant Government officials and agencies concerned for their review and comments. No comments were received.


5
Evaluation Summary
Background
1. Despite sustained urbanization through the 1980s and 199Os, about 50 percent of Morocco’s population remains rural. Rural inhabitants have benefited less from the country’s economic growth over the last decade than urban dwellers. A result is that over 70 percent of the poor population lives in rural areas. Consequent with its objectives to improve the welfare of its rural population, the Government is launching a plan of road investments for the period 1996- 2000 that aims to improve or pave 10,000 kilometers of rural roads. This report, by examining the results after several years of operation of a rural road component included in a broader road project financed by the Bank (the Fourth Highway Project, approved in March 1983), seeks to understand the impacts that emanate from improving rural roads, and how they filter beyond the physical investment to the agricultural economy and the social sectors. The intention is to derive lessons that can help Morocco and other countries better assess the long-term value of investing in rural roads.
Methodology
2. This study assesses the impact of paving and other improvements (completed between 1987 and 199 1) to four rural roads located in three different regions of Morocco: North, Center and South. As ti starting point, the study formulated four sets of hypotheses about the impacts of the road improvements: (i) direct impact on transport infrastructure and services; (ii) impact on the agricultural economy; (iii) impact on the social sectors such as health and education; and (iv) impact on the environment.
3. To test tbase hypotheses, the study utilized two types of analyses: first, for each of the roads considered, it compared current conditions with those before the investments and, second, it compared conditions in the project road relative to a control road which did not benefit from improvements over the period of the study. Data was obtained from extensive surveys conducted at the farm, regional and village levels, and focus groups discussions at these levels helped interpret the data. A monitoring system prepared by consultants under the road project, intended to provide a large set of indicators, was not put in place as public works officials doubted its cost-effectiveness.
4. A study hmitation is that since comparison roads were judgmentally selected at the end of the project because they had no improvements over the study period, we cannot definitively attribute changes in the communities studied to road improvements. The communities near improved roads may have been systematically different from those in areas where the roads were not improved. For example, communities near improved roads may have been targeted for other improvements. In addition, the sample is not generalizable. We believe, however, that viewed as case studies, the four improved roads and the four unimproved roads offer useful illustrations of some of the impacts of road improvements.
Impact on Transport Infrastructure and Services
5. All four roads studied were improved from an originally deteriorated gravel or unengineered track condition to an asphalt surface (mostly 4-meter paved width). The
6
most direct impact was elimination of frequent road closures during rainy periods, as the improved roads are open to traffic year-round. The road users benefited in several other ways: the cost of operating vehicles hopped, leading to lower prices for freight and passengers services than in roads that were not improved. TrafEc on project roads increased at rates higher than before the improvement, and comprised a bigger proportion of larger, more efficient trucks. The supply of road passenger services increased substantially, especially share-ride taxis offering frequent service, whereas in the past the only service was a rural bus offering as little as one run a day. Ownership of motorized vehicles increased, both of cars and trucks. The access time by the rural population to markets and social services fell drastically. In some cases, the time to access county and village administrative ofIices, agricultural extension personnel, health centers and rural markets, was cut by at least 50 percent. This improvement was a result of both better roads and new facilities, whose construction was made possible in part by the roads.
Impact on Agriculture
6. The study found that in the road project areas overall levels of agricultural activity increased in volume of production, productivity of the land, and monetary values of the output. The agricultural production mix was transformed as farmers were able to shift land from low value cereals to high value fruit orchards, which yield higher profits, thanks to the reduction in perishability risks brought about by the better quality and year-round operability of the improved roads. In two of the three study regions, land used for vegetables and fruits increased over 40 percent over the study period. Livestock production shifted towards pure breed cows, also a higher yield activity. The use of modem agricultural inputs, especially fertilizers, increased as improved transport made distribution channels better. Use of agricultural extension services by the small farms increased by more than four times over the study period. The shift to higher value products, combined with improved yields for traditional crops, raised the value added per unit of cultivated land.
7. Improvements in the agricultural economy led to related economic changes in workloads, employment on farm and establishment of new shops; these changes followed different patterns depending on the region. Off-farm employment grew overall by more than six times in the project zones (compared to about three times in the control zones) and happened across all three regions. The study found that agricultural practices in the control zones, which did not benefit from improved roads, remain essentially the same today as a decade ago.
Impact on Social Services
8. The surveys showed that while enrollment in primary education increased throughout all areas covered by the study, the gains in the areas served by the project roads, where enrollment more than doubled between 1985 and 1995, was much higher than in the control roads. In parallel, the quality of education improved, as it became possible to recruit teachers to staffthe schools, and absenteeism of both teachers and students dropped. The rural population also nearly doubled their use of health care facilities (hospital and primary care), and, similarly to education, the quality of health services was enhanced as the supply of medicines improved, health officials launched a campaign to staff rural health care centers with a doctor, and immunization and other health prevention programs became easier to implement.
9. Some of the social impacts were especially large for women: girls’ enrollment in primary education trebled over the period; expanded or new maternal and child care programs were made available and accessible, and the introduction of butane at affordable prices thanks to the existence of paved roads dramatically reduced women’s chores of daily collection of fuelwood for cooking and heating. Rural-urban interaction increased several-fold in the two directions: urban dwellers visiting their rural relatives, and farm household members visiting cities.
Impact on the Environment
10. Changes in transport conditions and in the agricultural economy had both negative and positive impacts on the environment although, overall, no environmentally sensitive areas were at risk by the road projects, which did not involve new construction. Negative impacts were those resulting from the increased traffic and economic activity, especially air and noise pollution and road accidents, and the increased used of fertilizers and other chemicals which in all likelihood contaminated the water table. Positive impacts resulted in part from the transformation of the agricultural economy, notably curtailment of extensive goat and sheep herding-that damages the soil cover -and increased tree plantations, and from broader use of butane substituting for fuelwood, whose demand is larger than the size of Morocco’s sustainable forests.
Economic Analysis
11. The improvements in the agricultural economy and in access to social services translated into increases in the roads’ traffic levels at rates substantially higher than on unpaved rural roads. The study quantified the economic benefits accruing to road users in the form of savings in vehicle operating costs compared to the original, unpaved roads, and the economic gains resulting from people and freight being able to move at any time, without the risk of road closures. Social impacts, although real, could not be isolated for attribution to the road investment and were not quantified in the analysis.
12. The economic returns as well as the timing of the improvements for all project roads were found to be satisfactory (economic rates of return ranging between 16 and 30 percent). Even under a worse case scenario assuming lower traffic growth and reduced benefits from operating costs savings, the returns would have remained acceptable. The benefits from the investments are expected to accrue to farmers in the form of expanded use of commercial freight services substituting for non-motorized carriage of loads, including operation of heavier, more efficient trucks. The rural population in the roads’ areas is expected to benefit mainly by the availability at affordable prices of frequent services by share-ride taxis.
13. Although some of the benefits appeared to be dependent on paved surfaces and the economic returns are satisfactory, this does not ensure that paving was an optimal economic solution, compared, for example, to rehabilitating the roads to a gravel surface maintained at a good standard.
Sustainability of Benefits
14. Historic trends showing steady traffic growth over long periods on Morocco’s paved roads, even during drought years when agricultural prodaction fell, suggest that the stream of
8
benefits is likely to be sustainable. The main issue is route 603 which currently, seven years after completion of the works and in part because traffic reached unexpectedly high levels, is in poor condition. While improvement of this road is included under the MPWs maintenance program for 1994- 1998, inadequate budgetary allocations for road maintenance raise uncertainty about the level of benefits on this road over the long-term. The transformation and improvement of the agricultural economy is based on sound business decisions and is likely to be sustained, with the possible exception of the sugar beet planting in the North (a small component of traffic on route 603) which is uneconomic and may lose market depending on the outcome of the privatization program for the state-owned sugar factories. The gains in agriculture are also dependent on government trade and fiscal policies, and as well as the access of Moroccan produce to European Union markets. The sustainability of the social service impacts appear as likely in view of the high value assigned to them by the direct beneficiaries and because of government policies and the increased funding it is allocating to improve social services.
Recommendations
15. The following recommendations are offered:
(a) Establish a practical rural road monitoring system. In the current program to pave 10,000 km of rural roads, an effective monitoring system could be set up with the following characteristics: (i) comprise a small number of road, agriculture and social sector indicators; (ii) arrange for each type of indicator to be collected by the respective sectoral, local-level authority, maybe once every two or three years; (iii) integrate the collection of agricultural and social indicators in the annual surveys carried out by these sectors; (iv) arrange for local authorities, ideally with assistance by a university, to compile the data into a single report for each selected road, and disseminate the report to local and central authorities
(b) [ncrsaue local community participation in rural roads through: (i) exchanges such as “village meetings”, at the planning stage, to ensure that road plans are properly and timely taken into account within the planning of all local-level activities, and (ii) for road maintenance, by direct participation of local stakeholders in the funding allocation for this activity, through, for example, the establishment of local “road boards”.
(cj Consider and require if cost-effective, the introduction of mitigation measures such as education campaigns and road signs to reduce and or prevent the likely increase in road accidents and their consequences, resulting from the increased traflic levels and speeds when rural roads are paved.
(d) Consider adopting identification and evaluation methodologies based on multi-criteria indicators for rural roads that: (i) combine a minimum acceptable economic return with well defined social sector (mainly education and health) objectives and with social sectors investments integrated in local government budgets, or, (ii) for very low traffic levels and for a small part of the budget for rural roads (20 percent is a good practice), apply multi-criteria based solely on attaining social objectives represented by well-defined indicators.
(e) Reassess the optimal pavement width for rural roads and compare with rehabilitation to gravel surface maintained in good standards. The very latest version of the Bank’s Highway Design Model (HDM) model allows to conduct this kind of analysis.

9
1. The Project and the Socioeconomic Setting
Despite sustained urbanization through the 1980s and 1990.x about 50 percent of Morocco’s population remains rural. Rural inhabitants have I eceived less beneftsjCom the country’s economic growth over the last decade than urban dwellers. A result is that over 7Opercent of all poor live in rural areas. The government, through investments in rural roads, combined with other intastructure and social programs, is making eflorts to improve the lot of the rural population. A new plan of road investments for the period 19964000 aims to improve or pave 10,000 kilometers of rural roads This report, by examining the medium-term results of a rural roadcomponent included in a larger roadproject financed by the Bank in the mid-1980s seeks to understand the impacts that emanate from improving rural roads and how they filter beyond the physical investment to the agricultural economy and the social sectors. The intention is to derive lessons that can heb Morocco and other countries better assess the value of investing in rural roads.
1.1 Morocco is situated on the extreme Northwestern comer of Africa, with a land mass exceeding 700,000 square kilometers, and combined Atlantic-Mediterranean coast lines which total almost 3,500 km in length. In 1995, the population is estimated to have reached 28 million inhabitants, of which and over 50% live in urban areas. Per capita income is estimated at approximately US$l,200.
1.2 Since its independence in 1956, Morocco has, as a response to climatic uncertainty, placed significant priority on the development of irrigated agriculture, and has invested substantial resources in an ambitious dam construction program and improving performance in the industrial crops sector, especially sugar, vegetable oil, cereals, dairy, and livestock. In addition to its commitment to food self-sufftciency, Morocco devotes substantial resources to the mineral industry and is the world leader in phosphate exports (13 million tons annually). Despite these efforts, Morocco’s commercial deficit has continued to widen and reached 29 million Dh in 1994.
1.3 Beginning in the 1980’s, Morocco undertook impressive steps to implement a World Bank-IMF coordinated program of structural adjustment. The main objectives of this effort, now largely implemented, included reducing the gap between the demand and supply of goods and services, decreasing the budget deficit, and encouraging exports. The central government committed itself to a greater delegation of activities from the public to the private sector and decentralization of responsibility to local government. At the same time as it addressed fundamental macro-economic reforms, Morocco pursued broad programs designed to improve socioeconomic welfare in rural areas.
1.4 For administrative purposes, Morocco is divided into 7 regions and 43 provinces. The present study concerns three different regions: the North-West Region, the Center Region, and tbe Tensif Region, located in the central-southern part of the country.
Fourth Higbway Project: Rural Roads Component
1.5 Concern for improving rural roads dates from the mid- 1970’s when Morocco’s Ministry of Public Works commissioned a study to identify 8,000 km of rural roads in need of construction and/or upgrading. These efforts were reflected in the preparation of the 198 l- 1985 Development Plan. A key objective of this plan was to “...improve and expand the provincial
10
road network to help alleviate rural poverty”. The Government and the World Bank agreed to include in the Fourth Highway project, besides ‘improvements in the national highway system and construction of the Rabat-Casablanca freeway, a major investment in secondary and tertiary rural roads. An important aim of the Fourth Project to be attained through the rural roads it helped finance was to” . ..to help reduce income disparities between regions”.
1.6 The Fourth Roads Project contained a specific study designed to develop a methodology to measure the impact on agriculture of provincial (rural) road improvements. It was expected that such methodology could later help improve the methods used to identify rural roads with the greatest potential for agricultural and socioeconomic impact. The consultant’s report (1989) recommended the establishment of a system for monitoring the impact of rural roads, and included some 40 indicators covering different aspects. The system was, however, not implemented, as government authorities had strong doubts that the cost of setting up and maintaining such monitoring system would bring commensurate benefits.
1.7 The government recently established a 5-year program (1996-2000) with a target to improve and pave 10,000 km of rural roads. An on-going World Bank highway project is expected to help finance 1,000 km under this program. The Direction des Routes has undertaken to screen, identify and evaluate such routes, and is interested in designing a cost-effective system for monitoring rural roads. The present study will provide timely inputs to that effort.
11
2. study Methodology
This study assesses the impact ofpaving and other improvements to four rural roads located in three dgerent regions of Morocco: North, Center and Ten.@ (Center-South). As a starting point, the studyformulatedfour sets of hypotheses about the impacts of the road improvements: (i) direct impact on transport infrastructure and services; (ii) improvements in the agricultural economy: (iii) impacts on the social sectors such as health and education; and (iv) impact on the environment.
To test these hypotheses, this study utilized two types of analyses: first, for each of the roaa3 considered, a comparison of current conditions with those before the investments, and, second, a comparison of conditions in the project road relative to a control road which did not benefit from improvements over the period of the study. &ten&e surveys conducted at the farm, regional and village levels allowed the coNection of the data requiredfor this analysis, and
focus groups discussions at these levels helped interpret the data
Hypotheses for Testing
2.1 A starting point for the design of the study was the development of hypotheses on the socioeconomic impact of rural roads. Such approach is a standard procedure in OED’s infrastructure impact studies. The formulation of relevant hypotheses was based on the direct experience of OED staff and consultants on rural road projects, and on the review of literature (e.g., World Bank appraisal reports of rural road projects and relevant OED audit reports as well as studies prepared by the United States Agency for International Development and the Inter- American Development Bank). The range of impacts of transport investments is best described by the quotation below, which served as a framework for the formulation of the study hypotheses.
“Transportplays a key role in getting land into production, in marketing agricultural commodities, and in making forest and mineral wealth accessible. It is a signi@cantfactor in the development of industry, in the expansion of trade, in the conduct of health and education programs, and in the exchange of ideas” I.
2.2
1.
2.
3.
4.
2.3
The study team developed four categories of hypotheses:
hypotheses dealing with the direct impact on the quality of the roads, and their related effects on traffic level and composition and on the road services offered; hypotheses dealing with improvements in the agricultural economy in zones benefiting from project road construction ; hypotheses dealing with improvements of socio-economic indicators (as measured at the farm, village and regional levels); and hypotheses dealing with the impact of project road construction on the environment.
These hypotheses and the associated socio-economic indicators developed by the study team to test the validity of each of the hypotheses are further detailed in Annex A, as well as in the respective chapters of this report.
’ Owens, W., 1964. Strutegyfor Mobili@. The Brooking Institute: Washington, D.C.

12
Selection of Project and Control Roads
2.4 In order to measure changes in socio-economic indicators, the study team selected a sample comprising four of the ten roads which had received funding under the Fourth Roads Project. The four roads, one in the North (North-West Region, LaracheKhefchaouen areas), one in the Center (Central Region, Settat area), and two in the Tensift Region (MarrakecWChichaoua areas in Morocco’s central-southern area) were chosen to maximize diversity in agro-climatic zone, economic character of the zone, and function of the road. To simplify the presentation in this report, these areas are labeled as North, Center and South.
2.5 During the preparation and appraisal of the Fourth Project, Moroccan officials and consultants had selected a control road for each of the roads targeted for improvement. In its review of these potential control roads, the study team, OED and Directorate of Road and Road Trafftc staff reviewed the appropriateness of retaining the corresponding control roads for the four roads selected for this study. For three of the four control roads, it was determined that the initial selections could no longer serve effectively as control roads. In these cases, the control roads themselves had undergone improvement since the beginning of the project or were so different in character (e.g., transit or local function; type of terrain; agro-climatic conditions) that before-after comparisons would be meaningless. Table 2.1 summarizes the project and control roads ultimately used in this study.
Table 2. I Roads Selected for the Impact Study
NO. Area/Province Project Road Initial Control Road Alternative Control Rd.
1 North/Larache RS- 603 CT 8305 C-l 8203
2 Center/Settat CT 1427 CT 1411 Not required
3 South/I-Iaouz CT 63G7 CT 6402 CT 6029
4 South/ Chichaoua CT 6308 CT 6403 CT 6457B
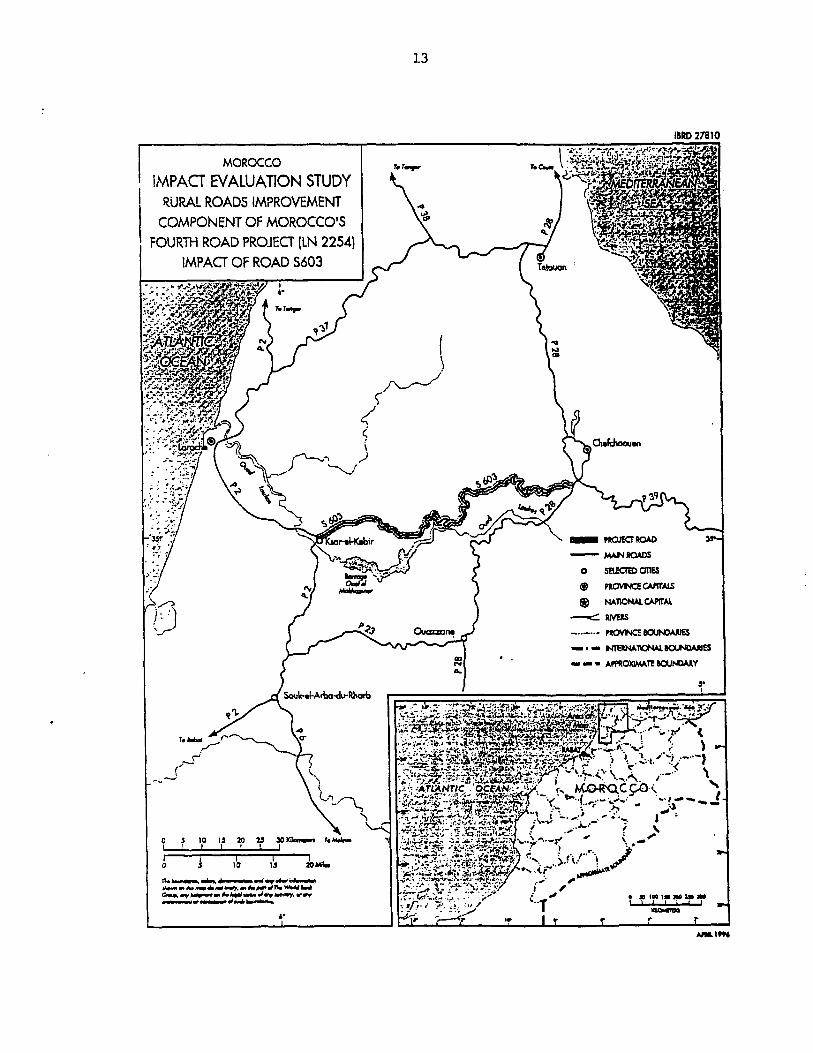
Characteristics of the Roads (Map IBRD 27809)
2.6 North: Route RS 603, located approximately 200 km Northwest of Rabat, cuts across the Larache and Chefchaouen provincial boundary (with the majority of the 95 km road in Larache province), serving as a link road between two rural towns, Ksar-el-Kebir and Derdara. Improvement works began in 1987 along kilometers l-30 and 43-60. The section kilometers 30- 43 was completed in 1991. For most of its length, the road is 4 meters in width, except for the first 13.5 kilometers, where its width is 5.5 meters. The zone of influence is characterized by higher than normal rainfall (over 800 mm), steep slopes along the Rif mountain range, high rates of erosion, with agriculture as the dominant economic activity.
2.7 Instead of maintaining CT 8305 as a control, a road which had experienced improvement along 10 kilometers did not serve a similar link function, and traversed significantly different type terrain and agro-climates, the team selected an alternative control road, CT 8203, which
13
MOROCCO
iMPAcT EVALUATION STUDY I WRA!. ROADS IMPROVEMENT
COMPONENT OF MOROCCO’S FOURTH ROAD PROJECI’ (LN 2254)
IMPACT OF ROAD S603 _
14
remained an unimproved track but did serve a similar link function and traversed similar terrain and agro-climates. -
2.8 Center: Road CT 1427 in Settat province directly South of Casablanca, also serves a link function, joining El Bourouj and Oued Zem along a 30 km distance. The 36 km control road CT 1411, which links Dar Chaffai with Guisser, has remained in an unimproved state (“&at de piste”) and traverses similar terrain and agro-climate as CT 1427 and, as a result, was maintained for the analysis.
2.9 The zone of influence of CT 1427 is dramatically different from that of RS 603 in Chefchaouen, with poor agricultural resources (land, surface water), and limited rainfall (less than 300 mm yearly). The major agricultural activity of the resident population revolves around extensive sheep grazing. The major economic activity in the region is centered in mining, primarily phosphates. As a result, the economic character of the zone has evolved much more towards commerce and merchandise exchange rather than agricultural forms of activity.
2.10 South: In the Tensift region South of Casablanca, two roads were selected, CT 6307 in the Haouz province, linking Amizmiz to Adassil along a length of 42 kilometers of which 13.4 kilometers were improved during the Fourth Roads Project (to a 4 meter width), and CT 6308, in the Chichaoua province, a 13.4 kilometer road (width of 4 meters) which provides access to the population of Eborg. As in Settat Province, the agricultural economy does not benefit from favorable land and water resources. Because there are few alternatives to agricultural economic activity, there is a greater emphasis than in Settat on dryland cereals, particularly barley and dairy production,
2.11 The roads selected in 1984 as control roads for CT’s 6307 and 6308 experienced improvement in the intervening year. Instead the team selected CT’s 6029, linking Tnine Oudaya to Moulay Brahim along a length of 43 kms. and CT 6457B, an access road linking Souk el Had with Mejjat along a length of 15 kms. Both these roads remained in an unimproved state at the time of this study.
Comparisons Between Project and Control Zones and Over Time
2.12 Several factors call for caution in the comparison of impact results between the control and the project zones:
a) The concept of control. The study team put special emphasis to select control roads which had not been the subject of improvements during the project period, and which were geographically near the project road. The control roads thus selected best simulated the “without project” situation to assess the net impact of the investment.
b) Baseline data. While an intention existed at the start of the project to collect baseline data, and most of such data was defined, in practice no data was collected, neither in the project roads nor m the original control zones. Thus, in order to recreate baseline data, retrospective questions were included in surveys. However, the recall ability, 10 years
15
later, may be highly unreliable for some indicators, for example, those requiring a quantitative assessment, such as visits to health services by members of a household. Other indicators, especially those pertaining to benchmark events of an either/or type (e.g., whether a particular type of service was available or not at the time, or whether a facility existed or not), may be recalled with a higher level of precision.
c) A study limitation is that since comparison roads were judgmentally selected at the end of the project because they had no improvements over the study period, we cannot definitively attribute changes in the communities studied to road improvements. The communities near improved roads may have been systematically different from those in areas where the roads were not improved. For example, communities near improved roads may have been targeted for other improvements. In addition, the sample is not generalizable. We believe, however, that viewed as case studies, the four improved roads and the four unimproved roads offer useful illustrations of some of the impacts of road improvements.
2.13 Since, as suggested above, the reliability of 1995 data is higher than that for 1985, this report gives priority in the analysis of impacts to comparisons between project and control in 1995, with references to 1985 generally used in a second order.
2.14 In addition to the comparison of the project with the control zones, information is provided about national trends in the areas where the impacts were assessed (Annex B). This information is limited due to the scarcity of time series covering the whole period under study, as a number of national statistics were either started or discontinued during this period. In particular, it was not possible to prepare regional trends in the project’s areas relevant to the type of impacts to be measured; such trends would have provided an additional basis to clarify the attribution of impacts in relation to the road improvements.
2.15 A last caveat refers to the weather, and its influence on agricultural and socio-economic conditions. During the IO-year period under study, Morocco experienced periods of drought, when traditional agricultural production, notable cereals, fell sharply. The latest agricultural statistics, which were used in this report, were for the year 1993/1994, a year when rainfall was above normal. Thus, comparison of agricultural output with earlier years is somewhat distorted. However, for other aspects of the agricultural economy, as well as for other socio-economic impacts, rainfall conditions are immaterial to the analysis.
Other Methodological Aspects
2.16 The design of the questionnaire, the selection of the survey sample (at village, household and farm levels), the study launch workshop, and data collection and analysis are described in Annex C. Aggregated survey results by region are presented in Annex D.
2.17 In preparing the survey, a special effort was made to generate information that would allow to isolate the impact on gender. Also, the household data was stratified by farm size, as it was anticipated that this variable could be a significant determinant of some impacts.
2.18 One study limitation is that, while it was a stated objective of the project to reduce local income disparities, the causal links between trafftc changes and incomes could not be firmed up
16
because the roads sample is smal1 and there are many factors exogenous to road improvements which must be controlled for.
_.
2.19 Finally, another important limitation is acknowledged: in selecting unimproved roads as c~u~trols, the methodology focuses on the impact of road improvement but not on the question of whether and to what extent cchieving this improvement with Bank’s help, rather than without it, makes a difference. Thus, the sutdy answers important questions about the nature, magnitude and sustainability of impacts from one project in the Bank portfolio; but, it cannot answer questions about the effectiveness of the Banks intervention relative to other ones.
17
3- Impact on Transport Infrastructure and Services
AIlfour roads studied were improved@om an originally deteriorated gravel or unengineered track condition to an asphalt surface. The most direct impact was year-round operation of the roads, eliminatingfiequent road closures during rainy periods. The road users benefited in other ways: as a result of the better road surface, cost of operating vehicles dropped, leading to lower prices for>eight andpassengers than those on roads that were not improved. Trafic on project roads increased at rates higher than before the improvement, and comprised a bigger proportion of larger, more efficient trucks. The supply of road passenger services increased substantially, especially share-ride taxis offeringfiequent service, whereas in the past the on/y service was a rural bus ofleering as little as one service run a day. Ownership of motorized vehicles increased, both of cars and trucks. The access time by the rural population to markets and social services was drastically cut: in some cases, such as access to county and village administrative offices, to agricultural extension personnel, to health centers and to rural markets, the time to reach these services was reduced by at least 50 percent. This improvement was the result of both better roads and new facilites, whose construction was made possible in part by the roads.
Rationale for the Impact
3.1 The project was intended to have a direct impact on the quality of road conditions. This was expected to reduce the operating costs of vehicles, to allow motorized and larger vehicles to operate at all times, and to make road maintenance easier. In turn, such effects could be expected to stimulate the provision of more commercial transport services to the project’s areas, and in some cases, the improved roads could become alternative routes for use by long-distance traffic. A complementary effect expected was improved access by the population to markets and social services reducing time and costs, and ensuring access under all weather conditions.
Key Features of Morocco’s Road Transport System*
3.2 Morocco’s road system comprises about 58,000 km of classified roads, of which about 28,000 are paved. The quality of the network is uneven, notably regarding pavement width: in only 1,500 km do pavement widths exceed seven meters, or the equivalent of two conventional lanes; in 16,000 km, the width is 6 meters or less, and in 20 percent of the network, the paved width is 4 meters (barely more than one conventional 3.5 meter lane) or less. In addition, there are some 30,000 km of unpaved, mostly rural roads.
3.3 Inter-urban bus and truck services are operated mainly by private companies and cooperatives. About one third of road freight is carried in small trucks (less than 8 ton net weight), which operate mostly in the rural areas, although these trucks also do substantial long- distance hauls. Inter-urban road passenger services is mainly by large buses, but collective, large taxis (mostly diesel-powered Mercedes) have become increasingly popular in the last year; nationally, taxis account for some 15 percent of the passengers carried. However, in many rural areas, such taxis are the prevailing mode of transport.
__ ’ World Bank, 1991. Kingdom ojhforocco-Trunsporf Sector Strutegv Paper. World Bank, Middle East and North Africa Region, Wnsbingtun, DC.

18
Road Conditions Before the Project
3.4 Overall, road conditions at the time of project appraisal in 1982 were characterized by low levels of traffic, poor road surface and periods of road closure, as described in Table 3.1.
Table 3.1 Road Conditions in 1982, Before Project
Region Road Tra@ Surface Periods of Road Closure (veMdrry)
North 603 40 Center 1427 150 south 6307108 54
gravel, poor condition about 90 days unengineered track’ about 60 days
gravel, poor condition during rainy season
Main Findings
3.5 All four roads were improved to an asphalt surface. The improvements were completed in the following dates: route 603 in 1987, route 1427 in 1988 and routes 6307 and 6308 in 1991. Traffic on all roads increased substantially after construction, although there were significant differences in the growth rates among the roads (Table 3.2). The better road surface, and improvements in road alignments, substantially reduced the cost of operating vehicles; at the same time, road closures were practically eliminated.
3.6 In 1995. road conditions were as follows:
Table 3.2. Road Conditions in 1995, After Project
Region Road TrafJic Tra#k growth Surface Period of Road (veh/d’ayl (?//year, since 1982) Closure
North 603 640 23.8% bitumen, 4-5.5m nil Center 1427 27.5 4.8% bitumen, 4 m nil south 630716308 192 10.3% bitumen, 4 m nil
Trafic: National Trends
3.7 Road transport in Morocco measured in vehicIe-kilometers over the network has grown at an average 4.4 percent per year since 1982 through today. Growth accelerated to over eight percent since the later years of the 1980s. This growth was mostly due to an increase in the vehicle fleet and to more intensive utilization of vehicles. The road network itself grew little: during the 1 O-year period 1984- 1994, the length of the overall road network increased by only 10 percent (or less than one percent per year on average), The highest expansion in the length of the network, percentage-wise, at 13 percent, occurred in the tertiary network, which comprises most rural roads and which carry low traffic (Annex B).
’ Mar~c Setec, 1982. Feasibilily srudy Evaluation Economique dim 4eme Pr@t Routier. M~KIC Setec, Sctec Economic.
’ ‘A I’etat de piste’.
19
Trafic: Project Roa+
3.8 North: Chefchaouen - Route 603. As noted above, the roads studied in this report experienced different rates of traffic growth. The most striking case is Route 603, where traffic grew at an average annual rate almost five times as big as that of the national network as a whole over the same period. This high growth is explained by the location and role of this route. It connects two major population centers, Ksar-el-Kebir and Chefchaouen; in addition, the improved road became an attractive route to two other major centers in the area of Ksar-el-Kebir, I arache to the North and Souk-el-Arba-du-Rharb to the South. Prior to the improvement of route 603, its poor condition required drivers to use an alternative route (Provincial Road 28), south of route 603. In some cases, this practically doubled the distance: for example, Ksar-el- Kebir to Chefchaouen is 86 km via route 603,150 km via PR 28. Thus, after the improvement, Route 603 ceased to be purely a rural road, and became an important road for long-distance travel (see map in next page).
3.9 Center: Settat - Route 1427. Traffic grew at about the average for the national network. This route is located in an area with a higher road density network than route 603, and this is partly the re:lson why this road generated a lower trafIic increase than the Northern project road. However, since 1982 to 1987, year when the improvements were completed, traflic growth on the unpaved road is likely to have been in the order of two percent per year. This indicates that since completion of the improvements, traffic growth accelerated.
3.10 South: Marrakech - Routes 6307/6308. Traffic increased at a high rate on this road, mainly because of its poor condition prior to the improvement, and because after the improvement the road took a transit function for long-distance traffic which was not originally foreseen.
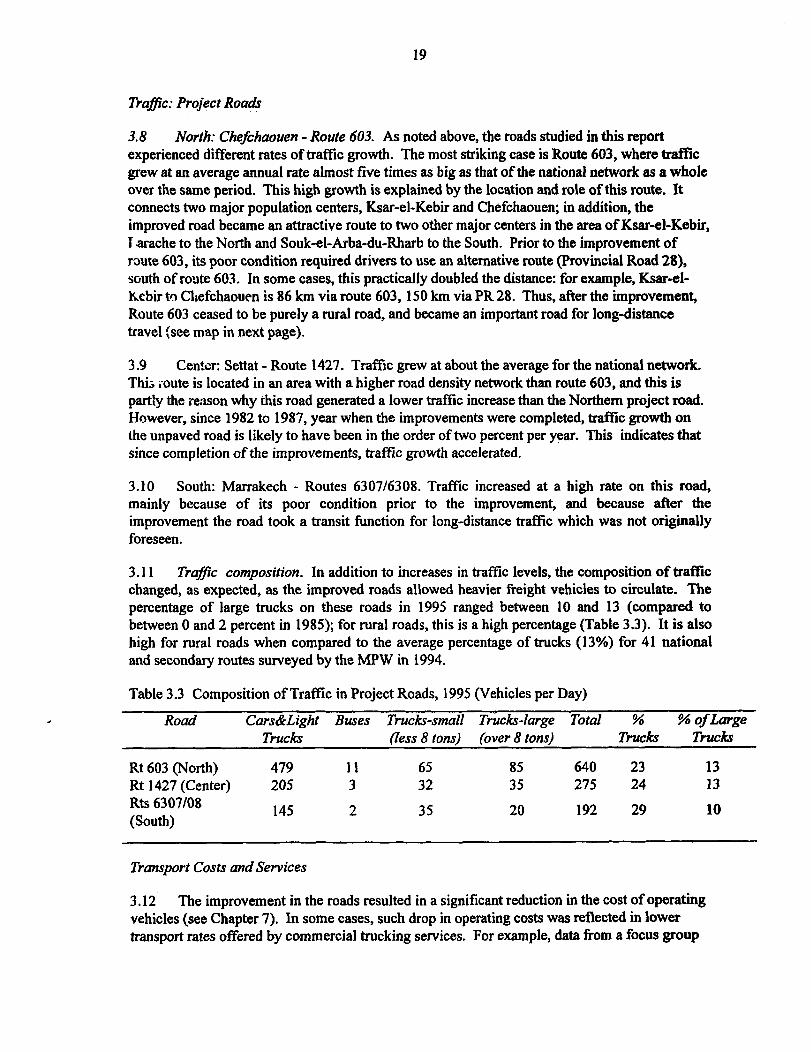
3.11 TrafJic composition. In addition to increases in traffic levels, the composition of traffic changed, as expected, as the improved roads allowed heavier freight vehicles to circulate. The percentage of large trucks on these roads in 1995 ranged between 10 and 13 (compared to between 0 and 2 percent in 1985); for rural roads, this is a high percentage (Table 3.3). It is also high for rural roads when compared to the average percentage of trucks (13%) for 41 national and secondary routes surveyed by the MPW in 1994.
Table 3.3 Composition of Traffic in Project Roads, 1995 (Vehicles per Day)
Road Cars&Light Buses Trucks-small Trticblarge Total % % of Large TrucRr (less 8 tons) (over 8 tons) Trucks Tnrcks
Rt 603 (North) 479 11 65 85 640 23 13 Rt 1427 (Center) 205 3 32 35 275 24 13 Rts 6307108 (South)
145 2 35 20 192 29 10
Transport Costs and Services
3.12’ The improvement in the roads resulted in a significant reduction in the cost of operating vehicles (see Chapter 7). In some cases, such drop in operating costs was reflected in lower transport rates offered by commercial trucking services. For example, data from a focus group
20
for routes 6307/6308 indicates that the rate for a truckload of merchandise between two population centers some 10 km apart (between Amizmis and one of the “douars” ‘of the Assif AI Ma1 county) went down from 300 Dh before the project to less than 150 Dh once the road was improved. In some cases, the reduction in the price of transport services paid by the local population was purely due to the better surface condition, which resulted on lower operating costs of the vehicle circulating on them. In other cases, such as the case of Chefchaouen mentioned above, transport prices decreased for many road users because a new road alternative became attractive that was substantially shorter in distance than the alternative existing road.
3.13 Another benefit was an increase in the quality and frequency of commercial transport services. For example, focus groups reported that on routes 6307/6308, prior to the improvement of the road the only passenger service was a daily run of a rural bus. Today, a fleet of some 40 collective taxis serve these roads, with a frequency of several taxis per hour.
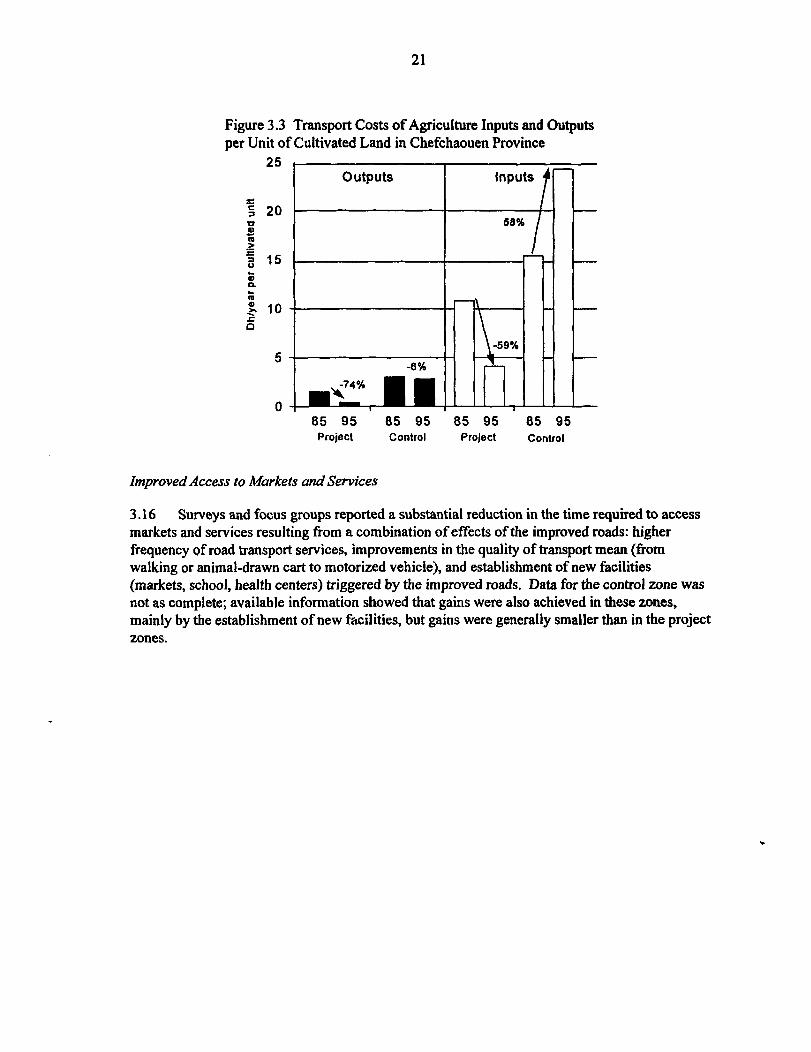
3.14 Survey data also revealed that annual transport costs per unit of cultivated area (expressed in current Dh) of farming inputs (fertilizers, herbicides, seeds) decreased drastically in the project area of Chefchaouen province (no information is available for the other two provinces) compared to the control areas. The annual transport cost of agricultural products to markets decreased in both the project and the control areas between 1985 and 1995, but the gains are substantially greater in the project than in the control areas (Figure 3.1).
Motorization
3.15 Overall, ownership of motor vehicles in the project zones increased. Ownership of cars increased about 3 times, reaching in 1995 one car per every 10 farms, compared to one car per every 30 farms in the control zone. Regionally, the largest increase happened in Set-tat, where many Moroccans residing in Europe bring cars on their visits home. Ownership of trucks followed a similar pattern, increasing in the project areas by about three fold, to reach in 1995 one truck for every 11 farms, compared to no change in the control zones, where truck ownership remained close to zero.
’ In Morocco’s regional administrative system, the “do&’ is the lowest level unit in the rural areas. A douar generally comprises anywhere upwards of some 50 agricultural units.
21
Figure 3.3 Transport Costs of Agriculture Inputs and Outputs per Unit of Cultivated Land in Chefchaouen Province
25 outputs Inputs
tn
85 95 85 95 85 95 85 95 Project Control Project Control
Improved Access to Markets and Services
3 .I 6 Surveys and focus groups reported a substantial reduction in the time required to access markets and services resulting from a combination of effects of the improved roads: higher frequency of road transport services, improvements in the quality of transport mean (from walking or animal-drawn cart to motorized vehicle), and establishment of new facilities (markets, school, health centers) triggered by the improved roads. Data for the control zone was not as complete; available information showed that gains were also achieved in these zones, mainly by the establishment of new facilities, but gains were generally smaller than in the project zones.
22
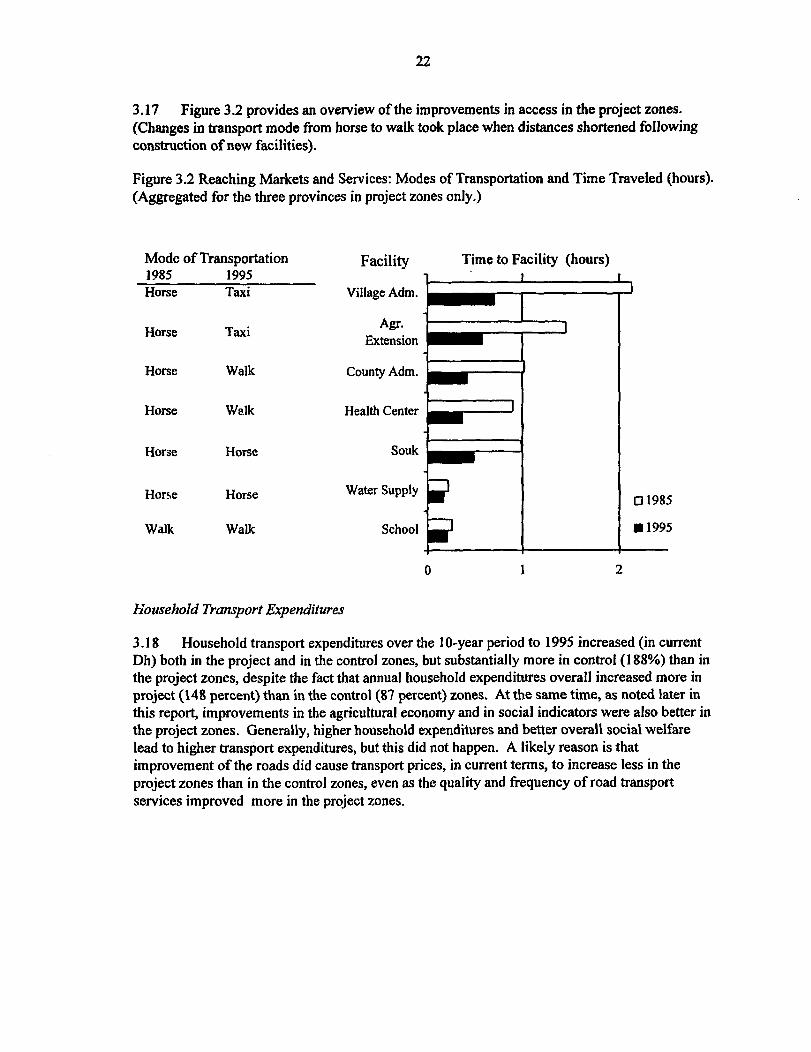
3.17 Figure 3.2 provides an overview of the improvements in access in the project zones. (Changes in transport mode from horse to walk took place when distances shortened following construction of new facilities).
Figure 3.2 Reaching Markets and Services: Modes of Transportation and Time Traveled (hours). (Aggregated for the three provinces in project zones only.)
Mode of Transportation 1985 1995 Horse Taxi
Horse
Horse
Horse
Taxi
Walk
Walk
Horse Horse Souk
Horse
Walk
Horse
Walk
Facility
Village Adm.
Agr. Extension
County Adm.
Health Center
Water Supply
School
Time to FaciIity (hours)
0 1985
D 1995
0 1 2
hiousehold Transport Expenditures
3.18 Household transport expenditures over the 1 O-year period to 1995 increased (in current Dh) both in the project and in the control zones, but substantially more in control (188%) than in the project zones, despite the fact that annual household expenditures overall increased more in project (148 percent) than in the control (87 percent) zones. At the same time, as noted later in this report, improvements in the agricultural economy and in social indicators were also better in the project zones. Generally, higher household expenditures and better overall social welfare lead to higher transport expenditures, but this did not happen. A likely reason is that improvement of the roads did cause transport prices, in current terms, to increase less in the project zones than in the control zones, even as the quality and frequency of road transport services improved more in the project zones.
23
4. Impact on Agriculture
The study found that overall levels of agricultwal activity increased in volume ofproduction, productivity of the land, and monetary values of the ourput. The agricultural production mix was transformed, as farmers shifted land use from low value cereals to high value fruit orchards, which yield higher profits, thanks to the reduction in perishability risk brought about by the belter quality and year-round operability of the improved roads. In two of the three study regions, land usedfor vegetables cndj%t~ increased over 4Opercent. Livestock production shlyed towards pure breed cows, following the trend toward more profitable investmenb. The use of modern agriculurat inputs, especially fertilizers, increased as improved transport made distribution channels better. Use oj*a@cultural extension services by smallfanns increased by more than four times over the study period. The shift to higher value products, combined with improved yields for traditional crops, raised the value addedper unit of cultivated land. Improvemenls in the agricultural economy led to related economic changes in workloads, employment in farms and establishment of new shops; these changes followed diflerent patterns depending on the region. Off-farm employment grew overall by more than six times in the project zones (compared to about three times in the control zones) and happened across all three regions. The study found that agricultural practices in the control zones, which did not benefin porn improved roads, remain essentially the same as a decade ago.
Rationale for the Impact
4.1 The road improvements, especially their projected year-round use operability and substantially lower costs of operating freight and passenger vehicles, were expected to benefit the agriculture economy in the projects’ area through higher farm-gate prices; lower costs of delivering productive inputs (fertilizers, insecticides, seeds, etc.); cheaper and more reliable availability of trucking services and, better accessibility to agriculture extension services. In turn, these effects were expected to lead to transformation of the agricultural output mix towards higher-value but perishable produce and to increases in the amount of planted area.
Key Features of the Sectol-6
4.2 Despite a high growth rate of urbanizaton during the 80s of about 4.8 percent per year the rural population in Morocco remains high, close to 50%,. Over 70% of all poor live in rural areas. Currently, agriculture contributes close to one quarter of the GDP, 40 percent of the employment, and 30 percent of the exports. Thus, agriculture is a vital sector, both from the social and the economic viewpoints.
4.3 Most agricultural lands are rainfed. Irrigated areas are only some 12 percent of total cultivable land. It is estimated that the potential for further expanding irrigation is limited, probably no more than by 20 percent of the existing irrigated areas. Tee potential for extensive agriculture is practically nil, as already lands of marginal value for agriculture are being cultivated. Thus, increasing the efficiency in the use of land is essential for the development of Moroccan agriculture.
6 Most of the information in this section is based on World Bank, 1994. Kingdom of Morocco - Agricultwuf Secfor Sfrutegy Puper
(Yellow Cover). Middle East and North Africa Region, The World Bank. Washington, D.C.
24
Main Findings . . .-/._
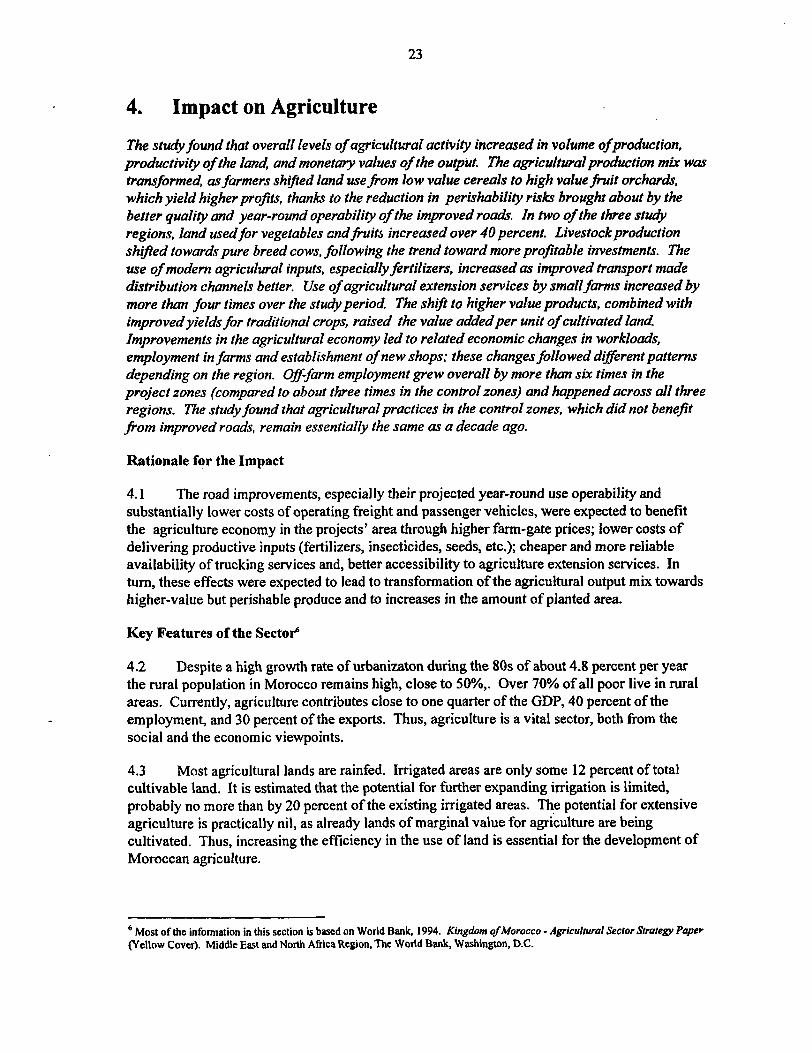
4.4 The roads opened between~ 1987 and 199 1. The latest agricultural data available is from surveys done in 1995. Data prior to road opening was obtained for 1985. Information collected for these two years’ reveals significant changes over the 1 O-year period, in the areas where the roads were improved. The latest completed agricultural year at the time of the survey was 1993- 1994, when there was above-normal rainfall, and thus higher than average agricultural output, especially for grains.’
4.5 The overaIl level of agricultural activity increased (Figure 4.1). Yields for the main crops increased in all three project zones. The most notable increase happened in fruit orchards, which, on average for the three zones, passed from 13.3 qx per hectare in 1985 to 17.4 qx per hectare in 1995, or a 3 1 percent increase during the period. These increases can be traced to improved seeds that require irrigation, and which the roads, that became passable practically year-round once the works were completed, made possible; the improved roads encouraged farmers to invest in on-farm irrigation, such as wells and pumps. Cereals yields also increased significantly, but such improvements are more difficult to attribute to changed economic conditions in the project zones, since cereal yields were influenced by the above average rainfall in 1993-1994.
Figure 4.1 Changes in Agricultural Productivity (Output per Unit of Cultivated Land) in Project Areas Between 1985 and 1995 (percentage change)
Fruit Trees
High Value Vegetables
Cereals
20% 40% 60% 80%
percent changes between 1965 and 1995
’ Based on agricultural statistics and suwey data
‘ It was not possible to obtain agricultural data at the ioad project level for earlier years, which would have permitted to calculate more normal values (e.g, three year averages) of productior levels. However, the comparisons with the control zones allow to take this factor into account.
25
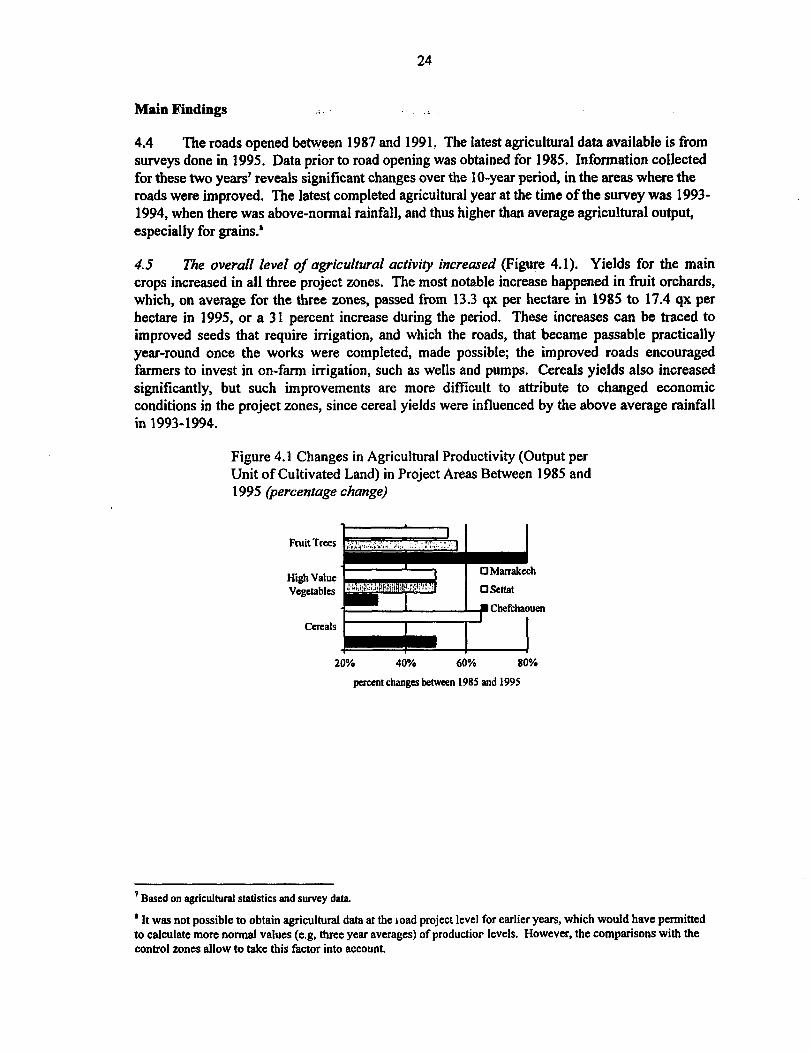
4.6 The agriculture production mix was substantially transformed (Figure 4.2). This was due mainly to an overall decrease in the land made available for low value agriculture, especially cereals and livestock production, combined with increased land available for the cultivation of high-value irrigated vegetables and fruits. The amount of land used for fruit plantation increased in all three zones: eight percent in Marrakech, and 42 percent in Chefchaouen and in Settat. Land used for high-value vegetables increased in Settat and Marrakech; however, it decreased in Chefchaouen mainly due to a shift to industrial sugar beet production, which also generated higher incomes for the farmers (Box 4.1).
Figure 4.2 Changes in Agricultural Land Use (Hectares per Type of Use) in Project Areas Between 1985 and 1995 (percentage change)
I
OMamkcch
0 settat
l Ckfchaouen
I 0% 50% 100% 150%
percent changm behvecn 1985 and I 995
Box 4.1. Introduction of New Crops
Cultivation of sugar beets in Chefchaouen is an example of the influence of improved roads on the introduction of new crops. Planting of sugar beets was introduced in the region during construction of a dam and putting in place an irrigation system in the Loukos area. However, collecting and distributing the crops was expensive and risky in view of the poor condition of the roads. Near the village of Tatouft, only 4 farmers produced sugar beets in 1985. As route 603 was improved, 90 percent of the farmers located close to the road (about 150 farmers) were producing sugar beet in 1995. Cultivation of sugar beet and other industrial crops, while yielding higher profits for the farmers, are intensive in labor use, and generated substantial on- farm employment.
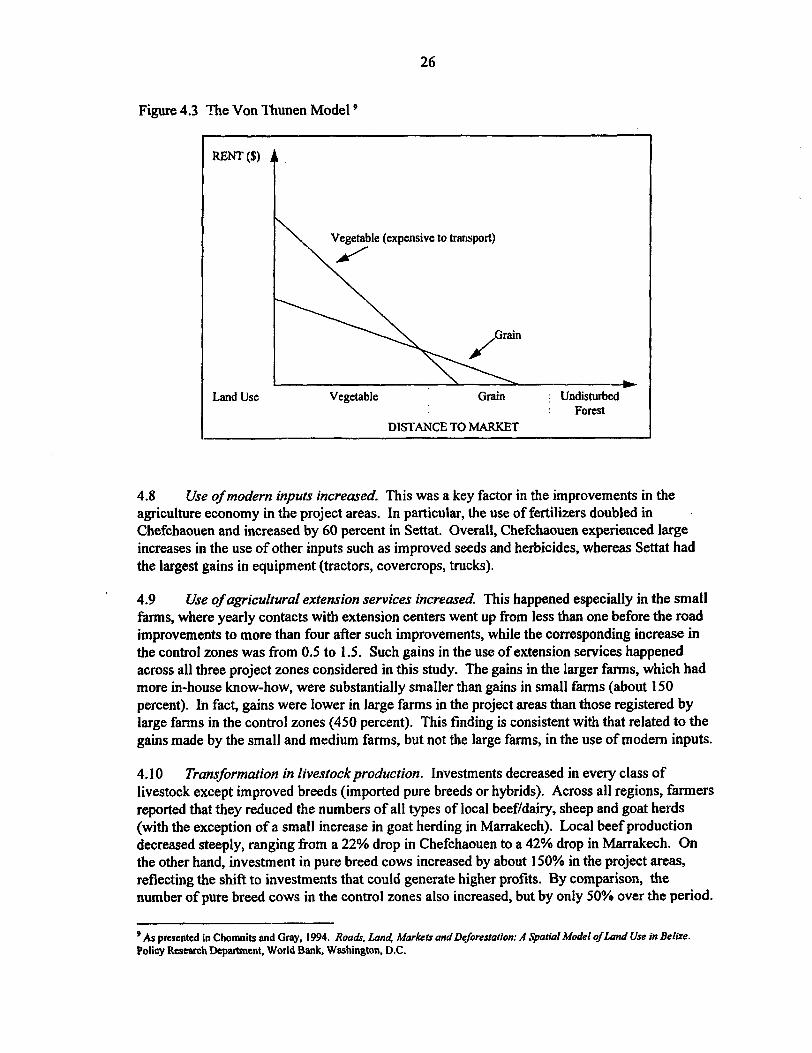
4.7 The transformation of the agricultural economy followed the well known Von Thunen model (Figure 4.3). In this model, the “economic” distance to market is reduced as roads are improved, encouraging farmers to substitute grains by vegetables, which yield higher profits but due to their perishability require reliable and speedy transport.
26
Figure 4.3 The Von Thunen Model ’
Vegetable (expensive to transport)
Land Use Vegetable Grain ; Undisturbed
DISTANCE TO MARKF.T Forest
4.8 Use of modern inputs increased. This was a key factor in the improvements in the agriculture economy in the project areas. In particular, the use of fertilizers doubled in . Chefchaouen and increased by 60 percent in Settat. Overall, Chefchaouen experienced large increases in the use of other inputs such as improved seeds and herbicides, whereas Settat had the largest gains in equipment (tractors, covercrops, trucks).
4.9 Use of agricultural extension services increased This happened especially in the small farms, where yearly contacts with extension centers went up from less than one before the road improvements to more than four after such improvements, while the corresponding increase in the control zones was from 0.5 to 1.5. Such gains in the use of extension services happened across all three project zones considered in this study. The gains in the larger farms, which had more in-house know-how, were substantially smaller than gains in small farms (about 150 percent). In fact, gains were lower in large farms in the project areas than those registered by large farms in the control zones (450 percent). This finding is consistent with that related-to the gains made by the small and medium farms, but not the large farms, in the use of modem inputs.
4.10 Transformation in livestockproduction. Investments decreased in every class of livestock except improved breeds (imported pure breeds or hybrids). Across all regions, farmers reported that they reduced the numbers of all types of local beef/dairy, sheep and goat herds (with the exception of a small increase in goat herding in Marrakech). Local beef production decreased steeply, ranging from a 22% drop in Chefchaouen to a 42% drop in Marrakech. On the other hand, investment in pure breed cows increased by about 150% in the project areas, reflecting the shift to investments that could generate higher profits. By comparison, the number of pure breed cows in the control zones also increased, but by only 50% over the period.
9 As presented in Chomnits and Gray. 1994. Roadr. Lund, Markets andDefores~ation: A Sjmtial Model of Lund Use in Belize. Policy Research Department, World Bank. Washington, D.C.
27
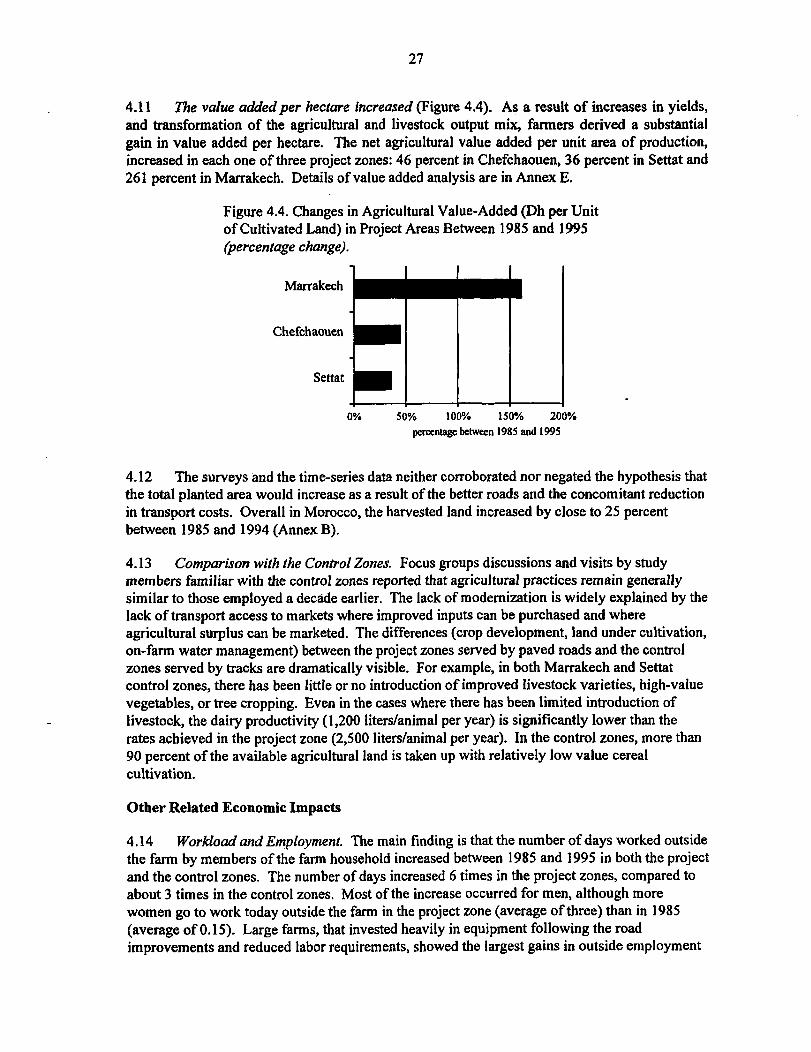
4.11 The vaiue added per hectare increased (Figure 4.4). As a result of increases in yields, and transformation of the agricultural and livestock output mix, farmers derived a substantial gain in value added per hectare. The net agricultural value added per unit area of production, increased in each one of three project zones: 46 percent in Chefchaouen, 36 percent in Settat and 261 percent in Marrakech. Details of value added analysis are in Annex E.
Figure 4.4. Changes in Agricultural Value-Added (Dh per Unit of Cultivated Land) in Project Areas Between 1985 and 1995 (percentage change).
Marrakech
Chefchaouen
Settat
50% 100% 150% 200%
perantage bchveen 1985 and I995
4.12 The surveys and the time-series data neither corroborated nor negated the hypothesis that the total planted area would increase as a result of the better roads and the concomitant reduction in transport costs. Overall in Morocco, the harvested land increased by close to 25 percent between 1985 and 1994 (Annex B).
4.13 Comparison with the Control Zones. Focus groups discussions and visits by study members familiar with the control zones reported that agricultural practices remain generally similar to those employed a decade earlier. The lack of modernization is widely explained by the lack of transport access to markets where improved inputs can be purchased and where agricultural surplus can be marketed. The differences (crop development, land under cultivation, on-farm water management) between the project zones served by paved roads and the control zones served by tracks are dramatically visible. For example, in both Marrakech and Settat control zones, there has been little or no introduction of improved livestock varieties, high-value vegetables, or tree cropping. Even in the cases where there has been limited introduction of livestock, the dairy productivity (1,200 liters/animal per year) is significantly lower than the rates achieved in the project zone (2,500 liters/animal per year). In the control zones, more than 90 percent of the available agricultural land is taken up with relatively low value cereal cultivation.
Other Related Economic Impacts
4.14 Workload and Employment. The main finding is that the number of days worked outside the farm by members of the farm household increased between 1985 and 1995 in both the project and the control zones. The number of days increased 6 times in the project zones, compared to about 3 times in the control zones. Most of the increase occurred for men, although more women go to work today outside the farm in the project zone (average of three) than in 1985 (average of 0.15). Large farms, that invested heavily in equipment following the road improvements and reduced labor requirements, showed the largest gains in outside employment
28
when compared to the control zones. While the increase of off-farm employment in all zones reflects the increasing integration of the rural with the urban economies, the substantially higher gains in the project zones can be attributed to two effects of the road improvements: i) a direct effect, resulting from a drastic drop in access costs from farms to outside employment, as the improved roads reduced transport costs, and ii) an indirect effect, stemming from the higher modernization in the management of the farms on the projects’ zones, which released household labor for outside employment.
4.15 On-farm employment, that is, people hired from outside the farm households to work on the farms, followed a different pattern. It showed a decrease in the project zones (by 7% on the aggregate for all three regions), while remaining practically constant in the control zones. Overall, the findings on household workload, on-farm and off-farm employment appear internally consistent and coherent with other findings related to the modernization of agricultural work in the project zones. Chapter 5 discusses the impact of the changing demand on women.
4.16 Establishment of New Shops. The study showed no clear overall impact when all three regions are considered. However, there was a marked rise in Set-tat, where the number of shops in the project area increased from one in 1985 to 10 in 1995, while the corresponding increase in the control zone was from 2 to 6. The most striking gain in commercial activity in this zone is the rise in the number of kiosks (‘tentes’) in the weekly market (souk), that went up from 10 in 1985 to more than 500 now. Another indicator is the increase in the number of basic food stores (‘epiceries’) in villages, as 20 such shops were established in Larbaa, and five in Lamazia. The
. increase in shop activity in this region, compared to the other two in the study, can be attributed to the lesser agricultural possibilities in Settat, which led to relatively higher shop activity. The finding on the increase in number of shops and kiosks in the market is corroborated by data provided by focus groups discussions, which reported that tax revenues from commercial activity went up from 1,500 Dh in 1985 to 10,000 Dh in 1995 (equivalent to about 7,000 Dh in constant 1985 prices).
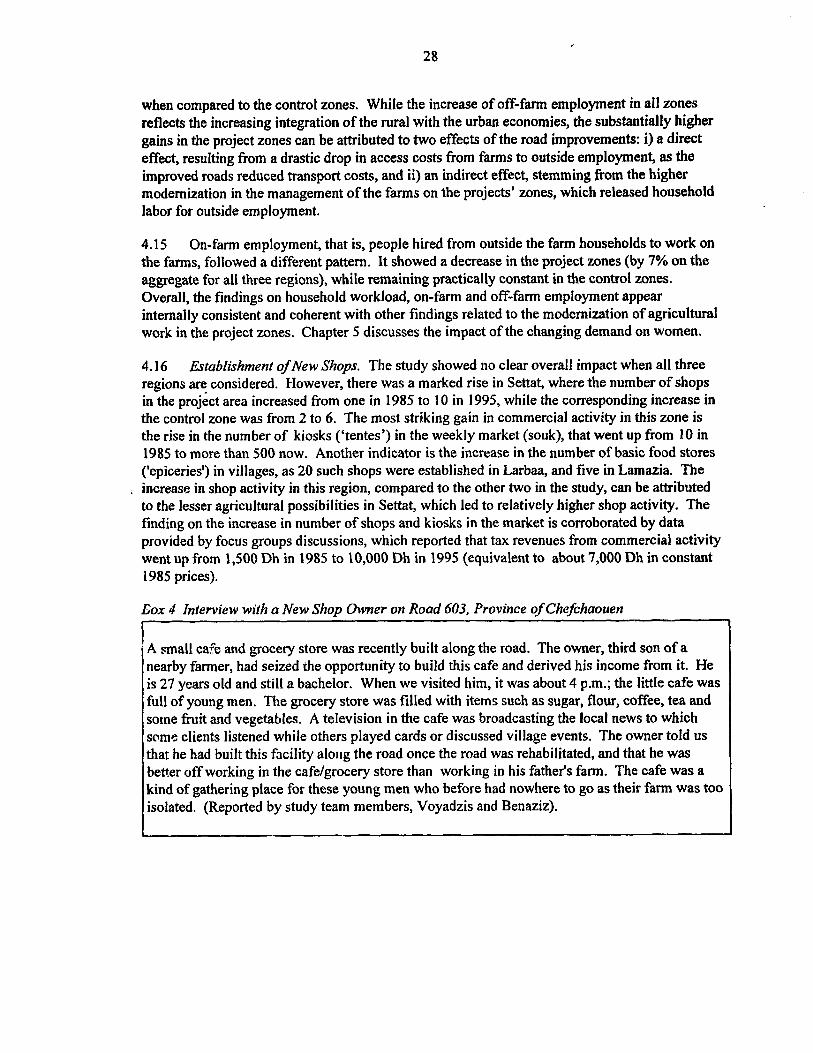
Eox 4 Interview with a New Shop Owner on Road 603, Province of Chefchaouen
r--- - A small cafe and grocery store was recently built along the road. The owner, third son of a nearby farmer, had seized the opportunity to build this cafe and derived his income from it. He is 27 years old and still a bachelor. When we visited him, it was about 4 p.m.; the little cafe was full of young men. The grocery store was filled with items such as sugar, flour, coffee, tea and sotne fruit and vegetables. A television in the cafe was broadcasting the local news to which some chents listened while others played cards or discussed village events. The owner told us that he had built this facility along the road once the road was rehabilitated, and that he was better off working in the cafe/grocery store than working in his father’s farm. The cafe was a kind of gathering place for these young men who before had nowhere to go as their farm was too isolated. (Reported by study team members, Voyadzis and Benaziz).

29
5. Impact on Social Services .
The surveys conducted by the study showed that while enrollment in primary education increased throughout all areas covered by the stua’y, the gains in the areas served by the project roads where enrollment more rhan doubled between 1985 and 1995, was much higher than in the control roads. In parallel, the quality of education improved, as it became possible to recruit teachers to stagthe schools, and absenteeism of both teachers and students dropped. The rural population also near& doubled their use of health care services (hospital andprimare care), and, similarly to education, the quality of health services was enhanced as the supply of medicine improved, health officials launched a campaign to staflrural health care centers with a doctor, and immunizaton and other health prevention programs became easier to implement. Women benefited greatly porn the project roadr: girls’ enrollment in primary education trebled over the period; expanded or new maternal aild child care programs were made available and accessible, and the introduction of butane at a#ordabIe prices, thanks to the existence of paved roads, dramatically reduced women’s chores of daily collection ofjkelwoodfor cooking and heating. Rural-urban interaction increased several-fold in the two directions, urban dwellers visiting their rural relatives, andfarm household members visiting cities.
Rationale for the Impact
5.1 The improvement of the roads was expected to facilitate access by the population to existing services, notably education and health, and to encourage the government and local authorities to establish new facilities in those areas. A direct effect was expected to be the increased enrollment in primary schools and visits to health facilities, with consequent improvements in education and health indicators.
Accessibility to Social Services
5.2 Access to social services is inadequate in rural Morocco. Accessibility is worse in the more isolated areas, due both to scarce social services facilities and to deficient transport infrastructure and services to reach them. Comprehensive, long-term plans for the social welfare of the country were inexistent since social concerns were not a top priority in Morocco”. Spending to promote human capital was not considered an investment that would ultimately lead to greater and more sustainable economic growth. It was only in 1993 that the Government issued the Social Development Strategy to extend basic social services to the poor and increase their participation in economically productive activities.
Education
Key Features of the Sector
5.3 In recent years, Morocco has made a great effort to improve education. Its budget for the sector is about one fifth of the central government’s budget and over five percent of the GDP. Substantial progress has been made in improving enrollment in secondary and higher education, which has grown at annual rates of 4.3 and 9.1 percent, respectively. However, it has been more
lo SAR, No. 15073-MOR.
30
diff:cult to achieve results in primary education; enrollment rates following an economic recession actually declined between 1983 and 1988, and did not recover its previous level until 1991.
5.4 The current situation is defined by the following indicators, Illiteracy is 58 percent, and it is substantially worse in the rural areas, where it reaches 77 percent (37 percent in the urban areas). In the countryside, schools are in short supply and those that exist are poorly equipped, making it difficult to attract teachers. About 56 percent of the communities have a primary school, and only 3 percent have access to a paved road.” School attendance rates in the rural areas are low: 48 percent overali, 64 percent for boys and 32 percent for girls. Important causes for this are on the demand side: parental attitudes (particularly illiteracy of mothers), and the opportunity costs of sending children to school, as many of the rural poor cannot afford to forego children’s labor or earnings. On the supply side, causes range from reasonable and accessible school facilities to provision of meals.
Main Findings
5.5 Improvement in Primary School Enrollment Rates. This was the main impact of the road improvements on education. In all three areas combined, primary school enrollment rates in 1995 reached a high level, for rural areas, of 68 percent. This compares to 5 1 percent in the control zones. Relative to 1985, enrollment rates in the project zones more than doubled from the initial level of 28 percent. While enrollment in the control zones also improved over the period, the rate of improvement was lower.
5.6 There are substantial regional differences in the absolute enrollment levels reached, and in the gains in the period (Table 5.1). The highest enrollment rate was for boys in Settat, reaching 85 percent in 1995. The highest enrollment rate for girls was also attained in Settat, with a high 67 percent in 1995. The highest gain was for girls in Chefchaouen, where enrollment rates increased from 10 percent in 1985 to 38 percent in 1995.
5.7 Girls’guins. As shown in Table 5.1, girls achieved the biggest gains in enrollment in primary school, which reached 54 percent in 1995, more than three times the level in 1985; there is insufficient information about the control zones. More details on the impact on girls’ education are given later in this chapter.
” Khandkcr, Lavy and Filmer, 1994. Schooling and Cognitve Achievements of Children in Morocco. Can rhe Government Improve Ourcomcs? World Bank Discussion Paper No. 264. The World Bank, Washington, D.C. (page 17).
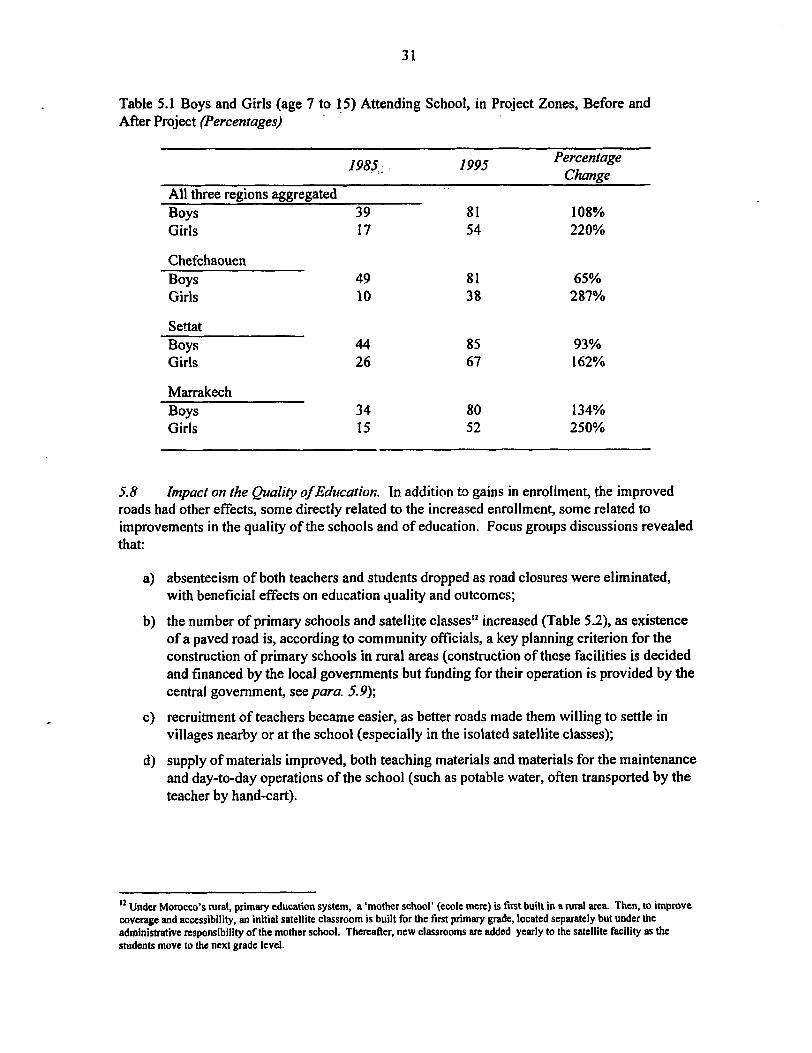
31
Table 5.1 Boys and Girls (age 7 to 15) Attending School, in Project Zones, Before and After Project (Percentages) ’
1985; 1995 Percentage Change
All three regions aggregated Boys 39 81 108% Girls 17 54 220%
Chefchaouen Boys 49 81 65% Girls 10 38 287%
Settat Boys 44 85 93% Girls 26 67 162%
Marrakech Boys 34 80 134% Girls 15 52 250%
5.8 Impact on the Quality of Education;. In addition to gains in enrollment, the improved roads had other effects, some directly related to the increased enrollment, some related to improvements in the quality of the schools and of education. Focus groups discussions revealed that:
a)
b)
c)
d)
absenteeism of both teachers and students dropped as road closures were eliminated, with beneficial effects on education quality and outcomes;
the number of primary schools and satellite classes12 increased (Table 5.2), as existence of a paved road is, according to community officials, a key planning criterion for the construction of primary schools in rural areas (construction of these facilities is decided and financed by the local governments but funding for their operation is provided by the central government, seeparu. 5.9);
recruitment of teachers became easier, as better roads made them willing to settle in villages nearby or at the school (especially in the isolated satellite classes);
supply of materials improved, both teaching materials and materials for the maintenance and day-to-day operations of the school (such as potable water, often transported by the teacher by hand-cart).
‘* Under Morocco’s rural, primary education system, a ‘mother school’ (ecole mere) is first built in a rural area. Then, to improve coverage and accessibility, an initial satellite classroom is built for the first primary grade, located separately but under the administrative responsibility of the mother school. Thereafter, new classrooms are added yearly to the satellite facility as the students move to the next grade level.
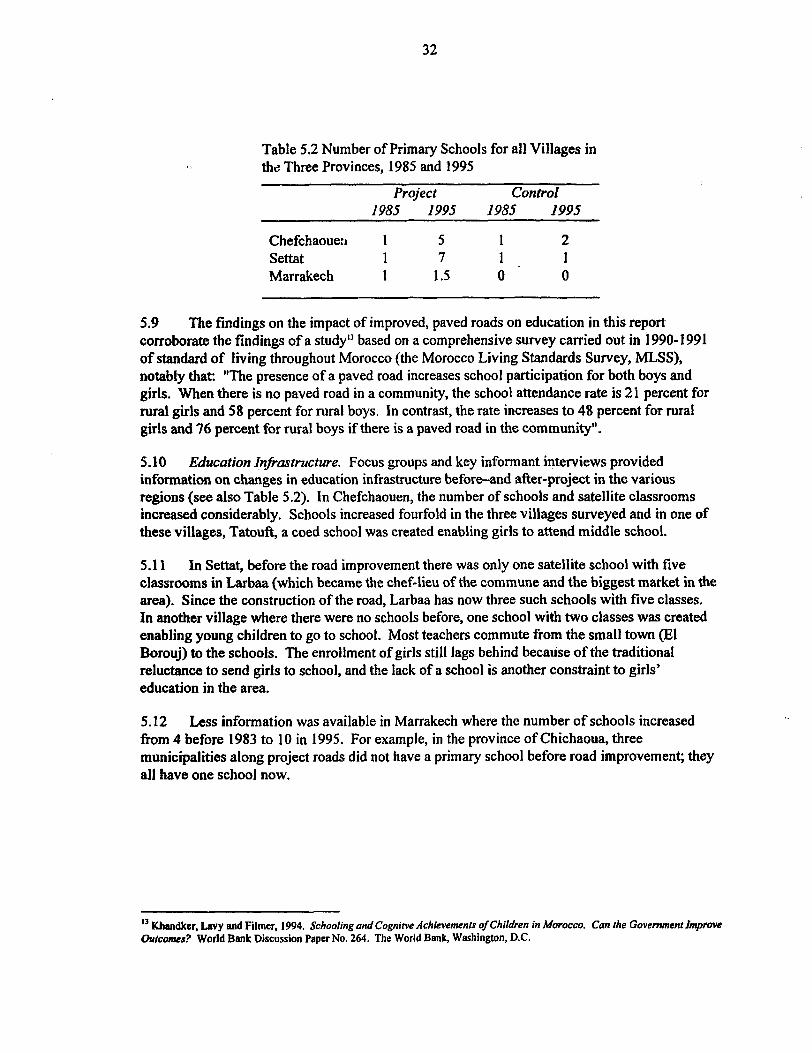
32
Table 5.2 Number of Primary Schools for all Villages in th,: Three Provinces, 1985 and 1995
Project Control I985 1995 1985 1995
Chefchaoue:r 1 5 1 2 Settat 1 7 1 1 Marrakech I 1.5 0’ 0
5.9 The findings on the impact of improved, paved roads on education in this report corroborate the findings of a study” based on a comprehensive survey carried out in 1990-I 991 of standard of living throughout Morocco (the Morocco Living Standards Survey, MLSS), notably that: “The presence of a paved road increases school participation for both boys and girls. When there is no paved road in a community, the school attendance rate is 21 percent for rural girls and 58 percent for rural boys. In contrast, the rate increases to 48 percent for rural girls and 76 percent for rural boys if there is a paved road in the community”.
5.10 l2ucation Infrastructure. Focus groups and key informant interviews provided information on changes in education infrastructure beforeand after-project in the various regions (see also Table 5.2). In Chefchaouen, the number of schools and satellite classrooms increased considerably. Schools increased fourfold in the three villages surveyed and in one of these villages, Tatouft, a coed school was created enabling girls to attend middle school.
5.11 In Settat, before the road improvement there was only one satellite school with five classrooms in Larbaa (which became the chef-lieu of the commune and the biggest market in the area). Since the construction of the road, Larbaa has now three such schools with five classes. In another village where there were no schools before, one school with two classes was created enabling young children to go to school. Most teachers commute from the small town (El Borouj) to the schools. The enrollment of girls still lags behind because of the traditional reluctance to send girls to school, and the lack of a school is another constraint to girls’ education in the area.
5.12 Less information was available in Marrakech where the number of schools increased from 4 before 1983 to 10 in 1995. For example, in the province of Chichaoua, three municipalities along project roads did not have a primary school before road improvement; they all have one school now.
I3 Khandker, Lavy and Filmcr, 1994. Schooling and Cognitve Achievements of Children in Morocco. Can the Government improve
oulcomes? World Bank Discussion Paper No. 264. The World Bank, Washington, DC.
33
Health
Key Features of the Sector
5.13 The limited health infrastructure and health services in the Moroccan countryside are reflected in poor health indicators. Only 6.5 percent of rural inhabitants have medical services in their douars, and only 27 percent have access to fmed primary care facilities. There are 100 hospitals in Morocco and all are located in urban settings. There are about 260 health centers in urban areas versus 230 in rural areas, and some 150 dispensaries in urban areas versus 1,040 in rural areas.” A rural health center serves, on average, 52,000 inhabitants and in some places up to 180,000.
5.14 The gap in health conditions between rural and urban settings is substantial. For example, life expectancy for rural inhabitants is 66, where as that for urban inhabitants is 72. A rural inhabitant is almost 25 km from facilities where a health-related consultation can be sought, compared with less than one third that distance for an urban inhabitant. Probably as a result, fewer than 40 percent of rural inhabitants seek treatment for illness (compared with over 60 percent of urban inhabitants), and lose some two days (about 25 percent) more of potential income-generating activity each year due to illness.
5.15 The fertility rate in rural areas is twice that of urban areas (5.7 and 2.8, respectively), and family planning services are beyond the reach of most women in the countryside. The maternal mortality rate is very high: 362 maternal deaths per 100,000 live births in rural areas against 284 in urban areas; the average in developed countries is less than 10 per 100,000 live births. The infant mortality rate is estimated at 66 deaths per 1,000 live births,” which compares to less than 20 in developed countries.
5.16 The public sector is the larger supplier of health care, and the Central Government funding amounts to about one percent of GDP each year.
Main Findings
5.17 Visits to Health Facilities. As shown in Table 5.3, visits to health facilities in all three regions combined increased. The largest gains were for visits to hospitals and health centers, which doubled from 1985 to 1995 once the roads were improved. Improvements also happened in the control zones, but reached lower levels than in the project zones. Nationally, admissions to hospitals increased by about 25 percent during the period (Annex B).
5.18 Health Facilities’ Stafing and Supplies. Focus groups revealed improvements in health facilities and services before and after the project:
a) In the Chefchaouen area, the health centers existing at the three main population centers (Tatoufet, Souk El Kolla and Tanakoub) had neither permanent professional personnel nor equipment and supplies. Today, each center is staffed by a medical doctor and two
” Health centers (ccntrer de Sante) are defined as health establishments with at least one physician. Healtb centers offer mainly out- patient scrviccs. Dispensaries (dispcnsains) arc defined as establishments offering out-patient health services and stied by nurses iyld other pars-medical staff (but not physician). In practice, many health centers have not succcoded in recruit a doctor, and them is prectically no difference with a dispcnsairc.
” World Bank, 1995. World Development Report 1995. Workers in on lniegroring World. World Bank, Washington, D.C.
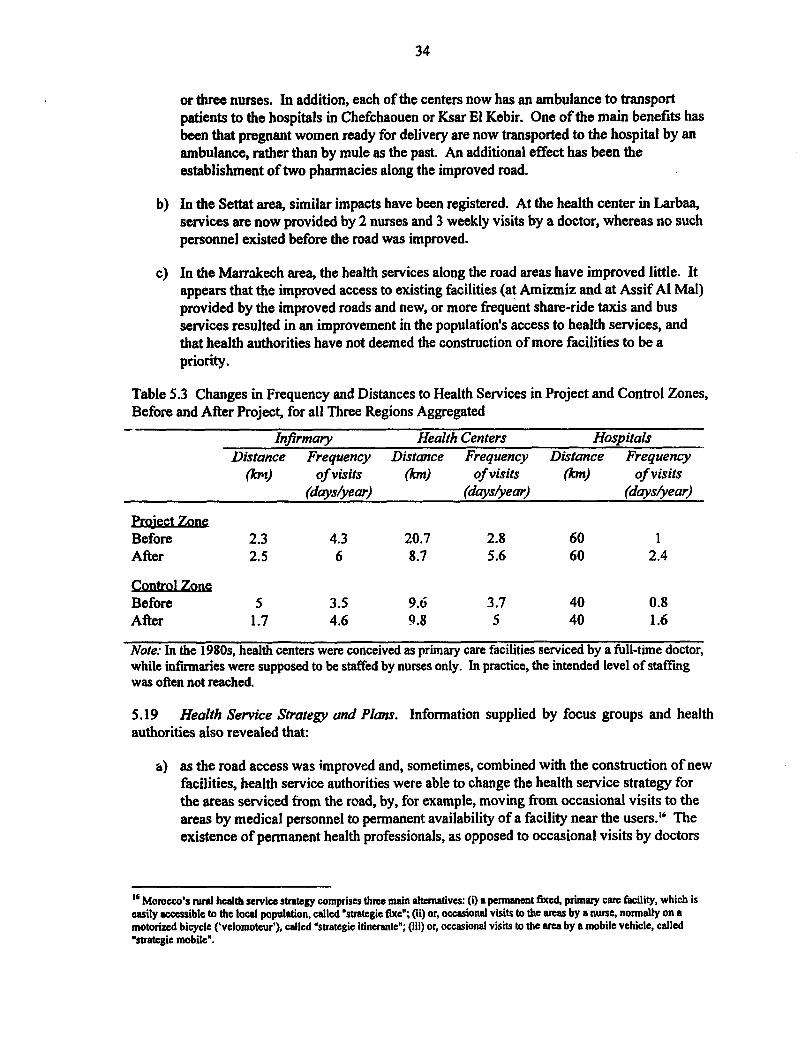
34
JO
cl
or three nurses. In addition, each of the centers now has an ambulance to transport patients to the hospitals in Chefchaouen or Ksar El Kebit. One of the main benefits has been that pregnant women ready for delivery are now transported to the hospital by an ambulance, rather than by mule as the past. An additional effect has been the establishment of two pharmacies along the improved road.
In the Settat area, similar impacts have been registered. At the health center in Larbaa, services are now provided by 2 nurses and 3 weekly visits by a doctor, whereas no such personnel existed before the road was improved.
In the Marrakech area, the health services along the road areas have improved little. It appears that the improved access to existing facilities (at Amizmiz and at Assif Al Mal) provided by the improved roads and new, or more frequent share-ride taxis and bus services resulted in an improvement in the population’s access to health services, and that health authorities have not deemed the construction of more facilities to be a priority.
Table 5.3 Changes in Frequency and Distances to Health Services in Project and Control Zones, Before and After Project, for all Three Regions Aggregated
In$rmary Health Centers Hospitals Distance Frequency Distance Frequency Distance Frequency
(kr2) of visits @m) of visits (km) of v&its (daysl)lear) Mw4eM (days/year)
Before 2.3 4.3 20.7 2.8 60 1 After 2.5 6 8.7 5.6 60 2.4
Before 5 3.5 9.6 3.7 40 0.8 After 1.7 4.6 9.8 5 40 1.6
Note: In the 198Os, health centers were conceived as primary care facilities serviced by a full-time doctor, while infirmaries were supposed to be staffed by nurses only. In practice, the intended level of staffmg was often not reached.
5.19 Health Service Strategy and Plans. Information supplied by focus groups and health authorities also revealed that:
as the road access was improved and, sometimes, combined with the construction of new facilities, health service authorities were able to change the health service strategy for the areas serviced from the road, by, for example, moving from occasional visits to the areas by medical personne1 to permanent availability of a facility near the users.16 The existence of permanent health professionals, as opposed to occasional visits by doctors
I6 Morocco’s era! health service strakgy comprises three main ~krnativcs: (i) a permanent fixed, primary cm facility, which is easily accessible to the local population, called “strategic fixe”; (ii) or, occasional visits to the areas by a nurse, normally on a motorized bicycle (‘velomotcur’), called “strategic itinerante”; (iii) or, occasional visits to the area by a mobile vehicle, called Wrakgic mobile”.
35
b)
cl
4
el
5.20
and nurses, allowed to implement health programs like prenatal care and immunization of children;
implementation of family planning national programs, mainly the distribution of contraceptives and provision of medical advice, are no longer hampered by transport bottlenecks thanks to the roads’ improved condition;
in the areas enjoying improved roads, it has been possible to implement a “medicalization” program whose aim is that every health center is serviced by at least one medical doctor. Local authorities reported that it was , and still is, practically impossible to recruit doctors in areas which do not have good road access;
due to the better access, it has been made easier to recruit as well as to retain health service personnel; and
the supply of medicines has increased considerably.
Comparison of Impacts between the Project and the Control Zones. As noted, there has been improvement in access to health infrastructure and services in the villages around the project zones. However, the fact that the control zones also benefited from such improvements makes it difficult to establish causal links between project investment and reported impacts. Three possible reasons may explain these findings:
a)
W
cl
improvements, percentage-wise, were about the same in the project and the control zones, but starting from and reaching lower levels in the control zones, possibly reflecting that it is easier to achieve gains at the lower end of the spectrum;
the “recall” factor of the retrospective survey (asking respondents to remember events ten years earlier) has led respondents to recall events/activities in a more favorable light than they actually were, especially as they improved over time. Thus, respondents from the project zones might have had the same health facilities as those from the control zones in 1985, but the memory of hardship experienced earlier had faded over time; and
the rehabilitation of the roads had no impact on the number of trips to and from health facilities, and the improvements noted are all due to exogenous factors such as the implementation of health programs in the areas. Unfortunately, data at the village, douar or neighborhood levels was not available to verify this.

36
Impact on Women
Box 5.1 Living Conditions of Rural Women 1
"The rural sector’s limited transportation infrastructure limits women’s opportunities. Many rural villages in Morocco are isolated from market centers by long distances. The lack of roads makes travel too difftcult, dangerous, or time-consuming for women to profitably engage in economic activity involving travel. Consequently, women often lack access to markets and are unable to participate in wage labor or trade. Transportation constraints stemming from the limitations of the road system inhibit women’s access to health care. Travel time to the nearest health center is greater than 60 minutes for nearly half the population in rural areas. This particularly affects women who with their reproductive role are more likely to be in-need of health services and have less mobility than men.“”
, \
Rationale for the Impact
5.21 The improvement of roads and the resulting better access to services and facilities was expected to benefit women more than men, for a number of reasons. First, women in rural Morocco enjoy substantially less mobility than men. On the education front, the effects of improved access to schools would be expected to be higher for girls in view of their very low enrollment rates compared to those of boys. Similarly, better access to health services could be expected to enable women to get gender-specific health services, such as maternal and infant care. Women would also be expected to derive benefits concerning personal mobility and rural- urban contacts because of their daily time-consuming activities. Female workload is heavy in the absence of easy access to clean water and fuelwood or other heating and cooking sources; thus, improvements in local roads facilitating access to water supply and to sources of energy (both existing sources and those created following the road improvements) could be expected to significantly reduce women’s workload.
Gender Indicators: A National Perspective”
5.22 Education Nationally, about 40 percent of all children aged 7- 13 are enrolled in primary education. Of those enrolled, 41 percent are girls. In rural areas, the percentage of girls goes down to 32 percent; by 6th grade, the percentage further drops to 25.
5.23 The probability of an average rural girl having access to basic education and surviving through the fifth grade was estimated in 1991 at less than 20 percent, while the corresponding probability for an urban boy was close to 90 percent. These disparities are explained by parental attitudes to schooling and opportunity costs of sending children to school as well as by unavailability of schooling facilities, along with factors such as the lack of provision of meals. Among the poorest expenditure group surveyed in the 1990-91 MLSS, poverty (that is, liability to forgo children’s labor or earnings) was cited in about two-thirds of the cases as the reason for not having children attend school.
” World Bank, 1995. Kingdom of Morocco. Enhancing the Porticipotion of Women in Lkvelopmcnt. Middle East and North Africa Region, World Bank, Washington, DC. (paragraph 3.5).
“Ibid, footnote 17.
37
5.?4 Heal& Several indicators iilustr#e women’s lower health conditions in rural settings. While women in urban areas may expect to live 74 years, such number drops to 67 in tvral areas. At the same time, the fertility rate in rural areas is twice that in urban areas (5.7 and 2.8, respectively). Family planning services are beyond the reach of most women in the countryside, and cultural factors further discourage their use. Maternal mortality rates are high in rural areas: they reach 362 maternal deaths per 100,000 live births, which compares with 284 in Morocco’s urban areas (and less than 10 per 100,000 live births in developed countries). Infant malnutrition is about twice as prevalent in rural as in urban areas.
5.25 Women consistently emphasize the need to have basic health facilities in the village or to have ambulances for easy transport, especially in maternity related emergencies.19 In rural settings, most deliveries take place at home (72 percent) with the assistance of traditional birth attendants (kabla) in 48 percent of cases and with relatives or friends in 20 percent of cases. Only about thirty percent of the births are attended by a health professional; of these, two thirds of the time by a doctor and one third by a midwife or nurse. Women’s lack of information about the health centers further reduces their access to such services.
Main Findings
5.26 Education. There was a dramatic improvement in the project zones in the enrollment of girls in primary school: it went up from 17 percent in 1985 to 54 percent in 1995 (see Table 5.1). This happened consistently across the three zones under study, and all three zones registered enrollment levels higher than the national average for rural areas, especially Settat, where girls’ entollment reached 67 percent. One reason cited for the substantial improvement in girls’ entollment is that several new primary schools and satellite classrooms opened during the period. By comparison, enrollment of girls in primary education in rural areas throughtout Morocco remained practically constant during the study period (Annex B).
5.27 Despite the large gains in the enrollment of girls in primary education in 1995, in the three zones combined, girls’ enrollment levels were still substantially below boys’, 54 percent versus 8 1 percent. It appears that the traditional reluctance of parents to send girls to school- because they contribute more than boys to household chores such as getting water and caring for siblings, and because of perceived dangers of rape when there are long distances and difficult trails to school-is still the primary cause for their lagging behind boys. These findings on girls’ education are consistent with those in the study completed by Khandher, Lavy and Filmer (1994)?O
5.28 Health. In the project zones, there was a clear gain in the frequency of visits by women to health services: their visits to a hospital more than doubled (2.4 per year in 1995, compared to 1 .lO in 1985) and their visits to the primary care centers also increased (3.1 in 1995 compared to 2.3 in 1985). Men made relatively similar gains percentage-wise, but the frequency of their
I9 Ibid, footnote 17.
” This report found, through regression analysis based on LMS data, that: (a) the presence of a paved road increases the girls’ probability of ever attending a school by 40 percent, compared with less than 10 percent for boys; (b) school attendance for rural children increases from 58 percent for boys and 21 percent for girls when there is no paved road in the communi& to 76 percent for boys and 48 percent for girls when thrrc is a paved road. Thus. girls’ attendance more than doubles, while boys’ attendance, which is higher initially, increase by about IS percent es a result of the existence of a paved road; (c) if a road is blocked during the year (an average of 1 month per year in the study), there is a 30 percent drop in girls attcndancc, but only 20 percent in boys attendance.
38
visits to hospitals was much lower than women (0.8 per year in 1995); however, it was about the same for visits to primary care centers.
5.29 Focus groups reported that women gained substantially from health programs in maternal and infant care and family planning, but no statistics specific to the project zones were availab!e.
5.30 Another health impact is the diversification of the diet. Focus groups in Chefchaouen reported that while in the past they rarely ate fish, they do so now at least once a month; they credit this change to the paving of the project road, which has enabled refrigerated trucks to have access to the so& serving their areas. Similarly, it was reported that consumption of fresh vegetables and fruits increased.
5.31 Cooking and Heating. A major gain in women’ welfare stemming from the better quality roads was the introduction of butane for cooking and heating. For example, focus groups in Chcfchaouen reported that before the improvement of the road, women had to spend an average of 2 hours daily in order to get and carry fuelwood. Butane gas, used extensively in urban areas, did not reach the rural areas due to the high transport and distribution costs. A bottle of butane used to cost 20 Dh; following improvement of the road, the price dropped considerably, to as low as 11 Dh: which is affordable. A similar phenomenon was reported in the other regions.
BOX 5.2 Fuelwood Collection by Women
“Fuelwood coliection for cooking and heating is sometimes S km away and most women must go twice a day, collecting up to ten kilos of wood per basket. In some larger households, women have to repeat the voyage four times a day. Quite naturally, the women linked backache, pain in the joints and arthritis to the heavy loads of wood they have on their shoulder.” ”
I I
5.32 Work Opportunities. There were area-specific impacts on women which, in some cases, resulted in opposite consequences. For example, focus groups in Settat reported that in the past women were required to work on the fields helping with the wheat crop. Today, as a result of mechanization and the creation of agricultural cooperatives made possible by the improved road, most women can stay home. Since, coincidentally, taxi services have greatly expanded, women now use time for more visits to their relatives and to nearby villages and cities. A rather different case happened in some localities in the Tensift area. The increase in milk cooperatives that resulted from the improved road required more labor to take care of the cows. Thus, municipal programs were instituted encouraging women to work on this activity and a specific incentive was created where women got a share of the revenues stemming from milk sales; the result has been an increase in earning-generating work for women. In view of the low participation of women in Morocco’s formal (monetized) economy, this is an important impact.
Other Impacts
5.33 Access to Water Supply. As shown in Table 3.2, in all three areas served by the improved project roads, the average time to access water supply facilities showed a small
*’ Ibid, footnote 17.

39
decrease, from an average for all regions of 16 minutes in 1985 to 13 minutes in 1995, while no gains were achieved in the control zones. 22
5.34 Mobility and Rural-Urban Links. The expanded rural tax? and bus services over the study period, led to a major increase in mobility and rural-urban links. For example, across all three regions served by the project roads, the number of visits by relatives in the urban areas to their families on the farms increased, on average, from 2 visits per year in 1985, to some 15 per year ten years later; this compares to less than two in the control zones in 1985, and to just 3 in 1995. At the same time, visits by members of the farm households to the nearby cities increased substantially in Settat and in Marrakech, from, on average, 12 in 1985 to over 60 in 1995, while the equivalent numbers in the controls zones changed from 8 to 25.
zz Access to water, as well as to other services, is reported by the World Bank’s 1996 Parficipation Sourcebook. To be a high priority by Moroccan women: “... we learned that whereas men wanted to build bridges and roads, women’ top priorities were clinics, ambulances, electricity, running water and collective ovens”
u Rural taxis in Morocco are share-ride type, that is. they are not limited to sewing one client but can take passengers up to the capacity of the vehicle.

41
6. Impact on the Environment
Changes in transport conditions and in the agricultural economy had both negative andpositive impacts on the environment although, overall, no environmentally sensitive areas were at risk by the roadprojects, which did not involve new construction. Negative impacts were those resulting from the increased trafic and economic activity, especiah’y air and noise po/rUrion and road accidents, and the increased use offertihzers and other chemicals which in all likelyhood contaminated the water table. Positive impacts resulted inpartjFom the trarqformation of the agricultural economy, notably curtailment of extensive goat and sheep that damages the soil cover and increased tree plantations, andfiom broader use of butane substituting for fuelwood, whose demand is larger than the size of Morocco’s sustainable forests.
Expected Impacts
6.1 The environmental impact of paving a rural road was expected to have both negative and positive dimensions. On the negative side, there would be the effects of increased economic activity in the rural economy and resulting higher levels of motorized traffic, with its known corLsequences of increased use of agricultural chemicals (fertilizers, pesticides) and vehicular pollution. On the positive side, transformation of the agricultural output and the introduction of better agronomic practices could lead to reduced soil erosion and better care of the forests. The road works themselves, invoiving no extension of the existing tight of way, could be expected to have only a minor impact on the environment, and limited in time to the period of the execution of the works.”
Main Findings
6.2 The data made available through the study did not permit to quantify the impacts of the rural roads improvements on the environment. However, information from the focus groups interviews, the analysis of the farm level questionnaires and the changes in the regional agricultural economy provide a basis to identify types of impacts, both negative and positive, on the environment. Such impacts are divided here between those resulting directly from the road works and the higher traffic levels they induced or allowed, and those resulting from changes in the agriculturai economy and related economic activity.
Types of Impacts
6.3 Impacts Directly Resultingfiom Road Improvements and Traflc. The main negative impacts are the increase in the levels of:
a) air pollution stemming from the increased fuel fumes resulting from the higher traffic;
b) road noise as a result of the higher vehicular activity; and
c) soil erosion caused by higher traffic levels and cars driving on road shoulders, leading to occasional flooding.
U The roads works on the four roads analyzed in this report would fall under the Bank’s Environmental Category B.

42
6.4 However, at least in the case of the first two impacts, while the overall levels increased, the levels per unit of traffic decreased as a result of the better road surfaces, which are more fuel efficient and less noisy.
6.5, While there is no statistical evidence, it is likely that the higher traffic levels and- . especially the higher speeds made possible by the paved roads, led to an increase in the number of road accidents, and related fatalities, injuries and material damages.
6.6 On the positive side, the asphalt roads substantially reduced, relative to the earth and gravel roads that they substituted, dust pollution; farm workers traveling to the so&r or to social services in the villages and children attending school were the main beneficiaries of such reduction in dust.
6.7 Impacts@om Changes in the Agricultural Economy and Increased Economic Activity. The main negative impacts were:
4
b)
6.8
a)
b)
c)
6.9
increased use of agricultural chemicals (mainly fertilizer and pesticides), resulting from the intensification of vegetable gardening, higher-yield cattle, tree cropping and sugar beet production. Measures of such contaminants on the water table, or in locally marketed foodstuffs, are not available for the zones of influence of the project roads;
increased liquid and solid waste resulting from livestock slaughtering in so&.
The main positive impacts, identified by the surveys and the focus groups, were:
the curtailment of extensive goat and sheep herding ;
an increase in the number of tree plantations; and
increased reliance on bottled gas for heating and cooking fuel (as access to these supplies is made cheaper and easier by the better roads), substituting for fuelwood.
In some areas (namely, in the Rif) these impacts combined resulted in decreased run-off
from steep slopes, increased preservation of upper watersheds and increased reforestation of the watershed which had been severely eroded due to the uncontrolled scavenging for fuelwood and the decrease in soil cover due to goat herding.
6.10 The shift to high-value agriculture, although it increased the use of polluting chemicals, reduced extensive planting and range practices generally harmful to the environment.
6.11 The positive impacts noted above will benefit the forests. Such benefits are important. It is estimated that 85% of Morocco’s need for fuelwood is supplied by forests and non- commercial agricultural vegetation. This level of demand for fuelwood in the country as a whole is estimated at 10 million cubic meters of wood, well above the sustainable forest yield of 3 million cubic meters. Also, some 40 percent of grazing grounds are in forest zones and overgrazing undermines reforestation”
2’ World Bank. 1994, op. cit.

43
6.12 Overall, it is not possible to provide a balance of the various environmental impacts caused by the improvement of the rural roads, since different types of impacts took place whose effects are not directly comparable and quantification of the individual impacts is not possible. However, the perception f?om the focus groups and from the surveys ca&d out during the study is that the positive impacts are of similar magnitude as those impacts that are harmful to the environment.

45
7. Economic-Analysis
The improvements in the agricultural economy and access to social services that the better roads brought about translated into increases in the roads’ trafic Ievets at rates substantially higher than on unpaved rural roads. The study quantified the economic benefits based on savings in- vehicle operating costs compared to the original, unpaved roacls, and on the economic gains resultingfkom the avoidance of road closures (due to rains) since the paved roads are open to traflc year-round. Social impacts, although real, could not be isolatedfor attribution to the road investments and were not quantified. The analysis showed that the economic returns as well as the timing of the improvements for a11 project roadr were satisfactory (economic rates of return ranging between I6 and 30 percent), and that even under a worse case scenario the returns would have remained acceptable. l%e bcnqfitsfrom the investments are expected to accrue to farmers in the form of expanded use of commercial freight services substituting for non-motorized carriage of loads, including heavier, more eficient truths. The ruralpopulation in the roads r areas is expected to benefit mainly by the availability at aflordable prices of frequent services of share-ride taxis. The satisfactory returns do not necessarily mean that paving was the optimal economic decision, compared, for example, to rehabilitated gravel roads maintained at good standards.
Economic Analysis at Project Appraisal
7.1 The feasibility study on which the Bank’s appraisal report was based assessed benefits of rural roads improvements mainly in terms of increased agricultural volumes stemming from: i) an increase of between 5 and 20 percent in planted areas, and ii) an increase in unit yields of up to 70 percent relative to those existing at the time the project was prepared. The study also quantified savings in vehicle operating costs to the existing traffic.
7.2 Based on this analysis, the ex-ante rates of return for the road projects were as follows:
Table 7.1 Ex-ante Economic Rates of Return, as Presented in the Staff Appraisal Report
Route Economic Rate of Return, percent
603 21 1427 37
6307108 39
Findings of Importance to Economic Analysis
7.3 Findings in this study point to the difficulty in forecasting changes in agricultural production levels, value added, and related traffic. The transformation of the agricultural economy found in the three regions went beyond improvements in yields, or increases in planted areas (a common assumption in rural road projects)?6 As noted in Chapter 4, such
“A common model is to assume a market for agricultural products located at a fixed distance for which the rural ar~n being analyzed is a marginal supplier and does not influence the market price. Thus. reduced transport costs stemming i?om belter roads
46
transformation followed the classical Van Thunen model, where improvement in roads will change the ccmposition of agricultural output from low value*cereals to high value but highly perishable vegetables.
7.4 At the same time, a transformation of the agricultural economy to higher value vegetables may lead, at least in the short term, to either an increase or a decrease in traffic, depending on precisely how and by how much the agricultural economy was transformed. In the medium term, it is likely that the better agricultural economy will raise disposable income, and will, therefore, lead to an increase in passenger travel.
Project Benefits
7.5. Economic benefits from the road improvements can be divided into two categories: (i) those related to the vehicles using the road had the road not been improved, designated as the road’s normal traffic and (ii) those related to the developmental effects of the road improvement. Benefits to normal traffic are measured by the savings in the vehicle operating costs. Benefits stemming from the developmental effect of the road can be measured either by the reduction in transport costs of the generated traffic, or by the value of expanded production. In theory both methods should yield the same results. 27 As this retrospective analysis can take advantage that actual traffic data exists for one year before the improvements, and one year after the improvements, this report follows the transport cost savings approach, comparing costs “with” and “without” project. The alternative approach, quantification of production benefits, although it allows to better relate road improvements to the developmental changes taking place, requires making assumptions which, overall, greatly increase the potential for faulty results. Especially difficult and prone to error is the assessment of a road’s area of influence from which production is to be quantified, and the estimation of the prices of inputs and outputs, notably as they are subject to large variations due to droughts and domestic and external market conditions.
7.6 The roads’ impact on the social sectors, described in earlier chapters, cannot be directly measured for the purposes of economic analysis, and they are normally considered as intangible benefits; nor can the analysis quantity benefit distribution among different beneficiaries. Benefit distribution is discussed later in this chapter. A recommendation regarding consideration of social impacts in the screening and evaluation of rural roads is in Chapter 9.
TraJEc
7.7 Changes in traffic levels between 1982 and 1995 are discussed in Chapter 3. The difference between current traffic levels and those in the early 1980s can be attributed to : i) normal growth in traffic, that is, the annual growth rate at which traffic grows on unpaved rural roads; ii) traffic diverted from other roads, due to shorter distance and/or lower vehicle operating costs; and iii) new traffic induced by the road in its direct zone of influence. The relative importance of each factor is directly related to the economic role of the road, both in the area it serves and as a long-distance route. Briefly explained, the roads’ economic roles are:
cause farm-gate prices to increase, and allows to extend the distance at which planting for selling in the existing market is profitable. See A. Walters, 1968. The Economics of Road User Charges. World Bank Occasional Page # 5.
*’ Hans Adler, 1987. Economic Appraisal of Transport Projects. A Manual with Case Studies. ED1 Series in Economic Development.
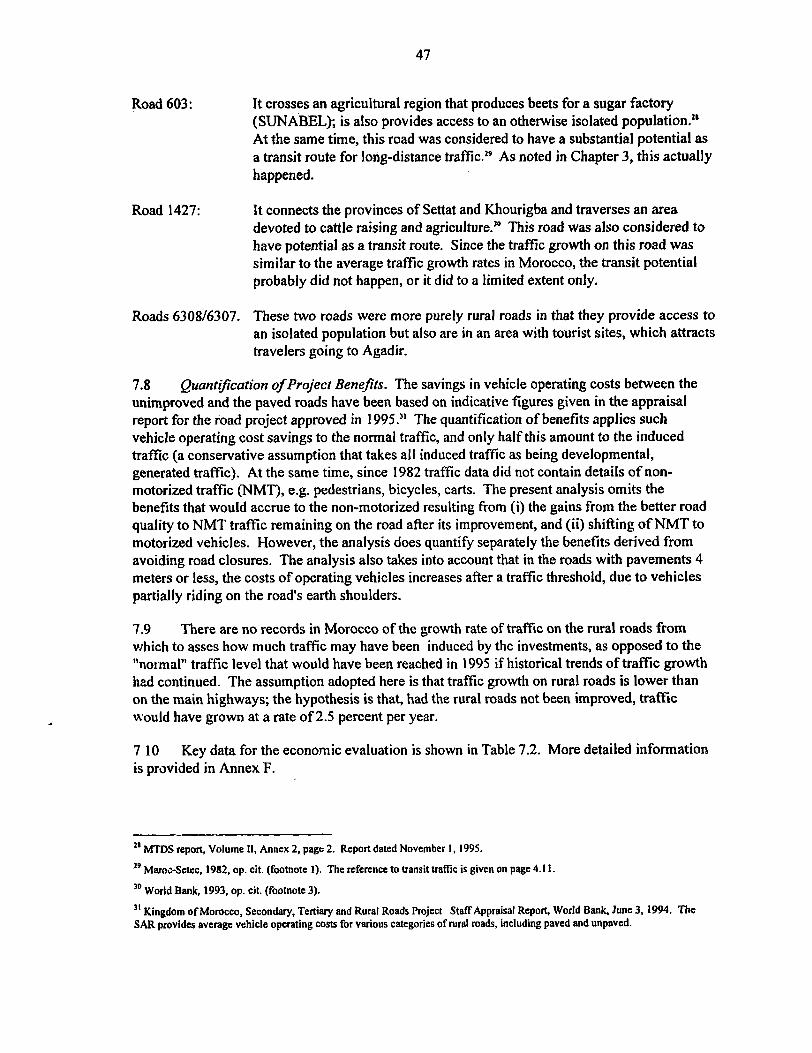
47
Road 603:
Road 1427:
It crosses an agricultural region that produces beets for a sugar factory (SUNABEL); is also provides access to an otherwise isolated population.*’ At the same time, this road was considered to have a substantial potential as a transit route for long-distance traffic. 29 As noted in Chapter 3, this actually happened.
It connects the provinces of Settat and Khourigba and traverses an area devoted to cattle raising and agriculture.‘” This road was also considered to have potential as a transit route. Since the traffic growth on this road was similar to the average traffic growth rates in Morocco, the transit potential probably did not happen, or it did to a limited extent only.
Roads 6308/6307. These two roads were more purely rural roads in that they provide access to an isolated population but also are in an area with tourist sites, which attracts travelers going to Agadir.
7.8 Quantl@cation of Project Benefits. The savings in vehicle operating costs between the unimproved and the paved roads have been based on indicative figures given in the appraisal report for the road project approved in 1995.” The quantification of benefits applies such vehicle operating cost savings to the normal traffic, and only half this amount to the induced traffic (a conservative assumption that takes all induced traffic as being developmental, generated traffic). At the same time, since 1982 traffic data did not contain details of non- motorized traffic (NMT), e.g. pedestrians, bicycles, carts. The present analysis omits the benefits that would accrue to the non-motorized resulting from (i) the gains from the better road quahty to NMT traffic remaining on the road after its improvement, and (ii) shifting of NMT to motorized vehicles. However, the analysis does quantify separately the benefits derived from avoiding road closures. The analysis also takes into account that in the roads with pavements 4 meters or less, the costs of operating vehicles increases after a traffic threshold, due to vehicles partially riding on the road’s earth shoulders.
7.9 There are no records in Morocco of the growth rate of traffic on the rural roads from which to asses how much traffic may have been induced by the investments, as opposed to the “normal” traffic level that would have been reached in 1995 if historical trends of traffic growth had continued. The assumption adopted here is that traffic growth on rural roads is lower than on the main highways; the hypothesis is that, had the rural roads not been improved, traffic would have grown at a rate of 2.5 percent per year.
7 10 Key data for the economic evaluation is shown in Table 7.2. More detailed information is provided in Annex F.
‘s MTDS report, Volume II, Annex 2, page 2. Report dated November I, 1995.
29 Maroc-Setec. 1982, op. cit. (footnote 1). The reference to transit traffic is given on page 4.11.
“World Bank, 1993, op. cit. (footnote 3).
3’ Kingdom of Morocco, Secondary, Tertiary and Rural Roads Project Staff Appraisal Report, World Bank, June 3, 1994. The SAR provides average vehicle operating costs for various categories of rural roads, including paved and unpaved.

48
Table 7.2 Key Data for Economic Evaluation
Road
Trafic (veh/day)
Length const. cost 1982 Open Year 1995 Open Year (km) (mDw95) Estimate Actual
603 1987 35 28.9 40 450 640 1427 1988 30 17.3 150 202 275 6307 1991 10 5.8 54 161 192 6308 1991 14 8.1 54 161 192
7.11 As shown in Table 7.3 below, the economic rate of return for all the investments is satisfactory, and ranges from 16 percent for road 6308 to 30 percent for road 1427. A sensitivity analysis considering lower traffic growth rates, lower savings in vehicle operating costs (for example, if the pavements are not well maintained), and higher costs of routine maintenance, as well as a worst case scenario combining lower traffic with lower vehicle operating costs savings shows that the economic return for all roads would still be acceptable.
7.12 The table also shows that the first year return (FYR, benefits the year of road opening relative to investment costs) is satisfactory for all roads. A satisfactory FYR indicates that the investment was not premature.
Table 7.3 Economic Rate of Return for Project Roads Project Roads
603 1427 6307 6308
Best Estimate (ERR) 21% 30% 16% 16% First Year Return 24% 26% 16% 16%
ERR Sensitivity Analysis (A) Total traffk annual growth
1) Higher (5.5%) 2) Lower (3.5%)
B) Overestimation of VOC savings (20% lower)
C) Higher routine maintenance cost (3%) D) Worse case scenario
(A. I and B combined)
22% 30% 17% 17% 21% 29% 16% 16% 21% 26% 14% 14%
20% 28% 15% 15%
20% 25% 13% 14%
7.13 The main reasons for the satisfactory returns appear to be: (a) the very poor condition of the original roads, which caused a major reduction in vehicle operating costs when the roads were improved and paved, (b) the fact that the roads (which is partially wider) were built to a narrow paved width of 4 meters only, with consequent savings in construction costs, and (c) that substantial traffic was generated, as reflected by the difference at opening year between the
49
normal traffic (without the improvement) and the estimate of the actual traffic that year based on the 1995 survey.
7.14 While some benefits appear to be dependent on paved roads the satisfactory returns to the rurr! roads investment does not ensure that paving was the optimal economic solution. It is possible that, especially the roads with lower traffic such as roads 6307/6308, rehabilitating the roads to a good gravel surface and maintaining them we11 could have yielded even higher returns.
7.15 Economic Rate of Returns Using HDM Model. MTDS consultants carried out an estimate of the icvestment returns using the Bank’s Highway Design Model (HDM) and adopting standard assumptions used by the MPW. The HDM/MPW-based evaluation gave ERRs substantially higher than those presented in Task 7.3, suggesting that some of the assumptions may be overly optimistic. Details of this analysis is in Annex F.
7.16 Distribution of Benefits. The direct beneficiaries of the road improvements are road users: motorized passenger and freight vehicles and non-motorized vehicles comprising bicycles, carts and pedestrians. Since vehicle ownership is still low in Morocco, most motorized vehicles operating on the roads do so for commercial purposes. Farmers benefit from the improved roads in two ways: (i) by expanding use of commercial freight services, substituting for the slower, limited-distance and more expensive non-motorized transport, which on unpaved roads in Morocco’s rural areas carry some 50 percent of all goods, and (ii) by being able to use the services of truckers operating larger freight vehicles, which offer lower transport rates. An indirect measure of the transport benefits to farmers is given by the lower increase (than in the control zones) in transport household expenditures, discussed in Chapter 3. The drastic drop in the retail price of butane cited in Chapter 5 is another indicator of these benefits. While these benefits are significant, it is likely that farmers could have derived even greater advantages had Morocco’s road freight transport market been less regulated and more competitive. This comment applies especially to the large trucks, over eight gross tons, that are required to do business through the state-owned Office Nationale des Transports (ONT), which operates as a freight-forwarding monopoly.
7.17 Regarding passenger travel, benefits accrued to the rural population mainly in the way of substantially increased share-taxi services which have taken an increasing share of the rural transport market, at the expense of interurban bus services. There are practically no entry controls to the taxi market, and tariffs are competitive. The non-motorized transport has benefited from the substantially better surface quality offered by the paved roads.
Design of Rural Roads
7.18 Two out of the three roads in this study were improved to paved surfaces of 4 meters or less, while the third has a 5.5 meter-wide section. Current thinking in the MPW regarding the large rural program under construction, appears to be not to consider pavements less than 6- meter wide. This would be in conflict with the results in the present study, which show that 4- meter pavements were cost effective for the traffic levels attained on roads where they were tried.

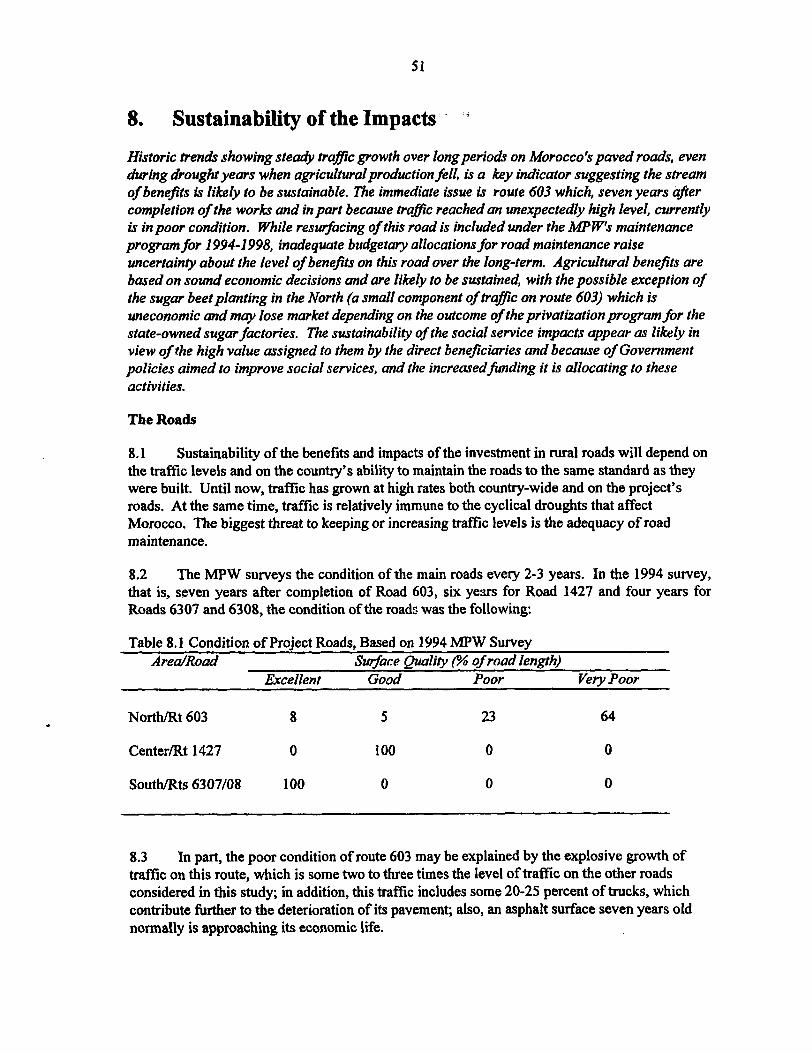
51
8. Sustainability of the Impacts . .-
Historic trends showing steady tra@c growth over long periods on Morocco’s paved roads even during drought years when agricultural production fell, is a key indicator suggesting the stream of bene$ts is likely to be sustainable. The immediate issue is route 603 which, seven years a$er completion of the works and in part because trafic reached an unexpectedly high level, currently is in poor condition. While resurfacing of this road is included under the MP W’s maintenance program for 1994-X 998, inadequate budgetary allocations for road maintenance raise uncertainty about the level of benefits on this road over the long-term. Agricultural benefits are based on sound economic decisions and are likely to be sustained, with the possible exception of the sugar beet planting in the North (a small component of traflc on route 603) which is uneconomic and may lose market depending on the outcome of the privatization program for the state-owned sugar factories. The sustainability of the social service impacts appear as likely in view of the high value assigned to them by the direct benejciaries and because of Government policies aimed to improve social services, and the increasedfinding it is allocating to these activities.
The Roads
8.1 Sustainability of the benefits and impacts of the investment in rural roads will depend on the traffic levels and on the country’s ability to maintain the roads to the same standard as they were built. Until now, traEc has grown at high rates both country-wide and on the project’s roads. At the same time, traffic is relatively immune to the cyclical droughts that affect Morocco. The biggest threat to keeping or increasing traffic levels is the adequacy of road maintenance.
8.2 The MPW surveys the condition of the main roads every 2-3 years. In the 1994 survey, that is, seven years after completion of Road 603, six years for Road 1427 and four years for Roads 6307 and 6308, the condition of the roads was the following:
Table 8.1 Condition of Project Roads, Based on 1994 MPW Survey Area/Road Surface Quality (?? of road length)
Excellent Good Poor Very Poor
NorthIRt 603 8 5 23 64
Center& 1427 0 100 0 0
South/Rts 6307/08 100 0 0 0
8.3 In part, the poor condition of route 603 may be explained by the explosive growth of traffic on this route, which is some two to three times the level of traffic on the other roads considered in this study; in addition, this traffic includes some 20-25 percent of trucks, which contribute further to the deterioration of its pavement; also, an asphalt surface seven years old normally is approaching its economic life.
52
8.4 More generally, there are three main issues related to maintenance and the sustainability of the roads benefits: the amount of budgetary resources for maintenance, the criteria for allocation of funding, and the maintenance administration. Inadequate budgetary resources for road maintenance has been a perennial problem in Morocco. The completion report of the fourth project, and, more strongly, the audit prepared by OED, noted this situation. More recently, the appraisal report of the highway project approved in 1995 reported that, as of 1993, there was a country-wide backlog of highway maintenance works estimated at Dh 1.74 billion. An increase in the overall tinding for roads appears unlikely due to a tight budget, and the Government is addressing this issue by shifting, to some extent, more resources for maintenance, relative to new road construction. Thefinding allocation issue is whether the limited funds are correctly allocated to the roads and type of maintenance with the highest pay-offs. The allocation of road funding is done at two levels: first, the DRCR allocated a tentative budget to each province based on four criteria: (a) length of paved roads in bad and very bad condition; (b) traflcic on paved roads; (c) total length of roads and (d) length of mountainous roads; second, individual roads maintenance priorities are assessed through a pavement management system. This allocation system is a considerable improvement over past practices, but the EVAL needs improvement to ensure correct counting of the benefits and identification of maintenance priorities. Administrution of maintenance, including programming, contracts and supervision of road works is carried out by 40 provincial offices reporting to seven regional offices. While this organization appears to have built-in incentives to optimize public expenditures for roads,” it could be improved by including road users in the road management process.
8.5 The maintenance of all four roads analyzed in this study fall under the responsibility of the MPW. The MPW’s Maintenance Action Plan for the period 1994-1998 includes the resurfacing of route 603. The sustainability of the benefits of this road hinges on the implementation of this plan.
The Socioeconomic Impacts
8.6 Agriculture. The improved project roads, to the extent they are kept well maintained, will be a key factor in ensuring the sustainability of the transformation and modernization of agricultural production that they helped bring about. The agricultural impacts, already in place for some years, are likely to be sustainable as the domestic market for produce is broadening thanks to improved incomes. Agricultural gains are, however, dependent on government trade and fiscal policies and on the opportunities for selling Moroccan fruits and vegetables in the European markets. The development of sugar beet planting in the Chefchaouen area along Route 603 is the agricultural impact most at risk. The sugar processing factories, which are state- owned, lose money, and are being considered for privatization. It is not clear whether, at a sufficiently low purchase price, such factories may become attractive for private sector investment and continued operationT3
8.7 The success achieved by the extension services in helping introduce new agricultural techniques is important for the sustainability of the agricultural benefits particularly as such
” This analysis relies largely on information provided in the appraisal report of the Secondary, Tertiary and Rural Roads Project.
” World Bank, 1994. Royaume du Maroc, Development Agro-lndustriel. Constraints et opportunities. World Bank, Washington. DC.
53
services are likely to be curtailed in view of Government policies to further reduce public expenditures.”
8.8 Social Services. The sustainability of the improvement in access to and use of health services, as well as improvements in women’s welfare, appears to be high because beneficiaries realize their direct value. This is the case, notably, of primary health care, whose benefits are tangible and immediate. Sustainability of the supply of services would be enhanced to the extent government decentralization policies are implemented and more budgetary decisions are made by the local governments. The sustainability of education impacts will depend largely on the level of budgetary allocations to primary education and on sustained economic growth; as noted elsewhere in this report, enrollment in primary education fell in the 1980s as a result of economic recession and there is a danger that a similar situation may occur in the future. The World Bank is assisting the social sectors through ongoing and newly-prepared projects, which should help in sustaining the benefits of social programs.”
u Government policies on extension services give special emphasis to irrigated areas where, on average, one extension center exists for every 3,000 hectares, whereas the ratio is only one center for every 100,000 hectares in rainfed areas. Oftht three project areas, only Chcfchaoucn is an irrigated one, and is likely to continue to benefit from intensive agricultural extension services.
” Basic Health and Basic Education Projects. These two projects were expected to be approved by the Bank’s Board during fiscal year 1996.

9. Conclusions
Conclusions
55
and Recommendations
9.1 The study, based on a broad database from surveys and focus groups, gathered unique socioeconomic information that allowed to assess the impact of road improvements beyond conventional cost-benefit analysis. Notably, the data permitted to quantify changes in economic and social indicators in the lo-year period covered by the study. Information from control zones where roads were not improved provided a proxy scenario for a “without project situation” and, when combined with feedback from focus groups, helped establish a logical chain of events to assess the relative role of the road improvements in the impacts reported. The main conclusions arc summarized below.
9.2
l
*
l
0
l
l
9.3
l
0
l
a
l
9.4
l
l
Transport InJ%.zstructure and Services. The improved road conditions led to:
year-round use of the roads, eliminating frequent road closures during rainy periods; reduced operating costs of vehicles, and lower rates for freight and passengers, resulting in substantial household transport savings relative to regions that did not benefit from road improvements; traffic increasing at rates higher than the past trend and comprising a larger proportion of trucks that offer lower transport rates; a major increase in the supply of rural passenger services, especially share-ride taxis; a higher degree of ownership of motorized vehicles, cars as well as trucks; and a substantial reduction in access time by the rural population to markets and social services.
Agriculture. Changes detected in the agricultural economy in the project areas were:
the overall level of agricultural activity increased in volume of production, productivity of the land, and monetary values of the output; the agricultural production mix was transformed, land use shifted from low-value cereals to high-value fruit orchards, and livestock production shifted to pure breed cows; the use of modem inputs, especially fertilizers, improved as distribution channels became easier and enjoyed lower costs; as a result of the shift to higher-value products, and the overall increase in yields, the value added per unit of cultivated land increased; related economic changes in workload, employment on and off-farm, establishment of new shops followed different patterns depending on the region.
Social sectors. Changes detected in social indicators in the project areas were:
in education, enrollment of children in primary school more than doubled between 1985 and 1995, and quality of education improved; as new facilities were built it became possible to recruit teachers in the rural areas served by the project, and absenteeism of both from students and teachers dropped; in health, visits per person to health facilities (hospitals and primary care facilities) nearly doubled over the period and, similarly to education, the quality of health services improved, as new health centers were built (except in the Marrakech area), supply of medicines was facilitated, health authorities launched a program to staff rural health
56
centers with a full-time doctor, and immunization and other health prevention programs became easier to implement;
l on women, while the road projects did not originally aim to have specific gender impacts, they did: girls’ enrollment in primary education more than trebled; women benefited from maternal and child health care programs; and, equally significant, the introduction of butaoe at affordable prices (thanks to the existence of paved roads) dramatically reduced women’s chores of daily collection of fuelwood for cooking and heating; and
l in rural-urban interaction, the improved rural transport services resulted in several-fold increases in social exchanges, both by relatives from the urban areas visiting the farms, and by farm household members visiting nearby cities.
9.5 Regional Distribution of Transport, Agricultural and Social Impacts. Many of the impacts were felt about equally in all three regions considered in the study. In the transport sector, this was the case with the elimination of road closures, increase in the amount of large trucks offering lower rates, and increase in the availability of share-ride taxis, all of which showed a high degree of impact. The Northern region enjoyed the most impact regarding traffic growth, reduction in operating costs and lowering rates of transport. In agriculture, the most consistent gains occurred in the Central region, which scored high in practically all categories of impacts (such as improved farmers’ access to markets, reduced prices for inputs and overall economic gains) followed closely by the Southern region. In the social sectors, the Central region also achieved the highest gains, while the other two regions attained somewhat lower gains. A summary of impacts by region is in Annex G.
9.6 Environment. Changes in transport conditions and in the agricultural economy had both negative and positive impacts on the environment, although overall, no environmentally sensitive areas were at risk by the road projects or by their direct and indirect effects:
,
a negative impacts were those resulting from the increased traffic and economic activity, that is, air and noise vehicular pollution, agricultural fertilizers and other chemicals which in all likelihood contaminated the water table;
l positive impacts stemmed mainly from transformation in the agricultural economy: curtailment of extensive goat and sheep herding and increase in tree plantations as well as from increased use of butane for cooking and heating which substituted for fuelwood, whose demand is larger than Morocco’s sustainable forests.
9.7 Projects’ Economic BeneJts. Savings in vehicle operating costs and avoidance of road closures generated by the paving of the roads yielded satisfactory economic rates of return for the investments. The increases in the level of and value added of agricultural outputs, in part triggered by the better road conditions, corroborate this finding.
9.8 Sustainability. The transport, agricultural and social impacts are likely to be sustainable. The only issue is Road 603 in the North which currently, seven years after opening, is in poor condition. The Ministry of Public Works has included this road for repaving under its 1994- 1998 maintenance program but actual implementation, on which the sustainability of the road’s benefits hinges, is uncertain due to inadequate funding for maintenance country-wide.
57
9.9 Monitoring of Road Impacts. Despite project objectives to develop and implement an impact monitoring system, this did not happen mainly because government authorities were not persuaded of the cost-effectiveness of the recommended monitoring program.
9.10 Integrating Road Improvements with Other Sectors. The findings of this study indicate that in most cases, the improvement of the roads was a necessary condition for the impact to happen, but other actions were also required, like investments and programs in education and health. While the project focused on roads alone, widespread impacts suggest that, in parallel, local authorities in other sectors did take into account the roads improvement plans in their own plans. It is not clear, however, whether the impact of the roads could have been made greater had more formal mechanisms for coordination of investments been devised from the beginning.
9.11 Comparison with Control Zones. In some cases, improvements in the control zones were equal or better than in the project zones. This indicates that the control zones, although they did not benefit from road improvements, are likely to have benefited from programs in other sectors which did not occur in the project zones.
Recommendations
9.12 The following recommendations are offered:
(a) Establish a practical rural road monitoring system. In the current program to pave 10,000 km of rural roads, an effective monitoring system could be set up with the following characteristics:
(9 select a small number of road, agriculture and social sector indicators;
(ii) arrange for each type of indicator to be collected by the respective sectoral, local-level authority, maybe once every two or three years;
(iii) integrate the collection of agricultural and social sectoral impact indicators in the annual survey carried out by these sectors (such as the agriculture annual survey on cereal production) and coordinate the type of data to be collected;
(iv) arrange for the local authorities (ideally with assistance by a university) to compile the data collected into a single report for each road, and disseminate the report to local and central authorities.
(b) increase local community participation in rural roads, through:
at the planning stage, exchanges such as “village meetings”, to ensure that road plans are properly and timely taken into account within the planning of all local- level activities;
(ii) for road maintenance, through direct participation of local stockholders in the
(cl
(4
(e!
58
1 funding allocation for this activity, such as, for example, the establishment of local “road boards”?6
Consider, and require if cost-effective, the introduction of mitigation measures, such as education campaigns and road signs, to reduce and or prevent the likely increase in road accidents and their consequences, resulting from the increased traffic levels and speeds when rural roads are paved.
Consider adopting for rural roads, identification and evaluation methodologies based on multi-criteria indicators: (i) that combine a minimum acceptable economic return with well defined social sector (mainly education and health) objectives and with social sectors investments integrated in local government budgets, or, (ii) for very low traffic levels and for a small part of the budget for rural roads (20 percent is a good practice), apply multi-criteria based solely on attaining social objectives represented by well defined indicators.
Reassess the cost-effectiveness of 4-meter pavements in rural roads, and further analyze the alternative to rehabilitate rural roads to good gravel standards. The very latest version of the Rank’s HDM model allows to conduct such kind of analysis.
36 Road Boards empowered to make decisions on allocation of road maintenance funds are a way to involve road users in the management of roads. See Ian Heggie, 1995. MoMgemenr OndFinancing ofRondr - AnAgendajiirRc@m. World Bank Technical Paper Number 275. Washington, DC.

Annex A
Study hypotheses and indicators
Area of Impact Indicator Hypothesis
. . onr
1. increases motorized traffic i) traffic counts; ii) use of animal traction for transport; and iii)estimates of household time savings
2. decreases transport costs i) HDM3 data; and ii) estimates of household transportation costs
savings .
3. improves access to services i) travel time to service
4. improves farmers’ access to markets and reduces i) transportation time to souk; prices paid for inputs as well as household ii) amount of produce to markets; expenditures iii) use of agriculture inputs;
iv) indexes of prices for agricultural and non- agricultural goods; and
v) prices of household inputs and consumer goods
5. increases the amount of land under cultivation, i) land use measures; productivity and production
6. attracts investments in agriculture
7. increases fanners’ incomes
8. decreases workload for men and women 9. reduces the demand for short-term labor
ii) production statistics; and iii)yields per hectare i) total land use data; and ii) CNCA activity i) agricultural value added; and ii) farmer estimates i) estimates of household time savings i) local estimates of unemployment; and ii) estimates of on farm labor demand and off-
farm labor supply 10. increases land and housing prices 11. increases other types of economic activities
i) local land and housing prices i) nights in hotels; ii) number of hotel rooms; iii) number of employees in tourist sector; and iv) number of small businesses (milling, mining,
garages, banks, and shops)
12. facilitates the use of social services i) frequency of contact with health facilities; and
13. leads to increasing social and economic infrastructure
ii) school attendance (gender segregated) i) number of health and educational facilities; ii) potable water and electricity availability; iii)number of small earthen dams; and iv) number of markets

Annex A 60
Area of [wpac( Hypothesis
Indicator
14. increases mobility and tightens rural-urban links i) number of visits to next largest town; ii) number of visits of urban relatives; and iii) number of rural and urban off-farm work
days
15. results in adverse impacts on the environment i) use of contaminating inputs; and ii) number of polluting activities
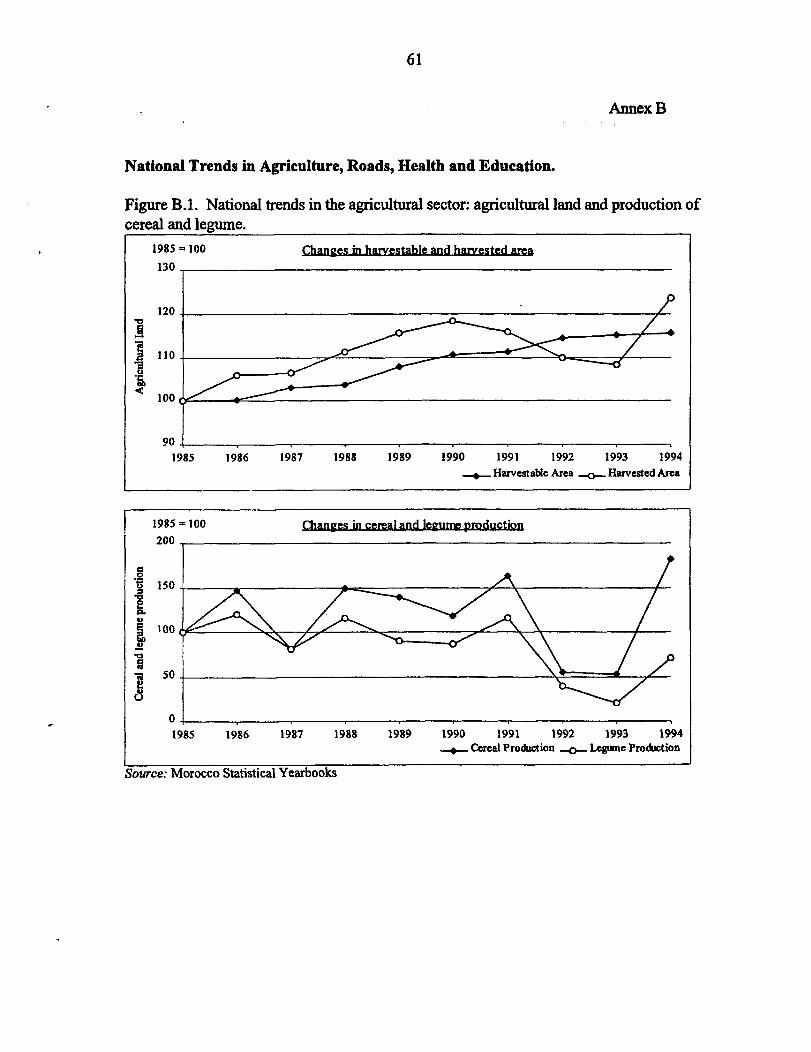
61
Annex B
c
National Trends in Agriculture, Roads, Health and Education.
Figure B. 1. National trends in the agricultural sector: agricultural laud and production cereal and lemme.
of
1985 - 100
130
120
110
100 c
90 I , 1985 1986 1987 1988 1989 1990 1991 1992 1993 1994
--eHarve.stable Area -o-Harvcstcd Area
1985 - 100
0 1985 1986 1987 1988
burce: Morocco Statistical Yearbooks
1990 1991 1992 1993 1994 - Cereal Production + Lcgmne Production
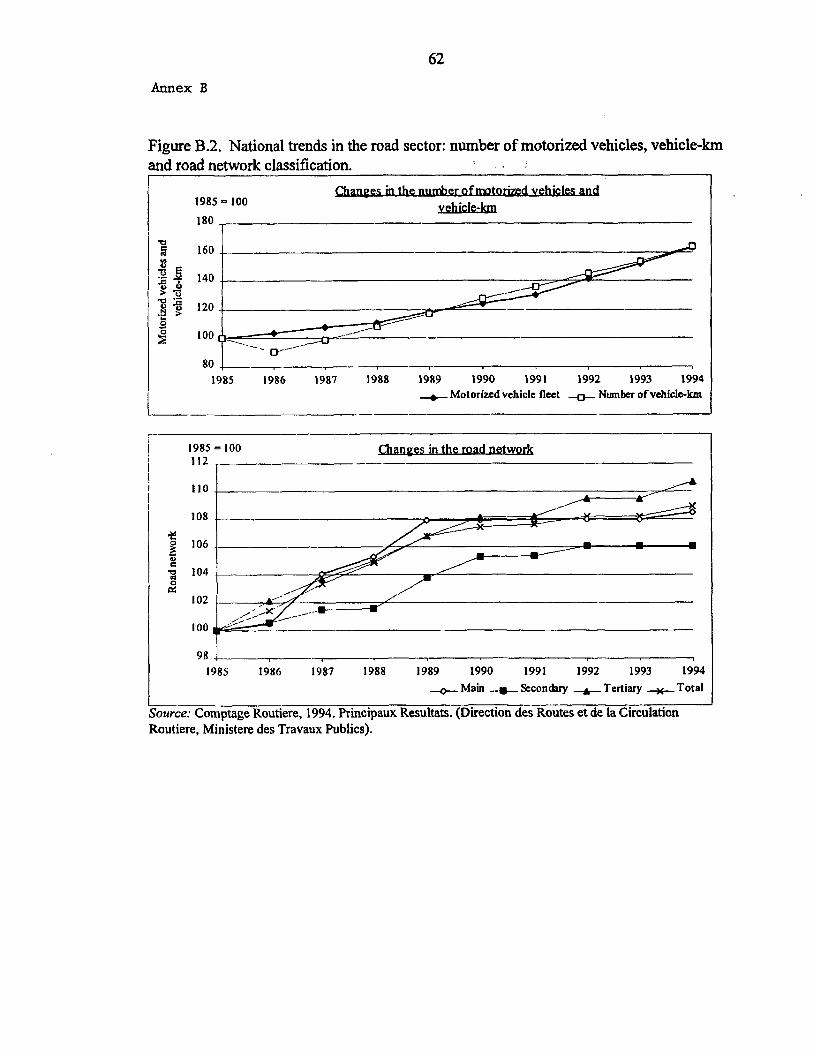
62
Annex B
Figure B.2. National trends in the road sector: number of motorized vehicles, vehicle-km and road network classification. . _
d v,eWes_i&
1987 1988 1989 1990 1991 1992 1993 1994 + Motorized vehicle fleet ._..o- Number of vehicle-km
1985 = 100 112
1
s m the r& network ---
110
108
106
104
102
100
981 I 1985 1986 1987 1988 1989 1990 1991 1992 1993 1994
-Main + Scondary t_ Tertiary ++_ Total
burce: Comptage Routiere, 1994. Principaux Resultats. (Direction des Routes et de la Circulation Routiere, Ministere des Travaux Publics).
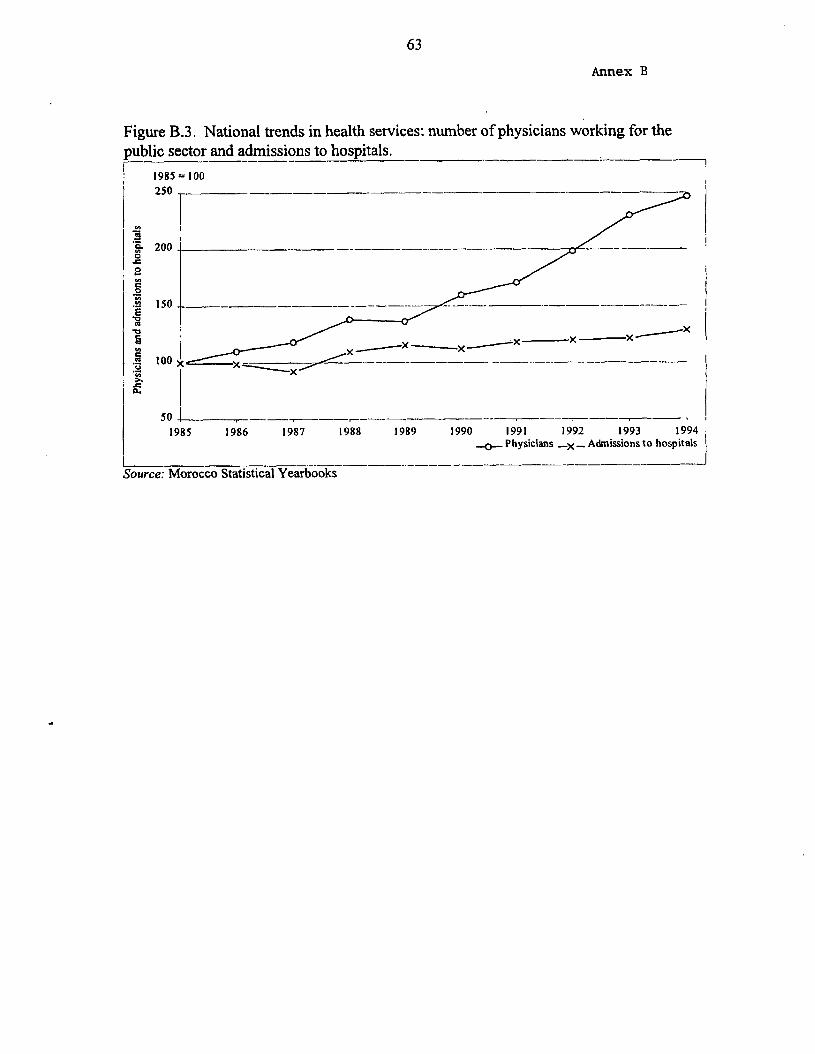
63
Annex B
Figure B.3. National trends in health services: number of physicians working for the ublic sector and admissions to hospitals. - ______---- .---- __---_ 7
2 ._ 5: % e 2 .o z ._ E -2
1985= 100 250 r________--__-_--_- --__--
I
200 ’ ______ -_--~__--__--__~_ ___-_ ___.
I------ w
150 ______--__--__-I-.-- __ _-__-. ___--___-__ __
)+---X-x
100 x
I
x~xL~~IICZ-_-__-___-____-_
;g I 5oj.-_- , --- -- r---7 ______---- ,
1985 1986 1987 1988 1989
i-- ------. Source: Morocco Statistical Yearbooks
I
1990 1991 1992 1993 I994 + Physicians _x_ Admissions to hospitals 1
___-_-_~- J
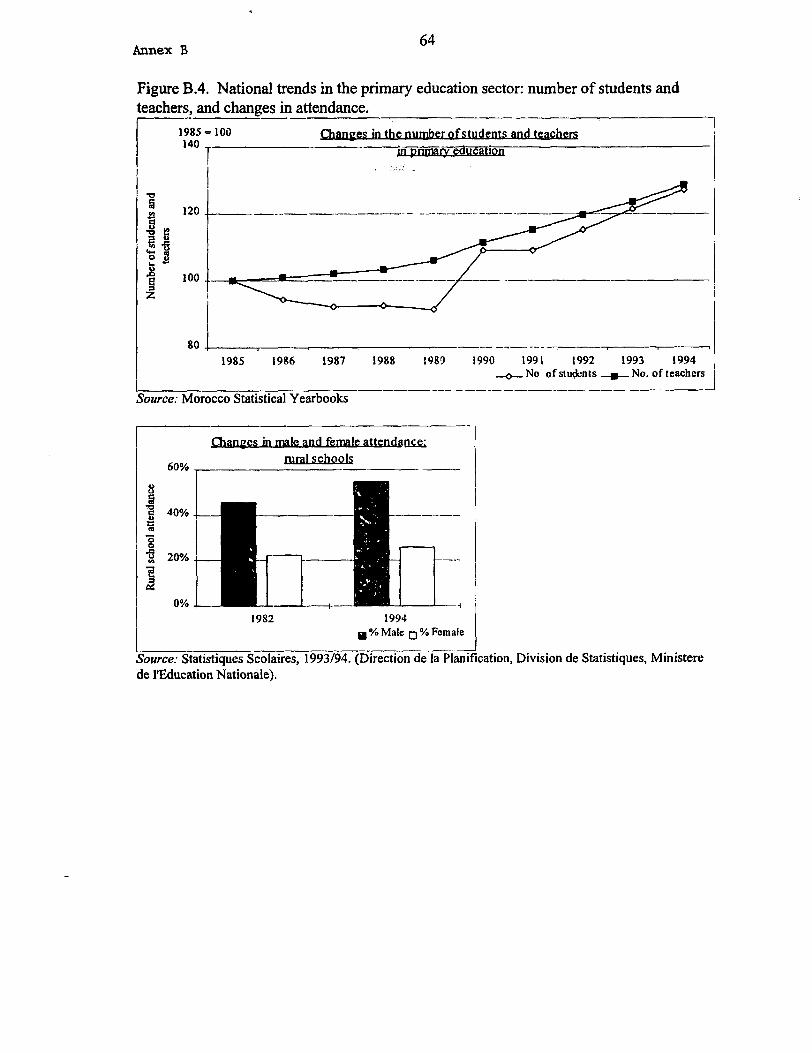
Annex B 64
Figure B.4. National trends in the primary education sector: number of students and teachers, and changes in attendance. r -- ----- I
1985=100 III the number ofstudents and&g&m
I T :. .: _
i s
r
_____-.--____-. -
I I --_ __-_-_ __,_--.Iy-.-, ,
1985 1986 1987 1988 1983 1990 1991 1992 1993 1994 -No of stu&nts -I)- No. of teachers
;
-__-- -_ --_------- --.- --_- -J burce: Morocco Statistical Yearbooks
~--
60%
v female attendam rural schools
a % Male 0 % Female _---
burce: Statistiques Scolaires, 1993/94. (DB-&%%&%cation, Division de Statistiques, Ministere S de I’Education Nationale).
65
Annex C
Study Methodology
Questionnaire Design
1. During the months of March and April, the team designed five questionnaires for data collection corresponding to different levels of survey: three at the household and village levels, one at the provincial public works representative level and one at the local representative of the ministry of agriculture level. The team trained two field data collectors responsible for administering the village and household level surveys, field tested the questionnaires (last week of April 1995), and continually refined the questionnaire items to respond to the levels of analysis required to test study hypotheses.
Primary Data
Household Level Data
2. Originally, sample design called for the collection of data from 200 small, medium and large-sized rural households in four project zones and four control zones, with households being selected approximately equally in each of the four study areas (fifty per area). Data collection began in Chefchaouen on May 29 and was completed two weeks later. Data for Settat was collected the first two weeks of June, and for Marrakech (two project roads) in the final two weeks of June. The study team also conducted focus group interviews and collected village level data and sample farm-level data (UnquCte Exploitation) at the same time as the household-level data. Copies of all questionnaires are included in Annex 2.
3. Because of the shortage of large-size farms in the Chefchaouen province, the study comprises household level data from 188 sample farms. Table 1 shows the frequency of farms sampled by size and region.
Focus Group Data
4. In each of the villages, Rural Sociologist conducted focus group interviews which varied between 10 and 20 villagers per interview. The focus group interview data provided important qualitative insights for the analysis of the household level data. See Volume 11, Annex A for the data made available from the focus group interviews.
Village Level Data
5. In addition to household-level data, village level data was collected for 9 project zone villages and 3 control zone villages. The Village Level Data questionnaire is in Annex 2.
Farm Level Data
6. Whenever household respondents indicated interest in the study, data collectors requested whether these villages would be willing to answer a series of detailed questions concerning farm budgets. Fourteen villagers agreed to such requests (3 in Chefchaouen, 4 in Settat, and 7 in Marrakech) and provided detailed crop production data (sugar beets, chickpeas, olives, barley,
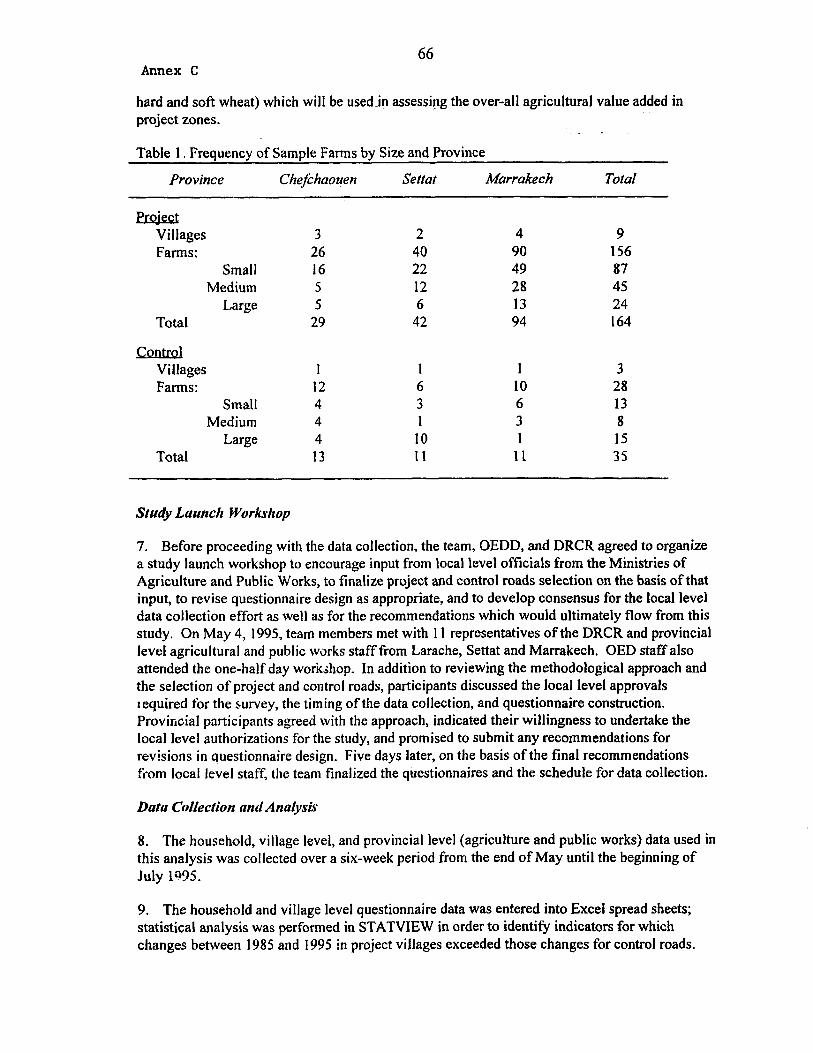
Annex C 66
hard and soft wheat) which will be used-in assessing the over-all agricultural value added in r
project zones.
Table 1. Frequency of Sample Farms by Size and Province
Province Chejizhaouen Settat Mnrrakech Total
Proiect Villages Farms:
Small Medium
Large Total
Control Villages Farms:
Small Medium
Large Total
3 2 4 9 26 40 90 156 16 22 49 87 5 12 28 45 5 6 13 24
29 42 94 164
1 12 4 4 4 13
1 I 3 6 10 28 3 6 13 1 3 8
10 I 15 I1 11 35
Study Launch Workshop
7. Before proceeding with the data collection, the team, OEDD, and DRCR agreed to organize a study launch workshop to encourage input from local level officials from the Ministries of Agriculture and Public Works, to finalize project and control roads selection on the basis of that input, to revise questionnaire design as appropriate, and to develop consensus for the local level data collection effort as well as for the recommendations which would ultimately flow from this study. On May 4, 1995, team members met with 11 representatives of the DRCR and provincial level agricultural and public works staff from Larache, Settat and Marrakech. OED staff also attended the one-half day workshop. In addition to reviewing the methodological approach and the selection of project and control roads, participants discussed the local level approvals required for the survey, the timing of the data collection, and questionnaire construction. Provincial participants agreed with the approach, indicated their willingness to undertake the local level authorizations for the study, and promised to submit any recommendations for revisions in questionnaire design. Five days later, on the basis of the final recommendations from local level staff, the team finalized the questionnaires and the schedule for data collection.
Data Collection and Analysis
8. The household, village level, and provincial level (agriculture and public works) data used in this analysis was collected over a six-week period from the end of May until the beginning of July lo95.
9. The household and village level questionnaire data was entered into Excel spread sheets; statistical analysis was performed in STATVIEW in order to identify indicators for which changes between 1985 and 1995 in project villages exceeded those changes for control roads.

67 Annex C
The data from the focus group interviews was textually analyzed to determine anecdotal support for the village and household level surveys. In early July 1995, a member of OED traveled to Rabat to review preliminary findings from Chefchaouen, verify World Bank requirements for rural sector impact evaluations and to visit one of the project roads (603 in Chefchaouen).
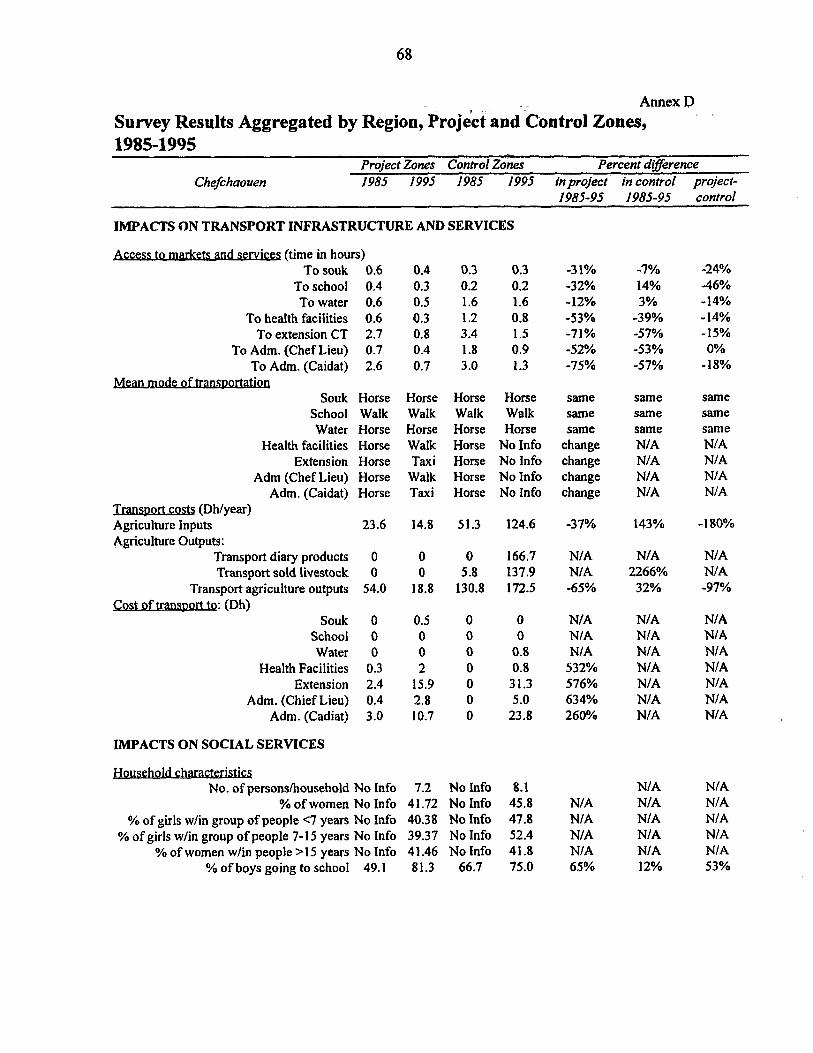
68
Annex D Survey Results Aggregated by Region,.Projekt a&ontrol Zones, 19851995
Project Zones Conlrol Zones Percent dlgerence Chefchaouen 1985 1995 1985 1995 inprojecr in conlrol project-
1985-95 1985-95 conlrol
IMPACXSONTRANSPORTINFRASTRUCTUREANDSERVICES
p (time in hours) To souk
To school To water
To health facilities To extension CT
To Adm. (Chef Lieu) To Adm. (Caidat)
Mean mode of transpe Souk
School Water
Health facilities Extension
Adm (Chef Lieu) Adm. (Caidat)
-port costs (Dh/year) Agriculture Inputs Agriculture Outputs:
Transport diary products Transport sold livestock
Transport agriculture outputs Cost of tritIlsport tQ: (Dh)
Souk School Water
Health Facilities Extension
Adm. (Chief Lieu) Adm. (Cadiat)
IMPACTSONSOCIALSERVICES
0.6 0.4 0.3 0.3 -3 I% -7% 0.4 0.3 0.2 0.2 -32% 14% 0.6 0.5 1.6 1.6 -12% 3% 0.6 0.3 1.2 0.8 -53% -39% 2.7 0.8 3.4 1.5 -71% -57% 0.7 0.4 1.8 0.9 -52% -53% 2.6 0.7 3.0 I.3 -75% -57%
Horse Horse Horse Horse same Walk Walk Walk Walk same Horse Horse Horse Horse same Horse Walk Horse No Info change Horse Taxi Horse No Info change Horse Walk Horse No Info change Horse Taxi Horse No Info change
same same same N/A N/A N/A N/A
23.6 14.8 51.3 124.6 -37% 143%
0 0 0 166.7 N/A 0 0 5.8 137.9 N/A
54.0 18.8 130.8 172.5 -65%
N/A 2266%
32%
0 0.5 0 0 N/A N/A 0 0 0 0 N/A N/A 0 0 0 0.8 N/A N/A
0.3 2 0 0.8 532% N/A 2.4 15.9 0 31.3 576% N/A 0.4 2.8 0 5.0 634% N/A 3.0 10.7 0 23.8 260% N/A
No. of persons/household No Info % of women No Info
% of girls w/in group of people ~7 years No Info % of girls w/in group of people 7- 15 years No Info
% of women w/in people >15 years No Info % of boys going to school 49.1
7.2 No Info 8.1 41.72 No Info 45.8 40.38 No Info 47.8 39.37 No Info 52.4 41.46 No Info 41.8 81.3 66.7 75.0
N/A N/A N/A N/A 65%
N/A N/A N/A N/A N/A 12%
-24% -46% -14% -14% -15% 0%
-18%
same same same N/A N/A N/A NIA
-180%
N/A N/A -97%
N/A N/A N/A N/A N/A N/A N/A
NIA N/A N/A N/A N/A 53%
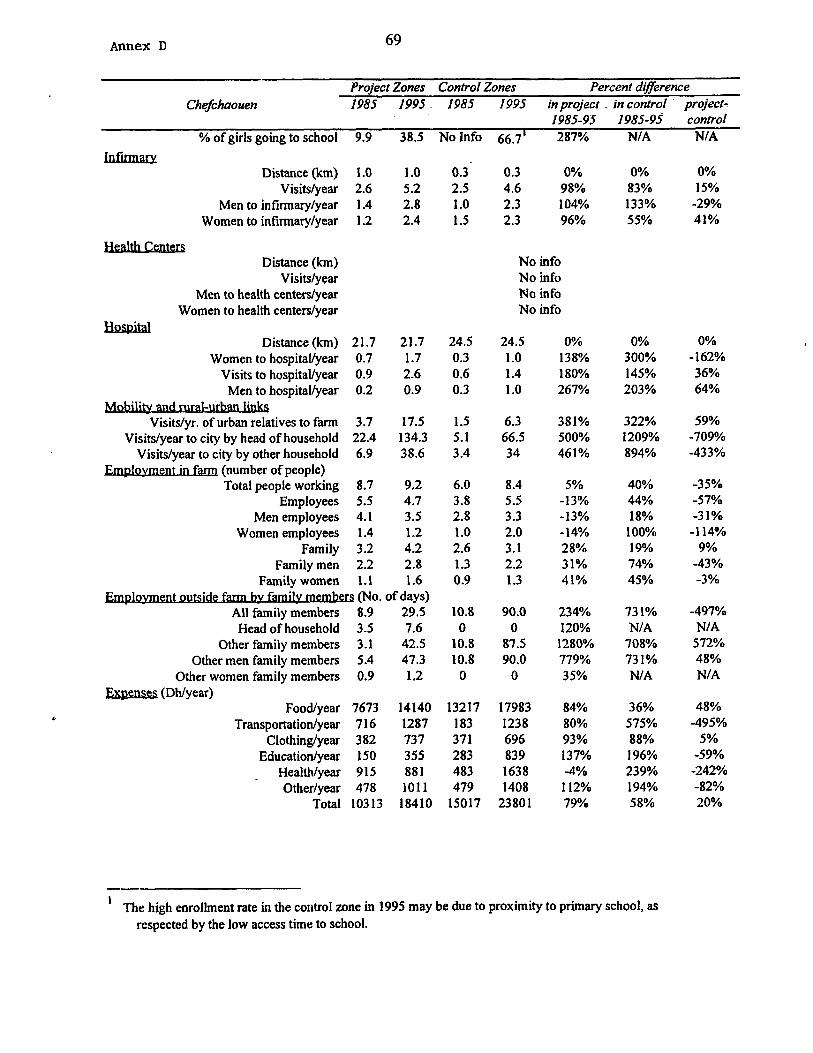
Anne% D 69
Project Zones Control Zones Percent difference Chefchaouen 1985 1995 1985 1995 in project _ in control. project-
I 985-95 1985-93 control % of girls going to school 9.9 38.5 No Info 66.7’ 287% NIA NIA
Distance (km) 1.0 Visits/year 2.6
Men to infirmary/year 1.4 Women to infirmary/year 1.2
Centers Distance (km)
Visits/year Men to health centers/year
Women to health centers/year NosDital
Distance (km) Women to hospital/year
Visits to hospital/year Men to hospital/year
- Visits/yr. of urban relatives to farm
Visits/year to city by head of household Visits/year to city by other household
farm (number of people) Total people working
Employees Men employees
Women employees Family
Family men Family women
21.7 21.7 24.5 24.5 0% 0% 0% 0.7 1.7 0.3 1.0 138% 300% -162% 0.9 2.6 0.6 1.4 180% 145% 36% 0.2 0.9 0.3 1.0 267% 203% 64%
3.7 17.5 1.5 6.3 381% 322% 59% 22.4 134.3 5.1 66.5 500% 1209% -709% 6.9 38.6 3.4 34 461% 894% -433%
8.7 9.2 6.0 8.4 5% 40% -35% 5.5 4.7 3.8 5.5 -13% 44% -57% 4.1 3.5 2.8 3.3 -13% 18% -31% 1.4 1.2 1.0 2.0 -14% 100% -114% 3.2 4.2 2.6 3.1 28% 19% 9% 2.2 2.8 1.3 2.2 31% 74% -43% 1.1 1.6 0.9 1.3 41% 45% -3%
1 .o 5.2 2.8 2.4
Emblovment_ootside (No. of days) All family members 8.9 29.5
Head of household 3.5 7.6 Other family members 3.1 42.5
Other men family members 5.4 47.3 Other women family members 0.9 1.2
ExDenses (Dwyear) Food/year 7673 14140
Transportation/year 7 16 1287 Clothing/year 382 737
Education/year 150 355 Health/year 9 15 881 Other/year 478 1011
10.8 90.0 234% 73 1% -497% 0 0 120% N/A N/A
10.8 87.5 1280% 708% 572% 10.8 90.0 779% 73 1% 48%
0 0 35% N/A N/A
13217 17983 183 1238 371 696 283 839 483 1638 479 1408
Total 10313 18410 15017 23801
0.3. 0.3 0% 2.5 4.6 98% 1.0 2.3 104% 1.5 2.3 96%
No info No info No info No info
84% 80% 93% 137% -4% 112% 79%
0% 83% 133% 55%
36% 575% 88% 196% 239% 194% 58%
0% 15%
-29% 41%
48% -495%
5% -59%
-242% -82% 20%
’ The high enrollment rate in the coutrol zone in 1995 may be due to proximity to primary school, as respected by the low access time to school.
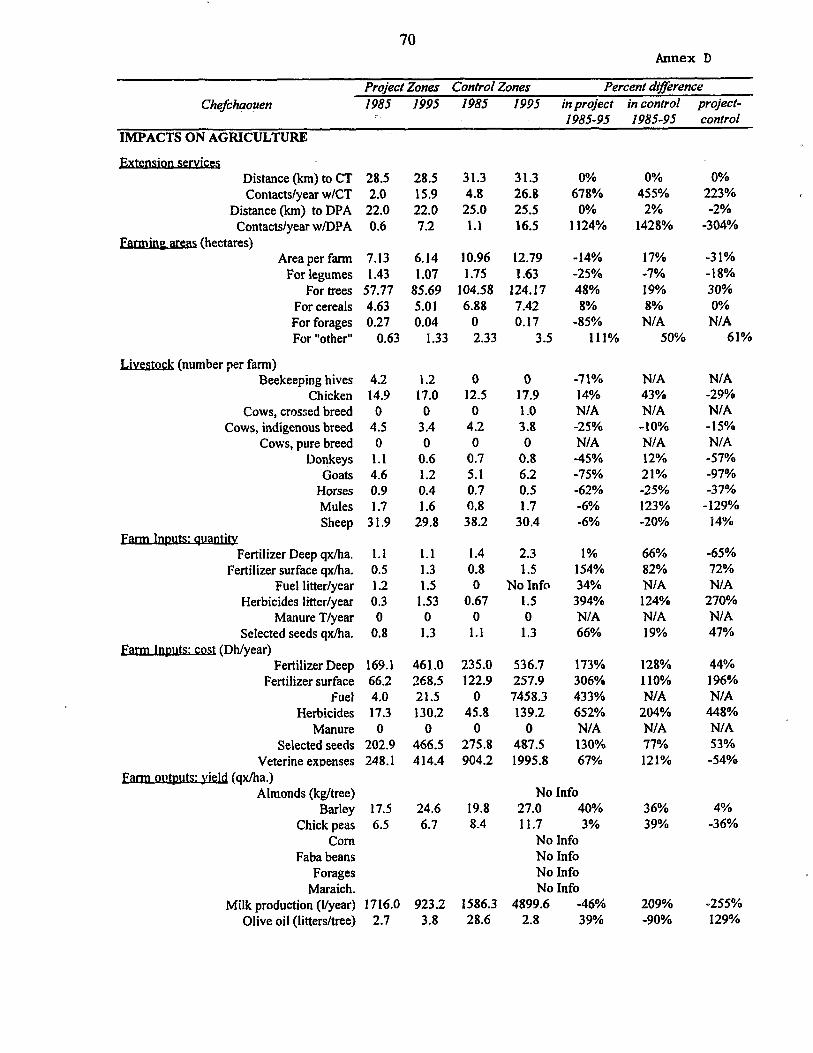
70 Annex D
Chefchaouen
IMPACTS ON AGRICULTURE
Project Zones Control Zones Percent difference 1985 1995 1985 1995 in project in control project-
j985-95 1985-95 control
Distance (km) to CT Contacts/year w/CT
Distance (km) to DPA Contacts/year w/DPA
Farmi- (hectares) Area per farm
For legumes For trees
For cereals For forages For “other”
Livestock (number per farm) Beekeeping hives
Chicken Cows, crossed breed
Cows, indigenous breed Cows, pure breed
Donkeys Goats
Horses Mules Sheep
Farm Inputs: qua&y Fertilizer Deep qxiha.
Fertilizer surface qx/ha. Fuel litter/year
Herbicides litter/year Manure T/year
Selected seeds qx/ha. Farm Inouts: cost (Dh/year)
Fertilizer Deep Fertilizer surface
Fuel Herbicides
Manure Selected seeds
Veterine expenses
Almonds (kg/tree) Barley
Chick peas Corn
Faba beans Forages
Maraich. Milk production (I/year)
Olive oil (litters/tree)
28.5 28.5 31.3 31.3 0% 0% 0% 2.0 15.9 4.8 26.8 678% 455% 223%
22.0 22.0 25.0 25.5 0% 2% -2% 0.6 7.2 1.1 16.5 1124% 1428% -304%
7.13 1.43
57.77 4.63 0.27
0.63
6.14 10.96 12.79 1.07 1.75 1.63
85.69 104.58 124.17 5.01 6.88 7.42 0.04 0 0.17
1.33 2.33 3.5
-14% 17% -31% -25% -7% -18% 48% 19% 30% 8% 8% 0%
-85% N/A N/A 111% 50% 61%
4.2 1.2 14.9 17.0
0 0 4.5 3.4 0 0
1.1 0.6 4.6 1.2 0.9 0.4 1.7 1.6
31.9 29.8
1.1 1.1 0.5 1.3 1.2 1.5 0.3 1.53 0 0
0.8 1.3
0 0 12.5 17.9
0 1 .o 4.2 3.8 0 0
0.7 0.8 5.1 6.2 0.7 0.5 0.8 1.7 38.2 30.4
1.4 2.3 0.8 1.5 0 No Info
0.67 1.5 0 0
1.1 1.3
-71% N/A N/A 14% 43% -29% N/A N/A N/A -25% -10% -15% N/A N/A N/A -45% 12% -57% -75% 21% -97% -62% -25% -37% -6% 123% -129% -6% -20% 14%
1% 66% -65% 154% 82% 72% 34% N/A N/A
394% 124% 270% N/A N/A N/A 66% 19% 47%
169.1 461.0 235.0 536.7 173% 128% 44% 66.2 268.5 122.9 257.9 306% 110% 196% 4.0 21.5 0 7458.3 433% N/A N/A 17.3 130.2 45.8 139.2 652% 204% 448%
0 0 0 0 N/A N/A N/A ’ 202.9 466.5 275.8 487.5 130% 77% 53% 248.1 414.4 904.2 1995.8 67% 121% -54%
17.5 24.6 6.5 6.7
4% -36%
1716.0 77
923.2 &., 3.8
No Info 19.8 27.0 40% 8.4 11.7 3%
No Info No Info No Info No Info
1586.3 4899.6 -46% 28.6 2.8 39%
36% 39%
209% -90%
-255% 129%
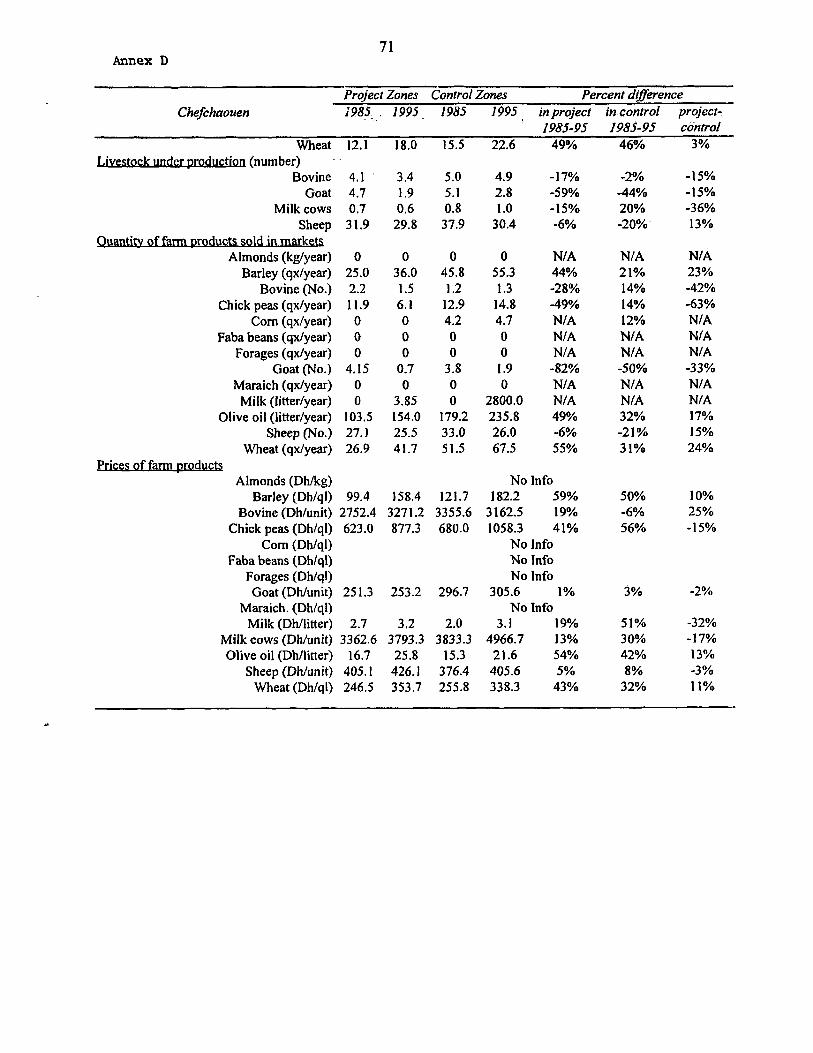
71 Annex D
Chefchaouen Project Zones Control Zones Percent difference i985.~ 1995_ 1985 1995 in project in control project- .
1985-95 1985-95 &intro/ Wheat 12.1 18.0 15.5 22.6 49% 46% 3%
m (number) Bovine
Goat Milk cows
Sheep of farm oroducts sold in m.&@s
Almonds (kg/year) Barley (qx/year)
Bovine (No.) Chick peas (qx/year)
Corn (qx/year) Faba beans (qxlyear)
Forages (qx/year) Goat (No.)
Maraich (qx/year) Milk (litter/year)
Olive oil (litter/year) Sheep (No.)
Wheat (qx/year) Prices of farm products
Almonds (Dh/kg) Barley (Dh/ql)
Bovine (Dh/unit) Chick peas (Dhlql)
Corn (Dh/ql) Faba beans (Dh/ql)
Forages (Dh/ql) Goat (Dh/unit)
Maraich. (Dh/ql) Milk (DWlitter)
Milk cows (Dh/unit) Olive oil (Dh/litter)
Sheep (Dh/unit) Wheat (Dh/ql)
4.1 3.4 5.0 4.9 -17% 4.7 1.9 5.1 2.8 -59% 0.7 0.6 0.8 1.0 -15% 31.9 29.8 37.9 30.4 -6%
0 0 0 0 N/A 25.0 36.0 45.8 55.3 44% 2.2 1.5 1.2 1.3 -28% 11.9 6.1 12.9 14.8 -49%
0 0 4.2 4.7 N/A 0 0 0 0 N/A 0 0 0 0 N/A
4.15 0.7 3.8 I .9 -82% 0 0 0 0 N/A 0 3.85 0 2800.0 N/A
103.5 154.0 179.2 235.8 49% 27.1 25.5 33.0 26.0 -6% 26.9 41.7 51.5 67.5 55%
99.4 158.4 121.7 2752.4 327 1.2 3355.6 623.0 877.3 680.0
251.3 253.2 296.7
2.7 3.2 2.0 3362.6 3793.3 3833.3
16.7 25.8 15.3 405.1 426.1 376.4 246.5 353.7 255.8
No Info 182.2 59%
3 162.5 19% 1058.3 41%
No Info No info No Info
305.6 1% No Info
3.1 19% 4966.7 13%
21.6 54% 405.6 5% 338.3 43%
-2% -44% 20% -20%
N/A 21% 14% 14% 12% N/A N/A -50% N/A N/A 32% -21% 31%
50% -6% 56%
3%
51% 30% 42% 8%
32%
-15% -15% -36% 13%
N/A 23% -42% -63% N/A N/A N/A
-33% N/A N/A 17% 15% 24%
10% 25% -15%
-2%
-32% -17% 13% -3% 11%
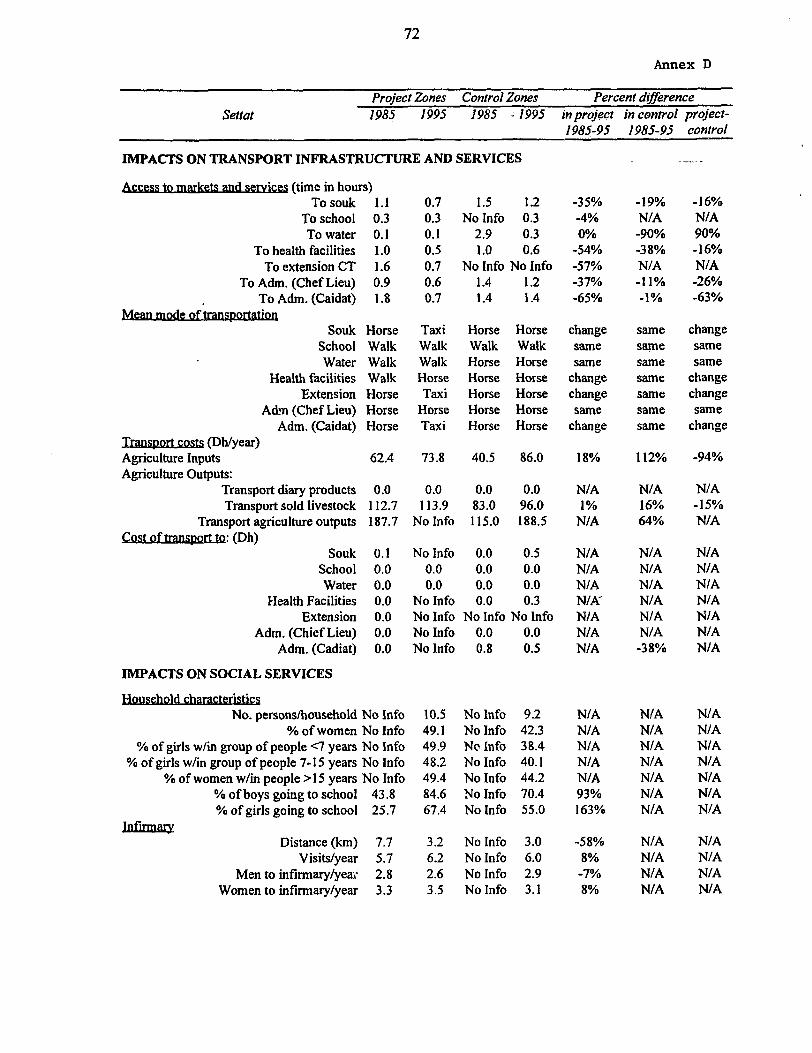
72
Annex D
Settat Project Zones Control Zones Percent dflerence 1985 1995 1985 ; 1995 in project in control project-
1985-95 1985-95 control
IMPACTS ON TRANSPORT INFRASTRUCTURE AND SERVICES -..-
Access (time in hours) To souk 1.1
To school 0.3 To water 0.1
To health facilities 1.0 To extension CT 1.6
To Adm. (Chef Lieu) 0.9 To Adm. (Caidat) 1.8
Souk School Water
Health facilities Extension
Adm (Chef Lieu) Adm. (Caidat)
TransDort @h/year) Agriculture Inputs Agriculture Outputs:
Transport diary products Transport sold livestock
Transport agriculture outputs CostoftransDort: (Dh)
Souk School Water
Health Facilities Extension
Adm. (Chief Lieu) Adm. (Cadiat)
Horse Taxi Horse Horse Walk Walk Walk Walk Walk Walk Horse Horse Walk Horse Horse Horse Horse Taxi Horse Horse Horse Horse Horse Horse Horse Taxi Horse Horse
62.4
0.0 0.0 0.0 0.0 112.7 113.9 83.0 96.0 187.7 No Info 115.0 188.5
0.1 No Info 0.0 0.5 0.0 0.0 0.0 0.0 0.0 0.0 0.0 0.0 0.0 No Info 0.0 0.3 0.0 No Info No Info No Info 0.0 No Info 0.0 0.0 0.0 No Info 0.8 0.5
IMPACTS ON SOCIAL SERVICES
No. persons/household % of women
% of girls w/ii group of people <7 years % of girls w/in group of people 7- I5 years
% of women w/in people >I 5 years % of boys going to school % of girls going to school
No Info 10.5 No Info 9.2 No Info 49.1 No Info 42.3 No Info 49.9 No Info 38.4 No Info 48.2 No Info 40.1 No Info 49.4 No Info 44.2
43.8 g4.6 No Info 70.4 25.7 67.4 No Info 55.0
Distance (km) 7.7 Visits/year 5.7
Men to infirmrylyeac 2.8 Women to infhmarylyear 3.3
0.7 1.5 1.2 -35% 0.3 No Info 0.3 -4% 0.1 2.9 0.3 0% 0.5 1.0 0.6 -54% 0.7 No Info No Info -57% 0.6 1.4 1.2 -37% 0.7 1.4 1.4 -65%
73.8 40.5 86.0
3.2 No Info 3.0 6.2 No Info 6.0 2.6 No Info 2.9 3.5 No Info 3.1
change same same
change change same
change
18%
N/A 1%
N/A
N/A N/A N/A NIA- NIA N/A N/A
N/A N/A N/A N/A N/A 93% 163%
-58% 8%
-7% 8%
-19% N/A -90% -38% NIA -11% -1%
same same same
same same
112%
N/A 16% 64%
N/A N/A N/A N/A N/A N/A -38%
N/A N/A N/A N/A N/A N/A N/A
N/A N/A N/A N/A
-16% N/A 90% -16% NIA -26% -63%
change same same
change change same
change
-94%
N/A -15% N/A
N/A NIA N/A N/A N/A N/A NIA
N/A N/A N/A N/A NIA NIA N/A
NIA N/A N/A N/A

73
Annex D
Settat Project Zones Control Zones Percent dtgerence 1985 1995 1985 1995 in project in control project-
1985-95 1985-95 control
Health._ Distance (km)
Visits/year Men to health center/year
Women to health center/year HosDital
Distance (km) Women to hospital/year
Visits to hospital/year Men to hospital/year
. . Mobrlny cindnrral_srrbanlinks Visits/yr. of urban relatives to farm
Visits/year to city by head of household Visits/year to city by other household
wvment in farm (number of people) Total people working
Employees Men employees
Women employees Family
Family men Family women
10.2 8.9 9.6 9.6 - 12% 2.9 6.8 3.7 4.9 131% 1.4 2.8 1.7 1.9 107% 1.6 4.0 2.2 3.0 147%
57.4 57.4 48.4 48.4 0.7 1.8 0.7 1.3 1 .o 2.6 0.9 1.7 0.3 0.9 0.2 0.4
0% 154% 163% 193%
0.8 26.6 1.3 2.3 3223% 49.0 342.6 96.4 129.8 600% 14.8 127.1 21.5 32.4 758%
7.5 7.7 6.4 6.7 3% 4.5 4.3 3.4 2.1 -3% 4.3 4.2 3.1 2.6 -4% 0.2 0.1 0.3 0.0 -47% 2.9 3.4 3.0 4.1 17% 2.0 2.3 1.9 2.8 12% 0.9 1.1 1.1 1.3 25%
vment outside farm bv famllva (No. of days) All family members 23.8 117.1
Head of household 16.3 18.0 Others family members 7.5 90.1
Other men family members 7.5 89.6 Other women family members 0.0 9.5
ExDenses (DMyear) Food/year 18525.0 33527.0
Transportation/year 2741.3 4032.8 Clothing/year 450.8 956.3
Education/year 630.8 1451.5 Health/year 1206.3 2613.8 Other/year 6 14.7 1970.4
Total 24168.7 4455 1.6
IMPACTS ON AGRICULTURE
Extension services Distance (km) CT 20.5 20.5
Contacts/year w/CT 9.9 14.0 Distance (km) DPA 90.2 90.2
Contacts/year w/DPA 0. I 1.7 &rr&a arm (hectares)
Area per farm 16.1 24.3 For legumes 0.4 0.2
For trees 9.0 13.2 For cereals 15.6 24.3 For forages 0.1 0.3
10.0 11.0 392% 2.0 2.0 11% 8.0 9.0 1096% 8.0 9.0 1094% 0.0 0.0 31567%
10972.0 21060.0 81% 690.0 1374.0 47% 395.0 675.0 112% 162.5 980.0 130% 455.0 800.0 117% 210.0 342.5 221%
12884.5 2523 1.5 84%
34.5 34.5 0% 0.1 0.4 42%
48.2 48.2 0% 0.0 0.0 1208%
6.7 6.7 51% 0.6 0.5 -59% 0.6 3.0 47% 6.0 6.1 55% 0.0 0.0 460%
0% 32% 12% 36%
0% 86% 89% 100%
77% 35% 51%
5% -38% -16%
-100% 37% 47% 18%
10% 0% 13% 13% N/A
92% 99% 71% 503% 76% 63% 96%
0% 300%
0% N/A
0% -18% 400%
2% N/A
-12% 99% 95% 111%
0% 68% 74% 93%
3146% 565% 708%
-1% 36% 12% 53% -20% -35% 7%
382% 11%
1084% 1082% N/A
-11% -52% 41%
-373% 41% 157% -11%
0% -258%
0% N/A
51% -41% -353% 54% N/A
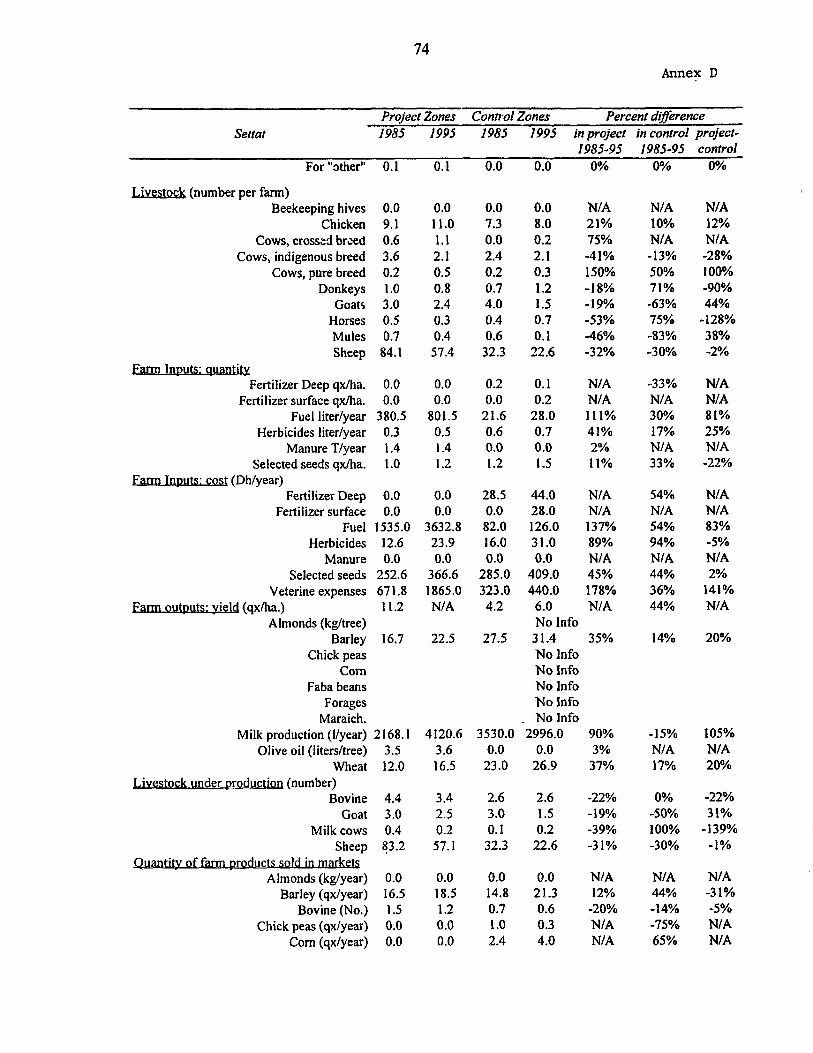
74 Annex D
Settat Prq’ect Zones Control Zones Percent dgerence 1985 1995 1985 1995 in project in control project-
3 985-95 1985-95 control 0% For “other” 0.1 0.1 0.0 0.0 0% 0%
L&&K& (number per farm) Beekeeping hives
Chicken Cows, crossed breed
Cows, indigenous breed Cows, pure breed
Donkeys Goats
Horses Mules Sheep
Farm inputs: ~UI.U& Fertilizer Deep qx/ha.
Fertilizer surface qx/ha. Fuel liter/year
Herbicides liter/year Manure T/year
Selected seeds qtia. uts: cost (Dh/year)
Fertilizer Deep Fertilizer surface
Fuel Herbicides
Manure Selected seeds
Veterine expenses outouts: vield (qx/ha.)
Almonds (kg/tree) Barley
Chick peas Corn
Faba beans Forages
Maraich.
0.0 0.0 0.0 0.0 N/A N/A N/A 9.1 11.0 7.3 8.0 21% 10% 12% 0.6 I.1 0.0 0.2 15% N/A N/A 3.6 2.1 2.4 2.1 -41% -13% -28% 0.2 0.5 0.2 0.3 150% 50% 100% I.0 0.8 0.7 1.2 -18% 71% -90% 3.0 2.4 4.0 1.5 -19% -63% 44% 0.5 0.3 0.4 0.7 -53% 75% -128% 0.7 0.4 0.6 0.1 -46% -83% 38%
84.1 57.4 32.3 22.6 -32% -30% -2%
0.0 0.0 0.2 0.1 N/A -33% N/A 0.0 0.0 0.0 0.2 N/A NIA N/A
380.5 801.5 21.6 28.0 111% 30% 81% 0.3 0.5 0.6 0.7 41% 17% 25% 1.4 1.4 0.0 0.0 2% N/A N/A 1.0 I .2 1.2 1.5 11% 33% -22%
0.0 0.0 28.5 44.0 N/A 54% N/A 0.0 0.0 0.0 28.0 N/A N/A N/A
1535.0 3632.8 82.0 126.0 137% 54% 83% 12.6 23.9 16.0 31.0 89% 94% -5% 0.0 0.0 0.0 0.0 N/A N/A N/A
252.6 366.6 285.0 409.0 45% 44% 2% 671.8 1865.0 323.0 440.0 178% 36% 141% 11.2 N/A 4.2 6.0 N/A 44% N/A
16.7 22.5 27.5 No Info 31.4 35% No Info No Info No Info No Info No Info
2996.0 90% 0.0 3%
26.9 37%
14% 20%
Milk production (I/year) 2 168.1 Olive oil (liters/tree) 3.5
Wheat 12.0 Livestock under production (number)
Bovine 4.4 Goat 3.0
Milk cows 0.4 Sheep 83.2
ntnv of farm Droducts sold in markets Almonds (kg/year) 0.0
Barley (qx/year) 16.5 Bovine (No.) 1.5
Chick peas (qxjyear) 0.0 Corn (qx/year) 0.0
4120.6 3530.0 3.6 0.0 16.5 23.0
-15% N/A 17%
105% N/A 20%
3.4 2.6 2.6 -22% 0% -22% 2.5 3.0 1.5 -19% -50% 31% 0.2 0.1 0.2 -39% 100% - 139% 57.1 32.3 22.6 -31% -30% -1%
0.0 0.0 0.0 N/A N/A N/A 18.5 14.8 21.3 12% 44% -31% 1.2 0.7 0.6 -20% -14% -5% 0.0 1 .o 0.3 N/A -75% N/A 0.0 2.4 4.0 N/A 65% N/A
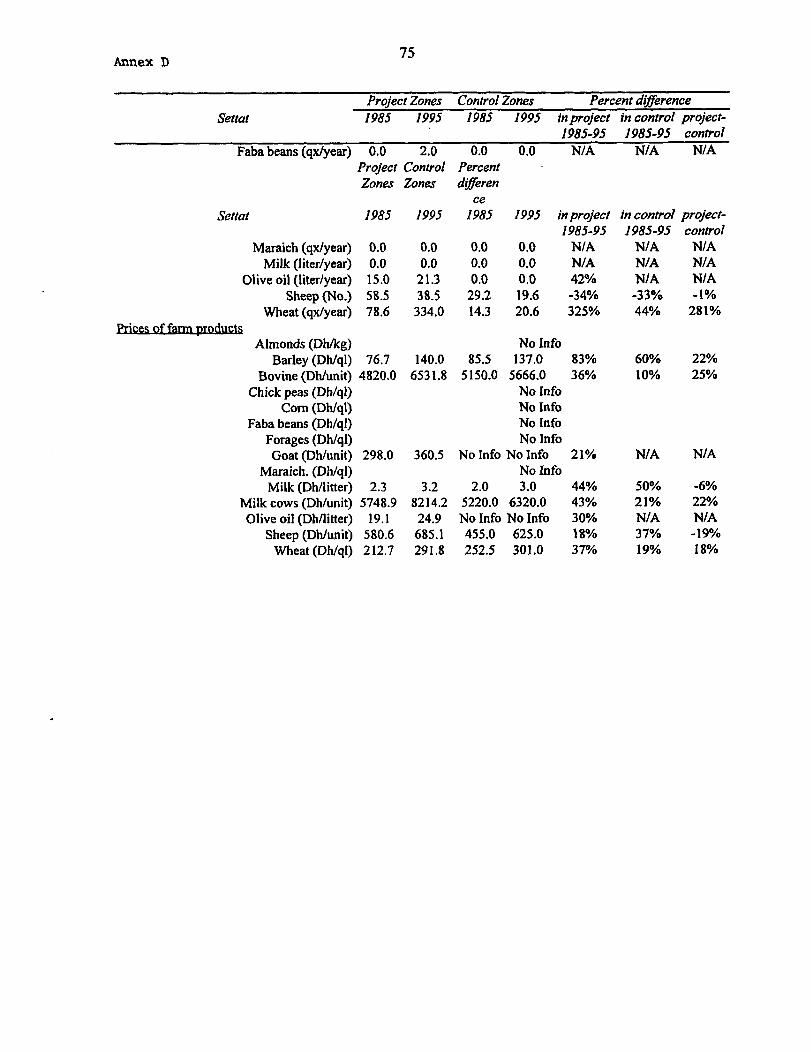
Annex D 75
Project Zones Control Zones Percent d@erence Settat I985 1995 1985 1995 in project in control project-
1985-95 1985-95 control Faba beans (qx/year) 0.0 2.0 0.0 0.0 N/A NIA N/A
Setfat
Maraich (qxlyear) Milk (liter/year)
Olive oil (liter/year) Sheep &lo.)
Wheat (qx/year)
Project Control Percent Zones Zones differen
1985 1995 IL 1995 in prqtzct in control projtzt- 1985-95 1985-95 control
0.0 0.0 N/A N/A N/A 0.0 0.0 N/A N/A N/A 0.0 0.0 42% N/A N/A
29.2 19.6 -34% -33% -1% 14.3 20.6 325% 44% 281%
0.0 0.0 0.0 0.0 15.0 21.3 58.5 38.5 78.6 334.0
Almonds (Dh/kg) Barley (Dh/ql)
Bovine (Dldunit) Chick peas (Dh/ql)
Corn (Dh/ql) Faba beans (Dh/qI)
Forages (Dh/ql) Goat (Dh/unit)
Maraich. (Dh/ql) Milk (Dh/litter)
Milk cows (Dh/unit) Olive oil (Dh/litter)
Sheep (Dh/unit) Wheat (Dh/ql)
76.7 140.0 4820.0 6531.8
298.0 360.5
2.3 3.2 5748.9 8214.2
19.1 24.9 580.6 685.1 212.7 291.8
No Info 85.5 137.0 83%
5 150.0 5666.0 36% No Info No Info No Info No Info
No Info No Info 21% No Info
2.0 3.0 44% 5220.0 6320.0 43% No Info No Info 30% 455.0 625.0 18% 252.5 301.0 37%
60% 22% 10% 25%
N/A NJA
50% 21% WA 37% 19%
-6% 22% N/A -19% 18%
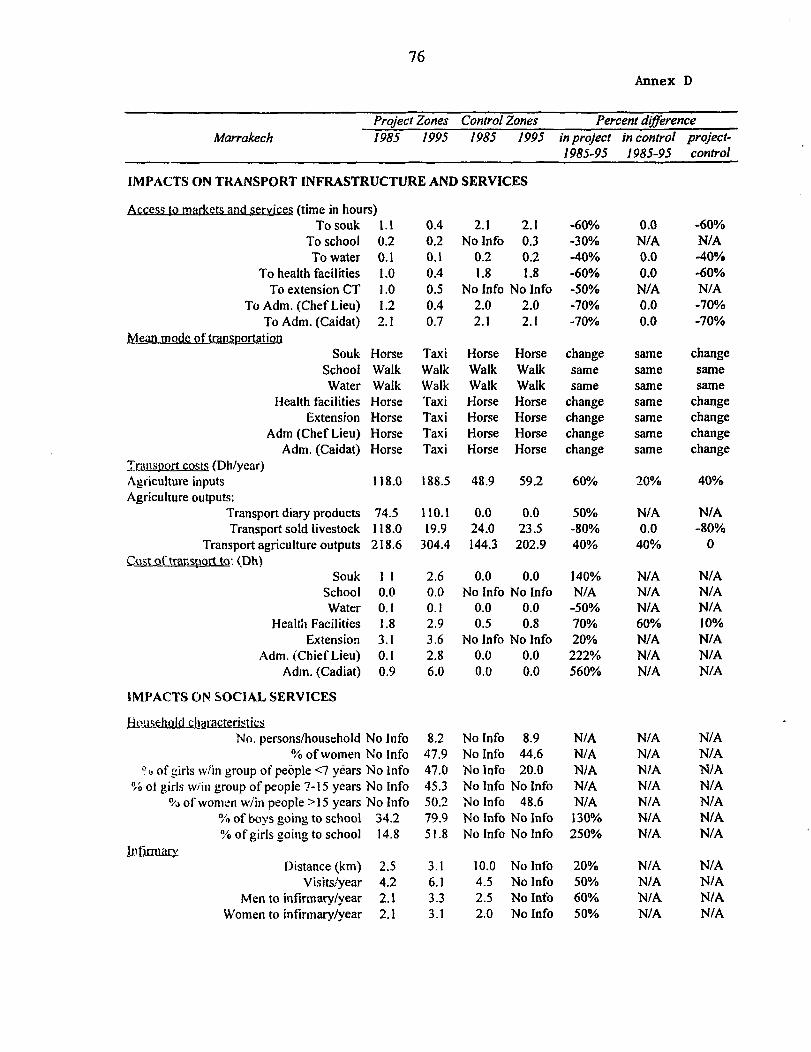
76
Annex D
Marrakech Project Zones Control Zones Percent d@erence 1985 1995 1985 1995 in project in control project-
1985-95 1985-95 control
IMPACTS ON TRANSPORT INFRASTRUCTURE AND SERVICES
Access to markets and services (time in hours) Tosouk 1.1
To school 0.2 To water 0.1
To health facilities 1.0 To extension CT I .O
To Adm. {Chef Lieu) I .2 To Adm. (Caidat) 2. I
Mean mode of transportation Souk Horse
School Walk Water Walk
Health facilities Horse Extension Horse
Adm (Chef Lieu) Horse Adm. (Caidat) Horse
Zc!nsoort costs (Dh/year) Agriculture inputs 118.0 Agriculture outputs:
Transport diary products 74.5 Transport sold livestock I 18.0
Transport agriculture outputs 218.6 Cust of transport to: (.Dh)
Souk 1 I School 0.0 Water 0.1
Health Facilities I .8 Extension 3. I
Adm. iChief Lieu) 0. I Adm. (Cadiat) 0.9
0.4 0.2 0.1 0.4 0.5 0.4 0.7
Taxi Horse Horse change Walk Walk Walk same Walk Walk Walk same Taxi Horse Horse change Taxi Horse Horse change Taxi Horse Horse change Taxi Horse Horse change
188.5 48.9 59.2 60%
110.1 0.0 0.0 50% 19.9 24.0 23.5 -80%
304.4 144.3 202.9 40%
fMPACTS Off SOCIAL SERVICES
Household characteristics No. persons/household No Info
o/o of women No Info i‘:, of girls wlin group of people <7 years No Info
$6 ol girls wiin group of people ?- 15 years No Info ?jti of women wiin people >I 5 years No Info
% of boys going to school 34.2 l’o ofgirls going to school 14.8
~$rmary
8.2 No Info 8.9 N/A 47.9 No Info 44.6 N/A 47.0 No info 20.0 N/A 45.3 No Info No Info NIA 50.2 No Info 48.6 N/A 79.9 No Info No Info 130% 51.8 No Info No Info 250%
Distance (km) 2.5 3.1 Visits/year 4.2 6.1
Men to infirmary/year 2.1 3.3 Women to infirmary/year 2.1 3.1
2.6 0.0 0.0 140% 0.0 No Info No Info N/A 0.1 0.0 0.0 -50% 2.9 0.5 0.8 70% 3.6 No Info No Info 20% 2.8 0.0 0.0 222% 6.0 0.0 0.0 560%
2.1 2.1 No Info 0.3
0.2 0.2 1.8 1.8
No Info No Info 2.0 2.0 2.1 2.1
10.0 No Info 20% 4.5 No Info 50% 2.5 No Info 60% 2.0 No Info 50%
-60% 0.0 -30% N/A -40% 0.0 -60% 0.0 -50% N/A -70% 0.0 -70% 0.0
same same same same same same same
20%
N/A 0.0
40%
N/A N/A N/A 60% N/A N/A N/A
N/A N/A NtA N/A N/A N/A N/A
N/A N/A N/A N/A
-60% NIA -40% -60% N/A -70% -70%
change same same
change change change change
40%
N/A -80%
0
N/A N/A N/A 10% N/A N/A N/A
N/A N/A N/A N/A N/A N/A N/A
N/A N/A N/A N/A
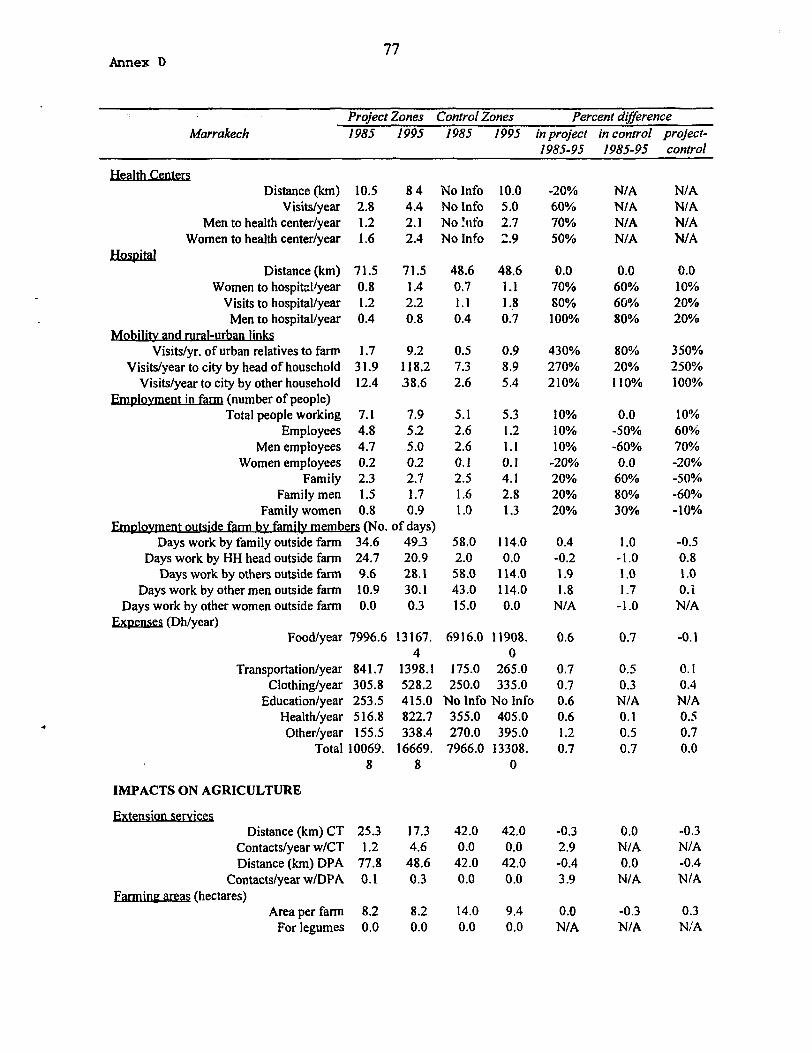
Annex D 77
Marrakech Project Zones Control Zones Percent dference 1985 I995 1985 1995 in project in control project-
1985-95 1985-95 control
Health Centers Distance (km)
Visits/year Men to health center/year
Women to health center/year HosDital
Distance (km)
. .
Women to hospitcl!year Visits to hospital/year
Men to hospital/year l&&g&y and rural-urban links
Visits/yr. of urban relatives to farm Visits/year to city by head of household
Visits/year to city by other household at in f&m (number of people)
Total people working Employees
Men employees Women employees
Family Family men
Family women
10.5 2.8 1.2 1.6
71.5 0.8 1.2 0.4
1.7 9.2 0.5 0.9 430% 80% 350% 31.9 118.2 7.3 8.9 270% 20% 250% 12.4 38.6 2.6 5.4 210% 110% 100%
7.1 4.8 4.7 0.2 2.3 1.5 0.8
familv members (No. Days work by family outside farm 34.6
Days work by HH head outside farm 24.7 Days work by others outside farm 9.6
Days work by other men outside farm 10.9 Days work by other women outside farm 0.0
I&XDSGS (Dh/year) Food/year 7996.6
Transportation/year 841.7 Clothing/year 305.8
8 4 No Info 4.4 No Info 2.1 No ‘nfo 2.4 No Info
71.5 48.6 1.4 0.7 2.2 1.1 0.8 0.4
10.0 -20% N/A N/A 5.0 60% N/A N/A 2.7 70% N/A N/A 2.9 50% N/A N/A
48.6 0.0 0.0 0.0 s.1 70% 60% 10% I.,8 80% 60% 20% 0.7 100% 80% 20%
7.9 5.1 5.3 10% 0.0 10% 5.2 2.6 I .2 10% -50% 60% 5.0 2.6 I.1 10% -60% 70% 0.2 0.1 0.1 -20% 0.0 -20% 2.7 2.5 4.1 20% 60% -50% 1.7 1.6 2.8 20% 80% -60% 0.9 I .o 1.3 20% 30% -10%
of days) 49.3 20.9 28.1 30.1 0.3
13167. 4
1398.1 528.2
58.0 114.0 0.4 1 .o -0.5 2.0 0.0 -0.2 -1.0 0.8 58.0 114.0 I .9 1 .o 1 .o 43.0 114.0 1.8 1.7 0.i 15.0 0.0 N/A -1.0 N/A
6916.0
175.0 250.0
11908. 0
265.0 335.0
Education/year 253.5 415.0 No Info No Info Health/year 516.8 822.7 355.0 405.0 Other/year 155.5 338.4 270.0 395.0
Total 10069. 16669. 7966.0 13308. 8 8
IMPACTS ON AGRICULTURE
sew= Distance (km) CT 25.3 17.3 42.0
Contacts/year w/CT I .2 4.6 0.0 Distance (km) DPA 77.8 48.6 42.0
Contacts/year wlDPA 0.1 0.3 0.0
Area farm per 8.2 8.2 14.0 For legumes 0.0 0.0 0.0
0
42.0 -0.3 0.0 -0.3 0.0 2.9 N/A N/A
42.0 -0.4 0.0 -0.4 0.0 3.9 N/A N/A
9.4 0.0 -0.3 0.3 0.0 N/A N/A N,‘A
0.6 0.7 -0.1
0.7 0.5 0.1 0.7 0.3 0.4 0.6 N/A N/A 0.6 0.1 0-S 1.2 0.5 0.7 0.7 0.7 0.0
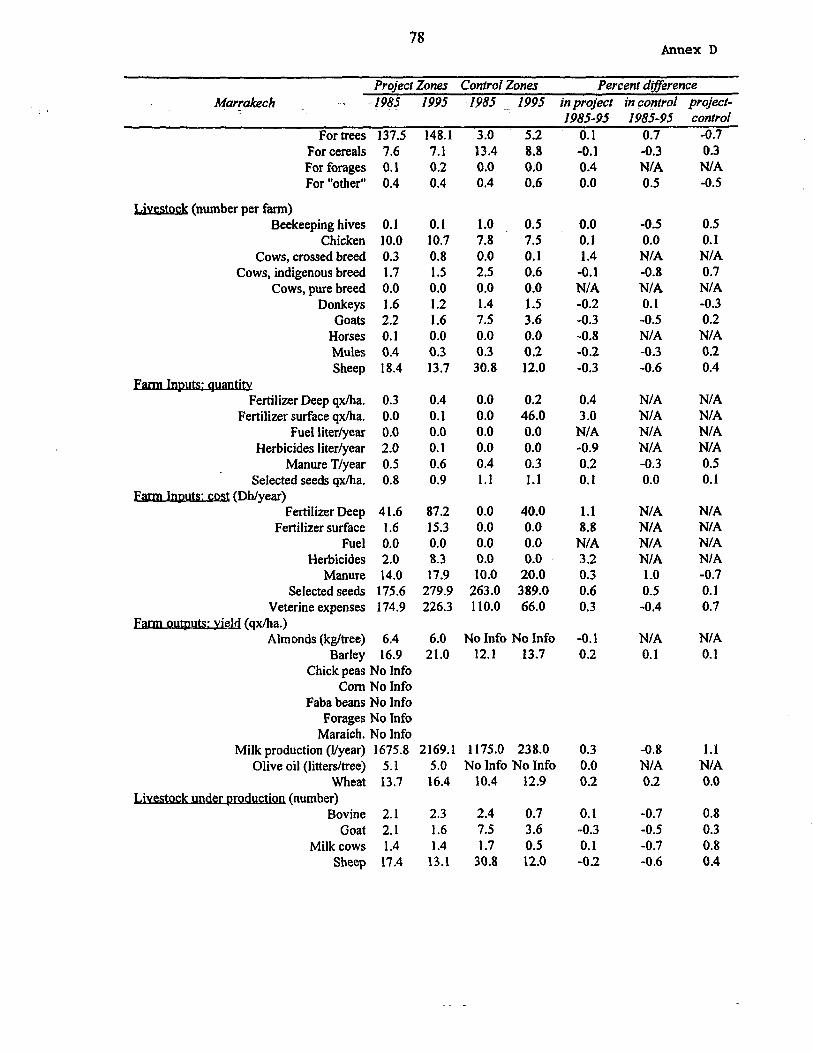
, .
78 Amex D
Project Zones Control Zones Percent difference A+qakech -% -’ 1983 1995 ~1985 __ 1995 in project in cofltrol project-
1985-95 1985-95 control Fortrees 137.5 148.1 3.0 5.2 0.1 0.7 -0.7
For cereals 7.6 For forages 0.1 For “other” 0.4
7.1 13.4 8.8 -0.1 -0.3 0.2 0.0 0.0 0.4 N/A 0.4 0.4 0.6 0.0 0.5
0.3 N/A -0.5
Livestock (number per farm) Beekeeping hives
Chicken Cows, crossed breed
Cows, indigenous breed Cows, pure breed
Donkeys Goats
Horses Mules Sheep
Fertilizer Deep qx/ha. Fertilizer surface qx/ha.
Fuel liter/year Herbicides liter/year
Manure T/year Selected seeds qxiha.
Farm (Dwyear) Fertilizer Deep
Fertilizer surface Fuel
Herbicides Manure
Selected seeds Veterine expenses
wuts: vi&i (qx/ha.) Almonds (kg/tree)
Barley Chick peas
Corn Faba beans
Forages Maraich.
Milk production (l/year) Olive oil (litters/tree)
Wheat oductistn (number)
Bovine Goat
Milk cows
0.1 0.1 1.0 0.5 0.0 -0.5 0.5 10.0 10.7 7.8 7.5 0.1 0.0 0.1 0.3 0.8 0.0 0.1 1.4 N/A N/A 1.7 1.5 2.5 0.6 -0.1 -0.8 0.7 0.0 0.0 0.0 0.0 N/A N/A N/A 1.6 1.2 1.4 1.5 -0.2 0.1 -0.3 2.2 1.6 7.5 3.6 -0.3 -0.5 0.2 0.1 0.0 0.0 0.0 -0.8 N/A N/A 0.4 0.3 0.3 0.2 -0.2 -0.3 0.2 18.4 13.7 30.8 12.0 -0.3 -0.6 0.4
0.3 0.4 0.0 0.2 0.4 N/A N/A 0.0 0.1 0.0 46.0 3.0 N/A N/A 0.0 0.0 0.0 0.0 N/A N/A N/A 2.0 0.1 0.0 0.0 -0.9 N/A N/A 0.5 0.6 0.4 0.3 0.2 -0.3 0.5 0.8 0.9 1.1 1.1 0.1 0.0 0.1
41.6 87.2 0.0 40.0 1.1 N/A N/A 1.6 15.3 0.0 0.0 8.8 N/A N/A 0.0 0.0 0.0 0.0 N/A N/A N/A 2.0 8.3 0.0 0.0 3.2 N/A N/A 14.0 17.9 10.0 20.0 0.3 1.0 -0.7
175.6 279.9 263.0 3 89.0 0.6 0.5 0.1 174.9 226.3 110.0 66.0 0.3 -0.4 0.7
6.4 16.9
No Info
6.0 No Info No Info 21.0 12.1 13.7
-0.1 0.2
0.3 0.0 0.2
0.1 -0.3 0.1 -0.2
N/A N/A 0.1 0.1
No Info No Info No Info No Info 1675.8 2169.1
5.1 5.0 13.7 16.4
1175.0 238.0 No Info No Info
10.4 12.9
2.1 2.3 2.4 0.7 2.1 1.6 7.5 3.6 1.4 1.4 1.7 0.5
Sheep 17.4 13.1 30.8 12.0
-0.8 1.1 N/A NIA 0.2 0.0
-0.7 0.8 -0.5 0.3 -0.7 0.8 -0.6 0.4
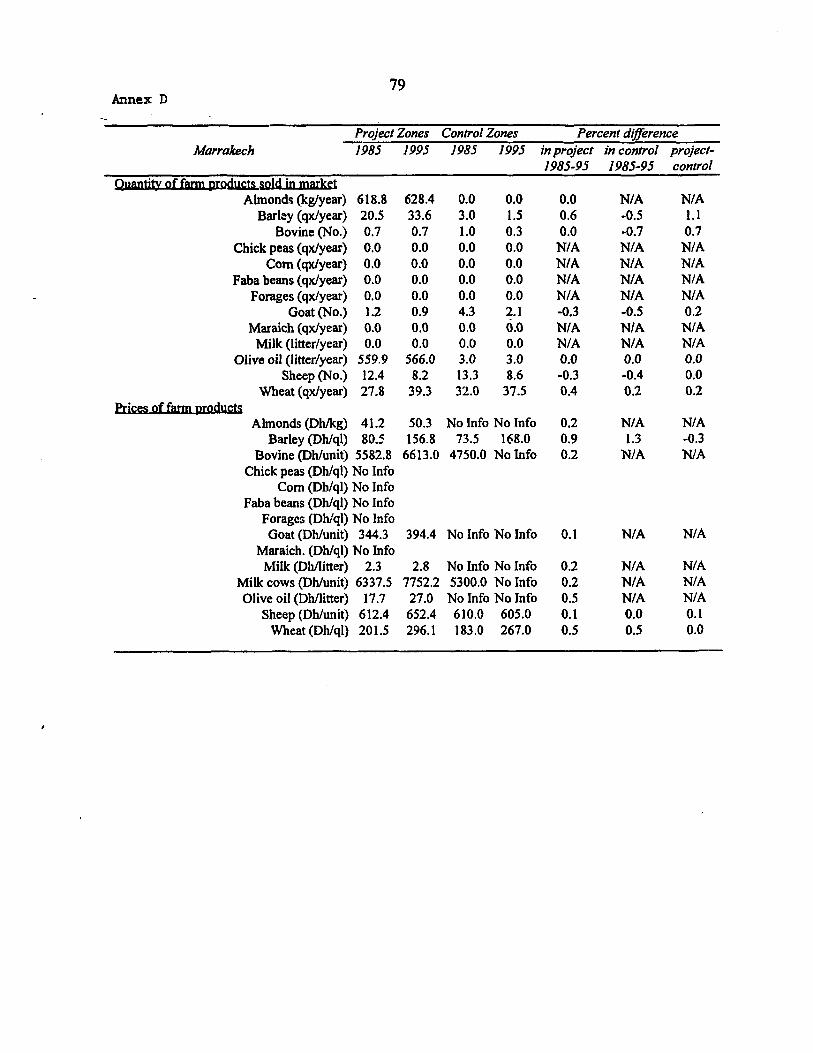
Annex D 79
-_
Marrakech Project Zones Control Zones Percent difference 1985 1995 1985 1995 in project in controI project-
1985-95 1985-95 control
Almonds (kg/year) 618.8 628.4 0.0 0.0 0.0 Nl A N/A Barley (qxlyear) 20.5 33.6 3.0 1.5 0.6 -0.5 1.1
Bovine (No.) 0.7 0.7 1.0 0.3 0.0 -0.7 0.7 Chick peas (qxlyear) 0.0 0.0 0.0 0.0 N/A N/A N/A
Corn (qx/year) 0.0 0.0 0.0 0.0 N/A N/A N/A Faba beans (qxlyear) 0.0 0.0 0.0 0.0 N/A N/A N/A
Forages (qxlyear) 0.0 0.0 0.0 0.0 N/A N/A NIA Goat (No.) 1.2 0.9 4.3 2.1 -0.3 -0.5 0.2
Maraich (qx/year) 0.0 0.0 0.0 0.0 N/A N/A N/A Milk (litter/year) 0.0 0.0 0.0 0.0 N/A N/A N/A
Olive oil (litter/year) 559.9 566.0 3.0 3.0 0.0 0.0 0.0 Sheep (No.) 12.4 8.2 13.3 8.6 -0.3 -0.4 0.0
Wheat (qx/year) 27.8 39.3 32.0 37.5 0.4 0.2 0.2
Almonds (Dhlkg) 41.2 50.3 No Info No Info Barley @h/ql) 80.5 156.8 73.5 168.0
0.2 0.9 0.2
0.1
0.2 0.2 0.5 0.1 0.5
N/A N/A 1.3 -0.3
N/A N/A Bovine @h/unit) 5582.8 6613.0 4750.0 No Info Chick peas (Dh/ql) No Info
Corn (Db/ql) No Info Faba beans (Dblql) No Info
Forages (Dh/ql) No Info Goat (Dh/unit) 344.3 394.4 No Info No Info
Maraich. (Dh/ql) No Info Milk (Dhllitter) 2.3 2.8 No Info No Info
Milk cows (Dhlunit) 6337.5 7752.2 5300.0 No Info Olive oil (Dh/Iitter) 17.7 27.0 No Info No Info
Sheep(Dh/unit) 612.4 652.4 610.0 605.0 Wheat (Dhlql) 201.5 296.1 183.0 267.0
NIA N/A
N/A N/A N/A N/A N/A N/A 0.0 0.1 0.5 0.0
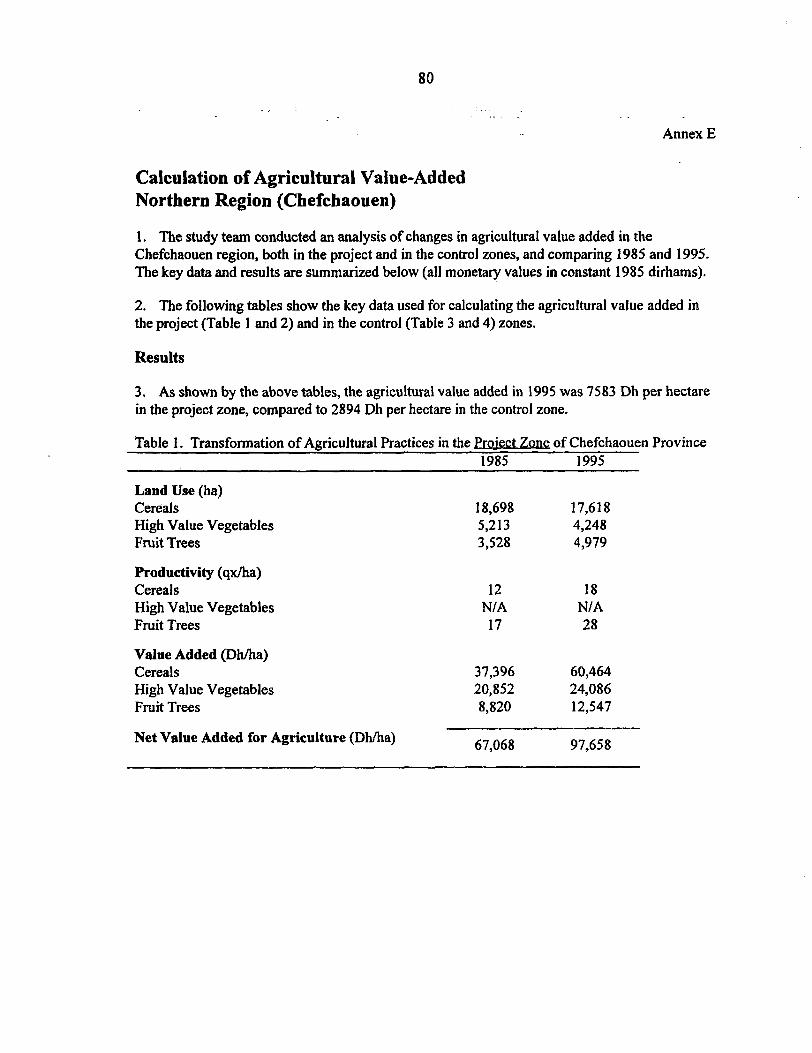
-. Annex E
Calculation of Agricultural Value-Added Northern Region (Chefchaouen)
1. The study team conducted an analysis of changes in agricultural value added in the Chefchaouen region, both in the project and in the control zones, and comparing 1985 and 1995. The key data and results are summarized below (all monetary values in constant 1985 dirhams).
2. The following tables show the key data used for calculating the agricultural value added in the project (Table 1 and 2) and in the control (Table 3 and 4) zones.
Results
3. As shown by the above tables, the agricultural value added in 1995 was 7583 Dh per hectare in the project zone, compared to 2894 Dh per hectare in the control zone.
Table 1. Transformation of Agricultural Practices in the Project of Chefchaouen Province 1985 1995
Land Use (ha) Cereals High Value Vegetables Fruit Trees
Productivity (qtia) Cereals High Value Vegetables Fruit Trees
Value Added (DhIha) Cereals High Value Vegetables Fruit Trees
Net Value Added for Agriculture (DhIha)
18,698 17,618 5,213 4,248 3,528 4,979
12 18 N/A N/A
17 28
37,396 60,464 20,852 24,086 8,820 12,547
67,068 97,658
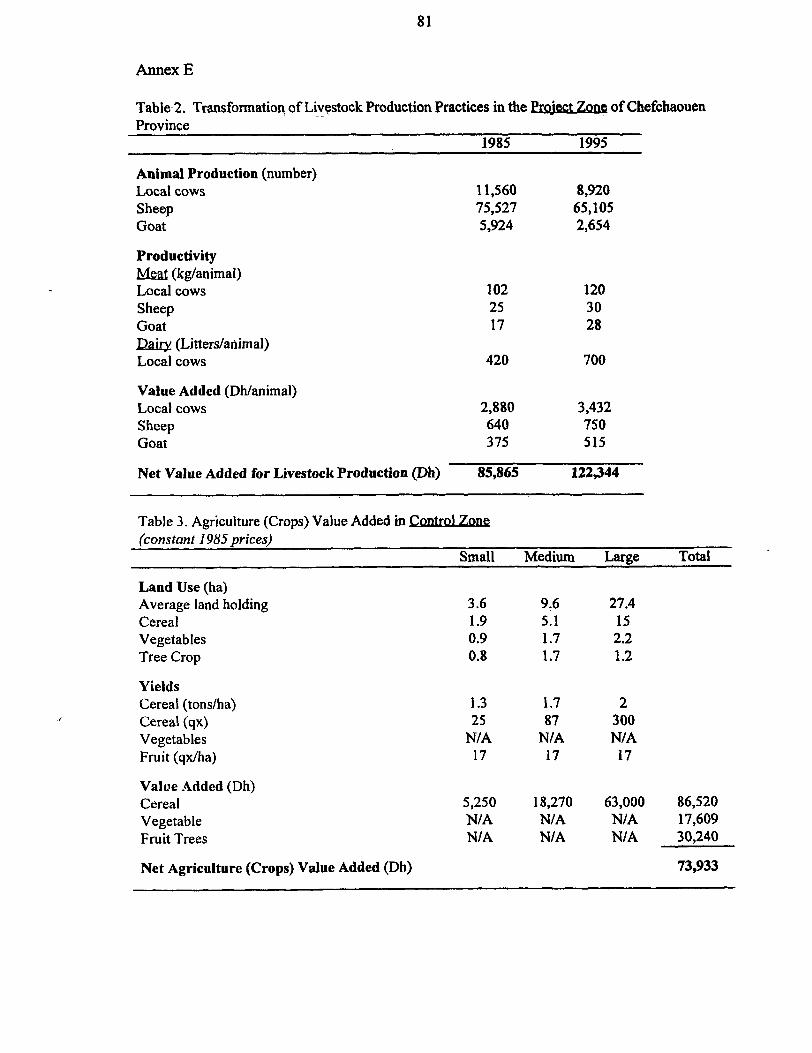
81
Annex E
Table-2. Transformation of Liystock Production Practices in the m of Chefchaouen Province
1985 1995
Animal Production (number) Local cows Sheep Goat
11,560 8,920 75,527 65,105 5,924 2,654
Productivity MG& (kg/animal) Local cows Sheep Goat Q&y (Litters/animal) Local cows
102 120 25 30 17 28
420 700
Value Added (Dh/animal) Local cows Sheep Goat
Net Value Added for Livestock Production (Dh)
2,880 3,432 640 750 375 515
85,865 122244
Table 3. Agriculture (Crops) Value Added in Control (constant 1985 prices)
Small Medium Large Total
Land Use (ha) Average land holding Cereal Vegetables Tree Crop
Yields Cereal (tons/ha) Cereal (qx) Vegetables Fruit (qx/ha)
Value Added (Dh) Cereal Vegetable Fruit Trees
3.6 9.6 27.4 1.9 5.1 15 0.9 1.7 2.2 0.8 1.7 1.2
1.3 1.7 2 25 87 300
N/A N/A N/A 17 17 17
5,250 18,270 63,000 86,520 N/A N/A N/A 17,609 N/A N/A N/A 30,240
Net Agriculture (Crops) Value Added (Dh) 73,933
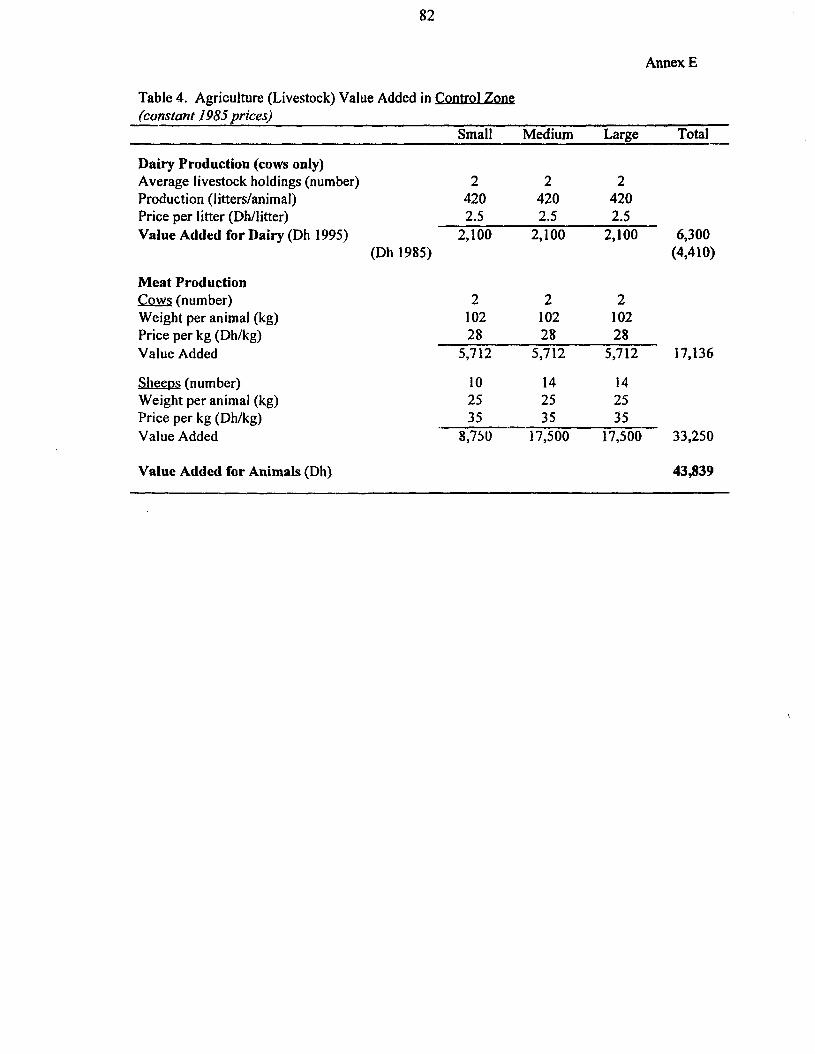
82
Annex E
Table 4. Agriculture (Livestock) Value Added in -01 Zone (constant 198.5 prices)
Small Medium Large Total
2 2 2 420 420 420
Dairy Production (cows only) Average livestock holdings (number) Production (litters/animal) Price litter _ per (Dh/Iitter) 2.5 2.5 2.5 Value Added for Dairy (Dh 1995) 2,100 2,100 2,100 6,300
(Dh 1985) (4,410)
Meat Production Cows (number) Weight per animal (kg) Price kg (Dh/kg) per Value Added
2 2 2 102 102 102 28 28 28
5,712 5,712 5,712 17,136
Sheeps (number) 10 14 14 Weight per animal (kg) 25 25 25 Price kg (Dh/kg) per 35 35 35 Value Added 8,750 17,500 17,500 33,250
Value Added for Animals (Dh) 43,839

83
Annex F
Econo+Analysis of Roag Improvements
Economic Evaluation Using HDM-III Model
1. The consultants working for MTDS carried out an economic evaluation of the three road projects, based on the application of the HDM-III model. This model, developed by the World Bank, is regularly used by the MPW/DRCR to assess road investments.
2. To collect traffic data, during the last two weeks of June and all of July 1996, the DRCR, in collaboration with local level public works officials, organized both visual and automatic trafftc counts in each of the project zones. Visual counts were conducted over two consecutive days (one market, one non-market) and included 6 categories of vehicular traffic. In addition, the team used data from the National Roads Studies and Research Center in order to calculate vehicle operating costs.
3. For purposes of the HDM analysis, traffic data was compressed into five categories of vehicles (from the seven categories observed): private passenger vehicles; pick-up, jeeps, mini- trucks and tractors; buses; freight trucks, less than 8 tons; freight trucks, more than 8 tons.
4. Road design characteristics, for both control and project roads, are shown in Table 1.
Table I. Road design characteristics Region Road Width
meters Northern
Project 603 4-6 Control 8203 4
Central Project 1427 4 Control 1411 3
Tensifi (South) Project P-6307 4 Project P-6308 4 Control C-6302 No Info
Shoulder Topography Soil meters Trpe
1.5 Mountain s2 1.5 Mountain s2
1.7 Flat Sl 2.0 Flat Sl
2 Flat s2 2 Flat s2
No Info Flat s2
5. Table 2 summarizes the traffic composition on project roads in 1995 by type of vehicle and by road.
Table 2. Observed average daily traffic by vehicle type for project roads (June 1995). (percentage of total counr)
Road Private Pickups, Buses Double axe1 Double axe1 vehicles jeeps, trucks trucks
tractors (less 8 tons) (more 8 tons)
Total
603 54 22 2 IO 12 640 1427 54 20 1 12 13 275 6308 51 19 0 15 15 212 6307 24 48 1 22 5 172
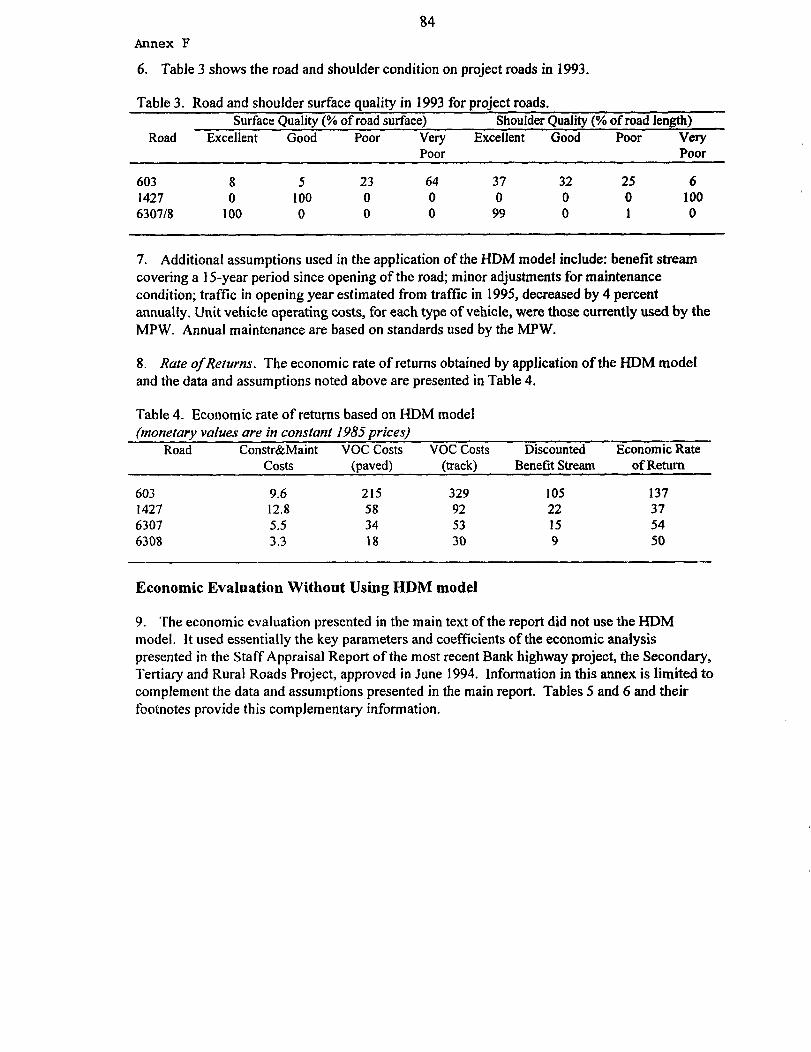
84 Annex F
6. Table 3 shows the road and shoulder condition on project roads in 1993.
Table 3. Road and shoulder surface quality in 1993 for project roads. Surface Quality (% of road surface) Shoulder Quality (“A of road length)
Road Excellent Good Poor Very Excellent Good Poor Very Poor Poor
603 8 5 23 64 37 32 25 6 1427 0 100 0 0 0 0 0 100 630718 100 0 0 0 99 0 1 0
7. Additional assumptions used in the application of the HDM model include: benefit stream covering a 1 S-year period since opening of the road; minor adjustments for maintenance condition; traffic in opening year estimated from traffic in 1995, decreased by 4 percent annually. Unit vehicle operating costs, for each type of vehicle, were those currently used by the MPW. Annual maintenance are based on standards used by the MPW.
8. Rute of Returns. The economic rate of returns obtained by application of the HDM model and the data and assumptions noted above are presented in Table 4.
Table 4. Economic rate of returns based on HDM model (monetary values are in constant I985 prices)
Road Constr&Maint voc costs voc costs costs (wed) (track)
603 9.6 215 329 1427 12.8 58 92 6307 5.5 34 53 6308 3.3 18 30
Discounted Economic Rate Benefit Stream of Return
105 137 22 37 15 54 9 50
Economic Evaluation Without Using HDM model
9. The economic evaluation presented in the main text of the report did not use the HDM model. It used essentially the key parameters and coefficients of the economic analysis presented in the Staff Appraisal Report of the most recent Bank highway project, the Secondary, Tertiary and Rural Roads Project, approved in June 1994. Information in this annex is limited to complement the data and assumptions presented in the main report. Tables 5 and 6 and their footnotes provide this complementary information.
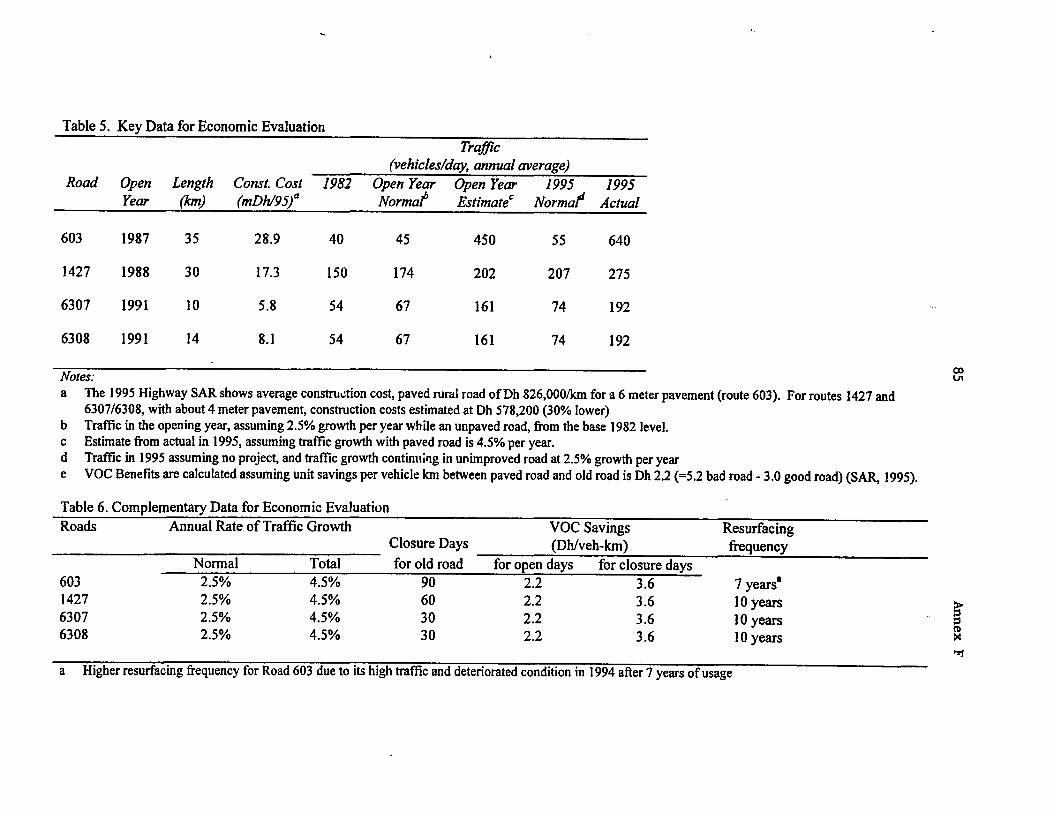
Table 5. Key Data for Economic Evaluation Trafic
(vehicles/day, annual average) Road Open Length Const. Cost I982 Open Year Open Year 1995 1995
Year (Xm) (mDw9.5)” Norma? EstimateC Norma# Actual
603 1987 35 28.9 40 45 450 55 640
1427 1988 30 17.3 150 174 202 207 275
6307 1991 10 5.8 54 67 161 74 192
6308 1991 14 8.1 54 67 161 74 192
Notes: a The 1995 Highway SAR shows average cons&u&ion cost, paved rurai road of Dh 826,OOOkm for a 6 meter pavement (route 603). For routes 1427 and
6307/6308, with about 4 meter pavement, construction costs estimated at Dh 578,200 (30% lower) b Traffic in the opening year, assuming 2.5% growth per year while an unpaved road, from the base 1982 level. c Estimate from actual in 1995, assuming tratfk growth with paved road is 4.5% per year. d Traffic in 1995 assuming no project, and traffic growth continuing in unimproved road at 2.5% growth per year e VOC Benefits are calculated assuming unit savings per vehicle km between paved road and old road is Dh 2.2 (=5.2 bad road - 3.0 good road) (SAR, 1995).
Table 6. Complementary Data for Economic Evaluation Roads Annual Rate of Traffic Growth
Closure Days Normal Total for old road
603 2.5% 4.5% 90 1427 2.5% 4.5% 60 6307 2.5% 4.5% 30 6308 2.5% 4.5% 30
VOC Savings (DMveh-km)
for open days for closure days 2.2 3.6 2.2 3.6 2.2 3.6 2.2 3.6
Resurfacing frequency
7 yearsa 10 years 10 years lOyears
a Higher resurfacing frequency for Road 603 due to its high traffic and deteriorated condition in 1994 after 7 years of usage

86
Annex G
Summary of Impacts
Table 8.1. Summary of impacts by regions according to area of impact and hypotheses - Area of impact Region
Hypotheses Overall Chefchaouen Settat Marrakech
structure and services increases motorized vehicle higher degree of ownership of cars
as well as trucks traffic increasing at rates higher than the past trend (Table 3.2)
decreases transportation reduction of operating costs of costs vehicles
lower rates of freight transport passengers transport
larger percentage of trucks in traffic offering lower rates (Table 3.3)
improvements in access to year-round use of roads, eliminating services frequent road closures during rainy
season
Low High
High Low
High Medium
High No Info High Medium High High
High High
Medium
Medium
Low
No Info Medium
High
High
major increase in the supply of rural passenger services, especially share- ride taxis
High High High
substantial reduction in access time by the rural population to markets and social services
High Medium High
Apriculture improves farmers’ access to markets Low High Low
reduces prices paid for inputs Low High Medium
increases the amount of land the overall level of agricultural under cultivation, activity increased
Medium Medium High
productivity and production attracts investments in increases use of modem inputs, agriculture especially fertilizers (as distribution High High Low
channels became easier and lower cost)
increases farmers’ incomes - agricultural production mix was Low High High transformed, and land use was shifted from low-value cereals to high-value fruit orchards - livestock production was shifted to Low High Low pure breed cows as a result of the shift to higher- value products, and the overall increases in yields, the value added per unit of cultivated land increased (para. 4.11)
Low Low High

Annex G a7
Area of impact Region Hypotheses Overall Chefchaouen Settat Marrahzch
decreases workload for men’ due to related economic changes LOW Medium High and women reduces.the demand for inconclusive from available data short-term labor increases land and housing Inconclusive from available data prices increases other types of establishment of new shops Low High Low economic activities
facilitates the use of social services
visits per person to health facilities nearly doubled between 1985 and
High High High
1995 enrollment of children in primary school more than doubled over the period Overall Low High Medium Girls Low High Medium
leads to increasing social new education facilities were built Medium High Low - and economic infrastructure
new health centers were built High High Low increasing mobility and the improved rural transport tightens rural-urban links services resulted in several-fold
increases in social exchanges, both Low High Medium by relatives from the urban areas visiting the farms and by farm household members visiting nearby cities

.__ _

MAP SECTION
,

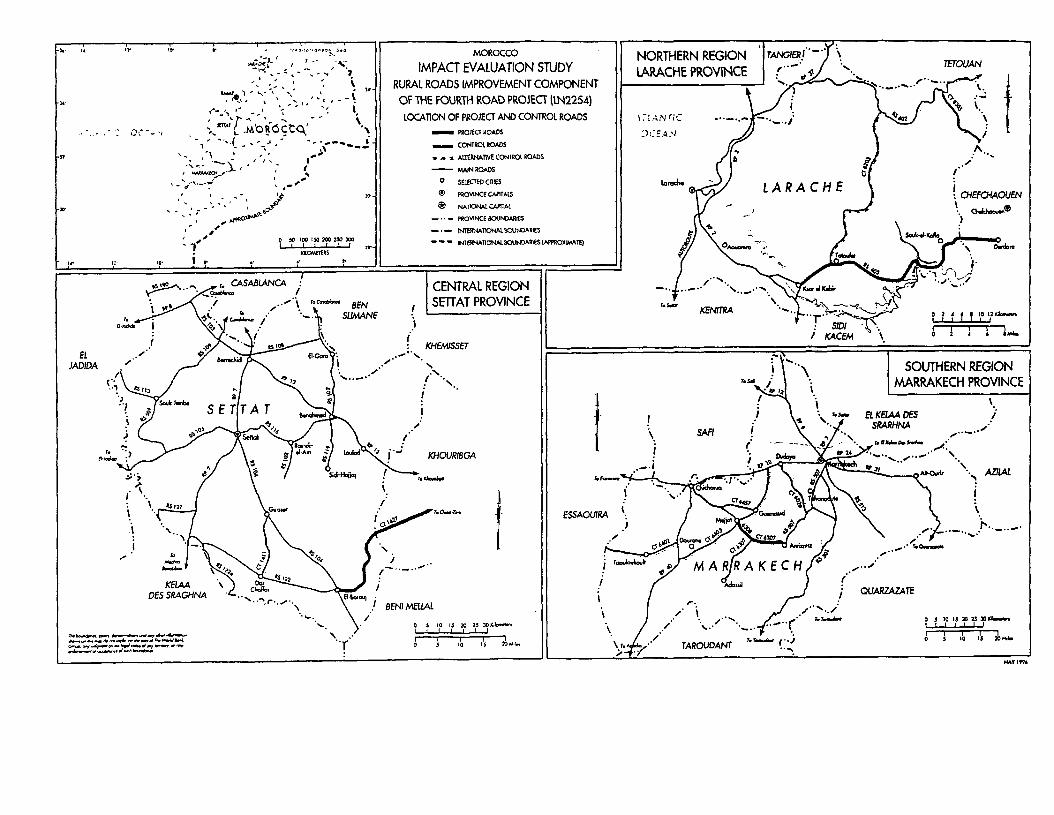
MOROCCO
IMPACT EVALUATION STUDY RURAL ROADS IMPROVEMENT COMPONENT OF THE FOURTH ROAD PROJECT (Lb42254 1ocATlON OF PROJECT AND CONTROL ROADS
- mJmIoAos _ coN1m1Roms . a x Uf.RM~E CCNIPCX RMDS
- MANRomS 0 SLECW cfws
@ PPOVWCE CAPVAtS
@ NAK?Nuc4mAL
- . . - PPcJvlNCE eaJNDnR,ES
- * - LNTv!W~ BouNDp.PlES
- - - iN,-llON*L -AmK IAmlMAm
CENTRAL REGION
: CHEKU4OUEN
SOUTHERN REGION MARRAKECH PROVINCE
1 \


m

END