report no. 13701-pan panama issues in basic...
TRANSCRIPT

Report No. 13701-PAN
PanamaIssues in Basic EducationMarch 17, 1995
Country Department IIHuman Resources Operations DivisionLatin America and the Carribean Regional Office
4~~~~~~
i_ 111 -i | E aSS I
4- -,
l || |ttW,e,,,,gG:f,,,_'',,,,,,', ,', F'
E z | | r _ _ x ' '
Pub
lic D
iscl
osur
e A
utho
rized
Pub
lic D
iscl
osur
e A
utho
rized
Pub
lic D
iscl
osur
e A
utho
rized
Pub
lic D
iscl
osur
e A
utho
rized

CURRENCY EQUIVALENTSCurrency Unit = Balboa (B.)
US$ 1 =B.1
LIST OF ACRONYMS
CEFACEI Community and Family Center for Initial Education (Centro Familiar yComunitario de Educacion Inicial)
COIF Center of Infant and Family Orientation (Centros de Orientaci6n InfantilyFamiliar)
ERP Economic Recovery ProgramERI Economic Recovery LoanFES Social Emergency Fund (Fondo de Emergencia Social)GDP Gross Domestic ProductGNP Gross National ProductIDB Inter-American Development BankIFARHU Institute for Training and Progress in Human Resources (Institutopara la
Formacion y Aprovechamiento de Recursos Humanos)IFI International Financial InstitutionsMIPPE Ministry of Planning and Economic Policy (Ministerio de Planrficaci6n y
Politica Econ6mica)MOE Ministry of Education (Ministerio de Educacion)NGO Nongovernmental OrganizationOAS Organization of American StatesUNESCO United Nations Educational, Scientific, and Cultural OrganizationUSAID United States Agency for International Development
LZ ..................................................... .9NINNVld GNV lN3W39VNVW 'ONIDNVNId *39z........................ .* NOISNVdXa 39W3AO3 g
.Z''''SiNN3W3AOMJdY KLHVflO v
.Z SNoI1VUN3NNO3aH*$
tz ........................................................................... Juaula8vuD" lauuoslad (E.)
zzoD6|>*q*@*> l ................ .......................... I... * S+ziUImU>-A-010d (1)
z,. *LN3w'aVNV (INV DNINNVId 'ODxm-AD)I1Od a
I z ........................................ I................
61 .. saaosay (g)81.''''''''''''''' '''a&?Jla4oJ (z)LI -............. uI. .S5.. . .-. . a.. (1)LT *- -- -00HJS A3IVGNODS *391.4sUai~!ff3 (A')
.1sa2no&'aJ (Z)911.................... .........---..... Vd g
6*--vwuvf*! unju ap sdu:p.wf puv UO!'2flP3i ;vujI (j)8.''' OOH3S A W1V 2Ud-Id ~V
8'-'"""-----------.-----------------S13A31 AU N3ISAS 100113S 311130 S3JISSI *TL.. ...... N.DNV.U. . OOH.S VAosd 39 ................ ... su w o// (z)
.;saamdo. (1f).S.1OOH ..S D ....d Nl SGNf... AO SNOlV. OT.. aINV S3Z-dvwOS g
,g, ................ sadn).puadxa ui spuaij (2)., 7 ................ .... ag 9daAa7 (1)
I'.-- *- -*NOIIlVDlG~ Nl 3~IlLIN3dX' DIl8fld YV
.----- - O.L3S NOIIV3f1U3 3111 9N1JMNIA Z
£.AD3IVThLS INSWNNE3AO9 (NV ONI(IN3IS IO.l9DS A1VIX)S 3L ......................... . Oa LHDS 3IVAdS
1-----I. --- -- AYONO3g 3111- GNflOf XDVO .V
9 -**--*--------- .............. SX UO; IV.9011I3o V I7
I@@ @ @@@****@@~~~~~~~~~~~~~~~~~~~~........... --*----... {h { .10dOs aN ams a2mT.~~~~~~~~~~IMO 1ifdNI SIOM! 3110 SN dU03S (NtV 3Saosl'El
..'' "AHV niS 3AISN1m14x
SIN3INOJ JO I3'ftAVI.
NOILVJaflU JISVE[ NI S3f1SSI
VJIVNVd

ii
TEXT TABLES
TABLE 1: DEMOGRAPHIC INDICATORS IN CENTRAL AMERICA, 1990 ............................................................ 2TABLE 2: EDUCATION PUBLIC EXPENDITURE TRENDS (ANNUAL AVERAGES) ............................. I .................... 5TABLE 3: CURRENT EXPENDITURE LEVELS IN SELECTED COUNTRIES (PERCENT) ........................................... 7TABLE 4: SCHOOL ENROLLMENT TRENDS 1970-92 ............................................................ 8TABLE 5: PRE-PRIMARY SCHOOL COVERAGE BY PROVINCE ............................................................ 10TABLE 6: PRIMARY EDUCATION COVERAGE BY PROVINCE, 1993 ............................................................. 12TABLE 7: PUBLIC MULTIGRADE PRIMARY SCHOOLS, TEACHERS, AND STUDENTS, 1993 .............................. 16TABLE 8: PRIMARY EDUCATION REPETITION AND DROPOUT RATES ............................................................ 17TABLE 9: SECONDARY SCHOOL GRADUATES, 1990 .............................................................. 18TABLE 10: SECONDARY GROSS ENROLLMENT RATES, 1992 ............................................................ 19TABLE 1 1: SECONDARY EDUCATION STUDENT, TEACHER AND SCHOOL RATIOS, 1993 ................................ 20TABLE 12: SECONDARY EDUCATION FAILURE AND DROP OUT RATES, 1993 ................................................ 22
FIGURES
FIGURE 1: PUBLIC EDUCATION EXPENDITURE AS A % OF GNP, 1993 ............................................................ 4FIGURE. 2: DISTRIBUTION OF RECURRENT AND INVESTMENT EXPENDITURES (PERCENT) NOTE: AVERAGE OF1991-94 EXPENDITURES ............................................................ 5FIGURE 3: PRE-PRIMARY GROSS ENROLLMENT RATE IN SELECTED COUNTRIES .......................................... 10
BIBLIOGRAPHY
ANNEXES
ANNEX 1: Poverty Index by District and ProvinceANNTEX 2: StatisticsANNEX 3: Teacher Salaries and Working Conditions
MAP
This report was based on the findings of a mission in June, 1994, composed of ClemenciaChiacpe, Task Manager (LA 2HR); Violeta Arancibia, Cristian Cox, Oswaldo Larranagaand Alfonso Muga (Consultants). It has benefitted greatly from the inputs of MateenThobani (LA TEA), Robert Kanchuger (Consultant), and Eleanor Schreiber (LA2HP).Elizabeth Waters contributed to the report at headquarters. Lerick Kebeck providedcomputer andformatting support. Peer reviewers are Donald Winkler (LA TAD) andErnesto Cuadra (LA 3HR).

BASIC DATA SHEETYear
A. General Country DataGDP Per Capita (US$) 2,600.0 $ 1992Area 77.0 000 Sq. Km. NAPopulation Estimate 2.5 Millions 1992Urban Population (percent of total) 54.0 % 1992
B. Social IndicatorsCrude Birth Rate (Per Thousand) 25.0 Births 1992Crude Death Rate (Per Thousand) 5.0 Deaths 1992Population Growth Rate 2.1 Annual % 1992Total Fertility Rate 2.9 Births 1992Infant Mortality Rate
(Per Thousand Live Births) 21.0 Deaths 1992Maternal Mortality Rate
(Per 100,000 Live Births) 60.0 Deaths 1992Life Expectancy At Birth 73.0 Years 1992Adult Illiteracy Rate 12.0 % 1990
C. Basic Education IndicatorsEnrollment Numbers
Pre-primary 33,248.0 Students 1992Primary 352,994.0 Students 1992Secondary 201,047.0 Students 1992University 63,300.0 Students 1993
Enrollment RatesInitial Educ. (3-4 year-olds) 5.8 % 1992Preschool (Jardin. 5 year-olds) 45.5 % 1992Primary, Gross 104.5 % 1992Primary, Net 90.9 % 1992Secondary, Gross 63.6 % 1992Secondary, Net 53.0 % 1992University, Gross 18.3 % 1993
Private sector participationPre-primary 33.0 % 1992Primary 8.5 % 1992Secondary 17.5 % 1992University 9.0 % 1992
D. Basic Education EfriciencvPrimary Education
Repetition Rate 11.3 % 1992Drop out Rate 1.6 % 1992Completion Rate 90.4 % 1992

iv
Secondary EducationRepetition Rate (Lower sec.) 11.1 % 1992Drop out Rate (Lower sec.) 6.9 % 1992Completion Rate 66.6 % 1992
E. Public Education Expenditure DataTotal Education Expenditures as % of GDP 5.5 % 1993
Educ. Expend. as % ofTot. Pub. Expend. 16.4 % 1993
Preprim. and Prim Educ. Expend.as % of Total Educ. Expen. 40.9 % 1992-93Second. Expen. as % of Tot. Pub. Exp. 26.7 % 1992-93Higher Ed. Expen. as % ofTot. Pub. Exp. 32.4 % 1992-93
F. Unit CostsPreprimary and Primary Education 290.0 $ 1992Secondary Education 371.0 $ 1992

PANAMA - ISSUES IN BASIC EDUCATION
EXECUTIVE SUMMARY
Purpose and Scope
The purpose of this report is to provide an analysis of educational issues. It isdesigned to assist the Government of Panama in establishing education policies andprograms to support the poverty alleviation and human resource development objectivesof its Economic Recovery Program. The study focuses on the pre-primary, primary andsecondary levels. It also assesses the financing of higher education and the role of thestate vis-a-vis the financing of pre-primary, primary and secondary education. The IDBwill complement this study with a secondary education assessment focused on uppersecondary school, vocational training and higher education. The assessment will form thebasis for establishing a country-Bank sector dialogue, and for identifying the areas inwhich the Bank may be able to assist the Government. The three main recommendationsin the study are to: a) expand pre-primary and secondary school coverage, targeting ruralareas and the urban poor; b) improve the quality of the basic ten years of education; and c)reallocate resources from higher education to finance the recurrent and investment costs ofthe recommended expanded coverage and quality improvements in basic education.
The Social Sector Paradox
Panama has the highest per capita income in Central America, US$ 2,600 in 1993.It has also achieved some of the best demographic indicators in the region, through theprovision of broad public health and social security coverage. Annual spending for health,education, and public housing were high and remained high during the economic crisis ofthe latter half of the 1980s, when spending for the social sectors actually increased as apercentage of total public sector expenditures, from 30 to 40 percent. Although economicactivity declined, the Government maintained the real level of expenditures for the socialsectors. Its expenditures on education, expressed both as a percentage of gross nationalproduct (5.1 percent in 1993) and as a percentage of total public sector expenditures (16.4percent in 1993), are among the highest in Latin America, and as high as those in somedeveloped countries. Yet, despite the country's relative wealth and the priority that hasbeen given to the social sectors, expenditures have not been well targeted and hence havefailed to alleviate poverty. Almost 30 percent of the population lives in conditions ofcritical poverty and the poorest 20 percent of the population received only 2 percent of thenational income in 1989, down from 4 percent a decade earlier.
Issues and Recommendations
Expand pre-primary and lower secondary school coverage, targeting ruralareas and the urban poor. National pre-primary school coverage, especially for childrenunder five years old, is very low, and secondary education coverage, while relatively goodnationally, is low in the poorest provinces. A targeted program of expanded coverage forboth levels is therefore recommended.
ii
Coverage for Jardines de Infancia (one year pre-primary school programs for fiveyear-olds) is estimated to be 45.5 percent. These programs are designed to teach readingand writing readiness for primary school and have been proven to promote primary schoolsuccess. A goal of 60 percent coverage by the end of the decade is feasible. Theexpansion could be achieved by reliance on informal sector entrepreneurs to establishcenters, and Government provision of curriculum standards and teacher training as well aspartial subsidies for needy students. There is a substantial quantity of unused classrooms,some of which could probably be utilized by the informal sector. Such an expansion ofcoverage, at a per student cost of US$ 100 per year, would cost under US$ 2 million. Asan alternative, the Government has suggested that each promotora working with needystudents be subsidized by the Government at a uniform rate. If this option is chosen, thereis no guarantee that the costs of all needy students would be covered..
Coverage for initial education (children three and four years of age) is estimated tobe 5.8 percent. The initial education programs are low cost and community-oriented.They can be designed to reach children from low-income families, providing them with theearly sensory stimulation which is important for the development of intelligence. Thetarget group for initial education should be the children of the poor. Initial educationexpansion could be achieved in a manner similar to the proposed expansion of the Jardinesde Infancia. By working through the private sector and providing subsidies to the veryneediest students, it will be possible to expand the system with less expense. Both pre-primary programs should raise the return on other education investments, contribute tohuman capital formation, and narrow the learning capacity gap between children fromadvantaged and disadvantaged families.
There is wide geographic variance in secondary school enrollment, directly relatedto the poverty level. Rural students account for only 15.6 percent of secondary schoolenro'lment, although rural areas account for 45 percent of total population. Two of thethree wealthiest provinces have a gross enrollment ratio of about 70 percent, while thetwo poorest have a gross enrollment ratio of about 21 percent. Although the difference isoverstated because there are students in rural areas that are able to attend urban schools,there are many areas where that option does not exist. Hence there is a valid need toexpand secondary schools in rural areas. Secondary school coverage needs to beexpanded in the poorest provinces, but this will best be achieved by improving the qualityof primary education, increasing the relevance of the secondary curriculum, and improvingthe accessibility of secondary schools. An expansion of 25 percent in rural areas, based onannual fees that would eventually reach US $30 per student, Government provision ofannual grants for half of the expected increase in enrollment, and some new schoolconstruction, is estimated to cost about US$ 11.3 million (in 1993 dollars).
Improve the Quality of the Basic Ten Years of Education. At the pre-primarylevel, quality should be improved by establishing curricular linkages between initialeducation and the Jardines de Infancia, and linkages of both to primary education, whilepreserving the important distinctions in teaching methods and learning environrnents of thedifferent levels. Curricula need to be developed for initial education and revised for theJardines de Infancia.

iii
Textbooks and teaching time are issues that affect quality at both the primary andsecondary school levels. At present, students must purchase their own textbooks andcosts are frequently beyond the capacity of poor parents. The Government should providefree textbooks to needy students. Such a policy would cost US$ 0.7 million for the onethird of primary students who need textbooks, and US$ 1.1 million for the 5 5 percent ofsecondary students. Learning time has been reduced by closing schools during teacherstrikes, which have averaged 40 school days in 1993. A political solution is required forthis problem.
At the primary level, multigrade schools are a particular concern because theyrepresent three quarters of all schools, and teachers assigned to them have been givenneither special training nor appropriate material for their challenging assignments.Although the lack of textbooks is a serious problem for all students, it is of particularconcern in a multigrade classroom, where students must often work independently of theteacher. Multigrade teachers should be given the necessary additional training andmaterials to allow them to do their jobs well, and students should have access totextbooks.
Each additional investment and reform in basic education should be based on theevidence about the status of learning, in order to avoid indiscriminate action. Continualevaluation of representative samples of students could reliably identify patterns ofcurricular weakness. Such a system of standardized monitoring and evaluation wouldprovide useful guidance for the design of curricula, textbooks and in-service training forteachers, and would help to assess the progress towards improved education.
Reallocate public resources from higher education to finance the recurrentand investment costs of the recommended expanded coverage and qualityimprovements at the pre-primary and secondary levels. Higher education receivesalmost one third of public education resources and serves only 10 percent of public schoolstudents. Public resource allocation for education in Panama has the effect of heighteningdisparities in income distribution. Subsidies are directed to those attending highereducation institutions, few of whom come from the poorest economic groups in thecountry, while resources are limited for those attending lower level educationalinstitutions, where representation of poor economic groups is broader. At US$ 1,400, theunit cost for higher education in Panama is high in comparison to other middle-incomeLatin American countries with similar size populations. And yet, university students arecharged an annual fee of only US$ 50 and are given grants regardless of need, to defrayliving expenses. It is recommended that a more realistic higher education fee schedule beestablished, and that scholarships and financial assistance be given to needy students. Agradual increase in the annual fee to US$ 250 would generate about US$ 12.8 million inrevenue. The Government acknowledges the importance of this issue, but notes that thestate has always subsidized the universities, so the political consequences of such a drasticreform would need to be thoroughly assessed.

iv
Conclhsion
It is not feasible to expect the Panamanian Government to increase educationexpenditures substantially, given that Panama already devotes the second highest budgetshare to education in Latin America. Furthermore, the budget is under increased pressuredue to the substantial commercial bank public debt, the increasing public sector wage bill,the mouint:ng deficit of the social security system, and the need to finance essentialmaintenance and investments in other sectors. But given the need to reverse the declinein education quality, and to provide greater economic opportunity to those outside theeducation system, the Government must seek ways to cut expenditures or raise user feesin other areas, in order to devote some additional expenditures to education. Given thisreality, the existing system must become more cost-effective, and innovative ways must besough& to achieve educational goals. These include utilizing the private sector wherepossible, introducing user charges where feasible, and reorienting the sizable scholarshipand loan program away from one based almost exclusively on merit, towards one basedprimarily cn need.
The recommendations above are intended to help achieve greater efficiency inpublic education expenditure, by targeting sector resources to rural areas and the urbanpoor. It is reasonable to aim for the expansion of pre-primary and secondary educationcoverage, and improved quality in basic education. This will spread the benefits of bettereducation to the disadvantaged, thereby providing them with the tools for economnicbetterment.

PANAMA - ISSUES IN BASIC EDUCATION
PURPOSE AND SCOPE OF THE WORK
The purpose of this report is to provide an analysis of the basic educationsubsector-- pre-primary, primary and lower secondary levels, and to assist the newadministration in formulating a strategy for the education sector. The study also assessesthe financing of higher education in relation to the state's role in pre-primary, primary andsecondary education. The Inter-American Development Bank (IDB) will complement thisstudy with an assessment focusing on upper secondary education, vocational training andhigher education. The present study provides inputs for the education strategy the newGovernment is preparing, which will place emphasis on expanding pre-primary educationand improving the quality of basic education (grades 1-10). The two studies will form thebasis for establishing a country-Bank sector dialogue and for identifying the areas in whichthe Bank may be able to assist the Government.
1. SOCIO-ECONOMIC CONTEXT
A. Background - The Economy
1. The Panamanian economy continues to be among the more prosperous and stablein the region. Nonetheless, the economy is highly segmented, between the dynamic,internationally-oriented service sector, which generates about 75 percent of GDP, and thedomestically-oriented sector, characterized by policy-induced rigidities and lowproductivity.
2. The Panama Canal and its associated infrastructure and security apparatus,coupled with the defacto use of the US dollar as the national currency, have encouragedentrepreneurial activity in international services. This includes a major offshore bankingcenter, international commerce (especially in the Colon Free Zone), international shipping,and a Trans-Isthmian oil pipeline. These services have generated substantial wealth,giving Panama the highest per capita income in Central America, US$ 2,600 in 1993.
3. Panama's wealth has cushioned it from the worst economic consequences of itsfailure to undertake structural adjustment. While avoiding the economic crisis which hasplagued the rest of Central America, Panama is paying for economic mismanagement inthe form of missed opportunities. The country has neither taken full advantage of itssubstantial assets, nor have its past efforts to extend basic education and expand ruralhealth programs been successful in improving income distribution. The poorest 20 percentof the population received 2 percent of national income in 1989, the lowest share in LatinAmerica. This group has seen its relative position worsen since 1980, when it receivednearly 4 percent of national income.

2
B. Social Sector Paradox
4. Panama is a country with 2.4 million inhabitants, and although its demographicindicators are among the best in Central America (Table 1), these statistics masksignificant regional differences within the country and wide variations from the meanwithin each indicator. Its 2 percent annual rate of population growth and 2.9 percentfertility rate are the lowest in the region, while its infant mortality, life expectancy, andacceptance of family planning are only slightly behind Costa Rica in the six-country region.Broad public health and social security coverage are responsible for these favorablenational indicators.
5. More than 90 percent of the population inhabits two zones: one, contiguous to theCanal Zone (about half the population); the other, west of the canal on the Pacific coastalplain (about 40 percent of the population). The urban population in 1990 was 53 percentof the total, and is currently estimated to be growing at double the rate of the ruralpopulation. The population is multi-ethnic, with persons of European, African, Asian, andindigenous descent, the latter group constituting 8.3 percent of the population in 1990.The indigenous population is principally located in the provinces of Bocas del Toro,Darien, Chiriqui, and in Comarca de San Bias in Colon. These areas have generallyunfavorable socioeconomic indicators.
Table 1_Demographic Indicators in Central America, 1990
Country Annual Rate of Fertility Infant Life. R a/FamilyPopulation Ratea Mortality Expectancy Plat g --__________ XGrowth (%) _ Rate" at Birth Acept lwe
Panama 2.0 2.9 21.7 72.4 58.2Costa Rica 2.4 3.2 18.0 74.7 68.0El Salvador 2.2 4.7 59.0 64.5 47.1Guatemala 2.9 5.6 54.0 60.0 23.2Honduras 3.1 5.3 63.0 59.0 40.6Nicaragua 3.3 5.3 56.0 59.0 27.0' Average number of children per woman.b Per thousand live birthsc Based on surveys of women 15 -44 years of age, undertaken during the decade of the 1980s.Source: IDB, 1993.
6. Analyses carried out by the Ministry of Planning and Economic Policy (MPPE)indicate that, in spite of the gains made during the 1970s and early 1980s, almost 30percent of Panama's population lives in conditions of critical poverty, with socialindicators typical of low-income countries. In the ten poorest districts (of 68), whichaccount for about 15 percent of Panama's total population, the average household earnedless than US$850 per annum, about one third of the cost of the basic food basket for afamily of five; life expectancy is below the national average; the infant mortality rateranges between 50 and 75 per thousand live births, three to four times the nationalaverage; 40 to 70 percent of the children ages 6 to 9 suffer from moderate to severegrowth retardation, compared to a national average of 24 percent; and almost one third ofhouseholds do not have access to safe water or basic sanitation. These pockets of poverty

3
f&l into one of two types: a) remote rural areas with limited natural resources andagricultural potential, including areas inhabited by indigenous people; and (b) urban slumsettlements.
C. Social Sector Spending and Government Strategy
7. Social sector expenditures account for about half of all public sector expenditures,but they have not been well targeted and have failed to alleviate poverty. Governmentspending for the social sectors remained relatively constant in real terms over the 1980sand increased as a percentage of the budget in the crisis years of the latter half of thedecade, as total public sector expenditures fell. Annual spending for education, health,and public housing averaged about 30 percent of total public sector expenditures in thefirst half of the decade, and about 40 percent in the latter half.
8. Social policies have been neither tailored to the needs of the rural population, noradequately targeted to the poor. In addition, the efficacy of social spending has beengreatly curtailed by the weak design and implementation capacity of the public sector,pcor inter-agency coordination, and insufficient involvement of the private sector,nongovernmental organizations (NGOs) and the poor.
9. To further the social objectives of its Economic Recovery Program, theGovernment has prepared rehabilitation programs for the public health systemadministered by the Ministry of Health, the Social Fund, and for the water and sewerageauthority that serves the urban population. IDB is helping the Government to implementand finance these programs. To develop its human resource base and alleviate poverty,the Government adopted two new programs in 1992. The first was a National Food andNutrition Program that defined new strategies and programs to address priority issues infood production, distribution, and malnutrition. The second was a US$ 200 millionHuman Development Program to alleviate poverty, to be implemented in 1993-97. TheHuman Development Program has three principal components: (a) a social emergencyfund; (b) a pilot nutrition project to meet the needs of the most vulnerable groups; and (c)an agro-forestry project. To complement the above actions, the Government requestedand received Bank financing and assistance for a rural health project (7846-PA), which isdesigned to reduce malnutrition, particularly among young children, and improve access tosafe water and basic sanitation services. This is the first social sector operation financedby the Bank in Panama. The Government has also requested Bank assistance in theeduc2tion sector, beginning with the analysis made in this report.

4
2. FINANCING TIHE EDUCATION SECTOR
A. Public Expenditure in Education
10. The Government has given a high priority to allocating resources to the educationsector. As a result Panama ranks high, compared to other developing and Latin Americancountries, in the percentage of GDP and total public sector resources allocated toeducation. However, higher education receives about one third of these resources, whilepre-primary education is given a disproportionately low share. The high share given touniversity education and the minuscule fee (approximately US$ 50) charged to universitystudents result in an across-the-board subsidy to many students whose families couldafford to contribute to the cost of their studies. The structure of subsector resourceallocation favors higher income groups at the expense of lower income groups, whowoulJ benefit from additional expenditures for pre-primary and primary education. At thesame time, pre-primary and primary education, which serve 54 percent of this populationand include a large percentage of students from the lower econornic group, receive only40.9 percent of total resources. Only 1.7 percent of total public expenditure for educationis allocated to pre-primary education, a figure far below international levels (Table 3).
(1) Levels of expenditure11. Public expenditure in education, as measured by several indicators, is high incomparison to other Latin American and developing countries, and even comparable todeveloped countries by some indicators. It is 5.1 percent of GNP, the highest percentagein Latin America, and almost as high as the 5.3 percent average for such expenditures indeveloped countries.
5.55
4.54
3,5
% ofGNP 25
1 5
0.50
Latin America Panama DevelopedCountries
Figure 1: Public Education Expenditure as a % of GNP, 1993Source: UNESCO, 1993b
(2) Trends in expenditures12. The level of public expenditure in education remained relatively constant in theperiod between 1983 and 199 1; expenditures as a percentage of GDP and total publicsector expenditure remained virtually unchanged. However, there was an abrupt changein public expenditure in education in 1992-1993, when the aggregate level of expenditureincreased 28.4 percent and expenditure per capita increased 23.7 percent over the 1990-1991 levels (Table 2). Although there were increases in public expenditure in education

5
as percentages of GDP and total public sector expenditure in the same period, theseincreases were a more modest 8 percent and 11 percent, respectively. These figuresreflect an increase in economic activity in 1992-1993 and the Government strategy tocontinue to give a high priority to the education sector.
Table 2Education Public Expenditure Trends (annual aver ges)
1983-1987 1990-1991 1992-1993Total (US$ million) 251.9 265.9 341.4As % of GDP 5.2 5.1 5.5As % of Public Expenditures 15.2 15.0 16.4Expenditures per Capita 116.3 109.8 135.8Source: Comptroller General of the Republic.
B. Sources and Allocations of Funds in Public Schools
(1) Sources13. The Government's general revenues financed 93.3 percent of recurrent publiceducation expenditures during 1991-94. The remaining 6.7 percent was financed from anearmarked tax of 2.75 percent on salaries and the income of self-employed persons.General Government revenues financed 62.6 percent of investment expenditures, whileexternal sources financed 37.4 percent. External financing is derived principally from IDBand some small grants from the United States Agency for International Development(USAID). IDB has assisted secondary schools in several operations over the past twenty-five years that have financed technical assistance, scholarships, and the construction,rehabilitation, expansion, and equipment of secondary schools. It has also financed theSocial Emergency Fund (Fondo de Emergencia Social, FES) which is used to rehabilitateand renovate primary school buildings.
Investment (General &Extemal Resources)
9.5%
1 - .Recurtnt (General , . . . Recurrent (EducationResources): Ta):84.4% 6.1%
Figure 2: Distribution of Recurrent and Investment Expenditures (Percent)Note: Average of 1991.94 Expenditures (Source: MIPPE, MOE)

6
14. Parental fees and employer contributions are additional sources of funds for pre-primary school programs and higher education, but there are no fees for primary andsecondary students. Parents of students attending the public Jardines de Infancia may berequired to pay a fee of up to US$10 per month. (See paragraphs 24-25 for a descriptionof pre-primary education programs.) There are neither guidelines on the fees parents arerequired to pay nor record-keeping requirements for collections. The principal hasauthority over the use of funds. The level of fee collection and the importance of fees inthe operation of schools are both difficult to evaluate, due to the dearth of records. TheJardines de Infancia have also benefited from materials provided by the provinces andfamilies. The informal Family and Community Center for Initial Education (CentroFamiliary Comunitario de Educaci6n Inicial, CEFACEI) program is financed by amonthly parental fee of US$ 2-10 and a small annual grant from the Organization ofAmerican States (OAS). The fees paid by parents cover about 75 percent of the cost ofsalaries required to operate the centers. As in the case of the Jardines de Infancia, thereare insufficient guidelines, records, and information about the relative importance of feepayments as a source of financing for the CEFACEI. The Centers of Infant and FamilyOrientation (Centros de Orientacion Infantil y Familiar, COIF) are located in workplaces(para. 25) and largely supported by employers.
15. Students enrolled in Panama's two public universities are charged an annual fee ofabout US$ 50, which is unnecessarily low. Fee revenues total US$ 2.8 million and coverapproximately 4.1 percent of total university expenditures.
(2) Allocations16. The relative shares of public expenditure allocated for the three principal levels ofeducation -- basic (including pre-primary and primary), secondary, and higher education --remained almost constant between 1983 and 1991. However, in 1991-92 there was asignificant 4.9 percent decline from the preceding two years in the allocation to basiceducation, and a 6.1 percent increase in the allocation to higher education (Annex 2,Table 23). Although the percentage decline in the allocation of public resources to basiceducation and the increase in the allocation of such resources to higher education are notgreat, they are significant in that they exacerbate an already inequitable distribution ofresources. Higher education receives almost one third of public education resources, toserve the 10 percent of students attending publicly-financed schools at that level.
17. The 1.7 percent of total public education expenditure allocated to pre-primaryschools is far below international levels (Table 3). Although the 32.4 percent of publiceducation expenditure allocated to higher education is close to the allocation of someother Latin American countries, it is much greater than the 14.1 and 16 percent ofexpLnditure allocated to this level of education in France and Spain, respectively.

7
Table 3Current xpenditure Levels in Selected Countri (percen
._________ Panama Costa Rica Venezuela Mexico Chile FrancePreschool 1.7 3.6 3.3 6.1 6.7 9.5 6.4Primary 39.2 34.5 20.2 28.6 49.4 16.8 22.2Secondary 26.7 21.6 4.5 26.6 14.9 40.4 46.8Higher 32.4 36.1 40.7 14.7 20.6 14.1 16.0Others 1.5 2.8 2.0 11.5 8.2Undistrib- 2.7 28.5 23.9 6.4 7.7 0.4u ted _ _ _ _ _ _ _ _ _ _ _ _ _ _ _ _ _ _ _ _ _ _ _ _ _ _ _ _ _
.. Toal 1 o. 100.0 100.0 100.0 100.0 100.0 100.0 100.0Years: Panama, 1993; Mexico, Chile, France, Spain 1992; Costa Rica, 1991; Venezuela, 1990.Sources: Panama: MOE and mission estimates, other countries: UNESCO, 1993.a It includes Preschool Expcnditure
* Totals may not add up due to rounding
18. Students at the University of Panama and the Technological University pay anannual fee of about US$ 50. Although there is no famnily income data for students at theUniversity of Panama, such data for the 11,000 students at the Technological University,show that about one third of students come from families with annual incomes over US$7,032, the top quintile of family income in Panama. A similar family income profile couldbe assumed for students attending the University of Panama. It is clear that a major statesubsidy is going to students from rniddle- and upper-income families who could afford topay for all or a substantial part of the cost of a university education. In contrast, the feesat private sector universities for upper-income students are about US$ 2,000, for rniddle-income students, about US$ 800, and for lower-income students, about US$ 500.
C. Private School Financing
19. Private school expenditures were estimated to be US$ 77.4 million for 1992,equivalent to about 24.4 percent of total sector expenditures (Annex 2, Table 5). Privateschool expenditures were particularly important at the secondary level, where theyaccounted for 37.9 percent of total expenditures, and least important at the higher level,where they accounted for only 8.7 percent of total expenditures. Private schoolexpenditure on a per capita basis far exceeded per capita expenditure by the public sectoron iJI levels, except in higher education, where public sector expenditure exceeded that ofthe p. ivate sector by about 20 percent.
20. The combined education expenditure of the private and public sector was about7.4 pcrcent of GDP in 1993. This calculation was based on direct costs and did notincha le the indirect costs incurred by families for school supplies, textbooks, uniforms, andtrans;ortation. The calculation also excludes the cost of studying abroad, which is fairlycommon at the higher education level.

8
3. ISSUES OF THE SCHOOL SYSTEM BY LEVELS
Table 4School Enrollment Trends 1970-92
Pre-prim Primary Seconday Universiy OtherYear Tol ros Total Gross Drop Total Gross Drop Total Gross TVa Totalfei
ewU- enrol- enroU- enroll- out enroll- enraU- out rate enroll- enroll- enrolS :SJanment ment meat ment rate ment menl ment ment meat
ratio ratio ________ ratio ratio1970 7 8 255 105 2.1 79 40 n.a. 9 6 4 3541980 18 17 338 107 2.2 171 61 6.7 40 16 15 5831983 26 24 336 105 2.5 176 60 5.7 45 16 12 5951986 30 27 344 107 2.2 187 61 4.3 60 19 1 1 6321987 33 30 346 107 2.1 190 61 5.6 55 17 1 1 6341988 33 29 345 106 2.8 190 61 6.7 51 16 1 1 6311989 32 28 350 107 1.6 190 61 3.8 50 15 12 6341990 31 27 351 106 1.8 196 63 5.3 53 15 1 1 6411991 34 29 350 105 1.6 198 63 5.7 58 17 11 6511992 33 28 353 105 1.5 201 64 5.5 63 18 12 663
Note: Gross Enrollment and Drop Out Numbers are Percentages; Total Enrollment Numbers are in thousands.Source: MOE, Statistics Department.
21. Pre-primary schooling is not mandatory in Panama. The six years of primaryschool are mandatory and free, and the six years of secondary school, divided in twocycles of three years each, are non-mandatory and free. As Table 4 shows, pre-primaryschool enrollment has increased substantially since 1970, though more than two thirds ofall children were still not enrolled in 1992. Primary school enrollment was high in 1970,and is even higher today. In 1992 the gross enrollment ratio was over 100, and the dropout rate was a low 1.5 percent. Secondary school enrollment has increased steadily since1970. when it was already relatively high in the region. Today the gross enrollment ratehovers around 60, while the drop out rate is 5-6 percent.
A. Pre-Primary School
22. Pre-primary school coverage in Panama for both initial education and Jardines deInfancia is significantly lower than that in countries such as Costa Rica and Chile.Coverage is 5.8 percent for initial education (children three and four years old) and 45.5percent for Jardines de Infancia (five-year-olds). The Ministry of Education (MOE) isresponsible for the Jardines de Infancia, but there are several Ministries involved in initialeducation that operate without clearly defined areas of responsibility.
23. The scientific, educational, economic, and equity arguments for expandingcoverage of pre-primary education are compelling. The low cost and communityorientation of initial education programs permit them to effectively reach children fromlow-i'i(ome families, providing them with the early sensory stimulation important for thedeve'opment of intelligence. One-year pre-primary programs, such as the Jardines deInfan, ia for reading and writing learning preparation, have been proven to promote schoolreadui.ess skills and timely school enrollment, lower primary repetition and dropout rates,and irapiove overall academic skills. These conclusions are based on international

9
research. There is substantial empirical evidence to indicate that both types of pre-primary school programs raise the return on other education investments, contribute tohuman capital formation, narrow the learning capacity gap between children fromadvantaged and disadvantaged families, and reduce overall public expenditures oneducation.
(1) Initial Education and Jardines de Infancia24. Jardines de Infancia are one-year schooling programs generally for five-year-oldsthat emphasize preparation for reading and writing. There are about 730,000 childrenenrolled in 894 Jardines de Infancia. About two thirds of these are public institutions,and the remainder are private.
25. Initial education is generally for children up to five years of age, and it emphasizeschild care and socialization. Programs are principally based in communities, workplaces,and churchs. At the community level, the CEFACEI are aimed at children two to six yearsold and administered by MOE and the local community. The program is small, with only2,169 children attending 88 centers. The province of Panama accounts for 50 percent ofenrollment (1,379), followed by Bocas del Toro and Cocle, both very poor provinces,with small enrollments of some 180 students in the main municipalities of the provinces.The purpose of the CEFACEI is to provide early learning stimulation to poor children,promote their social development, and provide them with nutritional supplements. Theworkplace program, known as Centers of Infant and Family Orientation (Centros deOrientaci6n In?fantily Familiar, COIF) is administered by the Ministry of Labor andparticipating agencies, and is available for children three to five years old in 70 centersmainly in Panama city and other urban areas. COIF's principal purpose is to provide childcare for working parents. Finally, the Catholic Church has an initial education program(Jardines de la Iglesia Cat6lica) for very poor children.
26. There is a lack of clear distinction in teaching content, methodology, andenvironment between the initial education programs and the Jardines de Infancia, with amixture of five-year-olds and under five-year-olds in both types of schools. This has led tosome confusion in teaching in both types of schools, with material appropriate for childrenof one age level being taught to children of another level. The problem has been mademore difficult because a standard curriculum has not been developed for initial educationand there is only an outdated curriculum for the Jardines de Infancia. These factors haveadversely affected the quality and utility of pre-primary education.
(2) Coverage27. rhe gross enrollment ratio in pre-primary schools (the number of all students inpre-orimary school divided by the number of five-year-olds in the population) is 57.8percent, significantly lower than the percentage in some other Latin American anddeveloped countries (Figure 3). Net enrollment (i.e. five-year-olds) for the Jardines deInfarwici is 45.5 percent and 2.4 percent for all of the initial education programs. Pre-prirnary school students in Panama are evenly divided between males and females.

10
100
10o
- 0
70so
I80 l t iFt .
e 60 E E' 50 > |i l
ui30 2 EIE eI1
Country
Figure 3: Pre-Primary Gross Enrollment Rate in Selected CountriesSource: UNESCO, 1993b
28. The pre-primary school coverage by province (Table 5) reveals a surprisingrelationship between coverage and provincial poverty. Both net and gross enrollmentratios for the second and third poorest provinces are below the ratios for the middleincome and higher income provinces. However, while Panama, the wealthiest and mostpopulous province, has ratios better than the poorest provinces, its ratios are lower thanthose of almost all of the middle- and higher-income provinces. This could be due to thefailure of the Province of Panama to meet the pre-primary education needs of the growinginflux of poor immigrants from rural areas.
Table 5Pre-Primary School Coverage by Province
Province Net Enrollment Gross Enrollment Poverty InideSan Blas n.a. n.a. 19.1Darien 39.87 50.69 29.9Bocas del Toro 31.06 39.48 47.3Veraguas 51.66 65.63 52.3Chiriqui 41.54 52.78 67.9Cocle 48.96 62.19 71.8Herrera 59.54 75.64 80.1Colon 49.75 63.19 84.8Los Santos 55.03 69.90 85.7Panama 42.67 54.23 94.9Total | 45.52 | 57.83 l _ln.a.: Not available.Note: Provinces are listed in order of poverty with the poorest province listed first. The PovertyIndex is comprised of three variables: housing, education and health. (See Annex 1 for adetailed explanation)Source: MIPPE.

11
(3) Resources29. Infrastructure. The Jardines de Infancia are given classroom space in publicschool buildings. The CEFACEI programs are located in community centers. Theparticipating public agencies provide space in their workplaces for the COIF program, andchurch facilities are used for the Catholic Church program. There is no indication that alack of physical infrastructure is a serious impediment to the expansion of pre-primaryeducation. In fact, estimates indicate that there might be about 2,000 unused primaryschool classrooms that could be used to expand the pre-primary school program (Annex2, Table 22).
30. Teachers. The qualifications of pre-primary teachers in Panama's poorestprovinces appear to be as high as, or superior to, the qualifications of pre-primary teachersin the country's wealthiest provinces. Particularly surprising is the high percentage ofteachers with university degrees in the poorest provinces. This phenomenon is related tothe proliferation of university branches around the country and the lack of otherprofessional opportunities for students graduating from these branches. High enrollmentsin the University of Panama's School of Education programs, and the low national student-teacher ratios of 23 for pre-primary schools and 25 for primary schools, indicate that thereis, and will likely continue to be for some time, an ample supply of pre-primary schoolteachers, who could be utilized to expand pre-primary coverage.
31. Expansion of the Jardines de Infancia would be cost-effective where there areavailable classrooms and underutilized teachers. In those areas where classrooms andteachers are not available, MOE could expand the use of informal CEFACEIs for five-year-olds. Expansion of these programs would need to be complemented by a clarificationof curricular differences and aims. It would be necessary to stress the differences betweenprograms for reading and writing preparation, and programs supporting early sensorystimulation and socialization.
B. Primary School
32. The primary school level is characterized by high enrollment ratios, qualifiedteachers, and low student/teacher ratios. And yet, there is no standard system to evaluatethe quality of education in Panama. The information available suggests that averagequality is low. This is a critical issue since Panama devotes a substantial amount ofeconomic resources to education. The sector has one of the best paid teaching forces inthe region (Annex 3) and fairly good infrastructure, the two most expensive componentsof the primary school student unit cost.
33. The lack of an evaluation system for expenditure efficiency is a seriousimpediment. But there are several indications of poor quality. There is a relatively largenumber of multigrade schools in rural areas, with teachers ill-equipped in the techniquesand materials necessary for the challenges of this special classroom environment. Almostone third of primary students lack textbooks (including most multigrade students), andalmost one half of students lack workbooks. Research confirms that the absence of

12
textbooks and of specific support for the multigrade teacher reduces quality. It is likelythat such weaknesses in quality contribute to low efficiency. Three out of five studentswho begin primary school do not complete the cycle in the anticipated six years, and therepetition rate in the four poorest provinces is close to 20 percent.
(1) Coverage34. The net enrollment ratio in primary school (the ratio of children ages 6 to 11attending primary school to the total 6 to 11 year-old population) is 90 percent,comparable to that of other countries in Latin America with good education indicators.The gross enrollment ratio (the ratio of the total primary school population to the total 6to 1 1 age population) is 104 percent and also comparable to the ratios of other LatinAmerican countries with strong education systems. There does not appear to be aconsistent correlation between net enrollment and the income level of a province (Table6). However, the poorest province, San Bias, has an exceptionally low net enrollment rateof 64.6 percent, which is probably due to both the poverty level and the difficulty ofaccess to the area. Its relatively large indigenous population has also hindered itsintegration into the country's predominantly Hispanic culture. There are about an equalnumber of female and male students in primary school in Panama.
Table 6Primary Education Coverage by Province, 1993
Province Net Enrollment Poverty IndexSan Blas 64.6 19.1Darien 96.4 29.9Bocas del Toro 98.0 47.3Veraguas 90.9 52.3Chiriqui 89.4 67.9Cocle 97.0 71.8Herrera 84.6 80. 1Colon 98.3 84.8Los Santos 92.5 85.7Panama 91.9 94.9Note: Provinces are listed in order of poverty with the poorest province listed first.Source: MOE, Statistics Department.
(2) Resources.35. Infrastructure. There is an estimate of the classroom surplus or deficit byprovince in Annex 2, Table 22. The 1992 balance shows a surplus of classrooms in allprovinces with two exceptions: Los Santos, with a significant deficit of 136 classrooms,and Herrera, with a small deficit of 9 classrooms. By 1999, assuming 100 percentcoverage and a 10 percent repetition rate, only three provinces would require additionalclassrooms: Los Santos, Herrera and San Blas.
36. Additional classroom space may be required as a result of shifts in populationpatterns and difficult access to some schools in urban areas. Past construction patterns

13
favored the building of large schools in urban centers that were designed to draw onextensive outlying geographic areas. The character of urban centers has shifted fromresidential to commercial, and area transport systems have not been adequate fortransporting children from areas where they now live to city centers. In rural areas, themigration of the population leaves classrooms empty and generates new demands. Astudy is necessary to assess these demands.
37. In recent years, the FES has been the exclusive source for financing allinfrastructure needs for public primary schools. About US$ 9.9 million has been spent inthe last few years on 485 projects.
38. Teachers. The public primary student/teacher ratio is 25. The current number ofteachers on the public payroll can serve all the 1999 projected primary school-agepopulation. Even the province with the highest student/teacher ratio at present wouldhave a ratio of only 31, using the current student/teacher ratio per province (Annex 2,Table 4). Ratios in eight provinces would still be below 30. Teachers have good formalqualifications--about 80 percent have Normal School degrees (secondary level) and almostall others have university-level degrees, many of them pedagogical. An ample, perhapsexcessive, future supply of teachers is assured, with over 7,000 students currently at theSchool of Education of the University of Panama and 1,000 at the teacher traininginstitute (Escuela Normal).
39. Textbooks and Materials. The Government does not provide textbooks tostudents, even though Article 89 of the Constitution guarantees this service. A recentsurvey conducted in schools close to or in Panama City showed that 68 percent of publicschool students purchase their textbooks. The survey also showed that only 50 percent ofurban students and 39 percent of rural students purchased workbooks.
40. Textbooks are available in the market, from Latin American and Spanishpublishers. Schools only use those textbooks approved by a special MOE unit. Teachersdecide which textbooks will be used in their classrooms. This system promotes healthycompetition among publishers, but annual changes in textbooks are costly for those whomust buy them. There is no program to help poor students obtain textbooks.
(3) Quality41. An assessment of education quality must examine two areas: the quality oflearning, and the presence and quality of inputs relevant to the learning process. Thequality of learning is measured by student achievement of an agreed set of standards.Primary education learning quality is evaluated through standardized tests, the results ofwhich are compared with national standards, based on what students should know or beable to perform at a certain level. Secondary education learning quality is evaluatedthrough standardized tests, but also by labor market acceptance of high school graduateslooking for work, and university assessments of applicant quality.
42. There are two kinds of education inputs: those that improve learning but are notcost-effective (e.g. small classes and computer-aided instruction) and those that improvelearning and are cost-effective, of which there are two types: school inputs and non-school

14
inputs. Relevant school inputs are textbooks, teacher guides that are well integrated withtextbooks, time spent on teaching and learning, and effective teaching, which includesknowledge of the subject matter and adequate pedagogical practices. Non-school inputsconsist mainly of the child's health and nutritional status, as well as prior learningexperience.
43. Quality of Learning. In the absence of a systematic assessment of learningquality, it is difficult to judge the quality of inputs, particularly when there are no obviousdeficiencies. It is easy to recommend improvements when teachers have an average ofonly 5 years of education, or when the curriculum is clearly problematic. But when acountry is already providing some of the most important and expensive inputs, eachadditional investment and reform (e.g. curricular changes or in-service training) should bebased on the evidence about the status of learning, in order to avoid indiscriminate actions.It is difficult to judge the quality of primary education in Panama without a standardevaluation system. Achievement tests have been conducted twice in the recent past, mostrecently in 1992. The test was based on a national sample, and comprised of math andSpanish language. The overall failure rates were strikingly low, ranging between 4 and 36percent. The variation between provinces follows the poverty index fairly closely--Panama and Los Santos have the lowest failures rates, and San Blas, Darien and Bocas delTorc. have the highest rates. The median rates for each grade show a steady decline infailure from first to sixth grade, beginning with rates of 22 and 19 for Spanish and math,respectively, in first grade, and ending with rates of 7 and 9 for Spanish and math,resptctively, in sixth grade. Without judging the overall reliability of the test, the resultsconvey evidence of sharp discrepancies in education quality between rich and poorprovinces. They also show that lower grade students have greater difficulty with thesubject matter than do upper grade students.
44. However, the lack of independence between test designers and the teachers whoadministered the test, leads to doubts about the test's objectivity. There is littleinformation about how the test was designed, how it related to the curriculum at eachlevei, how it was administered, etc. The evidence of teacher resistance to the studentevaluation process engenders skepticism about the validity of the test. The results mustthus be treated with caution. In its present form, the test can only tell us about relativedifferences in the quality of education in Panama.
45. Quality of Inputs. As previously mentioned, teachers have strong formalqua:iFications--about 80 percent have Normal School degrees, while almost all others haveunivelrsity-level pedagogical or other degrees. The official time spent on learning inPanama compares favorably with upper-middle-income countries, but in every daypractice this is not realistic. The official academic year for grades one through six averages896 instructional hours in upper-middle-income countries. Thirty-five percent of that timeis spent on language, while 18 percent is spent on mathematics. Panama's official schoolinstructional time is over 1,000 hours per year. However, 40 days were lost due toteaclier strikes in 1993 alone. Teachers are frequently absent for administrative andpersonal reasons, while the appointment of a substitute is a lengthy bureaucratic processthat involves seven steps and six offices. The percentage of hours devoted to mathematics(18 percent) corresponds to the average for upper-middle-income countries, but the 21

15
percent of hours devoted to language instruction is significantly less than the 36 percentdevoted to it in upper-middle-income countries. The student/teacher ratio is another inputfor quality. International research shows that children learn better in smaller classes(under twenty students). In 1985, the mean student/teacher ratio for upper-middle-incomecountries was 24. At 25, Panama's student/teacher ratio compares favorably with themean, but it is costly. If MOE wants to maintain such a ratio, it must ensure the provisionof textbooks and teacher guides, and that sufficient time is spent on learning. These arekey inputs for effective learning, which will not result from an abundance of teachersalone.
46. Almost one third of primary students do not have textbooks, and almost one halfdo not have workbooks. This is a particularly grave problem in multigrade classrooms,where students must often work independently of the teacher. The textbook deficiency isdue to the lack of resources of many parents. Frequent changes in textbook selection byteachers only exacerbate the problem. Such frequent changes mean that library copies areusually out of date, so that poor students who rely on such publicly provided texts areultimately denied access to those texts. Poor parents can not afford to buy new textbooksfor each child. Freedom of textbook selection can be constructive in allowing teacherinitiative to flourish, but investment in textbooks for the poor is far too costly with suchfrequent changes. A national textbook policy should preserve MOE's role in approvingtextbooks, and textbooks changes should be limited by MOE. Teacher guides should alsobe developed. There is a clear need for them, as indicated by the common practice ofmany teachers of selling their own teaching notes to their colleagues.
47. Effective teaching is comprised of subject knowledge and appropriate pedagogicalpractices. Extensive research shows that the way that teachers teach is largely determinedby how they were trained to teach and by the type and amount of teaching materialsavailable to them. Primary school teachers in Panama have good formal training in subjectknowledge, and attend two-week in-service training sessions every year of their career.These courses emphasize language and math, but also include other disparate topics suchas computer skills, folklore dances, and civil protection, among others, that indicate theoverall lack of focus and relevance of a large part of the program. Such a program wouldbe more useful if it were more sharply focused on the learning needs of students. Themost extreme example of this is the lack of pre- and in-service training in multigradeteaching techniques, in spite of the fact that almost three quarters of all primary schools inPanama have multigrade classes. Pre-service and in-service training in multigradetechniques would maximize the strong pedagogical qualifications that most teachers bringto the job, leading to a higher quality of education in multigrade classrooms.

16
Table 7Public Multigrade Primar Schools, Teachers, and Students, 1993
Schools Teachers StudentsArea Number [Percent Number Percent Number T Percent
Total 2,050 79.1 3,734 28.5 76,088 23.3Urban 9 3.9 13 0.3 345 0.2Rural 2,041 86.5 3,721 46.6 75,743 23.1Source: MOE, Statistics Department
(4) Efficiency48. There are important distinctions in the repetition rates between rural and urbanareas, and between private and public schools. The rural repetition rate (14 percent) isabout double the urban rate (8 percent). The rate for private schools is less than 1percent, while it is 11 percent for public schools. There is a significant relationshipbetween the repetition rate and the poverty of a province (Table 8). In the three poorestprovinces, where the percentage of multigrade schools is the highest, the repetition rate isclose to 20 percent. In the two wealthiest provinces, the repetition rate is about 6.5percent.
49. A similar pattern exists with respect to the drop out rate. The rural drop out rateof 2 percent is double the urban drop out rate of 1 percent. Private schools have a dropout rate of less than 1 percent, while public schools average 2 percent. In the threepoorest provinces, the average drop out rate is 2.9 percent, more than double the 1.3percent average rate in the two wealthiest provinces.

17
Table 8Primary Education Repetition and Dropout Rates
Repetition Rates Dropout RatesProvince Public Private Public Private
San Blas 18.3 n. a. 3.3 n.a.Darien 22.3 n. a. 3.3 n.a.Bocas del 21.7 0.5 2.0 14.7ToroVeraguas 15.0 15.0 1.7 0.2Chiriqui 10.1 0.5 3.4 0.3Cocle 9.5 0.5 0.7 0.7Herrera 10.1 0.4 1.4 n.a.Colon 10.3 1.2 1.3 n.a.Los Santos 6.1 n. a. 1.4 4.9Panama 6.8 0.6 1.2 n.a.Total 10.4 0.7 1.7 0.2n.a.: Not available.Note: Provinces are listed in order of poverty with the poorest province listed first.Source: MOE, Statistics Department, 1992.
50. Six out of ten students do not complete primary school in six years. Eventually,almost nine out of ten complete primary school, and the average completion time is eightyears (Annex 2, Table 10).
C. Secondary School
51. Although key indicators place Panama in the top ranks of Latin Americancountries for coverage of secondary education, there are important weaknesses to beaddressed. The most obvious weakness is the low coverage in the poorest areas of thecountry. The repetition and drop out rates, which are fairly low at the primary level,increase at the secondary level. The experience of the business and universitycommunities with secondary school graduates confirms the need to rethink the secondaryschool curriculum. However, very little is known about what is expected of secondaryschool graduates.
(1) The Two-Track System52. The secondary school cycle is six years, with two sub-cycles of three years each.The first cycle covers general subjects. The second cycle has two tracks. One isacademic, and has sciences and humanities sub-tracks, which lead to university study, aswell as primary teacher training. The other track is professional and technical, and hassub-tracks in commerce, industry, agriculture, homemaking and cosmetology, leadingdirectly to employment. Over the last five years, the percentage of students in each trackhas remained relatively constant, with about 43 percent of the students enrolled in theacademic track and the balance enrolled in the professional-technical track (Annex 2,Table 20).
18
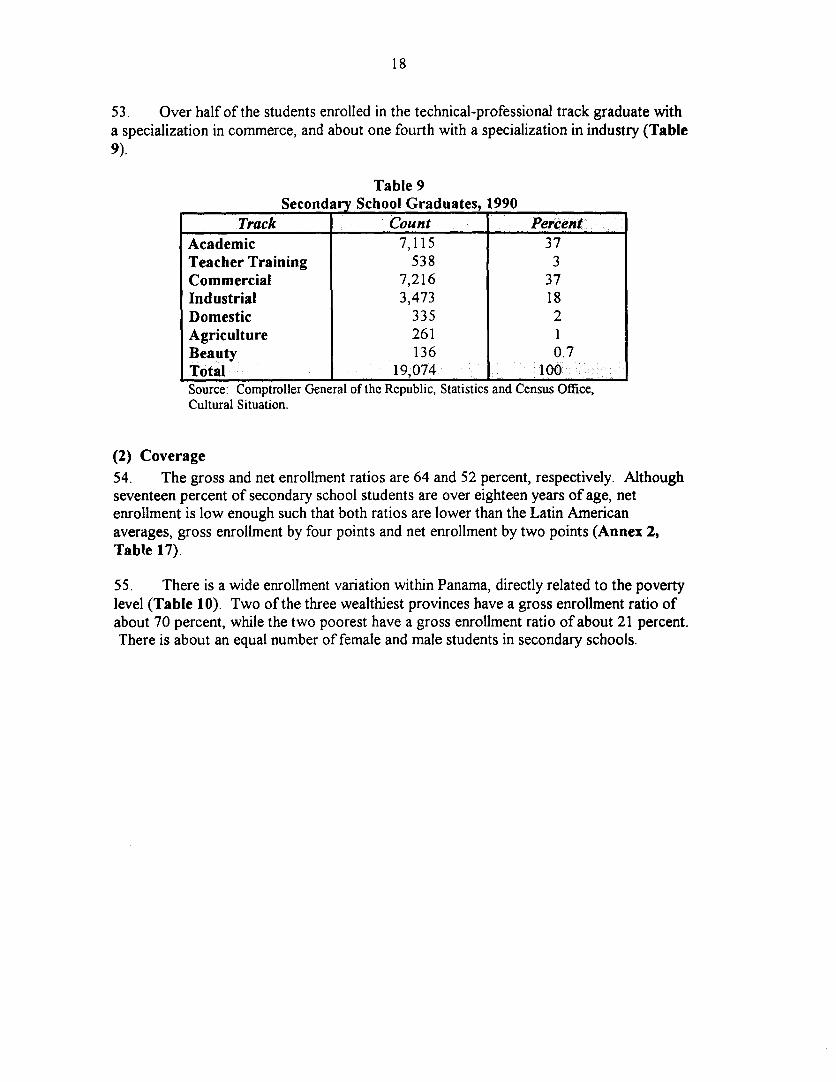
53. Over half of the students enrolled in the technical-professional track graduate witha specialization in commerce, and about one fourth with a specialization in industry (Table9).
Table 9Second ry School Graduates, 1990
Track Count PercentAcademic 7,115 37Teacher Training 538 3Commercial 7,216 37Industrial 3,473 18Domestic 335 2Agriculture 261 1Beauty 136 0.7Total 19,074 100Source: Comptroller General of the Republic, Statistics and Census Office,Cultural Situation.
(2) Coverage54. The gross and net enrollment ratios are 64 and 52 percent, respectively. Althoughseventeen percent of secondary school students are over eighteen years of age, netenrollment is low enough such that both ratios are lower than the Latin Americanaverages, gross enrollment by four points and net enrollment by two points (Annex 2,Table 17).
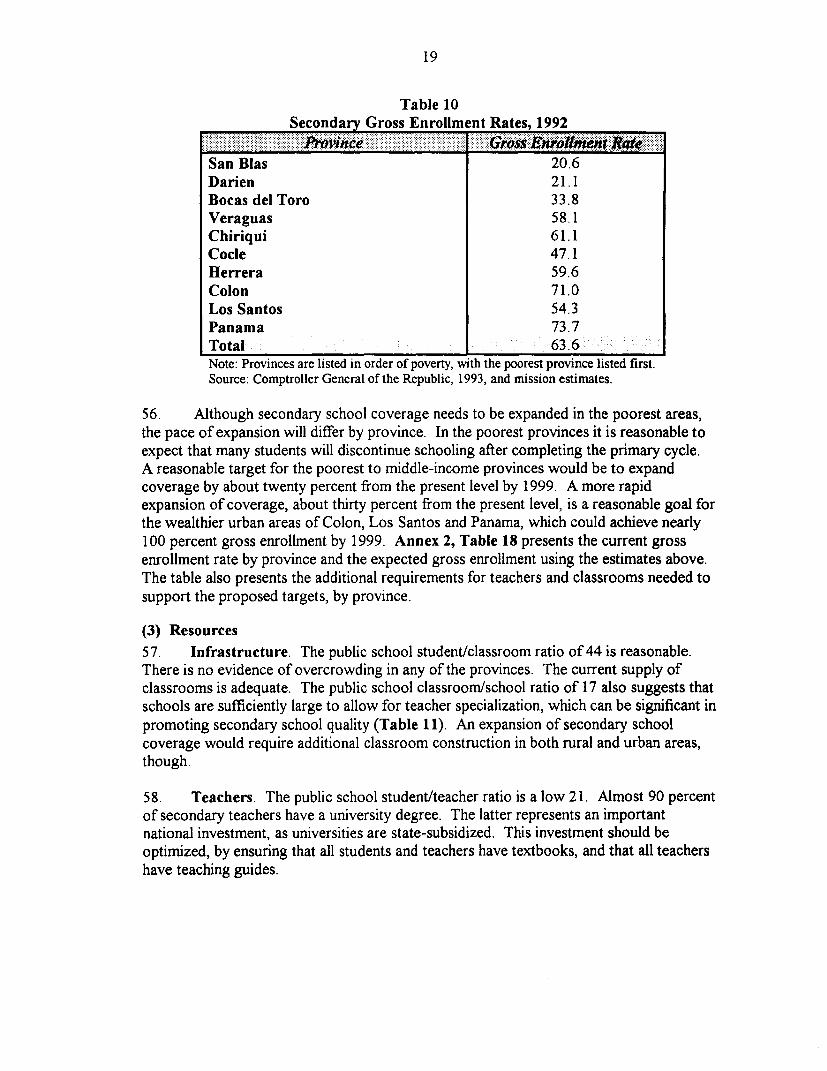
55. There is a wide enrollment variation within Panama, directly related to the povertylevel (Table 10). Two of the three wealthiest provinces have a gross enrollment ratio ofabout 70 percent, while the two poorest have a gross enrollment ratio of about 21 percent.There is about an equal number of female and male students in secondary schools.
19
Table 10Secondary Gross Enrollment Rates, 1992
San Blas 20.6Darien 21.1Bocas del Toro 33.8Veraguas 58.1Chiriqui 61.1Cocle 47.1Herrera 59.6Colon 71.0Los Santos 54.3Panama 73.7Total 63.6Note: Provinces are listed in order of poverty, vith the poorest province listed first.Source: Comptroller General of the Republic, 1993, and mission estimates.
56. Although secondary school coverage needs to be expanded in the poorest areas,the pace of expansion will differ by province. In the poorest provinces it is reasonable toexpect that many students will discontinue schooling after completing the primary cycle.A reasonable target for the poorest to middle-income provinces would be to expandcoverage by about twenty percent from the present level by 1999. A more rapidexpansion of coverage, about thirty percent from the present level, is a reasonable goal forthe wealthier urban areas of Colon, Los Santos and Panama, which could achieve nearly100 percent gross enrollment by 1999. Annex 2, Table 18 presents the current grossenrollment rate by province and the expected gross enrollment using the estimates above.The table also presents the additional requirements for teachers and classrooms needed tosupport the proposed targets, by province.
(3) Resources57. Infrastructure. The public school student/classroom ratio of 44 is reasonable.There is no evidence of overcrowding in any of the provinces. The current supply ofclassrooms is adequate. The public school classroom/school ratio of 17 also suggests thatschools are sufficiently large to allow for teacher specialization, which can be significant inpromoting secondary school quality (Table 11). An expansion of secondary schoolcoverage would require additional classroom construction in both rural and urban areas,though.
58. Teachers. The public school student/teacher ratio is a low 21. Almost 90 percentof secondary teachers have a university degree. The latter represents an importantnational investment, as universities are state-subsidized. This investment should beoptimized, by ensuring that all students and teachers have textbooks, and that all teachershave teaching guides.

20
Table 1 1Secondary Education Student, Teacher and School Ratios, 1993
Student' Studentl Student' Teacher/ Classroom/Teacher Classroom School School SchoolRafio Ratio Ratio Ratio Ratio
Public 21 44 762 36 17Private 17 30 256 15 8Total 20 41 567 28 14Source: MOE, Statistics Department.
59. Textbooks and Materials. Students may have access to textbooks in municipaland school libraries. However, textbooks are changed frequently by teachers, hencelibrary copies are often not current. The result is that students must purchase theirtextbooks, which cost about US$ 35 for the first cycle and US$ 90 for the second cycle,far beyond the economic reach of poor parents and middle-income parents with severalchildren in school. A policy to prevent frequent textbook changes by teachers wouldimprove textbook accessibility for the poor.
60. Laboratories have been installed in many secondary schools, but anecdotalevidence suggests that trained teachers and sufficient materials for operation are frequentlylacking.
(4) Quality
61. Quality of Learning. As in primary education, an assessment of secondaryeducation quality is difficult to make, due to the absence of a standardized monitoring andevaluation system. But there are a few disparate sources that give us some indication ofquality. University admissions exams are a potential source of information about quality.At the University of Panama, the principal public university, the portion of the entranceexam that tests specific knowledge is based on tte upper secondary school curriculum, aswell as the material to be mastered in the first two years of university. Students haveconsistently scored very low on the exam--the average is 40-50 out of a possible score of100. This is not a reliable indicator of secondary education quality, though, because theproportional weight of the two elements in the exam is unknown, as is the degree to whichthe university's own agenda and constraints determine the design of the exam. One in tenstudents is accepted to the public universities, while one in four is accepted to the privateuniversities. The low acceptance rates could well be based on the universities' capacityconstraints--i.e. their need to accept only a certain number of applicants, more than theintent to accurately measure achievement in secondary school. The ambiguity of suchstatistics means that they can not be used as an indicator of the quality of learning insecondary school.
62. Anecdotal evidence from employers is another potential source of informationabout secondary school quality. Many employers have expressed concern in recent yearsabout the lack of preparedness of secondary school graduates, claiming that they lack thenecessary skills to be productive employees. This evidence must also be treated withcaution, though, as it is possible that students are simply not being taught the skills thatare relevant to certain kinds of employment, rather than that they fail to learn what is

21
taught. More research must be done on the needs of employers, so that relevant skills canbe inciuded in the secondary school curriculum.
63. Finally, median income statistics from 1990 show that secondary school graduatesearn more than twice (222 percent) what primary school graduates earn. Given the unitcost of secondary education, though, it is relevant to ask whether the earnings differentialshould be even greater.
64. Quality of Inputs. Available information on some secondary education inputsraises questions about the quality of secondary education. Some secondary students haveas little access to textbooks as do some primary students (described in paragraph 46), dueto poverty and frequent changes in the textbooks used. And as mentioned in paragraph53, many school science laboratories are not adequately equipped for operation. Teachersare not trained to teach science, while in-service training does not focus on it. Finally,curricular content is questioned by the universities and employers. The universities havecreated a special one-year course to prepare students for the entrance examinations.
(5) Efficiency65. The national public secondary school failure rate is 10.5 percent. However, thedata do not show a correlation between failure and poverty, with the highest failure rateoccurring at about the same rates in the three wealthiest and the three poorest provinces.The national public secondary school drop out rate is 5.5 percent. As in the case of thefailure rate, the drop out rate is not correlated with poverty (Table 12), except in the poorprovince of Darien, which has a drop out rate that is twice the national average.

22
Table 12Secondary Education Failure and Drop Out Rates, 1993
Dropout _ FailureProvince Total Public Private Total Public Private
San Bias 7.2 7.2 n.a. 12.5 12.5 n.a.Darien 11.6 11.6 n.a. 10.8 10.8 n.a.Bocas delToro 4.6 4.6 4.5 8.9 9.5 5.2Veraguas 4.5 4.6 3.3 7.8 8.0 3.0Chiriqui 5.9 6.4 0.6 6.4 6.6 4.3Cocle 2.6 2.7 0.3 7.1 7.1 5.6Herrera 7.2 7.3 n.a. 12.8 12.9 5.2Colon n.a. n.a. n.a. n.a. n.a. n.a.Los Santos 6.4 6.4 n.a. 6.5 6.5 n.a.Panama 5.3 5.7 4.2 124 14.4 6.5Total 5.5 5.8 n.a. 10.5 11.4 .6.1n.a. Not Available.Note: Provinces are listed in order of poverty with the poorest province listed first.Source: MOE, Statistics Department.
66. Twenty-five percent of all students complete nine years of education in nine years.Eventually, 38 percent complete the ninth grade in an average of 11 years. Sixty-sixpercent of those who enter secondary school complete the first three-year cycle in threeyears (Annex 2, Table 15).
67. The student body in the second cycle of the academic track was about 60 percentof the size of the student body in the first cycle in 1990 and 1993. About 45 percent ofsecond cycle students in both years were enrolled in the academic track, and 55 percent inthe professional-technical track. The reasons for the significant drop in enrollmentbetween the two cycles need to be explored.
D. Policy-making, Planning and Management
(1) Policy-making68. Law 46 of 1946 defines the structure of the education system and its centralizedadministration. MOE establishes the norms and procedures for the administration ofpersonnel and physical resources, as well as for curricula and supervision. There is aregional office in each province. Although MOE represents the executive branch in theeducation sector, it has lost leadership over the policy-making process. Policy decisions inPanama are today the exclusive responsibility of the Comision Coordinadora deEducacion, the body in charge of educational reforms in Panama. For the last 15 years thecommission has had the exclusive right to propose educational reforms to the Assembly(major education policy reforms must be approved by the National Assembly). Minoreducation reforms that do not need Assembly ratification can be blocked by thecommission.
23
69. The commission was created in 1979 with the responsibility of developing aneducational reform proposal for presentation to the National Assembly. Commissionmembers are paid by the government, and have oversight power over the Minister. TheCommission was originally comprised of ministry, teacher union, and medical unionrepresentatives. The ministry and medical union representatives left gradually over time,until commission membership was left exclusively in the hands of the teachers union. Thecommission is so influential that after President Noriega dissolved it with a war decree in1989, teacher pressure forced the government to reinstate it in 1990.
70. Twice the commission has presented reform proposals to the Assembly, and bothtimes, the projects became mired in Assembly discussions. Ministry representatives andother education authorities made multiple suggestions to correct proposals that wereblatantly biased toward teacher interests. But no progress was achieved in the end, eitherin approving or implementing education policy reform.
71. The comrnission has acquired de facto permanent status, and continues to stymieeducation reform through the teachers union. In practical terms, this long-term stalematemeans that MOE has lost the capacity to implement reforms in the curriculum, thestructure of basic education and the role of the private sector.
72. Policy decisions need to be made in the executive branch of the government, whichis elected to fulfill that role. The executive branch must seek in turn the participation of al!interested parties in preparing educational reforms. MOE should clearly assign theComittee consultative functions, and include all stakeholders in the education system:private sector, church, parents, teachers and MOE.
(2) Planning73. The capacity for planning and formulating policy, strategy and programs is poor.This is due to the lack of key management and planning tools, namely, an MIS and asystem for standard assessment of student achievement. The lack of personnel devoted toeducation sector analysis at MOE, the universities, and research centers exacerbates theseweaknesses.
74. The Planning function. MIPPE and MOE both have educational planning teams.MIPPE has the Subdireccion de Planificaci6n Social and MOE has the Direcci6n
Nacional de Planificaci6n Educativa. At MIPPE, different units perform the planningand the budget programming functions. The planning unit focuses entirely on medium-and long-term planning, while the budget unit focuses on budget programming. MIPPE'sunit requires technical support and training to perform its function effectively.
75. MOE's Direcci6n de Planificacion performs two functions: technicalprogramming and budgeting. The latter consists of a yearly work program for each MOEoffice. There is no medium-term planning, due mainly to the lack of qualified humanresources.

24
76. In several Latin American countries, universities and research centers contribute tothe planning function through education sector analysis, in the form of consultancy work,books, and periodicals. A deliberate effort to strengthen such activity in Panama will helpto strengthen planning and policy-making capacity.
77. The Planning Tools. The basic tools to perform planning functions are statisticson coverage, efficiency, budget and payroll, and a standardized evaluation of studentachievement. MOE collects basic information about coverage and incomplete informationon system efficiency. MOE does not keep historical budget information, but ContraloriaGeneral maintains good historic records. Payroll information is difficult to analyze, andthere are no historic records. MOE administered standardized evaluation tests twice inrecent years. However, the results were not used to provide guidance and feedback to theMOE In-service Training Office, the Curriculum Office, or the team in charge ofevaluating textbooks. And teachers opposed the system because they feared it would beused to evaluate their performance. These two basic planning tools ought to beimplemented, and universities and research centers should be encouraged to use them.
(3) Personnel Management78. More than one-third of university students (23,000) are enrolled in educationprograms. Teacher salaries in Panama are comparatively high, 2.5 times the per capitaincome of about US$ 2,600. Among 11 other Latin American countries, only three havebetter paid teachers (Annex 3). Teachers are clearly among the higher wage earners inPanamanian society.
79. Expansion of the teacher payroll ought to be closely monitored and salaryincreases should be linked to achievement and not only to years of experience. Excessivewaste can be anticipated in the absence of more stringent criteria for the allocation ofadditional posts. And the increments of salary could be also used to support qualityimprovements.
80. Every year some 12,000 teachers apply for teaching posts, while in the past fouryears MOE has created about 1,700 posts annually. At the same time, there are clearindicators that the demand for teachers in Panama is slowing down. The current primarystudent/teacher ratio is a low 25. The current number of teachers on the public payrollcould serve all of the projected school-age population of 1999 (Annex 2, Table 4). Thecurrent student/teacher ratio at the secondary level is 21, also very low. Additionalteachers will be necessary, but only for the rural areas where highly educated teachers arenot likely to remain once they are on the payroll. The demand for many of these teacherscould be satisfied by rationalizing the system of teacher transfers (Annex 3).
81. Given this situation, the responsibility for evaluating and approving the opening ofnew posts should be given to a special high-level group. MIPPE, parents and otherstakeholders should be represented, in addition to MOE and the unions. Also theGovernment should consider linking salary increases to performance and not only to yearsof experience (Annex 3).

25
4. RECOMMENDATIONS
A. Quality Improvements
* Develop curricula for initial education and revise the curriculum for the Jardinesde Infancia, so that there is a developmental progression from initial education,to the Jardines de Infancia, and on to primary school. The curricula developedshould preserve the important distinctions in teaching methods and in learningenvironments for the three levels.
* MOE should develop and set curricular standards, operate pre-primaryprograms in public school buildings and administer the CEFACEI program.The Ministry of Labor should continue to operate the COIF program, but should doso within the educational standards established by MOE. The Ministry of Healthshould be responsible for the nutritional components of pre-primary school programs.
* Provide in-service teacher training according to educational needs, to improvethe quality of teaching. Multigrade teachers, for example, face particular challengesthat require the support of additional training.
? Undertake a study to review curricular content and quality at the secondarylevel, taking into account the needs of a modern economy. The study should alsoreview the sharp drop in the student body in the second academic cycle and theconcerns of students and parents about the relevancy of the secondary schoolcurriculum. The results of the study and curriculum reform should be reviewed by abroad-based group, which would include not only MOE staff but also employers,teachers and parents.
* Develop a national textbook policy to: (a) provide free textbooks and workbooks toneedy primary and secondary students, (b) establish national textbook standards; and(c) limit the frequency of textbook changes. Such a policy would cost about US$ 0.7million for one third of primary students and US$ 11 for 55 percent of secondarystudents.
* Establish a national monitoring and evaluation system to provide the necessaryinformation to manage and improve the education system. A monitoring andevaluation system operating under an independent authority, with representation fromteachers, the university, and MOE, would be non-threatening to teachers and effectivein generating the necessary information.
* Collect additional data and information on the status of school maintenance andrepair and, if necessary, begin a rehabilitation program.

26
B. Coverage Expansion
* Expand coverage of the Jardines de Infancia. Expand the pre-primary educationsystem by relying on private entrepreneurs (promotoras) or community associations toestablish centers and by utilizing the Government to (i) provide subsidies to centersbased on the number of students from families below a certain income threshold, (ii)set curriculum standards and provide training, and (iii) supervise the schools to verifyenrollment and curricular standards. A goal of 60 percent coverage by the end of thedecade is feasible. There are many unused classrooms, some of which could probablybe utilized by the informal sector.
* Expand initial education coverage. The target group for initial education should bethe children of the poor. A cost-effective expansion could be achieved in a mannersimilar to the proposed expansion of the Jardines de Infancia, working through theprivate sector and providing subsidies for the neediest students.
* Gather additional information, in order to design and plan a program to expandpre-primary school coverage. This information would include: identifying thelocation and availability of primary school classrooms that can be made available forpre-primary programs; estimating the cost of retraining and directing teachers into thepre-primary teacher stream; determining the financial contribution of parents to pre-primary programs through fee payments; and evaluating the quality and content ofexisting pre-primary programs.
* Expand secondary school coverage in the poorest provinces. This will best beachieved by improving the quality of primary education, increasing the relevance of thesecondary curriculum, improving the accessibility of secondary schools, andstimulating the demand for education. An expansion of 25 percent in rural areaswould cost about US$ 11.5 million.
* Conduct a study to determine the accessibility to students of present andprojected schools. The study should serve as the basis for determining classroomconstruction needs.

27
C. Financing, Management and Planning
* Increase the share of public resources allocated to pre-primary and primaryeducation, and decrease the share of public resources allocated to highereducation.
* MOE should establish pre-primary subsidy guidelines, to distinguish betweenthose who can pay and those who need to be subsidized from the start.
* Substitute across-the-board subsidies to university students with a program oftargeted subsidies for needy university students.
* Install an MIS and implement a standard evaluation system for studentachievement.
3 Provide training and technical assistance in medium- to long-term technicalplanning to the planning units at MOE and MIPPE.
3 Link teacher salary increases to teacher performance and not only to years ofexperience and rationalize the system of teacher transfers.
* Form a committee comprised of all stakeholders, to provide advice on policymatters and oversee the teacher payroll.

28
BIBLIOGRAPHY
Jaen, N. and others. 1993. Red de Investigadores en Educaci6n: Investigaci6nEducativa. Proyecto Movilizador de Apoyo a Acciones Relevantes de Educaci6npara todos en PanamA, PAN/92/00 1, Panama, Republica de Panama.
Contraloria General de la Republica. 1993a. "Estadistica Panamefia, Situaci6n Social,Estadisticas del Trabajo (Empleo) Ano 1990." Direcci6n de Estadistica y Censo,Panama, Rep[blica de Panama.
Contraloria General de la Republica. 1993b. "PanamA en Cifras: Afios 1988-1992."Direcci6n de Estadistica y Censo, Panama, Republica de PanamA.
Contraloria General de la Republica. 1993c. "Situaci6n Cultural: Educaci6n Afno 1990."Direcci6n de Estadistica y Censo, Panama, Republica de Panama.
Contraloria General de la Republica. 1993d. "Situaci6n Demografica: Proyecci6n de laPoblaci6n Total del Pais por Sexo, Segun Grupos de Edad: Afios 1990-2025."Boletin Especial. Direcci6n de Estadistica y Censo, PanamA, Repuiblica dePanama.
Contraloria General de la Republica. 1993e. "Situaci6n Social: Estadisticas del Trabajo(Empleo) Aho 1990." Direcci6n de Estadistica y Censo, Panama, Repuiblica dePanama.
Contraloria General de la Republica. 1994. "Indicadores Sociales, Afios: 1970, 1980,1983 y 1986-92." Direcci6n de Estadistica y Censo, Panama, Republica dePanama.
de Aparicio, A. 1993. "Propuesta Pedag6gica para el Uso y Aplicaci6n de la Informaticaen los Centros Educativos." Proyecto Movilizador de Apoyo a AccionesRelevantes de Educaci6n para todos en Panama, Panama, Republica de Panama.
Instituto Nacional de Formaci6n Profesional (ITNAFORP). 1993. "Proyecto Presupuestode Funcionamiento 1994." Subdirecci6n de Planificaci6n y Programaci6n TecnicoDocente, Panama.
Instituto para la Formaci6n y Aprovechamiento de Recursos Humanos (IFARI-JU). 1984.Memnoria. Panama City, Panama: IFARIHU.
Manzur, A. and others. 1993. "Concertaci6n Interinstitucional para el Desarrollo de laGerencia Educativo." Universidad de Panama, UJNESCO Proyecto Movilizador,Ciudad Universitaria, Panama.

29
Ministerio de Educaci6n. n.d.. "Informe Final del Proyecto Movilizador de Apoyo aAcciones Relevantes de Educaci6n para todos en Panama." Versi6n Preliminar -Borrador. PAN/92/001. Panama.
Ministerio de Educaci6n (MOE). 1985. "Sintesis General del Plan de DesarrolloEducativo." Documento de Trabajo. Oficina de Planificaci6n Educativa, Panama,Republica de Panama.
Ministerio de Educaci6n. 1986. "La Educaci6n Primaria por Corregimiento, Afno Escolar1985." Oficina de Planificaci6n, Departmento de Estadistica, Ministerio deEducaci6n, Republica de Panama.
Ministerio de Educaci6n. 1987. "Documento Preliminar del Anteproyecto de Ley deActualizaci6n del Sistema Educativo Nacional." Ministerio de Educaci6n,PanamA, Republica de Panama.
Ministerio de Educaci6n. 1991. "Anteproyecto de Ley por el cual se Modifican,Adicionan y Subrogan Articulos de la Ley 47, de 24 Septiembre de 1946, Organicade Educaci6n." Comision Coordinadora de Educaci6n Nacional, Panama,Repuiblica de Panama.
Ministerio de Educaci6n. 1992a. Infornme Anual 1993. Panama: Ministerio deEducaci6n.
Ministerio de Educaci6n. 1992b. "Proyecto Integral para el Mejoramiento de la Gesti6nEducativa. La Reprobaci6n y Deserci6n Escolar en el Primer Nivel de Ensefianzaen Panama en el Quinquenio 1986-1990." Oficina de Planificaci6n, Departmentode Estudios e Investigaciones Educativas, Panama, Republica de PanamA.
Ministerio de Educaci6n. 1993a. Informe Anual 1993. PanamA: Ministerio deEducaci6n.
Ministerio de Educaci6n. 1993b. Plan Nacional de Desarrollo Educativo: 1994-1998.Panama: Ministerio de Educaci6n.
Ministerio de Educaci6n. 1993c. "Proyecciones 1993." Direcci6n de Perfeccionamientoal Educador, Panama, Republica de Panama.
Ministerio de Educaci6n. 1993d. "Realidad Actual y Perspectiva de la Educaci6n deAdultos en Panama." El Proyecto Movilizador de Apoyo a Acciones Relevantesde Educaci6n para todos en Panama PAN/92/00 1, PanamA, Repuiblica de PanamA.
Ministerio de Educaci6n. 1993e. "Situaci6n y Perspectivas de la Educaci6n en las AreasRurales de PanamA." Oficina Subregional de UNESCO para Centroamerica,Ministerio de Educaci6n, Republica de Panama.

30
Ministerio de Educaci6n. 1993f. "Situacion y Perspectivas de la Educacion Profesional yTecnica de Panama." Proyecto Movilizador de Apoyo a Acciones Relevantes deEducaci6n para todos en Panama, PAN/92/001, Panama, Republica de Panama.
Ministerio de Planificaci6n y Politica Econ6mica (MIPPE). 1985. "Relaciones yDiferencias entre la Educaci6n Formal y la Formaci6n Profesional en Panama."Documento de Trabajo No. 57. Direcci6n General de Planificaci6n Econ6mica ySocial, Divisi6n de Planificaci6n Social, Departamento de Recursos Humanos yEmpleos, Panama, Republica de Panama.
Ministerio de Planificaci6n y Politica Econ6mica (MIPPE). 1993. "Mapa de la Pobreza."Direcci6n General de Planificaci6n Econ6mica y Social, Divisi6n de Planificaci6nSocial, Departamento de Recursos Humanos y Empleos, Panama, Republica dePanami.
Ministerio de Trabajo y Bienestar Social. 1984. "Informaci6n Estadistica Sobre RecursosHumanos (Censos, Encuestas de Hogares y Otras Fuentes)." Boletin No. 2.Proyecto 525-0221, Planificaci6n y Generaci6n de Empleo, Sistema deInformaci6n de Recursos Humanos (SIRH), Direcci6n Nacional de Empleo,Panama.
Organizaci6n Internacional del Trabajo (OIT). 1974. Situaci6n y Perspectivas delEmpleo en Panama. Geneva: OIT.
Orgariizaci&n Internacional del Trabajo (OIT). 1984. "Resena de los DocumentosPublicados por El PREALC sobre el Empleo en Panama, 1972-84." ProgramaMundial del Empleo, Programa Regional del Empleo para America Latina y elCaribe (PREALC), Ciudad de Panama, Republica de Panama.
Organizaci6n Internacional del Trabajo (OIT). 1985. "Programas Especiales de Empleoen Panama, 1978-1984. Programa Regional del Empleo para America Latina y elCaribe (PREALC), Santiago, Chile.
Organizaci6n Internacional del Trabajo. 1987. "Conclusiones y Recomendaciones delPoyecto." Apoyo Institucional y Tecnico as INAFORP (FortalecimientoInstitucional) PAN/86/003, Programa de las Naciones Unidas Para el Desarrollo,Ginebra, Suiza.
Pic6o, C. 1992. "Reflexiones, Enfoques y Propuestas Sobre el Desarrollo EducativePanamehio." Ministerio de Educaci6n, Proyecto Movilizador de Apoyo a AccionesRelevantes de Educaci6n para todos en PanamA, PAN/92/001, Panama, Republicade Panama.
Pic6n, C. 1993. Concertando el Futuro de la Educaci6n Panamena. Panama: Programade las Naciones Unidas para el Desarrollo and UNESCO.

31
Programa de las Naciones Unidas para el Desarrollo (PNUD). 1993. "Memoria:Encuentro Nacional Unidad y Desarrollo Humano." PNUD, Bambito, Repiublicade Panama.
Proyecto UNESCO-Alemania. 1993. "Reunion Tecnica Subregional Sobre ExperienciasInnovadoras de Educaci6n en Las Areas Rurales del Istmo Centroamericano."Informe Tecnico. Proyecto UJNESCO-Alemania, 507/RLA/10, Santiago deVeraguas, Republica de Panama.
Romero, P. 1992. Planificaci6n y Regimen Legal de la Educaci6n Superior. PanamaCity, Panama: published by the author.
Secretaria Ejecutive del Convenio Andres Bello (SECAB). 1993. ProgramaMaterialesEducativos y Calidad de la Educacion Basica: Estudio Nacional de Panama.Santafe de Bogota, Colombia: SECAB.
United Nations Educational, Scientific and Cultural Organization (UNESCO). 1993a."Proyecto Apoyo as Sistema de Mejorarniento de la Calidad de la Educaci6nPanamenia." UNESCO, New York, New York.
UNESCO. 1993b. Statistical Yearbook. Paris: UNESCO.
United Nations Children's Fund (UNICEF). 1994. The State of the World's Children1994. New York: Oxford University Press.
Universidad Santa Maria La Antigua (USMA). 1991. "La USMA en Cifras - 1990."Secretaria General, Universidad Santa Maria La Antigua, Panama, Republica dePanama.
United States Agency for International Development (USAID). 1985. "Central AmericaEducation Action Plan for Panama." USAID, Washington, DC.
World Bank. 1986. "Panama: Vocational/Technical/Management Training SubsectorMemorandum." Projects Department, Latin America and the Caribbean RegionalOffice, Washington, DC.

32 Annex IPoverty Index
Poverty Index By Province And District
Provinces and Districts Poverty Index Provinces and Districts Poverty Index
San Bias 19.14 Herrera 80.12Darien 29.96 Las Minas 35.36
Cemaco 13.08 Los Pozos 52.12Chepigana 32.28 Ocu 63.46Pinogana 35.41
Bocas del Toro 47.30 Santa Maria 89.64Chiriquiri Grande 0.00 Pese 84.30Bocas del Toro 22.42 Chitre 100.00Changuinola 70.84 Col6n 84.80
Veraguas 52.30 Donoso 40.28Cahlazos 14.59 Chagres 51.46Las Palmas 22.53 Santa Isabel 53.48Santa Fe 31.90 Portabelo 74.16San Francisco 33.55 Col6n 91.04La Mesa 40.78 Los Santos 85.69Calobre 44.55 Tonosi 66.55Sona 48.25 Macaracas 67.55Rio de Jesus 50.75 Pedasi 86.03Montijo 51.23 Pocri 86.54Atalaya 72.81 Guarare 90.61Santiago 86.54 Los Santos 92.03
Chiriqui 67.90 Las Tablas 93.41Tole 5.78 Panama 94.91San Lorenzo 10.76 Chimin 28.24Remedios 22.94 Chepo 57.35San Felix 27.93 Capira 61.12Renacimiento 59.25 Balboa 64.12Gualaca 64.97 San Carlos 78.27Boquer6n 68.36 Chame 87.19Alanje 69.14 Taboga 88.54Baru 77.47Bugaba 79.64 La Chorrera 92.81
Cocle 71.78 Arraijan 94.92Ola 31.81 Panama 98.01La Pintada 56.49Penonome 64.69Ant6n 75.62Nata 77.20Aguadulce 95.00 _
Note: The Poverty Index by Province is based on a Poverty Index by District done by MIPPE.The Poverty Index is comprised of three variables: housing, education and health. Housing comprises: percent ofhouseholds with running water, sanitary services and electricity, and percent of households with three or morepersons per room. Education is comprised of: percent of students 5-15 years old out of school, percent ofilliterate people over 10 years old and percent of the population over ten years old with less than three years ofprimary school. Health is comprised of: infant mortality, percent of first grade students with growth stunting andpercent of infants born without professional help. The poverty Index by Province is the weighted addition of allthe district indexes. Each district is weighted by its population index.
Source: MIPPE, 1993, Poverty Map

33 Annex 2Statistical. Annex
Table 1: School-Age Population, Students, Enrollment Rate andPercent of Private Students by Level of Education, 1992
School-Age Enrollment PercentStudents Population Students Rate Private
Pre-primary 360,071 33,288 57.9 gross 33Initial 302,581 7,120 2.3 net
educatioJardines 57,490 26,168 45.5 net
Primary 337,495 356,247 105 gross 8.590.9 net
Secondary 316,005 201,047 63.6 gross 17.553.0 net
University 250,097 63,288 25.3 gross 9Source: MOE, Statistics Department
Table 2: Student/Teacher Ratio; Student/School Ratio and Teacher/SchoolRatio by Levels of Education, 1992
II____________ StudentsITeacher Students/School Teachers/SchootPre-primary 23 37.2 1.6Primary 25 129.8 5.2Serondary 20 901.5 45.3
Source: MOE, Statistics Department.
Table 3: Total Number of Schools and Percentage Privateby Education Level, 1992
Schools Percent PrivatePre-Primary 894 31.4Primary 2,744 5.0Secondary 223 62.8Source: MOE, Statistics Department.

34 Annex 2Statistical Annex
Table 4: School-age Population/Teacher Ratio by 1999,Maintaining the Current Number of Teachers on the Payroll
Public and School AgePrivate Teachers, Student/Teacher PopulationiTeach-
Provin¢e 1993 Ratio, 1993 er Ratio, 1999San Blas 217 25 29Darien 425 23 17Bocas del Toro 733 26 24Veraguas 1,721 22 22Chiriqui 2,567 23 27Cocle 1,217 25 26Herrera 609 22 28Colon 1,015 28 31Los Santos 491 18 29Panama 5,315 27 37Total 14,310 25 30' Includes a 10 percent estimated repetition rate.Source: MOE Statistics Department
Table 5: Public and Private School Expenditures by Level, 1992
X t 0Pre- | 0 0 XT :p rmar Primary Secondary Higher Total
Private' 0.9 28.9 43.5 7.1 77.4Public 4.5 94.9 66.4 74.4 240.2
PerCap it abPrivate 900 1000 1290 1200 982Public 192 292 397 1439 421
US$ mnillions.b usS.Source: Comptroller General of the Republic and mission estimates.

35 Annex 2Statistical Annex
Table 6: Pre-Primary Distribution of the Five-Year-Old Population, Students all Ages and Five-Year-Old Students by Province, 1992
PrivateEstimated Population Public Sector Sector
Province Provincial Distribution Students Al Students Al 5 Years Olds4gAes Ages Students
San Bias 839.35 677 284 756Darien 1,080.81 386 162 431Bocas del Toro 2,305.35 641 269 716Veraguas 5,024.63 2,322 976 2,596Chiriqui 9,135.16 3,395 1,426 3,795Cocle 4,277 26 1,873 787 2,094Herrera 2,311 10 1,231 517 1,376Colon 4,150 78 1,847 776 2,065Los Santos 1,897.17 934 392 1,044Panama 26,462.65 10,102 4,244 11,293Total 57,484.26 23,410 9,835 26,166Note: Provincial distribution of the population in 1990 applied to estimated population for 1992.Source: MOE, Statistics and Panama en Cifras 1988-92.
Table 7: Pre-Primary Students by Age, 1992
Percent Of NumberStudents Of Students
Age By Age (Public) Lactantes Maternales Pre- Jardin_ _ _ _ _ _ _ _ _ _ _ _ _ _ _ _ _ _ _ _ _ _ _ _ _ _ _ _ _ _ _ _J a r din - _ _ _ _
One year 0.02 4 4 0 0 02 years 0.04 8 0 8 0 03 years 0.27 56 0 56 0 04 years 3.50 736 0 0 736 05 years 78.72 16,560 0 0 0 16,5606 years 17.22 3,623 0 0 0 3,6237 years 0.23 49 0 0 0 49
Total 100.00 21,036 _ _ _Source: MOE, Statistics Department.
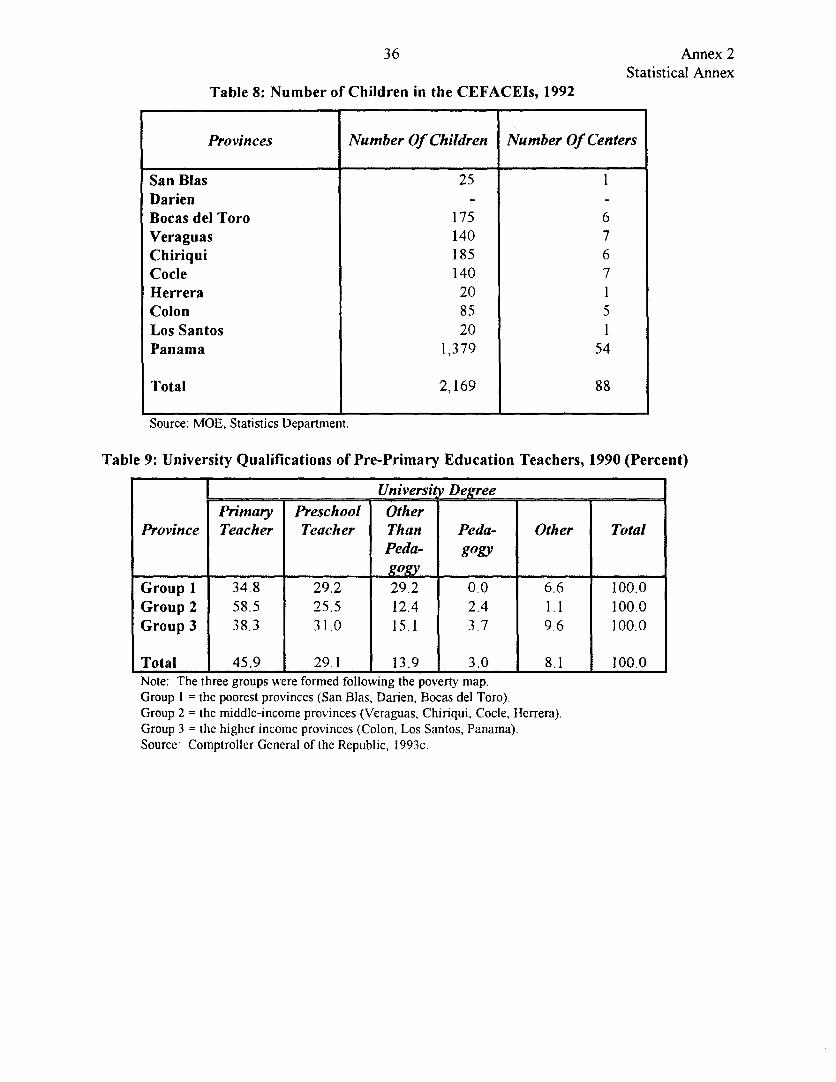
36 Annex 2Statistical Annex
Table 8: Number of Children in the CEFACEIs, 1992
Provinces Number Of Children Number Of Centers
San Blas 25 1DarienBocas del Toro 175 6Veraguas 140 7Chiriqui 185 6Cocle 140 7Herrera 20 1Colon 85 5Los Santos 20 1Panama 1,379 54
Total 2,169 88
Source: MOE, Statistics Department.
Table 9: University Qualifications of Pre-Primary Education Teachers, 1990 (Percent)
_ - Universi V DegreePrimary Preschool Other
Province Teacher Teacher Than Peda- Other TotalPeda- gogy
Group 1 34.8 29.2 29.2 0.0 6.6 100.0Group 2 58.5 25.5 12.4 2.4 1.1 100.0Group 3 38.3 31.0 15.1 3.7 9.6 100.0
Total 45.9 29.1 13.9 3.0 8.1 100.0Note: The three groups were formed following the poverty map.Group I = the poorest provinces (San Blas, Darien, Bocas del Toro).Group 2 = the middle-income provinces (Veraguas, Chiriqui, Cocle, Herrera).Group 3 = the higher income provinces (Colon, Los Santos, Panama).Source: Comptroller General of the Republic, 1993c.

37 Annex 2
;) I Statistical Annex
Table 10: Efficiency of the Primary Education System: Performance of a Hypothetical Cohort of1000 Students Using Constant Rates of Promotion, Repetition and Dropout
NUMBER OF GRADES IN CYCLE: 6 SCHOOL YEAR: 1992
Grade .I Grade 2 Grade 3 ade 4 Grade 5 Grade 6 7ITAL
ENROLLMENT 67,280 56,406 52,872 53.736 49,822 44,089 324,205
REPEATERS 12,768 9,249 6,679 4,442 2,797 889 36,824
DROPOUTS 2,190 1,065 880 585 490 477 5.687
PROMOTED 52,322 46,092 45,313 48,709 46,535 42,723 281,694
REPETITON RATE 19 16.4 12.6 9.3 5.6 2 11.
DROPOUT RATE 3.3 1.9 1.7 1.1 1 1.1 1.8
[PROMOTION RATE 77.8 81.7 85.7 90.6 93.4 96.9 86.
S du
SCPFOOL YEARS Grade I Grade 2 Grade 3 Grade 4 Grade 5 Grade 6 Gradtles Yrs so Grad Year Years
1992 1000 0 0 0 0 0 0 1 1,000
1993 190 778 0 0 0 0 0 2 968
1994 36 276 636 0 0 0 0 3 948
1995 7 73 305 545 0 0 0 4 930
1996 1 17 98 306 494 0 0 5 916
1997 0 4 26 109 305 461 447 6 905 2,682
1998 0 1 6 31 116 294 285 7 448 1,995
1999 0 0 2 8 34 114 110 8 158 880
2000 0 0 0 3 9 34 33 9 46 297
2001 0 0 0 0 4 9 9 10 13 91
2002 0 0 0 0 0 4 4 11 4 44
2003 0 0 0 0 0 0 0 12 - -
2004 0 0 0 13
2005 0 0 0 0 0 0 0 14
TOTALS 1.234 1,149 1,073 1,002 962 916 gm _,33 S,91
TIME AVERAGE = CUMULATIVE YEARS / GRADUATES 6.74 years per glrduate
COST AVERAGE - STUDENT YEARS / GRADUATES 7.14 student yearn per grdue
TIME EFFICIENCY - GRADUATES * NO. OF GRADES / CUM YEARS 0.89 output / year used
COST EFFICIENCY = GRADUATES * NO. OF GRADES / STUDENT YEARS 0.84 output / place fhmnced
STU9ENT YEARS - TOTAL STUDENTS ENROLLED IN EACH YEAR
CUMULATIVE YEARS - GRADUATES IN YEAR * NUMBER OF YEARS TO GRADUATE

38 Annex 2Statistical Aex
Table 11: Primary School Student Failure, Repetition and Dropout in Public and Private Schoob
R epenm Gr I Grade 2 Gradr 4 Grade 4 CGrade Grade 6 ToaPublic 19 16.4 12.6 8.3 5.6 2 11.Private 0.4 0.6 0.4 0.3 0.5 0.2 0.
DropoutPublic 3.3 1.9 1.7 1.1 1 1.1 1.Private -0.8 1 0.2 1.4 -0.8 0.3 0.
PailurePublic 18.5 14.4 10.3 7.7 5.9 1.5 10..Private 1.2 1 0.6 0.5 0.4 0.2Source: MOE, Statistics Department.
Table 12: Primary School StudentsFailure, Repetition and Dropout in Rural and Urban Areas
1993
Repewer Gr:de I Grade 2 Gp*k 4 Orade 4 C GrdeS GradG ;6 TOWaRural 22.5 19.1 15.4 9.8 6.3 2.5 1Urban 11.8 11.2 8.2 6.8 4.8 1.4 7.
DropoutRural 3.6 2 1.9 1.6 1.6 1.6 2.Urban 2.6 1.6 1.3 0.4 0.2 0.4 1.1
FailureRural 22.2 17.3 13.6 9 6.6 1.7 13.Urban 11.1 8.8 6.2 5.8 4.9 1.1 6Source: Statistics Department.

39 Annex 2Statistical Annex
Table 13: Primary Education Coverage in Selected Countries (Percent)
Couniy Gross Enrollment Net EnrollmentPanamaa 104 90Chileb 98 87Colombia' 111 74Costa Rica' 102 97IVenezuelac 99 91* 1991b 1992
a 1990Source: UNESCO, 1993b.
Table 14: University Qualifications of Primary Education Teachers, 1990 (Percent)
r- -wy Otheh SpecialProvine. T-ai,* Ped&&ogpy - biecfs IOther ToWl
Group 1 90.6 0.4 4.2 0.8 4.2 100.0Group 2 84.3 2.8 9.0 2.4 1.3 100.0Group 3 72.8 3.9 16.3 3.8 3.2 100.0Note: The three groups were formed following the poverty map.Group i = the poorest provinces (San Blas, Darien, Bocas del Toro).Group 2 = the middle-income provinces (Veraguas, Chiriqui, Cocle, Herrera).Group 3 = the less poor (Colon, Los Santos, Panama).Source: Office of Statistics and Census, Cultural Position, Ministry of Education, 1990.

Table 15: Efficiency of the Primary Education System: Performance of a Hypothetical Cohort of 1000 StudentsUsing Constant Rates of Promotion, Repetition and Dropout J
NUMBER OF GRADES IN CYCLEA 9 93.02 3.S77 SCHOOL YEARs1992
t0<r@s~~~C OR, 2 RUDE CAP" CE Cat GRA"E > > WXQ^
ENROLLMENT 67,280 56,406 52,872 53,736 49,822 44,089 41,013 33,682 27,605 426,505
REPEATERS 12,768 9,249 6,679 4,442 2,797 889 4,639 3,660 2,962 4S,085
DROPOUTS 2,190 1,065 880 585 490 477 3,554 2,198 1,286 12,725
PROMOTED 52,322 46,092 45,313 48,709 46,535 42,723 32,820 27,824 23,357 365,695
REPEnnON RATE 19 16.4 12.6 9.3 5.6 2 11.3 10.9 10.7 0
DROPOUTRATE 3.3 1.9 1.7 1.1 1 1.1 8.7 6.5 4.7 0
PROMOTION RATE 77.8 81.7 85.7 90.6 93.4 96.9 80 82.6 84.6 0
I ~~~~~~~~~~~~~~~~~~~~~~~~~~~~~~~~~~~~~~~~~~~~~~~~~~~S0-'~. GRADE GRDE- GRADE GRADE G GDE GRADE GRADE 0GRA ES T I0
SCEOOL'YERS- 1 2 3 4 5 4 7 8 J GRADUA GRAD
1992 1000 0 0 0 0 0 0 0 0 0 1 1,000
1993 190 778 0 0 0 0 0 0 0 0 2 968 -
1994 36 276 636 0 0 0 0 0 0 0 3 948 - 0
1995 7 73 305 545 0 0 0 0 0 0 4 930
1996 1 17 98 306 494 0 0 0 0 0 S 916
1997 0 4 26 109 305 461 0 0 0 0 6 905
1998 0 1 6 31 116 294 447 0 0 0 7 895
1999 0 0 2 8 34 114 336 358 0 0 8 852
2000 0 0 0 3 9 34 148 308 296 250 9 798 2,250
2001 0 0 0 0 4 9 50 152 286 242 10 501 2,4202002 0 0 0 0 0 4 15 57 157 133 11 233 1,4632003 0 0 0 0 0 0 6 IS 64 54 12 88 648 cn
2004 0 0 0 0 0 0 1 7 22 19 13 30 247 P)2005 0 0 0 0 0 0 0 2 8 7 14 10 98
4~TFA.8- .-.- t :1 -1234 E 1,149 I,073 -, -2 96- * - a .l --, .. l S i - .n - 7ijl4,4rtH
TIME AVERAGE = CUMULATTVE YEARS / GRADUATES 10.11 yean per graduate COST AVERAGE = STUDENT YEARS / GRADUATES 12.87 sudent yea per grduatre
TIME EFFICIENCY = GRADUATES * NO. OF GRADES / CUMM YEARS 0.89 output / yeas used
COST EFFICIENCY = GRADUATES * NO. OF GRADES / STUDENT YEARS 0.7 output / places financed D X
X t-aSTUDENT YEARS = TOTAL STUDENTS ENROLLED IN EACH YEAR
CUMULATIVE YEARS = GRADUATES IN YEAR * NUMBER OF YEARS TO GRADUATE

Table 16Multigrade Schools: Teachers and Students, 1992
-mnce (1) Toal AIurtltro de % Muhtgrad Tr4a Vul ade % of Multirag Total Maegr.de %MutradeShol, Swhool (2) Schoo/s 3) Toehen Tacher (4) Teacher Studts (5) Student,
T otal 2590 2050 79.1 13114 3,734 28.5rbwan 232 9 3.9 5134 13 0.3 145,338 345 0.2oRal 2358 2041 86.5 7980 3721 46.6 327,185 75,743 23.1
ians 39 23 59 226 43 19 5,534 1,052 19rUm - - - ----
Rurd 39 23 59 226 43 19 5,534 1,052 19Dari6n 149 137 91.9 432 231 53.5 9,840 4,758 48.3Urbana I - - 14 - - 345 - -Rual 148 137 91.9 418 231 53.5 9,495 4,758 48.3Boas del Toro 180 164 91.1 760 286 37.6 19,062 6,369 33.4Urbana 7 - - 155 - - 4,316 - -Rura 173 164 91.1 605 286 37.6 14,746 6,369 33.4Veragus 441 402 91.1 1,707 799 46.8 36,699 15,638 42.6Urbna 9 - - 260 - - 6,855 - -
Rund 432 402 91.1 1,447 799 55.2 29,844 15,638 52.3 4
Chiriquf 500 374 74.8 2,335 674 28.9 56,867 15,209 26.7Urbana 36 - - 599 - - 16,066 -Rurna 464 374 74.8 1,736 674 38.8 40,801 15,209 26.7codM 299 241 80.6 1,209 461 38.1 29,390 10,440 35.5Urban& 14 3 21.4 258 4 1.5 7,144 95 1.3Rund 285 238 83.5 951 457 48 22,246 10,345 46.5Hrrera 173 155 89.6 596 303 50.8 13,016 5,555 42.7 EUrbana 10 - - 209 - - 5,395 - -
Rund 163 155 89.6 387 303 50.8 7,621 5,555 72.9 I
Co6n 166 123 74 952 220 23.1 26,519 4,913 18.5Urbana 14 1 7.1 417 1 0.2 13,176 41 0.3Rral 152 122 80.3 535 219 40.9 13,343 4,872 36.5LosSantos 168 150 89.3 478 236 49.4 8,764 3,629 41.4 > Urbana 5 - - 110 - - 2,678 - -PX
Rural 163 IS0 92 368 236 64.1 6,086 3,629 41.4 x r
ransnnaProv. 475 281 59.1 4,419 481 10.9 121,494 10,180 8.4Ufbana 136 5 3.7 3,112 8 0.2 89,363 209 0.2oral 339 276 81.4 1,307 473 36.2 32,131 9,971 31
(1) Province. odered by poveity level. .Soure: MOe, Stitire Depatment
(2) 1992 Check with Psm. why the total of 4102 differ from other with total of 3750 ahown in other table.
(3) 1993 (5) Total enrllment a only 327,155 for 1993 while we arm wokn with a total enroilmnt of 356,247 for 1992
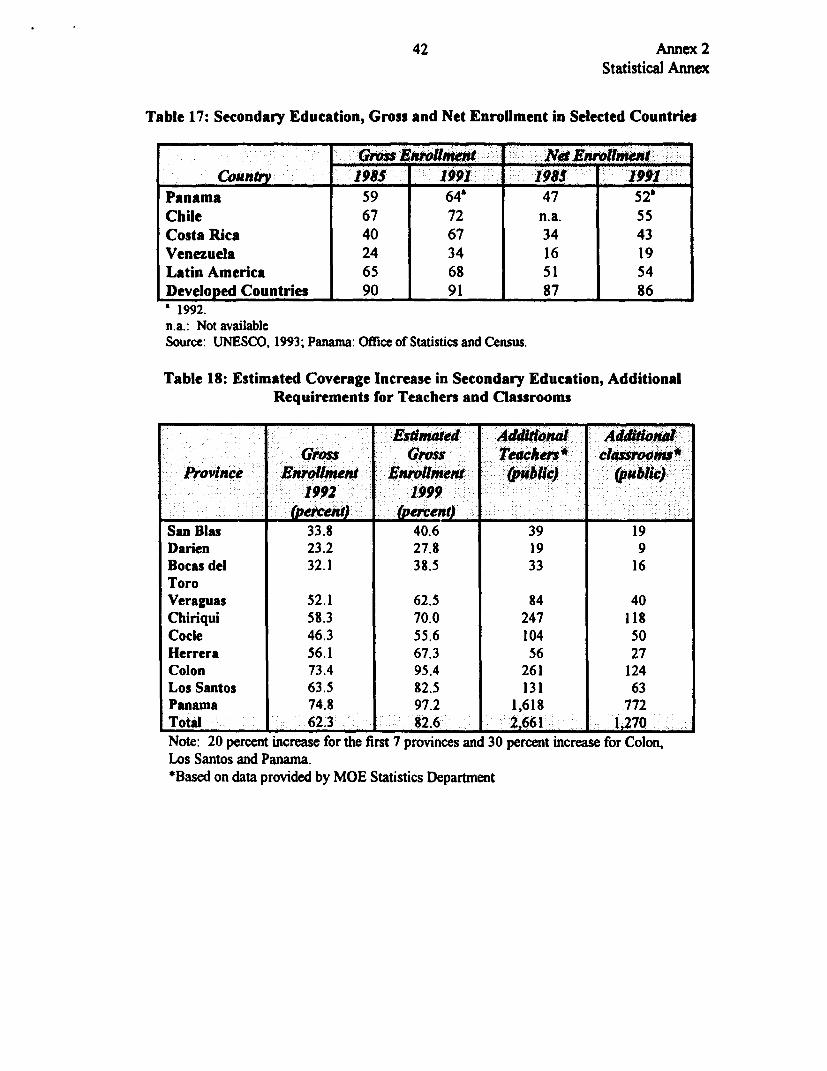
42 Annex 2Statistical Annex
Table 17: Secondary Education, Gross and Net Enrollment in Selected Countries
Colunty 19850 1991 1985 19*1Panama 59 64' 47 52Chile 67 72 n.a. 55Costa Rica 40 67 34 43Venezuela 24 34 16 19Latin America 65 68 51 54Developed Countries 90 91 87 86a 1992.n.a.: Not availableSource: UNESCO, 1993; Panama: Office of Statistics and Census.
Table 18: Estimated Coverage Increase in Secondary Education, AdditionalRequirements for Teachers and Classrooms
Estimted Additional Ad do,wiGreis Gross Tlei,2 das,wm
Province Enrllment Enrlmt (lic) (public)1.992' 1999
_______ 011~eni (percej#
San Blas 33.8 40.6 39 19Darien 23.2 27.8 19 9Bocas del 32.1 38.5 33 16ToroVeraguas 52.1 62.5 84 40Chiriqui 58.3 70.0 247 118Cocle 46.3 55.6 104 50Herrera 56.1 67.3 56 27Colon 73.4 95.4 261 124Los Santos 63.5 82.5 131 63Panama 74.8 97.2 1,618 772Total 62.3: 82.6 2,661 1,270Note: 20 percent increase for the first 7 provinces and 30 percent increase for Colon,Los Santos and Panama.*Based on data provided by MOE Statistics Department

43 Annex 2Statistical Annex
Table 19: Secondary Education, First and Second Cycle Students, 1990 and 1993
Professional-Year Cycle Total Academic Technical1990 First 126,735
Second 75,796 33,538 42,2581993 First 123,685
_ Second 77,362 34,658 42,704Source: MOE, Statistics Department.
Table 20: Secondary Education, Academic and Professional-Technical Students(percent)
1989 1990 1991 1992 1993Academic 42.0 42.6 43.1 43.7 42.9Professional- 58.0 57.4 56.9 56.3 57.1TechnicalTotal 100.0 100.0 100.0 100.0 100.0Source: MOE, 1993b.
Table 21: Number of Classrooms by Shift and Province, 1992
Provinces Classrooms Classrooms In Use(1) one Shift Two Three
Shifts Shifts
Total 12,472 11,363 1,817 368
Bocas del 626 573 171 20Toro
Cocle 1,293 1,192 34 36Colon 843 767 182 29Chiriqui 2,333 2,141 136 81Darien 483 430 - 21Herrera 704 594 2 25Los Santos 662 553 - 30Panama 3,497 3,241 1,221 46Veraguas 1,799 1,640 71 67San Blas 232 232 - 13
Panamc en Cifras reports 11181 classrooms. The Planning Direction of the Ministryof Edacation reports 12472.
970 classrooms are being used for secondary.Classrooms in use: 11363+1817 (second shift)+ 1263 (private schools classrooms)=14443.

44 Annex 2Statistical Annex
Table 22: Demand and Supply of classrooms by Province in 1992 and 1999
Balance ( y - Demand)Province; Cassrooms in 1992 1999C
San Bias 232 16 -18Darien 430 154 110Bocas del Toro 771 384 323Veraguas 1,737 455 251Chiriqui 2,428 365 38Code 1,260 214 48Herrera 608 -9 -107Colon 1,035 376 272Los Santos 560 -136 -247Panama 6,452 1,883 1,157
Including private schools and double shifts.b Using the current student/classroom ratio of each province.
Using current students/classroom ratio, projected schoolage population and enrollment of100%/ plus 10% repetition rate.
Sources: Private schools, MOE, Department of Statistics.Public Schools, mission estimates.
Table 23: Trends of Public Expenditures by Level (annual average percentages)
______________________ 1983-87: 1990-91 1992-93Pre-primary and Primary 45.1 45.8 40.9Secondary 29.3 27.9 26.7Higher 25.6 26.3 32.4Total 100.0 1000 l0ff.0Source: Contraloria General de la Repiiblica
Table 24:Education Expenditure Financing Sources (percent)
________________ ;1991 1992 1993 1994 AverageCentral 66.2 38.5 76.3 59.6 60.2GovernmentExternal Resources 33.8 61.5 23.7 40.4 39.8Total 100.0 10 0.0 100.0 100.0 100.0Note: These are budgeted amounts, not what was actually spent.Source: MIPPE.

45 Annex 3Teacher Salaries
TEACHER SALARIES AND WORKING CONDITIONS
1. There are two main components of the educational system in Panama for schoolteachers (initial, primary and secondary levels): salaries and work place. The salarystructure is predetermined by the kind of formation the teacher has and by years ofwork experience, while work location is determined by a competence system based onimprovement, experience and professional formation.
2. The salary structure in July 1994 consists of an initial salary, which depends onthe professional formation of the teacher. This salary is in place for an initial two-year trial period. Once this stage is completed, the salary is readjusted 0-10%,depending on professional formation. Thereafter, the salary is subject to bi-annualreadjustments, which add a constant amount to the base salary after every two yearson the job. In the case of primary teachers (51 % of the total in 1992), their salarieswere incremented by US$ 13 every two years, while the salaries of secondary teacherswith a specialization were increased by US$ 18 every two years.
TABLE 1TEACHER SALARY STRUCTURE (US$/Month)
Working Primary Primary I Primary 2 Secondary Speckia Secon.I Years Teacher Teacher Teacher Teacher Teacher
0 338 415 435 445 4852 361 425 465 445 5404 374 440 480 460 5586 387 455 495 475 5768 400 470 510 490 59410 413 485 525 505 61212 426 500 540 520 63014 439 515 555 535 64816 452 530 570 550 66618 465 545 585 565 68420 478 560 600 580 70222 491 575 615 595 72024 504 590 630 610 73826 517 605 645 625 75628 530 620 660 640 774
Source: Ministry of Education
Notes:
I Teacher with title of first instruction
2 Teacher with title of second instruction

46 Annex 3Teacher Salaries
3. Based on an international comparison, teacher salaries in Panama are high. Ifwe consider that in 1992, GDP per capita in Panama increased to US$ 2,367, then aprimary school teacher salary fluctuated--according to years of work experience--between 1.85 and 2.91 times GDP per capita. This number is relatively high whencompared with other countries in the region (see Table 2), where the average teachingsalary is 2.5 times GDP per capita. Only three countries are above Panama among the12 cases considered.
TABLE 2
TEACHER SALARIES IN SELECTED LATIN AMERICAN COINTRIES
Country SalarylGDPpercapita |
Mexico 0.9Uruguay 1.0
Peru 1.3Venezuela 1.5Guatemala 1.7Argentina 1.8Ecuador 2.0Colombia 2.2Panama 2.5
Costa Rica 3.2Brazil 3.2
Jamaica 3.4Soure: Lockheed and Verspoor: 'Improving Primary Education in Developing Countries' World Bank, 1991
4. Teacher salaries are high within Panama as well. According to a PRELACrepor., the average income of the eighth percentile of households was US$ 379 in1989. Incorporating the 14% increase in per capita income between 1989 and 1992, aprojection of US$ 432 is obtained for 1992, when the average liquid salary of teacherswas Uv$ 420. Teachers are clearly among the higher wage earners in Panamaniansociet .
5. Public school teachers in Panama are fortunate not only in salaries but also inworking hours (5 and 1/2 hours 5 days a week for a period of 36 weeks in a schoolyear), social security (complete package), retirement age (approximately 50), and jobsecurity and stability. But these benefits are not linked to performance criteria, exceptfor a iubious system of points for location transfers (traslados). In other words,teacherr receive the benefits mentioned independent of the level of dedication and effortthey pu. into their work. This shows that the education incentive system rewardsteachetr regardless of their productivity. One anticipated result of this incentivescheme is high fiscal funding, and a glut of teachers with low educational achievement.

47 Annex 3Teacher Salaries
6. The policy implications point towards a reform in the incentive system, in orderto link the benefits of teaching to educational achievement. Teachers in Panama shouldalso be subject to the new norms directed towards decreasing the deficit of the socialsecurity system and increasing the retirement age.
Salary System: Incentive for Teacher Union Pressure and Explosion of Costs
7. The basic change in the salay system agreed to in 1993 refers to the concept of"oversalary' (sobresueldo) or salary increase for teachers, based on years of workexperience. With the change, the readjustment is made through a higher initial salarylevel and incremental increases over time (see Table 3).
8. There are two main fiscal implications of this new salary scheme. First is theimpact of paying each teacher according to years of work experience. An estimateshows a 5-10% increase in additional resources needed by the Government for the firstyear. Second, a skewed effect because as teachers get older the salaries paid willincrea in relation to the present. In addition, the new salary system creates a heavyfisa burden for the social security system, because it is based on the amount of thelast salary received, which will be increased from 25% to 37% (provisional).

48 Annex 3Teacher Salaries
TABLE 3NEW TEACHER SALARY STRUCTURE
kWoingI Primary 1Seo 3 Specal Secon.Years Teacher Teacher Teacher Teaher Teacher I
0 0 0 0 0 02 0 0 0 0 04 0.8 0.9 0.8 0.9 0.26 1.8 2.2 2 2.9 1.48 3 3.6 3.3 5.1 2.710 4.4 5.2 4.8 7.3 4.112 5.9 6.8 6.3 9.8 5.714 7.5 8.7 8.1 12.5 7.616 9.5 10.9 10.2 15.5 9.618 12.1 13.4 12.5 18.6 11.820 14.5 15.7 14.7 21.6 1422 17.5 18.6 17.4 25.2 16.724 20.5 21.5 20.2 28.7 19.226 24 25.1 23.6 32.8 22.428 27.4 28.7 27 36.7 25.3
Source: Ministry of Education
Notes:
I Teacher with titde of first instruction
2 Teacher with title of second instruction
3 Beginner
9. The 1993 teacher strike and the conditions for its termination illustrate aperverse incentive for the teacher salary and benefit system in Panama. Teachers nowhave an incentive to exert pressure on the Government as a group, since theirnegotiating power depends on the number of teachers participating in the strike. Inaddition, the fact that the benefits obtained favor all of them, ensures a massive,synergist c movement. The overall results for Panamanian society are negative. Fiscalconcessicons have a high cost, because they favor the teaching profession withoutguararlteeing an improvement in education. Again this is due to the lack of connectionbetweer, benefits and achievements in the system.
10. As mentioned above, the policy implication is to link benefits to productivityand educational achievement. Salary adjustments should be made selectively,rewardling teacher merit and experience.
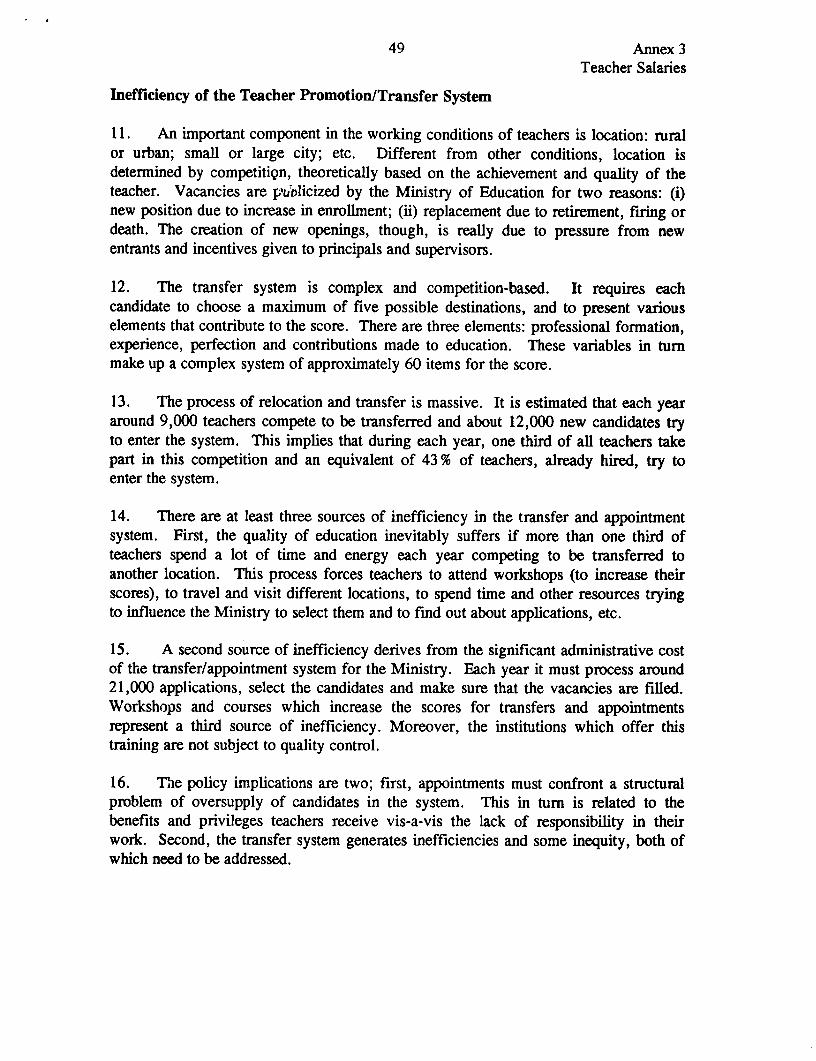
49 Annex 3Teacher Salaries
Inefficiency of the Teacher Promotion/Transfer System
11. An important component in the working conditions of teachers is location: ruralor urban; small or large city; etc. Different from other conditions, location isdetermined by competitiQn, theoretically based on the achievement and quality of theteacher. Vacancies are pV.olicized by the Ministry of Education for two reasons: (i)new position due to increase in enrollment; (ii) replacement due to retirement, firing ordeath. The creation of new openings, though, is really due to pressure from newentrants and incentives given to principals and supervisors.
12. The transfer system is complex and competition-based. It requires eachcandidate to choose a maximum of five possible destinations, and to present variouselements that contribute to the score. There are three elements: professional formation,experience, perfection and contributions made to education. These variables in turnmake up a complex system of approximately 60 items for the score.
13. The process of relocation and transfer is massive. It is estimated that each yeararound 9,000 teachers compete to be transferred and about 12,000 new candidates tryto enter the system. This implies that during each year, one third of all teachers takepart in this competition and an equivalent of 43 % of teachers, already hired, try toenter the system.
14. There are at least three sources of inefficiency in the transfer and appointmentsystem. First, the quality of education inevitably suffers if more than one third ofteachers spend a lot of time and energy each year competing to be transferred toanother location. This process forces teachers to attend workshops (to increase theirscores), to travel and visit different locations, to spend time and other resources tryingto influence the Ministry to select them and to find out about applications, etc.
15. A second source of inefficiency derives from the significant administrative costof the transfer/appointment system for the Ministry. Each year it must process around21,000 applications, select the candidates and make sure that the vacancies are filled.Workshops and courses which increase the scores for transfers and appointmentsrepresent a third source of inefficiency. Moreover, the institutions which offer thistraining are not subject to quality control.
16. The policy implications are two; first, appointments must confront a structuralproblem of oversupply of candidates in the system. This in turn is related to thebenefits and privileges teachers receive vis-a-vis the lack of responsibility in theirwork. Second, the transfer system generates inefficiencies and some inequity, both ofwhich need to be addressed.


826 80~ 78
PANAMACOMPOSITE INDEX OF POVERTY
POVERTY INDEX LEVEL:
_ Highest Poverty Level ( 19.1 to < 71.8)- Moderate Poverty Level ( 71.8 to < 80.1
_ .....iLowest Poverty Level ( 80.1 to 94.9) _
-% POVERTY INDEX VALUE:
'r ' - > @- Absolute Poverty Index Value PANAMA 1'9.),4 . .D ,- _1,O Panama City 08 (~~~~~~~~k8
, - COCLE
d.~~~~~~~~~~~~~~~~~~E
National Capitol
Province Boundories r_he booodories. ~ - - - International Boundaries
Z denom.not,ons .nd -ny LOS SANTOS0 other ,hnfornot,on s _mply on thid - ot f O20 30 4050 60708090 100 COLOMBIA Ore imply. on the ,~~~~~~ort o~~ ,i
857j ~KILOMETERS - CO OMBIThe World B.,n Gro,p. p
Tony iodgrent on the legul Mw stotos of ony terr,tory. MILES or ony endorsement 10 20 30 40 S0 60-0 or occeponce of such0 boundories 82, 80 78'