report no. 13619-do the dominican republic growth with ... filereport no. 13619-do the dominican...
TRANSCRIPT

Report No. 13619-DO
The Dominican RepublicGrowth with Equity:An Agenda for ReformMay 15, 1995
Country Operations DivisionCountry Department IILatin America and the Caribbean Regional Office
C
Document of the World Bank
Pub
lic D
iscl
osur
e A
utho
rized
Pub
lic D
iscl
osur
e A
utho
rized
Pub
lic D
iscl
osur
e A
utho
rized
Pub
lic D
iscl
osur
e A
utho
rized
Pub
lic D
iscl
osur
e A
utho
rized
Pub
lic D
iscl
osur
e A
utho
rized
Pub
lic D
iscl
osur
e A
utho
rized
Pub
lic D
iscl
osur
e A
utho
rized

CURRENCY EQUIVALENTS
Currency Unit: Peso (RD$)RD$1 = US$0.0738 (as of March 1995)
US$1 = RD$13.60
FISCAL YEAR
January 1 - December 31
ACRONYMS AND ABBREVIATIONS
CEA State Sugar Council (Consejo Estatal del Azucar)CDE Dominican Power Company (Corporaci6n Dominicana de Electricidad)CORDE State Holding Corporation (Corporaci6n Dominicana de Empresas Estatales)CPI Consumer Price IndexDIR Directorate of Income Tax (Direccion de Impuesto a la Renta)DGA Directorate of Customs (Direcci6n General de Aduanas)DGRI Directorate of Domestic Revenues (Direccion General de Recaudaci6n Indirecta)FED Economy and Development Foundation (Fundaci6n Economfa y Desarrollo)FGT P2 Foster-Greer-Thorbecke P2 IndexFTZs Free Trade ZonesGATT General Agreement on Tariffs and TradeGDP Gross Domestic ProductICOR Incremental Capital Output RatioINESPRE Price Stabilization Institute (Instituto Nacional de Estabilizaci6n de Precios)IVSS Tax on Luxury Housing and Non-Constructed LotsIDB Inter-American Development BankIMF International Monetary FundNAFTA North American Free Trade AssociationNFS Non-Factor ServicesRNC National Taxpayer Registry (Registro Nacional de Contribuyentes)UNDP United Nations Development ProgrammeVAT Value Added TaxWHO United Nations World Health Organization

TABLE OF CONTENTS
SUMMARY OVERVIEW i-ivPANORAMA GENERAL i-v
Section E-MACROECONOMIC FAEWOR
Sources of growth .IThe macroeconomic framework .3Macroeconomic vulnerability .4The reform agenda 8.:h reor agnd ... .. ..... ....... -. -................ :-.-...... ,-:................... . ..... ,. ...... _
Section -if: :RADEREFORM .. .: : .- ... . .. .. :
The trade regime is being reformed .11But effective protection remains high .12The VAT and excise provide additional protection .13Non-tariff barriers are substantial and discretionary .14Relative prices are distorted .15Conclusion .15
Section III: TAX REFORM ...................... 17
The present tax system .17Progress in tax administration is slow .18Administrative reforms .19Expanding the tax base 22
Section I: POVERTY ASSESSMENT.....,.-... ... '...'..:..-',."'.".-'' .23
Measuring poverty and inequality .23What the results show .24The effects of economic policies on the poor .27Social spending is not targeted to the poor .31Elements of a poverty alleviation strategy .32
BIBLIOGRAPHY
TECHNICAL PAPERS':
TECHNICAL PAPER A: Long-Run Growth DeterminantsTECHNICAL PAPER B: Effective Protection Estimates
1. Available on request.

TEXT TABLES
Table 1.1: Growth Performance of Tourism and FTZs, 1970-93 ........................ 2Table 1.2: Sources of Growth, 1974-93 ........................................ 2Table 1.3: Selected Macroeconomic Indicators ................................... 3Table 1.4: Consolidated Public Sector, 1989-93 ................................... 5
Table 2.1: Effective Protection Rates, 1993 ........ . . . . . . . . . . . . . . . . . . . . . . . . . . . . 12Table 2.2: Import Tariffs, 1993 .......... .. . .. . .. .. . .. . .. . .. .. . .. . .. . .. . . . 13Table 2.3: Additional Protection Due to VAT 1993 ....... . . . . . . . . . . . . . . . . . . . . . . . . 13Table 2.4: Additional Protection Through Excise Tax, 1993 ...... . . . . . . . . . . . . . . . . . . . . 14Table 2.5: Effective Protection for Selected Agricultural Products, 1990-92 ..... . . . . . . . . . . . . 15Table 2.6: Relative Prices-Santo Domingo/Miarmi ....... . . . . . . . . . . . . . . . . . . . . . . . . . 15
Table 3.1: Tax Revenues, 1990-93 .......... . .. . . .. . .. . .. . .. . .. . .. . .. . . .. . . . 18
Table 4.1: Poverty and Extreme Poverty, 1986-92 ....... . . . . . . . . . . . . . . . . . . . . . . . . . 24Table 4.2: Children in Poverty, 1992 ......... . .. . . .. . . .. . . .. . . . .. . . .. . . . .. . . 25Table 4.3: Malnutrition, 1991 ........... .. . .. .. .. . .. .. .. .. . .. .. .. . .. .. . .. . 25Table 4.4: Poverty and Gender, 1986-92 ......... . . . . . .. . . . . .. . . . . . .. . . . . . .. . . 26Table 4.5: Income Distribution, 1986-92 ......... . . . . . .. . . . . .. . . . . . .. . . . . . .. . . 26Table 4.6: Income Sources of the Rich and Poor, 1992 ....... . . . . . . . . . . . . . . . . . . . . . . 26Table 4.7: Expenditures of the Rich and Poor, 1992 ....... . . . . . . . . . . . . . . . . . . . . . . . . 27Table 4.8: Minimum Wages and Poverty, 1986-92 ....... . . . . . . . . . . . . . . . . . . . . . . . . . 28Table 4.9: Growth and Employment, FTZs and Rest of the Economy, 1974-93 ..... . . . . . . . . . 29Table 4.10: Expenditure on Selected Products, 1992 ....... . . . . . . . . . . . . . . . . . . . . . . . . . 29Table 4.11: Cost of Protection to the Poorest 10 Percent, 1992 ...... . . . . . . . . . . . . . . . . . . . 30Table 4.12: Who Gets the Subsidy on Cooking Gas? 1993 ....... . . . . . . . . . . . . . . . . . . . . . 30Table 4.13: Who Pays the Petroleum Tax? 1991-93 ....... . . . . . . . . . . . . . . . . . . . . . . . . . 31Table 4.14: Public Social Expenditures, 1980-92 ........ . . . . . . . . . . . . . . . . . . . . . . . . . . 32
TEXT BOXES
Box 1.1: Public Enterprises... . .................. 5Box 1.2: The Dominican Financial System.7. . ................. 7
Box 3.1: Organizational Structure ....... ................ 19
TEXT FIGURES
Figure 1.1: Lending Spreads.. ..................... 6Figure 1.2: Merchandise and NFS Exports. . . .................... 7
Figure 4.1: Inflation and Poverty.. ..................... 28
This report is based on the findings of a World Bank mission that visited the Domninican Republic in March1994. 'he mission was led by L. Ramfrez (LA3C1) and included: A. Solimano and R. Soto (PRDTM), H.von Gersdoff and M. Osorio (LA3TF), and M. Niforos (LA3CI). The report was written by Ian Bannon(LA2CO). A Green Cover draft was discussed with the Government in April 26-28, 1995. The DepartmentDirector is Edilberto L. Segura and the Country Operations Division Chief is Donna Dowsett-Coirolo.

SUMMARY OVERVIEW
Introduction
i. This report analyzes the scope for and selected elements that would need to figure in astrategy of growth with equity. It does not attempt to provide comprehensive coverage of theDominican economy-it does not include the extensive descriptions, reviews, analyses andstatistical information generally found in more traditional World Bank economic reports, suchas Country Economic Memoranda. Instead, it focuses on four selected areas-themacroeconomic framework, trade and tax reform and, emerging from a brief PovertyAssessment, poverty alleviation-which, in our view, will critically affect the country'sprospects for sustained and equitable economic growth.
ii. The report is based on extensive analysis carried out by World Bank staff but also reliesheavily on recent reports by the IMF, IDB and work produced by a local, non-governmentfoundation (Fundaci6n Economfa y Desarrollo), partly supported by the World Bank and otherexternal donors.
iii. This Summary Overview Section brings together and integrates the policy analysispresented in the report's four sections. It provides a brief discussion of, and rationale for, thereform agenda which confronts the Government in its pursuit of a strategy of growth withequity.
iv. Section 1: Macroeconomic Framework briefly analyzes sources of growth in theDominican economy, the recent evolution of the macroeconomic framework, the sources ofmacroeconomic vulnerability and concludes with suggestions on a medium-term reform agenda.Section II: Trade Reform discusses recent reforms to the trade regime and distortions resultingfrom high protection and non-tariff barriers. Section m: Tax Reform looks at some initialsteps taken to reform the tax structure and administration, and presents a set of recommendationsto increase reliance on domestic taxes and strengthen administration. Section IV: PovertyAssessment analyzes existing data on income distribution and poverty. It also includes ananalysis of the effects of some key economic policies on the poor, the lack of targeting in socialspending and concludes by suggesting a number of elements that would need to form part of aneffective poverty alleviation strategy.
v. Technical work which underpins the analysis on the long-run growth determinants of theDominican economy (Section I) and the calculation of effective protection estimates (Section II)has been prepared as Technical Papers to this report, and are available on request.
Growth with Equity
vi. Since the early 1990s, the Government has been carrying out a reform program designedto stabilize the economy and lay the foundations for export- and private sector-led growth. Theeconomy has considerable potential for growth, as evidenced by the impressive performance ofFree Trade Zones (FTZs) and tourism. These two sectors, which have many characteristics oftypical enclaves, have nonetheless been an important source of foreign exchange andemployment. Although these two sectors have cushioned the economy somewhat from external

ii Summary Overview
shocks and, to some extent, prevented the kind of economic crises which in other countries inthe region have been the precursors of more ambitious structural reforms, they cannot be theengine that pulls the economy toward sustained and equitable growth. In particular, a substantialand sustained reduction in poverty and inequality will not be possible without a major increasein the efficiency and productivity of the non-enclave domestic sector.
vii. The low productivity and anaemic growth of the domestic economy stands in sharpcontrast to the impressive performance of FTZs and tourism. During 1988-93, the domesticeconomy averaged less than 2 percent annual growth and its total factor productivity recordednegative growth of almost 1 percent. In contrast, value added in FTZs averaged annual growthof 23.5 percent and total factor productivity growth of almost 7 percent. Output andemployment in the tourism sector also expanded rapidly during the period. Clearly, the enclavesectors enjoy special benefits, particularly a virtual tax-free status, which are not available to thedomestic economy. However, their ability to compete internationally, sustain very highproductivity growth, and expand employment, suggests that the reform effort should focus noton strengthening backward linkages but on removing the obstacles which hamper productivitygrowth in the rest of the economy. Thus, reducing the extreme duality in the Dominicaneconomy should be guided not by attempts to integrate the enclaves but by reducing theproductivity gap in the domestic sectors.
viii. Since the mid-1970s, the Dominican economy has been caught in a stop-go cycle.Periodic macroeconomic crises lead to low or negative growth, which is followed by a strongrecovery until another period of instability begins the cycle anew.' Macro instability, largelythe result of external shocks and fiscal constraints has an adverse effect on growth. TheGovernment responds to recurring macro disequilibria by tightening aggregate demand whichin turn prompts a recession and slump in economic activity. When macro balance is restored,growth rebounds strongly but the high growth is not maintained. Macro instability not onlyleads to lower and fluctuating growth but, as discussed in the Poverty Assessment, periods ofhigh inflation and recession appear to have a devastating effect on poverty and incomeinequality.
ix. A stable macro framework is key to sustained growth and poverty reduction. Thereversals during the past year, although greatly influenced by political uncertainty, also point tothe need to strengthen the economy's macroeconomic framework. Three factors are critical:(i) fiscal fragility; (ii) weaknesses in the financial system; and (iii) external vulnerability.
x. The fiscal situation is a concern, not only because of the expansion that took place duringthe second half of 1993 and early 1994, but more fundamentally because of the underlyingweakness in the revenue side, the high level of public capital outlays, and the continued poorperformance of public enterprises. The improved revenue performance achieved during 1990-93relied almost exclusively on the petroleum differential and foreign trade taxes. As theGovemment proceeds with its delayed trade liberalization program, taxes on domestic activityand incomes will need to rise to compensate for lower reliance on foreign trade taxes. TheGovemment has made considerable progress in tax reform but greater efforts are required tostrengthen administration and enforcement, as well as further steps to expand the tax base.
' For a review of economic performance during the 1980s, see: World Bank, 1992.

Summary Overview iii
xi. An improved revenue mobilization effort is necessary, not only for fiscal reasons but toexpand the economy's human capital base. Increasing the competitiveness and productivity ofthe domestic economy will not be possible without greater development of the country's socialbase. This will require not only higher social investments, especially in basic education andhealth, but also increased efficiency and improved targeting in social expenditures.
xii. The poor performance and large investment programs of the relatively extensive publicenterprise sector result in major fiscal pressures and drain resources which could be moreproductively invested in human capital formation. The Government has yet to design acomprehensive privatization program, although reforms underway offer good prospects forattracting private capital in the power sector. The proposed legal and regulatory reforms in thepower sector constitute an encouraging beginning that could be extended to other sectorsdominated by public enterprises.
xiii. Spending on human resources is low by international standards, inefficient and is highlyskewed against lower-income groups. In addition to the sustainability of fiscal policies, theGovernment needs to create considerable fiscal space to finance increased investment in humancapital. There is considerable scope to achieve this by improving revenue performance andopening the public enterprise sector to private capital and management. Reforms to improve theefficiency and poverty orientation of social spending need to proceed hand in hand with effortsto increase allocations.
xiv. High real interest rates and large spreads reflect macroeconomic factors, weaksupervision and microeconomic distortions. The fragility of the financial sector poses a potentialthreat to macro stability and growth prospects. Over the past couple of years, the Governmenthas begun implementing a comprehensive financial sector reform program. Progress has beensubstantial but must be deepened, especially by continuing efforts to improve prudentialsupervision and strengthen the capacity of the Superintendency.
xv. Although the current account balance improved considerably in 1993, there are a numberof concems over the economy's external prospects, namely: (i) the increased reliance on short-term private capital inflows; (ii) the loss of competitiveness of the domestic economy; and (iii)the ability of the economy to weather adverse external developments. The remarkable expansionof the enclave sectors, is in sharp contrast to the steady decline in export performance of the restof the economy. A more competitive economy with a stronger and more diversified export base,outside of the enclave sectors, will be key to reducing vulnerability to external shocks. Despiterecent reforms, effective protection remains high, which encourages inefficient importsubstitution production and maintains a strong bias against exports. Protection levels in theDominican Republic are among the highest in the region. Extensive and discretional non-tariffbarriers to trade compound the problem, especially in agriculture where the import licensingsystem results in high and fluctuating protection rates. The analysis in the Poverty Assessmentsuggests that this protected and distorted system extracts a high cost from the poor-directly,by raising the price of items heavily represented in their consumption basket and, indirectly, bydiscouraging efficient growth which can raise productivity, employment and incomes.
A Reform Agenda
xvi. The Dominican economy has considerable potential for high and sustained growth.Structural reforms are necessary to increase the competitiveness of the domestic economy, butthey also need to be accompanied by an equally determined effort to strengthen the human base
iv Summary Overview
on which long-term growth must rely. Growth will help to reduce poverty but a stronger andmore equitable social base is also a requirement for efficient and sustained growth. A strategyfor growth with equity would need to consider:
Macroeconomic Stability. Attaining and sustaining macro stability is key to growth andpoverty alleviation. Controlling inflation is critical, both to provide a stable environmentfor private sector development and because inflation has a severe impact on the poor.Macro stability will require considerable strengthening of the revenue base which, in turnwill involve improving tax administration and expanding the tax base on domesticactivity.
*1. Public Enterprise Reform. There is considerable scope to transfer ownership and/ormanagement of most public enterprises to the private sector. This would help tostrengthen the fiscal base, freeing resources for the social sectors and increase efficiencythroughout the domestic economy.
Increasing Outward Orientation. The Government's trade reform program needs tobe accelerated and complemented by stronger efforts to dismantle non-tariff andregulatory barriers, and improve the transparency of the trade regime. High effectiveprotection and trade distortions need to be redressed, not only as a means to increaseinternational competitiveness but also to reduce adverse effects on the poor, especiallyin agriculture.
Strengthening the Financial System. Ongoing efforts to strengthen prudentialsupervision of the financial system need to be continued. A stronger and more effectiveSuperintendency will be key to safeguard the soundness of the financial system andprevent the types of financial crises that have often derailed stabilization efforts in theregion.
*o. Investing in Human Capital. There is a need to design and implement a longer-termstrategy to strengthen the country's human capital base and develop a program of targetedinterventions that can help alleviate poverty. With a sounder fiscal base in place, effortswill need to focus on increasing the level, efficiency and targeting of social spending,particularly in basic education and health.
Additional Elements of a Poverty Alleviation Strategy. Two additional elementsshould be considered as part of a comprehensive poverty alleviation strategy. First, aneffective system to periodically monitor living standards and poverty trends needs to bedeveloped and maintained. Second, improved allocations and efficiency within the socialsectors, need to be complemented by a more decentralized approach to meeting the basicsocial needs of poor communities. The public sector in the Dominican Republic is highlycentralized and the lack of responsive mechanisms to meet the needs of the poor willhamper efforts to improve the targeting of social interventions.

PANORAMA GENERAL
Introduccidn
i. En este informe se analiza el Ambito que debe abarcar una estrategia de crecimiento conequidad y algunos aspectos que deberfan contemplarse en ella. No se trata de presentar unacobertura amplia de la economfa dominicana, ya que no se consignan aquf las extensasdescripciones, exainenes, analisis y datos estadfsticos que por lo general se encuentran eninformes econ6micos mas tradicionales del Banco Mundial, como los memorandos econ6micosde pafs. Este informe se centra, en cambio, en cuatro esferas seleccionadas, a saber: el marcomacroecon6mico, la reforma comercial e impositiva y, tras una breve evaluaci6n de la pobreza,el alivio de esta situaci6n. A nuestro entender estas areas afectaran en forma decisiva lasperspectivas del pafs en lo que hace al crecimiento econ6mico sostenido y equitativo.
ii. El informe se basa en extensos analisis realizados por el personal del Banco Mundial ytambien, en gran medida, en informes recientes del Fondo Monetario Internacional (FMI), elBanco Interamericano de Desarrollo (BID) y estudios realizados por una organizacion nogubernamental local (Fundaci6n Economfa y Desarrollo), la cual en parte ha contado con elrespaldo del Banco Mundial y otros donantes externos.
iii. En este Panorama general se reunen e integran los analisis de polfticas econ6micas quese presentan en las cuatro secciones del informe. Se proporciona una breve discusi6n y exarnendel programa de reforma que encara el gobierno en aras de perseguir una estrategia de desarrollocon equidad.
iv. En la Secci6n 1: Marco macroecon6mico se analizan sucintamente las fuentes decrecimiento en la economfa dominicana, la evoluci6n de la situaci6n macroecon6mica en losiiltimos tiempos y las fuentes de vulnerabilidad en ese aspecto, y se termina con recomendacionesacerca de un programa de reforma a mediano plazo. En la Secci6n II: Reforma comercial seestudian las reformas que acaban de introducirse en el sistema de comercio y las distorsionesprovenientes de un elevado nivel de protecci6n y barreras no arancelarias. En la Seccion III:Reforma impositiva se examinan algunas de las medidas iniciales adoptadas con miras areformar la estructura y la administraci6n tributarias y se presenta un conjunto derecomendaciones para servirse mas de los impuestos internos y fortalecer la administraci6n. Enla Secci6n IV: Evaluaci6n de la pobreza se analizan los datos existentes sobre la distribuciondel ingreso y la pobreza. Tambien se consigna un analisis de los efectos de algunas de lasprincipales polfticas economicas en los pobres y la falta de focalizaci6n en materia de gastosocial, y se concluye con la recomendaci6n de varios aspectos que deberfan formar parte de unaestrategia eficaz de alivio de la pobreza.
v. Los estudios tecnicos basicos del analisis acerca de los factores determinantes delcrecimiento a largo plazo de la economfa dominicana (Secci6n I) y el calculo de las estimacionesde protecci6n efectiva (Secci6n 11) se han preparado como documentos tecnicos de este informey pueden obtenerse solicitandoselos al Banco Mundial.

ii Panorama General
Crecimiento con equidad
vi. Desde los primeros afios de la decada de 1990, el gobierno ha venido Ilevando a cabo unprograma de reforma destinado a estabilizar la economfa y sentar las bases del crecimientoimpulsado por las exportaciones y el sector privado. La economfa tiene considerable potencialde crecimiento, como lo demuestran los extraordinarios resultados de las zonas francas y elturismo. Estos dos sectores, que tienen muchas de las cararacterfsticas tfpicas de enclaves, sinembargo han sido una fuente importante de divisas y de empleo. Si bien los enclaves hanproporcionado cierta protecci6n a la economfa contra las conmociones externas y, de algunamanera, impedido que se produjeran los tipos de crisis econ6micas que en otros pafses de laregion han sido precursoras de reformas estructurales mas amplias, ellos no pueden erigirse enfuerza propulsora que conduzca a la economfa hacia un crecimiento sostenido y equitativo.Sobre todo, no sera posible una reducci6n sustancial y sostenida de la pobreza y la desigualdadsi no aumenta considerablemente la eficiencia y la productividad de la economfa domestica,aparte de los enclaves.
vii. La baja productividad y el crecimiento magro de la economfa nacional contrastannotablemente con los extraordinarios resultados de las zonas francas y el turismo. En 1988-93,el crecimiento anual promedio de la economfa nacional fue de menos de 2% y la productividadtotal de los factores registr6 un crecimiento negativo de casi 1%. En cambio, el valor agregadocorrespondiente a las zonas francas tuvo un crecimiento anual promedio de 23.5% y uncrecimiento de la productividad total de los factores de casi 7 %. La producci6n y el empleo enel sector turismo tambien se ampli6 rApidamente durante este perfodo. No cabe duda de que losenclaves gozan de beneficios especiales-sobre todo su condicion de estar practicamente exentosde impuestos-de los que no goza la economfa domestica. Sin embargo, su capacidad decompetir en el piano internacional, mantener un aumento muy grande de productividad y ampliarel empleo indica que el esfuerzo de reforma debe centrarse en eliminar los obstAculos que seoponen al aumento de la productividad en el resto de la economfa y no en el fortalecimiento dela vinculacidn con los enclaves. En consecuencia, la reducci6n de la dualidad extrema en laeconomfa dominicana debe orientarse a reducir el d6ficit de productividad en los sectores internosy no a tratar de integrar los enclaves.
viii. Desde mediados de la decada de 1970, la economfa de la Repdblica Dominicana se havisto atrapada en un ciclo de rapida expansi6n y contraccion. Crisis macroecon6micas peri6dicasconducen a un crecimiento bajo o negativo, seguido de una fuerte recuperacion hasta que el ciclovuelve a iniciarse con otro perfodo de inestabilidad'. La inestabilidad macroecon6mica, que engran medida es resultado de conmociones externas y de la austeridad en el gasto pliblico,perjudica el crecimiento. El gobierno reacciona ante los desequilibrios macroecon6micosrecurrentes restringiendo la demanda agregada, lo que a su vez impulsa la recesi6n y lacontracci6n de la actividad econ6mica. Cuando se reestablece el equilibrio macroecon6mico, elcrecimiento repunta vigorosamente pero no se mantiene. La inestabilidad macroecon6mica nos6lo conduce a un crecimiento mas bajo y fluctuante sino que, como se analiza en la evaluaci6nde la pobreza, al parecer perfodos de elevada tasa de inflaci6n y de recesi6n tienen un efectodevastador en terminos de pobreza y desigualdad en los ingresos.
1Para un examen de los resultados econ6micos en la ddcada de 1980, vease: Banco Mundial, 1992.

Panorama General iii
ix. Un sistema macroecon6mico estable es fundamental para el crecimiento sostenido y lareducci6n de la pobreza. Los cambios de rumbo ocurridos el afio pasado, si bien se vieron muyinfluidos por la incertidumbre polftica, tambien seialan la necesidad de fortalecer la estructuramacroecon6mica. Hay tres factores cruciales: i) la fragilidad del presupuesto, ii) las deficienciasdel sistema financiero, y iii) la vulnerabilidad de la balanza de pagos.
x. La situaci6n fiscal preocupa no solo debido a la expansi6n registrada durante el scgundosemestre de 1993 y los primeros meses de 1994, sino fundamentalmente por las debilidades enlos ingresos, el elevado nivel de gasto publico de capital y la persistencia de malos resultados delas empresas publicas. El aumento de los ingresos logrados durante 1990-93 se bas6 casiexclusivamente en el diferencial del petr6leo y los impuestos al comercio exterior. A medida queel gobierno avance en su demorado programa de liberalizaci6n del comercio sera preciso unaumento de los impuestos aplicables a las actividades economicas e ingresos internos a fin decompensar la baja de ingresos por concepto de impuestos al comercio exterior. El gobierno haalcanzado logros considerables en materia de reforma impositiva, pero es preciso intensificar losesfuerzos por fortalecer las funciones de administraci6n y ejecuci6n, asf como tomar masmedidas para ampliar la base imponible.
xi. Es necesario poner mayor empefio en la movilizaci6n del ingreso, no s6lo por motivosfiscales sino tambien para ampliar la base de capital humano de la economfa. Sin un desarrollomas intenso de la base social del pats no sera posible aumentar la competitividad y productividadde la economfa nacional. Para esto no s6lo hard falta un mayor volumen de inversi6n en lossectores sociales, especialmente en educaci6n basica y salud, sino tambien mas eficiencia y mejorfocalizaci6n del gasto social.
xii. El mal desempehio y los elevados programas de inversiones de las empresas ptlblicasdesembocan en mas presiones fiscales y absorben recursos que se podrfan invertir de manera masproductiva en la formaci6n de capital humano. Si bien el gobierno aun tiene que elaborar unprograma amplio de privatizaciones, las reformas en curso en el sector de energfa electricaofrecen buenas perspectivas de atraer capital privado. Las reformas a los marcos legales yregulatorios propuestas en este sector constituyen un comienzo alentador que podrfa extendersea otros sectores en los que predominan las empresas publicas.
xiii. El gasto en los recursos humanos es bajo en comparacidn con los niveles internacionales,ineficiente y sumamente sesgado en contra de los grupos de ingresos bajos. Ademas de lasostenibilidad de las polfticas fiscales, el gobierno debe crear considerable espacio fiscal parafinanciar el aumento de la inversi6n en capital humano. Hay bastante margen para ello si semejoran los resultados en materia de ingresos y se abren las empresas publicas a capitales yadministraci6n del sector privado. Las reformas encaminadas a mejorar la eficiencia y laorientacion del gasto social hacia el problema de la pobreza deben ir de la mano de los esfuerzospor aumentar las asignaciones.
xiv. Las altas tasas reales y el gran diferencial en tasas de interes obedecen a factoresmacroecon6micos, una supervisi6n ineficiente y distorsiones microecon6micas. Es posible quela fragilidad del sector financiero ponga en peligro la estabilidad macroecon6mica y lasperspectivas de crecimiento. En los dos Uiltimos anios, el gobierno ha comenzado a aplicar unprograma amplio de reforma del sector financiero. El progreso ha sido considerable y debe

iv Pantorama General
profundizarse, especialmente mediante esfuerzos constantes por mejorar las normas prudencialesy fortalecer la capacidad de la Superintendencia.
xv. Si bien la balanza en cuenta corriente mejor6 considerablemente en 1993, preocupanmucho las perspectivas externas de la economfa, a saber: i) la mayor dependencia de la afluenciade capital privado a corto plazo, ii) la perdida de competitividad de la economfa nacional, y iii)la capacidad de la economfa para hacer frente a circunstancias externas desfavorables. Lanotable expansi6n de los enclaves contrasta marcadamente con el sostenido deterioro de losresultados de las exportaciones del resto de la economfa. Una economfa mas competitiva conuna base de exportaciones mas firme y diversificada, fuera de los enclaves, sera fundamentalpara reducir la vulnerabilidad ante las conmociones externas. A pesar de las lltimas reformas,sigue habiendo un elevado nivel de protecci6n efectiva, que alienta la producci6n ineficientesustitutiva de las importaciones y mantiene un fuerte sesgo en contra de las exportaciones. Losniveles de protecci6n en la Republica Dominicana estan entre los mas altos de la regi6n. Elproblema se agrava con las barreras no arancelarias y discrecionales controles al comercio, sobretodo en el caso de la agricultura, sector en el que el sistema de licencias de importaci6n redundaen tasas altas y fluctuantes de protecci6n. El analisis que se hace en la evaluaci6n de la pobrezaindica que este sistema de protecci6n distorsionado impone un costo elevado a los pobres-enforma directa, elevando el precio de los artfculos que ellos consumen mas y, en forma indirecta,desalentando el crecimiento eficiente que puede aumentar la productividad, el empleo y losingresos.
Programa de reforma
xvi. La economfa dominicana tiene grandes posibilidades de lograr un nivel elevado decrecimiento sostenido. Si bien es preciso introducir reformas estructurales a fin de aumentar lacompetitividad de la economfa nacional, ellas deben ir acompaniadas de medidas igualmentedecididas encaminadas a fortalecer la base de recursos humanos en la que debe asentarse elcrecimiento a largo plazo. El crecimiento contribuira a reducir la pobreza, pero una base socialmas s6lida y equitativa tambidn es un requisito para el crecimiento eficiente y sostenido. En unaestrategia de crecimiento con equidad deben contemplarse los siguientes aspectos:
Estabilidad macroecon6mica. El logro y mantenimiento de la estabilidadmacroecon6mica son fundamentales para el crecimiento y el alivio de la pobreza.Controlar la inflaci6n es crucial para crear condiciones estables para el fomento del sectorprivado y para atenuar los graves efectos que ella tiene en los pobres. La estabilidadmacroecon6mica exigira el fortalecimiento considerable de la base de ingresos, lo que asu vez entranarg mejorar la administracion tributaria y ampliar la base imponible en loque se refiere a la actividad econ6mica nacional.
Reforma de las empresas ptiblicas. Hay considerable potencial para transferir lapropiedad y/o la administraci6n de la mayorfa de las empresas p.iblicas al sector privado.Esto contribuirfa a fortalecer la base fiscal, liberando recursos para los sectores sociales,y a aumentar la eficiencia en toda la economfa nacional.
*0. Aumentar la orientaci6n hacia el exterior. El programa de reforma comercial delgobierno debe acelerarse y complementarse con medidas mas decididas encaminadas aeliminar los obstgculos no arancelarios y reglamentarios y a aumentar la transparencia

Panorama General v
del sistema de comercio. Deben corregirse el elevado nivel de protecci6n efectiva y lasdistorsiones del comercio, no s6lo para aumentar la competitividad en el planointerriacional sino tambien para atenuar los efectos perniciosos en los pobres,especialmente en la agricultura.
*. Fortalecimiento del sistema financiero. Deben continuar los esfuerzos en marchaencaminados a fortalecer las normas de disciplina y control del sistema financiero. Parasalvaguardar la solidez del sistema financiero e impedir que se produzcan los tipos decrisis financieras que con frecuencia han echado por tierra los esfuerzos de estabilizaci6nen la regi6n, sera fundamental contar con una Superintendencia mas fuerte y eficaz.
*0. Inversiones en el capital humano. Es preciso formular y aplicar una estrategia a largoplazo con miras a fortalecer la base de capital humano del pafs y elaborar un programade intervenciones focalizadas que contribuya a reducir la pobreza. Una vez sentada unabase fiscal mgs s6lida, los esfuerzos deberan centrarse en aumentar el nivel, la eficienciay focalizaci6n del gasto social, sobre todo en los servicios basicos de educacidn yatenci6n de salud.
*. Otros aspectos de la estrategia de alivio de la pobreza. Deben considerarse otros dosaspectos como integrantes de una estrategia cabal de reducci6n de la pobreza. Primero,debe formularse y mantenerse un sistema eficaz de seguimiento peri6dico del nivel devida y las tendencias de la pobreza. Segundo, el aumento de las asignaciones y laeficiencia en los sectores sociales debe complementarse con un enfoque mAsdescentralizado en lo que respecta a la satisfacci6n de las necesidades sociales basicas delas comunidades pobres. El sector piblico de la RepiAblica Dominicana es sumamentecentralizado, y la falta de mecanismos adecuados para satisfacer las necesidades de lospobres obstaculizara los esfuerzos por mejorar la orientaci6n de las intervencionessociales.


SECTION I
MACROECONOMIC FRAMEWORK
The Dominican economy has considerable potential-for export-led growth, as evidenced by the dynamicperformance offree trade zones and tourism. 77tese enclave sectors, however, cannot pull the economy ontoa path of sustained growth-instead the rest of the economy must emul4te the two enclave sectors.. Since theeconomic crisis of 1990 the Government has successfully.carried out a stabilization program and initiatedstructural reforms.: Progress in stabilization a'nd structural adjustment,- however st'alled during. the election
.:period. For the cconomy to achieve export- and private sector-led growth, he 'Government m'ust act quickly:to restore :macro equilibrium and restart reform measures in the trade, financial, and public 5ectors. In.addition, stronger efforts will be required to strengthen ihe economy's h.man capital base and reduce poverty.
1.1 This section examines the economy's growth performance during the 1980s, assessesmacroeconomic balances after implementation of the stabilization program and reviews theremaining reform agenda. It concludes that, in addition to faster growth of capital andemployment, a strong improvement in total factor productivity explains the better growthperformance of free trade zones (FTZs), especially during the 1988-93 period. Also, while theinitial results of the stabilization program were dramatic in eliminating the fiscal deficit andinflation, and in reducing external arrears and accumulating international reserves, thesefavorable tendencies have reversed since the end of 1993. In addition, high real interest ratesand the fragility of the financial system are of concern due to their dampening effect on growthand the risk of a financial crisis. The current high levels of effective protection and non-tariffbarriers are especially worrisome since they distort incentives and constrain the economy'sability to improve international cornpetitiveness. Reforms in the tariff structure, the tax system,the financial sector, and the power sector have been initiated but only partially implemented.FTZs and tourism, however, continue to perform well.
Sources of growth
1.2 The Dominican Republic has a strongly dualistic economy-a highly protected domesticsector which has deteriorated sharply since the early 1980s and a non-traditional, export-oriented, private-sector-led sector (tourism and FTZs) which has continued to perform well evenduring adverse periods. The contribution of the non-traditional export oriented sector to growth,employment, investment, factor productivity and foreign exchange earnings attests to the highpotential of the Dominican economy to compete in external markets.
1.3 From the late 1970s until 1990, the Dominican economy experienced slow and fluctuatinggrowth, rising inflation, growing external indebtedness and deteriorating social conditions. Amild recovery in output growth in 1986-87, achieved through stimulative fiscal and monetarypolicies, proved very short lived and culminated with historically high levels of inflation andnegative growth in 1990 and 1991. Although the economy recovered after a stabilizationprogram was implemented (discussed below), the overall performance of the 1983-93 periodbarely reached an average growth of about 2 percent a year, with per capita GDP decreasingfrom around US$1,100 in the late 1970s to US$1,080 in 1993.
1.4 The poor growth performance of the economy in the 1980s and early 1990s presents asharp contrast to the dynamism of tourism and FTZs. Until very recently, FTZs were excluded

2 1: Macro Framework
from the official national accounting system and tourism's contribution to growth had only beenpartially recorded. A recent effort at estimating the contribution of these two sectors to GDPshows that annual growth of FTZs was almost 15 times higher than the rest of the economy andannual growth of tourism was more than 9 times higher than the rest of the economy during the1983-88 period (Table 1.1). Also, during the last five years, FTZs grew 7 times faster andtourism grew 4 times faster than the rest of the economy. The contribution to exports is evenmore dramatic-exports of FTZs averaged annual growth of more than 37 percent during thelast five years, while exports of the rest of the economy decreased by almost 12 percent.
Table 1.1: Growth Performance of Tourism and FTZs, 1970-93 (real annual growth rates)
`Peniod GDP'.: Value Addd Value Added Economy .FTTorin ... .. Z... s cxorn my: .Epot
1970-93 4.5 16.9 25.0 -0.4 24.8
1970-82 6.3 19.5 26.6 3.1 21.3
1983-88 2.5 23.5 36.9 2.0 25.5
1989-93 1.6 ~~~~..:6.4j 1.9... -11. 37.4
Excluding tourism and FIZa
Souce: staff estimates (Technical Paper A).
1.5 In addition to capital accumulation and increases in employment, the spectacular growth.of FTZs was due to significant improvements in total factor productivity at much faster rates inFTZs than in the rest of the economy. Table 1.2 shows the results of a Cobb-Douglasproduction function estimated for FTZs and the rest of the economy (Technical Paper A).' Thecontribution to growth of productivity improvements was higher in FTZs than the rest ofeconomy even before the debt crisis of 1982, when the overall economy was growing at anaverage rate of about 5 percent a year. As the economy deteriorated in the 1980s, FTZscontinued to grow fast, with total factor productivity improving at an average of 2 percent a yearduring 1982-93, compared to a deterioration of -0.2 a year for the rest of the economy. Thisproductivity differential was much higher durng the last five years (1988-93), when total factorproductivity in FTZs grew by about 7 percent a year, while productivity in the rest of theeconomy deteriorated by an average of -0.9 percent a year.
Table 1.2: Sources of Growth, 1974-93 (real annual growth rates)
Growth and Sources Sectors 1974-82 1982-93 1988-93
Rate of Growth of GDP Free Trade Zones 20.7 23.6 23.5Rest of the Economy 4.7 2.5 1.8
Rate of Growth of Labor Frec Tradc Zones 18.6 21.3 16.4Rest of the Economy 3.3 3.2 3.1
Rate of Growth of Capital Free Trade Zones 18.6 23.7 19.0Rest of the Economy 0.8 2.0 2.2
Rate of Growth of TotalFactor Productivity Free Trade Zones 3.0 2.0 6.8
Rest of the Economy 2.5 -0.2 -0.9urce: staff estimates (Technical Paper A).
1. Tourism could not be separated from the rest of the economy due to lack of data to estimate the stock of capital. Theresults for the rest of the economy, therefore, include the contribution of tourism to growth.

I. Macro Framework 3
1.6 The impressive performance of these two sectors suggests that the Dominican economyhas considerable potential to compete in world markets. Although FTZs and tourism have hadpositive economic effects, especially through the generation of foreign exchange andemployment, they operate with many characteristics of typical enclaves. Even if FTZs andtourism can maintain relatively high growth rates-and this may be in doubt due to acombination of external factors (para. 1.22)-they cannot be the engine that drives the economyalong a path of sustained growth and pulls most Dominicans out of poverty. Rather, the restof the economy must become more like the two enclaves. To achieve this goal will require astable macro framework coupled with a deepening of recent structural reforms designed toincrease outward orientation, remove constraints on the private sector, improve financialintermediation, modernize the State apparatus and considerably expand the level and efficiencyof human capital formation.
The macroeconomic framework
1.7 The poor macro performance of the Dominican economy during the 1980s culminatedin a serious economic crisis in 1990, when annual inflation reached over 50 percent, real GDPper capita fell 7 percent, and the fiscal deficit surpassed 5 percent of GDP. The Government'sstabilization plan, called the New Economic Program (NEP) and im?lemented since late 1990,focused on fiscal and monetary restraint, liberalization of trade and financial markets, exchangerate unification, elimination of substantial foreign debt arrears (exceeding US$1.5 billion), andaccumulation of intemational reserves, which had plunged to less than two weeks of imports.
1.8 The economy responded with remarkable speed to the stabilization measures (Table 1.3).Increased tax revenues eliminated the fiscal deficit (after grants) by 1991 and generated a surplusin 1992; the exchange rate stabilized rapidly and average annual inflation dropped tointernational levels in 1992; and output rebounded strongly in 1992 after two years ofcontraction. Large capital inflows allowed the Central Bank to accumulate net reserves (from -US$198 million in 1990 to US$438 million in 1992), despite a jump in the current accountdeficit to 8 percent of GDP. In addition to the stabilization measures, the Government beganimplementing a comprehensive package of structural reforms in the financial, trade, educationand public sectors.
Table 1.3: Selected Macroeconomnic Indicators, 1989-93
1989 1990 1991 1992 :1993.
GDP Growth Rate (%) 4.2 -5.0 -0.8 7.6 2.8Annual Inflation Rate (%) 41.2 50.5 47.1 4.3 2.8Fiscal Balance (% of GDP) -5.9 -4.7 0.1 1.4 -0.3Current Account Balance (% of GDP) -4.5 -2.7 -2.3 -8.0 -2.9Real Effective Exchange Rate (depreciation -) 24.8 1.5 6.9 0.6 3.7Change in Terms of Trade (%) 4.5 -16.8 -1.0 -9.S -1.8
Source: Central Bank, IMF and staff estimaLes.
1.9 The economic situation deteriorated in 1993 and worsened further in early 1994. Amida heated political campaign, the Government loosened its macro stance. During the second halfof 1993, a fiscal deficit of about 1 percent of GDP emerged and domestic credit to the publicsector rose sharply. For the year as a whole, the fiscal surplus achieved in 1992 turned into asmall deficit. Fiscal expansion and the political turbulence affected inflation and the balance ofpayments. By September 1994, inflation as measured by the 12-month CPI jumped to 10percent from 4.2 percent at the end of September 1993, net international reserves fell, and the

4 1: Macro Framework
spread between the official and extra-bank exchange rate rose from 0.3 percent in end-1993 toabout 6 percent. Real GDP growth slowed in 1993 due to major contractions in agriculture andmining. The current account deficit fell to less than 3 percent of GDP as a result of lowerimports and continued strong growth in tourism receipts.2 In February 1993, the Governmentsigned an agreement with commercial bank creditors to restructure about US$1.1 billion of debt(US$780 million in principle and US$300 million in past due interest). The agreement wasexecuted in August 1994 and involved an up-front payment of US$170 million which furtherreduced the already low level of reserves.
1.10 In September 1994, the Government took a number of measures to stabilize the economy,including: (i) devaluation of the official exchange rate by about 3 percent to be followed byweekly adjustments based on movements in the inter-bank market; (ii) adoption of a 10 percentsurrender requirement for commercial banks, the elimination of surrender requirements for non-traditional exports, and temporary reintroduction of surrender requirements for credit cards; (iii)a freeze of Central Bank credit operations with the public and private sectors, coupled with afreeze until the end of the year on net credit of the Reserve Bank to the public sector; and (iv)a freeze of excess reserves of commercial banks held at the Central Bank, which will earn 12percent interest.
Macroeconomic vulnerability
1.11 The reversals during the past 12 months, although greatly influenced by politicaluncertainty, also point to the vulnerability of the stabilization and reform programs. Threefactors are key: (i) the fragility of the fiscal situation; (ii) high interest rate levels and spreads;and (iii) external vulnerability. In addition, progress in implementing structural reforms hasstalled.
1.12 Fiscal Policy. The fiscal situation is a concern, not only because of the politically-induced expansion that took place during the second half of 1993 and early 1994, but morefundamentally because of the underlying weakness in the revenue base, the high level of publicsector capital outlays, and the continuing poor performance of public enterprises. The weaknessof the fiscal stance is apparent in light of the structure of revenues discussed in Section III. Theimproved revenue performance achieved during 1990-93 (5.7 percent of GDP) reliedpredominantly on the petroleum differential3 and foreign trade taxes. The latter include importduties, VAT on imports and the import surcharge. Foreign trade taxes and the petroleumdifferential accounted for more than two thirds of total tax revenues in 1993. Taxes on importsincrease protection and are indirect taxes on exports (trade policy and protection is analyzed inSection II). As the Govemment proceeds with its trade liberalization program domestic taxeswill need to rise to compensate for lower reliance on taxes on imports. Revenues from thepetroleum differential can fluctuate due to changes in international prices, exchange rates andthe domestic pricing policies of the Government.
2. Trade data are likely distorted as a result of the international embargo imposed on Haiti since October 1991. Someimports were probably re-exported to Haiti without appearing as exports in the balance of payments.
3. In mid 1990, the Government froze petroleum prices at the level prevailing on the international market at the heightof the Gulf War, generating a large differential between domestic and import prices. The petroleum differential hasgenerated annual fiscal revenues of about I percent of GDP.

I. Macro Framework 5
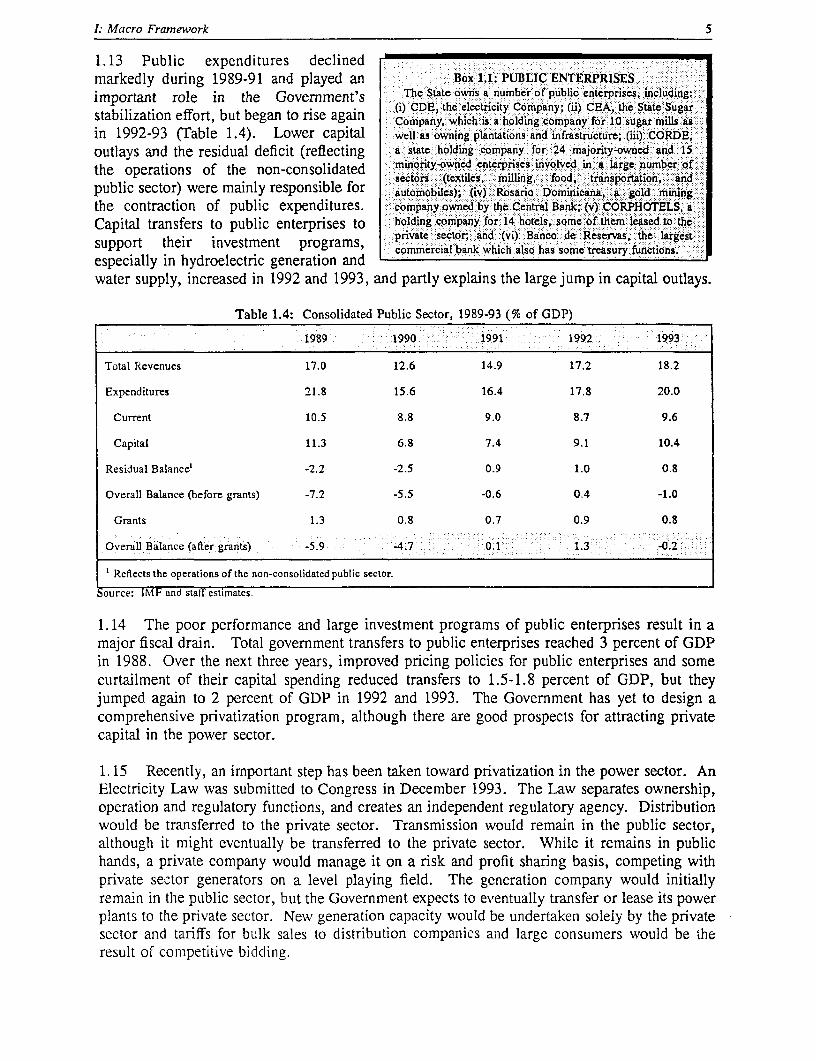
1.13 Public expenditures declinedmarkedly during 1989-91 and played an Box 1.1: PUBLIC ENTERPRISESimportant role in the Government's The State owns a number of public enterprises, including:
stabilization effort, but began to rise again (i) CDE, the electricity Company; (ii) CEA, the State SugarCompany, which is a holding company for l0 sugar mils as
in 1992-93 (Table 1.4). Lower capital well as owning plantations and infrastructure; (iii) CORDE,outlays and the residual deficit (reflecting a state holding company for .24. majority-owned and 15
the operations of the non-consolidated minority-owned enterprises involved in a large number ofsectors (textiles, milling, food,. transportation, :.and
public sector) were mainly responsible for automobiles); (iv) Rosario: Dominicana, a gold. miin& -the contraction of public expenditures. company owned by the Central Bank; (v) CORPHOTELS, a
Capital transfers to public enterprises to holding company for 14 hotels, some of them leased t the support their investment programs, private sector; and (vi) Banco de Reservas, the largest
commercial bank wlhch also has some treasury functions.especially in hydroelectric generation andwater supply, increased in 1992 and 1993, and partly explains the large jump in capital outlays.
Table 1.4: Consolidated Public Sector, 1989-93 (% of GDP)
1989 1990 .1991 1992 1993
Total Revenues 17.0 12.6 14.9 17.2 18.2
Expenditures 21.8 15.6 16.4 17.8 20.0
Current 10.5 8.8 9.0 8.7 9.6
Capital 11.3 6.8 7.4 9.1 10.4
Residual Balance' -2.2 -2.5 0.9 1.0 0.8
Overall Balance (before grants) -7.2 -5.5 -0.6 0.4 -1.0
Grants 1.3 0.8 0.7 0.9 0.8
Overall Balance (after grants) -5.9 -4.7 0.1 1.3 -0.2
Reflects the operations of the non-consolidated public sector.
Source: IMIF and staff estimates.
1.14 The poor performance and large investment programs of public enterprises result in amajor fiscal drain. Total government transfers to public enterprises reached 3 percent of GDPin 1988. Over the next three years, improved pricing policies for public enterprises and somecurtailment of their capital spending reduced transfers to 1.5-1.8 percent of GDP, but theyjumped again to 2 percent of GDP in 1992 and 1993. The Government has yet to design acomprehensive privatization program, although there are good prospects for attracting privatecapital in the power sector.
1.15 Recently, an important step has been taken toward privatization in the power sector. AnElectricity Law was submitted to Congress in December 1993. The Law separates ownership,operation and regulatory functions, and creates an independent regulatory agency. Distributionwould be transferred to the private sector. Transmission would remain in the public sector,although it might eventually be transferred to the private sector. While it remains in publichands, a private company would manage it on a risk and profit sharing basis, competing withprivate sector generators on a level playing field. The generation company would initiallyremain in the public sector, but the Government expects to eventually transfer or lease its powerplants to the private sector. New generation capacity would be undertaken solely by the privatesector and tariffs for bulk sales to distribution companies and large consumers would be theresult of competitive bidding.

6 1: Macro Framework
1.16 The Financial System. Highreal interest rates and the large spread Figure 1.1: Lending Spreads 1
between deposit and lending rates are 3 l
a second source of concern-they 30 \
reflect macroeconomic factors and, 25%*
more importantly, financial fragility 20 %
and microeconomic distortions in thefinancial sector. Annual real deposit Lsrates clustered around 5-7 percent [during 1993, while lending rates .exceeded 23 percent (Figure 1.1). O5 ,
Moreovr,.thespa inead from Jan Mar May Jul Sep Noy Jan Mar May Jul SOp NoY Jan M2rMoreover, the spread increased from 1 1992 1 199 119941
11 percent in January, 1993 to morethan 18 percent twelve months later. - LendIng Pale -4- Deposi Ptale
High interest rates are due to anumber of factors. First, monetary policy which succeeded in controlling inflation also pushedup interest rates. Second, the large differential between domestic and international rates is dueto high country risk and devaluation expectations prompted by the fragile balance of paymentsand reserve position. The country risk premium should fall as a result of the recently executedcommercial debt reduction deal. It could fall further if the Government's macro program leadsto a stronger external position.
1.17 Third, domestic spreads are high due to the oligopolistic nature of the financial sectorand high intermediation costs arising from the poor quality of bank loan portfolios. As of March1994 non-performing loans were on average about 50 percent of capital in the banking system.For some banks non-performing loans accounted for about 20 percent of their portfolios. Thestate-owned Banco de la Reserva, which accounts for 15 percent of total assets of the bankingsystem, has 43 percent of its loan portfolio in default (IDB, 1994). Provisions as percentage ofbad loans barely reached 23 percent for the entire banking system. To this must be added therisk that depositors and investors take when they invest in a banking system that is still reelingfrom a number of bankruptcies (Box 1.2). Weak prudential supervision, although improvingconsiderably in recent years, has been an important contributing factor to the precariouscondition of the financial system.4
1.18 The fragility of the financial sector and high interest rates pose threats to macro stabilityand growth prospects. International experience shows that the combination of high spreads, badloan portfolios, inadequate provisioning and weak supervision can lead to a major financialcrisis. As weak financial institutions struggle to stay afloat they maintain high deposit rates toattract funds which have to be invested in increasingly risky ventures. As portfolios deteriorate,the collapse of one or more major intermediary can quickly result in a run on the financialsystem and massive capital outflows. Throughout Latin America, governments faced with sucha crisis have been forced to intervene at an enormous fiscal cost.
1.19 The External Sector. Part of the improvement in the current account of the balance ofpayments can be linked to the slowdown in GDP growth in 1993 that reduced import demand,coupled with some increase in exports from tourisrn and FTZs. Nevertheless, there are a
4. For example, considerable progress was made in 1993, when the Superintendency irtroduced rules for loanclassification and the assessment of borrowers which led to more cautious credit policies by banks and accumulationof excess reserves.

L. Macro Framework 7
Box 1.2: THE DOMINNCAN FINANCIAL SYSTEMThe financial system is relatively broad by Latin intermediaries in the 1980s coupled with the virtual
American standards-4he ratio of broad money supply to absence of prudential supervision resulted in a number,ofGDP is about 28 percent-but is highly segmented.. -The bank failures in 1990. Although there is no forrnal deposit-banking laws of the- 1960s allowed the. proliferation of insurance, the Central Bank has tended to take over ailingspecialized financialintermediaries differentiated by deposit formal banks'for liquidation and to fully pay:offdepositors.and lending. terms, reserve requiremeats, interest rates, At present, there are 39 banks :and/or. 30, financialfiscal treatment and credit alloation. The formal private .'companies under liquidation. The cost for the bail-out forfinancial systemn.comprises 19 conimercial bariks,.38 1993 alonce'wasstimated at USSS0 milion (1DB,:1993).development banks, 14 mortgage banks, and 19 savings. The Govemment began reforming the financial system inand loan associations. This diversity masks th.efact that January. 1991 when it liberalized interest rates' and later::::the largest sh're of the market is operated by holdig . dopte ' singl egal res-v requirement of 20companies each owning a group of specialized banaks.. for all institutions, elimi:nating the distortions crated by.addition,,- thcr; are abouct 300 unregulated financial directed credit policies..: In December 1992' the Monetary:..companies... Board issued four resolitins which estabished multiple:n
The Superintendency of Banks, under the Central Bank,.. banking services and defined the regulatory and prudentialt'..oversees the system. Although overstaffed .(560 . framework, for the. firnancial iystem...ThesC.reolutionsi:employees)l it lacks adequately trained personnel. Whilc were to bc instituted fully with the 'promulgation of theshowing signs of improvement, Bank inspections are MonetaryCodebutithas:yetto be approvedby Congress.'
.infrequent and loan classifications provided by banks are The Government has implemented reforms: to strengthenrarely contested by. the Superintendency, As a result, the prudential supervision, but to be fully 'effective thereported quality of bank loan portfolios seriously overstate measures require legal .b'acking and.: considerablethe health of the system. The proliferation-of,financial . strengthening of the Superintendency; . .
number of concerns over the economy's external prospects. These include: (i) the increasedreliance on short-term private capital inflows to finance the current account deficit; (ii) the lossof competitiveness of the non-enclave economy; and (iii) the ability of the economy to adapt toadverse external developments.
1.20 Since 1991, the economy has grown increasingly dependent on short-term private capitalinflows and, to a lesser extent, private investment inflows. In response to an improved macroenvironment and high real interest rates in the domestic financial system, private sector capitalmoved from near equilibrium in 1990 to positive flows of US$383 million in 1991 and US$547million in 1992. Direct investment was mainly attracted to the tourist industry. Other privatecapital inflows (mainly short-term private capital, including errors and omissions) increased from-US$131 million in 1990 to US$368 million in 1992. These capital inflows have exertedpressure on the exchange rate. The real effective exchange rate appreciated by 12 percentduring 1990-93 (Table 1.3).
1.21 The remarkable expansion ofthe enclave sectors, FTZs and Figure 1.2: Merchandise and NFS Exports
tourism, is in sharp contrast to the -60l
steady decline in export performance I°° lof the rest of the economy. The latter 200
is the result of adverse external j F Vdevelopments, domestic supply | eo
constraints and .he lack ofcompetitiveness of non-traditional 200 --. __________-. ___ ._____._____________________________________
exports. Since 1989, commodity and a 99I 0s 19a9 1990 199, 1992
non-traditional exports have been on a --- ---------steady decline (Figure 1.2).Commodity exports fell bv almost 40 percent during 1989-92. This was largely the result ofreductions in the US sugar quota, decreases in world prices (coffee, cocoa and nickel) and

8 1: Macro Framework
supply problems (gold). Non-traditional exports, which peaked at US$163 million in 1989, hadfallen 21 percent by 1992.
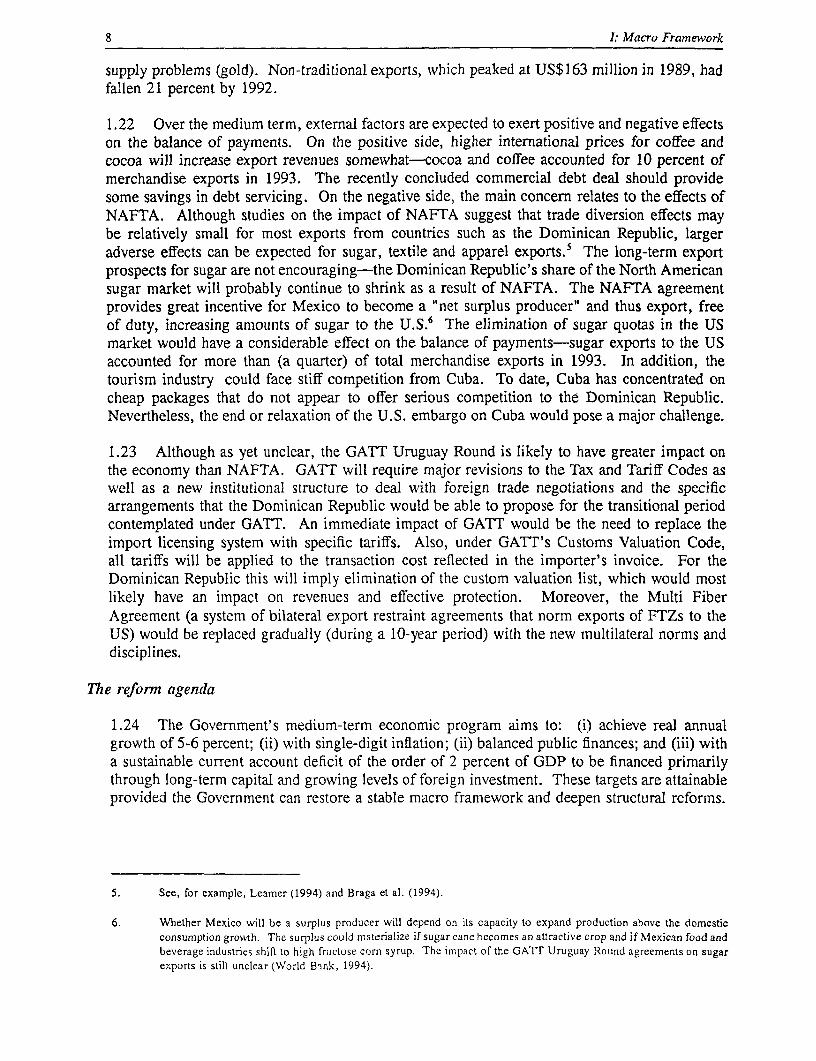
1.22 Over the medium term, external factors are expected to exert positive and negative effectson the balance of payments. On the positive side, higher international prices for coffee andcocoa will increase export revenues somewhat-cocoa and coffee accounted for 10 percent ofmerchandise exports in 1993. The recently concluded commercial debt deal should providesome savings in debt servicing. On the negative side, the main concern relates to the effects ofNAFTA. Although studies on the impact of NAFTA suggest that trade diversion effects maybe relatively small for most exports from countries such as the Dominican Republic, largeradverse effects can be expected for sugar, textile and apparel exports.5 The long-term exportprospects for sugar are not encouraging-the Dominican Republic's share of the North Americansugar market will probably continue to shrink as a result of NAFTA. The NAFTA agreementprovides great incentive for Mexico to become a "net surplus producer" and thus export, freeof duty, increasing amounts of sugar to the U.S.6 The elimination of sugar quotas in the USmarket would have a considerable effect on the balance of payments-sugar exports to the USaccounted for more than (a quarter) of total merchandise exports in 1993. In addition, thetourism industry could face stiff competition from Cuba. To date, Cuba has concentrated oncheap packages that do not appear to offer serious competition to the Dominican Republic.Nevertheless, the end or relaxation of the U.S. embargo on Cuba would pose a major challenge.
1.23 Although as yet unciear, the GATT Uruguay Round is likely to have greater impact onthe economy than NAFTA. GATT will require major revisions to the Tax and Tariff Codes aswell as a new institutional structure to deal with foreign trade negotiations and the specificarrangements that the Dominican Republic would be able to propose for the transitional periodcontemplated under GATT. An immediate impact of GATT would be the need to replace theimport licensing system with specific tariffs. Also, under GATT's Customs Valuation Code,all tariffs will be applied to the transaction cost reflected in the importer's invoice. For theDominican Republic this will imply elimination of the custom valuation list, which would mostlikely have an impact on revenues and effective protection. Moreover, the Multi FiberAgreement (a system of bilateral export restraint agreements that norm exports of FTZs to theUS) would be replaced gradually (during a 10-year period) with the new multilateral norms anddisciplines.
The reform agenda
1.24 The Government's medium-term economic program aims to: (i) achieve real annualgrowth of 5-6 percent; (ii) with single-digit inflation; (ii) balanced public finances; and (iii) witha sustainable current account deficit of the order of 2 percent of GDP to be financed primarilythrough long-term capital and growing levels of foreign investment. These targets are attainableprovided the Government can restore a stable macro framework and deepen structural reforms.
5. See, for example, Leamer (1994) and Braga et al. (1994).
6. Whether Mexico will be a surplus producer wil; depend on its capacity to expand production above the domesticconsumption growtlh. The surolus could materialize if sugar cane becomes an attractive crop and if Mexican food andbeverage industries shift to high fructose corn syrup. The inpact of the GA7T Uruguay Round agreeinents on sugarexports is stili un.:iear (World Bank, 1994).
I: Macro Framewvork 5
1.13 Public expenditures declinedmarkedly during 1989-91 and played an Box 1.1: PUBLIC ENTERPRISESimportant role in the Government's The State owrns a number of public enterprises, including::.
stabilization effo.t, but began to rise again C(i) CDE, the electrcity Company; (ii) CEA' the State Sugarstabilization effort, but began to rise again Company, which is a holding company for 10 sugar mills asin 1992-93 (Table 1.4). Lower capital well as owning plantations and infrastructure; (ill)' CORDE,
outlays and the residual deficit (reflecting a state holding companym for 24 majority-owned, and 15
the operations of the non-consolidated -minority-owned cntrprises involved in a large,number off sectors, (textilcs,, ".milling,. food, - transportation. andpublic sector) were mainly responsible f auto mobiles); (iv) Rosano 'Dominicana .-gold' mirngthe contraction of public expenditures. company,owvvned by the Central Bank;'v) CORPHOTELS, a
Capital transfers to public enterprises to holding company for 14 hotels, some'or them,leased to the j-private 'sector; and :(vi) Banco de Reservas the largestsupport their investment programs, ry -e -s commercial bank.which also has some treasury functions.
especially in hydroelectric generation andwater supply, increased in 1992 and 1993, and partly explains the large jump in capital outlays.
Table 1.4: Consolidated Public Sector, 1989-93 (% of GDP)
1989 1990 1991 1992 1993
Total Revenues 17.0 12.6 14.9 17.2 18.2
Expenditures 21.8 15.6 16.4 17.8 20.0
Current 10.5 8.8 9.0 8.7 9.6
Capital 11.3 6.8 7.4 9.1 10.4
Residual Balance' -2.2 -2.5 0.9 1.0 0.8
Overall Balance (before grants) -7.2 -5.5 -0.6 0.4 -1.0
Grants 1.3 0.8 0.7 0.9 0.8
Overall Balance (after grants) -5.9 -4.7 0.1 1.3 -0.2
Reflects the operations of the non-consolidated public sector.
ource: IMF and staff estimates.
1. 14 The poor performance and large investment programs of public enterprises result in amajor fiscal drain. Total government transfers to public enterprises reached 3 percent of GDPin 1988. Over the next three years, improved pricing policies for public enterprises and somecurtailment of their capital spending reduced transfers to 1.5-1.8 percent of GDP, but theyjumped again to 2 percent of GDP in 1992 and 1993. The Government has yet to design acomprehensive privatization program, although there are good prospects for attracting privatecapital in the power sector.
1.15 Recently, an important step has been taken toward privatization in the power sector. AnElectricity Law was submitted to Congress in December 1993. The Law separates ownership,operation and regulatory functions, and creates an independent regulatory agency. Distributionwould be transferred to the private sector. Transmission would remain in the public sector,although it might eventually be transferred to the private sector. While it remains in publichands, a private company would manage it on a risk and profit sharing basis, competing withprivate sector generators on a level playing field. The generation company would initiallyremain in the public sector, but the Government expects to eventually transfer or lease its powerplants to the private sector. New generation capacity would be undertaken solely by the privatesector and tariffs for bulk sales to distribution companies and large consumers would be theresult of competitive bidding.

6 1: Macro Framewvork
1.16 The Financial System. Highreal interest rates and the large spread Figure 1.1: Lending Spreads
between deposit and lending rates are _a second source of concern-they 3
reflect macroeconomic factors and, 25%
more importantly, financial fragility 20%
and microeconomic distortions in the 1 5 i
financial sector. Annual real deposit 10|rates clustered around 5-7 percentduring 1993, while lending rates s .exceeded 23 percent (Figure 1. 1). co|giX,,||1
Jan Mar May Jul Sep Nov Jan Mar May Jul Sep Ney Jan MarMoreover, the spread increased from 1 1992 1 1993 119941
11 percent in January, 1993 to morethan 18 percent twelve months later. LendingRate + Deptate
High interest rates are due to anumber of factors. First, monetary policy which succeeded in controlling inflation also pushedup interest rates. Second, the large differential between domestic and international rates is dueto high country risk and devaluation expectations prompted by the fragile balance of paymentsand reserve position. The country risk premium should fall as a result of the recently executedcommercial debt reduction deal. It could fall further if the Government's macro program leadsto a stronger external position.
1.17 Third, domestic spreads are high due to the oligopolistic nature of the financial sectorand high intermediation costs arising from the poor quality of bank loan portfolios. As of March1994 non-performing loans were on average about 50 percent of capital in the banking system.For some banks non-performing loans accounted for about 20 percent of their portfolios. Thestate-owned Banco de la Reserva, which accounts for 15 percent of total assets of the bankingsystem, has 43 percent of its loan portfolio in default (IDB, 1994). Provisions as percentage ofbad loans barely reached 23 percent for the entire banking system. To this must be added therisk that depositors and investors take when they invest in a banking system that is still reelingfrom a number of bankruptcies (Box 1.2). Weak prudential supervision, although improvingconsiderably in recent years, has been an important contributing factor to the precariouscondition of the financial system.4
1.18 The fragility of the financial sector and high interest rates pose threats to inacro sLabilityand growth prospects. International experience shows that the combination of high spreads, badloan portfolios, inadequate provisioning and weak supervision can lead to a major financialcrisis. As weak finanrcial institutions struggle to stay afloat they maintain high deposit rates toattract funds which have to be invested in increasingly risky ventures. As portfolios deteriorate,the collapse of one or more major intermediary can quickly result in a run on the financialsystem and massive capital outflows. Throughout Latin America, governments faced with sucha crisis have been forced to intervene at an enormous fiscal cost.
1.19 The External Sector. Part of the improvement in the current account of the balanice ofpayments can be linked to the slowdown in GDP growth in 1993 that reduced import demand,coupled with some increase in exports from tourism and FTZs. Nevertheless, there are a
4. For example, considerable progress was mnadc in 1993 vwhen the Supcrintendency introduced rijcs for 'oanclassification and the assessnment of bor-rowers wvhich led to more cautious credit policies by banks and accumulationof excess reserves.

I. Mlacro Framework 7
F Box 1.2: THE DOMINICAN FINANCIAL SYSTEMThe financial system is relatively broad by Latin internediaries in the 1980s coupled. with the virtual
American standards-the ratio of broad money supply to absence of prudential supervision resulted in a number ofGDP is about 28 percent-but is highly segmented.. The, bank failures in 1990. AltIiough there is no fornmal depositbanking laws of the .1960s allowed the proliferation of insurance, the Central Bank has' tended to take over ailingspecialized financial intermediaries differentiated by deposit formal banks for liquidation and to fully pay off depositors.and lending. terms, reserve requirements,. interest rates, At present, there are 39 banks..andlor 30'financialfiscal treatment and credit allocation. The'formal privatc :companies underliquidation. The cost for the bail-out--for'' financial system .comprises 19 commercial' banks, 38 1993 alone was estimated at USS5O million'(1DB, 1993)..development banks, 14 mortgage banks, 'and 19 savings- The Govemment began reforming.the financial system in.and loan associations. This diversity masks the fact- that: January 1991 when it liberalized interest.rates and-laterthe largest shaire of the market is operated by holding 'adopted a single legal reserve requir;emnt4of 20 'percent.companies 'each owning a group of specialized banks. .In for: al institutions, eliminating the distorions created by.addition, therre are: about. 300 unregulated financia directed credit policies. In December.1992, 'theMonetarycompanies. . . Board issued four resolutions which established multiple-.
The Superintendency of Banks, under the Central Bank,. banking services and defined the regulatory and prudentialoversees the system. Although overstaffed. (560 friameirk for the financial system.' These reslutions---'employees), it lacks adequately irained personnel.- While were to be instiuted fully with the promulgation of the.'showing signs' of improvement, Bank inspections are. Monetary Code but it has ytt to be approved-by Congress. 'infrequent and loan classifications provided by. banks are The Government has implemented reforms to strengthen.rarely contested by the Superintendency. As a result, the prudential. supervision, but to be fully effective thc-ereported quality. of bank loan portfolios seriously overstate measures require legal' backing and considerable.the health of the system. The proliferation of financial strengthening of'the Superintendency.
number of concerns over the economy's external prospects. These include: (i) the increasedreliance on short-term private capital inflows to finance the current account deficit; (ii) the lossof competitiveness of the non-enclave economy; and (iii) the ability of the economy to adapt toadverse external developments.
1.20 Since 1991, the economy has grown increasingly dependent on short-term private capitalinflows and, to a lesser extent, private investment inflows. In response to an improved macroenvironment and high real interest rates in the domestic financial system, private sector capitalmoved from near equilibrium in 1990 to positive flows of US$383 million in 1991 and US$547million in 1992. Direct investment was mainly attracted to the tourist industry. Other privatecapital inflows (mainly short-term private capital, including errors and omissions) increased from-US$131 million in 1990 to US$368 million in 1992. These capital inflows have exertedpressure on the exchange rate. The real effective exchange rate appreciated by 12 percentduring 1990-93 (Table 1.3).
1.2I The remarkable expansion ofthe enclave sectors, FTZs and Figure 1.2: Merchandise and NFS Exportstourism, is in sharp contrast to the am -steady decline in export performance 1'0of the rest of the economy. The latter I 00.
is the result of adverse external ,00developments, domrestic supply 8Oconistraints and the lack of .00competitiveness of non-traditional -00 -------- ------ -- ----------- ---------------------------------------------exports. Since 1989, commodity and 9-9 1990- 99 992
non-traditional exports have been on a ------- 0-. NFs
steady decline (Figure 1.e2). ICommodity exports fell by almost 40 percent during 1989-92. This was largely the result ofreductions in the US sugar quota, decreases in world prices (coffee, cocoa and nickel) and
8 I: Macro Framework
supply problems (gold). Non-traditional exports, which peaked at US$163 million in 1989, hadfallen 21 percent by 1992.
1.22 Over the medium term, external factors are expected to exert positive and negative effectson the balance of payments. On the positive side, higher international prices for coffee andcocoa will increase export revenues somewhat-cocoa and coffee accounted for 10 percent ofmerchandise exports in 1993. The recently concluded commercial debt deal should providesome savings in debt servicing. On the negative side, the main concern relates to the effects ofNAFTA. Although studies on the impact of NAFTA suggest that trade diversion effects maybe relatively small for most exports from countries such as the Dominican Republic, largeradverse effects can be expected for sugar, textile and apparel exports.5 The long-term exportprospects for sugar are not encouraging-the Dominican Republic's share of the North Americansugar market will probably continue to shrink as a result of NAFTA. The NAFTA agreementprovides great incentive for Mexico to become a "net surplus producer" and thus export, freeof duty, increasing amounts of sugar to the U.S.6 The elimination of sugar quotas in the USmarket would have a considerable effect on the balance of payments-sugar exports to the USaccounted for more than (a quarter) of total merchandise exports in 1993. In addition, thetourism industry could face stiff competition from Cuba. To date, Cuba has concentrated oncheap packages that do not appear to offer serious competition to the Dominican Republic.Nevertheless, the end or relaxation of the U.S. embargo on Cuba would pose a major challenge.
1.23 Although as yet unclear, the GATT Uruguay Round is likely to have greater impact onthe economy than NAFTA. GATT will require major revisions to the Tax and Tariff Codes aswell as a new institutional structure to deal with foreign trade negotiations and the specificarrangements that the Dominican Republic would be able to propose for the transitional periodcontemplated under GATT. An immediate impact of GATT would be the need to replace theimport licensing system with specific tariffs. Also, under GATT's Customs Valuation Code,all tariffs will be applied to the transaction cost reflected in the importer's invoice. For theDominican Republic this will imply elimination of the custom valuation list, which would mostlikely have an impact on revenues and effective protection. Moreover, the Multi FiberAgreement (a system of bilateral export restraint agreements that norm exports of FTZs to theUS) would be replaced gradually (during a 10-year period) with the new multilateral norms anddisciplines.
The reform agenda
1.24 The Government's medium-term economic program aims to: (i) achieve real annualgrowth of 5-6 percent; (ii) with single-digit inflation; (ii) balanced public finances; and (iii) witha sustainable current account deficit of the order of 2 percent of GDP to be financed primarilythrough long-term capital and growing levels of foreign investment. These targets are attainableprovided the Government can restore a stable macro framework and deepen structural reforms.
5. See, for example, Leamer (1994) and Braga et al. (1994).
6. Whether Mexico will be a surplus producer will depend on its capacity to expand production above the domesticconsumption growth. The surplus could materialize if sugar cane becomes an attractive crop and if Mexican food andbeverage industries shift to high frucLose corn syrup. The impact of the GATT Uruguay Round agreements on sugarexports is still unclear (World Bank, 1994).

SECTION III
TAX REFORM
The recent improvement in tax collections. has played a key .role in. the stabiliation prograzm. Thisimprovemnent, however, has come:at the expense of increased dependence onforeign trade iaxes, The 'chanesgintroduced through the new Tax Code in 1992 are :astep in the rig'ht direction, but they need to be followed.up byjfurther efforts to increase revenues -from domestic acivities to compensate for the planned reductionof import taxes. Moreover, progress has been stow in cartying, out the adinistratie reforms contemplatedin the new. Code. There is considerable scope to expand the'domestc,tax base by mod fying the tax structure-tobring"it more in line with the rest of the region -and byestrengtheni'ng 'the.a din framework...'
The present tax system
3.1 Tax revenues accounted for almost 13 percent of GDP in 1993, considerably lower thanLatin American and international averages. About 44 percent of total tax revenues are generatedby various taxes on international trade, including customs duties, the Value Added Tax (VAT)on imports, and a tax on foreign exchange transactions. As discussed in Section 1, the recentimprovement in tax collections has increased reliance on taxes on international trade (para.1.12). This tax structure is distortionary and favors import substitution activities. In addition,tax administration is weak and inefficient, which has contributed to considerable evasion anddiscretionality.'
3.2 A new Tax Code was approved in June 1992 (Law 1192), which introduced significantchanges to the tax system. The new Tax Code was designed to: (i) reduce distortions causedby high income tax rates; (ii) increase responsiveness of the tax system to price movements; (iii)expand the relative importance of broad-based and low-rate taxes; (iv) reduce the bias againstsavings imbedded in the previous system; (v) reduce tax evasion; and (vi) improve tax collectionas a share of GDP. Ultimately, the reforms aim to reduce dependence on foreign trade taxesand offset the revenue losses which would result from the full implementation of the tradeliberalization program.
3.3 The reforms reduced the maximum marginal income tax rate from 70 to 30 percent, withthe goal of reaching 25 percent in the following three years. Measures were taken to addressthe equity of the tax system by raising the deductible to RD$60,000 annually (from RD$36,000)so that the majority of wage earners (an estimated 90 percent) are exempted from incometaxation. The double taxation of dividends was eliminated. The tax base was expanded byincluding large taxpayers which were previously excluded (e.g., a 5 percent tax on hotel rooms).Specific excise taxes were converted to ad valorem rates and some 50 laws containing more than100 tax rates were replaced by rates of 10 and 15 percent for domestically-produced goods andseven rates ranging from 5 to 80 percent for imported goods. The new rates, however, werefar lower than those originally proposed to Congress. The VAT rate was raised, although theincrease from 6 to 8 percent was below the 10 percent originally proposed. The Tax Code
1. Of the estimated 28,000 businesses registered under the income tax, only 8,000 file tax returns. Of an estimateduniversc of 230,000 individuals who are in principle liable to pay income taxes, only 56,000 are registered and of theseonly 23,000 file tax returns. A recent UNDP study on compliance with VAT estimated evasion of at least 67 percentof the theoretical tax base (IDB, 1993).

18 IIl: Tax Reform
provided for a reduction in the import surcharge from 15 percent to 10 percent, to be reducedto 7 percent in 1993, 3 percent in 1994 and eliminated in 1995.
3.4 Total tax revenues increased by over 3 percent of GDP over the period 1990-93. Theincrease in revenues, however, was due to higher customs receipts as a result of applying freemarket exchange rates to the valuation of imports, the application of the exchange commissionon imports, the adoption of an import surcharge, and of the establishment of an ad hoc pricedifferential on the consumption of oil derivatives.2 More than two thirds of tax revenues in1993 consisted of taxes and tariffs on imports and the petroleum differential, compared with 40percent in 1990 before implementation of the tax reforms. Taxes on domestic activity fell fromalmost 6 percent of GDP to 5.1 percent over the period.
Table 3.1: Tax Revenues, 1990-93 (as % of GDP)
: ;: : ; : E X : f : E E i ~~~C anhge iiiE;1990 1991 1992- 1993. 1990-93
Tax Revenues 9.6 9.3 12.1 12.7 3.1
Foreign Trade Taxes 3.8 3.9 5.7 5.6 2.5
Petroleum Differential - 1.9 1.7 2.0 2.0
Other Taxes 5.8 3.5 4.7 5.1 -0.7Source: Central Bank and IMF.
Progress in tax administration reforn is slow
3.5 The provisions of the new Tax Law never fully materialized. The implementingregulations, needed to provide the guidelines for the extensive changes in the tax administrationand to attain the Law's goal of increased efficiency and simplification, are still pending approval.
3.6 The reform efforts have been marked by a distinct gradualism in their implementation,despite the radical change that their proposals assumed. The most notable progress wasregistered in the field of information systems. Several programs are currently in operation toestablish automatization and information systems. Specifically, a computerization process of thecashier activity of the DGRI in the Santo Domingo local agency has been initiated and thecomputerization of the DGA is presently being completed. However, the organizational changestaken to ensure the compatibility of the DGA administrative processes with the new informationsystem were very limited. The installation of automated systems had originally been plannedand developed for: (i) excise tax operations and their linkage to the Secretariat of Finance(National Computer Tax Information Management System); (ii) the Controller's Office of theTreasury; and (iii) the Legal Department and various other sections of the Ministry of Finance.As of early 1994, progress had come to a halt, although these programs are expected to resumewith IDB support.
3.7 Although no implementing regulations have been adopted since the passage of the 1992tax reform, a draft set of regulations was drawn by the administration with external assistance,most notably from UNDP. The proposed regulations, however, were rejected by the ExecutiveOffice of the President and were sent back to the Secretariat of Finance, where they are now
2. As of July 1991, the Covernment broadened the base for the 15 percent special surcharge on imports from about onehalf of total imports to all items With the exception of some food products and medicines.

II1 7ax Reform 19
under further consideration and F-adjustment. Especially controversial are Box 3.1: ORGANIZATIONAL STRUCTURE
the regulations pertaining to the issue of Law 1192 defines the tax system and establishes its general -w w * s 1 * administrative framewrk. Previously, these norms were
taxpayer refunds-particularly wltn included in the legislation pertaining to each tax. The Lawrespect to refunds of VAT credits to defines the tax system as consisting of: (i) Income Tax; (ii)
exporters and exempted goods Value Added Tax (VAT); (iii) Specific Consumption-Taxpreducers nd inflation adjustments on (ISC); and (iv) customs duties. Other minor taxes include the
Tax on Luxury-Housing.and Non-Constructed Lots (IVSS),.assets for depreciation. and the Inheritance and Donations Tax. The Law definiesi the
State Secretariat. of Finance as the. head-of .the tax3.8 In the absence of a clear legal administration body.' Tax administration is organied by tax-
fram ework an d sp eci fi c fo rm al type and consists of the Directorates of Income Tax (DIR), ofDomestic Revenues (DGRI), and of Customs (DGA).
regulations, the Director General of the DIR: administers.the Income Tax, the VAT, IVSS, and theDIR has adopted 15 "norms" which give Tax:on Inheritanceand Donations, which together representan ad hoc interpretation of Law 1192 in about 30 percent of total collection. It consists of -io
a Departments and one Juridical Bureau organized by type ofan effort to fill the vacuum and provide tax. The departments of Inspection and Internal Supervisionsome operational guidelines. However, are in charge of issues. relating to income tax. Other
many of the norms are not necessarily departments are in charge of VAT, IVSS and the Inheritance
compatible with the Tax Code. In fact, a and Donation Tax. There are 19 Local Agencies, dependenton the Department of Supervision of Local Agencies. They
number of these norms are in are responsible for the collection of tax declarations and the
contradiction to Law 1192, mainly due to supervision of aU taxpayers.the fact that they attempt to provide a DGRI: administers the ISC, which also represents thebridge between the new Tax Code and the largest share of the DGRI collection, vehicle taxes, patentsbridge ~~~~~~~~~~~and fees, and other minor taxes. Tax collection is executed:old administrative structure. through its 42 Collection Agencies (Colecturtas). The
Treasury acts as the direct collection agent for certain taxes,
3.9 Lack of progress in reforming such as the oil prce differential.
obsolete administrative processes and procedures is undermining the effectiveness of themodernization of information systems already under way. As a result, the improvement inperformance-albeit noticeable-is well below its potential. However, available data suggeststhat there is substantial potential to increase tax revenues as a result of greater efficiency in theadministration of internal taxes.
3.1 0) The tax reform measures recently adopted are a step in the right direction but the reformprocess needs to be effectively followed up and deepened. Future reform efforts would needto concentrate in two key areas: (i) implementation of the administrative reforms contained inthe new Tax Code; and (ii) further steps to broaden the domestic tax base.
Administrative reforms
3.11 Effective implementation of Law 1192 will not be possible, unless the Government adoptsclear and concrete regulations regarding the order and process of the required administrativechanges. Several policy issues must be addressed and resolved in order to increase the revenuesof the domestic tax system and reduce the dependency on customs duties, as was the intent ofthe tax reform. It is estimated that full implementation of the administrative reforms containedin the new Tax Code could produce additional revenues of up to 5 percent of GDP over threeyears (IDB, 1993). This would more than offset revenue losses due to trade liberalization.Specific steps which the Government should take include:
3.12 Improve coordination among the centrial la collectioni agencies and the FinanceSecretariat. The Director Generals currently enjoy considerable autonomy from the Secretariatof Finance, despite the Secretariat's nominal role of overjll policy coordination and supervision.
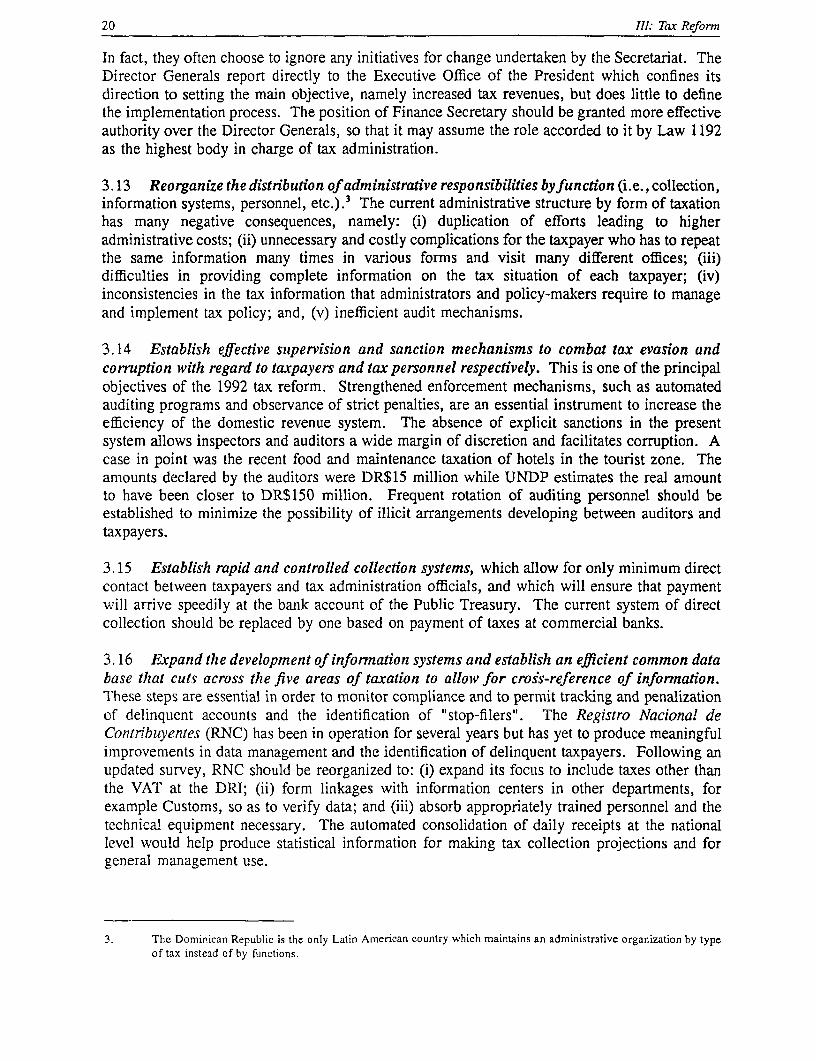
20 111: Tax Reform
In fact, they often choose to ignore any initiatives for change undertaken by the Secretariat. TheDirector Generals report directly to the Executive Office of the President which confines itsdirection to setting the main objective, namely increased tax revenues, but does little to definethe implementation process. The position of Finance Secretary should be granted more effectiveauthority over the Director Generals, so that it may assume the role accorded to it by Law 1192as the highest body in charge of tax administration.
3.13 Reorganize the distribution of administrative responsibilities byfunction (i.e.,collection,information systems, personnel, etc.).3 The current administrative structure by form of taxationhas many negative consequences, namely: (i) duplication of efforts leading to higheradministrative costs; (ii) unnecessary and costly complications for the taxpayer who has to repeatthe same information many times in various forms and visit many different offices; (iii)difficulties in providing complete information on the tax situation of each taxpayer; (iv)inconsistencies in the tax information that administrators and policy-makers require to manageand implement tax policy; and, (v) inefficient audit mechanisms.
3.14 Establish effective supervision and sanction mechanisms to combat tax evasion andcorruption with regard to taxpayers and tax personnel respectively. This is one of the principalobjectives of the 1992 tax reform. Strengthened enforcement mechanisms, such as automatedauditing programs and observance of strict penalties, are an essential instrument to increase theefficiency of the domestic revenue system. The absence of explicit sanctions in the presentsystem allows inspectors and auditors a wide margin of discretion and facilitates corruption. Acase in point was the recent food and maintenance taxation of hotels in the tourist zone. Theamounts declared by the auditors were DR$15 million while UNDP estimates the real amountto have been closer to DR$150 million. Frequent rotation of auditing personnel should beestablished to minimize the possibility of illicit arrangements developing between auditors andtaxpayers.
3.15 Establish rapid and controlled collection systems, which allow for only minimum directcontact between taxpayers and tax administration officials, and which will ensure that paymentwill arrive speedily at the bank account of the Public Treasury. The current system of directcollection should be replaced by one based on payment of taxes at commercial banks.
3.16 Expand the development of infonnation systems and establish an efficient common database that cuts across the five areas of taxation to allow for cross-reference of information.T hese steps are essential in order to monitor compliance and to permit tracking and penalizationof delinquent accounts and the identification of "stop-filers". The Registro Nacional deContribuyentes (RNC) has been in operation for several years but has yet to produce meaningfulimprovements in data management and the identification of delinquent taxpayers. Following anupdated survey, RNC should be reorganized to: (i) expand its focus to include taxes other thanthe VAT at the DRI; (ii) form linkages with information centers in other departments, forexample Customs, so as to verify data; and (iii) absorb appropriately trained personnel and thetechnical equipment necessary. The automated consolidation of daily receipts at the nationallevel would help produce statistical information for making tax collection projections and forgeneral management use.
3. The Dominican Republic is the only Latin American country which maintains an administrative organization by typeof tax instead of by functions.

III: Tax Reform 21
3.17 Reinforce the local tax system. The overcentralization of the system is paralyzing thedecentralized tax administration branches in the interior. The collection receipts from SantoDomingo, Santiago and Puerto Plata represent 92 percent of total collection. Santo Domingoalone accounts for 82 percent of the total collection, since the majority of the companies areregistered there. The local agencies (Agencias Locales) and collection agencies (Colecturfas)are often neglected by the center and deprived of even the most basic resources required for theiroperation. A case in point was the local agency of Puerto Plata-after a UNDP assessment, thebranch was found to be effectively non-operational due to the lack of basic supplies, such aswriting material. Local tax branches should be given more attention in the reform program andprovided with the necessary supplies, qualified personnel and technical assistance to carry outtheir operations.
3.18 A recent effort by UNDP shows the revenue potential from measures to strengthenadministration at the local level. In Puerto Plata, the UNDP implemented a simple system ofscanning the area for stop-filers and non-filers which resulted in a 200 percent increase in theagencies' revenues. Automated and manual systems of control should be established locally tomonitor revenues and tax returns filed in order to minimize costs and improve the flow ofdocuments between tax agencies. However, further efforts by international donors to provideassistance directly to the local agencies have been hampered because the Central Governmenthas to grant prior authorization. The Government's reform efforts have tended to focus on thecentral level, specifically within the Directorates. As a result, reform has stagnated even in thelocal agencies within Santo Domingo.
3.19 Initiate civil service reform. The lack of competent human resources is a major obstaclein the restructuring of the Dominican tax administration. The current civil service system iskeeping tax administration from attracting qualified personnel. The Finance Secretariat offeredto become the first institution to implement the Civil Service Law, but no significant reformsteps have been taken. The low salary levels and the absence of career incentives is causing aflight of qualified personnel to the private sector. It also contributes to the problem ofmoonlighting to which many of the tax officers resort in order to supplement their income. Thisoften leads to conflicts of interest, especially prevalent at higher levels. For example, directorsof tax departments act as consultants to, or even lobbyists for, private interest groups which arebeing audited.
3.20 Establish a management control system, rationalize procedures and provide workmanuals and criteria to measure perfonmance and productivity. The availability of clearguidelines and appropriate training is essential to implement the reforms and increaseaccountability throughout the administrative structure.
3.21 Avoid using tariffs on impons and selective consumption taxes as the preferred policyinstrument every time there is need to close a fiscal gap. During periods of fiscal crisis, theGovernment has tended to respond by introducing discrete tax changes, most often falling onimports or external transactions. The focus should shift from short-term, discrete increases inrevenue as a form of crisis management to strategic planning and reforms in the tax structurewhich will allow for more stable and sustainable increases in the long-term flow of revenues.An example is the conversion of the price differential of oil derivatives into a selectiveconsumption tax.

22 III: Tax Reform
3.22 Reinforce the existing public information program (Unidad de Informatizacion alContribuyente-UNICO) to assist taxpayers in fully understanding their responsibilities and thenew procedures to which they must adhere. The current program, sponsored by the Secretariatof Finance, is limited to responding to specific questions from taxpayers over the phone.
Expanding the tax base
3.23 Although administrative reforms along the lines suggested above, if effectivelyimplemented, are expected to have a considerable revenue impact, additional steps could beconsidered to expand the tax base and increase its efficiency. However, given the high levelsof tax evasion in the country, a gradual expansion of the tax base needs to be complemented bya stronger efforts to enforce compliance and reduce evasion. Without such measures, generalrate increases would have little impact and, in some cases, could even result in lower collections.
3.24 There are a number of areas where there appears to be considerable scope for expandingthe domestic tax base:
PI The VAT at 8 percent remains low and can be substantially raised to rates more in linewith the rest of Latin America (10-15 percent). In addition, further efforts are requiredto reduce exemptions, particularly on services.
b. There is further scope to raise the selective tax on the consumption of tobacco andalcoholic beverages, currently at 30 percent, well below rates in many Latin Americancountries (90 percent).
* lThe current implicit tax on the petroleum price differential should be formalized withinthe Tax Code by replacing it with an ad valorem rate on ex-refinery prices in localcurrency. This would reduce vulnerability to changes in international oil prices and theexchange rate.
b. Adoption and enforcement of clear and meaningful penalties for tax evasion should bea priority, including deadlines for payments and penalties for delays.
*. Taxes with very low yields should be eliminated, as their administrative costs are equalto or higher than revenues collected.
*. The IVSS tax, which generates less than 1 percent of total tax revenues, should bereplaced by a property tax on the market value of real estate.
*. To reduce corporate tax evasion, the Government should consider a minimum tax oncorporate income as in Mexico, collecting 1-2 percent on the gross assets of eachcorporation, to be deducted from their tax payments at the end of the tax year. Thiswould encourage corporations to file tax returns and to improve the reliability of theirstatements-thus reducing tax evasion.

SECTION IV
POVERTY ASSESSMENT
About one infive Dominicans live in poverty and almost one in ten live in extreme poverty. More than onequarter of children are poor.. Poverty and extreme poverty arefarm nore serious in rural areas.-and are morelikely to affectfemale-headed households. Income inequality is relatively high but has improved recently.Poverty worsened in the:,late 1980s. but recently appears. to have improved :mar,kedly,especlally'extremepoverty and for-female-headed households. 7'Wo factors, seem to have benofitted the poor-stabilizationpolicies which reduced inflation. and the continued expansionof the 'labor-intensivefree tra,de zones and ihc-.''tourism sector. The poor pay a high price for protection in the agriculture sector, get ,littl.of the subsidy-'
.on cooking gas buialso pay a small share of the petroleum' tax and have enefitiedfrom liberalizadton of milk.imports. Social spending has not suffered from the recent stabiizauioi efforts, but a shije in its compositionhas hurt the poor-especially in the provision of basic health and. education:services:. Public spendng n:.education and health: s among , the lowest. .inihf e'gion'.'
4.1 The Dominican Republic is a lower-middle income country with an income per capita ofUS$1,080 (1993). Most of its social indicators are somewhat below averages for lower-middleincome economies and for the Latin American and Caribbean Region. Unemployment is highat an estimated 19 percent in 1991. The economic problems of the late 1980s seem to have hada marked adverse effect on poverty. Two main factors, however, appear to have amelioratedthe situation of the poor: (i) real wages increased due to a drastic reduction of inflation; and (ii)employment increased at a rapid pace in the non-traditional export-oriented sectors of theeconomy, i.e., tourism and free trade zones (FTZs). High tariff levels and non-tariff barriers,however, have increased poverty in the rest of the economy by slowing down growth and byincreasing the prices of products highly represented in the consumption basket of the poor. Thispoverty assessment examines the data available to measure poverty, presents poverty and incomedistribution estimates, and analyzes the effects of economic policies on the poor. It ends bysuggesting elements to be considered in the elaboration of a poverty-reduction strategy. A noteof caution is warranted. Data reliability is a problem in the Dominican Republic, especially inanalyzing poverty and social developments. This not only explains the wildly different povertyestimates used by different sources, but also prevents a careful analysis of the incidence of socialexpenditures. The tentative nature of poverty-related estimates, however, should not detractfrom the general conclusions presented here.
Measuring povesty and inequality
4.2 The Dominican Republic has not developed a system of data collection to consistentlymeasure poverty and the living conditions of the poor. This makes it difficult to obtain reliableestimates of poverty levels and trends. The analysis reported here is based on three householdsurveys that were analyzed and adjusted by Fundacion Economfa y Desarrollo (FED, a non-profit, private economic research institute): (i) the Income-Consumption Survey conducted byTufts University in 1986; (ii) the Social Expenditure Survey conducted by the Central Bank andUNDP in 1989; and (iii) the Income-Expenditure Survey conducted by FED 1992. The resultsof these three surveys are not fully comparable, however, since they were designed for different

24 IV Poverty Assessment
purposes with different methodologies.' The 1986 and 1989 surveys were adjusted by FEDfollowing the methodology discussed in Psacharopoulos et al. (1993). It involved adjusting theaverage real income per capita obtained by the 1986 and 1989 surveys by a factor whichequalizes reported income with the national account estimates. For 1986 the underestimationof survey income was 34 percent and for 1989 it was 13.6 percent. Because of dataimperfections, however, the trend poverty estimates need to be interpreted with caution.
4.3 The poverty line was estimated as the cost of a food basket which provides the minimumcaloric requirement and an additional amount to purchase basic non-food needs. The extremepoverty line is defined as the income needed to purchase the basic food basket only. Thepoverty line covers the basic food basket and non-food necessities. The calculation of povertylines was based on the observed consumption pattern of the 25 percent lowest-income householdsin the 1992 FED survey. Poverty lines used urban and rural consumer price indices to arriveat rural and urban poverty estimates. The poverty line was estimated at RD$379.2 (US$29.8)per month at the national level, with RD$386.8 for urban areas and RD$365.8 for rural areas.The extreme poverty line was estimated at RD$252.1 (US$19.8) per month at the nationallevel-RD$262.4 for urban areas and RD$91.3 for rural areas.
Mhat the results show
4.4 Poverty and Extreme Poverty. Table 4.1: Poverty and Extreme Poverty, 1986-92 (%)
About one in five Dominicans was 1986 1989 1992
estimated to live in poverty and almostone in ten in extreme poverty in 1992 Povert 18.3 24.5 20.6(Table 4.1). Thus, in 1992 1.5 million Rural 24.5 27.4 29.8
Dominicans lived in poverty of which Urban 11.7 23.3 10.9
683,000 lived in extreme poverty. As isExtreme Poverty 10.5 13.7 - : 9.0~
generally the case, poverty in theDominican Republic, especially extreme Rural 14.1 16.3 12.3
poverty, is more serious in rural areas. In Urban 7.1 12.7 5.01992, rural poverty was almost three Surce: FED (1994).
times urban poverty and rural extreme poverty almost twice the level in urban areas. Moreover,rural poverty deteriorated steadily, increasing by more than 20 percent over 1986-92. Theadjusted poverty lines alsc suggest that the two previous poverty estimates, especially that for1986, may have been considerably overestimated. These estimates are also considerably lowerthan those reported by IDB.2 The adjusted data suggests that poverty was 45 lower in 1986 and18 percent lower in 1989. In terms of poverty trends, poverty increased by one third in 1986-89, falling by 16 percent in 1992. The drop in extreme poverty was more pronounced in 1992,falling below that estimated in 1986.
1. For example, although the three surveys estimated own consumption, the 1986 survey did not include data onconsumption of medicines and the 1989 survey did not include data on consumption of donated food. The 1989 surveyappears to have had a marked urban bias, which would tend to increase national poverty estimates during periods ofhigh inflation, as was the case during the late 1980s.
2. The unadjusted surveys arrive at a poverty estimate of 33.3 percent and extreme poverty of 17.3 for 1986, and povertyof 29.8 percent and extreme poverty of 20.2 percent for 1989. IDB reports total poverty in 1989 of 56 percent, ofwhich poverty of 20.8 percent and extreme poverty of 35.2 pcrcent. It also quotes a poverty estimate from CIECA(Centro de Invesligaci6n Economicapara el Caribe) of 70 percent in 1991. Psacharopoulos et al. (1992) estimate 1989poverty (based on a USS60 poverty line) and extreme poverty (US$30 extreme poverty line) of 24.1 percent and 4.9percent, respectively-more in line with the corrected estimates calculated by FED (Table 4.1).

IV: Poverty Assessment 25
4.5 As can be expected, poverty and extreme poverty tend to be deeper and more severe inrural areas. The poverty gap index and the FGT P2 index were calculated to assess the depthand severity of poverty, respectively. Whereas in 1992 the gap between the average urbanpoor's expenditures was 3.7 percent it was 8.8 percent for the average rural poor. The twoindices at a national level show a similar pattern as the headcount poverty measures over 1986-92-worsening in 1989 and improving in 1992. The two indices for rural areas, however,worsened over the period but less so for FGT P2. This, coupled with the observed reductionin extreme rural poverty, suggests that income inequality increased among the rural poor. Apossible explanation may be that a relatively small group of rural poor have benefitted from theemploymernt generation of the FTZs and even tourism.
4.6 Children in Poverty. Since, on Table 4.2: Children in Poverty, 1992 (%)average, the poor have more children perfamily than the rich, the population ofchildren (under 12 years of age) living Poverty 14.0 37.3 26.8
under poverty and extreme poverty Extreme Poverty 6.5 15.6 11.8conditions is higher than that of the total Source: FED (1994).
population. In 1992, more than one in four children were living in poverty and more than onein ten lived in extreme poverty (Table 4.2). Children in rural areas are particularly affected,where more than one third live in poverty and 16 percent live in extreme poverty.
4.7 Although infant mortality has fallen steadily-from 67 per 1,000 live births in 1986 to59 in 1991-it remains high compared to a Regional average of 44 and is exceeded only byHaiti, Bolivia and Guatemala. Moreover, because an estimated 60 percent of all infant deathsare not registered, the actual rate of infant mortality may be substantially higher. At 78 per1,000, the rate at which children die before their fifth birthday is also exceptionally high, as isthe maternal mortality rate of 200 per 100,000 births.
4.8 Malnutrition. Chronic Table 4.3: Malnutrition, 1991 (%)malnutrition in pre-school children (below Urban Rural TOTAL5 years), measured as growth stunting,affected almost one in five Dominican Chronic malnutrition 14.6 26.3 19.4
children and was more severe in rural Severe malnutrition 3.1 9.8 5.9areas (Table 4.3). Almost 6 percent of Mothers with chronicchildren suffered from severe malnutrition caloric deficiency 8.5 9.8 9.0(based on weight for age). Chronic iource: IDB (1994).
caloric deficiency (defined as 40.7 or more pounds below a body/mass index) affected 9 percentof mothers, with somewhat higher incidence in rural areas. These estimates, based on WHOdefinitions, are considerably lower than estimates based on the "Clasificaci6n GomezM which hasbeen used in the Dominican Republic. The latter has produced malnutrition estimates of around40 percent (IDB, 1994).
4.9 Poverty and Gender. The 1986 survey revealed that one quarter of all households wereheaded by women, decreasing to 22 percent in 1992. Female-headed households tend to behigher in urban areas-27 percent compared to 16 percent in rural areas in 1992. Table 4.4shows that poverty and extreme poverty were more likely to occur in female-headed households,especially in rural areas. Over the period 1986-92, female-headed households seem to havemade more progress than male-headed ones in reducing poverty and extreme poverty. Apossible explanation for the improvement in female-headed households may relate to the highparticipation rate of female labor (averaging 64 percent over 1986-92) in the dynamic FTZ

26 IV: Poverty Assessment
sector. A 1981 survey found that Table 4.4: Poverty and Gender, 1986-92 (% of households)
for 38 percent of women workingin FTZs, wages were the main TOTAL Urban Ruralsource of household income and 1986 1992 1986 1992 :1986 1992that almost one half of women Poorwere divorced, single or widowed. Male 14.8 16.7 9.8 8.5 18.8 23.6
FED estimates that over 1986-92 Female 22.6 15.8 15.4 10.7 32.7 24.4
about 63,300 women entered theFTZ labor force. In addition, a Male 8.6 7.4 6.5 2.7 10.2 10.9similar stimulus may be provided Femaleby the growing tourism sector. ource FED (1994). 8. 8.2 7.1 18.5 10.0
4. 10 Income Distribution. Inequality Table 4.5: Income Distribution, 1986-92 (% of total income)
is relatively high in the Dominican ..86 198 . 1 990
Republic. Inequality is described usingincome distribution by deciles and the 10% Poorest 1.1 0.8 1.6
Gini coefficient. The 20 percent richest 20% Poorest 3.8 2.7 4.4
income group received about 57 percent 60% Middle Income 43.6 36.6 39.1
of total income in 1992, while the poorest20 percent received only 4.4 percent of 20% Richest 52.6 60.7 56.5total income (Table 4.5). The share of 10% Richest 36.0 44.3 42.0
income received by the extreme rich and inoi eCoffcientt :,: 0.47 0.55 :049by the extreme poor increased during the Source: FED (1994).1986-92 period, but the share of the poor increased by a somewhat higher proportion. Middleincome groups seem to have been the losers over the period. The share of income of the richest20 percent was 13 times higher than the income share of the poorest 20 percent in 1992, whilethe income share of the richest 10 percent was about 27 times that of the poorest 10 percent.The gap between the richest 10 percent and the poorest 10 percent, although high, decreasedduring 1986-92 (from about 33 times to 26 times). A Gini coefficient of 0.49 in 1992 reflectsthe relatively high level of inequality in the Dominican Republic. Over 1986-92, the Ginicoefficient shows a marked deterioration in 1989 and a considerable improvement in 1992.
4.11 Sources of Income. The two Table 4.6: Income Sources of the Rich and Poor, 1992(%)
main income sources for Dominicans are 20% Poorest 20% Richestwages (38 percent) and self employment(33 percent). The poorest 20 percent get Family Business 4.3 10.9
about 60 percent of their income from Self Employment 12.2 38.4
wages and about 12 percent from self Foreign Remittances 1.5 5.6employment (Table 4.6). As incomeincreases, the proportion of income Domestic Transfers 4.3 0.3provided by wages decreases and the Wages 59.4 30.9
proportion of income provided by self Sale of Agricultural Products 11.1 6.7
employment rises. The richest 20 percentobtain about 30 percent of their income Other 7.2 7.2from salaries and about 40 percent from TOTAL 100.0 100.0
self employment. Foreign remittances are iource: FED (1994).
not significant income sources for the rich or poor.
4.12 Structure of Expenditures. Knowing the composition of expenditures of the poor canhelp us understand the impact of trade and price policies on the poor. As expected, most of the
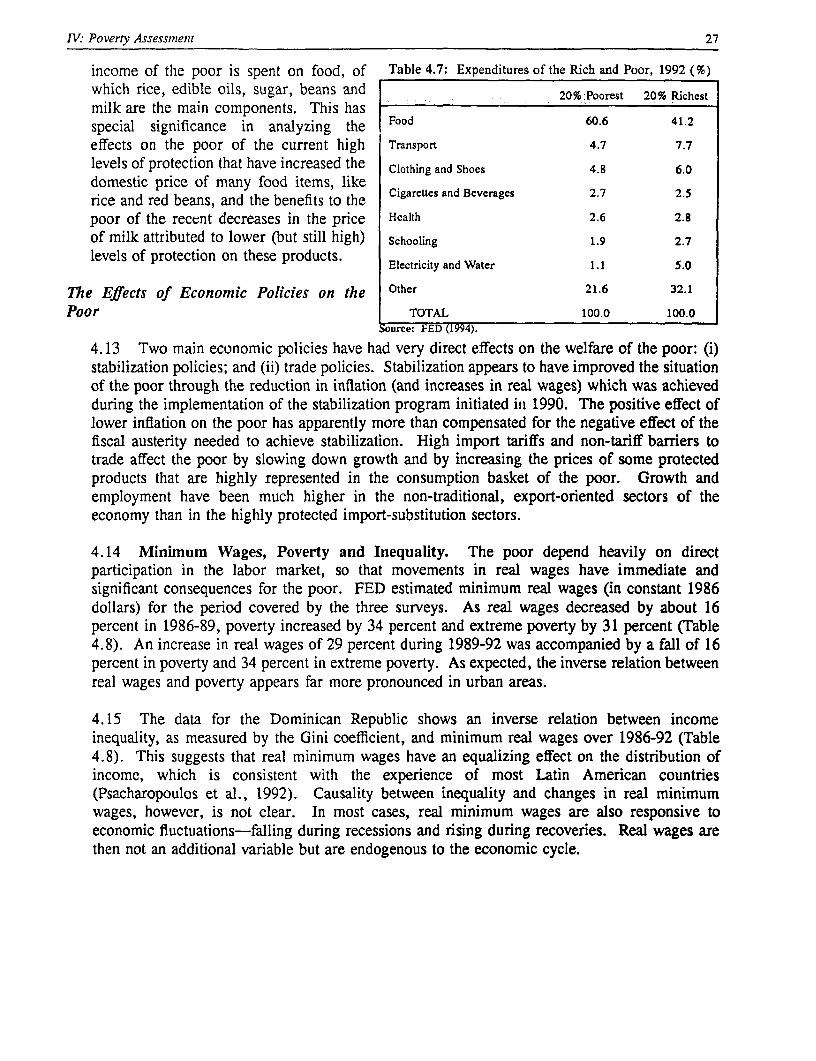
IV.: Poverty Assessment 27
income of the poor is spent on food, of Table 4.7: Expenditures of the Rich and Poor, 1992 (%)which rice, edible oils, sugar, beans and 20% Poorest 20% Richestmilk are the main components. This hasspecial significance in analyzing the Food 60.6 41.2
effects on the poor of the current high Transport 4.7 7.7
levels of protection that have increased the Clothing and Shoes 4.8 6.0
domestic price of many food items, likerice and red beans, and the benefits to thepoor of the recent decreases in the price Health 2.6 2.8of milk attributed to lower (but still high) Schooling 1.9 2.7levels of protection on these products. Electrcity and Water
Electriity an Water1.1 5.0
The Effects of Economic Policies on the Other 21.6 32.1Poor I TOTAL 100.0 100.0
Source: FED (1994).
4.13 Two main economic policies have had very direct effects on the welfare of the poor: (i)stabilization policies; and (ii) trade policies. Stabilization appears to have improved the situationof the poor through the reduction in inflation (and increases in real wages) which was achievedduring the implementation of the stabilization program initiated in 1990. The positis'e effect oflower inflation on the poor has apparently more than compensated for the negative effect of thefiscal austerity needed to achieve stabilization. High import tariffs and non-tariff barriers totrade affect the poor by slowing down growth and by increasing the prices of some protectedproducts that are highly represented in the consumption basket of the poor. Growth andemployment have been much higher in the non-traditional, export-oriented sectors of theeconomy than in the highly protected import-substitution sectors.
4.14 Minimum Wages, Poverty and Inequality. The poor depend heavily on directparticipation in the labor market, so that movements in real wages have immediate andsignificant consequences for the poor. FED estimated minimum real wages (in constant 1986dollars) for the period covered by the three surveys. As real wages decreased by about 16percent in 1986-89, poverty increased by 34 percent and extreme poverty by 31 percent (Table4.8). An increase in real wages of 29 percent during 1989-92 was accompanied by a fall of 16percent in poverty and 34 percent in extreme poverty. As expected, the inverse relation betweenreal wages and poverty appears far more pronounced in urban areas.
4.15 The data for the Dominican Republic shows an inverse relation between incomeinequality, as measured by the Gini coefficient, and minimum real wages over 1986-92 (Table4.8). This suggests that real minimum wages have an equalizing effect on the distribution ofincome, which is consistent with the experience of most Latin American countries(Psacharopoulos et al., 1992). Causality between inequality and changes in real minimumwages, however, is not clear. In most cases, real minimum wages are also responsive toeconomic fluctuations-falling during recessions and rising during recoveries. Real wages arethen not an additional variable but are endogenous to the economic cycle.

28 IV. Poverty Assessment
Table 4.8: Minimum Wages and Poverty, 1986-92 (% change)
Percentage Change
1986-89 1989-92
Poverty t 33.9 4 15.9
Urban t 134.2 4 60.2
Extreme Poverty t 30.5 4 34.3
Urban t 78.9 4 60.6
Real Minimum Wage 15.5: t 28.7
Gini Coefficient t 17.0 4 10.9iource: FED (1994).
4.16 Inflation and Poverty. Inflation is highly regressive. It affects the welfare of the poorthrough two main channels. First, since inflation is a tax on money balances, and since the poorhave little opportunity to hold wealth in inflation-protected assets, inflation erodes the real valueof the poor's wealth. Second, and more importantly, inflation has an effect on real wages.Experience in Latin America shows that the acceleration of inflation caused, or was accompaniedby, a big reduction in the real wage (Morley, 1994). Cardoso (1992) found that for seven LatinAmerican countries, a doubling of inflation was estimated to reduce real wages by an averageof 14 percent. When poverty evidence and the dates of the acceleration of inflation werematched for five of the seven countries, the average poverty level went up by 47 percent. TheGini coefficients all rose but by a somewhat lower amount (Morley, 1994).
4.17 The evidence for theDominican Republic is consistent with Figure 4.1: Inflation and Povertythese findings (Figure 4.1). During1985, the Government implemented a Infl,ation 0 poverty successful stabilization program whichreduced inflation to 10.1 percent NJ 2S
during January-November 1986 (the 5/
period for the Tufts Survey). During1987, the Government followed an 40
expansionary policy which raised 30 2U
inflation to 50.3 percent during March1986 (the period for the UNDP 2U
Survey). During this period ofaccelerated inflation, poverty increasedby 34 percent. Income inequality 19H6 19h9 1992
worsened as reflected in a 17 percentincrease in the Gini coefficient. A reduction in poverty and the Gini coefficient accompaniedthe successful stabilization program of the early 1990s.
4.18 Growth and Poverty. The pattern of growth as well as its rate is an importantdeterminant of changes in poverty. The sharp duality of the Dominican economy illustrates theimportance of growth patterns, i.e., inward vs. outward-oriented growth. The performance oftourism and FTZs-two labor-intensive, export-oriented sectors-indicates the potential impactof outward-oriented growth on employment and poverty. Since wages are the main source ofincome for the poor, the link between poverty and labor-intensive growth is clear and direct.

IV: Poverty Assessment 29
Tourism and FTZs have grown at much higher rates than the rest of the economy, even whenthe domestic economy stalled in the mid-1980s. While GDP growth fell to 2 percent per yearin 1983-93, tourism and FTZs averaged annual growth of 16.4 percent (Table 4.9). Growthgenerated a substantial increase in employment. Although official employment data do notdisaggregate tourism, IDB reported total direct employment in tourism of about 60,000 in 1992,while indirect employment was estimated at about twice the size of direct employment (IDB,1993). A more conservative estimate, based on an average ratio of 1.3 workers per room,would put total employment at about 39,000 in 1993, growing from less than 2,000 in 1970(FED, 1993). FTZ employment, in turn, increased from less than 1,000 in 1970 to 165,000 in1993-four to nine times higher than annual employment growth in the rest of the economy.
Table 4.9: Growth and Employment, FTZs and Rest of the Economy, 1974-93
GDP Growth Labor Force Value Added Growth ofULabor:Excluding FTZ - - Growth Growth in FTZ in FTZ
1974-78 4.8 3.2 35.2 29.41978-82 5.0 4.2 12.0 15.81982-88 3.1 3.4 24.9 22.31988-93 1.8 3.1 23.5 16.4
Source: FED (1994).
4.19 Protection and the Poor. High effective protection worsens the situation of the poorthrough: (i) lower growth in protected sectors; and (ii) higher prices for products consumedintensively by the poor, i.e., rice, edible oils, sugar, wheatmeal (derivados de harina de trtgo) andbeans (Table 4.10). Protection to the domestic production of rice and red beans was mainly theresult of import prohibitions. As a consequence, in 1992 the domestic consumer paid 2.5 timesmore than the equivalent international price of rice and about 30 percent more for red beans.Sugar can be imported only if CEA, the state-owned sugar company, authorizes it. Whenauthorized, sugar can only be imported by local sugar producers, i.e., CEA and two privateenterprises. To reduce CEA losses, the Government often fixed domestic sugar prices at levelswell above equivalent international prices. Wheatmeal imports are controlled by MolinosDominicanos, a state monopoly, which has raised the price well above international equivalents.
Table 4.10: Expenditure on Selected Products, 1992 (as % of total expenditures)
Average 10% Poorest 10%. Richest -% Poor/Rich
Rice 6.7 17.5 2.6 6.7Edible Oils 3.2 2.0 0.6 3.3Sugar 1.0 6.5 1.6 4.1Red Beans 2.6 7.0 1.1 6.4Wheatmeal 2.2 4.1 1.0 4.1
Source: FED (1994).
4.20 Table 4.11 presents an estimate of the excess total cost paid by the poor in 1992 due toprotection to the domestic production of rice, edible oils, red beans, sugar and wheatmeal. Dueto import restrictions and, therefore, higher prices for these four products, the poor paid aboutUS$26 million more in 1992 than they would have paid had they been imported free of duties.

30 1V: Poverty Assessment
Table 4.11: Cost of Protection to the Poorest 10 Percent, 1992
Annual per Capita Consumption of Poorest 10% (RD$) Excess Cost to the Poor
Share in Total At Domestic :At International Per Capita Total RD$ Total US$Product Expenditures Prices Prices RD$ Million Million
Rice 17.5 371.9 148.8 223.1 165.4 13.2Edible Oils 6.5 137.0 53.5 83.5 61.9 5.0Sugar 2.0 41.6 23.1 18.5 13.7 1.1Red Beans 7.0 149.1 82.4 66.7 49.4 4.0Wheatmeal 4.1 87.8 37.0 50.8 37.7 3.0
Total 37.1 787.4 334.9 442.6 328.1 26.3surce: FED (1994).
4.21 The case of milk provides a good example of the positive effects of trade liberalizationon the poor. The tariff reform implemented in September 1990 reduced the duty on powderedmilk to 30 percent, which was lowered to 20 percent in late 1992. Consumer prices of
powdered milk fell by an average of 25 percent and dampened prices of locally produced liquidmilk. Consumption per capita of powdered milk increased by 39 percent during 1986-92 while
consumption per capita of powdered milk increased by 172 percent over the period. For the two
lowest deciles, consumption per capita of liquid milk increased by 50 percent over the period.For this group, the share of calories supplied by liquid milk increased from 4 percent in 1986
to 5.1 percent in 1992 (FED, 1994).
4.22 Petroleum Prices and the Poor. Table 4.12: Who Gets the Subsidy on Cooking Gas? 1993
All petroleum products were priced below RDS mill. Percentageinternational prices before the stabilizationprogram was initiated in 1990. A 30% Richest 128.0 54.7
significant increase in domestic petroleum 40% Middle Income 86.3 36.9
prices was the most important measure
contributing to the Government's successin turning a large fiscal deficit into a Total Subsidy 234.0 100.0
surplus. Propane cooking gas, however, Zurce: FED (1994).
was the only product that was left at a subsidized price (the domestic price was the equivalentof US$0.25/gallon in June 1993), mainly due to the alleged impact that a rise in the price ofpropane gas would have on the welfare of the poor. The 1992 survey, however, shows that the
per capita consumption of propane gas of the richest 10 percent is abut 8 times the per capitaconsumption of the poorest 10 percent, and that the share of expenditures in propane gas as aproportion of total expenditures is about 45 percent higher for the richest 10 percent compared
with the poorest 10 percent (Table 4.12). As a consequence, the richest segment of the
population benefits disproportionately from the subsidy.
4.23 A case for subsidizing propane gas could be made on environmental grounds. Beneficial
environmental effects could arise to the extent that greater reliance on propane gas would reduceconsumption of fuelwood and coal, thereby reducing pressure on forest resources and causingless pollution. Additional research would be required to assess environmental effects of
subsidizing propane gas. Survey data indicates that there has been little change in the household
consumption of fuelwood. While the share of propane gas in household fuel consumption
increased from 32 percent in 1986 to 52 percent in 1992, the share of fuelwood decreased only

IV: Poverty Assessment 31
slightly from 30 percent to 29 percent. Increased propane gas consumption was at the expenseof coal, which fell from 37 percent of household consumption in 1986 to 15 percent in 1992.3
4.24 The implicit subsidy to petroleum Table 4.13: Who Pays the Petroleum Tax? 1991-93
products contributed about 22 percent ofthe fiscal deficit in 1990 (1.1 percent of iGDP, out of a total fiscal deficit of almost 30% Richest 4317 60.35 percent of GDP). By 1993, however, 40 Middle Income 2236 31.2the price differential of petroleum prices 30% Poret 608 8.5represented an important informal tax,which contributed about 2 percent of GDP :Totl Subsidy 7161- 10.0to fiscal revenues. Contrary to domestic ource: FED (1994).
opinion, most of the tax has been paid by the rich (Table 4.13). The 1992 survey indicates thatper capita expenditures on transportation and gasoline products of the richest 10 percent is about11-12 times the per capita expenditures of the poorest 10 percent, and that the share of totalexpenditures in transportation and gasoline, as a proportion of total expenditures, is 2.1 timeshigher for the richest 10 percent than for the poorest 10 percent.
Social spending is not targeted to the poor
4.25 Public expenditures in the Dominican Republic are not high by regional standards. Since1980, total public expenditures have fluctuated between 14 and 21 percent of GDP. During therecent stabilization period, total expenditures rose as a share of GDP (Table 1.4). Publicspending on education and health, on the other hand, is among the lowest in the region.4 Totalsocial spending has fallen somewhat since the early 1980s but it has not been a dramaticreduction. More striking, however, is the shift in spending within the social sectors. Since themid-1980s, there has been a marked shift toward social spending that has relatively little impacton the poor, and instead has been directed at urban sectors. This shift was the result of astrategy to stimulate growth through the expansion of public works and a pronounced bias in theexpenditure allocation process for large and visible physical construction. Thus, spending onhousing, and water and sewerage was favored at the expense of social sectors with highrecurrent expenditure needs. Education and social assistance were particularly affected, whilespending on health retained its share. In health, however, it is estimated that about 74 percentof spending goes to hospitals while preventive health services receive only 7 percent of the total(IDB, 1994).
4.26 Even within the favored sectors, public expenditures were highly regressive. In 1989,it was estimated that the poorest 50 percent of the population had been the beneficiaries of only28 percent of public housing. The middle four deciles received 51 percent of public housing.Despite the heavy investment in the water and sewerage sector (mainly in Metropolitan Santo
3. Charcoal is consumed by 80 percent of households-mainly low-income urban households-for cooking. Propane gasis a viable alternative to charcoal for low-income urban households but the high cost of gas stoves and cylinders dueto high domestic protection, hamper substitution of gas for charcoal among poorer households (World Bank, 1993).
4. Major issues in the education and health sectors were analyzed in the 1992 Country Economic Memorandum (WorldBank, 1992) and are not repeated here.

32 IV: Poverty Assessment
Domingo), about 50 percent of the total population do not have water in their homes. Costrecovery in housing and water and sewerage is negligible.5
Table 4.14: Public Social Expenditures, 1980-92 (as % of GDP)
1980 1985 1990 1991 1992
Social Expenditures 6.7 5.6 5.9 5.1 5.9
Education 2.2 1.8 1.2 1.1 1.5
Health 1.6 .1.3 1.7 1.4 1.3
Social Assistance 1.2 1.1 0.5 0.4 0.3
Housing 0.3 0.3 1.0 0.8 0.7
Water and Sewerage 0.4 0.1 0.9 1.0 1.6
Other 0.9 1.1 0.6 0.5 0.5bource: IDB (1994).
4.27 Three factors largely explain this regressive pattern of social spending. First, a socialdevelopment strategy which targets the poorer sections of the population and links social targetswith investment and spending priorities has not been articulated. Second, public revenues andexpenditures are highly centralized. The Central Government collects more than 80 percent oftotal revenues and executes about 90 percent of total spending and 85 percent of socialexpenditures. Local governments therefore have little say in how resources are mobilized andspending prioritized. Third, the Budgetary Law enables the Presidency to allocate discretionallya large proportion of Central Government expenditures. In 1992 and 1993, this proportionexceeded 50 percent. These funds fall outside the regular budgetary process and tend to beallocated to specific public entities or large and visible investment projects.
Elements of a poverty alleviation strategy
4.28 The Government does not have a coherent poverty alleviation strategy and its socialsector policies are weakening the country's human capital base. A number of elements wouldneed to form part of a comprehensive, long-term poverty alleviation strategy:
*- Sustained growth is essential. The country's economic strategy needs to be outwardoriented and private sector-led.
*0 Macroeconomic stability needs to be maintained, especially low inflation. Controllinginflation is critical, not only for sustained growth, but also because high inflation has hada devastating effect on the Dominican poor.
*. High effective protection and trade distortions need to redressed, not only as a means toencourage outward orientation and increased competitiveness in the economy but also tominimize adverse effects on the poor (especially in agriculture).
5. It is estimated that cost recovery in public housing covers less than 1/1,000th of program costs. In Santo Domingo,water tariffs for a middlc-income residence are less than US$3 per month (IDB, 1994).

IV: Poverty Assessment 33
An effective system to monitor living conditions and poverty trends needs to bedeveloped and implemented.
Public spending on education and health need to be increased as a share of GDP. Inaddition, social programs and spending need to be redirected away from the favoredurban sectors toward primary health and education services, especially in rural areas.Budgetary reform would be key to reduce the bias toward high visibility constructioninvestments. Improved cost recovery efforts need to be pursued for services benefitingmiddle and higher income groups.
*0, Even with improved allocations within the social sectors, there is unlikely to be muchprogress in meeting the basic health and education needs of poor communities withoutan effective decentralization program. A number of experiments are underway in CentralAmerica and elsewhere in Latin America to assign increased autonomy and responsibilityto community groups in the management of basic social services. Groups at themunicipal and community levels are better positioned to identify local needs andparticipate in the management of basic services. Noteworthy examples are the EDUCOprogram in El Salvador, the Health Decentralization program in Nicaragua andColombia's experience in decentralizing public health.
*. Effective targeted programs and safety net mechanisms benefiting the poor (especiallyin rural areas), female-headed households and malnourished children need to bedeveloped and implemented.

BIBLIOGRAPHY
Braga, Carlos A. Primo, Raed Safadi and Alexander Yeats. (1994). NAFTA 's ImplicationsforEastAsianExports. Policy Research Working Paper No. 1351. Washington, D.C.: InternationalEconomics Department, World Bank.
Cardoso, Eliana. 1992. The Macroeconomics of Poverty in Latin America. Cambridge, MA: NBER.
Dauhajre, Andres, Jose Achecar Chupani and Anne Swindale. 1994. Estabilizacion, Apertura yDindmica de la Desigualdad y la Pobreza en la Republica Dominicana. 1986-92. SantoDomingo: Fundaci6n Economfa y Desarrollo, Inc. (FED).
Inter-American Development Bank. 1993. Dominican Republic: Macroeconomic Assessment Paper,1993 (October 1993 draft). Washington, D.C.: Department of Plans and Programs.
1994. Republica Dominicana, Informe Socioecon6mico. Washington D.C.:Departamento de Desarrollo Econ6mico y Social.
Leamer, Edward E., Alfonso Guerra, Martin Kaufman and Boris Segura. 1994. Central America andthe North American Free Trade Agreement (September 1994 draft). Washington, D.C.: WorldBank, Country Department II, Latin America and the Caribbean Regional Office.
Morley, Samuel. 1994. Poverty and Inequality in Latin America.- Past Evidence, Future Prospects.Policy Essay No. 13. Washington, D.C.: Overseas Development Council
Psacharopoulos, George, Samuel Morley, Ariel Fiszbein, Haeduck Lee and Bill Wood. 1992.Poverty and Income Distribution in Latin America: The Story of the 1980s. Regional StudiesProgram, Report No. 27. Washington, D.C.: Technical Department, Latin America and theCaribbean Regional Office, World Bank.
Valdes, Alberto and Barry Schaeffer. 1993. Handbook on Surveillance of Agricultural Price andTrade. Washington, D.C.: World Bank.
World Bank. 1992. Dominican Republic, Updating Economic Memorandum: The Challengeof Sustainability. Report No. 10614-DO (Grey Cover). Washington, D.C.: Department III,Latin America and the Caribbean Regional Office.
. 1993 Dominican Republic: Environmental Issues Paper. Report No. 11813-DO(White Cover). Washington, D.C.: Department lll, Latin America and the Caribbean RegionalOffice.
. 1994. The Dominican Republic: Creating A Framework for SustainableAgricultural Growth. Report No. 12964-DO (Green Cover). Washington, D.C.:Country Department Il, Latin America and the Caribbean Regional Office.


IMHAGING
re' t Na 1319Type : ER