report mechanical properties of five different ...report . mechanical properties of five different...
TRANSCRIPT

Report
Mechanical Properties of Five Different Commercially Available OSB Products For Potential Upholstery Furniture Frame Stock
Submitted to:
Mr. Bill Martin
Director, Franklin Furniture Institute Mississippi State University
P.O. Box 9828 Mississippi State, MS 39762
(662) 325-6787 [email protected]
Submitted by:
Jilei Zhang, Professor Franklin Quin, Research Associate
Mississippi Forest Products Laboratory Mississippi State University
P.O. Box 9820 Mississippi State, MS 39762
(662) 325-2116
September 3, 2010

Introduction
Currently furniture manufacturers are starting to use oriented strand board (OSB)
as frame stock due to cost saving advantages, but many of them have little experience
with this type of material. There is not much data about the strength performance of OSB
as frame stock. Most manufacturers’ decisions are based on cost. There is a potential
problem with misuse of this product with the improper engineering of frames due to a
lack of strength data. This could cause quality problems in terms of frame durability
performance. The availability of strength and cost data would provide manufactures with
information to assist decision making.
Mechanical properties of five different OSB products from four different
manufactures were evaluated as potential upholstered furniture frame stock. The
mechanical properties evaluated were the ones related to upholstery furniture frame
strength performance, fastener withdrawal resistances from the material, and adhesive
bonding strength. All of the OSB panels were constructed from southern yellow pine
flakes. This report presents the results of mechanical properties evaluation of the five
materials.
The mechanical tests performed on the five materials were as follows: static
bending; tension perpendicular to the face (internal bond); screw direct withdrawal;
staple direct withdrawal; staple lateral withdrawal; glue bonding tensile strength; glue
bonding shearing strength; and toughness. In addition to the mechanical properties, some
physical properties such as moisture content, thickness, density, density profile were
measured.

2
Mechanical Properties Definitions
The static bending test measured the modulus of rupture (MOR) and the modulus
of elasticity (MOE). MOR is a measure of the maximum load-carry capacity of wood
composites as structural members in bending. MOE is a measure of the stiffness of the
wood composite as a structural member in bending. Internal bond is a measure of how
well the wood composite is glue together. Internal bond is also directly related to
fastener resistance. Toughness is the measure of the work required to break a wood
composite when exposed to an impact bending moment.
Mechanical fastener direct withdrawal resistance – reflects the resistance of wood
composites to direct withdrawal of mechanical fasteners such as staples and screws. The
strength and stability of an upholstery furniture frame depends on the fasteners that hold
its members together. The direct withdrawal resistance of staples can affect the strength
of staple-connected, end-to-face, top rail to back joints, or stretcher to front or back rail
joints, where staples are subjected to tensile forces.
Mechanical fastener lateral withdrawal resistance – reflects the resistance of
wood-based composites to lateral (shear) withdrawal of mechanical fasteners such as
staples and screws. For instance, the lateral withdrawal resistance of staples can affect
the strength of staple-connected, end-to-edge, L-shaped front rail to stump joints, where
staples are subjected to lateral shear forces.
Glue plays an important role in upholstery furniture frame construction. It acts as
a fastener joining frame parts together. Wood bonding strength can be judged based on
percentage of wood failure. Face-to-face or end-to-face tensile bonding strength reflects
the resistance of composite surface-to-surface or end-to-surface adhesive bonding to

3
tensile stresses. Face-to-face or end-to-face shear bonding reflects the resistance of
composite surface-to-surface or end-to-face adhesive bonding to shear stresses.
Materials and Procedures
In general, thirty replications were considered for each of the mechanical
properties tests for each material. To prepare specimens, ten 4’ x 8’ x 23/32” panels were
randomly selected from a bundle (approximately 43 sheets) supplied by manufacturers.
From these panels test specimens were cut. Figure 1 shows the cutting pattern for each of
the panels. The panels were first cut in halves along 4-foot direction of the full-size sheet
and labeled as section A and section B. From these two sections, test specimens were cut
as indicated in Figure 1. The measured moisture content of the panels when received was
approximately 4%; therefore the specimens were conditioned in an equilibrium moisture
content chamber at controlled at 8% moisture content level for at least two weeks before
testing.
Static Bending
Static bending tests were performed to evaluate strength and stiffness
performance of each material. Modulus of rupture (MOR) and modulus of elasticity
(MOE) data were obtained. The bending tests were conducted using a 36” span.
A complete 5×2×2 factorial completely random experiment with thirty replicates
per cell was conducted to evaluate the MOR and MOE. A total of 600 specimens were
tested. The factors were material (Company I RD, Company I HD, Company II,
Company III, and Company IV), specimen length orientation (parallel and cross), and
load direction (flatwise and edgewise). Parallel is defined as specimen length direction
that’s parallel to the full panel 8’ direction. Cross is defined as specimen length direction

4
that’s perpendicular to the full panel 8’ direction. Flatwise is defined as the concentrated
testing load applied perpendicular to the specimen surface. Edgewise is defined as the
concentrated testing load applied parallel to the specimen surface. Ten 2” x 40”
specimens were cut from each of the panels for each material as shown in Figure 1. Five
of the ten were cut parallel to the 8’ direction, and five of the ten were cut perpendicular
to the 8’ direction.
The testing flatwise was conducted by referencing ASTM D 3043-95: Standard
Methods of Testing Structural Panels in Flexure (ASTM 2008). The setup for testing
flatwise is shown in Figure 2. The tests were conducted on an Instron universal testing
machine at a speed of 0.37 in/min. After testing, a moisture content and density sample
was cut from each specimen. The moisture content and density were measured according
to ASTM D442-92: Standard Test Methods for Direct Moisture Content Measurements
of Wood and Wood-Base Materials (ASTM 2008) and ASTM D 2395-93: Standard Test
Methods for Specific Gravity of Wood and Wood-Base Materials (ASTM 2008),
respectively.
The testing edgewise was conducted by referencing ASTM D 4761-96: Standard
Test Methods for Mechanical Properties of Lumber and Wood-Base Structural Material
(ASTM 2008). The setup for testing edgewise is shown in Figure 3. The tests were
conducted on an Instron universal testing machine at a speed of 0.25 in/min. After
testing, a moisture content and density sample was cut from each specimen. The
moisture and density was measured according to the same methods mentioned for the
flatwise testing.

5
Tension Perpendicular to the Face (Internal Bond)
The internal bond test was conducted according to ASTM D 1037-96a: Standard
Test Methods for Evaluating Properties of Wood-Base Fiber and Particle Panel Materials
(ASTM 2008). A one factor (five levels) factorial completely random experiment with
thirty replicates per cell was conducted to evaluate internal bond strength. The factor was
material, which had five levels, Company I RD, Company I HD, Company II, Company
III, and Company IV. Three 2” x 2” specimens were chosen from each of the ten panels
for each material as shown in Figure 1. A total of 150 internal bond tests were
performed.
The setup for the internal bond test is shown in Figure 4. The tests were
conducted on an Instron universal testing machine at a speed of 0.04 in/min. The
ultimate withdrawal strengths were recorded.
Screw Direct Withdrawal
Screw direct withdrawal tests were performed to evaluate resistances of tested
materials to direct withdrawal of screws. The screw direct withdrawal tests were
conducted according to ASTM D 1761-88: Standard Test Methods for Mechanical
Fasteners in Wood (ASTM 2008). A complete 5×3 factorial completely random
experiment with thirty replicates per cell was conducted to evaluate the resistances of
tested materials to direct withdrawal of screws. The factors were material (Company I
RD, Company I HD, Company II, Company III, and Company IV) and surface
orientation (face, end, and edge). The face represents a screw that was inserted
perpendicular to the specimen surface. The end represents a screw that was inserted to
the specimen side in the direction parallel to the full size panel in the 8’ direction. The

6
edge represents a screw that was inserted to the specimen side in the direction
perpendicular to the full size panel in the 8’ direction. Thirty 3” x 6” samples blocks
were randomly chosen from a pile cut from the ten panels of each material. A total of
450 screw direct withdrawal tests were performed.
A 7/64” pilot hole was drilled into the face, edge, and end of each testing block.
The pilot hole was drilled into the face surface to a depth of 2/3” and in the end and edge
surfaces to a dept of ¾”. A #10 1-1/2” wood screw was hand turned into the pilot hole
through the block thickness for the face surface. The tip of the screw was flush with the
thickness of the test block. The wood screw was hand turned into the pilot hole to a
depth of 1” for the end and edge surfaces. Figures 5 through 7 shows the setups for the
screw direct withdrawal tests, face, end, edge, respectively. The tests were conducted on
an Instron universal testing machine at a speed of 0.1 in/min. The ultimate withdrawal
loads were recorded.
Staple Direct Withdrawal
Staple direct withdrawal tests were performed to evaluate resistances of tested
material to staple withdrawal. The staple withdrawal tests were conducted by referencing
ASTM D 1761-88: Standard Test Methods for Mechanical Fasteners in Wood (ASTM
2008). A complete 5×3 factorial completely random experiment with thirty replicates per
cell was conducted to evaluate staple direct withdrawal strength. The factors were
material (Company I RD, Company I HD, Company II, Company III, and Company IV)
and surface orientation (face, end, and edge). The face represents a staple that was
inserted perpendicular to the specimen surface. The end represents a staple that was
inserted to the specimen side in the direction parallel to the full size panel in the 8’

7
direction. The edge represents a staple that was inserted to the specimen side in the
direction perpendicular to the full size panel in the 8’ direction.
The general configurations of the face, end, and edge withdrawal specimens in
this study are shown in Figure 8. The direct withdrawal load test specimens of face, end,
and edge (Figure 8) consisted of two principal structural members, a fastened member
and a fastening member of the same type of material, joined together by one staple. For
face withdrawal specimens, both members had nominal dimensions of 12 inches long by
2 inches wide and by 23/32 inch thick. For end or edge specimens, both members were
constructed of the same type of material and had nominal dimensions of 6 inches long by
3 inches wide and by 23/32 inch thick. A total of 450 staple direct withdrawal tests were
performed.
The staples were Senco16 gauge galvanized chisel-end-point type with a crown
width of 7/16” and a leg length of 1 3/4”. The staples were coated with Sencote coating,
a nitro-cellulose-based plastic. All staples were power driven with a pneumatic staple gun
with the staple crown at a 45 degree angle into the test block. The air pressure for the
staple gun was 65 psi for driving staples into the face, end or edge. The tests were
conducted on an Instron universal testing machine at a speed of 0.1 in/min. The ultimate
withdrawal loads were recorded. Figures 9 and 10 show the test setup used for testing
staple direct withdrawal from the face, end, and edge, respectively.
Staple Lateral Withdrawal
End and Edge Surface – Staple lateral withdrawal tests were performed to evaluate
lateral resistances of tested material to withdrawal of staples from its end and edge. The
staple lateral withdrawal tests were conducted according to ASTM D 1761-88: Standard

8
Test Methods for Mechanical Fasteners in Wood (ASTM 2008). A complete 5×2×2
factorial completely random experiment with thirty replicates per cell was conducted to
evaluate the staple lateral withdrawal. A total of 600 specimens were tested. The factors
were material (Company I RD, Company I HD, Company II, Company III, and Company
IV), surface orientation (end and edge), and load direction (parallel and perpendicular).
The end represents a staple that was inserted parallel to the specimen side parallel to the
8’ direction. The edge represents a staple that was inserted parallel to the specimen side
perpendicular to the 8’ direction. The parallel load direction is defined as loading parallel
to the thickness of fastening member (Figure 11a). The perpendicular load direction is
defined as loading perpendicular to thickness of fastening member (Figure 11b).
The general configurations of end and edge lateral withdrawal specimens in this
study are shown in Figure 11. The lateral withdrawal load test specimens (Figure 11)
consisted of two principal structural members, as fastened member and a fastening
member of the same type of material, jointed together by one staple. Both members had
nominal dimensions of 6 inches long by 3 inches wide and by 23/32 inch thick. The tests
were conducted on an Instron universal testing machine at a speed of 0.1 in/min. The
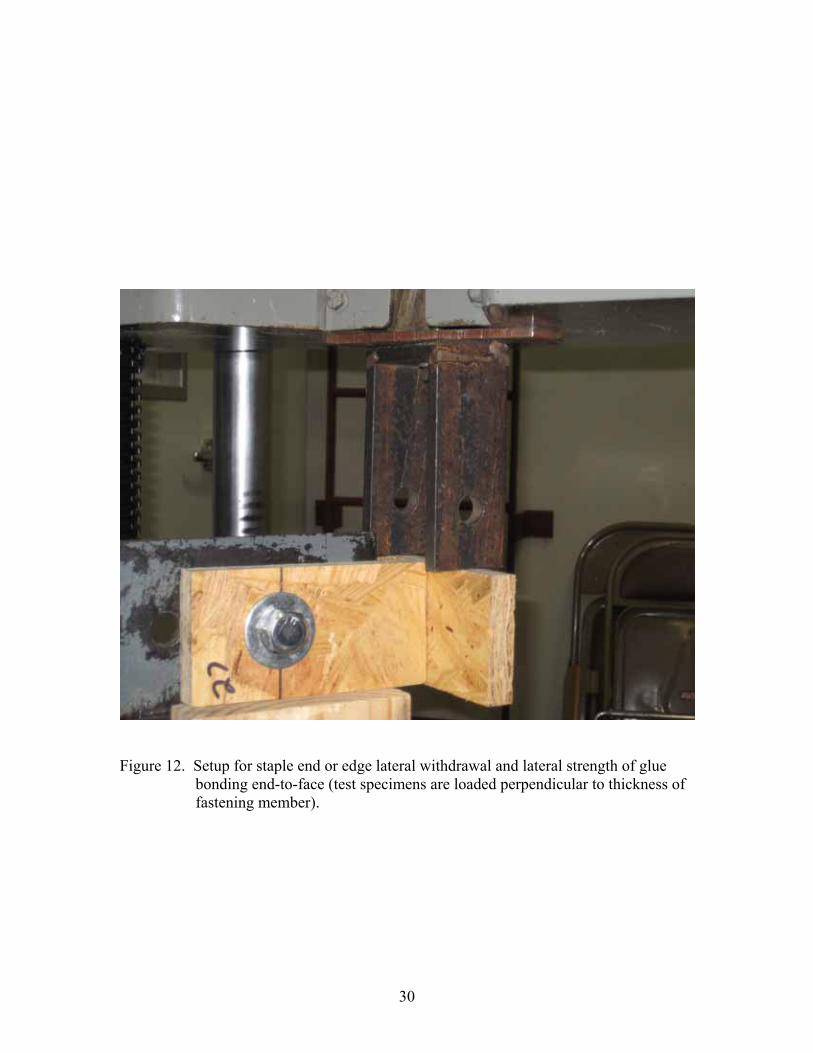
ultimate lateral withdrawal loads were recorded. Figures 12 and 13 shows the test setups
for the staple lateral withdrawal from end and edge.
Face Surface – Staple lateral withdrawal tests were performed to evaluate lateral
resistances of tested material to withdrawal of staples from its face. The staple lateral
withdrawal testes were conducted according to ASTM D 1761-88: Standard Test
Methods for Mechanical Fasteners in Wood (ASTM 2008). A complete 5×2 factorial
completely random experiment with thirty replicates per cell was conducted to evaluate

9
staple lateral withdrawal from face. A total of 300 specimens were tested. The factors
were material (Company I RD, Company I HD, Company II, Company III, and Company
IV) and fastening member surface flake orientation (parallel and cross). Parallel is
defined as specimen length direction that’s parallel to the full panel 8’ direction. Cross is
defined as specimen length direction that’s perpendicular to the full panel 8’ direction.
The general configuration of the face lateral withdrawal specimens in this study is
shown in Figure 11c. The specimens consisted of two principal structural members, a
fastened member and a fastening member of the same type of material, joined together by
one staple. Both members had nominal dimensions of 12 inches long by 2 inches wide
and by 23/32 in thick. Two members overlapped 2 inches in the fastening member length
direction. The tests were conducted on an Instron universal testing machine at a speed of
0.1 in/min. The ultimate lateral withdrawal loads were recorded. Figure 14 shows the
test setup for the staple lateral withdrawal from face.
Glue Bonding Strength
Glue bonding tensile and shear tests were performed to evaluate test material
face-to-face and end-to-face bonding strength. The same experimental design and testing
procedures describes for the staple direct and lateral withdrawal testing was used for the
glue bonding testing. Glue used to connect joint members was polyvinyl acetate (PVA)
wood glue provided by a local furniture company with solids content of 40%. The glue
was applied to both fastened member and fastening member and the two members were
clamped for 24 hours before testing. The amount of glue applied was approximately 2.2
g and 2.6 g per joint for face-to-face and end-to-face joints, respectively. All of the joints
were constructed using the non wax face, except for Company II. The Company II had

10
wax on both surfaces; therefore for Company II the joints were constructed wax face to
wax face. The tests were conducted on an Instron universal testing machine at a speed of
0.1 in/min. Ultimate lateral and tensile loads were recorded. The ultimate lateral and
tensile stress were calculated from equation 1.
σ =f / a Equation 1
where: σ - lateral or tensile stress in psi f - ultimate lateral load or tensile load a - glue bonding area ( face-to-face bonding (4 in2) and end or edge-to-face bonding (2.1375 in2) Toughness
A toughness test was conducted to evaluate the toughness of the tested materials.
The toughness was conducted by referencing ASTM D 143-94: Standard Test Methods
for Small Clear Specimens of Timber (ASTM 2008). A completed 5×2×2 factorial
completely random experiment with thirty replicates per cell was conducted to evaluate
toughness. A total of 600 specimens were tested. The factors were material (Company I
RD, Company I HD, Company II, Company III, and Company IV), specimen length
orientation (parallel and cross), and load direction (edge and flat). Parallel is defined as
specimen length direction that’s parallel to the full panel 8’ direction. Cross is defined as
specimen length direction that’s perpendicular to the full panel 8’ direction. Edge is
defined as the load applied parallel to specimen surface. Flat is defined as the load
applied perpendicular to the specimen surface. Ten 0.79”×11” specimens were cut from
each of the panels for each material as shown in Figure 1. Five of the ten were cut
parallel to the 8’ direction, and five of the ten were cut perpendicular to the 8’ direction.

11
The toughness test setup is shown in Figure 15. The toughness machine is a pendulum-
type toughness machine developed at the USDA Forest Products Lab in Madison, WI.
Results and Discussion
Table 1 summarizes the mean values and their coefficients of variation (COV)
along with the mean comparison results. Table 2 gives the 5th percentile values for each
property. The protested Least Significant Difference (LSD) multiple comparison
procedure at the 5 percent significance level was performed to determine the mean
differences for each of the mechanical properties among the evaluated materials. The
mean comparisons of each property are shown in Figures 16 through 23; Figures 26
through 37; and Figures 39 through 44 in bar chart format for easy data interpretation.
Static Bending
Figure 16 shows Company IV measured the highest stiffness in edgewise parallel
of 749,859 psi, which was approximately 19% higher than Company I HD, 27% higher
than Company II, 30% higher than Company I RD, and 34% higher than Company III.
Figure 17 shows Company IV measured the highest stiffness in flatwise parallel
of 1,007,213 psi, which was approximately 24% higher than Company II, 26% higher
than Company I RD, 27% higher than Company I HD, and 31% higher than Company
III.
Figure 18 shows Company IV measured the highest stiffness edgewise cross of
506,551 psi, which was approximately 11% higher than Company II, 19% higher than
Company I HD, 29% higher than Company III, and 38% higher than Company I RD.

12
Figure 19 shows Company IV measured the highest stiffness flatwise cross of
494,103 psi, which was approximately 14% higher than Company I HD, 25% higher than
Company III, 27% higher than Company I RD, and 38% higher than Company II.
Figure 20 shows Company IV measured the highest bending strength edgewise
parallel of 3,848 psi, which was approximately 15% higher than Company I HD, 22%
higher than Company III, 34% higher than Company II, and 36% higher than Company I
RD.
Figure 21 shows Company IV measured the highest bending strength flatwise
parallel of 4,756 psi, which was approximately 20% higher than Company III, 23%
higher than Company I HD, 35% higher than Company II, and 41% higher than
Company I RD.
Figure 22 shows Company IV measured the highest bending strength edgewise
cross of 2,842 psi, which was approximately 16% higher than Company I HD, 17%
higher than Company II & III, and 44% higher than Company I RD.
Figure 23 shows Company IV measured the highest bending strength flatwise
cross of 2,678 psi, which was approximately 10% higher than Company I HD, 14%
higher than Company III, 24% higher than Company II, and 40% higher than Company I
RD.
The modes of failure for the static bending sample were similar for all five
materials. Figures 24 and 25 show simple tension breaks for the static bending edgewise
and flatwise, respectively .
Screw Direct Withdrawal

13
Figure 26 shows Company II measured the highest end screw withdrawal strength
of 555 pounds, which was approximately 24% higher than Company I HD, 27% higher
than Company IV, 28% higher than Company III, and 39% higher than Company I RD.
Figure 27 shows Company I HD measured the highest face screw withdrawal
strength of 545 pounds, which was approximately 23% higher than Company IV, 29%
higher than Company II, 34% higher than Company III, and 41% higher than Company I
RD.
Figure 28 shows four materials (Company I HD, Company II, Company III, and
Company IV) measured the highest edge screw withdrawal strength, which was
approximately 22% higher than Company I RD.
The failure mode for screw withdrawal test was screw withdrawal from the
material.
Staple Direct Withdrawal
Figure 29 shows three materials (Company II, Company III, and Company IV)
measured the highest staple direct withdrawal strength from the end, which were
approximately 23% higher than Company I HD and 38% higher than Company I RD.
Figure 30 shows three materials (Company I HD, Company II, and Company IV)
measured the highest staple direct withdrawal strength from the edge, which were
approximately 14% higher than Company III and approximately 26% higher than
Company I RD.
Figure 31 shows four materials (Company I HD, Company II, Company III, and
Company IV) measured the highest staple direct withdrawal strength from the face,
which was approximately 20% higher than Company I RD.

14
Staple Lateral Withdrawal
End and Edge Surface - Figure 32 shows Company III measured the highest staple
lateral withdrawal strength from the end, which was 12% higher than Company IV, 17%
higher than Company I HD, 20% higher than Company II, and 33% higher than
Company I RD. The staple joint was loaded parallel to thickness of fastening member.
Figure 33 shows four materials (Company I HD, Company II, Company III, and
Company IV) measured the highest staple lateral withdrawal strength from the end,
which was 24% higher than Company I RD. The staple joint was loaded parallel to
thickness of fastening member.
Figure 34 shows Company II measured higher staple lateral withdrawal strength
from the end, which was approximately 12% higher than Company IV, 21% higher than
Company I HD, and 38% higher than Company I RD. The staple joint was loaded
perpendicular to thickness of the fastening member.
Figure 35 shows Company IV measured higher staple lateral withdrawal strength
from the edge, which was 8% higher than Company II and 24% higher than Company I
RD. The staple joint was loaded perpendicular to the thickness of the fastening member.
Face Surface - Figure 36 shows two materials (Company III and Company IV) measured
the highest staple lateral withdrawal strength from the face, which were more than 12%
higher than Company II and 25% higher than Company I RD. The staple was inserted
through the face material cut parallel to the 8’ direction.
Figure 37 shows Company IV measured the highest staple lateral withdrawal
strength from the face, which was 8% higher than Company I HD, 14% higher than

15
Companies II & III, and 24% higher than Company I RD. The staple was inserted
through the face material cut perpendicular to the 8’ direction.
The modes of failure for the staple direct and lateral withdrawal test was mainly
staple withdrawal from the material. In some cases the material failed during the staple
lateral withdrawal test on end or edge when loaded parallel to the fastening member
thickness (Figure 38).
Glue Bonding Strength
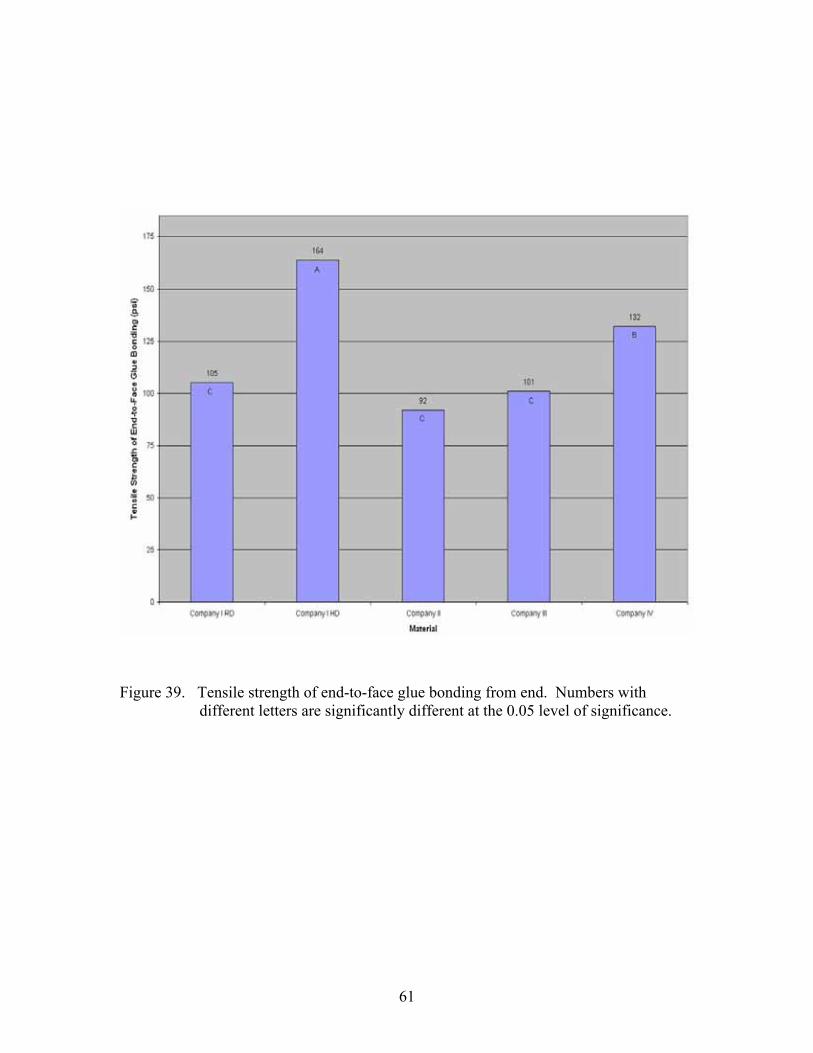
Figure 39 shows Company I HD measured the highest tensile strength of glue
bonding from end, which was 20% higher than Company IV, 36% higher than Company
I RD, 38% higher than Company III, and 44% higher than Company II.
Figure 40 shows two materials (Company I RD and Company IV) measured the
highest tensile strength of glue bonding from face, which was 9% higher than Company I
HD, 11% higher than Company II, and 28% higher than Company III.
Figure 41 shows Company I HD measured the highest parallel shear strength of
glue bonding from end, which was 21% higher than Company II, 29% higher than
Company IV, 34% higher than Company III, and 43% higher than Company I RD.
Figure 42 shows three materials (Company I RD, Company III, and Company IV)
measured the highest perpendicular shear strength of glue bonding from end, which were
30% higher than Company I HD and 49% higher than Company II.
Figure 43 shows Company IV measured the highest parallel shear strength of glue
bonding from face, which was 15% higher than Company I HD and Company III, 30%
higher than Company I RD, and 32% higher than Company II.

16
Figure 44 shows three materials (Company I HD, Company III, and Company IV)
measured the highest perpendicular shear strength of glue bonding from face, which was
approximately 24% higher than Company I RD and Company II.
The main mode of failure for the glue bonding test was material failure. All of
the material showed good surface to glue bonding. Figure 45 shows a face to face sample
tested for lateral withdrawal. Figure 46 shows the end to face sample tested in lateral
withdrawal when loaded parallel.
Toughness
Figures 47 shows Company I HD measured the highest parallel edge toughness,
which was 33% higher than Company IV, 40% higher than Company II, 44% higher than
Company I RD, and 49% higher than Company III.
Figures 48 shows Company I HD measured the highest parallel flat toughness,
which was 33% higher than Company IV, 41% higher than Company III and Company
II, and 44% higher than Company I RD.
Figure 49 shows Company I HD measured the highest cross edge toughness,
which was 35% higher than Company II, 39% higher than Company III, 43% higher than
Company IV, and 49% higher than Company I RD.
Figure 50 shows Company I HD measured the highest cross flat toughness, which
was 35% higher than Company II, 38% higher than Company IV and Company III, and
50% higher Company I RD.
Tension Perpendicular to the Face (Internal Bond)
Figure 51 shows the results of the internal bond test. Three materials (Company I
HD, Company III, and Company IV) measured the highest internal bond strength.

17
Company I RD measured the lowest internal bond strength at 46 psi, which was more
than 27% less than the other materials.
Panel Density Measurements
Figure 52 shows the average measured density of the panels. Figures 53 through
57 show a density profile of a section of one panel for each material. A 2” x 48” strip
was cut from the center of each panel. The strip was cut perpendicular to the 8’ direction.
From this 2” x 48” strip, three 2” x 2” blocks were made. Two blocks from the ends of
the strip and one block from the middle of the strip. The only panel that showed a
different type of behavior from the other panels was from Company II (Figure 55). There
was not a big difference in the density on the face of the 2” x 2” block as compared to the
center portion of the block.
Conclusions
No one company produced a product that outperformed the other companies for
all the tested properties. The mechanical properties of the materials from the four
companies differed significantly. Overall the companies can be ranked in the following
order (1) Company IV; (2) Company I (High Density (HD)); (3) Companies II & III; (4)
Company I (Regular Density (RD)).
Because of the amount of variability in the properties, the furniture company must
work closely with their supplier to determine the mechanical properties of their purchased
product. Furniture companies also need an understanding of which OSB property is most
important for their particular application because of the variability of the performance of
individual properties within a material. The Franklin Furniture Institute at Mississippi

18
State University has the expertise and test facility to assist a furniture company in
indentifying which OSB property is important to their frame performance.
REFERENCES
American Soc. For Testing and Materials (ASTM). 2008. Standard test methods for small clear specimens of timber. ASTM D 143-94. ASTM. West Conshohocken, Pennsylvania. American Soc. For Testing and Materials (ASTM). 2008. Standard test methods for evaluating properties of wood-base fiber and particle panel materials. ASTM D 1037-96a. ASTM. West Conshohocken, Pennsylvania. American Soc. For Testing and Materials (ASTM). 2008. Standard test methods for Mechanical fasteners in wood. ASTM D 1761-88. ASTM. West Conshohocken, Pennsylvania. American Soc. For Testing and Materials (ASTM). 2008. Standard test methods for specific gravity of wood and wood-base materials. ASTM D 2395-93. ASTM. West Conshohocken, Pennsylvania.
American Soc. For Testing and Materials (ASTM). 2008. Standard methods of testing structural panels in flexure. ASTM D 3043-95. ASTM. West Conshohocken, Pennsylvania. American Soc. For Testing and Materials (ASTM). 2008. Standard test methods for direct moisture content measurements of wood and wood-base materials. ASTM D 4442-92. ASTM. West Conshohocken, Pennsylvania. American Soc. For Testing and Materials (ASTM). 2008. Standard test methods for mechanical properties of lumber and wood-base structural material. ASTM D 4761- 96. ASTM. West Conshohocken, Pennsylvania.

19
Figure 1. Cutting pattern used for cutting test samples. Specimens were cut parallel to 8’ direction and also perpendicular to 8’ direction.

20
Figure 2. Setup for conducting the flatwise bending tests on the materials.

21
Figure 3. Setup for conducting the edgewise bending tests on the materials.

22
Figure 4. Setup for tension perpendicular to grain test (Internal Bond).

23
Figure 5. Setup for screw direct withdrawal from face.

24
Figure 6. Setup for screw direct withdrawal from end.

25
Figure 7. Setup for screw direct withdrawal from edge.

26
(a) (b)
Figure 8. General specimen configurations for evaluating material direct withdrawal resistances to staple from (a) face and (b) end or edge of testing block.
Fastened member
Fastening member
\

27
Figure 9. Setup for staple direct withdrawal from face and face-to-face glue bonding tensile.

28
Figure 10. Setup for staple direct withdrawal from end or edge and end-to-face glue bonding tensile.

29
(a) (b) (c)
Figure 11. General specimen configurations for evaluating material lateral withdrawal resistances to staple from a) end or edge, parallel loading, b) end or edge, perpendicular loading, and c) face of testing block.
3”
30
Figure 12. Setup for staple end or edge lateral withdrawal and lateral strength of glue bonding end-to-face (test specimens are loaded perpendicular to thickness of fastening member).

31
Figure 13. Setup for staple end or edge lateral withdrawal and lateral strength of glue bonding end-to-face (test specimens are loaded parallel to thickness of fastening member).

32
Figure 14. Setup for staple face lateral withdrawal and lateral strength of glue face-to- face bonding.

33
Figure 15. Setup for toughness test.

34
Table 1. Summary of the measured properties for the five materials tested.1,2 Material Property Company
I RD Company
I HD Company
II Company
III Company
IV
1. Bending Stiffness Edgewise (Parallel) (psi)
521,514 CD (8.9)
607,435 B (13.8)
549,024 C (15.6)
492,059 D (5.0)
749,859 A (16.0)
2. Bending Stiffness Flatwise (Parallel) (psi)
747,173 B (9.7)
739,778 B (13.3)
769,191 B (16.2)
692,090 C (8.1)
1,007,213 A (9.8)
3. Bending Stiffness Edgewise (Cross) (psi)
314,103 E (8.0)
409,218 C (10.0)
450,760 B (10.0)
360,754 D (6.0)
506,551 A (6.0)
4. Bending Stiffness Flatwise (Cross) (psi)
358,277 C (9.7)
424,299 B (14.6)
308,781 D (8.1)
372,888 C (8.0)
494,103 A (6.8)
5. Bending Strength Edgewise (Parallel) (psi)
2,470 D (18.0)
3,279 B (18.1)
2,529 D (21.2)
3,000 C (14.8)
3,848 A (15.6)
6. Bending Strength Flatwise (Parallel) (psi)
2,827 C (20.0)
3,650 B (18.1)
3,098 C (28.4)
3,809 B (14.5)
4,756 A (17.1)
7. Bending Strength Edgewise (Cross) (psi)
1,580 C (13.1)
2,374 B (16.0)
2,365 B (18.5)
2,362 B (15.1)
2,842 A (13.0)
8. Bending Strength Flatwise (Cross) (psi)
1,614 D (21.7)
2,415 B (17.2)
2,047 C (13.6)
2,312 B (17.6)
2,678 A (15.5)
9. Screw Direct Withdrawal End (lbs)
336 C (23.3)
423 B (21.4)
555 A (21.1)
397 B (14.1)
403 B (17.6)
10. Screw Direct Withdrawal Face (lbs)
322 D (19.5)
545 A (16.2)
388 BC (20.5)
360 C (15.2)
419 B (17.2)
11. Screw Direct Withdrawal Edge (lbs)
347 B (19.7)
475 A (26.1)
459 A (18.3)
444 A (15.5)
447 A (20.3)
12. Staple Withdrawal End to Face Direct (lbs)
109 C (26.1)
135 B (31.6)
188 A (26.6)
186 A (22.3)
175 A (36.3)
13. Staple Withdrawal Edge Direct (lbs)
134 B (31.0)
180 A (25.9)
191 A (37.2)
154 B (26.0)
200 A (15.6)
14. Staple Withdrawal Face Direct (lbs)
177 C (26.9)
221 B (55.8)
254 AB (26.5)
272 A (18.8)
236 AB (17.7)
15. Staple Withdrawal End Lateral Parallel (lbs)
117 C (23.6)
146 B (25.0)
140 B (21.6)
175 A (25.3)
154 B (25.0)
16. Staple Withdrawal Edge Lateral Parallel (lbs)
127 B (26.4)
172 A (23.2)
182 A (18.0)
167 A (26.2)
175 A (33.2)
17. Staple Withdrawal End Lateral Perpendicular (lbs)
113 D (21.0)
144 C (16.3)
182 A (20.6)
174 AB (13.4)
160 B (21.4)
18. Staple Withdrawal Edge Lateral Perpendicular (lbs)
131 C (16.0)
168 AB (14.0)
157 B (28.9)
163 AB (13.2)
172 A (17.5)
19. Staple Withdrawal Face to Face Lateral Parallel (lbs)
226 C (22.5)
289 AB (16.0)
268 B (22.3)
316 A (24.2)
303 A (12.9)
20. Staple Withdrawal Face to Face Lateral Perpendicular (lbs)
244 C (18.4)
293 B (22.5)
275 B (16.2)
276 B (16.8)
321 A (19.4)
21. Tensile Strength of End-to-Face Glue Bonding (psi)
105 C (25%)
164 A (17%)
92 C (25%)
101 C (29%)
132 B (22%)
22. Tensile Strength of Face-to-Face Glue Bonding (psi)
49 A (21%)
42 B (20%)
41 B (22%)
33 C (21%)
46 A (18%)
23. Parallel Shear Strength of End-to- Face Glue Bonding (psi)
145 D (23%)
255 A (18%)
201 B (25%)
169 C (23%)
182 BC (26%)
24. Perpendicular Shear Strength of End-to-Face Glue Bonding (psi)
396 A (15%)
297 B (21%)
196 C (44%)
390 A (15%)
385 A (20%)

35
Table 1. (Continued)
Material Property Company I RD
Company I HD
Company II
Company III
Company IV
25.
Parallel Shear Strength of Face-to-Face Glue Bonding (psi)
207 C (16%)
250 B (14%)
202 C (18%)
250 B (13%)
295 A (16%)
26. Perpendicular Shear Strength of Face-to-Face Glue Bonding (psi)
167 D (21%)
230 AB (19%)
163 D (17%)
217 B (14%)
237 A (13%)
27. Toughness (Edge) (Parallel)(in-lb) 38.0 D (18.8)
70.0 A (5.7)
42.3 C (13.3)
35.7 D (12.5)
47.2 B (17.2)
28. Toughness (Flat) (Parallel) (in-lb) 41.7 C (15.4)
74.5 A (11.2)
43.0 C (20.6)
43.8 C (21.6)
49.8 B (20.3)
29. Toughness (Edge) (Cross) (in-lb) 29.7 D (11.7)
58.4 A (8.4)
38.2 B (13.8)
35.8 BC (16.8)
33.5 C (11.1)
30. Toughness (Flat) (Cross) (in-lb) 29.2 C (11.6)
57.9 A (12.3)
37.5 B (19.1)
35.4 B (14.1)
35.9 B (10.4)
31. Internal Bond (psi) 46 D (16.9)
86 B (20.4)
63 C (34.2)
91 AB (16.3)
98 A (28.9)
32. Density (lbs /cu ft) 40.6 C (6.9)
46.5 A (5.4)
43.4 B (6.4)
45.6 A (5.4)
46.4 A (5.3)
33. Moisture Content (%) 4.9 (17%)
6.4 (10%)
5.8 (12%)
6.3 (4%)
4.5 (11%)
34. Thickness (inches) 0.7300 (1%)
0.7852 (2%)
0.7195 (1%)
0.7154 (1%)
0.7265 (2%)
1Values in parenthesis are coefficients of variation values 2Results of comparison-of-means tests (LSD). Mean values with different letters differed significantly at the 0.05 level.

36
Table 2. 5th percentile values of the measured mechanical properties for the five materials.
Material Property Company I RD
Company I HD
Company II
Company III
Company IV
1. Bending Stiffness Edgewise (Parallel) (psi) 444,847 469,675 408,492 451,413 552,827
2. Bending Stiffness Flatwise (Parallel) (psi) 627,778 577,801 563,878 599,650 845,177
3. Bending Stiffness Edgewise (Cross) (psi) 270,442 344,971 376,526 326,114 456,668
4. Bending Stiffness Flatwise (Cross) (psi) 301,053 322,741 267,847 323,609 438,937
5. Bending Strength Edgewise (Parallel) (psi) 1,737 2,300 1,648 2,269 2,862
6. Bending Strength Flatwise (Parallel) (psi) 1,899 2,564 1,651 2,898 3,414
7. Bending Strength Edgewise (Cross) (psi) 1,239 1,748 1,645 1,773 2,231
8. Bending Strength Flatwise (Cross) (psi) 1,039 1,730 1,588 1,642 1,995
9. Screw Direct Withdrawal End (lbs) 208 274 362 305 287
10. Screw Direct Withdrawal Face (lbs) 218 399 257 270 300
11. Screw Direct Withdrawal Edge (lbs) 234 271 320 331 298
12. Staple Withdrawal End Direct (lbs) 62 65 105 118 70
13. Staple Withdrawal Edge Direct (lbs) 66 103 75 88 147
14. Staple Withdrawal Face Direct (lbs) 99 18 143 188 167
15. Staple Withdrawal End Lateral Parallel (lbs) 74 105 120 136 103
16. Staple Withdrawal Edge Lateral Parallel (lbs) 73 107 128 96 80
17. Staple Withdrawal End Lateral Perpendicular (lbs) 72 86 90 102 91
18. Staple Withdrawal Edge Lateral Perpendicular (lbs) 97 169 82 128 121
19. Staple Withdrawal Face Lateral Parallel (lbs) 142 213 170 190 238
20. Staple Withdrawal Face Lateral Perpendicular (lbs) 170 184 202 200 219
21. Tensile Strength of End-to-Face Glue Bonding (psi) 62 118 54 53 84
22. Tensile Strength of Face-to-Face Glue Bonding (psi) 32 28 26 22 32
23. Parallel Shear Strength of End-to- Face Glue Bonding (psi) 90 179 118 105 104
24.
Perpendicular Shear Strength of End-to-Face Glue Bonding (psi) 298 194 54 294 258

37
Table 2. (Continued)
Material Property Company I RD
Company I HD
Company II
Company III
Company IV
25.
Parallel Shear Strength of Face-to-Face Glue Bonding (psi) 153 192 142 197 217
26. Perpendicular Shear Strength of Face-to-Face Glue Bonding (psi) 109 158 117 167 186
27. Toughness (Edge) (Parallel) (in-lb) 26 63 33 29 34 28. Toughness (Flat) (Parallel) (in-lb) 31 61 28 28 32 29. Toughness (Edge) (Cross) (in-lb) 24 51 29 26 27 30. Toughness (Flat) (Cross) (in-lb) 23 46 26 27 30 31. Internal Bond (psi) 33 58 56 67 51

38
Figure 16. MOE(edgewise) of materials tested parallel to 8’ direction. Numbers with different letters are significantly different at the 0.05 level of significance.

39
Figure 17. MOE(flatwise) of materials tested parallel to 8’ direction. Numbers with different letters are significantly different at the 0.05 level of significance.

40
Figure 18. MOE(edgewise) of materials tested perpendicular to 8’ direction. Numbers with different letters are significantly different at the 0.05 level of significance.

41
Figure 19. MOE(flatwise) of materials tested perpendicular to 8’ direction. Numbers with different letters are significantly different at the 0.05 level of significance.

42
Figure 20. MOR(edgewise) of materials tested parallel to 8’ direction. Numbers with different letters are significantly different at the 0.05 level of significance.

43
Figure 21. MOR(flatwise) of materials tested parallel to 8’ direction. Numbers with different letters are significantly different at the 0.05 level of significance.

44
Figure 22. MOR(edgewise) of materials tested perpendicular to 8’ direction. Numbers with different letters are significantly different at the 0.05 level of significance.

45
Figure 23. MOR(flatwise) of materials tested perpendicular to 8’ direction. Numbers with different letters are significantly different at the 0.05 level of significance.

46
Figure 24. Tension side of a test sample, splinting tension was the major failure mode for the edgewise bending test on all five materials.

47
Figure 25. Simple tension was the major mode of failure for the flatwise bending test for all five materials.

48
Figure 26. Screw direct withdrawal strength from end (screw inserted parallel to the 8’ direction). Numbers with different letters are significantly different at the 0.05 level of significance.

49
Figure 27. Screw direct withdrawal strength from face direction. Numbers with different letters are significantly different at the 0.05 level of significance.

50
Figure 28. Screw direct withdrawal strength from edge (screw inserted perpendicular to the 8’ direction). Numbers with different letters are significantly different at the 0.05 level of significance.

51
Figure 29. Staple direct withdrawal resistance from end. Numbers with different letters are significantly different at the 0.05 level of significance.

52
Figure 30. Staple direct withdrawal resistance from edge. Numbers with different letters are significantly different at the 0.05 level of significance.

53
Figure 31. Staple direct withdrawal resistance from face. Numbers with different letters are significantly different at the 0.05 level of significance.

54
Figure 32. Staple lateral parallel withdrawal resistance from end. Joints loaded parallel to the thickness direction of fastened member. Numbers with different letters are significantly different at the 0.05 level of significance.

55
Figure 33. Staple lateral parallel withdrawal resistance from edge. Joints loaded parallel to the thickness direction of fastened member. Numbers with different letters are significantly different at the 0.05 level of significance.

56
Figure 34. Staple lateral perpendicular withdrawal resistance from end. Joints loaded perpendicular to the thickness direction of fastened member. Numbers with different letters are significantly different at the 0.05 level of significance.

57
Figure 35. Staple lateral perpendicular withdrawal resistance from edge. Joints loaded perpendicular to thickness direction of fastened member. Numbers with different letters are significantly different at the 0.05 level of significance.

58
Figure 36. Staple lateral parallel withdrawal resistance from face (staple inserted through face material cut parallel to 8’ direction). Numbers with different letters are significantly different at the 0.05 level of significance.

59
Figure 37. Staple lateral perpendicular withdrawal resistance from face (staple inserted through face material cut perpendicular to 8’ direction). Numbers with different letters are significantly different at the 0.05 level of significance.

60
Figure 38. A major mode of failure for the end or edge staple lateral withdrawal when loaded parallel to the fastening member thickness was material failure.
61
Figure 39. Tensile strength of end-to-face glue bonding from end. Numbers with different letters are significantly different at the 0.05 level of significance.

62
Figure 40. Tensile strength of face-to-face glue bonding from face. Numbers with different letters are significantly different at the 0.05 level of significance.

63
Figure 41. Glue bonding parallel shear strength of end-to-face. Joints loaded parallel to thickness direction of fastened member. Numbers with different letters are significantly different at the 0.05 level of significance.

64
Figure 42. Glue bonding perpendicular shear strength of end-to-face. Joints loaded perpendicular to thickness direction of fastened member. Numbers with different letters are significantly different at the 0.05 level of significance.

65
Figure 43. Parallel shear strength of face-to-face glue bonding (material glued to face material cut parallel to the 8’ direction). Numbers with different letters are significantly different at the 0.05 level of significance.

66
Figure 44. Perpendicular shear strength of face-to-face glue bonding (material glued to face material cut perpendicular to the 8’ direction). Numbers with different letters are significantly different at the 0.05 level of significance.

67
Figure 45. Material failure was the major mode of failure for the glue bonding of face to face joints when tested for lateral withdrawal.

68
Figure 46. Material failure was the major mode of failure for the glue bonding of end to face joints when tested parallel to the thickness of the joint specimen.

69
Figure 47. Edge parallel toughness of specimens cut with their length parallel to 8’ direction. Numbers with different letters are significantly different at the 0.05 level of significance.

70
Figure 48. Flat parallel toughness of specimens cut with their length parallel to 8’ direction. Numbers with different letters are significantly different at the 0.05 level of significance.

71
Figure 49. Edge cross toughness of specimens with their length cut perpendicular to 8’ direction. Numbers with different letters are significantly different at the 0.05 level of significance.

72
Figure 50. Flat cross toughness of specimens with their length cut perpendicular to 8’ direction. Numbers with different letters are significantly different at the 0.05 level of significance.

73
Figure 51. Internal bond strength. Numbers with different letters are significantly different at the 0.05 level of significance.

74
Figure 52. Average density of OSB materials tested.

75
Figure 53. Density profile of Company I RD Panel from three different positions (two positions on the edge and one position in the middle of the panel.

76
Figure 54. Density profile of Company I HD Panel for three different positions (two positions on the edge and one position in the middle of the panel.

77
Figure 55. Density profile of Company II panel from three different positions (two positions on the edge and one position in the middle of the panel.

78
Figure 56. Density profile of Company II panel from three different positions (two positions on the edge and one position in the middle of the panel.

79
Figure 57. Density profile of Company IV panel from three different positions (two positions on the edge and one position in the middle of the panel.