report # matc-unl: 221 final report
TRANSCRIPT
®
The contents of this report reflect the views of the authors, who are responsible for the facts and the accuracy of the information presented herein. This document is disseminated under the sponsorship of the Department of Transportation
University Transportation Centers Program, in the interest of information exchange. The U.S. Government assumes no liability for the contents or use thereof.
Assessing the Risk of Crash for Trucks on Onset Yellow
Report # MATC-UNL: 221 Final Report
Anuj Sharma, Ph.D.Assistant ProfessorDepartment of Civil, Environmental, and Architectural EngineeringUniversity of Nebraska-Lincoln
Nathaniel P. BurnettGraduate Research Assistant
2012
A Cooperative Research Project sponsored by the U.S. Department of Transportation Research and Innovative Technology Administration
25-1121-0001-221
Assessing the Risk of Crash for Trucks on Onset Yellow
Anuj Sharma, Ph.D.
Assistant Professor
Department of Civil, Environmental, and Architectural Engineering
University of Nebraska–Lincoln
Nathaniel P. Burnett
Graduate Research Assistant
Department of Civil, Environmental, and Architectural Engineering
University of Nebraska–Lincoln
A Report on Research Sponsored by
Mid-America Transportation Center
University of Nebraska–Lincoln
July 2012

ii
Technical Report Documentation Page
1. Report No.
25-1121-0001-221
2. Government Accession No.
3. Recipient's Catalog No.
4. Title and Subtitle
Assessing the Risk of Crash for Trucks on Onset Yellow
5. Report Date
July 2012
6. Performing Organization Code
7. Author(s)
Anuj Sharma and Nathaniel P. Burnett
8. Performing Organization Report No.
25-1121-0001-221
9. Performing Organization Name and Address
Mid-America Transportation Center
2200 Vine St.
PO Box 830851
Lincoln, NE 68583-0851
10. Work Unit No. (TRAIS)
11. Contract or Grant No.
12. Sponsoring Agency Name and Address
Research and Innovative Technology Administration
1200 New Jersey Ave., SE
Washington, D.C. 20590
13. Type of Report and Period Covered
Final Report August 2001-July 2010
14. Sponsoring Agency Code
MATC TRB RiP No. 18458
15. Supplementary Notes
16. Abstract
Each day, millions of signal changes to the yellow phase occur at isolated high speed intersections, when erroneous
driver decisions to stop or go may often lead to a crash. Dilemma zone protection systems are typically used to control
these intersections in order to ensure the safe and efficient movement of vehicles. However, traditional dilemma zone
protection systems show deterioration in performance during medium to heavy traffic volume conditions, jeopardizing
both the safety and efficiency of intersections. The performance of these control systems for heavy vehicles is even
more greatly affected, as traditional dilemma zone boundaries were developed for passenger vehicles. Research
conducted by the authors found that to have the same level of protection as passenger vehicles, heavy vehicles needed
to be protected for twice as long. The traditional surrogate measure of safety, the dilemma zone, marks the region of
risk at high speed intersections, but does not quantify the level of risk, which is essential from an economic framework.
In the current study, an improved surrogate measure of safety, the dilemma hazard function, was developed by
expanding the existing measure of safety, utilizing the concept of traffic conflict. The probability of traffic conflict
defined the dilemma hazard function, which was used to quantify safety benefits for high speed intersections. A
behavioral model was used to develop the dilemma hazard function for passenger vehicles and heavy vehicles using
data collected at a typical high speed intersection site in Noblesville, Indiana. The advent of advanced wide area
detector technology made it feasible to assume that the dilemma hazard function could be developed for each site,
hence, barring the need for a search for a universal dilemma hazard function.
17. Key Words
Anxiety, Stress, Stressors, Traffic, Vehicle
18. Distribution Statement
19. Security Classif. (of this report)
Unclassified
20. Security Classif. (of this page)
Unclassified
21. No. of Pages
59
22. Price
iii
Table of Contents
Acknowledgments vii
Disclaimer viii
Abstract ix
Chapter 1 Introduction and Research Objectives 1
Chapter 2 Literature Review 5
2.1 Introduction 5
2.2 Defining Dilemma Zone Boundaries 5
2.3 Surrogate Measure of Safety Using Stop and Go Probabilities 7
2.4 Surrogate Measure using Fuzzy Based Approach 11
2.5 Yellow Phase Duration and Driver Behavior 14
2.6 Methods of Dilemma Zone Mitigation 15
2.6.1 The Green Extension Method 15
2.6.2 The Green Termination Algorithm Method 21
2.6.3 The D-CS System 21
2.6.4 The Self-Optimizing Signal Control (SOS) Method 23
2.6.5 Wavetronix SmartSensor Advance 23
2.7 Quantifying the Risk of Traffic Conflict 24
2.7.1 The Traffic Conflict Technique as a Surrogate Measure of Safety 26
2.7.2 Defining Traffic Conflicts at the Onset of Yellow 27
2.8 Modeling the Dilemma Zone Hazard for Passenger and Heavy Vehicles 28
2.9 Summary 30
Chapter 3 Development of Vehicle Based Dilemma Hazard Function 31
3.1 Traffic Conflict at the Onset of Yellow 28
3.2 Field Data Collection and Validation 30
3.3 Driver Decision Making at the Onset of Yellow 35
3.4 Theory of Drivers’ Perceived Conflict Resulting in Minor and Severe
Traffic Conflicts 40
3.5 Cost of Delay Associated with Extension of Green Phase of the High
Speed Approach 42
3.6 Safety Benefits 44
3.7 Calculation Dynamic Dilemma Protection Boundaries 45
3.8 Synthesis 49
Chapter 4 Conclusion and Recommendations 50
4.1 Wide area detector 50
4.2 Feasibility of Implementation of a Prototype Adaptive Sensor 50
4.2.1 Cost of Implementation 50
4.2.2 Special Controller 50
4.2.3 Technical Expertise Needed to Program the Sensor 50
4.2.4 Feasibility of the Development of Such a Sensor 51
4.3 Conclusion 52
4.4 Future Research 54
References 55
iv
List of Figures
Figure 2.1 Illustration of simultaneous gap-out logic 17
Figure 2.2 Comparison of traditional and proposed surrogate measures of safety 25
Figure 2.3 Dilemma hazard curves for various yellow and all-red
clearance intervals (Li 2009) 29
Figure 3.1 Driver decision processes at the onset of yellow 29
Figure 3.2 Data collection at SR 37 and SR 32 in Noblesville, Indiana 32
Figure 3.3 Example comparison between WAD and GPS 33
Figure 3.4 Cumulative speed distribution of heavy vehicles and passenger vehicles
at the onset of yellow 34
Figure 3.5 Histogram of passenger vehicles and heavy vehicles observed at a given
time from the stop bar 35
Figure 3.6 Probability density function for perceived time to stop bar 36
Figure 3.7 Probability of stopping curve for passenger vehicles and heavy vehicles
for the test site 39
Figure 3.8 Dilemma hazard function for passenger vehicles and heavy vehicles 41
Figure 3.9 Increase in delay of the standing queue due to vehicle extension 43
Figure 3.10 Dynamic dilemma zone boundaries for a passenger vehicle 48

v
List of Tables
Table 2.1 Dilemma zone boundaries 8
Table 3.1 Probit model for probability of stopping 39
Table 3.2 Time to stop bar based probit model for stop and go decisions 40
Table 3.3 Estimation of Cost Associated with a Traffic Conflict of passenger vehicles 45
vi
List of Abbreviations
American Society of Civil Engineers (ASCE)
Dilemma Zone Protection (DPZ)
Mid-America Transportation Center (MATC)
National Highway Traffic Safety Administration (NHTSA)
Red Light Running (RLR)
Root Mean Square Error (RMSE)
Time to Intersection (TTI)
Traffic Conflict Technique (TCT)
Wide Area Detector (WAD)

vii
Acknowledgments
The research team would like to thank the Nebraska Department of Roads (especially
Kent Wohlers, Bob Malquist, and Matt Neeman), and the City of Lincoln Public Works
Department (especially Josh Meyers and Larry Jochum). We are grateful to Brad Giles from
Wavetronix, who guided us through the proper setup of the detectors to enable data acquisition at
the test sites, and who helped to generate custom codes for data collection. Thanks also go out to
the business team at the Mid-America Transportation Center (MATC), who contributed to the
project by arranging transportation and providing technical support.
viii
Disclaimer
The contents of this report reflect the views of the authors, who are responsible for the
facts and the accuracy of the information presented herein. This document is disseminated under
the sponsorship of the U.S. Department of Transportation’s University Transportation Centers
Program, in the interest of information exchange. The U.S. Government assumes no liability for
the contents or use thereof.

ix
Abstract
Each day, millions of signal changes to the yellow phase occur at isolated high speed
intersections, when erroneous driver decisions to stop or go may often lead to a crash. Dilemma
zone protection systems are typically used to control these intersections in order to ensure the
safe and efficient movement of vehicles. However, traditional dilemma zone protection systems
show deterioration in performance during medium to heavy traffic volume conditions,
jeopardizing both the safety and efficiency of intersections. The performance of these control
systems for heavy vehicles is even more greatly affected, as traditional dilemma zone boundaries
were developed for passenger vehicles. Research conducted by the authors found that to have the
same level of protection as passenger vehicles, heavy vehicles needed to be protected for twice
as long. The traditional surrogate measure of safety, the dilemma zone, marks the region of risk
at high speed intersections, but does not quantify the level of risk, which is essential from an
economic framework. In the current study, an improved surrogate measure of safety, the
dilemma hazard function, was developed by expanding the existing measure of safety, utilizing
the concept of traffic conflict. The probability of traffic conflict defined the dilemma hazard
function, which was used to quantify safety benefits for high speed intersections. A behavioral
model was used to develop the dilemma hazard function for passenger vehicles and heavy
vehicles using data collected at a typical high speed intersection site in Noblesville, Indiana. The
advent of advanced wide area detector technology made it feasible to assume that the dilemma
hazard function could be developed for each site, hence, barring the need for a search for a
universal dilemma hazard function.

1
Chapter 1 Introduction and Research Objectives
The cost of motor vehicle collisions in 2006 in the United States totaled nearly $230.6
billion (NHTSA 2007). According to data from the National Highway Traffic Safety
Administration (NHTSA) Fatality Analysis Reporting System, crashes caused by red light
running (RLR) resulted in an estimated 805 fatalities in 2005 (NHTSA 2006). A survey
conducted by the U.S. Department of Transportation and the American Trauma Society indicated
that 56% of Americans admit to running red lights (FHWA 2002).
At rural intersections, drivers sometimes travel at high speeds with the expectation of
proceeding through them without stopping. A driver approaching isolated intersections must
decide whether to stop or go at the onset of the yellow phase. An erroneous decision to go can
possibly lead to a right angle crash, and the wrong decision to stop could lead to a severe rear-
end crash. The “dilemma zone” is the area where the risk of stop or go decision making error is
high (Parsonson 1978).
There are approximately 300,000 signalized intersections in the United States (National
Impact Assessment Link 2007), of which about 16% are classified as operating with dilemma
zone protection (ITS Deployment Statistics 2004) to avoid drivers being present in the dilemma
zone at the onset of yellow. A typical intersection has approximately 700-800 instances of main-
street phase terminations for each approach per day. Therefore, 68 million instances occur per
day where a potentially incorrect driver decision can be made at the onset of yellow. To mitigate
the risk associated with dilemma zones, many intersections employ specialized traffic control
systems called dilemma zone protection systems. The two systems currently in place are the
green extension and green termination systems.
2
In green extension systems, the green phase of the high speed approach is extended until
there is no vehicle in the dilemma zone. An upper threshold, maximum green time, is provided
for this operation to avoid excessive delays to the cross street traffic. Engineering judgment is
used to determine the value of the maximum green time. This is an “all-or-nothing” approach:
high speed vehicles are provided complete protection against dilemma zone incursions before the
maximum green is reached, but if the maximum green is reached, no protection is provided.
Green extension systems have been widely implemented in the field for the past four decades.
These systems operate efficiently during low volume conditions, but are inefficient and unsafe
during medium to heavy volume conditions because of an increased number of max-outs. A
detailed discussion of the operation of a green extension system is provided in chapter 2.
Green termination systems are relatively new, and they exist at only a few intersections
as a proof of concept and for evaluation purposes. These systems attempt to identify an
appropriate time to end the green phase by predicting the value of a performance function for the
near future. This performance function is based on the number of vehicles present in the dilemma
zone and the opposing queue. The objective is to minimize the number of vehicles in the
dilemma zone. These systems have not been implemented on a large scale; therefore, limited
quantitative data exists regarding the trade-off between efficiency, cost, and sensor requirements.
The dilemma zone protection systems currently in place at high speed intersections were
designed around the passenger vehicle dilemma zone. Passenger vehicles braking systems are
required by federal law to sustain a deceleration rate of a minimum of 14 ft/s2, while braking
systems for trucks are required to have a deceleration rate of 21 ft/s2, meaning that trucks require
50% more stopping distance (Federal Motor Carrier Safety Regulations 2005) and take more
time to stop. Moreover, trucks require more time to accelerate at the onset of green. These

3
performance characteristics are a possible influence on driver stop/go decision making at the
onset of the yellow phase.
The literature reveals flaws in approaches that are designed solely upon measuring the
dilemma zone boundaries for trucks. Using real-time simulation to analyze an extended truck
dilemma zone, Karl Zimmerman (2007) demonstrated that an addition of 1.5 s of upstream time
to the dilemma zone of passenger vehicles (resulting in a dilemma zone 2.5-5.5 s from the stop
line) was associated with a reduction of the number of heavy vehicles in the dilemma zone.
Zimmerman also found a dilemma zone boundary of 3-8.2 s from the stop line for heavy
vehicles—nearly twice the 3.5-6 s dilemma zone boundary for passenger vehicles.
Though dilemma zone boundaries are determined using a sound stochastic concept, the
definition of dilemma zone boundaries is limited in that it is inherently deterministic. It implies a
binary conceptualization in which drivers are deemed either at-risk or risk free—specifically,
vehicles within a probability of stopping range of 10-90% are automatically considered to be
unsafe, while any vehicle outside this area is deemed safe.
The dilemma zone is the traditional surrogate measure of intersection safety; yet, while
the dilemma zone marks the region of risk, it does not quantify the level of risk. Sharma and
colleagues recently developed and proposed a new and improved surrogate measure of safety,
the dilemma hazard function (Sharma et al. 2007). This stochastic function estimates the
probability of traffic conflict of varying levels of severity at a specific spatial location. The
current research presents the results of an effort to develop a dilemma hazard function for heavy
vehicles.
Following the current introductory chapter, chapter 2 reviews research pertaining to
dilemma zone definitions as they have developed over time, as well as methods of dilemma
4
hazard mitigation. Presented are historical and current methods utilized in attempts to model
driver behavior at high speed intersections upon the onset of yellow. Also described are the
current practices involved in assessing vehicle safety at approaching intersections. The
limitations of these practices are discussed.
In chapter 3, the different data collection sites and data collection setups are detailed.
This study used a combination of radar-based detection and video to monitor and track vehicles
as they approached a high speed intersection. In addition, this chapter discusses the steps used in
processing the video collected. The current theory underlying driver behavior at the approach of
a high speed intersection is also discussed. Using the probit modeling technique, the decision
process of drivers at the onset of yellow was modeled. As previously mentioned, traditional
surrogate measures of safety such as the dilemma zone denote the region of risk but do not
quantify the level of risk. A marginal cost-benefit approach for implementing the dilemma
hazard function to improve the safety and efficiency of intersection operation is also presented in
this chapter.
Chapter 4 summarizes the research findings and proposes future research steps.

5
Chapter 2 Literature Review
2.1 Introduction
This chapter reviews previous research on the development and progress of dilemma
zone definitions and mitigation methods. Previous and current methods utilized to model driver
behavior at high-speed intersections upon the onset of yellow are described, as are current
practices used in the assessment of vehicle safety upon approaching an intersection.
2.2 Defining Dilemma Zone Boundaries
Historically, the dilemma zone has been defined as the area where the driver can neither
stop comfortably nor clear the intersection safely at the onset of yellow. This approach (Gazis et
al. 1960; May 1968) uses deterministic design values, such as perception reaction time,
comfortable deceleration or acceleration rates, length of the yellow interval, etc., to determine
the location of the dilemma zone. The stopping and clearing distances for a vehicle can be
calculated using equations 2.1 and 2.2, respectively.
Any vehicle satisfying the criteria for stopping distance can come to a stop using a
comfortable deceleration as represented by the following equations.
20
2
0
2tV
d
VXs
(2.1)
Any vehicle satisfying the criterion for clearing distance can cross the stop line using
comfortable acceleration,
6
LtTa
TVXc 2
102
(2.2)
where,
Xs , Xc is the distance from stop line to when the amber phase commences, in ft;
0V is the approach speed in ft/s;
T is the amber phase duration in seconds;
L is the length of the vehicle in ft;
a is the acceleration rate in ft/s2;
d is the deceleration rate in ft/s2;
t1,t2 are the reaction times to accelerate and decelerate respectively, in seconds.
There are three possible scenarios based on the values of the stopping distance and
clearing distance.
Xs > Xc: There exists a dilemma zone (Xs > X > Xc) where a driver can neither stop
comfortably nor clear safely.
Xs = Xc: There exists no dilemma zone.
Xs < Xc: There exists an option zone (Xs < X < Xc) where a driver can both stop
comfortably or proceed safely.
One drawback of this approach is that it assumes a perfect knowledge of all variables.
Drivers, lack perfect knowledge, and only perceive variables, such as the distance from the stop
bar, yellow duration, etc. Another drawback is that there is no conversion metric that can convert
the presence of a vehicle in its dilemma zone to the magnitude of the risk of a crash. As a result,
7
this surrogate measure cannot effectively be used to compare the trade-off between safety and
efficiency of operations at intersections.
2.3 Surrogate Measure of Safety using Stop and Go Probabilities
Researchers characterized the surrogate measure of safety as the “decision dilemma
zone,” taking into account the variability in human perception. The decision dilemma zone is
defined as the approach area within which the probability of deciding to stop at the onset of
yellow is within the range of 10-90%. This zone is considered to have a higher risk for rear-end
collisions and red light violations, since drivers are not sure whether to proceed through the
intersection or to attempt to stop. Zeeger (1977) observed a 54% reduction in total crashes and a
75% reduction in rear-end crashes after implementing traffic control logic that prevented the
presence of any vehicle in the decision dilemma zone at the onset of the yellow phase.
There have been several attempts to characterize the dilemma zone boundaries (Olson
and Rothery 1962; Webster and Ellson 1965; ITE Technical Committee 1974; Zeeger 1977;
Sheffi and Mahmassani 1981; Chang et al. 1985; Bonneson et al. 1994). Initially, a frequency-
based approach was used to obtain the probability of stopping. The percentage of drivers
stopping at a given distance and speed was used to develop the cumulative distribution function.
Typically, distance and speed or time was used as a measure for decision dilemma zone
boundaries. Zeeger (1977) found that approximately 90% of traffic would stop if the passage
time to the stop line was 4.5-5 s or greater, while only 10% of traffic stopped when the passage
time to the stop line was less than 2-2.5 s. Bonneson et al. (1994) found that the beginning of the
dilemma zone was 5.0-6.0 s upstream, while the end was approximately 3.0 s upstream.
Researchers have observed significant variation in the dilemma zone boundaries obtained from

8
frequency-based methods. Table 2.1 (below) presents the observed ranges of dilemma zone
boundaries as reported by different researchers.
Binary discrete choice models were proposed to determine the probability of stopping at
a given distance and speed to provide a better understanding of the underlying human decision
models, and to explain the variation in the observed dilemma zone boundaries (Sheffi and
Mahmassani 1981; Chang et. al. 1985; Gates et al. 2007).
Table 2.1 Dilemma zone boundaries
Speed
(mph)
Distance of stop line, ft
Olson and
Rothery (1962)
Herman et al.
(1963)
Webster and
Ellson (1965)
ITE (1974)
Zeeger (1977)
Chang et al.
(1985)
Bonneson et al. (1994)
35 212* 218* 170* 212* 254 288 245
40 255 260 205 250 283 307 293
45 315* 315* 252* 300 325 326 343
50 375 370 300 350 350 345 396
55 - - 370* 400* 384 364 452
a) Beginning of dilemma zone (probability of stopping = 0.9)

9
Table 2.2 (cont’d.) Dilemma zone boundaries
Speed
(mph)
Distance of stop line, ft
Olson and
Rothery (1962)
Herman et al.
(1963)
Webster and
Ellson (1965)
ITE (1974)
Zeeger (1977)
Chang et al.
(1985)
Bonneson et al.
(1994)
35 103* 100* 103* 105* 103 128 145
40 110 110 125 110 121 147 178
45 165* 165* 155* 165 152 166 213
50 220 220 185 220 170 185 252
55 - - 230* 240* 232 204 294
* Interpolated values
b) End of dilemma zone (probability of stopping = 0.1)
Sheffi and Mahmassani (1981) used a probit construct to model driver decisions to stop
or go at the onset of yellow, hypothesizing that the travel time to the stop bar, T, as perceived by
a driver randomly selected from the population, was a random variable given by,
tT (2.3)
where,
t is the measured time to reach the stop bar at a constant current speed. The error term
is a random variable assumed to be normally distributed, ),0(~ 2
N .
10
If T is less than a critical value, Tcr, then the driver would choose to go. Critical time, Tcr,
was also modeled as a random variable to account for drivers’ levels of experience and
aggressiveness.
crcr tT (2.4)
where,
),0(~ 2
N across the driver population and tcr is the mean critical time.
The probability of stopping is then given by the probit equation:
cr
crSTOP
ttTTP Pr
(2.5)
where,
,
22 2 , and is the standard cumulative normal function, while ,
denotes the covariance of the error terms ( , ).
Note that, although inferences are made based on frequency-based estimates, the error
terms , not only encompass those errors that occur due to non-homogenous drivers, but also
account for the perception errors occurring at the level of the individual driver.

11
There are drawbacks to the approach presented above. First, although the approach
determined dilemma zone boundaries using a sound stochastic concept, the definition that the
dilemma zone is based upon is still deterministic on the basis of its binary interpretation: a driver
in the area where the probability of stopping ranges from 10-90% is considered to be unsafe
while anyone outside this area is considered to be safe. This does not account for the variation in
level of risk based upon location. This suggests the need for a traffic hazard function, which
would quantify the risk of a crash at a certain location.
2.4 Surrogate Measure Using Fuzzy Based Approach
A possibilistic approach to quantifying anxiety has been proposed as a surrogate measure
of safety at signalized intersections (Zadeh et al. 1974; Wang 1983; Klir and Folger 1988;
Zimmermann 1990). Possibility theory is a relatively new concept for representing uncertainty.
Yager (1982) defined tranquility as the emotional or psychological ease with which the best
alternative could be selected from a set of competing ones. Anxiety can then be defined as the
lack of tranquility. If all competing alternatives are nearly equal in terms of their feasibility of
being selected as the best, then the selection of one alternative for implementation would lead to
high anxiety.
Consider a situation in which it is necessary to select from di alternatives the one which
best satisfies a set of criteria, defined by fuzzy set D. The fuzzy set D can be represented as:
12
.......,,3
3
2
2
1
1
ddd
(2.6)
where,
i is the degree of membership in set D for decision alternative di.
The anxiety associated with the decision is defined as:
dCardD
DAnt max
0
11)( (2.7)
where,
)(DAnt is the degree of anxiety associated with the decision function D;
max is the largest degree of membership in D; and
CardD is the cardinality of the -level set of D. This is the number of alternatives
whose membership grade is greater than or equal to .
Some typical properties of quantitative measures of anxiety are highlighted hereafter
through example. Anxiety is low if a single best alternative is available. If one alternative
satisfies the necessary criteria perfectly and all other alternatives are not fit for selection, then
CardD = 1 for all , and anxiety for the selection would be zero. Higher anxiety would arise
from deciding between several alternatives having equal support (or, when none of the
alternatives have high support). For a binary choice, the above expression is reduced to equation
2.7 (Yager and Kikuchi 2004):
13
2121 ,2
1,1)( aaMinaaMaxDAnt (2.8)
where,
1a and 2a correspond to the membership grade for choices 1 and 2, respectively.
Yager and Kikuchi (2004) also proposed a principle of maximum anxiety. A decision-maker
chooses the time to act as the time of highest anxiety.
Kikuchi et al. (1993) used the measure of anxiety defined above to quantify the level of
ease with which drivers made the decision to stop or go when faced with a yellow phase. The
authors commented that, regardless of the timing of the yellow phase, driver will experience
anxiety during the signal change interval. It was suggested that the only method of alleviating
anxiety would be to implement intelligent transportation systems to provide drivers with external
commands to stop or go. The lack of near-term feasibility is a key drawback of this approach.
Another drawback is that when the driver receives an external command that is contradictory to
his or her perception, anxiety levels may increase further.
Apart from implementation issues, there are other shortcomings of the use of anxiety as a
surrogate measure of safety. In the United States, safety is measured in terms of the number of
crashes occurring at a facility. The conversion function which converts the measure of anxiety to
the risk of crash is not available, and will need to be developed prior to using this theory as a
surrogate measure of safety. Another unaddressed issue is the dynamic nature of human
decision-making, which implies that, even if a person makes a decision at a given instance in
time, he or she may change the decision in the near future based on feedback from the system.
For example, a common traffic conflict observed at the onset of the yellow phase occurs when a
driver initially presses the brake, then decides to proceed; or conversely, when a driver decides to
14
proceed, then suddenly brakes. These types of conflicts are not addressed within the proposed
measure of anxiety.
2.5 Yellow Phase Duration and Driver Behavior
Researchers have also studied change in driver behavior as a function of the length of the
yellow interval. For example, increases in the duration of yellow were found to correspond to
decreased incidents of right-angle crashes in a study of intersections equipped and not equipped
with a flashing green signal (Knoflacher 1973). In a study by Van der Horst and Wilmink (1986),
lengthy yellow intervals led to premature stopping (stopping before the onset of red when the
light was still yellow) among last-to-stop drivers at intersections. This indecision influenced
drivers to proceed through the intersection at their next approach. The probability of stopping 4 s
from the intersection decreased from 0.5 for a yellow length of 3 s to 0.34 for a yellow length of
5 s (Van der Horst and Wilmink 1986). Bonnenson et al. (2002), in a study of multiple
intersections in Texas, also found that driver behavior was responsive to increases in the duration
of yellow; in their (2002) study, RLR decreased up to half upon increases in yellow duration
ranging between 0.5-1.5 s among instances when yellow duration did not exceed 5.5 s. As
determined by Koll et al. (2004), early stops should have a negative effect on the frequency of
right-angle collisions.
On the other hand, other research (e.g., Olson and Rothery 1962) has concluded that
varying yellow phase durations did not change driver behavior. Further, studies have
demonstrated that end-of-phase signal duration that is too long is associated with greater
variability in driver decision making and a potential increase in the risk of rear-end collisions
(Olson and Rothery 1962; May 1968; Mahalel and Prashker 1987). For example, Mahalel and
Prashker (1987) witnessed an expansion of the indecision among zone among intersections

15
equipped with a 3 s yellow that was preceded by a 3 s flashing green signal. The indecision zone
increased from 2-5 s to 2-8 s with the addition of a flashing green interval. Evidence linked the
lengthened indecision zone to an increase in the frequency of rear-end crashes.
2.6 Dilemma Zone Mitigation
2.6.1 The Green Extension Method
Green extension systems are deployed at rural high-speed signalized intersections to
reduce the number of red light violations and rear-end crashes. These systems use simultaneous
gap-out logic in the signal controller to decide the allotment of green to each phase. The basic
logic is:
1. All phases are allotted green until they discharge at saturation.
2. The main street green is extended beyond saturation until there is no vehicle in the
dilemma zone or the max-out time is reached.
The first objective of this signal control logic is to minimize the occurrence of high-speed
vehicles in the dilemma zone; this objective governs the length of the green phase at the main
approach. The second objective of the logic is to keep the wait time for any vehicle at the
intersection within acceptable limits; this objective governs the max-out time for the main street
green. All side-street phases are allotted green as long as they are discharging at saturation flow,
thereby reducing the total delay at the intersection.
Engineering judgment are used to determine the value of the maximum green time.
However, as previously noted, this is an “all-or-nothing” approach in which high-speed vehicles
are provided complete protection against dilemma zone incursions before the maximum green is
reached, but the protection is withdrawn after maximum green is reached. Consequently, there

16
exists no intermediate level of protection; the signal logic either provides 100% protection
against the dilemma zone in the case of gap-out, or drops to 0% in the case of max-out.
The operation of simultaneous gap-out logic for the green extension is illustrated in
figure 2.1. A hypothetical traffic signal is shown in figure 2.1a. This intersection has high-speed
through movement running north-south. The advance detectors present on the high-speed arterial
mark the beginning of the dilemma zone. The advance detectors on both the northbound and
southbound arterial are connected in a series. The northbound and southbound through phases
are simultaneously extended for a pre-specified green extension time upon the detection of a
vehicle. The green extension time is sufficient to carry the detected vehicle through the dilemma
zone. So, the green through phase for the northbound and southbound movements is terminated
when there is no vehicle present in the dilemma zone on either of the two approaches. Such a
termination of the phase is called “gap-out.” The through phase can also be terminated if the
traffic controller is unable to find a gap before the maximum green time has expired. Such a
termination of the green phase is called “max-out.” Figure 2.1b shows the actuation time diagram
for the hypothetical traffic flow shown in 2.1a. A green extension time of 3 s and a maximum
green time of 18 s are assumed in this example.
In figure 2.1a, the signal is resting in green for the northbound and southbound through
movements at time 0. Upon arrival of the first vehicle on the cross-street, the maximum green
timer starts. The green phase for the through movement is extended for 3 s at t = 1 s by car N-1,
and is again extended by the arrival of car S-1. This process is continued until the last car, N-3,
arrives at t = 16 s. The phase would have terminated as a “gap-out” at t = 19 s, but the maximum
green time is set to be 18 s; hence the phase “max-out” occurs at t = 18 s, leaving a vehicle in its
dilemma zone.

17
a) Example intersection
b) Example detector inputs
Figure 2.1 Illustration of simultaneous gap-out logic
N
Advance
Detectors
Car S-1
Car S-2
Car S-3
Car N-1
Car N-2
Car N-3
North Bound
Thru Phase
South Bound
Thru Phase
0 126 18
0
1
0
1
0
1
0 126 18
0
1
0
1
0
N-1 N-2 N-3
N-1 N-2 N-3
S-1 S-2 S-3
S-1 S-2 S-3
Ad
va
nce
De
tecto
r A
ctu
atio
ns
Time (Sec)
No
rth
Bo
un
d
So
uth
Bo
un
d
Sim
ulta
ne
ou
s
Ga
p O
ut
Max Out
18
This simple example illustrates a major drawback in the simultaneous gap-out logic. If
only the northbound traffic were present, the through phase would have gap-out at t = 4 s; and if
only the southbound traffic were present, the phase would have gap-out at t = 12 s. The increase
in the number of lanes decreases the probability of gap-out. This problem becomes worse when
the high-speed arterial carries medium to heavy traffic volumes. The safety benefits are negated
when the high-speed through phase is arbitrarily terminated by max-out. A detailed analysis of
this problem is described later in this chapter. It is shown that the implementation of the
simultaneous gap-out logic led to max-outs ranging from 3.5-40% of the cycles per hour during
the peak traffic flow periods and around 200 dilemma zone incursions per day at the study
intersection in Noblesville, Indiana.
In an actuated control, phases 2 and 6 (main street through phases) are most often linked
for gap-out purposes, which impose an additional constraint on the control system. The
constraint requires that when crossing the barrier, phases 2 and 6 must gap-out together in order
to terminate the green interval. In the absence of a simultaneous gap-out logic, if phase 2 gaps
out prior to phase 6, both phases proceed to clearance as soon as a gap is found in phase 6,
regardless of any new call placed on phase 2. With simultaneous gap-out enabled, the new call
will extend phase 2, even though it would have otherwise already gapped out. In this example,
phase 2 and phase 6 need to gap-out simultaneously to end the phases. Therefore, the
simultaneous gap-out logic inherently increases the likelihood of max-out scenarios.
The above example illustrates that simultaneous gap-out logic can be problematic under
conditions of medium to high traffic volumes; in such scenarios, it will reduce the efficiency of
the intersection without improving any dilemma zone protection when the phases max-out. The

19
maxing-out of phases leads to increases in the cycle lengths, which results in increased delay on
the intersection and subsequent increases in travel times and vehicle operating costs.
Though some advanced green extension systems do exist, such as Texas Transportation
Institute truck priority system (Middleton et al. 1997) and LHORVA (Kronborg 1992), to date,
none explicitly consider the marginal trade-offs between safety and delay.
2.6.2 The Green Termination Algorithm Method
The green termination algorithm is currently in the early phases of implementation and
can be found at only a few intersections. Green termination algorithm systems attempt to identify
the correct time to end the green signal phase by predicting the correct value of a performance
function for the near future, with the objective of minimizing the performance function. The
performance function is based upon the quantity of vehicles present in the dilemma zone and the
length of the opposing queue. At this time, only limited empirical data exists regarding the
performance of green termination algorithms in terms of efficiency, cost, and detector
requirements.
2.6.3 The D-CS System
Detection-Control System, or D-CS, is a state-of-the-art system developed by the Texas
Transportation Institute (Bonneson et. al. 2002). DC-S has been implemented at eight
intersections in Texas, as well as three intersections in Ontario, Canada (Zimmerman, 2007). The
system uses a green termination algorithm, and consists of two components: vehicle status and
phase status. It collects data from a speed trap located sufficiently far from the intersection
(approximately 800-1,000 ft), as well as data on vehicle length. Based on this data, the system
projects the arrival and departure time of a vehicle in the dilemma zone, using this data to
maintain a “dilemma zone matrix” that is updated every 0.05 s. The phase status component,

20
which is also updated every 0.5 s, utilizes the dilemma-zone matrix, maximum green time, and
number of calls registered on opposing phases to control termination of the main street green
phase.
The phase end decision can be summarized as follows:
1. Stage 1: D-CS operates similarly to simultaneous gap-out logic. The main street green
phase is terminated only if there are no vehicles in their dilemma zone in any of the
main-street lanes. This stage lasts for 70% of the maximum green time.
2. Stage 2: D-CS terminates the main street green phase if all of the following
conditions are true:
a. All of the main street lanes have one or fewer passenger cars in their dilemma
zone.
b. There are no trucks in the dilemma zone in any of the main street lanes.
c. There is not a time in next few seconds when there will be a lesser number of
projected vehicles in the dilemma zone.
3. Stage 3: D-CS terminates the main street green once the maximum green time has
elapsed.
Bonneson and Zimmerman (2005), found that DC-S intersections displayed a reduced
frequency of red light violations at nearly every approach, with a 58% overall reduction in the
frequency of red light running violations. The reduction for heavy vehicles, specifically, was
approximately 80%. When DC-S replaced systems that used multiple advance loop detection or
no advance detection, the system reduced violations by 53% and 90%, respectively.
2.6.4 The Self-Optimizing Signal Control (SOS) Method
Developed in Sweden, the SOS system is a green termination algorithm system designed
for use at isolated intersections. Similarly to D-CS, the SOS system utilizes detectors in each
21
lane to project vehicles that are approaching the intersection. The Miller algorithm performs
calculations for different lengths of t (e.g., 0.5 s-20 s) and determines the cost of terminating the
green phase immediately versus in t seconds (Kronborg 1997). SOS evaluates three different
factors: the reduction of stops and delays for vehicles via the green extension, increased stops
and delays for the opposing traffic, and increased stops and delays for vehicles void of the green
extension that must wait for the next green phase. In evaluating SOS, Kronborg et al. (1997)
found that the percentage of vehicles in the dilemma zone decreased by 38%, while the number
of vehicles at-risk of rear-end collisions decreased by 58%.
2.6.5 Wavetronix SmartSensor Advance
The Wavetronix SmartSensor Advance with SafeArrival technology is one of the most
modern vehicle detection-based dilemma zone protection systems (Wavetronix 2011). The
system uses digital wave radar to track vehicle ranges and speeds, in order to provide an accurate
estimate of the arrival time to the stop bar. The system also determines the position and size of
gaps in the flowing traffic to extend the green time to allow for safe passage if necessary. In a
comparison study conducted by Knodler and Hurwitz (2009), SmartSensor reduced the number
of vehicles in the Type II dilemma zone in more effectively than inductive loops, decreasing red
light running more than threefold in comparison to that system. The system also shows promise
in the early detection of heavy vehicles, making it potentially useful toward the development of
variable dilemma zones that are based on vehicle type.
2.7 Quantifying the Risk of Traffic Conflict
While traditional surrogate measures of safety (e.g., the dilemma zone vehicle count) are
unable to quantify crash risk, traffic conflicts have demonstrated utility as a tool for indirectly
measuring the safety of a given intersection. Figures 2.6a-c illustrate the contrast between the

22
currently utilized surrogate measure of intersection safety and the proposed measure presented in
this evaluation.
Current green extension systems represent an all-or-nothing approach in which all
vehicles at a high speed approach are cleared until maximum green time is reached, and vehicles
are not provided protection at the end of maximum green time. As shown in figure 2.6a, green
extension systems do not incorporate a metric for measuring the cost associated with crash risk.
Green termination systems use rank-ordered assessment of the number of vehicles in the
dilemma zone as a surrogate measure to quantify the cost of risk, where the cost of one vehicle in
the dilemma zone is lower than the cost of two, but this measurement is independent of the
positions of vehicles in the dilemma zone. There is also only limited research on the relationship
between dilemma zones and associated safety-related monetary costs of dilemma zone incursion.
The dilemma zone model devised by Sharma et al. (2011) utilized the observed
probability of stop and go at the onset of the yellow light. In this model, the probability of traffic
conflict was based upon the probability of driver decision making error. The dilemma hazard
function for vehicles traveling at 45 mph at the data collection site in Noblesville, Indiana is
shown in figure 2.6c. The analysis conducted by Sharma et al. (2011) developed probability of
conflict curves for single passenger vehicles. The current research aims to develop the dilemma
hazard function for heavy vehicles. The dilemma hazard function can be enhanced even further
with the addition of severe conflict boundaries using acceleration and deceleration thresholds.

23
a) Evaluating the cost of safety in current green extension systems
b) Evaluating the cost of safety in advanced green termination systems
Figure 2.2 Comparison of traditional and proposed surrogate methods of safety
DLZ End DLZ Beginning
Distance to Stop bar (ft.)
Un
kno
wn
(All o
r no
thin
g a
pp
roac
h)
DLZ End DLZ Beginning
Distance to Stop bar (ft.)
Re
lati
ve
safe
ty c
ost
1 Vehicle
2 Vehicles

24
c) Proposal for the evaluation of safety cost
Figure 2.2 (cont’d.) Comparison of traditional and proposed surrogate methods of safety
2.7.1 The Traffic Conflict Technique as a Surrogate Measure of Safety
The traffic conflict technique (TCT) was first proposed by Perkins and Harris (1968),
who defined a conflict as “the occurrence of evasive actions, such as braking or weaving, which
are forced on the driver by an impending crash situation or a traffic violation.” The conflicts
were categorized as left-turn conflicts, weave conflicts, rear-end conflicts, and cross-traffic
conflicts.
This technique gained wide popularity as a surrogate for measuring traffic safety for two
main reasons: first, traffic conflicts are more frequently observed than are crashes, implying that
a large amount of information regarding intersection safety can be collected quickly using
conflict data. Cooper and Ferguson (1976) reported that, on average, the ratio of the rate of
crashes to the rate of serious conflicts lies in the range of 1:2000; in other words, 10 hours of
conflict observation at a particular site can provide information that is equivalent to two to three
years of reported crash records. Second, TCT provides an opportunity for traffic engineers to
0
0.2
0.4
0.6
0.8
1
0 200 400 600
Pro
bab
ilit
y o
f tr
aff
ic c
on
flic
t
Distance from the stop bar (ft)

25
proactively improve the safety of a site, instead of waiting for the crash history to evolve. Due to
these advantages, the traffic conflict technique has been used by several agencies to investigate
the crash potential and operational deficiencies of intersections. Numerous research efforts have
attempted to establish a direct relationship between crashes and conflicts (Baker 1972; Spicer
1972; Cooper 1973; Paddock 1974). A review by Glauz and Migletz (1980) identified 33
previous studies that at least partially dealt with the conflict-crash relationship.
Some concerns have been raised regarding TCT techniques (e.g., Glennon et al. 1977),
due to the fact that the initial approach to this technique was, generally, to compare observed
crashes with the observed surrogate measure; since both conflict and crashes are randomly
distributed events, it is highly improbable that the exact number of crashes at a site could be
predicted. Glauz et al. (1985) proposed a new approach that compared the expected crash rate as
predicted by conflict ratios to the expected crash rate as predicted by crash histories, concluding
that estimates of the expected crash rates could be computed from traffic conflict history with
nearly the same accuracy as predicted by crash history. Fazio et al. (1993) also advocated the use
of traffic conflicts as a surrogate measure for traffic safety. Further, Gettman and Head (2003)
provided a detailed use-case analysis for using traffic conflicts as a surrogate measure for safety
in a micro-simulation package.
2.7.2 Defining Traffic Conflicts at the Onset of Yellow
Zeeger (1977) identified six conflicts that can occur at the onset of yellow.
Red light runner (RLR): Defined as occurring when the front of the vehicle was
behind the stop line at the onset of the red signal.
Abrupt stop: Occurs when a vehicle stops instead of clearing the intersection,
when it would be more appropriate to clear the intersection. These conflicts can

26
be calculated mathematically based on onset yellow distance and speed; they can
also be observed visually.
Swerve-to-avoid collision: An erratic swerve-out-of-lane maneuver conducted to
avoid collision with a vehicle in front stopped at the light.
Vehicle skidded: A more severe abrupt stop that is audible to the observer. The
vehicle wheels lock-up in order to stop.
Acceleration through yellow: The vehicle successfully crosses the stop bar, but
only by accelerating; based on calculated distance and speed, the vehicle’s
constant speed trajectory would not have been adequate for successful crossing.
Acceleration through yellow can be heard audibly or identified through numerical
calculation.
Brakes applied before passing through: The driver applies the brakes before
traversing the intersection. Indicates driver indecisiveness. This conflict can be
observed visually.
2.8 Modeling the Dilemma Zone Hazard Model for Passenger and Heavy Vehicles
Researchers have recently developed dilemma hazard models to quantify the level of risk
associated with vehicle presence in the dilemma zone. The recently developed dilemma hazard
model is a potential traffic conflict measure that calculates the dilemma zone hazard based on
driver decisions and actual vehicle capability as a function of time-to-intersection (TTI) at onset
yellow. The dilemma zone hazard model was calibrated and validated by Li (2009) utilizing a
methodology developed by the American Society of Civil engineers (ASCE). Li used the Monte
Carlo method to simulate collected data (driver stop/go decisions, vehicle kinematics,
acceleration/deceleration rates) in order to establish dilemma zone hazard values within the

27
boundaries of 2-5 s. Models were created for single- and two-vehicle scenarios. Results are
shown below in figure 2.8, and illustrate the effect of signal timing on the dilemma hazard.
Figure 2.3 Dilemma hazard curves for various yellow and all-red clearance intervals (Li 2009)
Sharma et al. (2011) outlined a theoretical justification for utilizing probability of
stopping to estimate probability of conflict at high speed intersections for single vehicles,
discussed in detail in the following chapter.
2.9 Summary
The traditional surrogate measure of intersection safety—the dilemma zone—denotes the
region of risk but fails to quantify the level of risk. The dilemma zone hazard model and
dilemma zone hazard function have recently been used in attempts to quantifying the level of
safety risk upon onset yellow. The dilemma hazard function was recently developed for single
passenger vehicles (Sharma et al. 2011). The goal of the current research was to develop a
dilemma zone hazard function for heavy vehicles.

28
Chapter 3 Development of Vehicle Based Dilemma Hazard Function
This chapter develops a dilemma zone hazard function estimation for passenger cars and
heavy vehicles. This approach is an extension of the current approach which uses dilemma zone
boundaries to determine the risk of traffic conflict for an individual vehicle in the case of a
dilemma zone incursion. Field data collected from the intersection of SR 37 and SR 32 at
Noblesville, Indiana were used to generate a binary choice model that best explained the
underlying criteria for driver decisions at the onset of yellow. The probability of making an
erroneous decision was used as the probability of a traffic conflict. Conflict severity was
determined using the observed acceleration and deceleration ranges used by drivers at the
intersection. Although the data were specific to one intersection, the procedures are readily
transferable, and demonstrate how a sensor providing richer data than that provided via an
inductive loop detector can be used to incorporate safety into signal operations.
3.1 Traffic Conflict at the Onset of Yellow
A conceptualized order of events occurring at the onset of yellow is shown in figure 3.1.
A driver makes a decision to stop or go based on his/her environment, the signal settings, and
adjacent vehicles. Let us assume a driver observes a yellow light at time t and decides to stop or
go at time t+ 1t . An erroneous decision could be made at time t+ 1t due to an error in
perceiving the surroundings. The driver would realize his/her error after receiving feedback from
the surrounding system, called “perceived conflict.” The driver then tries to rectify the error by
taking evasive action at time t+ 1t + 2t . If the evasive action is successful, then normal traffic
resumes. However, an unsuccessful evasive action results in a crash. The probability of a traffic
conflict would therefore be the same as the probability of having a “perceived conflict.” Some
perceived conflicts may require severe evasive action (e.g., in the case of a higher degree of

29
perception error), while others may require minor evasive action. Compared to a minor conflict,
the probability of a crash is much higher in the case of a severe conflict.
Figure 3.1 Driver decision processes at the onset of yellow
For example, traffic conflicts caused by the onset of the yellow light—such as
acceleration through yellow, brakes applied before passing through, and abrupt stops—are minor
conflicts. However, running a red light, swerving to avoid a collision, and vehicle skidding fall in
the category of severe conflicts. Traffic conflicts can further be sub-divided into two categories
based on the (a) presence or (b) absence of another vehicle in close proximity in the same lane. A
driver’s decision when faced with the yellow phase may depend on the presence of another
vehicle in the lane. In the absence of another vehicle, the factors affecting the decision of the
driver will be the distance from the stop-bar, velocity, weather conditions, length of yellow, etc.
In the presence of another vehicle, the decision model of each driver can become complicated, as
Feedback
from
surroundings
Perceived
conflict
Evasive
action
Crash
Normal traffic
communication
Unsuccessful
Successful
Time Line
t t + ∆t1 t + ∆t1+ ∆t2
Environment
Decision to brake,
accelerate or maintain
the speed
Adjacent
vehicle position
Signal settings
Perceive correct decision made
Perceive incorrect
decision made

30
the decision of one driver may affect the other, and the correlated perception errors of both
drivers would lead to a complex decision model. In this report, we restrict our discussion to
single vehicle conflict. Multiple vehicle conflict is a topic we propose for future investigation
and research. Note that recasting the dilemma zone design as a marginal costs-benefit problem
(Sharma et al. 2007), presented in the previous chapter, allows the designer to considerably
enhance the efficiency and safety at the intersection, even when a single vehicle dilemma zone
hazard function is used.
The high-speed intersection of SR37 and SR32 in Noblesville, Indiana was used to study
the decision process of drivers for the development of driver decision models and the dilemma
zone hazard function. The following section describes the data collection and validation
processes.
3.2 Field Data Collection and Validation
The data collection site at the signalized intersection of SR 37 and SR 32 in Noblesville,
Indiana is shown in figure 3.2a. This instrumented intersection logs wide area detector (WAD)
individual vehicle tracks and signal states. A simultaneous video of the existing traffic conditions
was recorded for manual ground-truthing. Figure 3.2b illustrates the data collection environment
used for the evaluation.
The equipment used for data collection included:
Southbound (SB) WAD: SmartSensor Advance by Wavetronix was used as the
WAD. This sensor uses a patented digital wave radar technology to track all vehicles,
with a stated accuracy of 5 ft. The SB WAD was mounted on a mast arm 155 ft
behind the stop bar at a height of 32 ft.
31
SB Video: A video camera mounted on the SB mast arm was used for visual
validation. The camera had the capability to overlay signal actuations over the video
captured by the video sensor.
This setup was used to estimate the speed and position of the vehicle entering the SB
approach. Vehicles up to a distance of 450 ft were detected by the WAD, and the WAD track
files with the distance, speed, and identification numbers of the reported detections were logged.
Also, the video output and the WAD output were displayed on a PC, and were recorded by a
screen capture device at a rate of 30 frames/s, as shown in figure 3.2b.
After installation of the WAD, it was validated against a handheld GPS device. Three
vehicle types: a sedan, a pickup truck, and an eight-passenger van, were used as probe vehicles
to collect data. Ten runs were conducted for each vehicle type. The time was dynamically
synchronized to 0.01 s precision across the data collection computer and GPS device. The root
mean square error (RMSE) in distance was reported as 7.3 ft. An example of vehicle tracking by
GPS and WAD is shown in figure 3.3. A detailed analysis of the performance of the WAD can
be found in Sharma et al. (2008).

32
a) Intersection layout
b) Data collection environment
Figure 3.2 Data collection at SR 37 and SR 32 in Noblesville, Indiana
Screen recording utility capturing
to a 30 fps digital video file
Data logged to
*.txt or *.csv file
PC1
ID Range Velocity
1 500 50
3 150 34
2007/10/09 07:08:44.36
2 400 46
4 0 50
2007/10/09 07:08:44
SB Solo Pro
SB Video
Loop/Signal
ActuationsSB WAD

33
Figure 3.3 Example comparison between WAD and GPS
Data was collected on the southbound approach of SR 37 beginning in September 2007
and ending in April 2008; data was recorded between 6:00 am and 8:00 pm. The recorded video,
with WAD and video input, was analyzed manually to reduce 102 days of data. The data were
collected during good weather conditions and in the absence of any special event. The time of
the onset of yellow, the vehicle Id number, driver decisions to stop or go, vehicle velocity, and
the distance from the stop bar as given by the WAD, were noted. Only cases having one car in a
lane at the onset of yellow were kept for the analysis of single vehicle conflict. Instances where
the WAD performed erratically were deleted to maintain a high degree of accuracy. A total of
2,349 vehicles were observed, of which there were 252 heavy and 2,097 passenger vehicles.
Figure 3.4 shows the cumulative speed distribution of speed for heavy vehicles and passenger
vehicles. The 85th
percentile speed for passenger vehicles was 56 mph, and was 51 mph for
0
100
200
300
400
500
8:38:10 AM 8:38:13 AM 8:38:15 AM 8:38:18 AM 8:38:20 AM
Time
Dis
tan
ce (
ft)
WAD GPS

34
heavy vehicles; the 15th
percentile speed for passenger vehicles was 40.4 mph and 34 mph for
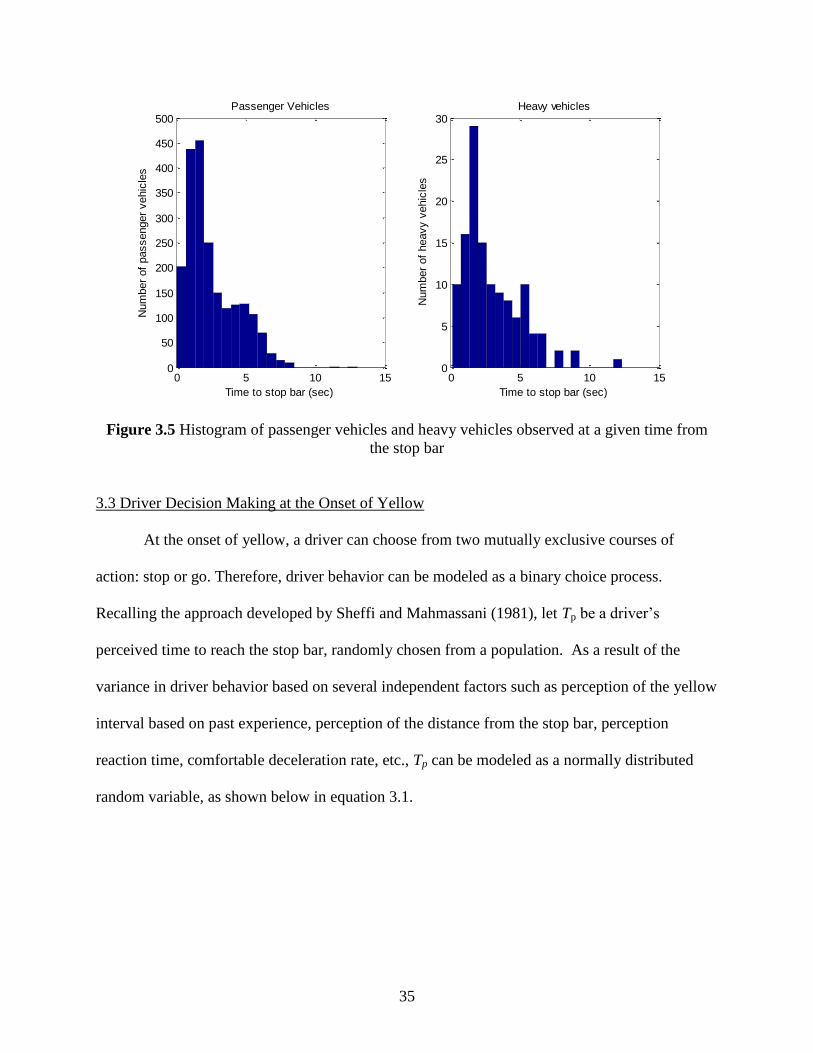
heavy vehicles. Figure 3.5 presents a histogram for the frequency of observation of passenger
vehicles and heavy vehicles at a certain time to the stop bar. It can be seen that the data
encompasses the typical range of dilemma zone boundaries. The peak hour through volume on
the two south bound approach lanes varied between 600-900 vehicles per hour.
Figure 3.4 Cumulative speed distribution of heavy vehicles and passenger vehicles at the onset
of yellow
0 20 40 60 80 1000
0.1
0.2
0.3
0.4
0.5
0.6
0.7
0.8
0.9
1
Speed (mph)
Perc
enta
ge
PC
HV
Speed PV (median) = 49 mph
Speed HV (median) = 44 mph
35
Figure 3.5 Histogram of passenger vehicles and heavy vehicles observed at a given time from
the stop bar
3.3 Driver Decision Making at the Onset of Yellow
At the onset of yellow, a driver can choose from two mutually exclusive courses of
action: stop or go. Therefore, driver behavior can be modeled as a binary choice process.
Recalling the approach developed by Sheffi and Mahmassani (1981), let Tp be a driver’s
perceived time to reach the stop bar, randomly chosen from a population. As a result of the
variance in driver behavior based on several independent factors such as perception of the yellow
interval based on past experience, perception of the distance from the stop bar, perception
reaction time, comfortable deceleration rate, etc., Tp can be modeled as a normally distributed
random variable, as shown below in equation 3.1.
0 5 10 150
50
100
150
200
250
300
350
400
450
500
Time to stop bar (sec)
Num
ber
of
passenger
vehic
les
Passenger Vehicles
0 5 10 150
5
10
15
20
25
30
Time to stop bar (sec)
Num
ber
of
heavy v
ehic
les
Heavy vehicles

36
reqp TT (3.1)
where,
Treq is the required time to safely enter the intersection based on the vehicle’s onset
distance and speed.
: is a random variable is assumed to be normally distributed.
Figure 3.6 illustrates the resulting probability density function. If the perceived time, Tp,
is greater than the critical time threshold, Tt, for the driver, a driver will decide to stop;
otherwise, they decide to go.
Figure 3.6 Probability density function for perceived time to stop bar
TtTreq
PDF of Perceived
Time to Stopbar (Tp)
Probability to stop
Pr ( Tp > Tt )
Time to stopbar (sec)
Treq: Required time to stopbar
Tt: Critical time threshold

37
Therefore, the probability of stopping can then be calculated as:
(3.2)
(3.3)
(3.4)
{
} (3.5)
{ (
)} (
) ( ) (3.6)
In addition, the estimates of a and b represent,
(3.7)
where,
Φ(●) represents the standard normal cumulative normal function and equation 3.7 is a
probit construct.
Estimates a and b from equation 3.7 are imperative to the formation of the probability of
stopping curve, as they represent the slope and intercept. The two proceeding figures are
illustrations of this significance.

38
Table 3.1 presents the probit model developed for the data obtained from the test site.
The model had 93.38% correct prediction accuracy. Figure 3.7 presents the probability of
stopping plots for passenger vehicles and heavy vehicles. Table 3.2 presents the important
statistics from the two models. The dilemma zone boundaries were found to be between 3.5-6 s
and 3-8.2 s for passenger vehicles and heavy vehicles, respectively. It can be seen that the
dilemma zone boundary for trucks was 2.7 s longer. The longer boundaries show that heavy
vehicles had higher variability in decision making at the onset of yellow. A provision of
providing information to truck drivers, such as advance warning flashers, to aid in decision
making could help reduce this variability. The other important observation to be noted is that the
critical threshold for passenger vehicles (4.7 s) was very close to the yellow time at the
intersections, a finding consistent with Sheffi and Mahmassani (1981). The critical threshold for
trucks (5.6 s) was higher than the passenger vehicle threshold, as well as the yellow duration. A
significant number of truck drivers decided to go through the intersection, despite the risk of
running the red light; this could be due to the fact that heavy vehicles try to avoid heavy
deceleration to avoid jack-knife crashes. This also signifies the need to provide special dilemma
zone protection when the trucks are detected. Wide area detectors with the capability to identify
heavy vehicles could provide site-specific and vehicle specific protection, thus significantly
improving safety at high speed intersections.

39
Table 3.1 Probit model for probability of stopping
Number of observations: 2223
Unrestricted log likelihood: -352.25 Restricted log likelihood: -1000.79
Prob 69.2752 = 0.00 AIC: 0.32
Variable Name Value T-stats
Constant 4.83 20.02
Required Acceleration -1.022 -19.65
HV_addConst -2.04 -4.53
HV_Acc 0.52 5.52
Figure 3.7 Probability of stopping curve for passenger vehicles and heavy vehicles for the test
site

40
Table 3.2 Time to stop bar based probit model for stop and go decisions
Variable Name Passenger Vehicle Heavy Vehicle
DLZ start (s) 3.5 3
DLZ end (s) 6 8.2
Length of dilemma zone
boundary (s) 2.5 5.2
Critical time threshold (s) 4.73 5.6
Standard deviation (s) 0.98 2.01
Yellow time (s) 5 5
3.4 Theory of Drivers’ Perceived Conflict Resulting in Minor and Severe Traffic Conflicts
The driver decision process at the onset of yellow is a dynamic feedback system. The
consequences of any decision made by the driver at a certain time step are fed back to that driver
in the next time step. If a driver erroneously decides to go even though the required time is
greater than the threshold, the driver will realize it after some duration of time. Similarly, an
error would occur if a driver decided to stop even though the time required was less than the
critical time threshold. The probability of a traffic conflict, therefore, would be the same as the
probability of a detected error. The curve of probability of traffic conflict is termed the dilemma
hazard function.
treqSTOPGo
treqSTOP
CONFLICT TTPP
TTPP
1 (3.8)
Figure 3.8 shows the dilemma hazard function for passenger vehicles and heavy vehicles
for the test site. It can be seen that, for heavy vehicles, the dilemma hazard function is spread
over a larger region.

41
Figure 3.8 Dilemma hazard function for passenger vehicles and heavy vehicles
Sharma et al. (2011) derived a marginal cost-benefit approach that can be used to
improve the safety and efficiency of operations at high speed intersections, using dilemma
hazard functions. The optimal operation of intersections demands that the total cost levied on all
drivers should be minimized. The total system cost can only be minimized if the marginal
benefits of extending the main street green (beyond the minimum green time) to reduce the
probability of traffic conflict are greater than the resulting marginal increase in the cost of delays
on the accumulated queue of the opposing movement. Since the queue length on the side streets
will increase with the passage of the main-street green, the protection provided to the main street
driver has to be dynamically reduced.
This remainder of this section will present a methodology for implementing dynamic
dilemma zone protection. Wide area detector technology can be used to identify vehicle class
0
0.2
0.4
0.6
0.8
1
0 5 10 15
Pro
ba
bil
ity o
f tr
aff
ic c
on
flic
t
Time to stopbar (sec)
HVPV

42
and speed. Note that the proposed algorithm is used only to reduce the protection provided for
single vehicle conflict; full protection will be provided if there are more than two vehicles in
their dilemma hazard zone in same lane. Also, the probability of traffic conflict might be further
divided into severe and minor conflict using the typical acceleration and deceleration thresholds.
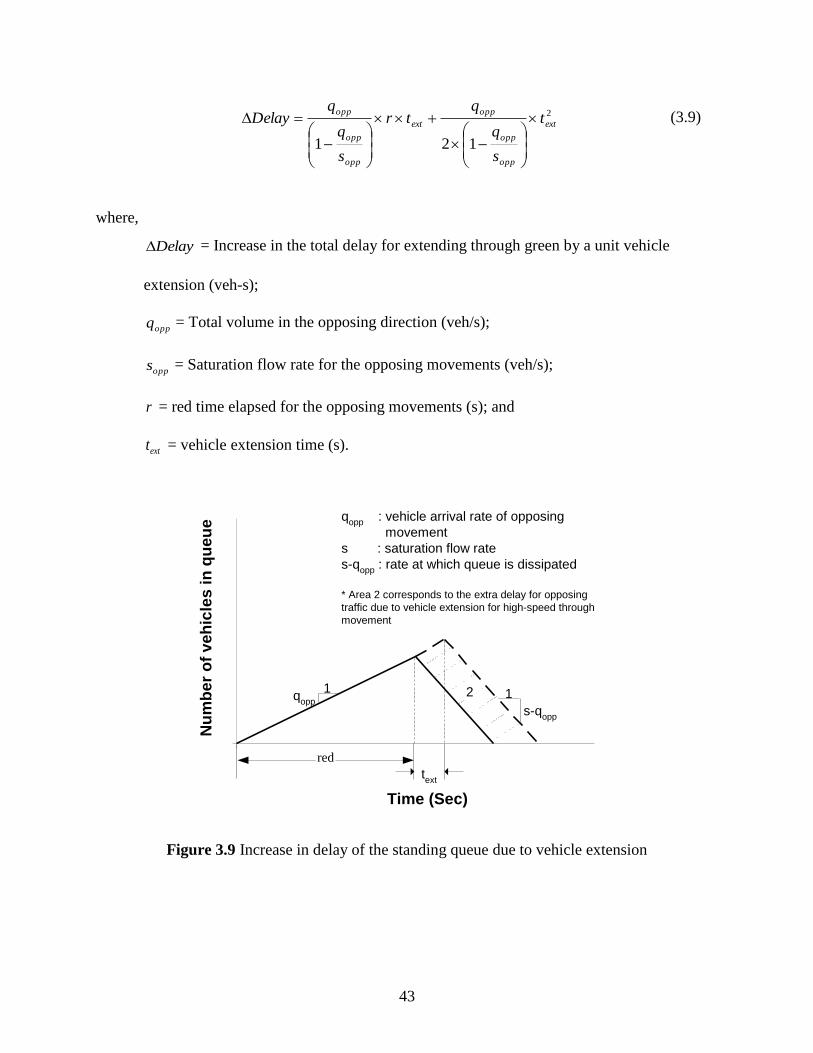
3.5 Cost of Delay Associated with Extension of Green Phase of the High Speed Approach
The cost of extending the green for clearing the vehicle from the high risk zone can be
calculated by using the amount of delay incurred by the queue formed on the stopped phases.
Figure 3.9 illustrates the concept of increase in delay for extending a through green by a single
vehicle extension (text). The un-shaded queue polygon in figure 3.9 is the delay experienced by
the vehicles in opposing movement if the green were terminated without the green extension.
The extra delay is shown as the shaded area, and this extra delay accrues to the side street if the
through phase is extended by a time equal to text. The extra delay associated with extending the
main street green phase by text after r seconds of green has elapsed is given by equation (3.9)
(below).
43
2
121
ext
opp
opp
opp
ext
opp
opp
oppt
s
q
qtr
s
q
qDelay
(3.9)
where,
Delay = Increase in the total delay for extending through green by a unit vehicle
extension (veh-s);
oppq = Total volume in the opposing direction (veh/s);
opps = Saturation flow rate for the opposing movements (veh/s);
r = red time elapsed for the opposing movements (s); and
extt = vehicle extension time (s).
Figure 3.9 Increase in delay of the standing queue due to vehicle extension
Time (Sec)
Nu
mb
er
of
ve
hic
les
in
qu
eu
e
red
2
qopp
: vehicle arrival rate of opposing
movement
s : saturation flow rate
s-qopp
: rate at which queue is dissipated
* Area 2 corresponds to the extra delay for opposing
traffic due to vehicle extension for high-speed through
movement
1q
opp1
s-qopp
text
44
The increase in the total system delay is multiplied by the cost of the delay ($/veh/s) to
obtain the cost of extending the high speed through phase by a unit vehicle extension. For
illustration purposes, in this report we use mean hourly rate income for the United States 20.32
$/hr.
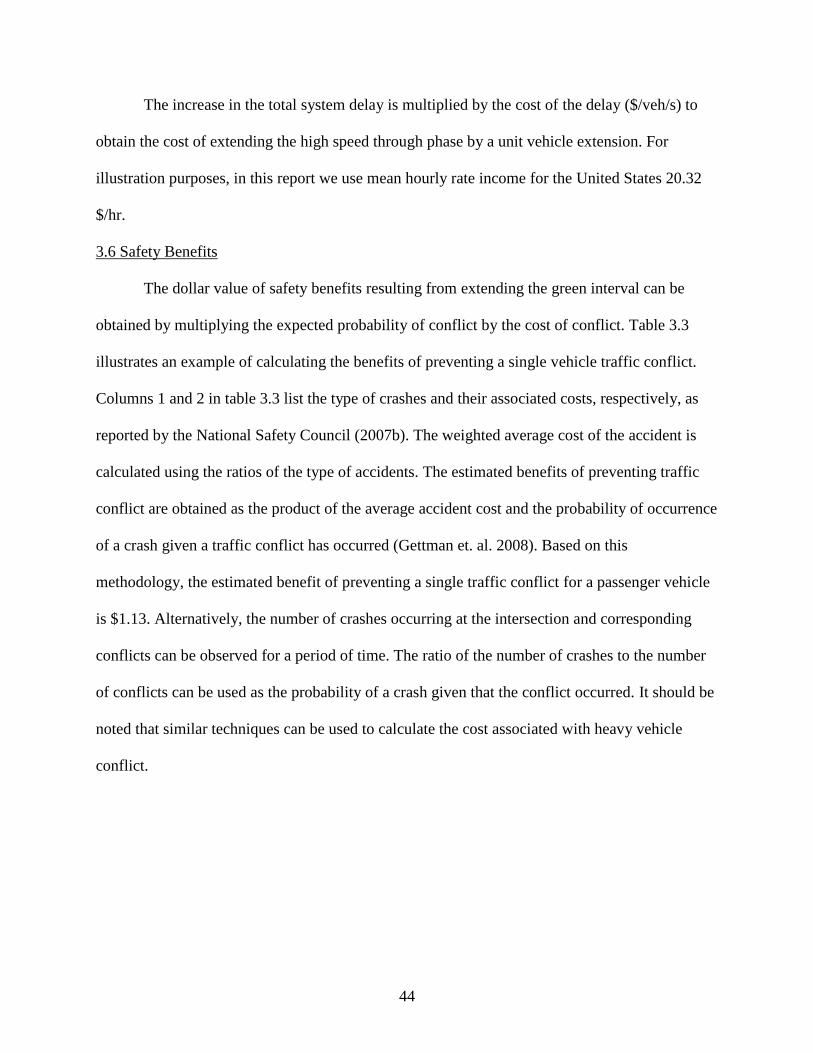
3.6 Safety Benefits
The dollar value of safety benefits resulting from extending the green interval can be
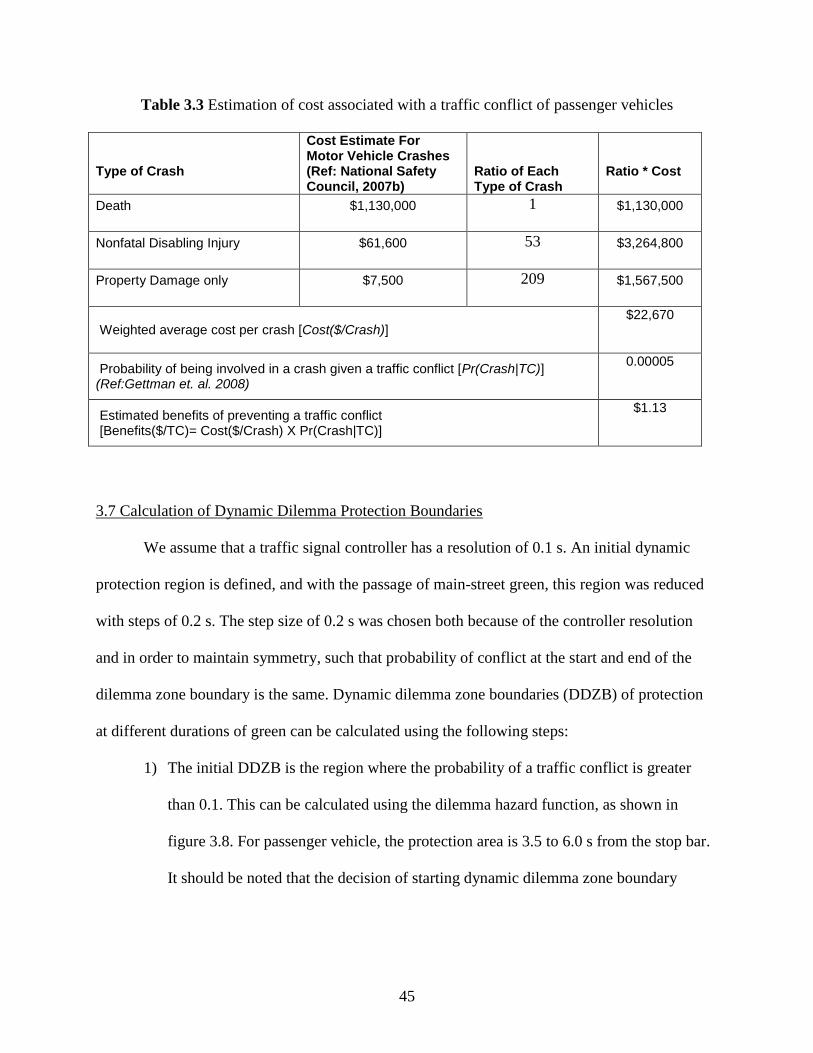
obtained by multiplying the expected probability of conflict by the cost of conflict. Table 3.3
illustrates an example of calculating the benefits of preventing a single vehicle traffic conflict.
Columns 1 and 2 in table 3.3 list the type of crashes and their associated costs, respectively, as
reported by the National Safety Council (2007b). The weighted average cost of the accident is
calculated using the ratios of the type of accidents. The estimated benefits of preventing traffic
conflict are obtained as the product of the average accident cost and the probability of occurrence
of a crash given a traffic conflict has occurred (Gettman et. al. 2008). Based on this
methodology, the estimated benefit of preventing a single traffic conflict for a passenger vehicle
is $1.13. Alternatively, the number of crashes occurring at the intersection and corresponding
conflicts can be observed for a period of time. The ratio of the number of crashes to the number
of conflicts can be used as the probability of a crash given that the conflict occurred. It should be
noted that similar techniques can be used to calculate the cost associated with heavy vehicle
conflict.
45
Table 3.3 Estimation of cost associated with a traffic conflict of passenger vehicles
Type of Crash
Cost Estimate For Motor Vehicle Crashes (Ref: National Safety Council, 2007b)
Ratio of Each Type of Crash
Ratio * Cost
Death $1,130,000 1 $1,130,000
Nonfatal Disabling Injury $61,600 53 $3,264,800
Property Damage only $7,500 209 $1,567,500
Weighted average cost per crash [Cost($/Crash)] $22,670
Probability of being involved in a crash given a traffic conflict [Pr(Crash|TC)] (Ref:Gettman et. al. 2008)
0.00005
Estimated benefits of preventing a traffic conflict [Benefits($/TC)= Cost($/Crash) X Pr(Crash|TC)]
$1.13
3.7 Calculation of Dynamic Dilemma Protection Boundaries
We assume that a traffic signal controller has a resolution of 0.1 s. An initial dynamic
protection region is defined, and with the passage of main-street green, this region was reduced
with steps of 0.2 s. The step size of 0.2 s was chosen both because of the controller resolution
and in order to maintain symmetry, such that probability of conflict at the start and end of the
dilemma zone boundary is the same. Dynamic dilemma zone boundaries (DDZB) of protection
at different durations of green can be calculated using the following steps:
1) The initial DDZB is the region where the probability of a traffic conflict is greater
than 0.1. This can be calculated using the dilemma hazard function, as shown in
figure 3.8. For passenger vehicle, the protection area is 3.5 to 6.0 s from the stop bar.
It should be noted that the decision of starting dynamic dilemma zone boundary

46
depends on the site engineer; the value of 0.1 was chosen for the purposes of
illustration.
2) The next step is to calculate the expected probability of traffic conflict for the
dynamic protection region. The expected value of probability of traffic conflict can be
calculated using equation 3.10. Expected probability of traffic conflict for passenger
vehicles in the range 3.5-6 s can be calculated as 0.27.
StartDDZBEndDDZ
xxf
StartDDZBEndDDZB
dxxf
flictTrafficConprE
EndDDZB
StartDDZB TCpr
EndDDZB
StartDDZB
TCpr
)()(
))(()(
)(
(3.10)
where,
))(( flictTrafficConprE is the expected probability of having traffic conflicts over the
given dynamic dilemma zone region;
StartDDLBis the start dynamic dilemma zone boundary distance;
EndDDLB End dynamic dilemma zone boundary distance;
)()( xf TCpris the dilemma hazard function.
3) The safety benefits of the protection zone can be obtained by multiplying the
expected probability of traffic conflict for a given set of DDZB by the monetary
benefit associated with saving a single vehicle conflict, as shown in equation 3.11:
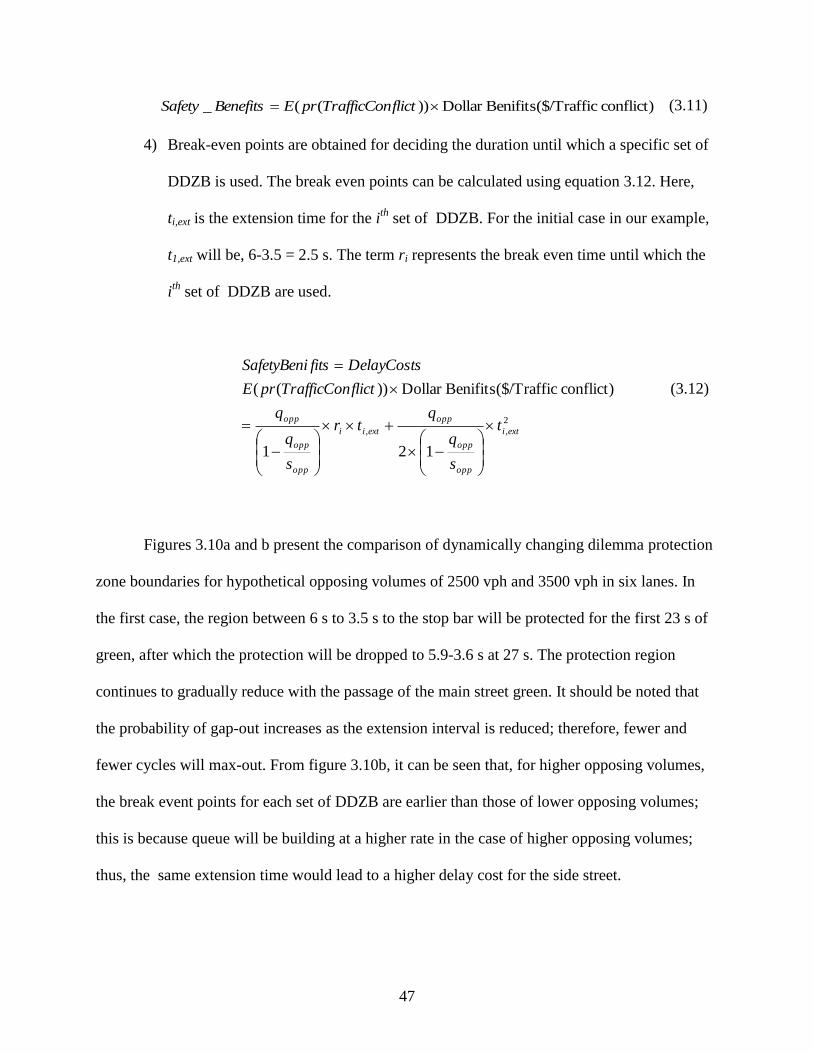
47
conflict) /TrafficBenifits($Dollar ))((_ flictTrafficConprEBenefitsSafety (3.11)
4) Break-even points are obtained for deciding the duration until which a specific set of
DDZB is used. The break even points can be calculated using equation 3.12. Here,
ti,ext is the extension time for the ith
set of DDZB. For the initial case in our example,
t1,ext will be, 6-3.5 = 2.5 s. The term ri represents the break even time until which the
ith
set of DDZB are used.
2
,,
121
conflict) /TrafficBenifits($Dollar ))((
exti
opp
opp
opp
extii
opp
opp
oppt
s
q
qtr
s
q
q
flictTrafficConprE
DelayCostsfitsSafetyBeni
(3.12)
Figures 3.10a and b present the comparison of dynamically changing dilemma protection
zone boundaries for hypothetical opposing volumes of 2500 vph and 3500 vph in six lanes. In
the first case, the region between 6 s to 3.5 s to the stop bar will be protected for the first 23 s of
green, after which the protection will be dropped to 5.9-3.6 s at 27 s. The protection region
continues to gradually reduce with the passage of the main street green. It should be noted that
the probability of gap-out increases as the extension interval is reduced; therefore, fewer and
fewer cycles will max-out. From figure 3.10b, it can be seen that, for higher opposing volumes,
the break event points for each set of DDZB are earlier than those of lower opposing volumes;
this is because queue will be building at a higher rate in the case of higher opposing volumes;
thus, the same extension time would lead to a higher delay cost for the side street.

48
a) Break-even points for opposing volume of 2500 vph
b) Break-even points for opposing volume of 3500 vph
Figure 3.10 Dynamic dilemma zone boundaries for a passenger vehicle
65.9
5.85.7
5.65.5
5.45.3
3.53.6
3.73.8
3.94
4.14.2
3
4
5
6
0 20 40 60 80 100
Tim
e t
o t
he S
top
Bar
(sec)
Main Street Green (sec)
65.9
5.85.7
5.65.5
5.45.3
3.53.6
3.7
3.83.9
44.1
4.2
3.5
4.5
5.5
6.5
0 20 40 60 80 100 120 140
Tim
e t
o t
he S
top
Bar
(sec)
Main Street Green (sec)

49
A technique similar to that utilized in the case of passenger vehicles can be used to
develop site-specific dynamic dilemma zone boundaries for trucks or other heavy vehicles. A
detailed discussion of the feasibility of implementation is provided in the next chapter.
3.8 Synthesis
The methodology presented in this chapter quantitatively assessed the risk of crash for
passenger vehicles and heavy vehicles facing yellow phases at a high-speed intersection. The
chapter extended the current literature on determining dilemma zone boundaries by providing a
methodology to ascertain the probability of a traffic conflict for a single vehicle, thereby
providing practitioners with a valuable tool for controlling signal operation, in order to
quantitatively compare trade-offs between safety and efficiency at intersections. It also provided
researchers with a potential tool for quantifying safety in other transportation applications.
A key conclusion drawn from this chapter is that the dilemma zone hazard function
developed for single vehicle conflicts is not a binary function—as is typically assumed for the
traditional dilemma zone definitions—but, rather, is a stochastic function which yields the
probability of a perceived conflict given the ambient conditions. This function also classifies
risk, based on the severity of the evasive action required, as severe or minor conflicts. Also, we
found that heavy vehicles need to be protected over approximately twice the amount of time (3-
8.2 s) in comparison to passenger vehicles (3.5-6 s) in order to maintain the same probability of
traffic conflict.
This research proposed real-time estimation of the dilemma zone hazard function for
different intersection and vehicle types using smart wide area sensors.
50
Chapter 4 Conclusions and Recommendations
It is estimated that there are 68 million instances per year at high speed intersections of
signal change to the yellow phase, accompanied by the possibility of dilemma zone incursions.
The four attributes of a dilemma zone hazard system that need to be carefully designed for
dilemma zone protection are: the surrogate measure of safety and efficiency, signal control logic,
the sensor system layout, and feasibility of implementation.
A brief discussion of the limitations of the current system in regards to these attributes
was provided in chapter 2. Chapter 3 presented the dilemma hazard functions for passenger
vehicles and heavy vehicles, and introduced an economic costs-benefit framework developed to
inform the safe and efficient operation of high speed intersections through analysis of the ratio of
marginal costs of delay over marginal enhanced safety benefits; the chapter also introduced a
proposed methodology to develop a dilemma hazard function as an improved surrogate measure
of safety.
The following section describes a methodology for implementing the proposed
improvements as a dilemma zone protection system. A wide area detector can be designed to
overcome the shortcomings of the current system.
4.1 Wide Area Detector
An adaptive wide area detector is envisioned to overcome the limitations in existing
dilemma zone protection systems. The prototype sensor could leverage current smart sensor
technologies, and would have following built-in features:
1. The sensor would house embedded logic to generate a site-specific and mode-specific
dynamic dilemma hazard function using the methodology presented in chapter 3. This

51
sensor would be able exploit valuable historical data to generate curves sensitive to
inclement weather conditions and special events.
2. The sensor would implement a cost-benefit analysis model using estimated safety and
estimated delay costs to minimize the total system cost of operation.
3. The sensor would be able to track each vehicle through the dilemma zone, and also to
sense the class of vehicle in order to implement an appropriate dilemma hazard
function.
4.2 Feasibility of the Implementation of a Prototype Adaptive Sensor
4.2.1 Cost of Implementation
Currently available wide area sensors cost in the range of $5,000 per sensor and can
detect one approach. This cost is comparable to the cost of an inductive loop at approximately
$2,500 per loop. It is estimated that the cost differential could be quickly eliminated, as the
number of lanes being monitored by WAD increases.
4.2.2 Special Controller
The prototype adaptive sensor would be a smart sensor, meaning that the adaptive logic
of generating a dilemma hazard function would be embedded in the sensor. Also, it would have
embedded marginal costs and benefits signal logic. The final output from the smart sensor
therefore could be made to be compatible with the existing signal controller, thereby avoiding
any need for an advanced controller.
4.2.3 Technical Expertise Needed to Program the Sensor
Most of the sensor parameters would be self-organizing and would adapt to the data
collected from the site of implementation. There would be some start-up values for sensor
parameters in order to operate the intersection prior to the point in time when enough history is
52
generated to self-organize the sensor. All default values could be factory programmed, and thus
made very easy to install on site.
4.2.4 Feasibility of the Development of Such a Sensor
Following the completion of this research, the sensor described herein is not considered
to be a very difficult leap. The greatest foreseeable limitation is obtaining a wide area sensor
with satisfactory performance. If such an operational sensor were developed, the prototype
adaptive sensor could be developed with minimal effort.
4.3 Conclusion
The methodology presented in this report quantitatively assessed the risk of crash for a
driver facing a yellow phase on a high-speed intersection, while also being specific to the mode
of vehicle (passenger vehicle, heavy vehicle). This methodology extends the current literature on
determining dilemma zone boundaries to enable researchers to ascertain the probability of traffic
conflicts for single vehicles—thus providing practitioners with a useful tool for controlling signal
operation while quantitatively comparing trade-offs between safety and efficiency at
intersections. We found that, rather than being a binary function, the dilemma zone hazard
function developed for mode-specific single vehicle conflicts was a stochastic function, yielding
the probability of a conflict given the ambient conditions. It was found that heavy vehicles had a
significantly wider dilemma zone boundary (5.2 s) than passenger vehicles (2.5 s). This implies
that the mode-specific boundaries need to be calculated for each site, instead of protecting the
heavy vehicles by using the same region as passenger vehicles.
This research also proposed a dynamic dilemma zone protection algorithm for
implementing a marginal costs-benefit approach. The proposed algorithm gradually decreases
the safety net as the queue on the side streets starts to build. This approach increases the

53
economic efficiency of operations, in addition to reducing the probability of max-out, thus
enhancing safety at the intersection.
The dilemma hazard function assigns a higher probability of traffic conflict to the central
region, with risk deteriorating toward the boundaries. The dilemma hazard function is a case
sensitive function, and depends on several other variables such as geometric conditions, mode of
transportation, weather conditions, time of day, and driver aggressiveness. The range of the
region to be protected will change depending on the dilemma hazard function; a steeper dilemma
hazard function will reduce the region to be protected, thus the initial DDZB will have a lower
value. Thus, a case sensitive design of the dilemma hazard function is needed to ensure safe and
efficient operations. Wide area detectors could be used for real-time development of a dilemma
zone hazard function for any intersection. A smart sensor could develop the probability of the
stopping curves. Note that the process of manual calculation could be replaced by computational
logic built into the smart sensor. The probability of stopping curves could then be used to
develop a dilemma hazard function. The use of smart sensors would facilitate data collection to
account for variables such as mode of transportation, weather conditions, time of day, driver
aggressiveness, etc.
The methodology proposed in this study could be used to reduce delay and improve
safety at high-speed intersections by using novel stochastic paradigms to overcome the
limitations of the current generation of dilemma zone protection systems. Improved
methodological constructs are proposed using only currently-utilized variables in signal
hardware logic, thereby circumventing expensive infrastructure upgrade costs.
54
4.4 Future Research
It is recommended that future research pursues the development of a prototype adaptive
sensor that could model a dilemma zone hazard function for different intersection and weather
conditions using smart, wide area sensors. Future research is also needed to estimate the
dilemma zone hazard function for multiple vehicle conflicts.
55
References
Baker W. 1972. “An evaluation of the traffic conflict technique.” Highway Research Record,
384: 1-8.
Bonneson, J., P. McCoy, and B. Moen. 1994. “Traffic detector design and evaluation
guidelines.” Report No. TRP-02-31-93, Nebraska Department of Roads, Lincoln,
Nebraska.
Bonneson, J., and K. Zimmerman. 2005. "In-service evaluation of a detection-control system for
high-speed signalized intersections.” Report No. FHWA/TX-05/5-4022-01-1, Texas
Department of Transportation, Austin, TX.
Bonneson, J., K. Zimmerman, and M. Brewer. 2002. “Engineering countermeasures to reduce
red-light running,” Report No. 4027-2. Federal Highway Administration, Washington,
D.C.
Chang, M., C. Messer, and A. Santiago. 1985. “Timing traffic signal change intervals based on
driver behavior.” Transportation Research Record, 1027: 20-30.
Cooper, P. 1973. “Predicting intersection accidents.” Ministry of Transport, Canada Road and
Motor Vehicle Traffic Safety Branch.
Cooper, D., and N. Ferguson. 1976. “Traffic studies at T-junctions: 2. A conflict simulation
model.” Traffic Engineering and Control, 17: 306-309.
Fazio, J., J. Holden, and N. Rouphail. 1993. “Use of freeway conflict rates as an alternative to
crash rates in weaving section safety analysis.” Transportation Research Record, 1401:
61-69.
Federal Highway Administration Safety Website, 2002, Stop Red Light Running
safety.fhwa.dot.gov/programs/srlr.htm
Federal Highway Administration. 2005. Federal motor carrier safety regulations. Washington,
D.C.: author.
Federal Motor Carrier Safety Regulations. FHWA. Aug. 2005.
Gates, T., D. Noyce, and L. Laracuente. 2007. “Analysis of dilemma zone driver behavior at
signalized intersections.” Transportation Research Record, 2030: 29-39.
Gazis, D., R. Herman, and A. Maradudin. 1960. “The problem of amber signal light in traffic
flow.” Operations Research, 8, no. 1: 112-132.

56
Gettman, D. and L. Head. 2003. “Surrogate safety measures from traffic simulation models.”
Report No. FHWA-RD-03-050, Federal Highway Adninistration, U.S. Department of
Transportation, Washington D.C.
Gettman, D., L. Pu, T. Sayed, and S. Shelby. 2008. “Surrogate safety assessment model and
validation: Final report.” Publication No. FHWA-HRT-08-051. U.S. Department of
Transportation, Federal Highway Administration, Washington, D.C.
Glauz, W., K. Bauer, and D. Migletz. 1985. “Expected traffic conflict rates and their use in
predicting accidents.” Transportation Research Record, 1026: 1-12.
Glauz, W., and Migletz, D., 1980, “Application of Traffic Conflict Analysis At Intersections,”
NCHRP Report 219. TRB, National Research Council, Washington, D.C.
Glennon J., W. Glauz, M. Sharp, and B. Thorson. 1977. “Critique of the traffic-conflict
technique.” Transportation Research Record, 1026: 1-12.
ITE technical committee 18, (P. Parsonson, Chairman). 1974. “Small-area detection at
intersection approaches.” Traffic Engineering, February 1974, Institute of Transportation
Engineers, Washington D.C., 8-17.
ITS deployment statistics database, 2004.
http://www.itsdeployment.its.dot.gov/Results.asp?year=2004&rpt=M&filter=1&ID=322
Kikuchi, S., Perincherry, V., Chakroborty, P., and Takahashi, H, 1993, “Modeling of Driver
Anxiety during Signal Change Intervals,” Transportation Research Record, No. 1399, pp
27-35.
Klir, G., and Folger, T., 1988. Fuzzy Sets, Uncertainty and Information, Prentice Hall,
Englewood Cliffs, New Jersey.
Knodler Jr., M. A., and D. Hurwitz. 2009. “An evaluation of dilemma zone protection practices
for signalized intersection control.” Report No. 2009-6, University of Massachusetts
Transportation Center, Amherst, MA, Vermont Agency of Transportation, Montpelier,
VT.
Knoflacher, H. 1973. Der Einflusdes Grunblinkens auf die Leistungsfahigkeit und
Sicherheit Lichtsignalgeregelter Strassenkruezungen. Bundesministerium fur Bauten
and Tehnik, Heft 8.
Koll, H., M. Bader, and K.W. Axhausen. 2004. “Driver behaviour during flashing green before
amber: A comparative study.” Accident Analysis & Prevention, 36: 273-280.
Kronborg P. MOVA and LHOVRA Traffic Signal Control for Isolated Intersections, TFK
Report 1992:4E, TFK- Transport Research Institute, Stockholm, Sweden, December,
1992.

57
Kronborg, P., and F. Davidson. 1993. “MOVA and LHOVRA: Traffic signal control for isolated
intersections.” Traffic Engineering and Control, 34, no. 4: 193-200.
Kronborg, P., F. Davidsson, and J. Edholm. 1997. “Development and field trials of the SOS
algorithm for self optimising signal control at isolated intersections.” Publication TFK -
1997-05-07. Transportation Research Institute, Stockholm, Sweden.
Li, P. 2009. “Stochastic methods for dilemma zone protection at signalized intersections.”
Virginia Tech University, Blacksburg, VA.
Mahalel, D. and J. N. Prashker. 1987. “A behavioral approach to risk estimation of rear-end
collisions at signalized intersections.” Transportation Research Record, 1114: 96-102.
May A. D. 1968. “Clearance interval at flashing systems.” Highway Research Record, 221: 41-
71.
Middleton, D., D. Jasek, H. Charara, and D. Mors. 1997. “Evaluation of innovative methods to
reduce stops to trucks at isolated signalized intersections.” Report No. TX-97/2972-S,
Texas Transportation Institute, Texas A&M University System.
National Highway Traffic Safety Administration. 2006. Traffic Safety Facts 2005. Washington
D.C.: U.S. Department of Transportation, National Highway Traffic Safety
Administration.
National Highway Traffic Safety Administration. 2007. Traffic Safety Facts 2006. Washington
D.C.: U.S. Department of Transportation, National Highway Traffic Safety
Administration.
National Impacts Assessment. 2007. http://www.tfhrc.gov/safety/pubs/07042/chapter5.htm
National Safety Council, 2007b. Web Link: <http://www.nsc.org/resources/issues/estcost.aspx>
Olson, P., and R. Rothery. 1962. “Driver response to amber phase of traffic signals.” Highway
Research Board, 330: 40-51.
Paddock, R. 1974. “The traffic conflict technique: An accident prediction method.” Ohio
Department of Transportation, Division of Highways, Bureau of Traffic Control.
Parsonson, P. 1978. “Signalization of high speed, isolated intersections.” Transportation
Research Record, 681: 34-42.
Perkins, S. R., and J. I. Harris. 1968. “Traffic conflict characteristics: Accident potential at
intersections.” Highway Research Record, 225: 45-143.
58
Sharma, A., D. Bullock, and S. Peeta. 2007. “Recasting dilemma zone design as a marginal
costs-benefits problem.” Transportation Research Record, 2035: 88-96.
Sharma, A., D. Bullock and S. Peeta. 2011. “Estimating dilemma zone hazard function at high
speed isolated intersection.” Transportation Research Part C: Emerging Technologies,
19, no. 3: 400-412.
Sharma, A., M. Harding, B. Giles, D. Bullock, J. Sturdevant, and S. Peeta. 2008. “Performance
requirement and evaluation procedures for advance wide area detector.” Paper presented
at the 87th Annual Meeting of the Transportation Research Board, Washington, D.C.
Sheffi, Y., and M. Mahmassani. 1981. “A model of driver behavior at high speed signalized
intersections.” Transportation Science, 15, no. 1: 51-61.
Spicer, B. A. 1972. “A traffic conflict study at an intersection on the Andoversford by-pass.”
TRRL Report LR 520, Transport and Road Research Laboratory, Road User
Characteristics Division, Safety Department.
Van der Horst, R. and A. Wilmink, 1986, “Driver’s Decision-Making at Signalized Intersections:
An Optimization of the Yellow Timing,” Traffic Engineering & Control. pp. 615-622.
Wang, P., 1983, Advances in Fuzzy Sets, Possibility Theory and Applications, Plenum Press,
New York.
Wavetronix. 2009. “SmartSensor Advance.”
www.wavetronix.com/en/products/smartsensor/advance/safearrival. Accessed February
9, 2011.
Webster, F., and P. Ellson. 1965. “Traffic signals for high speed roads.” Road Research
Laboratory Technical Paper No. 74. H.M.S.O, London.
Yager,R., 1982, “Measuring Tranquility and Anxiety in Decision Making: An Application of
Fuzzy Sets,” International Journal of General Systems, Vol. 8, pp 139-146.
Yager, R., and Kikuchi, S., 2004, “On the Role of Anxiety in Decision under Possiblistic
Uncertainty,” IEEE Transactions on Systems, Man and Cybernetics-Part : Cybernetics,
Vol. 34, No.2, pp 1224-1233.
Zadeh, L., Fu, K., Tanaka, K., and Shimura, M., 1974. “Fuzzy Sets and Their Applications to
Cognitive and Decision Processes.” Academic Press, New York.
Zeeger, C., 1977. “Effectiveness of green-extension systems at high-speed intersection.”
Research Report 472, Bureau of Highways, Kentucky Department of Transportation,
Lexington, Kentucky.
59
Zimmermann, H., 1990, Fuzzy Set Theory and Its Applications, Kluwer Academic Publisher,
Norwell, Massachusetts.
Zimmerman, K. 2007. “Development of a second generation detection-control system for safer
operation of high-speed signalized intersections.” Report No. TRB-NCHRP-115, Texas
Transportation Institute, Texas A&M University System.
Zimmerman, K. 2007. “Providing additional dilemma zone protection for trucks at high-speed
signalized intersections.” Transportation Research Record, 2009: 82-88.