report guidelines - civil engineering
TRANSCRIPT

Report Guidelines
CIVL 1101/1112 - Civil Engineering Measurements/Analysis
The University of Memphis Department of Civil Engineering
Memphis, TN 38152

Report Guidelines ii
Table of Contents
TITLE PAGE ....................................................................................................................................... 1
Critique of the Sample Title Page ................................................................................................. 1
COVER LETTER ................................................................................................................................ 3
Critique of the Sample Cover Letter .............................................................................................. 3
TABLE OF CONTENTS ..................................................................................................................... 5
LIST OF FIGURES AND TABLES ..................................................................................................... 5
EXECUTIVE SUMMARY .................................................................................................................... 7
GENERAL STRUCTURE FOR REPORTS ........................................................................................ 8
Introduction ................................................................................................................................... 9
Procedures/Methods ................................................................................................................... 10
Results ........................................................................................................................................ 11
Discussion ................................................................................................................................... 12
Conclusions................................................................................................................................. 12
Recommendations ...................................................................................................................... 12
TABLES ............................................................................................................................................ 14
Critique of the Sample Tables ..................................................................................................... 15
GRAPHS ........................................................................................................................................... 16
Guidelines for Graphs ................................................................................................................. 16

Report Guidelines iii
List of Figures
Figure 1. Sample Title Page ............................................................................................................ 2
Figure 2. Sample Cover Letter ........................................................................................................ 4
Figure 3. Sample Table of Contents ................................................................................................ 6
Figure 4. Sample List of Figures ..................................................................................................... 7
Figure 5. Sample Figures .............................................................................................................. 18
List of Tables
Table 1. Elements of a Report and their Relationship to the Readers' Basic Questions. .............. 8
Table 2. Checklist for Overall Report ........................................................................................... 13
Table 3. Turbine Test Data and Results - Nozzle Setting = 6. ..................................................... 14
Table 4. Types, Composition, and Properties of Stainless Steel ................................................. 15
Table 5. Checklist for Graphs ....................................................................................................... 19

Report guidelines 1
TITLE PAGE
Some organizations require reports submitted to it from other organizations use a standard for-
mat. When this is the case, all information appears clearly and legibly. The report's title specifically
identifies both the report's function (what the report does) and the subject (what the report con-
cerns). Figure 1 illustrates a sample title page that is attractive and informs the reader of important
information.
Examples:
Vague: Motor Analysis
Clear: Performance Analysis of Model 26K Three-Phase Motor
Vague: Study of Apartment Building
Clear: Cost Feasibility Study of Oceanview Towers
Note: A feasibility study can address either cost or technical feasibility; therefore, the title should
indicate the appropriate feasibility.
Critique of the Sample Title Page
Information relating to the function and subject, report number, writer, recipient, and date sub-
mitted (important in contract disputes) are visible to the reader on the sample title page in Figure 1.
The placement of the information is balanced and aesthetically pleasing to the reader.
The title identifies the contents of the report. It begins with a functional heading, "Dodge Boat-
ing, Inc.," which tells the reader what the report does. The report's subject, "An Extended Feasibility
Study," immediately follows the function title, which tells the reader the reported subject. Because
both of these are essential items on the cover page, they are in uppercase letters in the upper half
of the page. The report number appears immediately below the title. Less critical items are titled for
easy identification and indicated in the lower half of the page.

Report guidelines 2
Figure 1. Sample Title Page
Dodge Boating, Inc. An Extended Feasibility Study
Report Number CIVL1101-1 (W)
Date Submitted: October 1, 2017
Prepared by: Group Name Individual Group Member’s Names Address Memphis, TN
Prepared for: Dr. Charles V. Camp The University of Memphis Department of Civil Engineering Memphis, TN 38152
Report guidelines 3
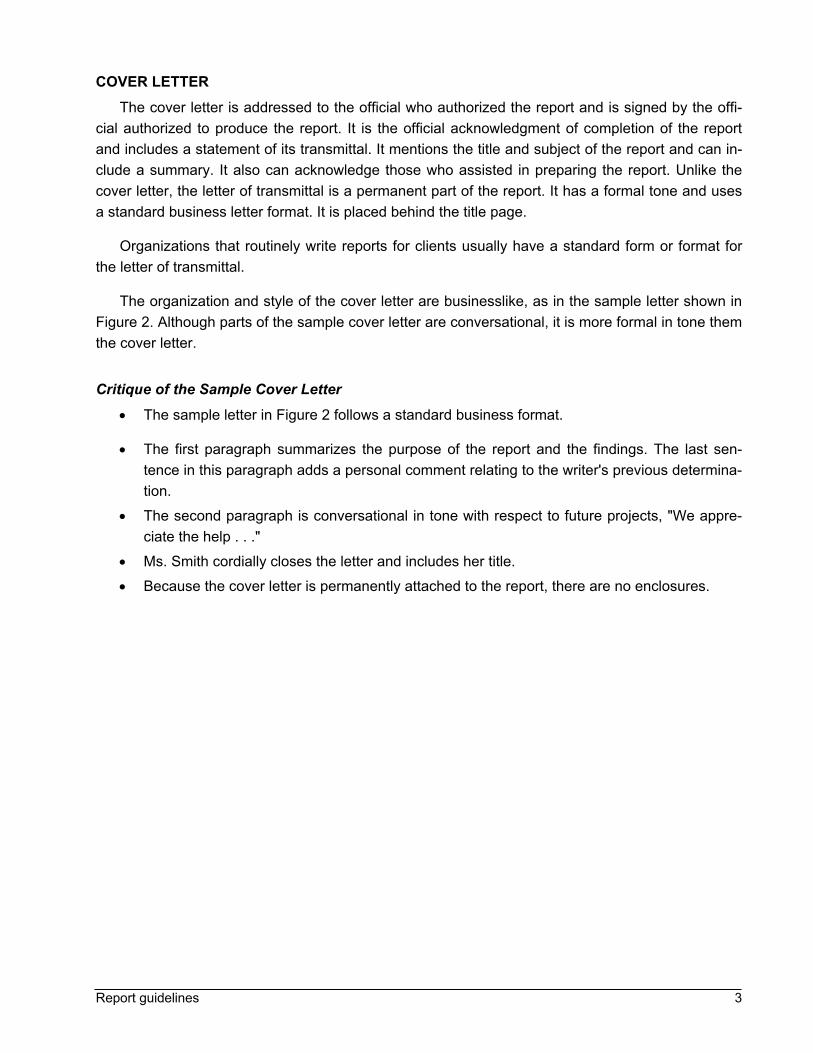
COVER LETTER
The cover letter is addressed to the official who authorized the report and is signed by the offi-
cial authorized to produce the report. It is the official acknowledgment of completion of the report
and includes a statement of its transmittal. It mentions the title and subject of the report and can in-
clude a summary. It also can acknowledge those who assisted in preparing the report. Unlike the
cover letter, the letter of transmittal is a permanent part of the report. It has a formal tone and uses
a standard business letter format. It is placed behind the title page.
Organizations that routinely write reports for clients usually have a standard form or format for
the letter of transmittal.
The organization and style of the cover letter are businesslike, as in the sample letter shown in
Figure 2. Although parts of the sample cover letter are conversational, it is more formal in tone them
the cover letter.
Critique of the Sample Cover Letter
The sample letter in Figure 2 follows a standard business format.
The first paragraph summarizes the purpose of the report and the findings. The last sen-
tence in this paragraph adds a personal comment relating to the writer's previous determina-
tion.
The second paragraph is conversational in tone with respect to future projects, "We appre-
ciate the help . . ."
Ms. Smith cordially closes the letter and includes her title.
Because the cover letter is permanently attached to the report, there are no enclosures.

Report guidelines 4
Figure 2. Sample Cover Letter
Business Opportunities & Investigations, Inc.
111 Gawin Street Benson, AK 58392
(433) 542-9485 October 3, 2004 Mr. Charles Richmond, President Coastal Corporate Investments, Inc 2332 Sudan Road New Berne, AL 43627 Dear Mr. Richmond: As we briefly discussed at Pamlico Tar River Foundation's oyster roast in early November, Dodge Boating, Inc., is a quite profitable enterprise. Following up on your interest in the company; our re- searchers and analysts have put together the figures you requested on the company's status and potential based on evaluations of the financial statements and examinations of the firm’s tangible and intangible assets. We also held a brief meeting with Ms. Pamela Hawke, the current owner and CEO of Dodge Boating. We appreciate the help your of office staff, especially James Overton and Maria Sanchez, gave us in providing the criteria you use for determining whether to recommend investments for your clients. Based on your formula, our initial research shows that Dodge Boating, Inc., is a sound business opportunity for your investors, and we encourage you to continue with investigations. After your review, I would be delighted to answer any questions you have about the report, about Dodge Boating, or about any other possible investments. At that point, our team will have com-pleted a more detailed evaluation of Dodge Boating, Inc., including a Level I Environmental As-sessment. I look forward to hearing from you. Sincerely; Betty Smith Account Representative
Context and major finding Work accomplished Methods
Appreciation for staff support Finding reiterated Offer to answer questions Work remaining

Report guidelines 5
TABLE OF CONTENTS
A table of contents is required when a report is longer than several pages to help readers de-
termine its subject matter, its organization, and the location of sections of interest. Readers some-
times use the table of contents as an abstract. When the major headings have subheadings and
sub-sub headings, these are indented from the major and subheadings. Figure 3 shows a sample
table of contents.
Including a table of contents in a report serves two purposes. First, it helps readers who do not
want to read the whole communication in sequence but instead want to find particular parts of it -
the description of the research method, the proposed schedule, the budget, and so on. To these
readers, the table of contents is like an expressway through your document that leads them directly
to their destination.
A table of contents also helps readers who will read sequentially through your text. Also, like a
summary, a table of contents enables readers to quickly see the general scope and arrangement of
the material you cover, so they can begin to build the mental framework to organize the various
pieces of information they will gain from the communication. Because such frameworks are so help-
ful to readers, many people read the table of contents before looking at anything else in a commu-
nication.
LIST OF FIGURES AND TABLES
When your readers are looking for some part of your communication, they may be looking not
for a specific paragraph but a particular table, drawing, or other graphic aid. You can help them by
including a list of tables and a list of figures. By custom, the list of figures and list tables follow the
table of contents. Figure 4 shows a sample list of figures.

Report guidelines 6
Figure 3. Sample Table of Contents
Table of Contents Introduction ....................................................................................................................... 1 WHPA – RESSQC .............................................................................................................. 3
Capabilities, Assumptions and Limitations................................................................... 4 RESSQC Input Variables............................................................................................. 4 Stochastic RESSQC .................................................................................................... 5
Geohydrologic Data Requirements ................................................................................. 7
Sources of Information ................................................................................................ 7 Geographic Information Systems ................................................................................... 9
Paris GIS Data Base 10 Geohydrology of the City of Paris Wellfield ................................................................. 12
General Geology of Henry County (Wells, F. G. (1933) ............................................ 12 McNairy Sand (Wilson and Criner, 1969) .................................................................. 13 Transmissivity ............................................................................................................ 14 Aquifer Thickness ...................................................................................................... 14 Hydraulic Gradient ..................................................................................................... 15 Porosity...................................................................................................................... 15 Paris Pumping Rates ................................................................................................. 15 RESSQC Input Summary .......................................................................................... 17
Capture Zone Delineations ............................................................................................ 18
Zone 1A and Zone 1B ............................................................................................... 20 Zone 2A and Zone 2B ............................................................................................... 22 40-Year Capture Zone ............................................................................................... 24
Potential Contaminant Source Inventory ..................................................................... 25
Potential Contaminant Source List ............................................................................ 25 Risk Assessment Index ............................................................................................. 28 Underground Storage Tanks ..................................................................................... 28
Wellhead Protection Plan Implementation ................................................................... 30
Agency Requirements ............................................................................................... 30 Wellhead Plan Implementation .................................................................................. 30
Acknowledgments .......................................................................................................... 33 References ...................................................................................................................... 34 Appendix A - Wellhead Protection Areas ................................................................... A–1
Map 1 - Wellhead Protection Area - Zone 1A and Zone 1B ..................................... A–2 Map 2 - Wellhead Protection Area - Zone 2A and Zone 2B ..................................... A–3
ii

Report guidelines 7
Figure 4. Sample List of Figures
List of Figures
Figure 1. Information Contained in the GIS Data Base for Deep Water, Tennessee. ..................... 11
Figure 2. Geologic Map of Henry County. ....................................................................................... 13
Figure 3. Stratigraphic Electric Log and Gamma–ray Log Cross Sections
of Test Wells in Henry County (Russell and Parks, 1975). .............................................. 14
Figure 4. Locations of production wells in the Deep-Water Wellfield. ............................................. 16
Figure 5. Probability Function for Deep Water Wellhead Protection Areas Zone 1. ........................ 20
Figure 6. Deep Water Wellhead Protection Areas Zone 1. ............................................................. 21
Figure 7. Probability Function for Deep Water Wellhead Management Area Zone 2. ..................... 22
Figure 8. Deep Water Wellhead Management Area Zone 2. .......................................................... 23
Figure 9. Probability Function for the Paris 40-Year Capture Zone. ................................................ 24
iii

Report guidelines 8
GENERAL STRUCTURE FOR REPORTS
When trying to use and understand information readers find in reports, they usually ask the
same basic questions. The general structure for reports is a pattern that writers and readers have
successfully answered those basic questions. Therefore, you will prepare yourself to understand
the report structure and use it effectively by thinking about your readers' questions. The readers' six
basic questions are as follows:
What will we gain from your report? - Most people want to read only those communica-
tions that are directly useful to them. Therefore, you need to explain your complications rel-
evant to the readers' interests, responsibilities, and concerns.
Are your facts reliable? - Readers want to be sure that the facts you supply will provide a
sound basis for their decisions or actions.
What do you know that is useful to us? - Readers don't want you to tell them everything
you know about your subject; they want you to tell them only those facts they must know to
do the job that lies before them.
How do you interpret those facts from our point of view? - Facts alone are meaningless.
To give facts meaning, people must interpret them by pointing out relationships or patterns
among them.
How are those facts significant to us? - Readers generally want you to go beyond an in-
terpretation of the facts to explain what the facts mean in terms of the readers' responsibili-
ties, interests, or goals.
What do you think we should do? - Because you will have studied the facts in detail, your
readers will often want you to tell them what action you think they should take.
The general structure for reports contains six elements, one for each of the six basic questions:
introduction, method of obtaining facts, facts, discussion, conclusions, and recommenda-
tions. Table 1 lists the six elements and how they are related to the readers' basic questions. Of
course, each element of the report structure may serve important purposes and answer the general
question identified with it. Also, the six elements may be arranged in many ways, and one or more
of them may be omitted if circumstances warrant. It is not uncommon to present two or more of the
six elements under a single heading.
Table 1. Elements of a Report and their Relationship to the Readers' Basic Questions.
Report Element Readers' Question
Introduction/Background What will we gain from your report?
Procedure/Methods Are your facts reliable?
Results What do you know that is useful to us?
Discussion How do you interpret those facts from our point of view?
Conclusions How are those facts significant to us?
Recommendations What do you think we should do?

Report guidelines 9
Introduction
In the introduction of a report, you answer your readers' question, "What will we gain by reading
your report?" In some reports, you can answer the question in a sentence or less. In more extended
reports, your explanation of the relevance of your information to your readers may take many pag-
es, in which you tell such things as:
What problem your report will help solve
What activities you performed toward solving that problem
How your audience can apply your information in their efforts toward solving the
problem
Besides telling your readers what your communication offers them, your introduction may serve
many other functions. The most important of these is to tell your main points. In most reports, your
main point will be your major conclusions and recommendations. Although you should save a full
discussion of these topics for the sections devoted to them at the end of your report, your readers
will usually appreciate a summary of them - perhaps in a sentence or two in your introduction. In
brief reports (for example, one-page memos), a statement of your main points may even replace
the conclusions and recommendations that would otherwise appear at the end. The INTRODUC-
TION section should conform to the following guidelines:
It gives a short, conceptual overview of the report
Defines the purpose and objectives of the report
Provides an in-depth description of the concepts involved in the experiment or report
Does not refer to results in this section
Mathematical derivations are typically not necessary
Although references are not required in the INTRODUCTION section, you should research dif-
ferent sources of information (textbooks, magazines, etc.) to obtain sufficient background material.

Report guidelines 10
Procedures/Methods
In a report, the discussion of your method of obtaining your facts can serve a wide variety of
purposes. Report readers want to assess the reliability of the facts you present: the discussion of
your method tells the reader how and where you got your facts. It also suggests to your readers
how they can gain additional information on the same subject. For example, if you obtained your
information through reading, you would direct your readers to those sources. If you obtained your
data through an experiment, survey, or other special technique, your account of your method might
help others design similar projects.
The procedure section gives a "technical description" of how the measurements were ob-
tained (it does not include calculations).
Provide an in-depth description of how the measurements were obtained (including the type
of instrumentation).
Use past tense to describe what was performed
Use present tense to describe: (a) the capacity of a device; (b) a property of a material; (c)
where values are located in the report.
Avoid writing, ". . . readings were taken . . ."
For every procedure, you must have a figure.
The actual values of the measurements can be stated in the RESULTS section.

Report guidelines 11
Results
Your facts are the individual pieces of evidence that underlie and support your conclusions and
recommendations. If your report is based upon laboratory, field, or library research, your facts are
the verifiable pieces of information you gathered: the laboratory data you obtained, the survey re-
sponses you recorded, or the knowledge you assembled from printed sources. If your report is
based on your efforts to design a new product, procedure, or system, your facts reflect various as-
pects of what you designed or created.
In summary, your facts are the separate pieces of information you present as objectively verifia-
ble. You may present your facts in a section of their own, or you may combine your presentation of
your facts with your discussion of them, as explained next. The RESULTS section should conform
to the following guidelines:
The RESULTS section briefly states or points to the actual measurements and then de-
scribes how the calculations were made.
State each equation in terms of what has been previously measured or calculated.
Define every symbol in the equation (if not defined earlier in the report).
Refer to where the values are located in the report.
Never refer the reader to your original datasheets.
All measurements or calculations should be either in written text or in a table.
State every equation used in your calculations, except conversion formulas, statistical for-
mulas, simplistic formulas, and geometric formulas.
Avoid writing, "The formula used was . . ."
Do not include sample calculations in this section.
Do not interpret the results in the RESULTS section.
Below is a sample equation and the definition of the variables.
e
VDR
The Reynolds number Re can be determined as follows
where V is velocity (ft/s), D is hydraulic diameter (ft), and is the kinematic vis-cosity (ft2/s). Values for Re can be found in Table 3 and are plotted as a function of time in Figure 4.
(3)

Report guidelines 12
Discussion
Facts, taken alone, mean nothing. They are a table of data, a series of isolated observations, or
pieces of information without meaning. Therefore, an essential element of every report you prepare
will be your discussion of the facts, in which you interpret the facts in a way significant to your read-
ers.
Sometimes, writers have trouble distinguishing between a presentation of the facts and a dis-
cussion of them. The following example may help to make the distinction clear. Imagine that you
observed that when the temperature is 65°F, the precision of a surveyed distance is ±0.03 ft; when
it is 70°F, the precision is ±0.03 ft; when it is 75°F, the precision is ±0.04 ft, and when it is 80°F, the
precision is ±0.06 ft. Those would be your facts. If you were to say, "As the temperature rises above
70°F, so does the precision of the distance measured," you would be interpreting those facts.
Of course, in many reports, you will be dealing with much larger and more complicated sets of
facts that require much more sophisticated and extended interpretation. But the basic point remains
the same: when you begin to make general statements based upon your facts, you interpret them
for your readers. You are discussing them.
In many of the communications you write, you will weave your discussion of the facts together
with your presentation of them. In such situations, the interpretations often serve as the topic sen-
tences for paragraphs.
Whether you integrate your presentation and discussion of the facts or treat the two separately,
you need to remember that your readers count upon you to select the relevant facts and discuss
those facts in a meaningful way.
Conclusions
Like interpretations, conclusions are general statements based on your facts. However, conclu-
sions focus not simply on interpreting the facts but on answering the readers' question, "How are
those facts significant to us?" Brief, explicit statements of conclusions are almost always desired
and welcomed by report readers.
Recommendations
Just as conclusions grow out of interpretations of the facts, recommendations grow out of find-
ings. They answer the readers' question, "If your conclusions are valid, what should we do?"
As mentioned above, you can help your readers immensely by stating your major recommenda-
tions at the beginning of your report. On the other hand, if your communication is long or if a full
discussion of your recommendations requires much space, you can summarize your recommenda-
tions generally at the beginning of your report and then treat them more extensively at the end.
Although readers usually want recommendations in reports, you may encounter situations
where you will not want to include them. That might happen, for instance, in either of the two follow-
ing cases:

Report guidelines 13
The decision being made is clearly beyond your competence, and you have been asked to
provide only a small part of the information your readers need to make the decision.
You are working in a situation where the responsibility for making recommendations belongs
to your boss or other people.
Table 2 lists a general checklist for technical reports.
Table 2. Checklist for Overall Report
Item Check Box
Title Page and required information
Letter of Transmittal in a proper format
Table of Contents
List of Figures/Tables (if required)
Executive Summary
Introduction/Background Section
Procedure/Methods Section
Discussion Section
Summary/Conclusions
Recommendations
The text should be double-spaced
Avoid using "I, we, my lab partners, . . ."
All numerical values must have units
All text in 12 point font size
Section titles are centered and typed in all caps and bold font
Equations are centered and numbered
Table headings placed at the top of the table
Figure captions placed at the bottom of the figure
Figures and tables are numbered consecutively based on the order they appear in the report
Figures and tables are located immediately after the page where they are first mentioned
For landscaped figures, the bottom is oriented towards the right and the top towards the left
Proper pagination

Report guidelines 14
TABLES
Tables are often used because the information may be presented without interpretation by the
writer. However, numerical data are frequently interpreted by the writer and presented in the same
or subsequent tables. Tables show data or facts in matrix form (a rectangular array of numerical
quantities or facts) and give the reader latitude to analyze and understand their meaning. For ex-
ample, data collected from a laboratory experiment are ordinarily recorded in tables (see Table 3).
Also, tables are used effectively for non-numerical facts (see Table 4). Tables may be accompanied
by graphs or charts that demonstrate the relationship between the data or facts.
Follow these guidelines to set up a table:
Place the table number with a title near the top of the table.
Label the top of each column and the left side of each row with a title.
When all units of measurement for the table are the same, place the units with the caption of
the table (e.g., "Length, ft."). Otherwise, include the units of measurement in parentheses
with the column or row headings.
For a table with numerical data, line up the decimal points in each column
Indicate detailed explanations for data or facts in the body of the table with a superscripted
number after the data or facts in the table. The explanations appear below the table (see
Figure 6).
When tables have more than five columns and five rows, when possible, separate the data
or facts into subsets to encourage reader attention. Then, either display the separation of
these subsets with double or bold lines or display these subsets in two or more tables.
Table 3. Turbine Test Data and Results - Nozzle Setting = 6.
Wheel Speed(N) (rpm)
Brake Load (lb)
Pnet
(lb) NxPnet
(lb/min) Brake
Horsepower
Efficiency, h (%)
300 8.2 6.4 1920 0.55 52
400 7.3 5.4 2160 0.62 58
500 5.7 4.0 2000 0.57 54
600 4.5 2.8 1680 0.48 45
6701 3.0 1.32 870 0.25 23 1 Maximum wheel speed 2 Pnet less than 2.0 is estimated

Report guidelines 15
Critique of the Sample Tables
Table 3 shows a six-column by a five-row table from a laboratory report. The table is divided into
three subsets separated by double vertical lines. The left section, "Wheel Speed," is the independ-
ent measured variable. The center section, which includes "Brake Load" and "Pnet," presents the
measured dependent variables. The right section consists of three columns of calculated data (re-
sults). Although the methods for determining the calculated data are appropriately not indicated,
sample calculations for determining these data should be included in a prior section of the report or
given in an appendix.
A title at the top of the table identifies the recorded data. Specific information concerning the
nozzle setting is included with the title.
Each column of the table is labeled, and the units of measurement are indicated in paren-
theses. Each row is identified by the selected wheel speed for which the data are measured.
The decimal points for the data in each column are lined up. All data are included with the
appropriate number of significant digits.
Data in the table that require additional explanations are superscripted in the body and are
explained at the bottom of the table.
Table 4 shows a non-numerical table used for determining the composition and description of
different types of stainless steel. The table is divided into three columns. Units of measurement, not
applicable for non-numerical data, are not included. Each row is headed with a type of stainless
steel. A title at the top of the table identifies its contents.
Table 4. Types, Composition, and Properties of Stainless Steel
Type No. Composition Description
302 Basic Type Cr 18%, Ni 8% Good formability
314 Lower C More weldable than 302
316 Higher Mo Resists saltwater
317 Higher Mo than 316 Good heat resistance, excellent corrosion resistance
405 Al added to Cr 12% Excellent heat resistance

Report guidelines 16
GRAPHS
A graph visualizes data that shows the interrelationship between two continuous variables, such
as temperature and time or stress and strain. Graphs are used for the following reasons:
A table in a laboratory report is ordinarily accompanied by a graph that includes the experi-
mental data points and a smooth curve approximating the path of these points to help the
writer determine the relationship between the two variables studied in the laboratory. The
scatter of these data points on either side of this smooth curve measures the validity of the
data.
A theoretical or design graph (a smooth graph without experimental data points) helps the
reader understand the relationship between the variables or is a source of technical infor-
mation for design or analysis.
Guidelines for Graphs
1. Any appropriate software program may be used to construct graphs. All graphs are to be
printed on laser printers.
2. Plot the independent variable (the variable that is controlled during a test or selected) along
the horizontal (x) axis and the dependent variable (the variable that is measured during a
test or determined) along the vertical (y) axis except when this is contrary to standard prac-
tice. Usually, the axis of the independent variable is longer than the axis for the dependent
variable.
3. Margins of 1 in. shall be maintained.
4. Axes should coincide with major subdivisions on the graph and be dark heavy lines.
5. The number of significant digits shown at the main divisions of each axis should be con-
sistent with the precision of the measuring instruments or the reliability of the results.
6. Scales should be selected to facilitate the plotting and checking of data. Preferably, the ma-
jor subdivisions should represent changes of 1 x 10n, 2 x 10n, or 5 x 10n in the plotted pa-
rameter; less desirable but acceptable scales are 4 x 10n and 8 x 10n. Do not use notation
such as "Stress, x 103 psi" in the labels on the ordinate or abscissa. Instead, use a label
such as "Stress (thousand psi)" or place the "x 103" beside the largest value on the ordinate
and abscissa scales.
7. Include the name of the variable measured and the units of measure, if any, in each axis ti-
tle. The symbol for the variable is sometimes included. The units of measure can be placed
in parentheses. For example, an axis title may read "Moment, M (ft-lb)."
8. The ordinate and abscissa should correspond to a conventional style when appropriate. For
example, force or concentration are plotted on the ordinate, and deformation or time are
presented on the abscissa. When this convention does not apply, the abscissa should be
used for the independent variable and the ordinate for the dependent variable.
9. Broken scales should be avoided. It is generally desirable that the origin of the axis system
be shown on the graph.

Report guidelines 17
10. Data points should be represented on a graph by a symbol (circle, square, diamond, or tri-
angle).
11. If a continuous mathematical expression plots the points, it should not be denoted by sym-
bols.
12. Scales should be selected to use the available graphing area effectively; the plotted data
should use a significant percentage of the paper and be approximately centered on the
page.
13. When data represents a phenomenon that should be a smooth continuous function (e.g.,
load vs. deflection of a beam), a smooth curve should be plotted using a "best fit" curve.
When data are presented for a non-continuous function (such as daily precipitation vs. day
of the year), it is common to connect individual data points with straight lines or use a bar-
graph style.
14. The ordinate and abscissa should be given clear labels in a consistent set of units (you
would not plot load in pounds against displacement in centimeters).
15. When several data sets are plotted on a single graph, different symbols should be used for
each data set and explained in a legend.
16. The graph should have a descriptive title. If you have plotted stress vs. strain, do not simply
repeat the ordinate and abscissa labels; this is redundant and adds no useful information.
However, a title such as "Uniaxial Tensile Test of A-36 Steel" might be suitable. The date of
the experiment/lab and the person or group who prepared the graph should be a part of the
title block.
17. Sometimes it is necessary to add a small figure or sketch to clarify the meaning of one or
more of the plotted parameters. The need for such additional information must be judged on
the ability of the reader to interpret the graph quickly.

Report guidelines 18
60,000
70,000
80,000
90,000
100,000
110,000
120,000
0 10 20 30 40 50 60 70 80 90 100
Cycles
Fra
me
Wei
ght
(lb)
Figure 5. Sample Figures
Figure 12. Typical Convergence History of One-Bay, Ten-Story Frame Design.
9
Figure 13. Compression stress-strain diagrams for copper.
Strain
0.2 0.4 0.6 0.8 1.0
20
40
60
Str
ess
(ksi
)
1.2
Phase 1 Phase 2
Average Frame Weight
Best Frame Weight

Report guidelines 19
Table 5. Checklist for Graphs
Guideline
#
Item Check Box
1 Proper paper
2 Proper orientation on the page
3 Margins
12 Plot approximately centered on the page
4 Axes are clearly defined and coincide with major subdivisions
5, 6 Convenient scales
9 Unbroken scales (and origin of axes present in most situations)
8 Ordinate and abscissa parameters conform to convention or guidelines
10, 16 Data properly presented with symbols
11 Mathematical functions properly presented (when appropriate)
13 Proper curves through data
9 Proper identification of scales on ordinate and abscissa
14 Properly labeled ordinate and abscissa
16 Proper title block
17 Useful figure or sketch when needed for clarity