report from the advisory panel on management and … · report from the advisory panel on...
TRANSCRIPT
1
Report from the Advisory Panel on Management and Non-Bargaining Staff Recruitment and Retention
March 31, 2016
Message from the Chair The Commission on the Reform of Ontario’s Public Services (2012) set an ambitious objective for the Ontario Government to deliver the best public services in the world at a cost that could be funded with a reasonable tax burden. The Commission felt the only ways to achieve this objective would be to improve the efficacy and efficiency of everything the Government does. It was recognized that success or failure would largely be determined by how well the roughly 8,000 managers in the Ontario Public Service (OPS) design and execute plans. To foster an environment that permitted the Government to hire and retain the best and brightest into management and ensure proper motivation, the Commission advised that managers should be appropriately compensated and rewarded for excellence. Instead, the Government has frozen salaries since 2011 and suspended merit pay. It is disconcerting but not surprising to observe many signs of stress within the Ontario Government’s management cadre. The Government announced some positive steps on December 15, 2015. However, for the most part those compensation and benefit adjustments will merely prevent the situation from deteriorating further. Urgent action is needed to have in place the kind of management cadre that can deliver on Ontario’s need to return and remain in fiscal balance while meeting important economic, social, environmental and other needs of the people of Ontario. Further pay adjustments are in order to ensure Ontario Government managers earn a competitive income. A merit pay regime must be restored. However, it should give substantial awards to the minority who go beyond their job requirements as opposed to the previous system that gave modest bonuses to almost everyone. The Ontario Government must ensure that its managers have the competencies to deliver in the modern environment where public service is more about leadership, policy design and program evaluation than the actual delivery of services which has increasingly been shifted to other parties. Recruitment and training practices must be sharpened to facilitate the replacement of the large number of managers who are about to retire and to ensure the management group is more representative of the Ontario population. A process must be put in place to ensure the ability to respond quickly to the stresses that arise in the future that could compromise the maintenance of a well-functioning management group. Finally, while it is beyond the terms of reference of this Panel to examine compensation and other terms of employment in the Broader Public Sector (BPS), we believe the type of review we have conducted here for managers within the OPS should in future be extended to the BPS. There will no doubt be some hesitation on the part of the Ontario Government to implement some of the recommendations made by the Advisory Panel because they will involve some additional cost, phased-in over time, at a time of expenditure restraint. There could be some public backlash. But it must be kept in mind that creating the right conditions for management to be effective is critical for achieving Government and public objectives, including restoring fiscal balance while maintaining and hopefully improving the quality of public services. In this sense, addressing the stresses within the management group is an investment toward broader goals. The need for action is urgent, inaction will only impair the quality of Ontario's public service.
2
****************************************************************************** On December 15, 2015, the Ontario Government announced the Advisory Panel on Management and Non-Bargaining Staff Recruitment and Retention. Work began immediately to identify the information the Panel would need for its deliberations. The Treasury Board Secretariat worked over the course of January and February to provide as much information as it could. A preliminary draft was submitted to the Treasury Board Secretariat on January 6 2016 to fulfill the requirement in the terms of reference for a draft addressing short-term issues by January 31, 2016. Membership of the Panel was completed in late February. The current version deals more thoroughly with the short-term issues and provides perspectives on the longer-term issues the Panel was asked to report on by March 31, 2016. The Panel would like to thank the Treasury Board Secretariat and others in the Ontario Government for their support, in particular in providing background information. The Panel also thanks Professor Richard Chaykowski of Queen’s University for support with research and drafting. The contents of this report including its recommendations are, however, exclusively the responsibility of the Panel and should not be attributed to the Treasury Board Secretariat or any other parts of the Ontario Government.
The Advisory Panel’s Membership and Mandate A. Membership
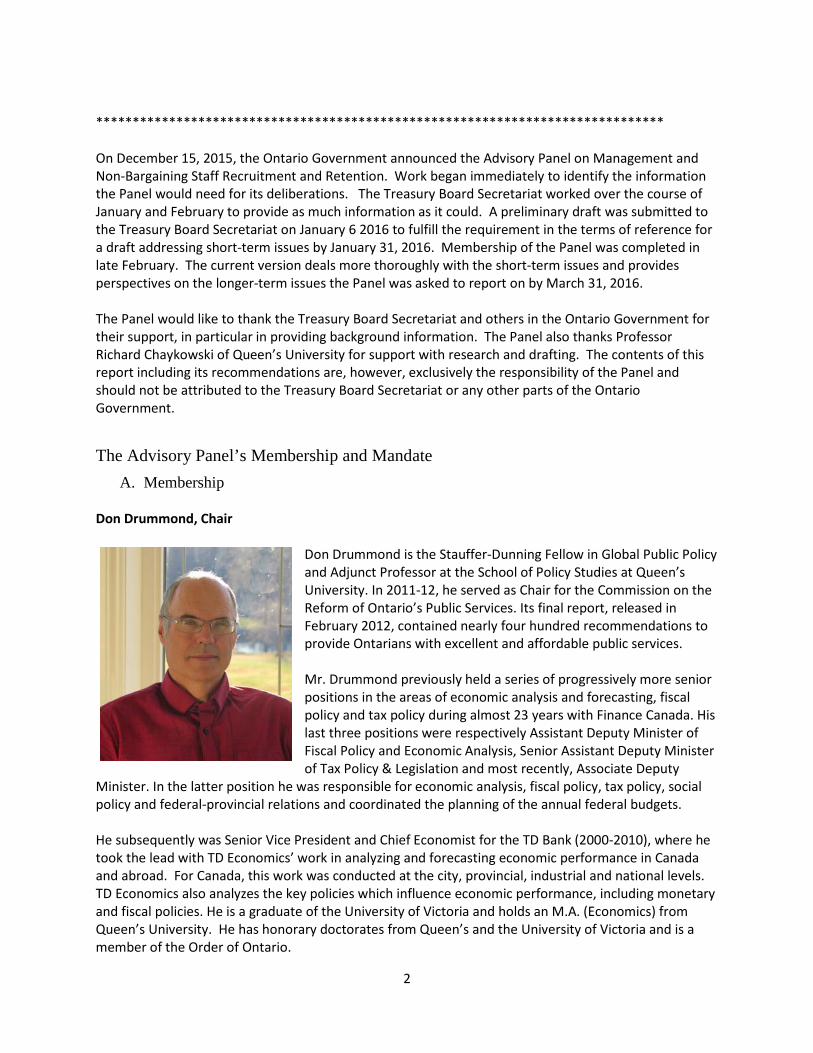
Don Drummond, Chair
Don Drummond is the Stauffer-Dunning Fellow in Global Public Policy and Adjunct Professor at the School of Policy Studies at Queen’s University. In 2011-12, he served as Chair for the Commission on the Reform of Ontario’s Public Services. Its final report, released in February 2012, contained nearly four hundred recommendations to provide Ontarians with excellent and affordable public services. Mr. Drummond previously held a series of progressively more senior positions in the areas of economic analysis and forecasting, fiscal policy and tax policy during almost 23 years with Finance Canada. His last three positions were respectively Assistant Deputy Minister of Fiscal Policy and Economic Analysis, Senior Assistant Deputy Minister of Tax Policy & Legislation and most recently, Associate Deputy
Minister. In the latter position he was responsible for economic analysis, fiscal policy, tax policy, social policy and federal-provincial relations and coordinated the planning of the annual federal budgets. He subsequently was Senior Vice President and Chief Economist for the TD Bank (2000-2010), where he took the lead with TD Economics’ work in analyzing and forecasting economic performance in Canada and abroad. For Canada, this work was conducted at the city, provincial, industrial and national levels. TD Economics also analyzes the key policies which influence economic performance, including monetary and fiscal policies. He is a graduate of the University of Victoria and holds an M.A. (Economics) from Queen’s University. He has honorary doctorates from Queen’s and the University of Victoria and is a member of the Order of Ontario.

3
Camille Orridge, Member
Camille Orridge, Biography Camille Orridge is the former CEO of the Toronto Central Local Health Integration Network (TC LHIN), one of 14 health regions responsible for planning and managing local health care services in Ontario. The TC LHIN is made up of over 180 health service providers that serve approximately 1.15 million Torontonians and hundreds of thousands of others who come to the TC LHIN area for care. In this role, Camille oversaw an organization responsible for the
overall performance of over 180 Toronto health service providers, serving approximately 1.15 million Torontonians and hundreds of thousands of others who come to the TC LHIN area for care, and allocating $4.2 B to hospitals, long-term care homes, and community agencies. Camille was also accountable for shared services for all 14 LHINs. Throughout her career Camille has advanced strategies to design services around patient needs. Camille spearheaded a regional quality improvement strategy in Toronto Central LHIN. For the first time, all providers in the TC LHIN would be accountable for common quality goals and indicators including those related to the patient experience. She also made improving health equity a priority in the TC LHIN. Under her leadership, the TC LHIN launched Language Services Toronto, a shared telephone interpretation service that will expand access for non-English patients at Toronto hospitals and community agencies and lower costs for providers. Camille has received many accolades for her passionate advocacy for developing strong and inclusive communities. Most recently, Camille was awarded the Queen Elizabeth II Diamond Jubilee Medal in 2013 and an African Canadian Achievement Award in 2014. Camille holds a Masters Degree in Health Administration from the University of Toronto.
B. Mandate The text below is reproduced from the terms of reference given the Advisory Panel. The mandate of the Advisory Panel on Management and Non-Bargaining Staff Recruitment and Retention (the Panel) will be to provide advice to the President of the Treasury Board on:
• A long-term strategy to address the issues of retention, recruitment and succession planning; • A fair and sustainable compensation structure; • Best practices with respect to performance evaluation and management compensation, as well
as appropriate public sector benchmarks; • How to enable and sustain the development of a modern and inclusive OPS.
In fulfilling its mandate, the Panel will review and consider leading governance practices and standards related to management and non-bargaining compensation within comparable public sector/broader public sector organizations in other jurisdictions.
4
The Panel will review and provide advice on: Shorter-Term Approaches:
A. A fair and sustainable compensation structure for the OPS, that will inform a long-term strategy to address retention, recruitment and succession planning, including:
• Total cash compensation for OPS non-bargaining employees (Deputy Ministers, Executives, Managers, Non-bargaining specialists). Note that compensation for employees represented by a bargaining unit will not be included in the Panel’s scope of review
• A strategy to address acute compression/inversion issues in professional management groups (Management Crown Counsel, Law Enforcement Management and Management Engineers & Land Surveyors)
• A performance incentive program designed to reward and hold to account non-bargaining employees
• A new pay administration policy enabling progression through the salary range applicable to non-bargaining employees
• A new job evaluation system and market aligned salary ranges for non-bargaining employees • Paralleling the compensation of non-bargaining employees to their bargaining counterparts
where fair and equitable given similar job functions.
B. Best practices with respect to performance evaluation and management compensation, as well as appropriate public sector benchmarks.
C. The utility and potential role of a long-term panel or other advisory body to provide external and ongoing advice on OPS non-bargaining compensation to the President of the Treasury Board, taking into consideration the role and responsibility of the Public Service Commission.
Longer-Term Approaches:
D. A long-term strategy to address retention, recruitment and succession planning, to ensure the OPS has the talent to deliver top quality public services.
• How to leverage and build on OPS HR policies and programs to ensure long-term strategies are in place to support building management capacity
E. How to enable and sustain the development of a modern and inclusive OPS
The Chair will report back to the President of the Treasury Board with advice by January 31, 2016 on the shorter-term approaches and by March 31, 2016 on the longer-term approaches.
The Minister may amend these Terms of Reference from time to time.
5
Report from the Advisory Panel on Management and Non-Bargaining Staff Recruitment and Retention
Contents
Message from the Chair ................................................................................................................................ 1
The Advisory Panel’s Membership and Mandate ..................................................................................... 2
A. Membership .................................................................................................................................. 2
B. Mandate ........................................................................................................................................ 3
Contents ........................................................................................................................................................ 5
1. The Advisory Panel’s Aspirations for Management in the Ontario Government ............................. 6
2. What it takes to Have World Class Management in Government .................................................... 6
3. The Panel’s Overall Assessment of Conditions within Ontario Public Service Management ........... 7
4. Base Compensation ........................................................................................................................ 15
A. Relative Compensation Level ...................................................................................................... 15
B. Compensation Adjustments over Time ...................................................................................... 26
5. Merit Pay ......................................................................................................................................... 29
6. Structure of the Management Group ............................................................................................. 33
7. Competencies and Other Elements of the Profile of Managers ..................................................... 35
8. Inclusiveness of Management ........................................................................................................ 37
9. Implications for Management Recruitment and Training .............................................................. 42
10. Longer-term Considerations ....................................................................................................... 43
Advisory Panel Recommendations ............................................................................................................. 46
6
1. The Advisory Panel’s Aspirations for Management in the Ontario Government The Advisory Panel on Management and Non-Bargaining Staff Recruitment and Retention (the Panel) has been requested to provide advice on some specific issues of concern to management in the Ontario Government. We feel it is important to first specify a broader aspiration for management and then determine how the specific issues can be dealt with to best support that aspiration. We begin by reflecting on the challenge put out by the Commission on the Reform of Ontario’s Public Services (2012) that Ontario should strive to provide the best public services in the world. In turn, that would require having the best public servants, including managers. At the time this statement caused controversy, likely because it did not fit with the characteristic Canadian modesty. But it is illuminating to put the challenge in the inverse and ask what jurisdiction in the world should be able to naturally provide better public services and have better public servants and managers than Ontario? The answer is not obvious. Ontario has one of the best educated, most diversified populations to draw upon. The province has a long tradition of non-partisan civil service and public service is considered an honorable calling. World class universities and colleges in Ontario, Canada and other countries provide programs and graduates in public policy and administration. As such, we agree with the Commission on the Reform of Ontario’s Public Services that Ontario should strive to have the best public services and these should be designed, implemented and evaluated by the best managers.
2. What it takes to Have World Class Management in Government Having embraced a lofty aspiration for management in the Ontario Government, we must now consider what is required to get there. We believe all the elements below must be present to support world class public sector management.
• A compensation system that promotes recruitment, retention and engagement with incentives for excellent performance and in particular for delivering government objectives
• Clear government objectives and means of holding government managers accountable for their roles in delivering on them
• A management cadre that is representative of the population it serves
• A supportive workplace that encourages engagement and initiative and is respectful of employees
We have been asked to advise specifically on the first three elements. We note, however, that the fourth is integral to achieving the aspiration of a world class management cadre and we are encouraged by the initiatives the Treasury Board Secretariat (TBS) and the Ontario Public Service (OPS) are taking to address workplace conditions through initiatives such as addressing discrimination.
7
3. The Panel’s Overall Assessment of Conditions within Ontario Public Service Management
Among the evidence of stress within the management cadre, we cite the following observations:
• Lower levels of job satisfaction and engagement recorded from managers in the latest OPS employee engagement survey. Surveys of OPS management employees indicate that engagement levels have declined substantially amongst middle and senior managers and, to a lesser extent, among executives.
• Prevalence of a sentiment among managers that their work is not being properly recognized and rewarded.
OPS employee engagement surveys reveal that many in management feel that they are not trusted, valued or supported, that their workloads and stress levels are high, and that they are not recognized for their contributions. Others reported feeling a high level of dissatisfaction and frustration with the pay freeze, especially in light of the high level of demands placed upon them. In many cases the overall result is a strong sense that they are not compensated fairly, especially in relation to bargaining unit employees.
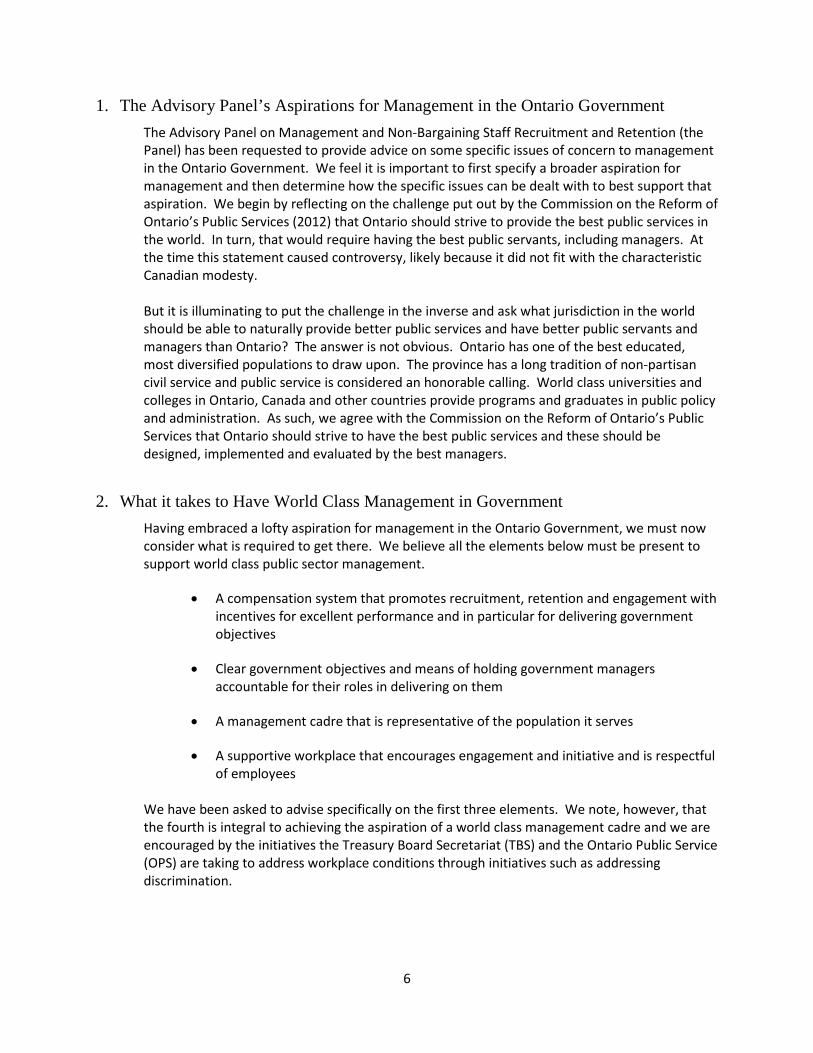
• Although there has not been any discernable trend over time in voluntary turnover rates in key OPS positions since the pay freeze,1 there are a significant number of managers of late requesting what is effectively a demotion out of the management group and into the bargaining units. After the freeze was first imposed in 2011, the number of non-bargaining unit employees moving into a bargaining unit position, annually, has increased by roughly 40%; and since 2007, the destination for 78% of all the movers was the bargaining unit that is the traditional feeder group back into management. Among the movers, 45% took a demotion (i.e., a position with a lower salary range maximum); and, in all cases, the move then allowed the employee the opportunity to increase their salary through annual merit increases.
1 Turnover rates in key positions in the OPS (e.g., non-bargaining specialists, middle managers; senior managers and executives) are broadly similar, or even lower, than the rates for government employees in other major jurisdictions (federal; Alberta; BC).

8
Chart 1: Moves from Non-Bargaining to Bargaining from April 2007 to December 2015
1% → ALOC/OCAA (Bargaining
Lawyers)
78% → AMAPCEO (Typical feeder
Group to
Chart 2: Summary of Moves from Non-Bargaining to Bargaining Positions where Employees Gained the Opportunity for Salary Increases through Merit
Management)
19 % → OPSEU (Front-Line
employees e.g. MNR Resource
Technicians) 1% → PEGO (Bargaining
Engineers and Land Surveyors)
1% → OPPA (Bargaining Law Enforcement)
Which bargaining
groups are Non-Bargaining Employees moving to?
9
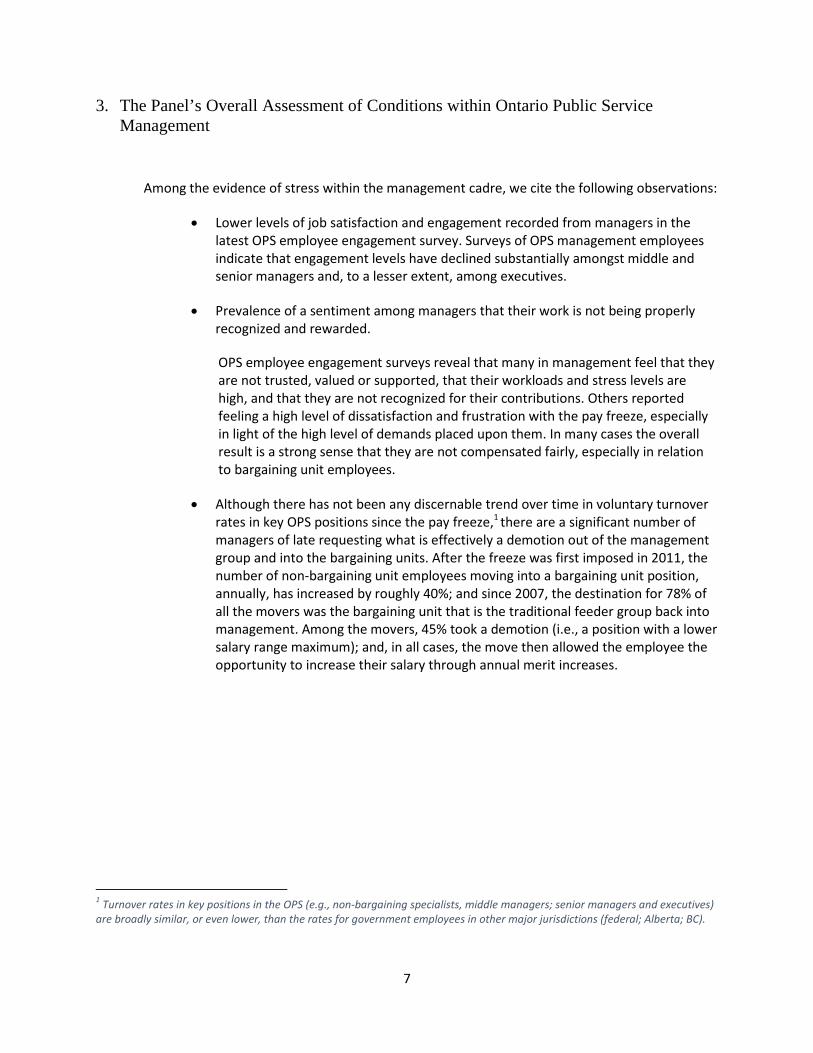
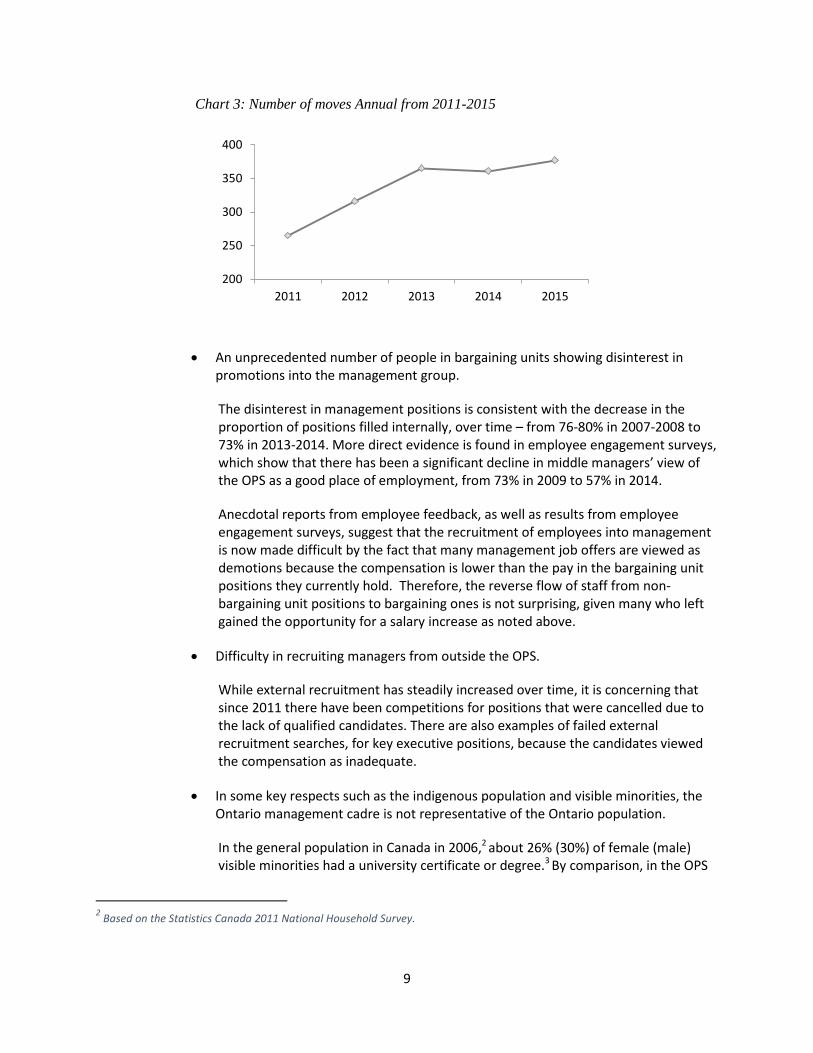
Chart 3: Number of moves Annual from 2011-2015
• An unprecedented number of people in bargaining units showing disinterest in promotions into the management group.
The disinterest in management positions is consistent with the decrease in the proportion of positions filled internally, over time – from 76-80% in 2007-2008 to 73% in 2013-2014. More direct evidence is found in employee engagement surveys, which show that there has been a significant decline in middle managers’ view of the OPS as a good place of employment, from 73% in 2009 to 57% in 2014.
Anecdotal reports from employee feedback, as well as results from employee engagement surveys, suggest that the recruitment of employees into management is now made difficult by the fact that many management job offers are viewed as demotions because the compensation is lower than the pay in the bargaining unit positions they currently hold. Therefore, the reverse flow of staff from non-bargaining unit positions to bargaining ones is not surprising, given many who left gained the opportunity for a salary increase as noted above.
• Difficulty in recruiting managers from outside the OPS.
While external recruitment has steadily increased over time, it is concerning that since 2011 there have been competitions for positions that were cancelled due to the lack of qualified candidates. There are also examples of failed external recruitment searches, for key executive positions, because the candidates viewed the compensation as inadequate.
• In some key respects such as the indigenous population and visible minorities, the Ontario management cadre is not representative of the Ontario population.
In the general population in Canada in 2006,2 about 26% (30%) of female (male) visible minorities had a university certificate or degree.3 By comparison, in the OPS
2 Based on the Statistics Canada 2011 National Household Survey.
200
250
300
350
400
2011 2012 2013 2014 2015
10
visible minorities comprised only 13% of middle managers, 15% of senior managers, 12% of Directors, and 9% of ADMs/DMs. Aboriginal persons comprise about 2.4 per cent of the Ontario population and roughly 2 per cent of the OPS workforce in total; yet across the most populous managerial levels, including managers and directors, the proportion who are Aboriginal is about 1% or less.
One possible explanation is in the education realm. Most OPS managers have a university level degree, often at the graduate level. Approximately 10 per cent of the Aboriginal people in Canada have a university level degree compared to 26.5 per cent among the non-Aboriginal population.4
Ensuring that the OPS management workforce becomes representative of the Ontario population it serves is a complex challenge, because OPS management typically possess higher qualifications (e.g., post-secondary education) and, yet, the representation of minorities among post-secondary university students is uneven across disciplines. This fact further highlights the importance of outreach programs to attract visible minorities and Aboriginal persons into the OPS.
The Panel attempted to infer some root causes for these symptoms of stress within the management cadre. The effort was compromised by the lack of good records of movement into, within and out of management. This leads to our first recommendation: RECOMMENDATION 1: The Treasury Board Secretariat should develop more complete records on movements into, within and out of the management group. The most significant information gap at present is on exits as the Ontario Public Service has no means of tracking where people go and why and when they leave jobs. To address this shortcoming, a comprehensive exit survey should be developed and applied in the case of voluntary departures to determine where the manager is going and why. Yet despite the absence of the kind of rigorous data we might have hoped for, one central factor looms large as a source of stress. That is what has happened to the level and structure of compensation for managers since 2009. A series of compensation restraint measures began in that year and then a hard freeze was applied at 2011-12 levels and merit pay was suspended. The Commission on the Reform of Ontario’s Public Services recommended very strongly that compensation not be frozen and that the merit pay system be reformed rather than suspended. Yet the Government chose the opposite path. The Commission described the longer-term results that would flow from freezing compensation and this is more or less the situation that has unfolded.
3 Source: Statistics Canada, Census of Population, 2006 (Table 7 Educational attainment of population aged 15 and over, by visible minority group, Canada, 2006) [Accessed at: http://www.statcan.gc.ca/pub/89-503-x/2010001/article/11527/tbl/tbl007-eng.htm].
4 In 2011, approximately 10% of Aboriginal people in Canada had a university level degree; source: Statistics Canada. 2013. The Educational Attainment of Aboriginal Peoples in Canada. National Household Survey (NHS), 2011. Catalogue no. 99-012-X2011003. Also see C. Gordon and J. White. 2014. “Indigenous Educational Attainment in Canada.” The International Indigenous Policy Journal. Vol. 5, No. 3.
11
We cite the following as examples of the situations that have been created by the longer-term application of compensation restraint with no mechanism other than promotion to recognize outstanding performance:
• Many managers in their current position now earn less in real (i.e., after-inflation) terms than they did in 2011 considering the hard freeze on compensation and the suspension of merit pay.
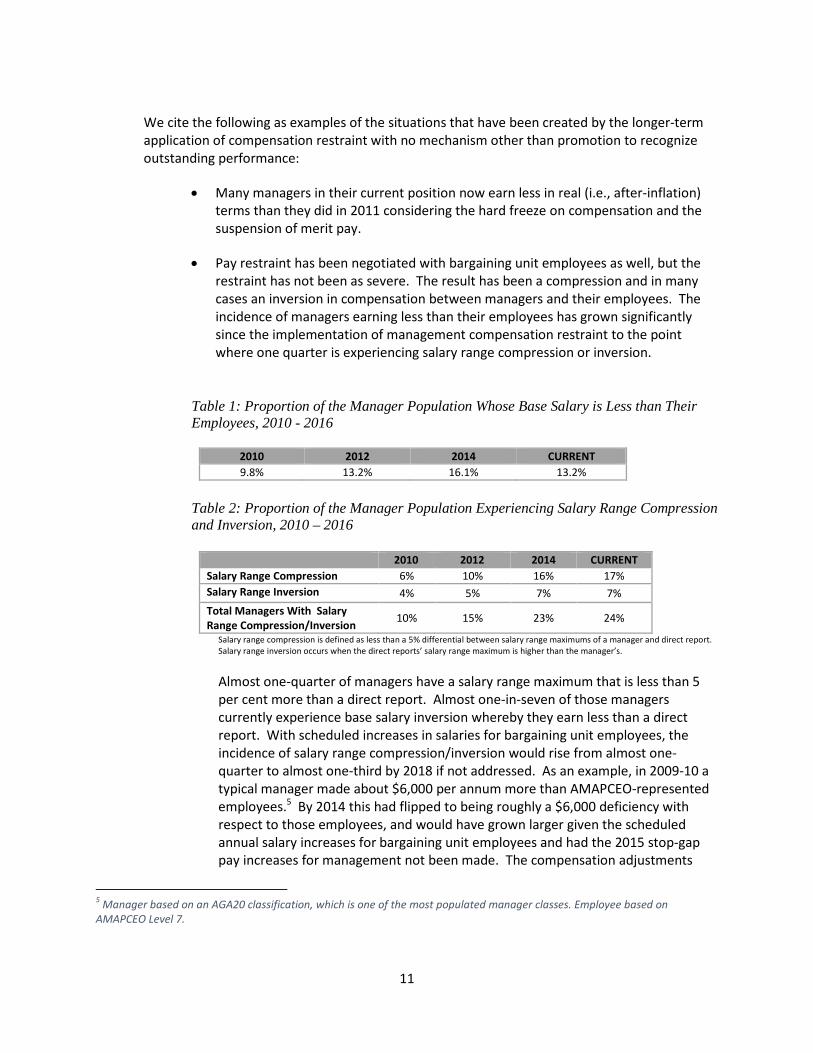
• Pay restraint has been negotiated with bargaining unit employees as well, but the restraint has not been as severe. The result has been a compression and in many cases an inversion in compensation between managers and their employees. The incidence of managers earning less than their employees has grown significantly since the implementation of management compensation restraint to the point where one quarter is experiencing salary range compression or inversion.
Table 1: Proportion of the Manager Population Whose Base Salary is Less than Their Employees, 2010 - 2016
2010 2012 2014 CURRENT 9.8% 13.2% 16.1% 13.2%
Table 2: Proportion of the Manager Population Experiencing Salary Range Compression and Inversion, 2010 – 2016
2010 2012 2014 CURRENT Salary Range Compression 6% 10% 16% 17% Salary Range Inversion 4% 5% 7% 7% Total Managers With Salary Range Compression/Inversion 10% 15% 23% 24%
Salary range compression is defined as less than a 5% differential between salary range maximums of a manager and direct report. Salary range inversion occurs when the direct reports’ salary range maximum is higher than the manager’s.
Almost one-quarter of managers have a salary range maximum that is less than 5 per cent more than a direct report. Almost one-in-seven of those managers currently experience base salary inversion whereby they earn less than a direct report. With scheduled increases in salaries for bargaining unit employees, the incidence of salary range compression/inversion would rise from almost one-quarter to almost one-third by 2018 if not addressed. As an example, in 2009-10 a typical manager made about $6,000 per annum more than AMAPCEO-represented employees.5 By 2014 this had flipped to being roughly a $6,000 deficiency with respect to those employees, and would have grown larger given the scheduled annual salary increases for bargaining unit employees and had the 2015 stop-gap pay increases for management not been made. The compensation adjustments
5 Manager based on an AGA20 classification, which is one of the most populated manager classes. Employee based on AMAPCEO Level 7.
12
announced December 15, 20156 narrow the deficiency to around $3,000 (about 3%)7 and prevent that gap from growing in the face of the scheduled pay increases for bargaining unit employees. In the absence of further action, this deficiency will grow again.
The challenge posed by the compression and inversion between compensation of management and employees in the bargaining units was compounded by the curtailment of paramedical benefits to management employees. When efforts failed to make similar changes for bargaining unit employees, a large gap emerged in benefit packages. This was addressed in December 2015 by making paramedical coverage (which was eliminated in January 2015) available again to management commencing January 1, 2016, though not at the rate that existed previously.
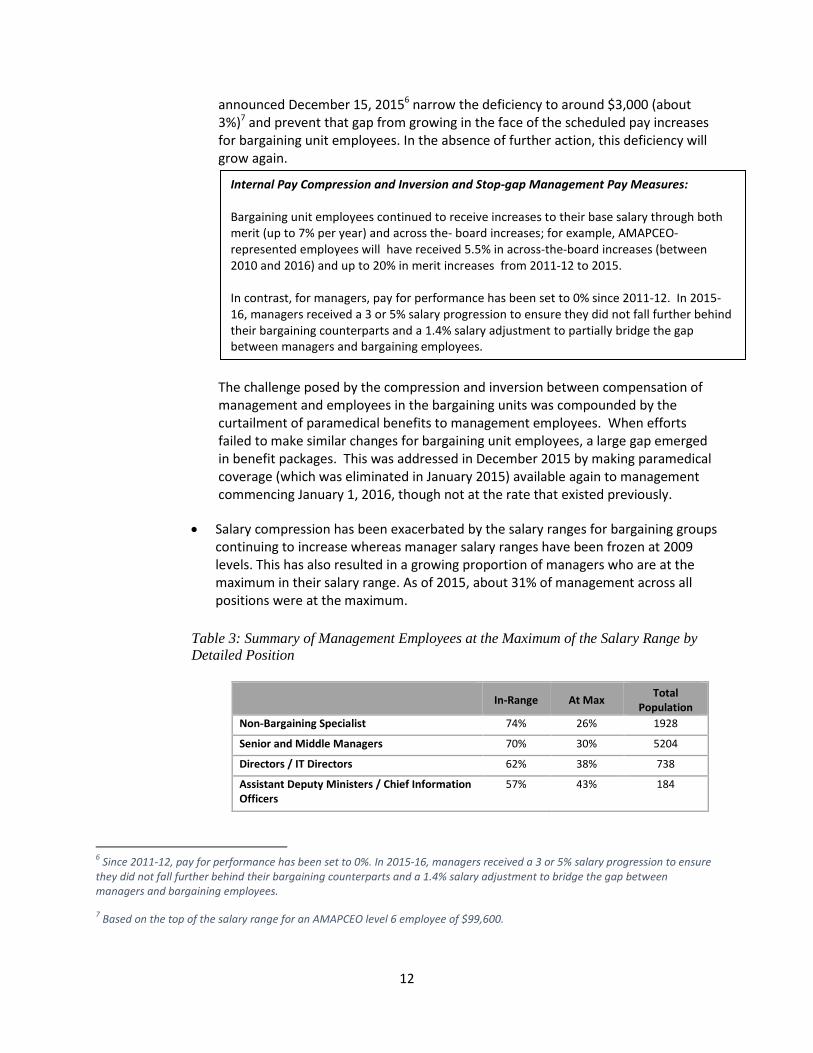
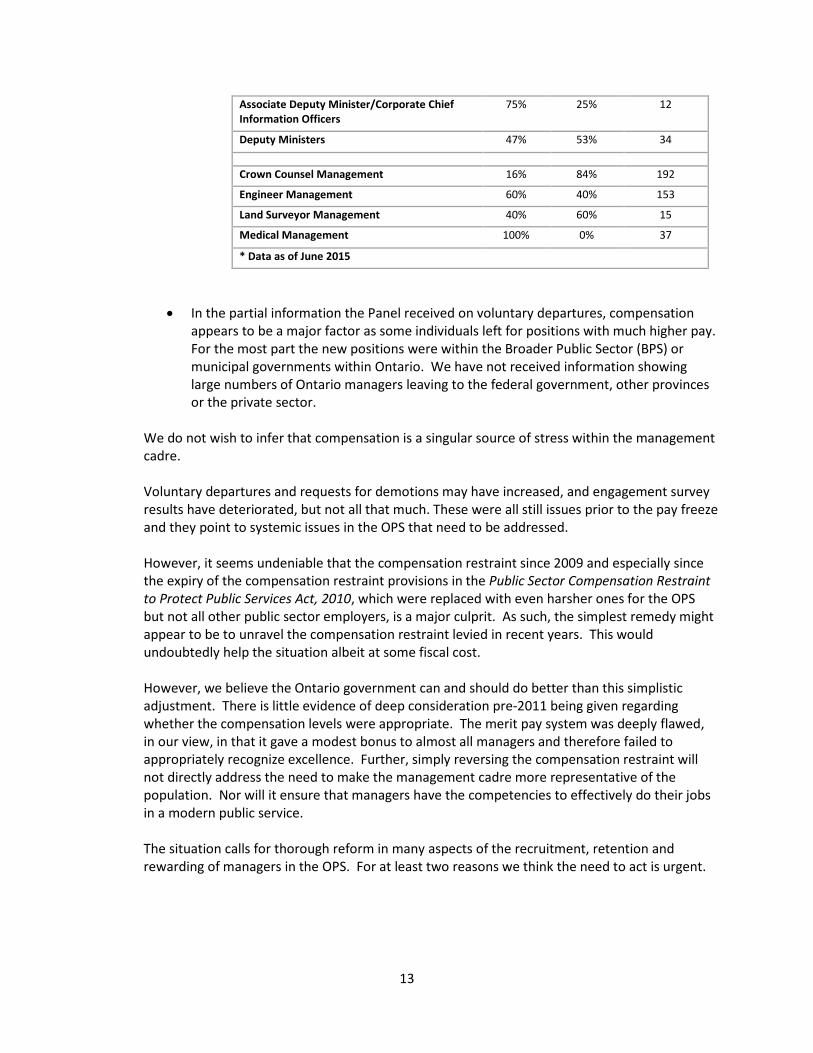
• Salary compression has been exacerbated by the salary ranges for bargaining groups continuing to increase whereas manager salary ranges have been frozen at 2009 levels. This has also resulted in a growing proportion of managers who are at the maximum in their salary range. As of 2015, about 31% of management across all positions were at the maximum.
Table 3: Summary of Management Employees at the Maximum of the Salary Range by Detailed Position
In-Range At Max Total
Population Non-Bargaining Specialist 74% 26% 1928
Senior and Middle Managers 70% 30% 5204
Directors / IT Directors 62% 38% 738
Assistant Deputy Ministers / Chief Information Officers
57% 43% 184
6 Since 2011-12, pay for performance has been set to 0%. In 2015-16, managers received a 3 or 5% salary progression to ensure they did not fall further behind their bargaining counterparts and a 1.4% salary adjustment to bridge the gap between managers and bargaining employees.
7 Based on the top of the salary range for an AMAPCEO level 6 employee of $99,600.
Internal Pay Compression and Inversion and Stop-gap Management Pay Measures: Bargaining unit employees continued to receive increases to their base salary through both merit (up to 7% per year) and across the- board increases; for example, AMAPCEO-represented employees will have received 5.5% in across-the-board increases (between 2010 and 2016) and up to 20% in merit increases from 2011-12 to 2015. In contrast, for managers, pay for performance has been set to 0% since 2011-12. In 2015-16, managers received a 3 or 5% salary progression to ensure they did not fall further behind their bargaining counterparts and a 1.4% salary adjustment to partially bridge the gap between managers and bargaining employees.
13
Associate Deputy Minister/Corporate Chief Information Officers
75% 25% 12
Deputy Ministers 47% 53% 34
Crown Counsel Management 16% 84% 192
Engineer Management 60% 40% 153
Land Surveyor Management 40% 60% 15
Medical Management 100% 0% 37
* Data as of June 2015
• In the partial information the Panel received on voluntary departures, compensation appears to be a major factor as some individuals left for positions with much higher pay. For the most part the new positions were within the Broader Public Sector (BPS) or municipal governments within Ontario. We have not received information showing large numbers of Ontario managers leaving to the federal government, other provinces or the private sector.
We do not wish to infer that compensation is a singular source of stress within the management cadre. Voluntary departures and requests for demotions may have increased, and engagement survey results have deteriorated, but not all that much. These were all still issues prior to the pay freeze and they point to systemic issues in the OPS that need to be addressed. However, it seems undeniable that the compensation restraint since 2009 and especially since the expiry of the compensation restraint provisions in the Public Sector Compensation Restraint to Protect Public Services Act, 2010, which were replaced with even harsher ones for the OPS but not all other public sector employers, is a major culprit. As such, the simplest remedy might appear to be to unravel the compensation restraint levied in recent years. This would undoubtedly help the situation albeit at some fiscal cost. However, we believe the Ontario government can and should do better than this simplistic adjustment. There is little evidence of deep consideration pre-2011 being given regarding whether the compensation levels were appropriate. The merit pay system was deeply flawed, in our view, in that it gave a modest bonus to almost all managers and therefore failed to appropriately recognize excellence. Further, simply reversing the compensation restraint will not directly address the need to make the management cadre more representative of the population. Nor will it ensure that managers have the competencies to effectively do their jobs in a modern public service. The situation calls for thorough reform in many aspects of the recruitment, retention and rewarding of managers in the OPS. For at least two reasons we think the need to act is urgent.
14
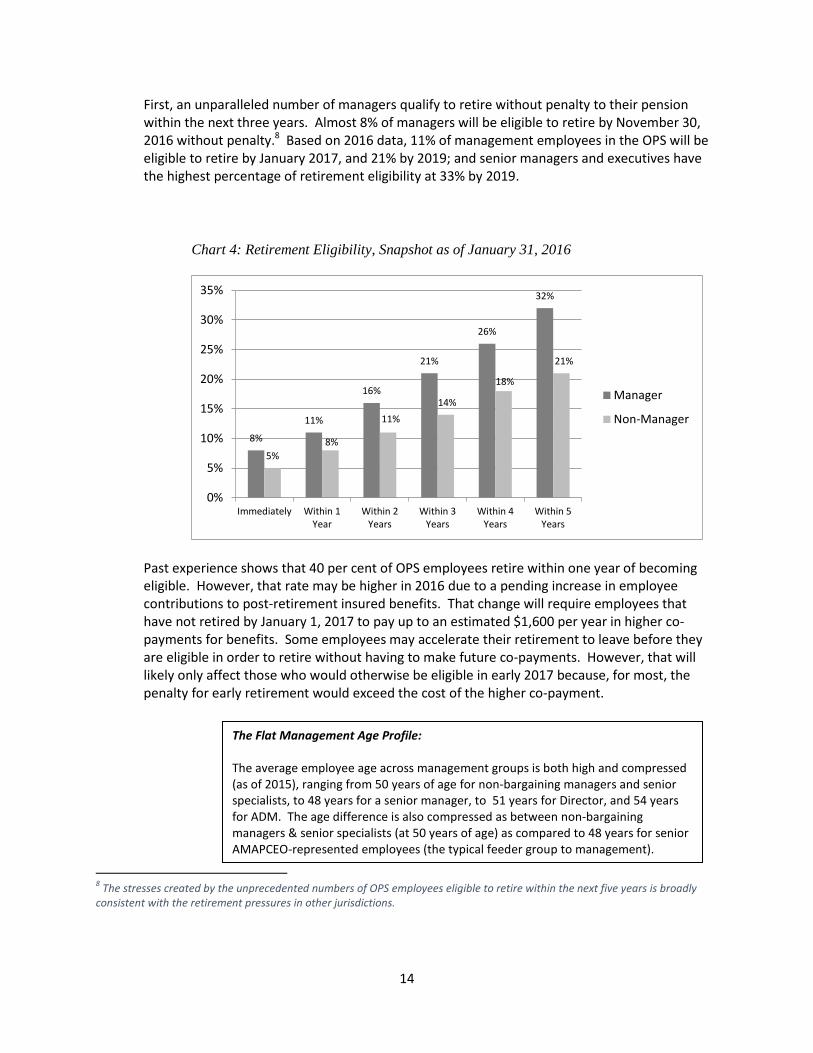
First, an unparalleled number of managers qualify to retire without penalty to their pension within the next three years. Almost 8% of managers will be eligible to retire by November 30, 2016 without penalty.8 Based on 2016 data, 11% of management employees in the OPS will be eligible to retire by January 2017, and 21% by 2019; and senior managers and executives have the highest percentage of retirement eligibility at 33% by 2019.
Chart 4: Retirement Eligibility, Snapshot as of January 31, 2016
Past experience shows that 40 per cent of OPS employees retire within one year of becoming eligible. However, that rate may be higher in 2016 due to a pending increase in employee contributions to post-retirement insured benefits. That change will require employees that have not retired by January 1, 2017 to pay up to an estimated $1,600 per year in higher co-payments for benefits. Some employees may accelerate their retirement to leave before they are eligible in order to retire without having to make future co-payments. However, that will likely only affect those who would otherwise be eligible in early 2017 because, for most, the penalty for early retirement would exceed the cost of the higher co-payment.
The Flat Management Age Profile: The average employee age across management groups is both high and compressed (as of 2015), ranging from 50 years of age for non-bargaining managers and senior specialists, to 48 years for a senior manager, to 51 years for Director, and 54 years for ADM. The age difference is also compressed as between non-bargaining managers & senior specialists (at 50 years of age) as compared to 48 years for senior AMAPCEO-represented employees (the typical feeder group to management).
8 The stresses created by the unprecedented numbers of OPS employees eligible to retire within the next five years is broadly consistent with the retirement pressures in other jurisdictions.
8%
11%
16%
21%
26%
32%
5% 8%
11% 14%
18%
21%
0%
5%
10%
15%
20%
25%
30%
35%
Immediately Within 1Year
Within 2Years
Within 3Years
Within 4Years
Within 5Years
Manager
Non-Manager
15
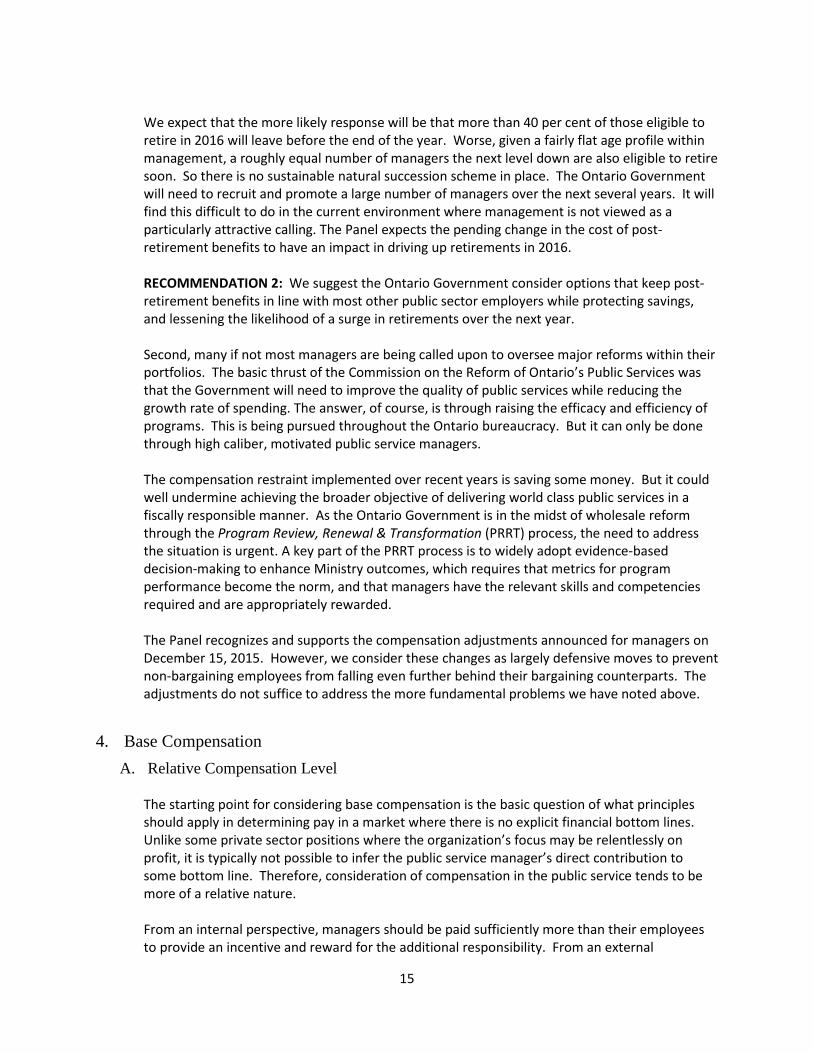
We expect that the more likely response will be that more than 40 per cent of those eligible to retire in 2016 will leave before the end of the year. Worse, given a fairly flat age profile within management, a roughly equal number of managers the next level down are also eligible to retire soon. So there is no sustainable natural succession scheme in place. The Ontario Government will need to recruit and promote a large number of managers over the next several years. It will find this difficult to do in the current environment where management is not viewed as a particularly attractive calling. The Panel expects the pending change in the cost of post-retirement benefits to have an impact in driving up retirements in 2016.
RECOMMENDATION 2: We suggest the Ontario Government consider options that keep post-retirement benefits in line with most other public sector employers while protecting savings, and lessening the likelihood of a surge in retirements over the next year. Second, many if not most managers are being called upon to oversee major reforms within their portfolios. The basic thrust of the Commission on the Reform of Ontario’s Public Services was that the Government will need to improve the quality of public services while reducing the growth rate of spending. The answer, of course, is through raising the efficacy and efficiency of programs. This is being pursued throughout the Ontario bureaucracy. But it can only be done through high caliber, motivated public service managers. The compensation restraint implemented over recent years is saving some money. But it could well undermine achieving the broader objective of delivering world class public services in a fiscally responsible manner. As the Ontario Government is in the midst of wholesale reform through the Program Review, Renewal & Transformation (PRRT) process, the need to address the situation is urgent. A key part of the PRRT process is to widely adopt evidence-based decision-making to enhance Ministry outcomes, which requires that metrics for program performance become the norm, and that managers have the relevant skills and competencies required and are appropriately rewarded. The Panel recognizes and supports the compensation adjustments announced for managers on December 15, 2015. However, we consider these changes as largely defensive moves to prevent non-bargaining employees from falling even further behind their bargaining counterparts. The adjustments do not suffice to address the more fundamental problems we have noted above.
4. Base Compensation A. Relative Compensation Level
The starting point for considering base compensation is the basic question of what principles should apply in determining pay in a market where there is no explicit financial bottom lines. Unlike some private sector positions where the organization’s focus may be relentlessly on profit, it is typically not possible to infer the public service manager’s direct contribution to some bottom line. Therefore, consideration of compensation in the public service tends to be more of a relative nature.
From an internal perspective, managers should be paid sufficiently more than their employees to provide an incentive and reward for the additional responsibility. From an external
16
perspective, managers should be paid in the vicinity of their opportunity income elsewhere. This is not only fair, but is a market reality because Ontario will not be able to recruit, retain or motivate world class managers if they are severely underpaid relative to what they can earn elsewhere, whether that be in other public sector jobs or in the private sector. Determining the relativity between management and bargaining employees seems the more straightforward. As noted above, prior to the onset of compensation restraint for managers, a fairly typical situation was having a manager earn around $6,000 more than the highest-paid employees in a bargaining unit. There is no science behind an assumption that this is an appropriate differential, but at least anecdotally that regime seemed to work in that there is anecdotal evidence that in that previous regime employees were interested in being promoted to management and managers did not request demotions into bargaining units. Restoring the more typical management pay differential would require a pay increase at the first level of management of around $9,000 or 9 per cent on top of the adjustment announced on December 15, 2015 and as a means of keeping compensation differential in step with pending increases in pay for bargaining unit employees. However, before recommending such an adjustment, we first need to check whether that would yield an appropriate compensation for a manager relative to the opportunity income. Defining the opportunity income of a manager in the OPS is more difficult. Ideally there would be a set of positions outside the OPS that would be used as comparators. The OPS would typically not necessarily need to lead pay among the comparators. In some cases, as discussed below, it might not even need to be on par, but it should be in the ball park. Otherwise, Ontario will not be able to recruit and retain the high caliber managers it needs. In some select cases, it may even need to be just above-market for the same reason. But what positions should constitute the comparator groups for determining the compensation of Ontario Government managers? One can think of a fairness principle. Ontario managers should receive similar compensation to others with similar qualifications doing similar work. But that just begs the question of defining similar. Many positions in Ontario management are quite specialized. The fairness principle suggests putting a high weight on similar positions in other Governments, such as the federal government and other large provinces, such as Quebec, Alberta and British Columbia. One can also think of a market principle. Compensation should be adequate to permit recruitment from other workplaces and prevent wholesale departures to such places. The test should not, however, be to avoid any departures. If Ontario hires the best and the brightest for management, some will naturally go elsewhere at some point. But, the rate of voluntary departures of late is not high across management groups in the OPS when compared to other major governments; and especially as compared to the average voluntary turnover rate for governments across Canada (of 4.5%)9. Involuntary departures among OPS Managers and Non-bargaining Staff are also low in relation to other comparators and to the average voluntary turnover rate for governments across Canada (of 2.7%)10.
9 Source: Conference Board of Canada. Compensation Planning Outlook 2016. 10 Source: Conference Board of Canada. Compensation Planning Outlook 2016.

17
Table 4: OPS, Federal, Alberta and BC Government Turnover Rates, 2015
2015 Turnover Rates
Executive (Deputy Minister, Assistant Deputy Minister, Director)
Manager Non-Bargaining Employees
Jurisdiction ON Fed BC AB ON Fed BC AB ON Fed BC AB
Voluntary (excluding retirements)
1.68% Senior Exec:1.5% Execs: 1.1%
2.6% 2.22% 1.05% NA 2.4% 1.18% 2.52% 1.1% 4.7% 4.09%
Involuntary 1.62% Senior Exec:0% Execs: 1.2%
1.3% 1.29% 0.87% NA 1.3% 0.15% 0.65% 0.9% 1.3% 1.58%
Retirements 4.49% NA 6.4% 7.01% 4.51% NA 4.4% 0.87% 2.77% NA 2.0% 1.87%
Private Sector Comparators This market test suggests examining data on where Ontario managers come from and where they voluntarily leave to. For the most part, Ontario managers come from within the OPS. There appears to be an overwhelming tendency to recruit future managers to entry level positions and then support their development into a management position over time. As noted above, the data on voluntary departures and where they go is not very good, but our sense is that few managers leave for the private sector. It is very difficult to match many of the positions in the civil service with those in the private sector, and at a superficial level, the entry and exit data might suggest that the private sector should not receive a large weight as a comparator for salary positions because it is largely a distinct market. But before embracing such a view, one must consider whether this is a chicken-and-egg issue. To some degree the low level of recruitment from the private sector may be due to the difficulty of offering managers comparable salaries to what they were earning in their private sector positions. This would not, however, explain why there isn’t a higher exit flow into the private sector. It would appear that the financial incentive is there for managers. But perhaps the skill sets don’t match or perhaps managers are willing to accept much less compensation to do the public service work – which is consistent with the observed lower voluntary turnover rates in the OPS relative to that of managers in other major government comparators.
The argument is sometimes made that civil service managers can be underpaid relative to their opportunity income because they are doing what they most want to do and would be willing to accept lower pay for the work. We do not attach a great deal of weight to this argument. Talented people tend to gravitate over time to work that satisfies them. The same observation could likely be made of these people regardless of what type of work or sector they are in. The Panel is not inclined to ignore the private sector as a comparator group. This is especially because we feel that in order to replace retiring managers and to achieve a more representative management cadre, the Ontario Government should put much more effort into recruiting managers from the private sector over the next few years. So compensation relative to the private sector is relevant. However, for a few reasons, we are not inclined to suggest putting an explicit or high weight on private sector compensation. One often sees a comparison between Deputy Minister and private sector CEO’s compensation. The comparison shows a large pay deficiency in base compensation and an even larger shortfall
18
in total compensation as Deputies have much smaller merit pay (none in recent years, but even before the suspension of merit pay the bonuses were much smaller than typical in the private sector). We think the Ontario Government should be mindful of this compensation gap but should not have an explicit objective to close it or to even necessarily put a large weight on it in inferring an opportunity income for Deputies because:
• First, the education and experience path are typically quite different as between Deputies and CEOs.
• Second, while Deputies have enormous responsibilities, they do operate within a broader, supportive organization whereas CEOs more singularly carry the responsibility.
• Third, a CEO’s direct role in driving the bottom line objectives (usually profits) is more easily identified than a Deputy’s role. It is not surprising then, and likely appropriate, that CEOs have more compensation designed as at-risk.
• Fourth, Deputies should have the expectation of greater employment stability – whether it is through business cycles or not achieving objectives, there tend to be severe employment cycles among management in the private sector.
The Ontario Government has significantly reduced the number of managers in recent years, as they did during the austerity regime in the 1990s. However, the recent reduction has been accomplished for the most part through attrition and re-structuring, which has either preserved manager’s jobs or restricted any loss of jobs to particular areas. While this has been a relatively positive outcome, the uncertainty may also have contributed to stress within the management cadre.
So the longer-term expectation of income should be positively affected by this employment stability when comparing to the private sector. In conclusion, on the private sector, we think the Ontario Government should be mindful of the pay gap between managers in the public service and the private sector, especially over the next few years as efforts should be increased to hire from the private sector. But we do not advocate that a specific weight be attached to private sector compensation in considering a comparator group for establishing the compensation levels of managers. Public Sector Comparators The market test does suggest, on the other hand, that considerable weight be attached to the compensation of managers in Ontario’s municipal governments, especially within the GTA, and
Management Job Transfers though Restructuring: Since 2010 the number of management employees has been reduced by the equivalent of 504 full time positions. Almost half is accounted for by the transfer of the administration of the Harmonized Sales Tax administration to The Canada Revenue Agency, the realignment of Correctional Facilities and the closing or downsizing of Service/Youth Offender Facilities. Most of the rest has come through retirements and other voluntary departures.
19
to agencies within the BPS. The partial data we have on voluntary departures of managers show that this is where many of the managers go when they leave the OPS. And the partial records we have seen also suggest they are often going for very large compensation increases, sometimes doubling their total package. Pension portability within the BPS further facilitates such movement. The market test does not suggest putting weight on compensation in the Quebec government, even though that is the only provincial bureaucracy close to the size of Ontario’s. Perhaps due to language considerations there appears to be little movement between the two bureaucracies. The panel has reviewed data on comparisons of compensation of Ontario’s management in comparison to comparable positions in the federal government, Alberta, British Columbia, the BPS and certain municipalities. We first looked at base pay. Merit pay will be addressed below. We restricted our examination to 4 levels of management: Deputy Ministers, Assistant Deputy Ministers, Directors and Managers. These are the main four positions. While there are hundreds of management classifications, as explained below, we recommend most of the position classifications be collapsed to a much smaller number; and most OPS management employees populate these four positions. Finally, implications for other positions can fairly readily be inferred from what we observe for these four main positions. Although the current base salary maximum for each of the four OPS management groups is currently below the median base salary of the main groups identified as comparators (e.g., Alberta government and British Columbia governments; federal government; or the Ontario BPS), we also observe very large differences in base compensation among the groups identified as comparators. There are especially large differences among compensation levels for managers in the various agencies, boards and commissions within the BPS. Not surprisingly, those closest to private sector operations tend to feature the largest compensation packages. It would be beyond the mandate given the Panel to analyze and comment upon the compensation of managers outside the OPS. The range of salaries across comparators groups suggests there is no single labour market for public service managers. Hence one cannot and should not even pretend to be scientific about determining the appropriate level of compensation for Ontario managers from the market test. The best that can be hoped for is to get a feel for the appropriate compensation level on the bases of fairness and opportunity income. We recognize there is a fair degree of subjectivity involved. It may seem that a return to the pre-2009 regime of targeting the salary range maximum of executive compensation at the median compensation of an external comparator group (Ontario agencies, commissions and boards, the federal government, Alberta and British Columbia governments, and certain municipalities) is an appropriate approach. However, this is also somewhat arbitrary in terms of which jurisdictions are included; and the median (and even more so the average or mode) can be a biased measure in a small sample with large variation, as this can be unduly influenced by outliers. The Panel feels that such aggregate measures should be part of the analysis, but that additional judgment is likely required to supplement such a mechanistic approach.
20
We note above that the large variation in compensations across the various potential comparators suggests there is no single market for positions somewhat akin to OPS executives. We could go further and say that perhaps there should be no single market for given positions within the Ontario management cadre. In Ontario, all executive positions at a given level are given the same classification. The only pay differences among incumbents within an executive group would arise from the individual’s position in the salary range resulting from experience or, in the pre-2011 regime, from differing bonuses. Yet responsibilities can vary drastically depending upon the nature of the work of an executive. On balance, a Deputy Minister at a central agency or a large Ministry will have more onerous responsibilities than a Deputy Minister of a small Ministry or agency. The Deputy Minister of the central agency or large Ministry is also more likely to have skills compatible with external bodies such as the commissions, agencies and boards of the BPS or the private sector. Hence, their opportunity income is likely higher. For these reasons, we do not believe Deputy Ministers of all Ministries should have the same classification. In the federal government there are four levels of Deputy Ministers. The highest classification is typically for the central agencies, the middle for large Departments and the lowest level for smaller Departments or agencies. The Panel believes such a system should be introduced in Ontario with at least two levels of Deputy Minister. Consideration should be given to whether there should also be two levels of Assistant Deputy Minister. We feel there is less need for more than one level for Directors and Managers. With regard to base salaries:
• We believe Ontario managers will still be paid 10-15 per cent below the base salaries of a reasonable comparator group after the adjustments announced December 15, 2015 are in effect.11
With this observation, we can go back and test for the relativity in management compensation vis-à-vis the highest paid employees from bargaining units. We argued that to restore a more traditional management-employee pay gap would require raising managers’ pay around 9 per cent.12 It is satisfying to observe that this is in the ballpark of the pay increase (at the low end in fact) suggestive of alignment with the external comparator group.
• We believe Ontario Directors and Assistant Deputy Ministers are underpaid in base compensation (again after the adjustments of December 15, 2015) by about 20 per cent relative to the comparator groups.13
11 The current base salary maximum for Managers (AGA21) is roughly 5% less than that of the comparator with the lowest base salary maximum (Alberta); and about 23% below the median base salary among comparators among all major comparators (including Alberta, BC, Federal, and Toronto).
12 Just restoring a traditional pay advantage for managers of roughly $6000, or 6%, given the current disadvantage of about 3%, requires at least a 9% increase.
13 The current base salary maximum for Directors (SMG2) is roughly 7% less than that of the comparator with the lowest base salary maximum (BC); and about 21% below the median base salary among comparators among all major comparators (including Alberta, BC, Federal, and Toronto).
21
• Finally, we believe Deputy Ministers have base compensation that is at least 25 per cent per cent below the comparator groups. But within the Deputy Minister rank, we believe those in the central agencies and the larger Ministries are at least 35 per cent below the comparator groups and in some cases much more than this.14
The above observations come down to precise numbers. However, we reiterate that the precision should not be confused with science. It is not possible to determine the appropriate level of compensation on the basis of fairness or the market test by using the pay information from other jurisdictions because the pay differences are very large within this universe. Ultimately it comes down to a fair bit of use of intuition. Would pay increases of the order indicated above address the problems noted of late of employees not wanting promotions, managers requesting demotions, managers not feeling their work is being appropriately recognized and rewarded, managers voluntarily departing in large numbers, and the Government finding it hard to recruit from other public bodies and the private sector? We believe the suggested pay increases would go a long way toward addressing these problems. Of course the ultimate test would be to implement them and observe the management employees’ behavioral responses that these pay increases elicited. If the problems persist then the compensation issue would need to be re-visited. This points to the need for a process whereby the situation can be monitored and adjusted over time, longer term, as warranted. We deal with this in the last section of our report.
Specialized Management Roles At this point we wish to return to the fact we only examined four positions of management, albeit the most common. A great deal of work is left to be done in looking at the hundreds of other positions. Quite different results may flow relative to what we found for Managers, Directors, Assistant Deputy Ministers and Deputy Ministers. Some specialized positions may not have much of a market outside the OPS and current pay may be adequate or even excessive to permit recruitment and retention. Other specialized positions may have active markets outside the OPS and these markets may be tight. Even with the sorts of compensation increases we suggest it may not prove to be possible to recruit and retain the right numbers and quality of these managers. In each case, very careful analysis must be done and there should not be a slavish adherence to rigid formulae. An example we encountered is for Chief Information Officer (CIO). A straightforward comparison of Ontario CIO compensation against a comparator group would suggest Ontario’s managers are overpaid by a large amount. This goes against our a priori belief that this was one
The current base salary maximum for Assistant Deputy Ministers (SMG3) is roughly 16% less than that of the comparator with the lowest base salary maximum (BC); and about 18% below the median base salary among comparators among all major comparators (including Alberta, BC, Federal, and Toronto).
14 The current base salary maximum for a Deputy Minister is roughly 27% less than that of the comparator with the lowest base salary maximum (Alberta); and about 41% below the median base salary among comparators among all major comparators (including Alberta, BC, Federal, Toronto, the Ontario BPS, and Ontario Agencies).
22
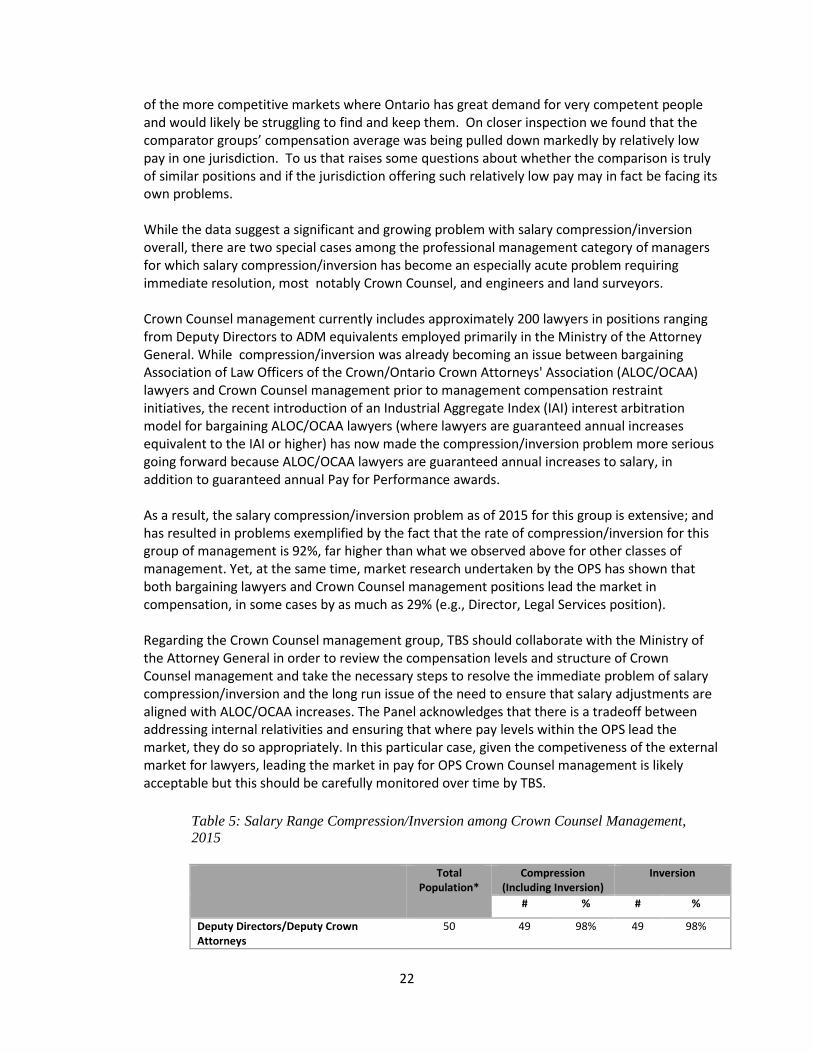
of the more competitive markets where Ontario has great demand for very competent people and would likely be struggling to find and keep them. On closer inspection we found that the comparator groups’ compensation average was being pulled down markedly by relatively low pay in one jurisdiction. To us that raises some questions about whether the comparison is truly of similar positions and if the jurisdiction offering such relatively low pay may in fact be facing its own problems. While the data suggest a significant and growing problem with salary compression/inversion overall, there are two special cases among the professional management category of managers for which salary compression/inversion has become an especially acute problem requiring immediate resolution, most notably Crown Counsel, and engineers and land surveyors. Crown Counsel management currently includes approximately 200 lawyers in positions ranging from Deputy Directors to ADM equivalents employed primarily in the Ministry of the Attorney General. While compression/inversion was already becoming an issue between bargaining Association of Law Officers of the Crown/Ontario Crown Attorneys' Association (ALOC/OCAA) lawyers and Crown Counsel management prior to management compensation restraint initiatives, the recent introduction of an Industrial Aggregate Index (IAI) interest arbitration model for bargaining ALOC/OCAA lawyers (where lawyers are guaranteed annual increases equivalent to the IAI or higher) has now made the compression/inversion problem more serious going forward because ALOC/OCAA lawyers are guaranteed annual increases to salary, in addition to guaranteed annual Pay for Performance awards. As a result, the salary compression/inversion problem as of 2015 for this group is extensive; and has resulted in problems exemplified by the fact that the rate of compression/inversion for this group of management is 92%, far higher than what we observed above for other classes of management. Yet, at the same time, market research undertaken by the OPS has shown that both bargaining lawyers and Crown Counsel management positions lead the market in compensation, in some cases by as much as 29% (e.g., Director, Legal Services position). Regarding the Crown Counsel management group, TBS should collaborate with the Ministry of the Attorney General in order to review the compensation levels and structure of Crown Counsel management and take the necessary steps to resolve the immediate problem of salary compression/inversion and the long run issue of the need to ensure that salary adjustments are aligned with ALOC/OCAA increases. The Panel acknowledges that there is a tradeoff between addressing internal relativities and ensuring that where pay levels within the OPS lead the market, they do so appropriately. In this particular case, given the competiveness of the external market for lawyers, leading the market in pay for OPS Crown Counsel management is likely acceptable but this should be carefully monitored over time by TBS.
Table 5: Salary Range Compression/Inversion among Crown Counsel Management, 2015
Total
Population* Compression
(Including Inversion) Inversion
# % # %
Deputy Directors/Deputy Crown Attorneys
50 49 98% 49 98%
23
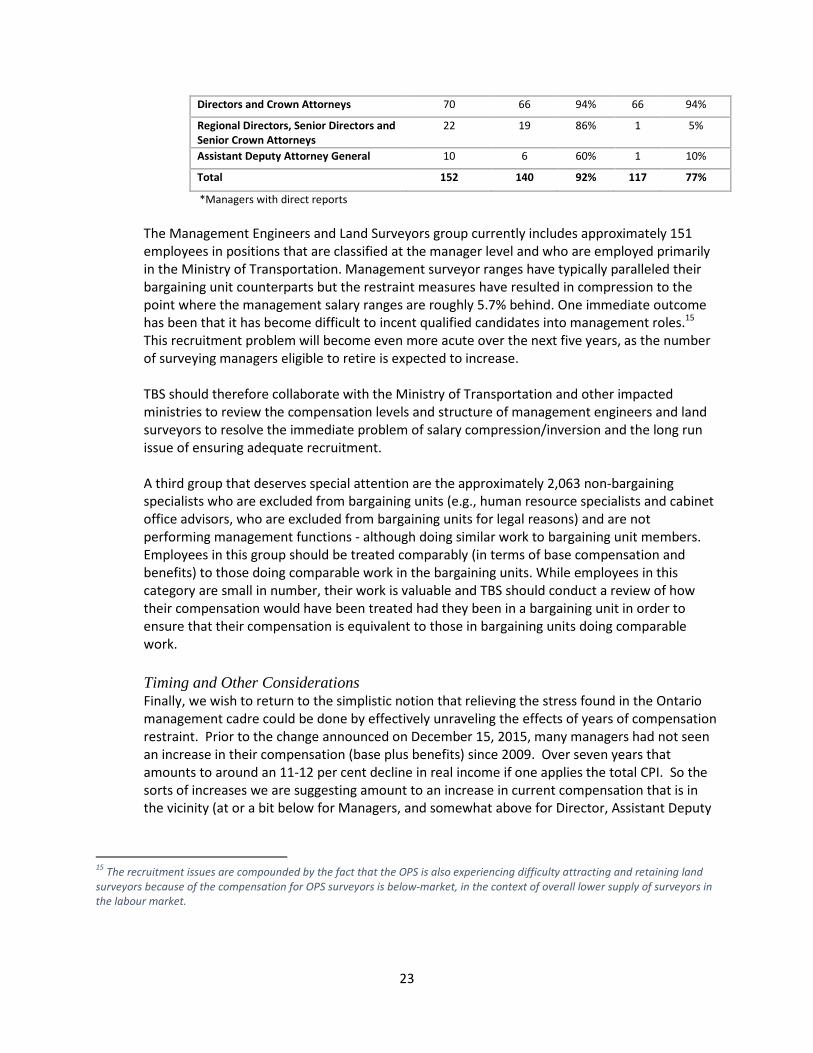
Directors and Crown Attorneys 70 66 94% 66 94%
Regional Directors, Senior Directors and Senior Crown Attorneys
22 19 86% 1 5%
Assistant Deputy Attorney General 10 6 60% 1 10%
Total 152 140 92% 117 77%
*Managers with direct reports
The Management Engineers and Land Surveyors group currently includes approximately 151 employees in positions that are classified at the manager level and who are employed primarily in the Ministry of Transportation. Management surveyor ranges have typically paralleled their bargaining unit counterparts but the restraint measures have resulted in compression to the point where the management salary ranges are roughly 5.7% behind. One immediate outcome has been that it has become difficult to incent qualified candidates into management roles.15 This recruitment problem will become even more acute over the next five years, as the number of surveying managers eligible to retire is expected to increase. TBS should therefore collaborate with the Ministry of Transportation and other impacted ministries to review the compensation levels and structure of management engineers and land surveyors to resolve the immediate problem of salary compression/inversion and the long run issue of ensuring adequate recruitment. A third group that deserves special attention are the approximately 2,063 non-bargaining specialists who are excluded from bargaining units (e.g., human resource specialists and cabinet office advisors, who are excluded from bargaining units for legal reasons) and are not performing management functions - although doing similar work to bargaining unit members. Employees in this group should be treated comparably (in terms of base compensation and benefits) to those doing comparable work in the bargaining units. While employees in this category are small in number, their work is valuable and TBS should conduct a review of how their compensation would have been treated had they been in a bargaining unit in order to ensure that their compensation is equivalent to those in bargaining units doing comparable work.
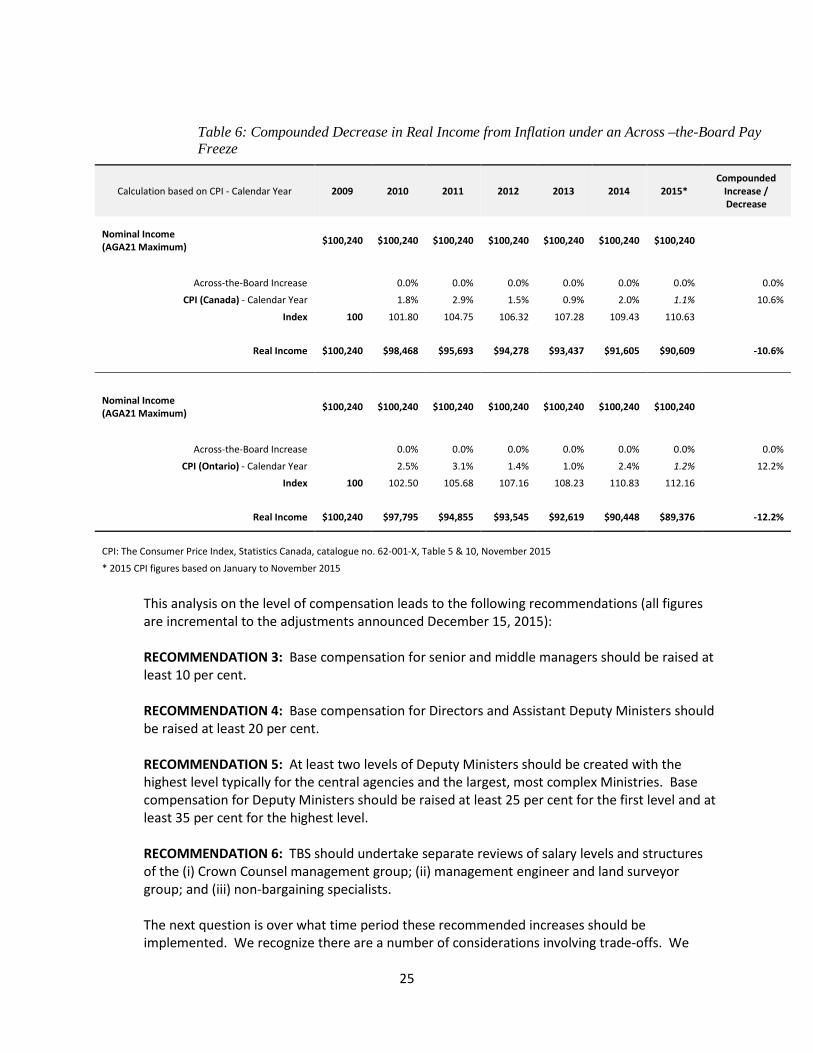
Timing and Other Considerations Finally, we wish to return to the simplistic notion that relieving the stress found in the Ontario management cadre could be done by effectively unraveling the effects of years of compensation restraint. Prior to the change announced on December 15, 2015, many managers had not seen an increase in their compensation (base plus benefits) since 2009. Over seven years that amounts to around an 11-12 per cent decline in real income if one applies the total CPI. So the sorts of increases we are suggesting amount to an increase in current compensation that is in the vicinity (at or a bit below for Managers, and somewhat above for Director, Assistant Deputy
15 The recruitment issues are compounded by the fact that the OPS is also experiencing difficulty attracting and retaining land surveyors because of the compensation for OPS surveyors is below-market, in the context of overall lower supply of surveyors in the labour market.

24
Ministers and Deputy Ministers) of where compensation would have been had management received increases in line with inflation over the past seven years.
25
Table 6: Compounded Decrease in Real Income from Inflation under an Across –the-Board Pay Freeze
Calculation based on CPI - Calendar Year 2009 2010 2011 2012 2013 2014 2015* Compounded
Increase / Decrease
Nominal Income (AGA21 Maximum) $100,240 $100,240 $100,240 $100,240 $100,240 $100,240 $100,240
Across-the-Board Increase 0.0% 0.0% 0.0% 0.0% 0.0% 0.0% 0.0%
CPI (Canada) - Calendar Year 1.8% 2.9% 1.5% 0.9% 2.0% 1.1% 10.6%
Index 100 101.80 104.75 106.32 107.28 109.43 110.63
Real Income $100,240 $98,468 $95,693 $94,278 $93,437 $91,605 $90,609 -10.6%
Nominal Income (AGA21 Maximum) $100,240 $100,240 $100,240 $100,240 $100,240 $100,240 $100,240
Across-the-Board Increase 0.0% 0.0% 0.0% 0.0% 0.0% 0.0% 0.0%
CPI (Ontario) - Calendar Year 2.5% 3.1% 1.4% 1.0% 2.4% 1.2% 12.2%
Index 100 102.50 105.68 107.16 108.23 110.83 112.16
Real Income $100,240 $97,795 $94,855 $93,545 $92,619 $90,448 $89,376 -12.2%
CPI: The Consumer Price Index, Statistics Canada, catalogue no. 62-001-X, Table 5 & 10, November 2015 * 2015 CPI figures based on January to November 2015
This analysis on the level of compensation leads to the following recommendations (all figures are incremental to the adjustments announced December 15, 2015):
RECOMMENDATION 3: Base compensation for senior and middle managers should be raised at least 10 per cent. RECOMMENDATION 4: Base compensation for Directors and Assistant Deputy Ministers should be raised at least 20 per cent. RECOMMENDATION 5: At least two levels of Deputy Ministers should be created with the highest level typically for the central agencies and the largest, most complex Ministries. Base compensation for Deputy Ministers should be raised at least 25 per cent for the first level and at least 35 per cent for the highest level. RECOMMENDATION 6: TBS should undertake separate reviews of salary levels and structures of the (i) Crown Counsel management group; (ii) management engineer and land surveyor group; and (iii) non-bargaining specialists.
The next question is over what time period these recommended increases should be implemented. We recognize there are a number of considerations involving trade-offs. We
26
have argued that urgent action is needed in order to facilitate the recruitment, retention and motivation of managers to replace those who will be retiring and to carry out the major reforms the Ontario Government is implementing. On the other hand, the Government is in the midst of spending restraint with the laudable goal of returning the fiscal books to balance. The recommended salary increases would have a direct fiscal cost; and no doubt they could have a negative symbolic effect on the acceptance of the overall fiscal restraint effort. On balance we put the emphasis on the need to move quickly in order to address the urgency of the situation. Consequently, the Panel recommends that 50 per cent of the adjustment be undertaken immediately with the balance of the base compensation adjustment phased in at 25 per cent per year over the remaining two years so the target levels are achieved in 2018. This will also help limit any large-scale departures of those eligible to retire at the end of 2016/beginning of 2017 because many will want to add years of service at the higher salary base. Our recommended base salary increases are based on the data we have for 2015, including the adjustments announced December 15, 2015. Therefore, these recommendations through 2018 will need to be adjusted upward over the next three years to reflect: (i) the market adjustment factor; and (ii) increases in compensation in the bargaining units to ensure that a suitable compensation advantage for management is maintained.
RECOMMENDATION 7: The recommended base pay adjustments for Ontario managers should be implemented over three years, with 50 per cent of the adjustment undertaken immediately and the balance of the base compensation adjustment phased in at 25 per cent per year over the remaining two years so the target levels are achieved in 2018. These increases through 2018 will need to be adjusted upward over the next three years to reflect: (i) the market adjustment factor; and (ii) increases in compensation in the bargaining units to ensure that an appropriate compensation advantage for management is maintained.
The Panel would be concerned if, in addition to compensation compression and inversion, OPS managers had inferior employment benefits to those in the bargaining units. A conspicuous example was the availability of para-medical benefits to people in bargaining units but not managers. This was corrected in the announcement of December 15, 2015. The Panel did not find other examples where managers do not enjoy the same sort of benefits as those of employees of bargaining units. Therefore, the Panel is not making any recommendations on managers' employee benefits.
B. Compensation Adjustments over Time Salaries have to be adjusted over time so one cannot just set the appropriate level once and go away. This is already something the Panel has flagged as part of Recommendation 7, above. Typical reasons for them to be adjusted over time reflect: productivity increases, inflation and changes in opportunity incomes (the market test). Productivity is difficult to measure in the public sector. It is hard at the aggregate level and even more difficult for the individual public servant. Automatic inflation adjustments (such as Cost of Living Adjustments, or COLAs) were
27
once common but now very rare;16 and the AMAPCEO and OPSEU agreements with the government do not have COLAs. Therefore, we believe that just as we did for recommending the level of compensation, the greatest weight should be placed on comparator compensation in determining changes over time. At least indirectly this should reflect productivity gains, although not those associated with the OPS or individual managers. So, for example, if compensation for managers in the federal government, the BPS, other provinces and key municipalities (with an eye but not an explicit weight toward the private sector) rose 1.5 per cent, then the base compensation for all Ontario management positions should be increased similarly. This would apply to all managers satisfying the requirements of their positions regardless of whether they are at the top of the salary range for their position. Similarly, relative differentials in compensation between managers and bargaining unit employees should be checked annually to ensure compression and inversion do not re-emerge. We recognize that compensation decisions are influenced by other considerations, such as in recent years the overall environment of fiscal constraint. In our advice we are focusing more on longer-term considerations and implicitly average through such experiences. Additionally, we caution putting too much weight on some of these other considerations as surely a lesson from the application of the hard freeze on management salaries and the suspension of merit pay is that it has caused more problems over the longer-term than the modest fiscal savings were worth. Just like the government makes investment decisions to build, for example, physical infrastructure to deliver more effective and efficient services or to enhance high-performing programs, appropriate compensation for the management cadre of the public service should be seen as an investment to help improve outcomes. The disinvestment over the last seven years has certainly had a contrary effect based on the stresses the Panel has observed. A key question is whether, in addition to any adjustments over time reflecting opportunity incomes, managers should receive pay increases for experience in their positions. At least implicitly this was the case in the compensation regime pre-2011. In that regime, through merit pay, most managers could expect to receive annual pay increases that went into their base until they hit the top of their salary range. As there are open ranges with the maximum of the range notionally targeted at the median of an outdated market comparator group, the process of receiving annual increases in effect is on the basis of experience (we note it was experience rather than excellence because almost all managers received merit pay under the pre-2011 regime) and could go on for several years. There is a fair amount of economic literature showing that experience is positively related to pay – because experience may be associated with on-the-job training that increases productivity.17
16 Both the share of collective bargaining settlements, as well as the proportion of unionized employees, with a COLA clause has declined steadily across industries over the past several decades; and the decline of COLA clauses in public administration has been especially pronounced. Source: ESDC. 2015. Role of COLA clauses during low inflation times. Cat. No.: Em8-14/2015E-PDF.
28
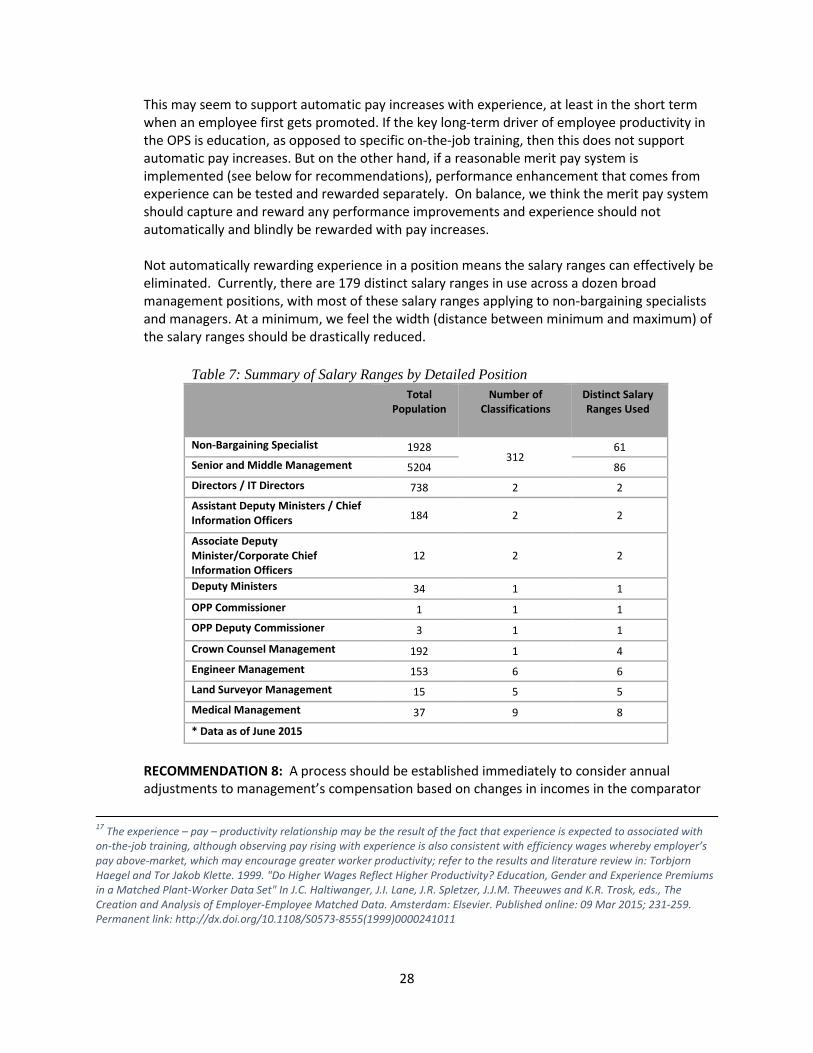
This may seem to support automatic pay increases with experience, at least in the short term when an employee first gets promoted. If the key long-term driver of employee productivity in the OPS is education, as opposed to specific on-the-job training, then this does not support automatic pay increases. But on the other hand, if a reasonable merit pay system is implemented (see below for recommendations), performance enhancement that comes from experience can be tested and rewarded separately. On balance, we think the merit pay system should capture and reward any performance improvements and experience should not automatically and blindly be rewarded with pay increases. Not automatically rewarding experience in a position means the salary ranges can effectively be eliminated. Currently, there are 179 distinct salary ranges in use across a dozen broad management positions, with most of these salary ranges applying to non-bargaining specialists and managers. At a minimum, we feel the width (distance between minimum and maximum) of the salary ranges should be drastically reduced.
Table 7: Summary of Salary Ranges by Detailed Position Total
Population Number of
Classifications Distinct Salary Ranges Used
Non-Bargaining Specialist 1928 312
61 Senior and Middle Management 5204 86 Directors / IT Directors 738 2 2 Assistant Deputy Ministers / Chief Information Officers 184 2 2
Associate Deputy Minister/Corporate Chief Information Officers
12 2 2
Deputy Ministers 34 1 1 OPP Commissioner 1 1 1 OPP Deputy Commissioner 3 1 1 Crown Counsel Management 192 1 4 Engineer Management 153 6 6 Land Surveyor Management 15 5 5 Medical Management 37 9 8 * Data as of June 2015
RECOMMENDATION 8: A process should be established immediately to consider annual adjustments to management’s compensation based on changes in incomes in the comparator
17 The experience – pay – productivity relationship may be the result of the fact that experience is expected to associated with on-the-job training, although observing pay rising with experience is also consistent with efficiency wages whereby employer’s pay above-market, which may encourage greater worker productivity; refer to the results and literature review in: Torbjorn Haegel and Tor Jakob Klette. 1999. "Do Higher Wages Reflect Higher Productivity? Education, Gender and Experience Premiums in a Matched Plant-Worker Data Set" In J.C. Haltiwanger, J.I. Lane, J.R. Spletzer, J.J.M. Theeuwes and K.R. Trosk, eds., The Creation and Analysis of Employer-Employee Matched Data. Amsterdam: Elsevier. Published online: 09 Mar 2015; 231-259. Permanent link: http://dx.doi.org/10.1108/S0573-8555(1999)0000241011
29
groups beginning in 2016 (i.e., a “market adjustment factor”) and also with an eye to ensuring that compression and inversion are not exacerbated vis-à-vis bargaining groups. RECOMMENDATION 9: Experience should not be automatically rewarded with higher pay, and therefore the OPS should move to eliminate the salary ranges for positions. To get toward this goal, the width of the salary range (distance between minimum and maximum) should be reduced so that the benefit of management employees’ prior experience does not compound year-over-year. The implementation of narrower ranges will ensure current incumbents are not significantly enriched as the OPS moves toward a single rate of pay for a position.
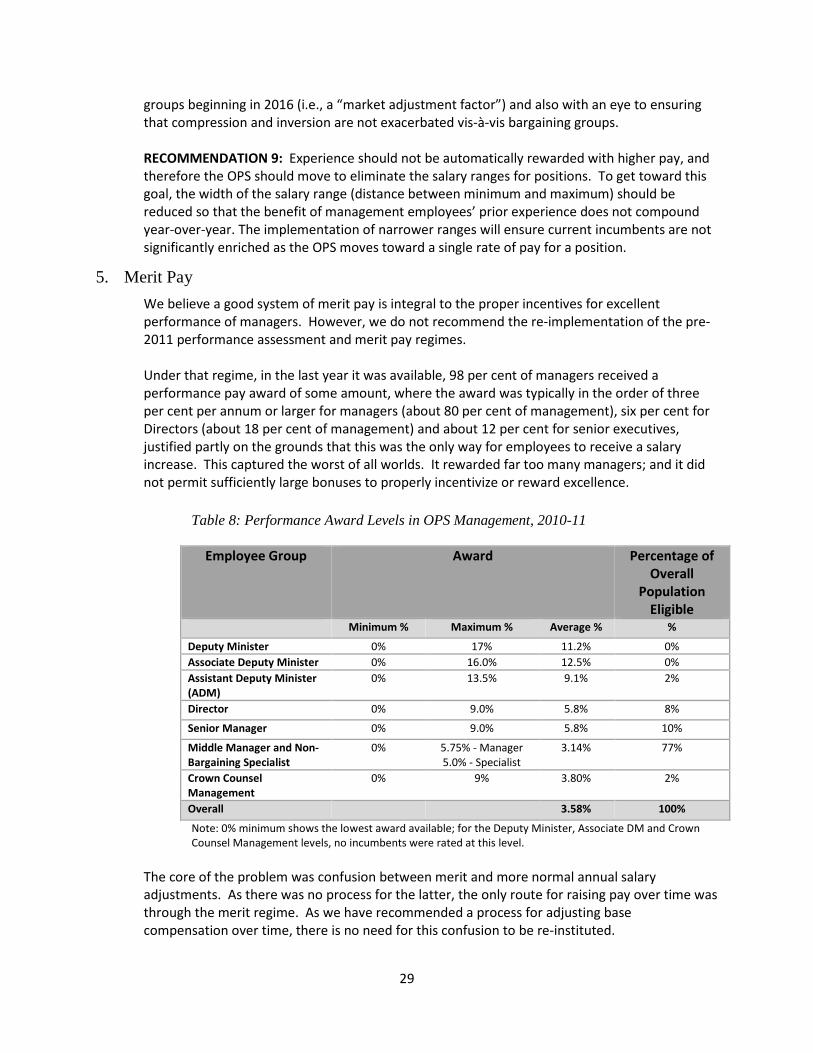
5. Merit Pay We believe a good system of merit pay is integral to the proper incentives for excellent performance of managers. However, we do not recommend the re-implementation of the pre-2011 performance assessment and merit pay regimes. Under that regime, in the last year it was available, 98 per cent of managers received a performance pay award of some amount, where the award was typically in the order of three per cent per annum or larger for managers (about 80 per cent of management), six per cent for Directors (about 18 per cent of management) and about 12 per cent for senior executives, justified partly on the grounds that this was the only way for employees to receive a salary increase. This captured the worst of all worlds. It rewarded far too many managers; and it did not permit sufficiently large bonuses to properly incentivize or reward excellence.
Table 8: Performance Award Levels in OPS Management, 2010-11
Employee Group Award Percentage of Overall
Population Eligible
Minimum % Maximum % Average % %
Deputy Minister 0% 17% 11.2% 0% Associate Deputy Minister 0% 16.0% 12.5% 0% Assistant Deputy Minister (ADM)
0% 13.5% 9.1% 2%
Director 0% 9.0% 5.8% 8%
Senior Manager 0% 9.0% 5.8% 10%
Middle Manager and Non-Bargaining Specialist
0% 5.75% - Manager 5.0% - Specialist
3.14% 77%
Crown Counsel Management
0% 9% 3.80% 2%
Overall 3.58% 100%
Note: 0% minimum shows the lowest award available; for the Deputy Minister, Associate DM and Crown Counsel Management levels, no incumbents were rated at this level.
The core of the problem was confusion between merit and more normal annual salary adjustments. As there was no process for the latter, the only route for raising pay over time was through the merit regime. As we have recommended a process for adjusting base compensation over time, there is no need for this confusion to be re-instituted.
30
A key principle of the Panel in our deliberations is that there should be no merit pay in cases where managers meet the requirements of the job. If one is hired to do a job at $100,000 a year and all the requirements are met then the pay should be $100,000, no more and no less. If the requirements are not met, then there should be action to determine and correct the causes. The panel has not deliberated on this circumstance. The manager at $100,000 pay will receive pay adjustments over time in accordance with our recommendation to follow changes in income in the comparator groups. In brief, merit pay should be restricted to cases where the incumbent exceeds requirements. There are three basic questions concerning merit pay:
• What percentage of managers should receive merit?
• How much should merit pay be?
• Should merit pay be a one-time cash payment or should it be embedded in the manager’s base pay?
Again there is no great science that can be applied to these questions. To some degree we can look at other systems and apply some judgment as to what works and what doesn’t work in terms of delivering the appropriate incentives and rewards at an acceptable cost. Our sense is that around 30 per cent of the total management cadre should be eligible for merit pay on the grounds they exceeded the requirements of their position.18 We suggest two levels of bonuses with 10 per cent of managers eligible to be considered Outstanding and receive the highest bonus and 20 per cent Superior and receive a lower amount. The highest bonus should be substantial in order to deliver the appropriate incentive and reward. We have argued above that due to the greater difficulty of tracking a public service manager’s individual contribution to overall objectives, the bonuses should not be as large as typical in the private sector. We also believe the bonuses should be largest for Deputy Ministers because they have the greatest responsibility and the greatest discretion in influencing outcomes of programs. On balance, we suggest the top bonus be 25 per cent for Deputies and their second order bonus 10 per cent. For Assistant Deputy Ministers, Directors and Managers we suggest a top bonus of 15 per cent with the second order bonus 5 per cent. As noted above, the pre-2011 regime allowed merit pay to be embedded into a manager’s base compensation. Merit pay was the only mechanism for a non-bargaining employee to receive an increase to base salary (other than changing jobs), however, this resulted in a confusion between merit and annual adjustments to compensation to track what is happening in the economy and with comparator groups. One can, however, relate some principles to the question of whether merit pay should be added into the base compensation or not. To some degree it revolves around the question of whether performance in one year is correlated with performance in subsequent years; that is, if a manager exceeded requirements in year one, should there be an ongoing reward? Or should a repeat of the financial reward be predicated
18 The 30 per cent is broadly consistent with the 2014-2015 competency assessment scores for management for the percentage that scored at the “demonstrates above level” competency rating.

31
on the manager receiving an Outstanding or Superior rating in the subsequent years? We tend to side with the latter scenario. Having merit pay embedded into base pay also tends to re-create the pre-2011 system. If the merit bonuses were allowed to accumulate over time without limit, the top of the pay scale could become very high and exceed what is suggested from the market test. Consider that with the compounding effect, someone receiving a 15 per cent bonus for five consecutive years would double their compensation. On the other hand, allowing the merit pay to be embedded into base compensation only up to the top of the pay grid would create a situation, as per pre-2011, of managers getting crowded at the top of pay salary range and recreating compression. We have recommended that base compensation be adjusted over time in accordance with what happens among the comparator groups. But we have identified two mechanisms whereby that could be altered:
• As discussed in the previous section, whether base pay is automatically adjusted for experience; and,
• The discussion here whether merit pay should be reflected in the base.
Putting the two issues together, one can consider a two by two matrix of possibilities including: Model 1. No adjustment for experience; Merit pay one-time cash. Model 2. Adjustment for experience; Merit pay one-time cash. Model 3. No adjustment for experience; Merit pay to be embedded in base. Model 4. Adjustment for experience; Merit pay to be embedded in base.
Figure 1: Ontario Public Service Experience-Performance Pay Models
MODEL 1 Merit Pay One
Time cash No Adjustment for
Experience
MODEL 2 Merit Pay One
Time Cash Adjustment for
Experience
MODEL 3 Merit Pay
Embedded in Base No Adjustment for
Experience
MODEL 4 Merit Pay
Embedded in Base Adjustment for
Experience
32
The Panel comes down in favour of Model 1. We recognize this is the “toughest” option from the perspective of managers. But we think it can deliver the intended results due to the systems we recommend for setting base and merit pay. Where experience leads to better performance in a job that should, in turn, increase a manager’s odds of being evaluated as Outstanding or Superior; and the merit pay can be re-earned every year by maintaining an Outstanding or Superior performance. We are aware that merit pay and the system of performance appraisals that underlies it can be fraught with risk. The process can be highly subjective and even arbitrary. It will not be possible to remove all such risk, but certain procedures can be adopted to reduce the risks. The Panel has heard anecdotal comments from Executives that the performance appraisal process and the form itself are onerous/cumbersome. Similarly, while it may not be possible to establish a completely efficient appraisal system, the current procedure for performance appraisals should be reviewed with a view to increasing its efficacy. We provide some guidance here but believe a good merit pay system must be supported by a sophisticated process of performance appraisals and devising this goes beyond the scope of this Panel’s work. We urge the Ontario Government to formally establish a process to improve the performance appraisal system.
RECOMMENDATION 10: The Ontario Government should review the current performance appraisal system to ensure that it supports the merit pay regime we advocate.
The key to a good performance evaluation system is to establish as clearly as possible on an a priori basis the objectives of a manager. This must be set out prior to or at the commencement of the year and understood and agreed to by all parties. To the extent possible the objectives should be concrete with explicit deliverables that can be measured and tested against. The document should be amended when and if any changes are made to objectives. The goals should reflect a mix of corporate (Government-wide, Ministry-wide) and individual goals. We note that in 2011 the permanent advisory group on executive compensation to the Federal Treasury Board Secretariat recommended an explicit weighting of corporate and individual goals but that in the 2015 report they acknowledged this had not worked well and the two sorts of objectives should be blended without explicit weights. We agree with this position. This requirement for explicit goals in performance appraisals fits well with the thrust of the Ontario Commission (2012) where a major principle was the need to establish much more explicit goals for programs throughout the Government. These program tools can in turn be used to establish clear markers for managers’ performance. With a quota system in that only 30 per cent of managers can receive merit pay, there is a need for oversight in the allocation of merit. This is required at several levels as the total across Government cannot exceed the 30 per cent but, as well, there will be a need for fairness across and within Ministries. This does not mean that each Ministry or each area within a Ministry should hit the 30 per cent mark. It may be deemed that certain areas are especially critical to achieving the Government’s objectives in a particular year. Those most closely associated with delivering on the required fiscal savings in the drive to return to budget balance might be an example. A new and challenging need might arise that is going to require imaginative and hard
33
work. Managers in those areas might be eligible to use up more than the 30 per cent allocation. The actual allocation would of course depend upon whether they actually delivered. We do not believe the pre-2011 regime was applied to allow for such allocations of ratings that exceeded requirements. We note that in the pre-2011 regime Ministries were ranked in a manner that provided higher merit payments for executives and senior managers for some Ministries. This was the case with the central agencies, for example. We do not deny that executives in the central agencies tend to have tough jobs. The point is that recognizing this should not be to the exclusion of incentivizing and rewarding executives and senior managers in other areas of high priority or individuals who went above and beyond the call of duty regardless of where they work. Further, the previous regime made the executives and senior managers in the central agencies reluctant to move elsewhere due to the expectation that such a move could reduce their performance-based award.
RECOMMENDATION 11: A new system of merit pay should be implemented. No more than 30 per cent of managers would be eligible for merit pay in any year; with 10 per cent of managers rated Outstanding and 20 per cent Superior. No other managers would receive any bonus. The two levels of bonuses for Deputies would be 25 and 10 per cent; for Assistant Deputy Ministers, Directors and Managers the two levels would be 15 and 5 per cent. All bonuses would be one-time cash payments and they would not be embedded in base salaries. RECOMMENDATION 12: A supportive system based around performance evaluations needs to be established to ensure a fair and effective merit pay system. Processes should be established to have fair allocation of merit pay across and within Ministries. The allocation should reflect a mix of Government-wide and Ministry-wide priorities and individual performance.
6. Structure of the Management Group There are hundreds of distinct job classifications within Ontario’s management group and for the overwhelming majority of managers there are many salary ranges corresponding to different classifications and positions. In many cases there are only a few and sometimes no people in certain classifications. On the other hand, the vast majority of managers are in a small number of positions. We have recommended above that the number of distinct salary ranges within positions be eliminated or at least substantially reduced. The structure of management also needs to be reviewed including both the number of classifications and management layers. Altogether there are 342 classifications across a dozen broad management positions. While the senior executive positions (i.e., Deputy Ministers; Associate/Assistant Deputy Ministers; Directors), as well as some of the professional management groups (e.g., Crown Counsel; Medical Management; Management engineers and Land Surveyors) have few classifications, there are 312 classifications for the middle manager and non-bargaining specialist positions. This structure is antiquated and dates back to the 1970s so that many of the classes have become obsolete and are either underutilized or are simply not used at all. Among non-bargaining specialists and middle managers, 53% of classifications are currently vacant and 68 classifications have less than ten employees in them, while the 10 most populated classes
34
account for about 55% of all middle managers and non-bargaining specialists. Here we recommend the number of classifications be reduced from the hundreds to a figure likely less than a dozen, through the application of a modern job evaluation system. We note that important work has already started to develop a new job evaluation plan for non-bargaining specialists and middle management positions that is expected to significantly reduce the number of classifications. The Panel wishes to emphasize the importance of fully accounting for the new skills and competencies required in the OPS while at the same time undertaking to ensure that pay equity principles and requirements are fully adhered to. This job re-evaluation process also needs to be initiated for the other senior management (i.e., Directors, Associate/Assistant Deputy Ministers; and Deputy Ministers) and professional management groups. The reduction in the number of classifications will need to be done with care in cases where there are incumbents because they should not be hurt financially through the transition. In some cases the transition may require a modest round-up in a manager’s salary to move the position to one of the remaining categories/base salary levels; and in other cases this might involve simply “red-circling” incumbents in certain classifications. RECOMMENDATION 13: Reduce the number of management job classifications from the hundreds to fewer than a dozen, through the application of a modern job evaluation system. The transition process to implement the new job evaluation plan should neither hurt nor significantly enrich incumbents.
The Panel wished to examine the number of layers of management and spans of manager control within organizations in the OPS, but the data available to the Panel to assess whether the layers and spans of control are efficient was too limited. As examples, the data available regarding span of control does not provide information on the nature of the reports, distinguish how many people are at the lower levels in the hierarchy, or differentiate across functional lines. The Panel has concluded that the levels of management can vary considerably both across ministries as well as across functions within a ministry. While on the surface there seems to be too many layers of management in at least 20 per cent of the cases, we are also aware, for example, that many of these circumstances are in Natural Resources and Corrections where there are large numbers of employees. While the Panel to date has not seen sufficient information to draw a strong overall conclusion regarding layers of management, the Panel does recommend that there be a formal review of management structures within Ministries (i.e., number of layers of management) and spans of control that is conducted in conjunction with the review of the number of management job classifications. RECOMMENDATION 14: Conduct a review of management structures and spans of control within Ministries, in conjunction with the development of job evaluation plans and process of reviewing and reducing the number of management job classifications. This review of management layers should take full account of the operational requirements of Ministries.
Table 9: Summary of Classification Structure by Detailed Position

35
Population
Number of Classifications
% of Classifications Used
Non-Bargaining Specialist 1928 312
28% Senior and Middle Managers 5204 40%
Directors / IT Directors 738 2 100% Assistant Deputy Ministers / Chief Information Officers 184 2 100%
Associate Deputy Minister/Corporate Chief Information Officers
12 2 100%
Deputy Ministers 34 1 100% OPP Commissioner 1 1 100% OPP Deputy Commissioner 3 1 100% Crown Counsel Managers 192 1 100% Engineer Managers 153 6 50% Land Surveyor Managers 15 5 60% Medical Managers 37 9 100%
* Data as of June 2015
Table 10: Span of Control in Terms of Number of Direct Reports
1 Report 2-3 Reports 4-5 Reports 6-10 Reports 11+ Reports
% of Management
3% 7% 11% 28% 51%
7. Competencies and Other Elements of the Profile of Managers The nature of work within the OPS has changed drastically in recent decades in favour of more highly skilled occupations involving knowledge-based activity. Managers and their employees are much more likely to be involved in policy design, policy planning evaluation and contract management than in direct service delivery as so much of the latter is now contracted out. Despite this relative shift toward policy and away from delivery, the OPS and its managers are still at or close to the front lines in delivering many services. Yet the delivery of some of these services is one of the things the Ontario Auditor General was most critical of in her last report. At first blush, the criticisms seem to be fairly directly targeted at transfer partners. Of course, indirectly that is a criticism of the OPS managers that manage those transfer partners or at least of those who establish and manage the contracts – hence the need to review competencies in the contracting and management of transfer partners. In particular, we recommend that any responses of the government to comments from the Auditor General’s report related to transfer partners be reviewed to determine whether they should also be reflected in a review of competencies of OPS managers responsible for the contracting and management of transfer partners.

36
Chart 5: Distribution of Jobs in the OPS by Function, as at March
The Panel was interested in whether the changing nature of work has been reflected in the competencies sought and found in management. We are pleased and impressed to note that careful efforts have been made to set certain appropriate competencies. In particular, great weight is attached to leadership skills and teamwork. We are also pleased to note that these particular competencies are tested in candidates for recruitment. There are also special programs to identify and give support and training to employees identified as management potential, and to provide them training in such aspects as leadership when they make the transition to management. We have seen less evidence of progress on developing the skills and competencies required of the modern manager. In particular, we believe that policy development and program evaluation skills, knowledge of contracts, and managing third parties are all critical aspects of a manager’s job in the modern environment of delivering world class services at a reasonable cost. We believe potential recruits should be tested on these skills. And while to a degree these skills can be and are learned on the job with experience, we believe more explicit training programs in policy development and program evaluation should be provided to employees and to new managers. The Panel is also pleased to note that a Centre of Excellence for Evidence-Based Decision-making has been created that has the mandate to support performance measurement and the development of competencies in data analytics in government that will build capacity in evidence-based policy making across ministries and agencies. While initial progress is being made on establishing the Centre itself, the real work of the Centre is still at a formative stage and this initiative should be given a high priority. The Ontario Government could be doing more to describe and convey the competencies they seek to the colleges and universities that provide the graduates that are the feeder group to the public service and, ultimately, given the tendency to promote from within into the management
0%
10%
20%
30%
40%
50%
60%
70%
Program Delivery Program SupportServices
ProgramDevelopment
(Policy, Planning andEvaluation)
Legal counsel Senior and ExecutiveManagement
1995
2003
2008
2015
37
level, to management. This requires aligning the work and outcomes of the OPS Centre for Leadership and Learning, and the Talent Management Program/Strategy, with post-secondary programs. Greater use could also be made of specific post-secondary courses and programs to train potential and current managers in areas where there might be specific gaps in their competencies. More generally, the OPS must develop stronger recruiting programs with post-secondary institutions and create greater linkages between the existing recruitment platforms in the OPS and post-secondary programs that feed into key management areas, including BAs and MAs, MBAs and MPAs, and MIRs.
RECOMMENDATION 15: The Ontario Government should put a greater emphasis on policy development and program evaluation in the competencies it seeks in its managers and these skills should be tested in recruits to the Government. RECOMMENDATION 16: Existing management training programs should be reviewed and new ones designed to ensure that the objectives and outcomes are matched to the required management skills and competencies. RECOMMENDATION 17: The Government should more explicitly describe and communicate the competencies it seeks in managers to the colleges and universities that provide the graduates that are the feeder group.
RECOMMENDATION 18: The government should make greater use of specific courses and programs, in conjunction with colleges and universities, to address gaps in the competencies of managers and those with the potential for management. RECOMMENDATION 19: The OPS must develop stronger recruiting programs with post-secondary institutions and create greater linkages between the existing recruitment platforms in the OPS and post-secondary programs that feed into key management areas.
8. Inclusiveness of Management Ideally the composition of managers in the OPS would be representative of the Ontario population. The data required for a thorough examination of the composition of managers in the OPS are not available. Essentially the only tool is a self-declaration process in the employee engagement survey done every few years and this survey suffers from a low response rate - in 2009, the response rate was 59.9%, 2011 63.5% and most recently, in 2014, the OPS response rate fell to 57.5%.
RECOMMENDATION 20: The Ontario Government needs to create much better data on its employees and their movements into, within and out of the Ontario Public Service in order to support the analysis required to better understand how best to improve inclusiveness in and across the Government including the management group. We applaud the recent survey of interns but we believe this is already quite a diverse group so that survey may not yield results with broader implications. A survey with anonymity of all applicants to the Ontario Public Service would be useful to determine who applies, is selected, and ultimately hired. Therefore i) Priority should be placed on increasing the response rate for the Employee Engagement Survey; and the Employee Engagement Survey could be sharpened to reveal more useful data specifically to support the goal of inclusiveness; ii) All applicants and all new hires into the OPS
38
should be invited to complete a self-identification survey that includes demographic information that will support the goal of inclusiveness.
From the self-declarations on the Employee Engagement surveys, we know that in certain respects Ontario’s management cadre is representative of the population. As in the Ontario workforce, females are close to 50 per cent of the management group. The share of francophones and the share of people with disabilities are also close to the general workforce population. The representation falls short within the management group for indigenous people and visible minorities. In the former case, the representation shortfall is small in the OPS, but it is serious in the management group. A representation shortfall of visible minorities is found at the OPS level, although the overall representation gap is not as acute as in the management group. There are several questions one needs to pose in order to understand and then address the under-representation in management of indigenous people and visible minorities:
• Do the under-representations flow from historical patterns or are they being propagated by
current practices?
• Is the problem one of under-representation at the recruitment level, amongst employees in the OPS, generally, or more exclusively an issue at the level of management?
Although the data are weak, we can infer a few answers. Only about 1 per cent of management is indigenous whereas in the Ontario workforce it is about 2.4 per cent. The representation in the OPS as a whole is 2 per cent. At first blush this might suggest the issue is a slow rate of promotion for indigenous people. But in order to understand the process we would need much more information. Perhaps the indigenous people in the OPS are disproportionately in positions that do not tend to feed into management; or possibly the indigenous workers in the OPS do not have the education profiles typical of managers. Only about 14 per cent of senior management are visible minority (again we note the caution this is from self-declaration on an employee survey) whereas the representation in the Ontario workforce is 25 per cent. The representation in the OPS, overall, falls in between at 20 per cent. This is suggestive of both a potential issue in the inclusiveness of recruitment and in promotion. But here again we can’t distinguish whether this is largely a reflection of historical patterns or is the present propagating the issue. In the 2014 Employee Engagement survey, people who self-declared as visible minority noted rates of promotion within the last 3 and 5 years that are similar to the general OPS population. This is far from conclusive, but it does suggest the rate of promotion in recent years is not a factor behind the under-representation of visible minorities in management. The Panel also notes that there is a degree of skewness in the representation data, such as certain ethic groups being concentrated in administration and others in information technology. We believe a goal should be to not only increase overall representation of visible minorities but to improve the distribution across all fields of the Government as well. However, we consider the skewness of representation to be a second order issue at the moment relative to the large gaps that exist in the overall degree of representation.
39
While the Panel is not able to decipher with any great accuracy the causes of the under-representation of indigenous people and visible minorities in management, we hypothesize that a good deal of it reflects historical patterns. This may explain some of the under-representation but, of course, does not excuse it. It does mean, however, that if recent recruitment and promotion patterns are more representative, the problem may self-correct over time. But given that weight of history, it will be a long time before the OPS is fully representative. If the OPS relies primarily upon internal promotion and mobility, then the representation would most likely become more balanced first at the entry level into the OPS, then through the bargaining units, and then only finally in the management cadre. The Panel does not believe the Ontario Government should rely solely on normal processes to address the management cadre not being representative of the population. The Panel notes that the Ontario Government has clearly come to the same conclusion. There is strong leadership within the OPS driving these issues, including an external advisory group on inclusion recently set up by the Secretary of the Cabinet/Head of the OPS to provide him with ongoing advice. This measure is in addition to the internally led initiatives mentioned at the outset of this report. There are several things the Ontario Government could and should do to address the under-representation of indigenous and visible minorities in management and to increase diversity more generally:
• First, the Government should do everything possible to eliminate discrimination within the
Government. We note in the employee surveys that many employees indicated they experienced discrimination, and that reports of race-based discrimination have increased. Discouragingly, we also observe employees say they do not report much of the discrimination they confront and few are satisfied with the responses when they do report. On the other hand, we note and applaud the Government taking this seriously and mounting programs to eradicate the discrimination. The Panel is concerned about both overt as well as implicit forms of discrimination. The latter form of discrimination can manifest itself systemically through hiring, promotion and performance evaluation procedures. Recognizing that addressing implicit discrimination is also a long term issue, we strongly encourage the Government to begin, immediately, to design and implement a plan that specifically addresses the issue of implicit discrimination in hiring and promotion decision-making and in performance evaluation.
• Second, as the degree of representation is better below the management level, establishing
programs that prepare manager- and director-ready employees for promotion would speed up the representation improvement in management. Indeed, such programs were included in the OPS Anti-Racism Action Plan and we applaud this.
• Third, to speed up the transition to better representation, the Government will have to rely
more extensively on external recruitment than is normally the case.
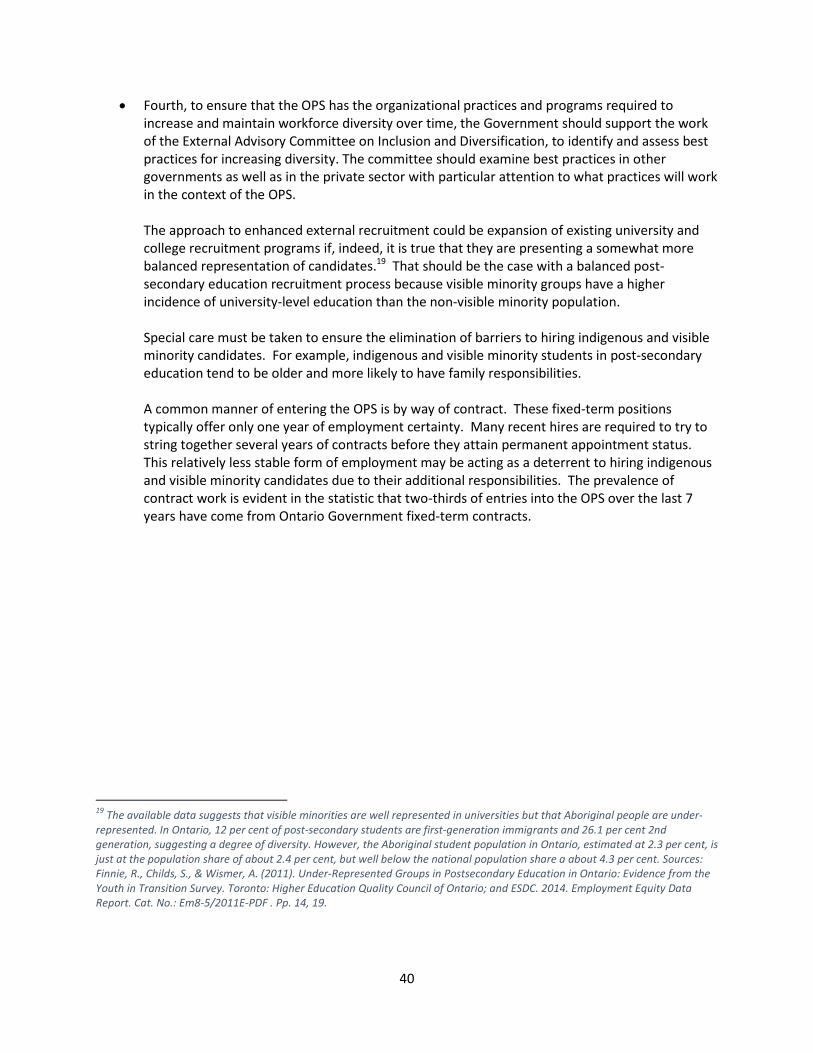
40
• Fourth, to ensure that the OPS has the organizational practices and programs required to increase and maintain workforce diversity over time, the Government should support the work of the External Advisory Committee on Inclusion and Diversification, to identify and assess best practices for increasing diversity. The committee should examine best practices in other governments as well as in the private sector with particular attention to what practices will work in the context of the OPS.
The approach to enhanced external recruitment could be expansion of existing university and college recruitment programs if, indeed, it is true that they are presenting a somewhat more balanced representation of candidates.19 That should be the case with a balanced post-secondary education recruitment process because visible minority groups have a higher incidence of university-level education than the non-visible minority population.
Special care must be taken to ensure the elimination of barriers to hiring indigenous and visible minority candidates. For example, indigenous and visible minority students in post-secondary education tend to be older and more likely to have family responsibilities. A common manner of entering the OPS is by way of contract. These fixed-term positions typically offer only one year of employment certainty. Many recent hires are required to try to string together several years of contracts before they attain permanent appointment status. This relatively less stable form of employment may be acting as a deterrent to hiring indigenous and visible minority candidates due to their additional responsibilities. The prevalence of contract work is evident in the statistic that two-thirds of entries into the OPS over the last 7 years have come from Ontario Government fixed-term contracts.
19 The available data suggests that visible minorities are well represented in universities but that Aboriginal people are under-represented. In Ontario, 12 per cent of post-secondary students are first-generation immigrants and 26.1 per cent 2nd generation, suggesting a degree of diversity. However, the Aboriginal student population in Ontario, estimated at 2.3 per cent, is just at the population share of about 2.4 per cent, but well below the national population share a about 4.3 per cent. Sources: Finnie, R., Childs, S., & Wismer, A. (2011). Under-Represented Groups in Postsecondary Education in Ontario: Evidence from the Youth in Transition Survey. Toronto: Higher Education Quality Council of Ontario; and ESDC. 2014. Employment Equity Data Report. Cat. No.: Em8-5/2011E-PDF . Pp. 14, 19.
41
Fixed-term assignments versus regular employment: Across the OPS, new hires into the organization consist of those that are hired as regular (permanent) employees and those that are hired under a fixed term. Each year, about 1800-2200 employees have been hired on fixed term contracts, and each year about 2000 move into to regular status, making this a major port of entry into the OPS.
2007-08 2008-09 2009-10 2010-11 2011-12 2012-13 2013-14 2014-15
Regular (Permanent)
1,414 1,617 1,221 1,112 669 712 822 922
Fixed Term 14,530 14,385 13,369 13,310 11,944 11,280 12,144 12,344
Fixed-Term to Regular
(Permanent)
2,199 2,368 2,273 1,786 1,415 1,267 1,792 2,205
External recruitment must also expand beyond post-secondary education graduates to pick up employees further along in the ranks and some who will enter the OPS just below or just into the management cadre, while respecting Collective Agreement provisions. Although here it must be noted that indigenous and visible minority people are under-represented at the management level in virtually all sectors.20 So it may be difficult to find a large number of candidates immediately ready for management positions. The salary adjustments recommended above should alleviate one barrier to external recruitment although the Panel does not believe compensation is the major barrier in the case of indigenous or visible minority workers. Research could support the nature of an external recruitment process. In a 2014 study, DiversityLeads reported that within the GTA, only 4.5 per cent of senior corporate leaders were visible minority whereas the shares were almost 20 per cent in the sectors of education and public sector agencies, boards and commissions. That suggests which doors should be looked behind.
We note and support the Ontario Government’s recent efforts to study the non-executive and executive hiring processes. It is possible that certain other factors like the one noted above on the age and responsibilities of indigenous and visible minority candidates may surface. There may even be aspects of the hiring protocols that introduce implicit distortions. Our hope is that any such factors that are impediments to inclusiveness will surface from the studies so that better hiring protocols can be developed.
20 in 2011, nationally, the occupational distribution shows that Aboriginal peoples were slightly less represented in senior management (at roughly 2 per cent of Aboriginal Peoples compared to 2.5 per cent of the total population) and substantially under-represented among middle managers and professionals (for middle managers, at roughly 6 per cent of Aboriginal Peoples compared to about 9.5 per cent of the total population; and for professionals, at roughly 10.5 per cent of Aboriginal Peoples compared to about 17.5 per cent of the total population.
The occupational distribution shows that visible minorities were also under-represented: they were slightly less represented in senior management (at less than 1 per cent of visible minorities) and under-represented among middle managers and professionals (for middle managers, at roughly 8 per cent of visible minorities compared to about 9.5 per cent of the total population; and for professionals, at roughly 17.5 per cent of visible minorities compared to about 19.5 per cent of the total population.
Source: ESDC. 2014. Employment Equity Data Report. Cat. No.: Em8-5/2011E-PDF . Pp. 14, 19.
42
RECOMMENDATION 21: The Ontario Government should continue with its initiatives to eradicate discrimination in the workplace and ensure that they are adequately resourced. RECOMMENDATION 22: The Ontario Government should begin immediately to design and implement a plan that specifically addresses the risks of implicit discrimination in hiring and promotion decision-making and in performance evaluation. RECOMMENDATION 23: The Ontario Government should continue its work with the External Advisory Committee on Inclusion and Diversification to identify and assess best practices for increasing diversity that examine practices in other governments as well as in the private sector. RECOMMENDATION 24: The Ontario Government should increase the rate of external hiring at both the post-secondary education and workplace levels, as this offers the greatest chance of speeding up the process to achieving a more representative management cadre. RECOMMENDATION 25: The Ontario Government should consider to what degree the tendency to hire on contract is impeding the recruitment of indigenous and visible minority candidates and amend the hiring model accordingly, with consideration for the implications for collective agreements. RECOMMENDATION 26: The Ontario Government should continue to study recent recruiting at the non-executive and executive levels to determine whether there are explicit and/or implicit factors that are acting as impediments to inclusiveness. Better hiring protocols can then be developed from this evidence. RECOMMENDATION 27: The merit principle should continue to guide recruitment and promotion throughout the Ontario Public Service. As such, quotas should not be set for representation. The focus should be on actively broadening the recruitment process and ensuring that there are no barriers to indigenous people and visible minorities being hired and promoted.
9. Implications for Management Recruitment and Training Several elements of what we have discussed above have implications for recruitment and training. A large number of managers will be retiring over the next few years and perhaps especially in 2016 and they will need to be replaced. The Ontario Government has some succession management initiatives underway that will help identify top talent in the short run (e.g., OPS Talent Management Program; STEP Program (Succeeding Talent in Executive Positions); and Assessment and Development Framework for ADMs Ready for Higher Level), and support increased recruitment into management longer term (e.g., Advancing into Management (AIM); and Leadership Development Program (LDP)). But the flat age profile across the management group noted above suggests the traditional model of promoting up from within is not going to get the job done, especially as the next-level-down will be retiring as well. Significantly more external recruitment will be required over a sustained period of time to ensure the OPS has talent in place to continue to deliver and to speed up any natural process of improving the representativeness of management. We also
43
noted there may be gaps between existing and desired competencies of managers. All of this suggests some major challenges for recruitment and training over the next few years. We note with approval that the Ontario Government has some good programs in place that will support the tasks. These include the ones that identify and support potential management candidates. More of this will be required. Inevitably some people will be getting promoted into or within management before they would have been considered ready under more traditional circumstances. And that means a special emphasis on supporting them. Against this context we recommend: RECOMMENDATION 28: A more concerted effort to identify employees who have management potential or managers who could potentially go higher and identify and deliver the training and other supports they need. Some of this can and should be done internally. Some should be done in conjunction with colleges and universities. RECOMMENDATION 29: A program should be established along the lines of what used to be called The Accelerated Economist Program in the federal government. In Ontario’s case it would encompass all disciplines, not just economists. Only the best and brightest would be recruited to the program. They would start off with experiences in the central agencies and line Ministries working on high priority projects that offer the greatest learning opportunities and broadest perspectives. They would be tracked and supported throughout their careers with the aspiration that they would be ready for management earlier than under a traditional model.
10. Longer-term Considerations Even if implementing the above recommendations gets the environment in the Ontario management cadre correct at the moment, things would need to be adjusted thereafter. The field of compensation and management issues in general changes over time. Some of the recommendations may not have exactly the expected effect and they, too, may well need to be fine-tuned. In short, some sort of ongoing process is needed for monitoring and reviewing changes and progress, making recommendations on compensation adjustments, and to address the other systemic issues this Panel has looked into, and more. We've done a thorough review of compensation and other conditions of employment of managers in the OPS. Of course Ontario public services are delivered by the BPS as well. It is beyond the terms of reference to the Advisory Panel to look at compensation and other terms of employment in the BPS. However, these conditions do affect OPS managers because the BPS is often the destination of managers who leave the OPS. We recommend in future that the Ontario Government conduct for the BPS the kind of review we have done here for the OPS. RECOMMENDATION 30: Establishment of a permanent standing body to make recommendations to the President of the Treasury Board on OPS management and compensation issues. It could be similar in structure and reporting to the federal government’s Advisory Committee on Senior Level Retention and Compensation.21 The body:
21 In terms of reporting it might follow the pre-2012 regime as the group does not seem to have been very active since then.
44
i. Should include representation from across sectors and backgrounds.
ii. Should include among its members persons with expertise in employment relations and compensation.
iii. Could make recommendations on the most appropriate “market adjustment” that would change all managers compensation in line with what is happening in comparator groups.
iv. Could examine the implications of any “market adjustments” and other factors on the gap in compensation between managers and employees in bargaining units.
v. Could look at special cases that might require changes in compensation. vi. Could respond to special requests from the President of the Treasury Board.
The Panel notes that reducing discrimination and achieving an OPS management that is representative of Ontario citizens will require that there be a sustained emphasis placed upon this goal by the senior leadership over time, and that this effort be backed up by a long term strategy. This is a service-wide objective that requires senior leadership.
RECOMMENDATION 31: The PSC, as part of its mandate should ensure enterprise-wide focus on strategies and actions, including coordination of initiatives, to reduce discrimination and to achieve a management in the Ontario Public Service that is much more representative of the Ontario population. The committee should include senior management and members with expertise in employment relations and human resources, including workplace discrimination and equity.
The Panel has identified a number of targeted areas where more information about the workforce is required in the near term in order to begin the process of renewing the OPS, including new survey information on hiring and exists, and the demographics of new hires. These specific initiatives need to be pulled together, and a more comprehensive and coordinated approach to information collection and analysis is required if the objectives of improving diversity, enhancing recruitment and retention, and improving productivity are to be achieved. The Panel therefore also looks beyond the recommendations above to immediately enhance the information available in specific areas, to create a comprehensive Workforce Information System (WIS). It is not enough, however, for the new WIS to simply be a comprehensive but stagnant depository of survey data and other information about employees. This workforce information system also needs to go well beyond such measures as upgrading the current personnel information system in place in the OPS, which is focused on collecting and handling more traditional payroll types of information.22 To achieve the objectives of modernizing the OPS management, the establishment of the WIS should be done with a view to permitting
22 This is in addition to and to be clearly distinguished from the more conventional uses of an “HRIS” for personnel management (e.g., payroll management; managing employee benefits).
45
evidence-based analysis that will be used in understanding of workforce dynamics (e.g., hiring and exits), and to support strategic planning and objectives (e.g., meeting diversity objectives). RECOMMENDATION 32: Treasury Board Secretariat should work to establish a comprehensive Workforce Information System (WIS) that among other things keeps more complete records on movements into, within and out of the management group, key demographic characteristics of new hires, results of exit surveys, survey results of new hires, and information about employee engagement. The establishment of the WIS should be done with a view to permitting evidence-based analysis that will be used in understanding workforce dynamics (e.g., hiring and exits), and to support strategic planning and objectives (e.g., meeting diversity objectives). People trained in human resources issues should be responsible for the WIS.
46
Advisory Panel Recommendations Overall Recommendations.
RECOMMENDATION 1: The Treasury Board Secretariat should develop more complete records on movements into, within and out of the management group. The most significant information gap at present is on exits as the Ontario Public Service has no means of tracking where people go and why and when they leave jobs. To address this shortcoming, a comprehensive exit survey should be developed and applied in the case of voluntary departures to determine where the manager is going and why.
RECOMMENDATION 2: We suggest the Ontario Government consider options that keep post-retirement benefits in line with most other public sector employers while protecting savings, and lessening the likelihood of a surge in retirements over the next year.
Base Compensation.
RECOMMENDATION 3: Base compensation for senior and middle managers should be raised at least 10 per cent. RECOMMENDATION 4: Base compensation for Directors and Assistant Deputy Ministers should be raised at least 20 per cent. RECOMMENDATION 5: At least 2 levels of Deputy Ministers should be created with the highest level typically for the central agencies and the largest, most complex Ministries. Base compensation for Deputy Ministers should be raised at least 25 per cent for the first level and at least 35 per cent for the highest level. RECOMMENDATION 6: TBS should undertake separate reviews of salary levels and structures of the (i) Crown Counsel management group; (ii) management engineer and land surveyor group; and (iii) non-bargaining specialists.
RECOMMENDATION 7: The recommended base pay adjustments for Ontario managers should be implemented over three years, with 50 per cent of the adjustment undertaken immediately and the balance of the base compensation adjustment phased in at 25 per cent per year over the remaining two years so the target levels are achieved in 2018. These increases through 2018 will need to be adjusted upward over the next three years to reflect: (i) the market adjustment factor; and (ii) increases in compensation in the bargaining units to ensure that an appropriate compensation advantage for management is maintained.
RECOMMENDATION 8: A process should be established immediately to consider annual adjustments to management’s compensation based on changes in incomes in the comparator groups beginning in 2016 (i.e., a “market adjustment factor”) and also with an eye to ensuring that compression and inversion are not exacerbated vis-à-vis bargaining groups. RECOMMENDATION 9: Experience should not be automatically rewarded with higher pay, and therefore the OPS should move to eliminate the salary ranges for positions. To get toward this
47
goal, the width of the salary range (distance between minimum and maximum) should be reduced so that the benefit of management employees’ prior experience does not compound year-over-year. The implementation of narrower ranges will ensure current incumbents are not significantly enriched as the OPS moves toward a single rate of pay for a position.
RECOMMENDATION 10: The Ontario Government should review the current performance appraisal system to ensure that it supports the merit pay regime we advocate.
RECOMMENDATION 11: A new system of merit pay should be implemented. No more than 30 per cent of managers would be eligible for merit pay in any year; with 10 per cent of managers rated Outstanding and 20 per cent Superior. No other managers would receive any bonus. The two levels of bonuses for Deputies would be 25 and 10 per cent; for Assistant Deputy Ministers, Directors and Managers and two levels would be 15 and 5 per cent. All bonuses would be one-time cash payments and they would not be embedded in base salaries. RECOMMENDATION 12: A supportive system based around performance evaluations needs to be established to ensure a fair and effective merit pay system. Processes should be established to have fair allocation of merit pay across and within Ministries. The allocation should reflect a mix of Government-wide and Ministry-wide priorities and individual performance.
Structure of the Management Group.
RECOMMENDATION 13: Reduce the number of management job classifications from the hundreds to fewer than a dozen, through the application of a modern job evaluation system. The transition process to implement the new job evaluation plan should neither hurt nor significantly enrich incumbents.
RECOMMENDATION 14: Conduct a review of management structures and spans of control within Ministries, in conjunction with the development of job evaluation plans and process of reviewing and reducing the number of management job classifications. This review of management layers should take full account of the operational requirements of Ministries.
Competencies and Other Elements of the Profile of Managers.
RECOMMENDATION 15: The Ontario Government should put a greater emphasis on policy development and program evaluation in the competencies it seeks in its managers and these skills should be tested in recruits to the Government. RECOMMENDATION 16: Existing management training programs should be reviewed and new ones designed to ensure that the objectives and outcomes are matched to the required management skills and competencies. RECOMMENDATION 17: The Government should more explicitly describe and communicate the competencies it seeks in managers to the colleges and universities that provide the graduates that are the feeder group.
48
RECOMMENDATION 18: The government should make greater use of specific courses and programs, in conjunction with colleges and universities, to address gaps in the competencies of managers and those with the potential for management. RECOMMENDATION 19: The OPS must develop stronger recruiting programs with post-secondary institutions and create greater linkages between the existing recruitment platforms in the OPS and post-secondary programs that feed into key management areas.
Inclusiveness of Management.
RECOMMENDATION 20: The Ontario Government needs to create much better data on its employees and their movements into, within and out of the Ontario Public Service in order to support the analysis required to better understand how best to improve inclusiveness in and across the Government including the management group. We applaud the recent survey of interns but we believe this is already quite a diverse group so that survey may not yield results with broader implications. A survey with anonymity of all applicants to the Ontario Public Service would be useful to determine who applies, is selected, and ultimately hired. Therefore i)Priority should be placed on increasing the response rate for the Employee Engagement Survey; and the Employee Engagement Survey could be sharpened to reveal more useful data specifically to support the goal of inclusiveness; ii) All applicants and all new hires into the OPS should be invited to complete a self-identification survey that includes demographic information that will support the goal of inclusiveness.
RECOMMENDATION 21: The Ontario Government should continue with its initiatives to eradicate discrimination in the workplace and ensure that they are adequately resourced. RECOMMENDATION 22: The Ontario Government should begin immediately to design and implement a plan that specifically addresses the risks of implicit discrimination in hiring and promotion decision-making and in performance evaluation. RECOMMENDATION 23: The Ontario Government should continue its work with the External Advisory Committee on Inclusion and Diversification to identify and assess best practices for increasing diversity that examine practices in other governments as well as in the private sector. RECOMMENDATION 24: The Ontario Government should increase the rate of external hiring at both the post-secondary education and workplace levels, as this offers the greatest chance of speeding up the process to achieving a more representative management cadre. RECOMMENDATION 25: The Ontario Government should consider to what degree the tendency to hire on contract is impeding the recruitment of indigenous and visible minority candidates and amend the hiring model accordingly, with consideration for the implications for collective agreements. RECOMMENDATION 26: The Ontario Government should continue to study recent recruiting at the non-executive and executive levels to determine whether there are explicit and/or implicit factors that are acting as impediments to inclusiveness. Better hiring protocols can then be developed from this evidence.
49
RECOMMENDATION 27: The merit principle should continue to guide recruitment and promotion throughout the Ontario Public Service. As such, quotas should not be set for representation. The focus should be on actively broadening the recruitment process and ensuring that there are no barriers to indigenous people and visible minorities being hired and promoted.
Management Recruitment and Training.
RECOMMENDATION 28: A more concerted effort to identify employees who have management potential or managers who could potentially go higher and identify and deliver the training and other supports they need. Some of this can and should be done internally. Some should be done in conjunction with colleges and universities. RECOMMENDATION 29: A program should be established along the lines of what used to be called The Accelerated Economist Program in the federal government. In Ontario’s case it would encompass all disciplines, not just economists. Only the best and brightest would be recruited to the program. They would start off with experiences in the central agencies and line Ministries working on high priority projects that offer the greatest learning opportunities and broadest perspectives. They would be tracked and supported throughout their careers with the aspiration that they would be ready for management earlier than under a traditional model.
Longer-term Considerations.
RECOMMENDATION 30: Establishment of a permanent standing body to make recommendations to the President of the Treasury Board on OPS management and compensation issues. It could be similar in structure and reporting to the federal government’s Advisory Committee on Senior Level Retention and Compensation.23 The body:
i. Should include representation from across sectors and backgrounds.
ii. Should include among its members persons with expertise in employment relations and compensation.
iii. Could make recommendations on the most appropriate “market adjustment” that would change all managers compensation in line with what is happening in comparator groups.
iv. Could examine the implications of any “market adjustments” and other factors on the gap in compensation between managers and employees in bargaining units.
v. Could look at special cases that might require changes in compensation. vi. Could respond to special requests from the President of the Treasury Board.
23 In terms of reporting it might follow the pre-2012 regime as the group does not seem to have been very active since then.
50
RECOMMENDATION 31: The PSC, as part of its mandate should ensure enterprise-wide focus on strategies and actions, including coordination of initiatives, to reduce discrimination and to achieve a management in the Ontario Public Service that is much more representative of the Ontario population. The committee should include senior management and members with expertise in employment relations and human resources, including workplace discrimination and equity.
RECOMMENDATION 32: Treasury Board Secretariat should work to establish a comprehensive Workforce Information System (WIS) that among other things keeps more complete records on movements into, within and out of the management group, key demographic characteristics of new hires, results of exit surveys, survey results of new hires, and information about employee engagement. The establishment of the WIS should be done with a view to permitting evidence-based analysis that will be used in understanding workforce dynamics (e.g., hiring and exits), and to support strategic planning and objectives (e.g., meeting diversity objectives). People trained in human resources issues should be responsible for the WIS.