report for the first quarter of 2021 - ccb
TRANSCRIPT
1
REPORT FOR THE FIRST
QUARTER OF 2021
Hong Kong Exchanges and Clearing Limited and The Stock Exchange of Hong Kong Limited take no
responsibility for the contents of this document, make no representation as to its accuracy or completeness
and expressly disclaim any liability whatsoever for any loss howsoever arising from or in reliance upon
the whole or any part of the contents of this document.
中國建設銀行股份有限公司
CHINA CONSTRUCTION BANK CORPORATION
(A joint stock company incorporated in the People’s Republic of China with limited liability)
Stock Code: 939 (Ordinary H-share)
REPORT FOR THE FIRST QUARTER OF 2021
The board of directors (the “Board”) of China Construction Bank Corporation (the
“Bank”) is pleased to announce the unaudited consolidated results of the Bank and
its subsidiaries (collectively the “Group”) for the period ended 31 March 2021,
prepared under the International Financial Reporting Standards (IFRS). This
announcement is made in accordance with Part XIVA of the Securities and Futures
Ordinance (Chapter 571 of the Laws of Hong Kong) and Rule 13.09 of the Rules
Governing the Listing of Securities on The Stock Exchange of Hong Kong Limited.

2
REPORT FOR THE FIRST
QUARTER OF 2021
1 IMPORTANT NOTICE
1.1 The Board, the board of supervisors, directors, supervisors and senior
management of the Bank warrant that the information in this quarterly report is
truthful, accurate and complete and contains no false representations or misleading
statements, or material omissions, and they assume severally and jointly legal
liability.
1.2 This quarterly report has been reviewed and approved at the Board meeting of
the Bank held on 28 April 2021. All 15 directors of the Bank attended the meeting.
1.3 The financial statements in this quarterly report have not been audited.
1.4 Mr. Wang Jiang, vice chairman, executive director and president of the Bank, Mr.
Kenneth Patrick Chung and Mr. Carl Walter, independent non-executive directors
of the Bank, hereby warrant the truthfulness, accuracy and completeness of the
financial statements in this quarterly report.
2 CORPORATE PROFILE
2.1 Corporate information
Listing stock exchange,
stock abbreviation and
stock code
A-share: Shanghai Stock Exchange
Stock abbreviation: 建设银行
Stock code: 601939
H-share:
The Stock Exchange of Hong
Kong Limited
Stock abbreviation: CCB
Stock code: 939
Domestic preference
share:
Shanghai Stock Exchange
Stock abbreviation: 建行優 1
Stock code: 360030
Secretary to the Board Hu Changmiao
Company secretary Ma Chan Chi
Customer service and
complaints hotline 95533
Contact information for
investors
Telephone: 86-10-66215533
Facsimile: 86-10-66218888
E-mail: [email protected]

3
REPORT FOR THE FIRST
QUARTER OF 2021
2.2 Major financial information prepared under IFRS
The financial information set forth in this quarterly report is the consolidated results
of the Group prepared under IFRS and expressed in RMB unless otherwise stated.
(In millions of RMB unless otherwise stated) 31 March
2021
31 December
2020 Change (%)
Total assets 29,378,083 28,132,254 4.43
Total equity attributable to equity shareholders
of the Bank 2,444,774 2,364,808 3.38
Net assets per share attributable to ordinary
shareholders of the Bank (in RMB) 9.38 9.06 3.53
(In millions of RMB unless otherwise stated)
Three months
ended 31
March 2021
Three months
ended 31
March 2020 Change (%)
Operating income 195,350 186,405 4.80
Net profit 83,020 80,981 2.52
Net profit attributable to equity shareholders of
the Bank 83,115 80,855 2.80
Net cash from operating activities 253,365 495,018 (48.82)
Basic and diluted earnings per share (in RMB) 0.33 0.32 3.13
Annualised return on average equity (%) 14.42 15.09
down 0.67
percentage
points
2.3 Differences between the financial statements prepared under PRC GAAP and
those prepared under IFRS
There is no difference in the net profit for the three months ended 31 March 2021 or
total equity as at 31 March 2021 between the Group’s consolidated financial
statements prepared under PRC GAAP and those prepared under IFRS.
2.4 Number of ordinary shareholders and particulars of shareholding as at 31 March
2021
2.4.1 As at 31 March 2021, the Bank had 338,226 ordinary shareholders, including
40,581 H-share holders and 297,645 A-share holders.

4
REPORT FOR THE FIRST
QUARTER OF 2021
2.4.2 Particulars of shareholding of top ten ordinary shareholders
Unit: share
Particulars of shareholding of top ten ordinary shareholders (based on the register of members as at 31 March 2021 and
confirmation of shareholders)
Name of ordinary
shareholder
Nature of
shareholder
Shareholding
percentage
(%)
Change
during the
reporting
period
Total number of
shares held
Number of
shares
pledged
or frozen
Central Huijin
Investment Ltd. 1 State 57.03 - 142,590,494,651 (H-shares) None
0.08 - 195,941,976 (A-shares) None
HKSCC Nominees
Limited 1, 2 Foreign legal
person 37.55 +9,391,712 93,872,575,874 (H-shares) Unknown
China Securities
Finance Corporation
Limited State-owned
legal person 0.88 -96 2,189,259,672 (A-shares) None State Grid Corporation
of China 2, 3 State-owned
legal person 0.64 - 1,611,413,730 (H-shares) None Reca Investment
Limited Foreign legal
person 0.34 - 856,000,000 (H-shares) None China Yangtze Power
Co., Limited 2 State-owned
legal person 0.26 - 648,993,000 (H-shares) None Hong Kong Securities
Clearing Company
Ltd. 1
Foreign legal
person 0.25 +136,356,437 631,867,198 (A-shares) None
Central Huijin Asset
Management Ltd. 1 State-owned
legal person 0.20 - 496,639,800 (A-shares) None China Baowu Steel
Group Corporation
Limited 2
State-owned
legal person 0.13 - 335,000,000 (H-shares) None
Taiping Life Insurance
Co., Ltd.-Traditional
-Ordinary insurance
product-022L-CT001SH Others 0.07 - 168,783,482 (A-shares) None
1. Central Huijin Asset Management Ltd. is a wholly-owned subsidiary of Central Huijin Investment Ltd. HKSCC Nominees Limited is a wholly-owned subsidiary of Hong Kong Securities Clearing Company Ltd. Apart from these, the Bank is not aware of any connected relation or concerted action
among the aforesaid shareholders.
2. As at 31 March 2021, State Grid Corporation of China, China Yangtze Power Co., Limited and China Baowu Steel Group Corporation Limited held
1,611,413,730 H-shares, 648,993,000 H-shares and 335,000,000 H-shares of the Bank respectively, all of which were held under the name of HKSCC
Nominees Limited. Save for the aforesaid H-shares held by State Grid Corporation of China, China Yangtze Power Co., Limited and China Baowu
Steel Group Corporation Limited, 93,872,575,874 H-shares were held under the name of HKSCC Nominees Limited, which also included the H-shares
held by Temasek Holdings (Private) Limited.
3. As at 31 March 2021, the holding of H-shares of the Bank by State Grid Corporation of China through its subsidiaries was as follows: State Grid International Development Co., Ltd. held 296,131,000 shares, and State Grid International Development Limited held 1,315,282,730 shares.
4. None of the shares held by the aforesaid shareholders were subject to selling restrictions.

5
REPORT FOR THE FIRST
QUARTER OF 2021
2.5 Number of preference shareholders and particulars of shareholding as at 31
March 2021
2.5.1 As at 31 March 2021, the Bank had 21 preference shareholders, all of which
were domestic preference shareholders.
2.5.2 Particulars of shareholding of top ten (including ties) domestic preference
shareholders
Unit: share
Name of preference shareholder
Nature of
shareholder
Shareholding
percentage
(%)
Changes
during the
reporting
period
Total
number of
shares held
Number of
shares
pledged or
frozen
Bosera Asset Management Co., Limited Others 17.19 -26,180,000 103,140,000 None
Shanghai Branch of Bank of China
Limited Others 15.00 - 90,000,000 None
China International Capital Corporation
Limited Others 12.98 +26,180,000 77,860,000 None
China Life Insurance Company Limited Others 8.33 - 50,000,000 None
China Mobile Communications Group Co.,
Ltd.
State-owned
legal person 8.33 - 50,000,000 None
Truvalue Asset Management Co., Limited Others 6.67 - 40,000,000 None
China CITIC Bank Corporation Limited Others 4.64 - 27,850,000 None
GF Securities Asset Management
(Guangdong) Co., Ltd. Others 4.50 - 27,000,000 None
Postal Savings Bank of China Co., Ltd. Others 4.50 - 27,000,000 None
AXA SPDB Investment Managers Co.,
Ltd. Others 3.33 - 20,000,000 None
PICC Asset Management Company
Limited Others 3.33 - 20,000,000 None
1. Particulars of shareholding of the preference shareholders were based on the information in the Bank’s register of preference shareholders.
2. The Bank is not aware of any connected relation or concerted action among the aforesaid preference shareholders, or between the aforesaid preference
shareholders and the top ten ordinary shareholders.
3. “Shareholding percentage” refers to the percentage of domestic preference shares held by the preference shareholder in the total number of domestic
preference shares.
2.5.3 During the reporting period, there was no restoration of voting rights of the
Bank’s preference shares, nor was there distribution of dividend for preference
shares.

6
REPORT FOR THE FIRST
QUARTER OF 2021
3 HIGHLIGHTS OF OPERATING RESULTS
3.1 Analysis of items in the statement of financial position
As at 31 March 2021, the Group’s total assets were RMB29,378,083 million, an
increase of RMB1,245,829 million or 4.43% over the end of last year. The Group’s
total liabilities were RMB26,908,834 million, an increase of RMB1,165,933 million
or 4.53% over the end of last year.
The Group actively implemented the New Finance initiative, continuously improved
the long-term mechanism for green finance development, and further advanced the
“Three Major Strategies” for house rental, inclusive finance, and FinTech, fully
embarking on a new journey of high-quality development on all fronts. By the end
of the first quarter of 2021, the comprehensive housing rental service platform had
been launched in 328 cities at prefecture-level and above across the country, with
33.62 million registered real-name users on a cumulative basis. The Bank’s inclusive
finance loans totalled RMB1,576,030 million, an increase of RMB152,292 million
over the end of 2020, and the number of inclusive finance loan borrowers increased
by 72,400 over the end of 2020 to 1,768,000. The Bank further embedded the
FinTech strategy in areas such as business support, building of middle platform of
technology and independent innovation, fully empowering the digitalised operation.
Gross loans and advances to customers were RMB17,671,317 million, an increase
of RMB883,885 million or 5.27% over the end of last year. Specifically, corporate
loans, personal loans, discounted bills and accrued interest amounted to
RMB10,012,416 million, RMB7,454,383 million, RMB159,972 million and
RMB44,546 million, respectively.
Financial investments were RMB7,071,599 million, an increase of RMB120,946
million or 1.74% over the end of last year.
Deposits from customers were RMB22,129,890 million, an increase of
RMB1,514,914 million or 7.35% over the end of last year. Specifically, time deposits
and demand deposits of the Group were RMB10,210,245 million and
RMB11,630,447 million respectively; corporate deposits and personal deposits of
the Group were RMB10,447,378 million and RMB11,393,314 million respectively;
accrued interest was RMB289,198 million.
The non-performing loans increased by RMB13,524 million to RMB274,253
million over the end of last year based on the five-category loan classification
standard. The non-performing loan ratio was 1.56%, staying flat over the end of last
year. The ratio of allowances to non-performing loans was 214.94%, up 1.35
percentage points from the end of last year.
Total equity was RMB2,469,249 million, an increase of RMB79,896 million or 3.34%
over the end of last year. Specifically, total equity attributable to equity shareholders
of the Bank was RMB2,444,774 million, an increase of RMB79,966 million or 3.38%
over the end of last year.

7
REPORT FOR THE FIRST
QUARTER OF 2021
As at 31 March 2021, considering relevant rules for the transitional period, the
Group’s total capital ratio, Tier 1 ratio and Common Equity Tier 1 ratio, which were
calculated in accordance with the Capital Rules for Commercial Banks (Provisional),
were 16.71%, 14.01% and 13.43%, respectively, all in compliance with the
regulatory requirements.
In July 2020, the regulators announced the extension of the transition period to the
end of 2021 for the Guiding Opinions on Regulating the Asset Management Business
of Financial Institutions. Banks were encouraged to orderly dispose of legacy assets
of wealth management business by various approaches, such as issuance of new
products, market-based transfers, contract modifications and asset undertaking. The
Bank pressed ahead with tasks such as the issuance of net-asset-value type wealth
management products, asset standardisation, and legacy assets disposals in a
pragmatic, efficient, active and orderly manner in accordance with regulatory
requirements, assessed and recognised the impact of rectification on provisions and
credit impairment losses in the financial statements and strived to achieve the
smooth transition and steady development of wealth management business.
3.2 Analysis of items in the statement of comprehensive income
For the three months ended 31 March 2021, the Group’s net profit was RMB83,020
million and net profit attributable to equity shareholders of the Bank was
RMB83,115 million, up 2.52% and 2.80% respectively over the same period last
year. Annualised return on average assets was 1.15%, and annualised return on
average equity was 14.42%.
Net interest income was RMB147,148 million, up 4.27% over the same period last
year. Net interest spread was 1.96% and net interest margin was 2.13%, down 0.14
and 0.13 percentage points respectively from the same period last year, mainly due
to the steady progress of interest rate liberalisation, changes in product structure, and
fierce competition for deposits.
Net fee and commission income was RMB41,079 million, up 8.82% over the same
period last year. This was mainly due to the rapid growth of fee income from
products including agency services, trust and fiduciary activities.
Operating expenses were RMB42,649 million, an increase of RMB3,762 million
from the same period last year. Cost-to-income ratio increased to 21.08% by 0.92
percentage points from the same period last year.
Impairment losses were RMB52,263 million, an increase of RMB3,096 million over
the same period last year. Specifically, credit impairment losses were RMB52,284
million, up 6.44% over the same period last year.
Income tax expense was RMB17,300 million, a decrease of RMB89 million from
the same period last year. The effective income tax rate was 17.24%.
8
REPORT FOR THE FIRST
QUARTER OF 2021
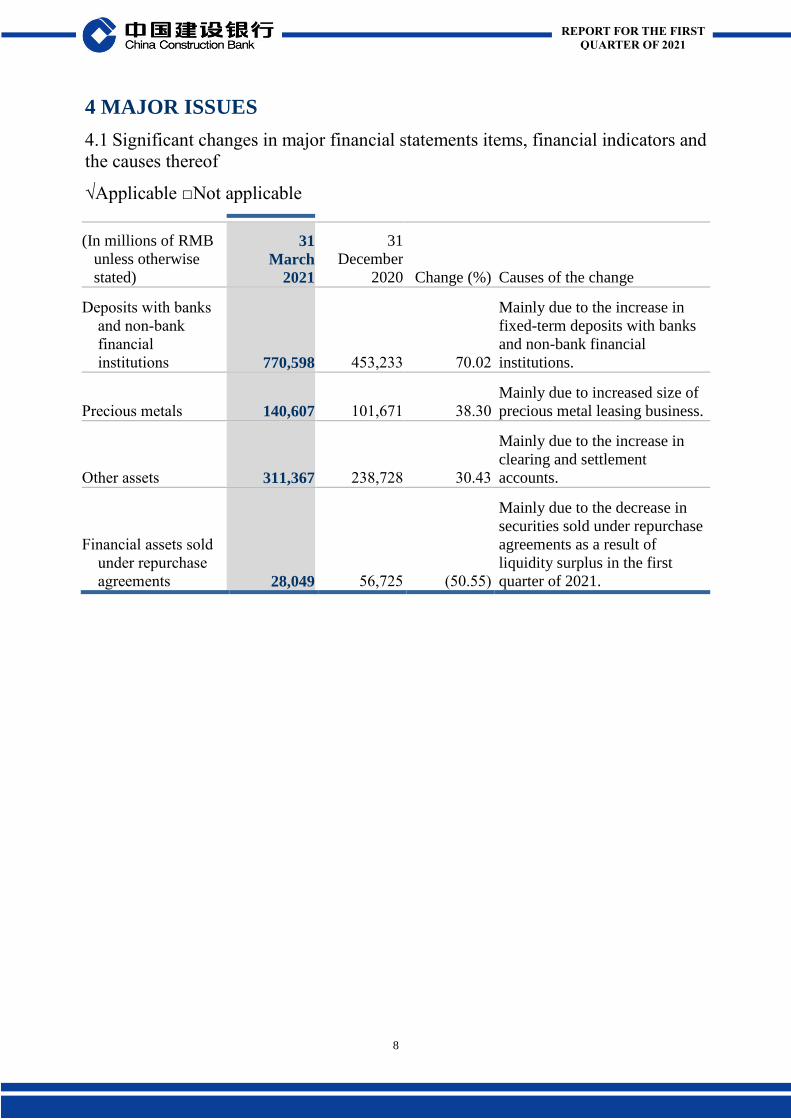
4 MAJOR ISSUES
4.1 Significant changes in major financial statements items, financial indicators and
the causes thereof
√Applicable □Not applicable
(In millions of RMB
unless otherwise
stated)
31
March
2021
31
December
2020 Change (%) Causes of the change
Deposits with banks
and non-bank
financial
institutions 770,598 453,233 70.02
Mainly due to the increase in
fixed-term deposits with banks
and non-bank financial
institutions.
Precious metals 140,607 101,671 38.30
Mainly due to increased size of
precious metal leasing business.
Other assets 311,367 238,728 30.43
Mainly due to the increase in
clearing and settlement
accounts.
Financial assets sold
under repurchase
agreements 28,049 56,725 (50.55)
Mainly due to the decrease in
securities sold under repurchase
agreements as a result of
liquidity surplus in the first
quarter of 2021.

9
REPORT FOR THE FIRST
QUARTER OF 2021
(In millions of RMB
unless otherwise
stated)
Three
months
ended 31
March 2021
Three
months
ended 31
March 2020 Change (%) Causes of the change
Net trading gain 1,555 2,762 (43.70)
Mainly due to decreased
gains on trading bonds as a
result of fluctuations of bond
yields and the decline in the
size of trading bonds.
Dividend income 369 137 169.34
Mainly due to increased
dividend income of
subsidiaries from their equity
investments.
Net gain arising from
investment
securities 2,280 1,716 32.87
Mainly due to the increase in
equity investment income
amid fluctuations of the stock
market, offsetting by the
increase in interest expenses
as a result of increased size of
structured deposits.
Net gain on
derecognition of
financial assets
measured at
amortised cost 1,113 362 207.46
Mainly due to the significant
increase in the size of asset
securitisations issued during
the reporting period, as well
as the small decline in
issuance rate.
Share of
(losses)/profits of
associates and
joint ventures (118) 19 (721.05)
Mainly due to decreased
income from investments in
associates and joint ventures
by subsidiaries.
Net profit
attributable to
non-controlling
interests (95) 126 (175.40)
Mainly due to decreased net
profit from non-wholly-
owned subsidiaries over the
same period last year.

10
REPORT FOR THE FIRST
QUARTER OF 2021
4.2 Progress of major issues, related impacts and solutions
√Applicable □Not applicable
The Bank simultaneously issued multi-currency ESG-themed bonds overseas on 15
April 2021, including 3-year and 5-year dual tranche sustainability-linked bonds of
US$1.15 billion, a 3-year green bond of EUR800 million, and a 2-year offshore
transition bond of RMB2 billion. The USD bond, which was listed simultaneously
in Hong Kong and Dubai exchanges, was the first sustainability-linked USD bond
issued by a financial institution; the EUR bond, which was listed simultaneously in
Hong Kong, Luxembourg and London exchanges, was the first offshore “water area
protection” themed green bond issued by a Chinese-funded institution; the offshore
RMB bond, which was listed simultaneously in Hong Kong and Singapore
exchanges, was the largest offshore RMB transition bond.
With the approvals from China Banking and Insurance Regulatory Commission and
the People’s Bank of China, the Bank issued in the domestic market a 3-year special
financial bond for small and micro business loans with a fixed interest rate of 3.30%
and a total face value of RMB20.00 billion in January 2021. The funds raised were
specifically used to grant small and micro business loans. Please refer to the
announcement published by the Bank on 27 January 2021 for details.
4.3 Unfulfilled undertakings overdue in the reporting period
□Applicable √Not applicable
4.4 Implementation of cash dividend policy during the reporting period
□Applicable √Not applicable
4.5 Alerts and explanations of any forecasted loss or significant changes compared
to the same period last year in accumulated net profit for the period from the
beginning of the year to the end of the next reporting period
□Applicable √Not applicable
4.6 Changes in accounting policies
□Applicable √Not applicable

11
REPORT FOR THE FIRST
QUARTER OF 2021
5 RELEASE OF QUARTERLY REPORT
This quarterly report will be published on the “HKEXnews” website of Hong Kong
Exchanges and Clearing Limited (www.hkexnews.hk) and the website of the Bank
(www.ccb.com) at the same time. The quarterly report prepared under PRC GAAP
will also be published on the websites of the Shanghai Stock Exchange
(www.sse.com.cn) and the Bank (www.ccb.com) at the same time.
By order of the Board
China Construction Bank Corporation
Wang Jiang Vice chairman, executive director and president
28 April 2021
As of the date of this announcement, the executive directors of the Bank are Mr. Tian
Guoli, Mr. Wang Jiang and Mr. Lyu Jiajin; the non-executive directors of the Bank
are Mr. Xu Jiandong, Mr. Zhang Qi, Mr. Tian Bo, Mr. Xia Yang, Ms. Shao Min and
Ms. Liu Fang; and the independent non-executive directors of the Bank are Ms.
Anita Fung Yuen Mei, Sir Malcolm Christopher McCarthy, Mr. Carl Walter, Mr.
Kenneth Patrick Chung, Mr. Graeme Wheeler and Mr. Michel Madelain.

APPENDIX I: FINANCIAL STATEMENTS PREPARED IN ACCORDANCE WITH
INTERNATIONAL FINANCIAL REPORTING STANDARDS
China Construction Bank Corporation
Consolidated statement of comprehensive income
For the three months ended 31 March 2021
(Expressed in millions of RMB, unless otherwise stated)
12
REPORT FOR THE FIRST
QUARTER OF 2021
Three months ended 31 March
2021 2020
(Unaudited) (Unaudited)
Interest income 255,239 240,873
Interest expense (108,091) (99,746)
Net interest income 147,148 141,127
Fee and commission income 45,545 41,212
Fee and commission expense (4,466) (3,464)
Net fee and commission income 41,079 37,748
Net trading gain 1,555 2,762
Dividend income 369 137
Net gain arising from investment securities 2,280 1,716
Net gain on derecognition of financial assets
measured at amortised cost 1,113 362
Other operating income, net:
- Other operating income 23,418 25,784
- Other operating expense (21,612) (23,231)
Other operating income, net 1,806 2,553
Operating income 195,350 186,405
Operating expenses (42,649) (38,887)
152,701 147,518
Credit impairment losses (52,284) (49,120)
Other impairment losses 21 (47)
Share of (losses)/profits of associates and joint ventures (118) 19
Profit before tax 100,320 98,370
Income tax expense (17,300) (17,389)
Net profit 83,020 80,981

China Construction Bank Corporation
Consolidated statement of comprehensive income (continued)
For the three months ended 31 March 2021
(Expressed in millions of RMB, unless otherwise stated)
13
REPORT FOR THE FIRST
QUARTER OF 2021
Three months ended 31 March
2021 2020
(Unaudited) (Unaudited)
Other comprehensive income:
(1) Other comprehensive income that will not be
reclassified to profit or loss
Fair value changes of equity instruments designated as
measured at fair value through other comprehensive
income (112) (392)
Others 5 -
Subtotal (107) (392)
(2) Other comprehensive income that may be
reclassified subsequently to profit or loss
Fair value changes of debt instruments measured at fair
value through other comprehensive income (1,665) 20,293
Allowances for credit losses of debt instruments measured
at fair value through other comprehensive income (146) 285
Reclassification adjustments included in profit or loss due
to disposals (181) (183)
Net gain/(loss) on cash flow hedges 230 (264)
Exchange difference on translating foreign operations (1,255) (855)
Subtotal (3,017) 19,276
Other comprehensive income for the period, net of tax (3,124) 18,884
(189)

China Construction Bank Corporation
Consolidated statement of comprehensive income (continued)
For the three months ended 31 March 2021
(Expressed in millions of RMB, unless otherwise stated)
14
REPORT FOR THE FIRST
QUARTER OF 2021
Three months ended 31 March
2021 2020
(Unaudited) (Unaudited)
Total comprehensive income for the period 79,896 99,865
Net profit attributable to:
Equity shareholders of the Bank 83,115 80,855
Non-controlling interests (95) 126
83,020 80,981
Total comprehensive income attributable to:
Equity shareholders of the Bank 79,966 99,790
Non-controlling interests (70) 75
79,896 99,865
Basic and diluted earnings per share
(in RMB Yuan) 0.33 0.32

China Construction Bank Corporation
Consolidated statement of financial position
As at 31 March 2021
(Expressed in millions of RMB, unless otherwise stated)
15
REPORT FOR THE FIRST
QUARTER OF 2021
31 March
2021
31 December
2020
(Unaudited) (Audited)
Assets:
Cash and deposits with central banks 2,832,243 2,816,164
Deposits with banks and non-bank financial institutions 770,598 453,233
Precious metals 140,607 101,671
Placements with banks and non-bank financial institutions 320,337 368,404
Positive fair value of derivatives 68,369 69,029
Financial assets held under resale agreements 478,388 602,239
Loans and advances to customers 17,082,523 16,231,369
Financial investments
Financial assets measured at fair value through profit or loss 569,222 577,952
Financial assets measured at amortised cost 4,576,613 4,505,243
Financial assets measured at fair value through other
comprehensive income 1,925,764 1,867,458
Long-term equity investments 13,675 13,702
Fixed assets 169,729 172,505
Land use rights 13,930 14,118
Intangible assets 5,150 5,279
Goodwill 2,194 2,210
Deferred tax assets 97,374 92,950
Other assets 311,367 238,728
Total assets 29,378,083 28,132,254

China Construction Bank Corporation
Consolidated statement of financial position (continued)
As at 31 March 2021
(Expressed in millions of RMB, unless otherwise stated)
16
REPORT FOR THE FIRST
QUARTER OF 2021
31 March
2021
31 December
2020 (Unaudited) (Audited)
Liabilities:
Borrowings from central banks 766,325 781,170
Deposits from banks and non-bank financial institutions 1,575,270 1,943,634
Placements from banks and non-bank financial institutions 436,246 349,638
Financial liabilities measured at fair value through profit or loss 308,987 254,079
Negative fair value of derivatives 63,448 81,956
Financial assets sold under repurchase agreements 28,049 56,725
Deposits from customers 22,129,890 20,614,976
Accrued staff costs 31,327 35,460
Taxes payable 99,937 84,161
Provisions 57,550 54,114
Debt securities issued 920,505 940,197
Deferred tax liabilities 1,079 1,551
Other liabilities 490,221 545,240
Total liabilities 26,908,834 25,742,901

China Construction Bank Corporation
Consolidated statement of financial position (continued)
As at 31 March 2021
(Expressed in millions of RMB, unless otherwise stated)
17
REPORT FOR THE FIRST
QUARTER OF 2021
31 March
2021
31 December
2020
(Unaudited) (Audited)
Equity:
Share capital 250,011 250,011
Other equity instruments
Preference shares 59,977 59,977
Perpetual bonds 39,991 39,991
Capital reserve 134,263 134,263
Other comprehensive income 11,899 15,048
Surplus reserve 275,995 275,995
General reserve 349,783 350,228
Retained earnings 1,322,855 1,239,295
Total equity attributable to equity shareholders of the Bank 2,444,774 2,364,808
Non-controlling interests 24,475 24,545
Total equity 2,469,249 2,389,353
Total liabilities and equity 29,378,083 28,132,254
Approved and authorised for issue by the Board of Directors on 28 April 2021.
Wang Jiang Kenneth Patrick Chung Carl Walter Vice Chairman, executive
director and president Independent non-executive
director Independent non-executive
director

China Construction Bank Corporation
Consolidated statement of cash flows
For the three months ended 31 March 2021
(Expressed in millions of RMB, unless otherwise stated)
18
REPORT FOR THE FIRST
QUARTER OF 2021
Three months ended 31 March 2021 2020 (Unaudited) (Unaudited)
Cash flows from operating activities
Profit before tax 100,320 98,370
Adjustments for:
− Credit impairment losses 52,284 49,120
− Other impairment losses (21) 47
− Depreciation and amortisation 6,440 6,129
− Interest income from impaired financial assets (1,132) (729)
− Revaluation loss/(gain) on financial instruments
measured at fair value through profit or loss
452 (543)
− Share of losses/(profits) of associates and joint ventures 118 (19)
− Dividend income (369) (137)
− Unrealised foreign exchange (gain)/loss (4,273) 3,061
− Interest expense on bonds issued 4,501 1,998
− Interest income from investment securities and net
income from disposal
(54,911) (49,943)
− Net gain on disposal of fixed assets and other
long-term assets
(61) (12)
103,348 107,342

China Construction Bank Corporation
Consolidated statement of cash flows (continued)
For the three months ended 31 March 2021
(Expressed in millions of RMB, unless otherwise stated)
19
REPORT FOR THE FIRST
QUARTER OF 2021
Three months ended 31 March
2021 2020
(Unaudited) (Unaudited)
Cash flows from operating activities (continued)
Changes in operating assets:
Net (increase)/decrease in deposits with central banks and
with banks and non-bank financial institutions
(82,317) 47,847
Net (increase)/decrease in placements with banks and non-
bank financial institutions
(3,301) 45,607
Net increase in loans and advances to customers (892,630) (940,635)
Net decrease/(increase) in financial assets held under
resale agreements
123,691 (204,761)
Net decrease in financial assets held for trading purposes 5,042 26,643
Net increase in other operating assets (112,135) (96,509)
(961,650) (1,121,808)
Changes in operating liabilities:
Net (decrease)/increase in borrowings from central banks (15,728) 86,355
Net increase/(decrease) in placements from banks and non-
bank financial institutions
86,272 (22,907)
Net increase in deposits from customers and from banks and
non-bank financial institutions
1,130,203 1,612,978
Net decrease in financial assets sold under repurchase
agreements
(28,681) (88,885)
Net decrease in certificates of deposit issued (44,853) (127,069)
Income tax paid (7,502) (8,755)
Net increase in financial liabilities measured at fair value
through profit or loss 54,875 55,951
Net (decrease)/increase in other operating liabilities (62,919) 1,816
1,111,667 1,509,484
Net cash from operating activities 253,365 495,018

China Construction Bank Corporation
Consolidated statement of cash flows (continued)
For the three months ended 31 March 2021
(Expressed in millions of RMB, unless otherwise stated)
20
REPORT FOR THE FIRST
QUARTER OF 2021
Three months ended 31 March
2021 2020
(Unaudited) (Unaudited)
Cash flows from investing activities
Proceeds from sales and redemption of financial
investments 476,112 387,011
Interest and dividends received 44,326 38,621 Proceeds from disposal of fixed assets and other long-term
assets 804 562
Cash received from other investing activities - 6
Purchase of investment securities (594,256) (520,447)
Purchase of fixed assets and other long-term assets (2,174) (2,715)
Acquisition of subsidiaries, associates and joint ventures (469) (238)
Net cash used in investing activities (75,657) (97,200)
Cash flows from financing activities
Issue of bonds 26,000 1,000
Repayment of borrowings (4,070) (12,771)
Interest paid on bonds issued (1,170) (1,998)
Cash payment for other financing activities (1,709) (1,867)
Net cash from/(used in) financing activities 19,051 (15,636)

China Construction Bank Corporation
Consolidated statement of cash flows (continued)
For the three months ended 31 March 2021
(Expressed in millions of RMB, unless otherwise stated)
21
REPORT FOR THE FIRST
QUARTER OF 2021
Three months ended 31 March
2021 2020
(Unaudited) (Unaudited)
Effect of exchange rate changes on cash and cash
equivalents 793 7,109
Net increase in cash and cash equivalents 197,552 389,291
Cash and cash equivalents as at 1 January 878,931 1,052,340
Cash and cash equivalents as at 31 March 1,076,483 1,441,631
Cash flows from operating activities include:
Interest received, excluding interest income from
investment securities 196,866 183,095
Interest paid, excluding interest expense on bonds
issued (89,488) (81,000)

22
REPORT FOR THE FIRST
QUARTER OF 2021
APPENDIX 2 CAPITAL AND LIQUIDITY INFORMATION
1. Capital adequacy ratios
According to the regulatory requirements, commercial banks shall calculate and
disclose capital adequacy ratios in accordance with the Capital Rules for
Commercial Banks (Provisional). Based on the approval for the Group to implement
the advanced capital management method in 2014, the CBIRC approved the Group
to expand the implementation scope of the advanced capital management approach
in April 2020. The Group calculated the capital requirements for financial institution
credit exposures and corporate credit risk exposures that meet regulatory
requirements with the foundation internal ratings-based approach, the capital
requirements for retail credit risk exposures with the internal ratings-based approach,
the capital requirements for market risk with the internal models approach, and the
capital requirements for operational risk with the standardised approach. Pursuant to
the regulatory requirements, the Group calculates capital adequacy ratios with both
the advanced approach and other approaches for capital measurement, and complies
with the relevant requirements for capital floors.
Capital adequacy ratios calculated in accordance with the Capital Rules for
Commercial Banks (Provisional)
(In millions of RMB, except
percentages)
As at 31 March 2021 As at 31 December 2020
Group Bank Group Bank
Common Equity Tier 1 capital
after regulatory adjustments 2,342,653 2,172,075 2,261,449 2,105,934
Tier 1 capital after regulatory
adjustments 2,442,723 2,251,975 2,361,517 2,191,258
Total capital after regulatory
adjustments 2,914,010 2,724,700 2,832,681 2,649,639
Risk-weighted assets 17,440,565 16,242,670 16,604,591 15,451,991
Common Equity Tier 1 ratio (%) 13.43 13.37 13.62 13.63
Tier 1 ratio (%) 14.01 13.86 14.22 14.18
Total capital ratio (%) 16.71 16.77 17.06 17.15

23
REPORT FOR THE FIRST
QUARTER OF 2021
2. Leverage ratio
As at 31 March 2021, in accordance with the Measures for the Administration of the
Leverage Ratio of Commercial Banks (Revised), the Group’s leverage ratio was
7.92%, meeting regulatory requirements.
The Group’s leverage ratio calculated in accordance with the Measures for the
Administration of the Leverage Ratio of Commercial Banks (Revised)
(In millions of RMB, except
percentages)
As at 31
March
2021
As at 31
December
2020
As at 30
September
2020
As at 30
June
2020
Leverage ratio (%) 7.92 7.99 7.78 7.84
Tier 1 capital after regulatory
adjustments 2,442,723 2,361,517 2,312,381 2,274,724
On and off-balance sheet assets
after adjustments 30,826,197 29,548,554 29,722,025 29,023,947
3. Liquidity coverage ratio
According to the requirements of the Measures on Information Disclosure of
Liquidity Coverage Ratio of Commercial Banks, commercial banks shall disclose the
daily average liquidity coverage ratio for the quarter. In accordance with the current
applicable regulatory requirements, definitions and accounting standards, the
average daily liquidity coverage ratio of the Group for the 90 days in the first quarter
of 2021 was 148.78%, meeting regulatory requirements. The liquidity coverage ratio
dropped by 9.75 percentage points from the fourth quarter of 2020, mainly due to
the increase in net cash outflows as a result of a decrease in secured lending
(including reverse repos and securities borrowing).

24
REPORT FOR THE FIRST
QUARTER OF 2021
No. (In millions of RMB, except percentages)
Total
Unweighted
Value
Total
Weighted
Value
High-Quality Liquid Assets
1 Total High-Quality Liquid Assets (HQLA) 4,667,230
Cash Outflows
2 Retail deposits and deposits from small
business customers, of which: 10,516,937 925,941
3 Stable deposits 2,513,519 125,599
4 Less stable deposits 8,003,418 800,342
5 Unsecured wholesale funding, of which: 10,274,509 3,353,948
6
Operational deposits (excluding those
generated from correspondent banking
activates) 6,771,027 1,681,352
7 Non-operational deposits (all counterparties) 3,399,408 1,568,522
8 Unsecured debt 104,074 104,074
9 Secured funding 163
10 Additional requirements, of which: 1,801,679 243,161
11 Outflows related to derivative exposures
and other collateral requirements 76,141 76,141
12 Outflows related to loss of funding on
secured debt products 4,582 4,582
13 Credit and liquidity facilities 1,720,956 162,438
14 Other contractual funding obligations 2 -
15 Other contingent funding obligations 3,597,929 438,049
16 Total Cash Outflows 4,961,262
Cash Inflows
17 Secured lending (including reverse repos and
securities borrowing) 653,144 652,100
18 Inflow from fully performing exposures 1,706,074 1,081,097
19 Other cash inflows 77,615 76,207
20 Total Cash Inflows 2,436,833 1,809,404
Total Adjusted Value
21 Total HQLA 4,667,230
22 Total Net Cash Outflows 3,151,858
23 Liquidity Coverage Ratio (%) 1 148.78
1. The daily averages for the quarter above represent simple arithmetic means of the values for 90 calendar days in the latest
quarter, calculated in accordance with the current applicable regulatory requirements, definitions and accounting standards.