report - effect of fatigue due to repetitive work
DESCRIPTION
Fatigue is a major safety concern in many fields, but especially in transportation and manufacturing because fatigue can result in disastrous accidents. Fatigue is considered an internal precondition for unsafe acts because it negatively affects the human operator's internal state. Fatigue Research has generally focused on pilots, truck drivers, and shift workers. This study therefore attempts to quantify the effects of fatigue on repetitive activities in the manufacturing field by using human factors approach to analyze both mental and physical load.TRANSCRIPT

Page 1 of 27
The Effects of Continuous Repetitive Work on the Quality and Efficiency of the Manufacturing
Process
Introduction
Manufacturing is the production of merchandise for use or sale using labor and machines, tools,
chemical and biological processing, or formulation. The term may refer to a range of human activity,
from handicraft to high tech, but is most commonly applied to industrial production, in which raw
materials are transformed into finished goods on a large scale. Such finished goods may be used for
manufacturing other, more complex products, such as aircraft, household appliances or automobiles, or
sold to wholesalers, who in turn sell them to retailers, who then sell them to end users – the "consumers".
The United States is the world's second largest manufacturer, with a 2010 industrial output of
approximately $1,696.7 billion. In 2008, its manufacturing output was greater than that of the
manufacturing output of China and India combined, despite manufacturing being a very small portion of
the entire U.S economy, as compared to most other countries.
The manufacturing sector is closely connected with engineering and industrial design. In its
earliest form, manufacturing was usually carried out by a single skilled artisan with assistants, however
today it is usually a much larger process and is carried out by a multitude of people with skills in various
aspects of engineering. Manufacturing supports an estimated 17.6 million jobs in the United States or
about one in six private-sector jobs. More than 12 million Americans (or 9 percent of the workforce) are
employed directly in manufacturing. Manufacturing industries are complex organizations that require a
lot of human-machine interactions. Hence, human errors that come from the mishandling defective
products and machine failures can become dreadfully prevalent in manufacturing industries. Many of the
work environments that workers have to deal with are noisy, stressful and may include repetitive tasks.
An organization that does not have an ergonomic system or process may have allowed a gap to
exist between the worker's characteristics and the functional requirements of their job. Ergonomics is
undoubtedly an important social and technological proponent for people to improve their quality of work,
work satisfaction and safety. In short, there have been many studies on human error. However, these

Page 2 of 27
studies are not fundamentally correlated to any particular factor. Therefore, it is crucial for researchers to
highlight the effects of several factors on human error in the manufacturing industry. The factors that
possibly affect human error may include stress, repetition, fatigue and work environment.
Fatigue is a major safety concern in many fields, but especially in transportation and
manufacturing because fatigue can result in disastrous accidents. Fatigue is considered an internal
precondition for unsafe acts because it negatively affects the human operator's internal state. Fatigue
Research has generally focused on pilots, truck drivers, and shift workers. This study therefore attempts to
quantify the effects of fatigue on repetitive activities in the manufacturing field by using human factors
approach to analyze both mental and physical load.
Scope
Due to repetitive work, we believe, that fatigue sets in. This may lead to reduction in speed of the
work being done and thus efficiency decreases. Also, repetitive work in wrong posture or ergonomically
unbeneficial workstations not only leads to higher levels of fatigue but health problems like
musculoskeletal disorders. To do the same task day in and day out can lead to reduction in concentration
and over confidence which may affect the quality of a product. In scenarios involving manufacturing of
critical components, like pressure gauges in aircrafts, this lack of quality control can have disastrous
effects, even loss of lives. Also, the fatigue and loss of concentration can lead to safety issues of the
worker itself in scenarios involving use of hazardous equipment, like welding machines.
The scope of this project is to study the effects of fatigue caused by repetitive work on quality of
product and efficiency of worker.
Objective
To analyze the effect of continuous repetitive work on the quality of work and efficiency of
manufacturing process. Testify the effectiveness of proposed solutions.

Page 3 of 27
Literature Review
Much work has been conducted in the field of minimizing fatigue. Gershon et al [1] tested two
methods in reducing fatigue experienced by vehicle drivers. The methods tested were the effectiveness of
energy drinks and dexterity activity as fatigue counter measures. They concluded that drinking energy
drinks had a positive effect on counteracting fatigue. Thus, for our experiment participants in the control
group were asked not to consume energy drinks and drinks with caffeine. Gershon et al [2] further
elaborated by conducting a survey on professional and nonprofessional drivers and observed the most
effective fatigue coping behaviors. Some noteworthy techniques included listening to the radio and
talking, so using that information we chose not to engage the participant in conversation once the
experiment had begun (except to initiate breaks). Dadi G. B et al [3] studied the effects of information
presentation and how it relates to mental workload. They concluded that while there was no significant
mental load difference between using 2D drawings, 3D CAD drawings and 3D printed models, the most
effective way of conveying this information was through training. They also concluded that 3D models
are a better learning tool than either 2D drawings or CAD drawings. As a result for the experiment, the
training phase that the participant undergoes has an instructional process that involves a 3d model as a
learning tool. Saito K [4] remarked that fatigue manifests itself in various forms and cannot be measured
or indicated by a single test or a change of only one function. It is therefore important in the assessment of
fatigue that one should not only make physiological and psychological measurements, but also relate the
findings to various factors which influence fatigue. In conclusion, fatigue should be evaluated by a
multidisciplinary approach rather than simply measured. Many tools have been used in the past to
measure fatigue, some more effective than others, for instance Hosokawa et al [5] studied the effect of
room illumination and other conditions on the portable fatigue meter, by employing it in several different
fatigue measuring experiments. The results suggested that the portable fatigue meter did have a
significant age bias in measurement. Fatigue is assumed to increase with work time as a study conducted
by Kakizaki and Kurimori [6] , which studied the changes in mental workload and fatigue during a one
day transcribing task and concluded that mental workload becomes heavier and subjective feeling of
fatigue increases as the working hours become longer . Most occupational tasks involve some level of
mental/cognitive processing in addition to physical work. Mehta and Agnew [7] conducted a study to
quantify the interactive effects of physical and mental workload on muscle endurance. Changes in
muscular capacity were determined by measuring EMG and heart rate among other parameters. The study
conclusively showed that physical capacity is adversely affected by mental workload. Higher levels of

Page 4 of 27
mental workload have detrimental effects to the subject’s performance, increasing human error and injury
and reducing work efficiency. Fatigue, regardless how high or low, does show noticeable effects to a
subjects work performance. To this end, Barker and Maury [8] examined the effects of multiple
dimensions (both high and low types) of fatigue simultaneously on the human body. They concluded that
higher physical fatigue adversely affected measures of physical and mental performance, whereas higher
mental fatigue had a positive effect on one measure of mental performance. Overall, these results suggest
causal effects between manipulated levels of mental and physical fatigue and task-induced changes in
mental and physical performance. A paper by Mehta and Agnew [9] shows that fatigue has an undeniable
relationship with repetitive work. The study examined the effect of repetitive work on shoulder fatigue
and how they related to both mental and physical demands. The literature collected provided key insight
into the relationship between fatigue, mental and physical workloads, as well as fatigue measurement
techniques, the trend’s in measurement, etc. vital to carrying out our experiment. It was also found that, in
continuous repetitive work, both physical and mental fatigues have negative effects on the worker’s
production rate. The more tired you are, the less efficient you are at work. By scheduling shift duration
and rearranging the breaks properly, worker’s fatigue and stress level can be reduced. As what human
factors engineering emphasizes on, designing a scientific schedule helps increase the efficiency of worker
in repetitive works.
Tecnomatix, a software by Siemens, allows ergonomic analysis and also the creation and modification
virtual environment. It also allows the dimensioning and positioning the biomechanical model of human
and creation of work operation simulations. For analysis and evaluation of workload in virtual
environment, we can use a few tools like: Fatigue Analysis, Force Solver, Lower Back Analysis, Manual
Handling Limits, NIOSH etc. Using this software, we can realize the corrective measures in virtual
environment and their results can be followed in real time while changing the basic parameters.
Case Study
The study took place in an industry in India, which does the work of machining and
manufacturing of spare parts for industries. These parts are huge in terms of size and weight. The work is
done according to the customer specifications. Raw material is converted into finished product or semi-
finished product.

Page 5 of 27
For part in consideration, an axle wheel, the machining process requires two workers. Once the
raw material is received it is loaded on to the large lathe machines to be machined. It takes about 48 hours
to manufacture a single product with 2 workers working in shifts. The workers have to work in 12 hour
shifts and get single 1 hour break and single 15 minutes break during this shift.
Machining on the lathe includes the following processes -
1. Loading the raw material with the help of the crane – 1 hour
2. Aligning the raw material - 0.5 hour
3. Ready the tool according to the job - 1 hour
4. Machining the raw material which will take up to 40 hours (includes 3hr break, 6hr machine idle time, second tool to be made ready 1hr)
5. Unloading - 0.2hours.
After this the product goes for Drilling, then Clearance fit which involves heating the part and a
lot of precision work and finally finishing operations are done.
The working environment is in a large shed with concrete flooring and walls, work goes on the
floor with no platform. The shed is made up of steel sheets with proper ventilation. This process involves
is a lot of repetitive work happening continuously for a long time. The product needs to be manufactured
with a quality of 15% error on the tolerance or it has to be reworked. For example, if the product is
obtained with error on diameter of up to 0.1 – 0.2mm then this product requires rework to be done.
Finishing required would be triple delta finish, and if there is any error then rework needed again. This
leads to increase in mental load. Physical load on workers is also high due to the nature of work involved.
Proficiency of the workers in this industry:
1. Semiskilled labor with 2-3 years of experience. These workers get no training
2. Skilled labor with about 8 years of experience and theoretically require no training.
3. Unskilled labor with no more than a year of experience, and hence trained for about 3 months.
The unit is just 2.5 years old and has various products. However, due to the processes involved, we identified this as a situation where, in a few years, quality and efficiency will be major issues as a result of fatigue due to repetitive work.
Experiment Design and Implementation
Permission for conducting experiment in the factory was not achieved. It was also not in our scope to conduct an experiment involving the actual manufacturing process in college due to availability of skilled
Page 6 of 27
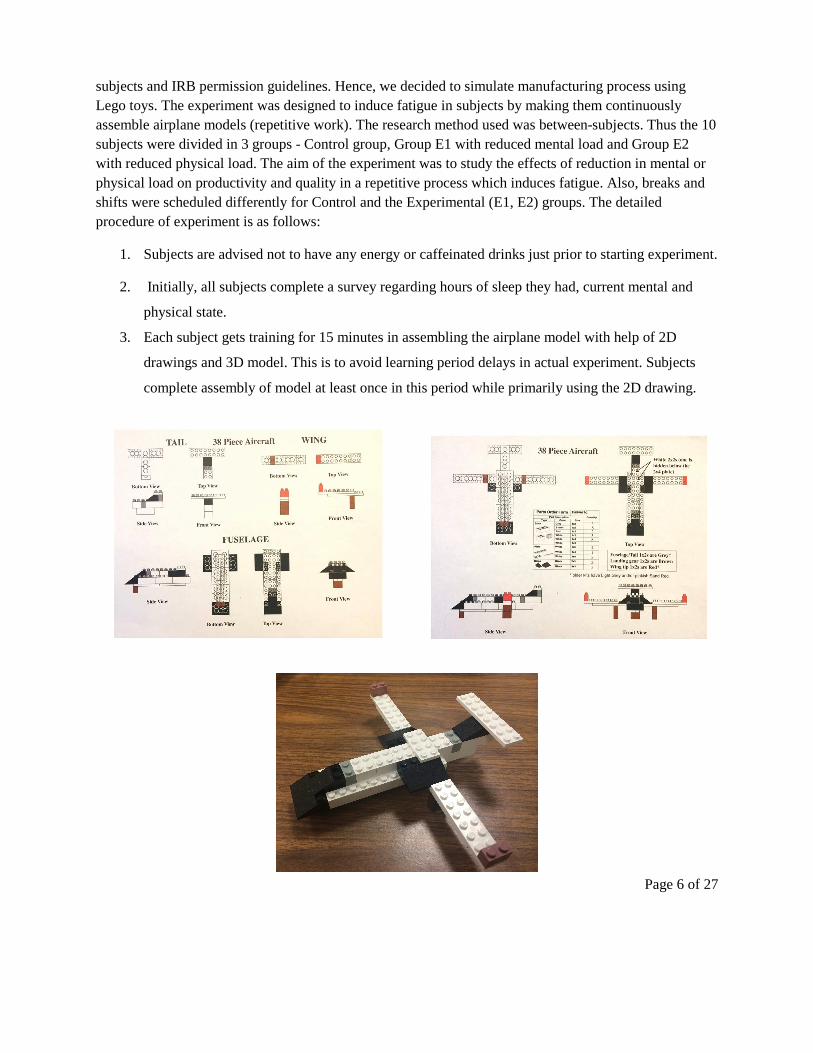
subjects and IRB permission guidelines. Hence, we decided to simulate manufacturing process using Lego toys. The experiment was designed to induce fatigue in subjects by making them continuously assemble airplane models (repetitive work). The research method used was between-subjects. Thus the 10 subjects were divided in 3 groups - Control group, Group E1 with reduced mental load and Group E2 with reduced physical load. The aim of the experiment was to study the effects of reduction in mental or physical load on productivity and quality in a repetitive process which induces fatigue. Also, breaks and shifts were scheduled differently for Control and the Experimental (E1, E2) groups. The detailed procedure of experiment is as follows:
1. Subjects are advised not to have any energy or caffeinated drinks just prior to starting experiment.
2. Initially, all subjects complete a survey regarding hours of sleep they had, current mental and
physical state.
3. Each subject gets training for 15 minutes in assembling the airplane model with help of 2D
drawings and 3D model. This is to avoid learning period delays in actual experiment. Subjects
complete assembly of model at least once in this period while primarily using the 2D drawing.
Page 7 of 27
4. Subjects were asked to sign a standard Consent form for participation in the experiment.
5. Physiological signals of subjects are continuously monitored:
Mental Workload � Skin Conductance, heartbeat rate � Skin Conductor Sensors, BVP Physical Workload � Muscle strain, heartbeat rate � EMG, BVP These sensors are to be attached to the subject using standard procedures prior to starting the experiment.
6. During the experiment, subjects are to continuously assemble airplane models from given blocks
for a period of 30 minutes (working time). The number of models created and the quality in terms
of correctness and fit is recorded to measure productivity and efficiency
7. For comparison purposes, subjects divided in 3 groups:
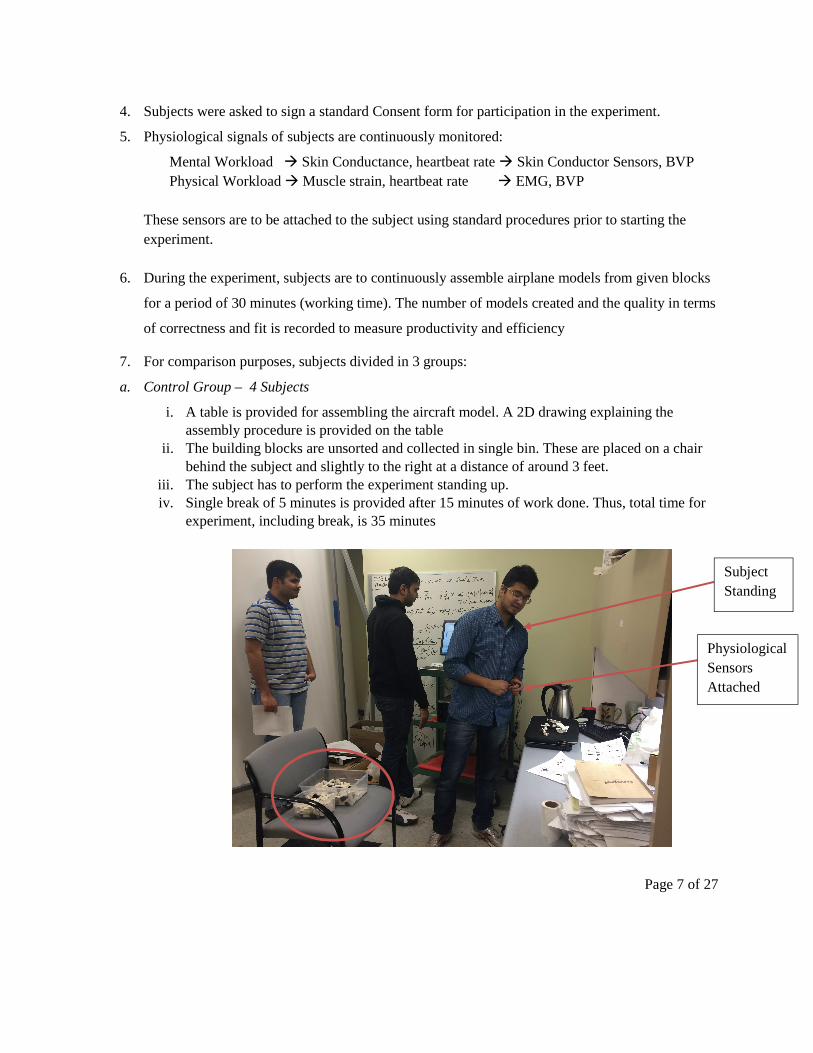
a. Control Group – 4 Subjects
i. A table is provided for assembling the aircraft model. A 2D drawing explaining the assembly procedure is provided on the table
ii. The building blocks are unsorted and collected in single bin. These are placed on a chair behind the subject and slightly to the right at a distance of around 3 feet.
iii. The subject has to perform the experiment standing up. iv. Single break of 5 minutes is provided after 15 minutes of work done. Thus, total time for
experiment, including break, is 35 minutes
Subject Standing
Physiological Sensors Attached

Page 8 of 27
b. E1 Group – 3 Subjects
i. For this group, the raw material is sorted depending on shape and color in different bins. This is done to reduce mental workload.
ii. Also, for same reason, a partial 3D model is provided along with 2D drawing on the table. Actual prototype of model makes assembling process much easier.
iii. The subject is still standing with blocks placed at a distance behind him (no change in physical load).
iv. Two breaks of 2.5 minutes are given after 10 and 20 minutes respectively. So, total time for experiment, including break, is 35 minutes.
c. E2 Group – 3 Subjects
i. Here, the building blocks are unsorted again but placed on the table where assembly is done
ii. Subject is sitting on a chair near the table to reduce physical load.
iii. Only 2D drawing of assembly process is provided, so no change in mental workload
iv. Two breaks of 2.5 minutes are given after 10 and 20 minutes respectively. Thus, total time for experiment, including break, is 35 minutes.
Sorted Blocks

Page 9 of 27
8. Each subject completes the NASA-TLX form at end of experiment.
Data Collection
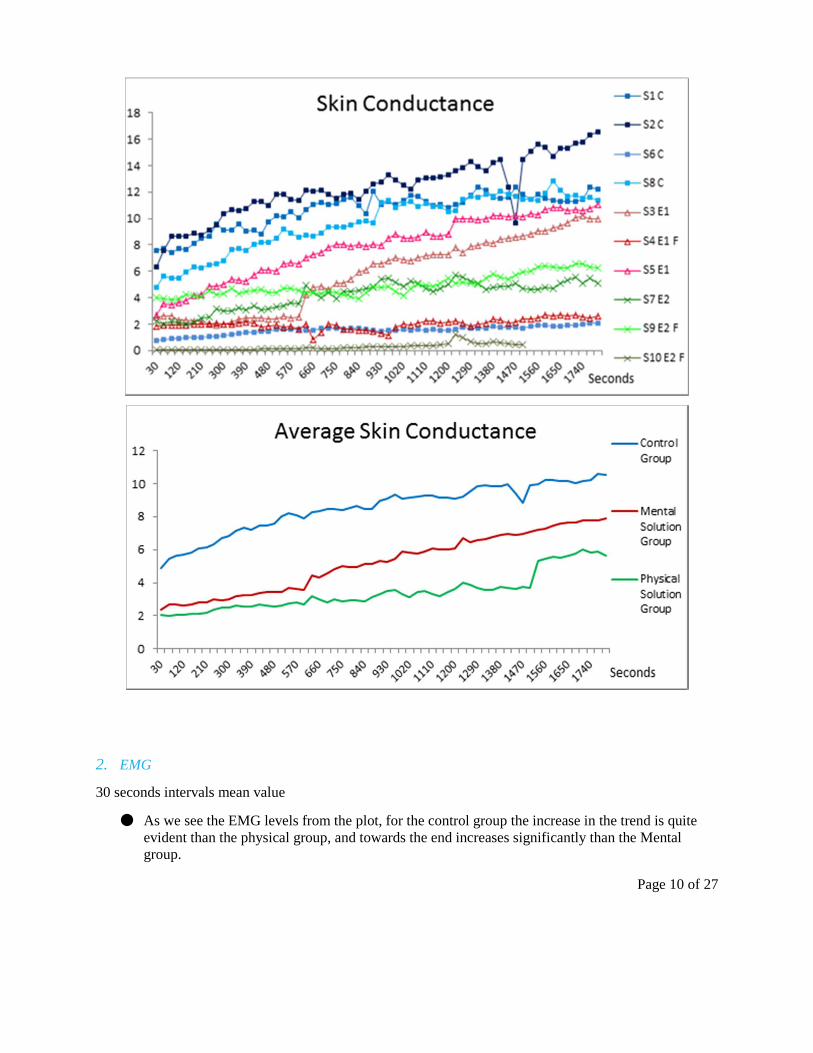
1. Skin Conductance Sensor
30 seconds intervals mean value
● Increasing trend for all subjects
● Highest in control group
● Stress level reduced in solution groups
● Stress level lowest in physical solution group
Subject is sitting
Page 10 of 27
2. EMG
30 seconds intervals mean value
● As we see the EMG levels from the plot, for the control group the increase in the trend is quite evident than the physical group, and towards the end increases significantly than the Mental group.

Page 11 of 27
● Looking at the E2 physical group the solutions provided worked successfully as there no significant increase in the stress levels.
● EMG data for the E1 mental group remains the same while showing smaller decrease in the stress levels.
● EMG data for certain subjects, as we see from graph 1, had lower levels of stress even from control group.

Page 12 of 27
3. BVP (HR)
30 seconds intervals mean value
● Heart rate is indication of stress induced in body.
● Highest variation of heart rate was in control group
● Fatigue lowest in physical solution group

Page 13 of 27
4. Production Rate and Quality
Data Analysis
How decrease in physical and mental workloads would impact the physical and mental stress.
Skin Conductance Sensor (how physical and mental workload would affect mental stress)
Here is the initial statistical data:

Page 14 of 27
However, to eliminate the effects from unusual polar values, it is better to analyze the data within 95% confidential interval:
Group Type 95%CI
Variable N Mean StDev Lower Upper Range
Control
S1 C 60 10.592 1.369 10.238 10.946 0.708
S2 C 60 12.284 2.283 11.694 12.874 1.18
S6 C 60 1.5406 0.3162 1.4589 1.6223 0.1634
S8 C 60 9.648 2.131 9.097 10.199 1.102
Average 60 8.51615 1.5248 8.121975 8.910325 0.78835
Experimental 1
(visual/mental)
S3 E1 60 5.779 2.796 5.057 6.502
1.445
S4 E1 60 2.0083 0.3793 1.9104 2.1063 0.1959
S5 E1 60 7.838 2.345 7.232 8.444
1.212
Average 60 5.208433 1.8401 4.733133 5.6841 0.950967
Experimental 2
(physical)
S7 E2 60 4.201 1.074 3.924 4.479
0.555
S9 E2 60 4.933 0.79 4.729 5.137
0.408
S10 E2 50 0.283 0.2451 0.2133 0.3526 0.1393
Average 56.7 3.139 0.703033 2.955433 3.322867 0.367433
Summary:
In view of the average value for entire group, control group had the largest mental stress,
then the first experimental group, and the second experimental group had the least mental stress.
So the result is that decreasing physical workload is the most effective way to decrease the mental
stress, which reduced by (3.139-8.516)/8.516 = 63.1%; decreasing mental workload is the second
effective method to weaken the mental stress, which decreased by (5.208-8.516)/8.516 = 38.8%.

Page 15 of 27
The subjects in the first experimental group had the largest range on average (most
fluctuate), while the subjects in the second experimental group had the least average range (most
flat). This result shows that the reduction on physical workload can make mental stress less time
sensitive (mental stress increases slowly as time goes by), whereas the reduction on mental
workload makes mental stress more time sensitive (mental stress increases quickly as time goes
by). This result has been foreseen in the beginning, because decreasing the mental workload
significantly increased the production rate, by which the labor did more work than the labors in
control group and the second experimental group (reducing physical workload).
EMG (how physical and mental workload would affect muscle strain)
Here is the initial statistical data:
Group Type 95% CI
Variable N Mean StDev Lower Upper Range
Control
S1 C 60 93.95 17.34 89.47 98.43 8.96
S2 C 60 68.45 13.84 64.87 72.02 7.15
S6 C 60 19.125 4.249 18.027 20.223 2.196
S8 C 60 57.85 9.95 55.28 60.42 5.14
Average 60 59.84375 11.34475 56.91175 62.77325 5.8615
Experimental 1
(visual/mental)
S3 E1 60 44.57 25.49 37.98 51.15 13.17
S4 E1 60 44.57 25.49 37.98 51.15 13.17
S5 E1 60 40.189 6.131 38.605 41.773 3.168

Page 16 of 27
Average 60 43.10967 19.037 38.18833 48.02433 9.836
Experimental 2
(physical)
S7 E2 60 18.78 5.692 17.309 20.25 2.941
S9 E2 60 25.358 3.357 24.491 26.225 1.734
S10 E2 50 43.8 8.99 41.24 46.35 5.11
Average 56.66667 29.31267 6.013 27.68 30.94167 3.261667
Analyze the data within 95% confidential interval:
Summary:
In view of the average EMG value for each group, the method of reducing physical workload in the
second experimental group notably decreased the muscle strain by 49.3% and the method of reducing
mental workload in the first experimental group decreased the muscle strain by 28%.
From the range values, it can be concluded that the increasing speed of muscle strain is in this order:
experimental 1 > control group > experimental 2. This means that the second method of reducing
physical workload not only caused less muscle strain, but also led to a much slower increasing speed for
muscle strain; whereas reducing the mental workload brought up higher increasing speed for muscle
stain than the control group did, although it caused less average strain. This phenomenon could still be
explained by the fact that reducing mental workload remarkably increased the production rate which
simultaneously caused the labor to do more work.
BVP/ Converted Heart Beat Rate (how physical and mental workload would affect physical stress and mental stress)
Here is the initial statistical data:

Page 17 of 27
Analyze the data within 95% confidential interval:
Group Type 95% CI
Variable N Mean StDev Lower Upper Range
Control
S1 C 60 93.25 9.06 90.91 95.59 4.68
S2 C 60 100.148 7.207 98.286 102.01 3.724
S6 C 60 104.34 8.09 102.25 106.42 4.17
S8 C 60 110.43 3.992 109.399 111.461 2.062
Average 60 102.042 7.08725 100.2113
103.8703 3.659
Experimental 1 visual/mental
S3 E1 60 95.86 7.89 93.82 97.89 4.07
S4 E1 60 110.334 5.313 108.962 111.706 2.744
S5 E1 60 104.34 8.09 102.25 106.42 4.17
Average 60 103.5113
7.097667
101.6773
105.3387
3.661333
Experimental 2 physical
S7 E2 60 92.176 5.443 90.77 93.582 2.812
S9 E2 60 98.441 7.425 96.523 100.359 3.836
S10 E2 50 90.66 9.97 87.83 93.49 5.66
Average 56.66667 93.759 7.61266
7 91.7076
7 95.8103
3 4.10266
7
Summary:
Because the simulation experiments were not asking the subjects to perform heavy
workload, the proposed methods of two experimental groups would not have obvious impact to
the heart beat rate. As the workload gets heavier, the impacts could be amplified.
In view of the average heart beat rate for each of the three groups, the method of
decreasing mental workload in the first experimental group slightly increased the heart beat rate
by 1.5%, whereas the method of decreasing physical workload decreased the heart beat rate by
8.5%. This shows that reducing the physical workload can keep the heart beat rate at a lower level,
whereas decreasing the mental workload could propel the heart beat rate.

Page 18 of 27
Overall Tendency:
Conducted the regression analysis for each group, using time as the predictor, then it showed the
following regression functions:
Sensor type Regression functions Revealed truth
Skin Conductance
(mental stress)
ConAve = 6.09 + 0.00265 Time Proposed methods in experimental group #1 caused the fastest increasing speed for metal stress; methods in experimental group #2 led to the slowest increasing speed. E1Ave = 2.16 + 0.00333 Time
E2Ave = 1.64 + 0.00196 Time
EMG
(muscle strain)
ConAve = 54.4 + 0.00598 Time Proposed methods in experimental group #1 caused the fastest increasing speed for muscle strain; methods in experimental group #2 led to the slowest increasing speed. E1Ave = 14.7 + 0.0310 Time
E2Ave = 25.9 + 0.00281 Time
HR
(heart beat rate)
ConAve = 6.09 + 0.00265 Time Proposed methods in experimental group #1 caused decreasing heart beat rate; methods in experimental group #2 led to the fastest increasing speed. E1Ave = 104 - 0.000589 Time
E2Ave = 90.6 + 0.00389 Time
How subjects react to the Break
Control group took one 5-minute-break at after 15 minutes (900 seconds) of working, and the two
experimental groups took two 2.5-minute-breaks after 10 minutes (600 seconds) and 20 minutes (1,200
seconds) of working respectively. All devices were stopped recording data while break time.
For all the three groups, all the three parameters after break(s) were higher than their previous
values. But the increasing speed after breaks was slightly decreased.

Page 19 of 27

Page 20 of 27
NASA-TLX & Performance Analysis
Page 21 of 27
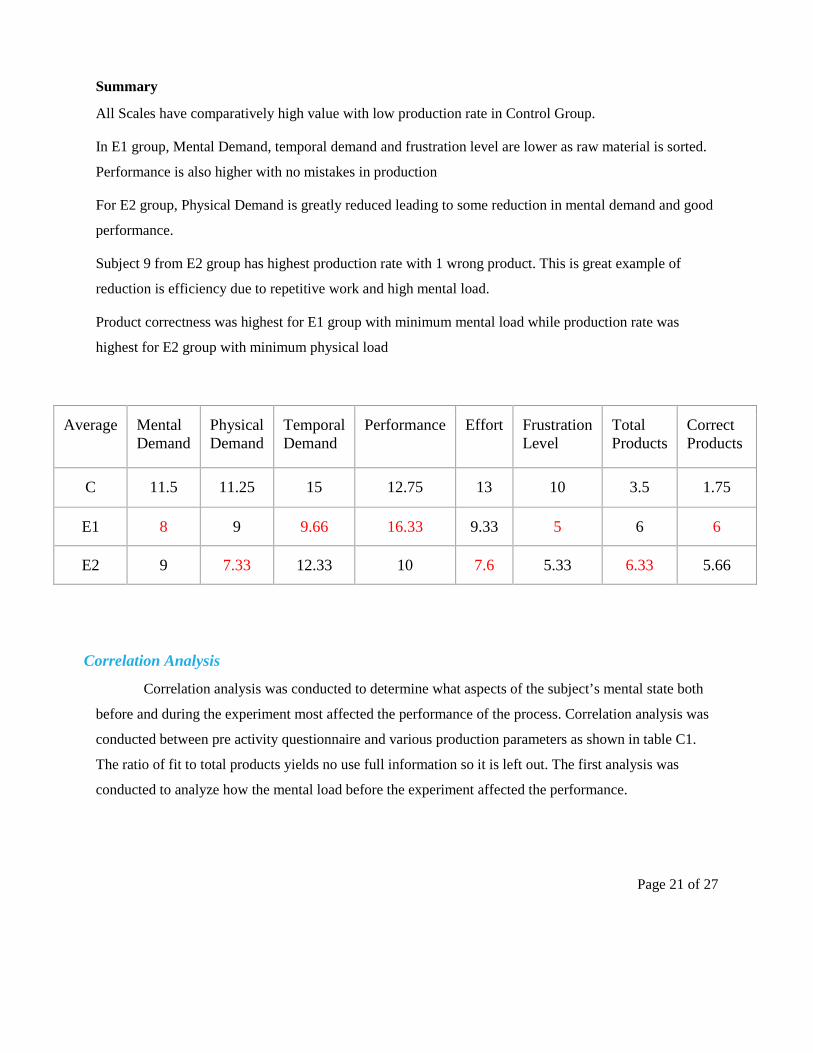
Summary
All Scales have comparatively high value with low production rate in Control Group.
In E1 group, Mental Demand, temporal demand and frustration level are lower as raw material is sorted.
Performance is also higher with no mistakes in production
For E2 group, Physical Demand is greatly reduced leading to some reduction in mental demand and good
performance.
Subject 9 from E2 group has highest production rate with 1 wrong product. This is great example of
reduction is efficiency due to repetitive work and high mental load.
Product correctness was highest for E1 group with minimum mental load while production rate was
highest for E2 group with minimum physical load
Average Mental Demand
Physical Demand
Temporal Demand
Performance Effort Frustration Level
Total Products
Correct Products
C 11.5 11.25 15 12.75 13 10 3.5 1.75
E1 8 9 9.66 16.33 9.33 5 6 6
E2 9 7.33 12.33 10 7.6 5.33 6.33 5.66
Correlation Analysis
Correlation analysis was conducted to determine what aspects of the subject’s mental state both
before and during the experiment most affected the performance of the process. Correlation analysis was
conducted between pre activity questionnaire and various production parameters as shown in table C1.
The ratio of fit to total products yields no use full information so it is left out. The first analysis was
conducted to analyze how the mental load before the experiment affected the performance.

Page 22 of 27
Table C1 - Correlation coefficients between pre-activity questionnaires and production performance
How many hours of sleep do you typically get?
How many hours of sleep have you gotten in the last three nights, on average
Ratio of question 2 to question 1
Compared to your normal stress levels, how stressed are you currently?
Rate your current level of mental exhaustion
Rate your current level of physical exhaustion
Number of products made 0.27686223 0.0976023 -0.2158401 -0.2187286 0.3877801 0.109778
Ratio # of correct products/# of products 0.44708719 0.0032210 -0.5408434 -0.1273518 -0.0640726 0.0229444
Correlation analysis was then conducted between various production parameters and the NASA TLX scores shown in table C2. This analysis was conducted to analyze how the mental load during the experiment affected the performance
Table C2 - Correlation coefficients between NASA-TLX and production performance
Number of products Ratio of # of correct to total
Mental -0.120319494 -0.20677037
physical 0.13266678 -0.556626577
Temporal 0.157498592 -0.524494735
performance 0.486694585 0.097363545
effort -0.304109384 -0.908957768
frustration -0.265793844 -0.804454641
Similarly another correlation analysis was conducted to check what conditions of the participant before the experiment affect the TLX scores entered after the experiment. Table C3 compares the 6 questions of the pre questionnaires with the 6 rating scales of the TLX scale.

Page 23 of 27
Table C3 - Correlation coefficients between pre-activity questionnaires and NASA-TLX
How many hours of
sleep do you typically get?
How many hours of sleep have you
gotten in the last three nights, on
average Ratio of question 2
to question 1
Compared to your normal stress
levels, how stressed are you
currently?
Rate your current level of mental
exhaustion
Rate your
current level of physical exhaustion
Mental 0.018107606 -1.15689E-17 0.108210659 0.435767464 0.139517176 0.4407297
Physical -0.172349211 -0.193888125 0.071886139 0.147421927 0.024723409 0.264359416
Temporal -0.357197379 -0.139178 0.399548114 0.520976443 0.360402923 0.52907555
performance -0.38828218 -0.544643452 -0.131990083 -0.642808629 -0.19349128 -0.265403341
Effort -0.400064015 -0.096788796 0.482086592 0.216540879 -0.101929438 0.101929438
frustration -0.468542925 -0.253782363 0.355989854 0.486664263 -0.06681531 0.233853587
Summary
The effort required and the frustration experienced by the subject was inversely related (High negative correlation) to how “correctly” the products were being made. In other words, the more frustrated the subject was, the fewer products were made correctly. Similarly the greater the level of effort the subject required doing the experiment; the fewer products were made correctly. High levels of stress prior to the experiment have negative (Moderate correlation) effects on the performance during the experiment
Contrary to conventional understanding of how sleep affects performance, all the participants consistently scored themselves (Performance TLX score) higher when they had slept fewer hours the previous few days. One possibility that could be inferred is that people are poor at judging their own performance when they are sleep deprived.
This conclusion may be backed up by a study conducted by the department of physiology at Clemson University
Page 24 of 27
Conclusion
Physiological Measures
1) Fatigue and stress can be lowered if better working conditions are provided.
2) Both methods employed in groups E1 and E2 were effective in decreasing the muscle strains and
mental stresses. E2 is more powerful. E2 decreases the heart rate whereas E1 slightly increases it.
3) E2 can cause flatter trends, E1 causes more choppy trends.
4) A combination of methods in E1 and E2 group is proposed as solution.
5) Breaks did not show effectiveness in decreasing fatigue, but the breaks did cause lower rates of
increase.
Performance
6) Better working conditions ergonomically - sorted, automated and well planned processes - can help in
reducing mental and physical workload considerably.
7) This will lead to higher productivity with much lower rate of defects in products.
8) Frustration level (-0.8), amount of effort required (-0.91) and Hours of sleep (0.45) affected the
quality, while the level of mental exhaustion (0.5) affected the quantity of work.
Limitation and Work Extension
Limitation
1.1 Sample size was too small
While the ideal sample size for this experiment was 30, the actual number of participants
in this experiment was 10 due to availability of equipment (sensors), human subject resources and
time limitations. The sample size was not large enough and the individual variances may have
affected the results of the experiment. Though the results showed some trends for some
parameters and differences within and between groups, larger sample size might show more
obvious trend and bigger differences in the results.
1.2 Sample diversity
The experiment study was done on a group of people in same age group (20 – 25 years).
The subjects were from varied backgrounds (not mechanical or industrial engineering) with

Page 25 of 27
almost zero experience of working in a manufacturing unit. Experiment done with actual workers
may give different results
1.3 Workstation design limitation
The original workstation design was to try to simulate the real manufacturing workshop
in the case study as much as possible. Because subjects were required to be attached with sensors
in the experiment and the laboratory setting was fixed, the workstation for the simulation was
relatively simple. The distance between Lego parts and the workstation was not long enough.
Enough amount of fatigue could not be generated.
1.4 Manufacturing process simulation design limitation
To make sure no harm would be done to human subjects and to stick to the IRB
agreement, the simulation experiment required no more than minimum physical risk to the
subjects. In this situation, it was hard to produce proper amount of mental and physical fatigue
while keeping subjects at a safe and risk-free condition. Although the Lego assembly experiment
we chose for the simulation could satisfy the basic requirement of the simulation, the fatigue and
mental workload created were not big enough to show strong effects of our solution groups’
results.
1.5 Real time motions not simulated
Real time motions of the workers and the working time need to be considered to get the
real time data of the work being done and also the workers mental and physical states.
1.6 Experiment duration was too short
The duration of experiment was also not long enough due to same reasons. The 30
minutes experiment could not simulate the real manufacturing process which usually takes hours
for each shift. The limited duration could only create small amount of fatigue and mental
workload.
1.7 Pre-learning process
The pre-learning process was essential to our experiment because the simulation process
required good familiarity of the work. We could only give each participant only 15 to 20 minutes
of pre-learning to make one plane due to laboratory scheduling. In the experiment we found that,

Page 26 of 27
most of the participants found it hard to assemble the first two planes and it took almost half of
the time of the experiment. The effects of learning phase were not eliminated entirely for the
simulation and the results were affected correspondently.
1.8 Proper training of TLX self-evaluation scores
The NASA-TLX scores for human subjects showed great individual bias. Even with
detailed explanation of our group, some participants found it hard to evaluate their workload
properly. The scale scores for different participants were different. In addition, the bias in TLX
self-evaluation had effects on our experiment results. The expected correlations could not be
showen.
Extension of Work
With improvements and modification of the experiment, the solution groups may show more
significant difference in reducing fatigue and mental workload.
The results in this experiment can be used in designing more ergonomic-friendly workstation and
rescheduling shift breaks to reduce the fatigue and mental workload in real manufacturing unit. The
efficiency and production of manufacturing can also be increased.
The comparison between real labors and simulation participants could be done. Real labors in the
industry could be stronger and older than the participants due to their proficiency and experience.
References
[1] Gershon. P., Shinar. D., Ronen. A., 2009, “Evaluation of experience-based fatigue countermeasures”, Ben-Gurion University of the Negev, Beer Sheva, P.O.B. 653, Beer Sheva 84105, Israel
[2] Gershon. P., Shinar. D., Oron-Gilad. T., Parmet. Y., Ronen. A., 2010,“Usage and perceived effectiveness of fatigue countermeasures for professional and nonprofessional drivers”, Department of Industrial Engineering and Management, Ben-Gurion University of the Negev, Beer Sheva, Israel
[3]Dadi. G. B., Goodrum P. M., Taylor T. R. B., Carswell C.M, 2014, “Cognitive workload demands using 2d and 3d special engineering information formats”, Journal of Construction Engineering and Management,Vol.140(5), pp.04014001
[4] Saito, K., April 1999 “Measurement of fatigue in industries” , Industrial health, Vol.37 (2), pp.134-42

Page 27 of 27
[5] Hosokawa, T., Mikami, K., Saito, K., 1997, “Basic study of the portable fatigue meter: effects of illumination distance from eyes and age”. Ergonomics 40, pp. 887-94.
[6]Kakizaki, T., Oka, T. and Kurimori, S,. 1992, “Changes in mental workload and fatigue during performance of a mental task”. An experiment in 8-h self-paced transcribing task, Japanese Journal of Industrial Health, Vol 34, pp.565-573
[7] Mehta, Rk ; Agnew, Mj, 2012 Aug, “ Influence of mental workload on muscle endurance, fatigue, and recovery during intermittent static work” European Journal Of Applied Physiology, , Vol.112(8), pp.2891-2902
[8] Barker, L, M., Nussbaum, M, A., September 2011, “The effects of fatigue on performance in simulated nursing work”, Ergonomics, Vol.54 (9), pp.815-29
[9] Mehta, R., Agnew, M., 2012, “Effects of physical and mental demands on shoulder muscle fatigue”, Journal Of Prevention Assessment & Rehabilitation, Vol.41, pp.2897-2901