report department of health & social care nhs england · department of health & social care...
TRANSCRIPT

Reportby the Comptroller and Auditor General
Department of Health & Social Care NHS England
Reducing emergency admissions
HC 833 SESSION 2017–2019 2 MARCH 2018
A picture of the National Audit Office logo

Our vision is to help the nation spend wisely.
Our public audit perspective helps Parliament hold government to account and improve public services.
The National Audit Office scrutinises public spending for Parliament and is independent of government. The Comptroller and Auditor General (C&AG), Sir Amyas Morse KCB, is an Officer of the House of Commons and leads the NAO. The C&AG certifies the accounts of all government departments and many other public sector bodies. He has statutory authority to examine and report to Parliament on whether departments and the bodies they fund, nationally and locally, have used their resources efficiently, effectively, and with economy. The C&AG does this through a range of outputs including value-for-money reports on matters of public interest; investigations to establish the underlying facts in circumstances where concerns have been raised by others or observed through our wider work; landscape reviews to aid transparency; and good-practice guides. Our work ensures that those responsible for the use of public money are held to account and helps government to improve public services, leading to audited savings of £734 million in 2016.

Report by the Comptroller and Auditor General
Ordered by the House of Commons to be printed on 1 March 2018
This report has been prepared under Section 6 of the National Audit Act 1983 for presentation to the House of Commons in accordance with Section 9 of the Act
Sir Amyas Morse KCB Comptroller and Auditor General National Audit Office
27 February 2018
HC 833 | £10.00
Department of Health & Social Care NHS England
Reducing emergency admissions
This report examines the progress that the Department of Health & Social Care, NHS England and other stakeholders have made in reducing emergency admissions.
© National Audit Office 2018
The material featured in this document is subject to National Audit Office (NAO) copyright. The material may be copied or reproduced for non-commercial purposes only, namely reproduction for research, private study or for limited internal circulation within an organisation for the purpose of review.
Copying for non-commercial purposes is subject to the material being accompanied by a sufficient acknowledgement, reproduced accurately, and not being used in a misleading context. To reproduce NAO copyright material for any other use, you must contact [email protected]. Please tell us who you are, the organisation you represent (if any) and how and why you wish to use our material. Please include your full contact details: name, address, telephone number and email.
Please note that the material featured in this document may not be reproduced for commercial gain without the NAO’s express and direct permission and that the NAO reserves its right to pursue copyright infringement proceedings against individuals or companies who reproduce material for commercial gain without our permission.
Links to external websites were valid at the time of publication of this report. The National Audit Office is not responsible for the future validity of the links.
11693 03/18 NAO

The National Audit Office study team consisted of: James Beveridge, Mark Burkett, Marisa Chambers, Robin Hinks and Hayley Quick, under the direction of Ashley McDougall.
This report can be found on the National Audit Office website at www.nao.org.uk
For further information about the National Audit Office please contact:
National Audit Office Press Office 157–197 Buckingham Palace Road Victoria London SW1W 9SP
Tel: 020 7798 7400
Enquiries: www.nao.org.uk/contact-us
Website: www.nao.org.uk
Twitter: @NAOorguk
Contents
Key facts 4
Summary 5
Part OneTrends in emergency admissions 12
Part TwoNHS England’s and partners’ response to increasing emergency admissions 20
Part ThreeChallenges in reducing emergency admissions 29
Appendix OneOur audit approach 43
Appendix TwoOur evidence base 45
Appendix ThreeTechnical note 47
If you are reading this document with a screen reader you may wish to use the bookmarks option to navigate through the parts.
4 Key facts Reducing emergency admissions
Key facts
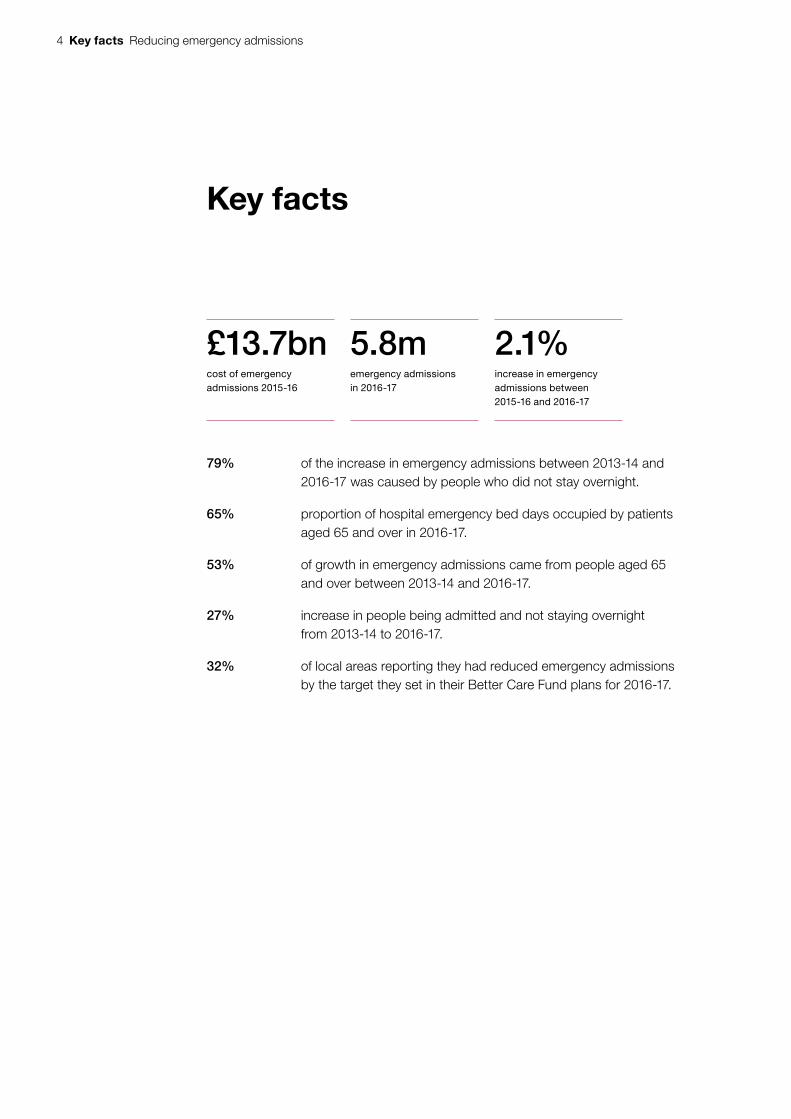
£13.7bncost of emergency admissions 2015-16
5.8memergency admissions in 2016-17
2.1%increase in emergency admissions between 2015-16 and 2016-17
79% of the increase in emergency admissions between 2013-14 and 2016-17 was caused by people who did not stay overnight.
65% proportion of hospital emergency bed days occupied by patients aged 65 and over in 2016-17.
53% of growth in emergency admissions came from people aged 65 and over between 2013-14 and 2016-17.
27% increase in people being admitted and not staying overnight from 2013-14 to 2016-17.
32% of local areas reporting they had reduced emergency admissions by the target they set in their Better Care Fund plans for 2016-17.

Reducing emergency admissions Summary 5
Summary
1 NHS England defines an emergency admission to be ‘‘when admission is unpredictable and at short notice because of clinical need’’. Some emergency admissions are clinically appropriate and unavoidable. Others could be avoided by providing alternative forms of urgent care, or by providing appropriate care and support earlier to prevent a person becoming unwell enough to require an emergency admission.
2 Increasing emergency admissions lead to increasing pressures across the health and social care systems. Prolonged overnight emergency admissions can have a significant impact on people, particularly older people who can lose mobility very quickly if they do not keep active, and their ability to perform everyday activities can reduce while in hospital. Increasing emergency admissions can limit a hospital’s capacity to undertake routine elective care. Efforts to reduce emergency admissions can create additional demand for general practice and local authorities’ social services. The cumulative impact of rising emergency admissions is an increased challenge to the financial and service sustainability of the NHS and the already under-pressure acute hospital system.
3 The Department of Health & Social Care (the Department) sets NHS England’s mandate for arranging the provision of health services. The 2017-18 mandate includes an objective for NHS England to achieve a measurable reduction in emergency admission rates by 2020. The Department and its arm’s-length bodies have an internal ambition to reduce growth in elective and emergency admissions in 2017-18 to 1.5%. NHS England recognises that reducing emergency admissions requires action across the health and social care systems, rather than focusing on activity in accident and emergency (A&E) departments alone. NHS England is aware that there is a direct trade-off between funding going to acute hospitals and funding spent on out-of-hospital services.

6 Summary Reducing emergency admissions
Scope of the report
4 This report examines progress that the Department, NHS England, NHS Improvement and other stakeholders are making in reducing the impact of emergency admissions on acute hospitals. The report takes a whole-system approach, and looks at action across acute, primary, community and social care systems rather than focusing on A&E departments alone. It builds on our 2013 report on Emergency admissions to hospital: managing the demand and our 2016 report on Discharging older patients from hospital, which also examined the pressures on the whole health and social care system.
5 Our report covers:
• trends in emergency admissions (Part One);
• NHS England’s and partners’ response to increasing emergency admissions (Part Two); and
• challenges in reducing emergency admissions (Part Three).
We have set out the detailed methodology in appendix Three.
Key findings
Trends in emergency admissions
6 Overall emergency admissions continue to increase each year. Emergency admissions have grown 9.3% from 2013-14, when we last reported on emergency admissions, to 2016-17. In 2016-17, there were 5.8 million emergency admissions, up by 2.1% on the previous year. In 2016-17, 24% of emergency admissions were admissions that NHS England considers could be avoidable (paragraphs 1.3, 3.9, Figures 1 and 6).
7 A large proportion (79%) of the growth in emergency admissions from 2013‑14 to 2016‑17 was accounted for by people who did not stay in hospital overnight. NHS England told us that it, along with NHS Improvement, is seeking to promote a different model of emergency care which shortens the length of time that people stay in hospital, in particular to avoid an overnight stay and an admission to a bed. There has been a 27% increase in people being admitted and not staying overnight from 2013-14 to 2016-17 and a 6.1% increase from 2015-16 to 2016-17. In overall terms, nearly half of emergency admissions in 2016-17 resulted in people staying for two or more nights, and nearly one-third did not stay overnight. There is some evidence that admission thresholds have risen since 2010 and that without this change in practice the number of emergency admissions in 2015 would have been 11.9% higher than it actually was (paragraphs 1.7, 1.8, 1.10 and figure 3).
Reducing emergency admissions Summary 7
8 The increase in emergency admissions is mostly made up of older people. Older people make up more than half of the growth in emergency admissions between 2013-14 and 2016-17. Some of this is down to demographic change. Between 2013-14 and 2016-17, the number of people aged 65 and over grew by 6.2%. However, over the same period, emergency admissions for people aged 65 and over grew by 12%, almost twice the rate of population growth. The demographic pressure will only increase as the numbers of people aged 65 and over is projected to increase by a further 20% between 2017 and 2027. The Department is aware that demographic changes do not fully account for increasing admissions and is doing further work to better understand the other drivers (paragraph 1.11).
9 The number of bed days used by patients has increased. The number of bed days used by people admitted in an emergency admission has increased from 32.41 million in 2013-14 to 33.59 million in 2016-17. This is a 3.6% increase, which is less than the 9.3% increase in emergency admissions during the same period (paragraph 1.9 and Figure 4).
10 The cost of emergency admissions has not increased in line with the growth in numbers. We estimate that the real-terms cost of emergency admissions has increased by 2.2% since 2013-14, from £13.4 billion to £13.7 billion in 2015-16, the latest period for which costs are available. The increase in emergency admissions over the same period is 7% and therefore suggests that the NHS has become more cost-effective in managing emergency admissions (paragraph 1.14).
How NHS England and partners have sought to reduce emergency admissions
11 NHS England and partners have developed a number of national programmes that aim, among other objectives, to reduce the impact of emergency admissions. These programmes include the urgent and emergency care programme, the new care models and the Better Care Fund. The programmes focus on integrating health and social care, improving access to general practices’ services, improving the performance of A&E departments and improving out-of-hospital care. NHS England and NHS Improvement have approved eight areas to become accountable (now integrated) care systems from 2017-18, and a further two to become devolved health and social care systems. NHS England and NHS Improvement plan that these areas will be given more autonomy over how they spend their resources and manage their own performance (paragraphs 2.3 to 2.9).
8 Summary Reducing emergency admissions
12 While the rate of growth in emergency admissions has slowed slightly, there is limited evidence to show that NHS England’s programmes have brought about that slow‑down. There is disagreement among clinicians, other practitioners and evaluators about the effectiveness of some of the interventions within the programmes. On the Better Care Fund, data for 2017-18 are not available, and 2016-17 data show limited progress, with only 32% of local areas reporting they had met their local target to reduce emergency admissions. NHS England is currently unable to demonstrate that the interventions now in place in the urgent and emergency care programme have led to the slight slow-down in growth in emergency admissions seen in 2016-17; further work is underway by NHS England and NHS Improvement to evaluate interventions. Some new care models have had slower increases in the rate of emergency admissions than other areas in England as of June 2017. However, there is considerable variability in performance, with results ranging from a reduction in emergency admissions of 7.4% to increases of 11.4% for multi-speciality community providers (paragraphs 2.10 to 2.17 and figure 9).
13 NHS England believes that the move to provide daycase emergency care is a significant factor in easing pressure on hospitals. As part of the urgent and emergency care programme, hospitals are required to provide more daycase emergency care. NHS England considers the move to providing this model of care to be more appropriate for some patients and that it frees up beds. However, it is not possible to identify the numbers of people who receive daycase emergency care, as hospitals cannot record these patients as a distinct population. Some hospitals record these patients as being admitted while other hospitals record them as outpatients. Because of these inconsistencies in how hospitals record patients who receive daycase emergency care, NHS England cannot determine the extent of the impact of people receiving daycase emergency care, although it has started work to look at how these patients could be recorded (paragraph 2.12 and 3.32).
Challenges in reducing emergency admissions
14 Bed closures have increased the pressures posed to acute hospitals by rising emergency admissions. NHS England statistics show that from 2010-11 to 2016-17, the average number of available general and acute beds has fallen by 6,268 beds (5.8%). Our previous work has found that bed occupancy above 85% can lead to regular bed shortages, periodic bed crises and increased numbers of hospital-acquired infections. Bed occupancy has been increasing since at least 2010-11, reaching a seasonal peak of 91.4% in the fourth quarter of 2016-17. In January 2018, NHS England and NHS Improvement’s National Emergency Pressures Panel recommended trusts defer their elective activity for January, in light of pressures on emergency care. NHS England expects to publish data on the level of activity that was affected in March 2018 (paragraph 3.2 and Figure 10).
Reducing emergency admissions Summary 9
15 There has been an increase in the number of people being readmitted in an emergency shortly after an initial inpatient stay. Readmission rates can indicate the success of the NHS in helping people to recover effectively from illnesses or injuries. Readmissions can occur for a number of reasons and are not always preventable, but can serve as a warning indicator that local practices may not be providing the required quality of acute care and discharge planning, particularly when readmissions are increasing. NHS Digital no longer reports readmissions. Using data from 72 Trusts, Healthwatch England has estimated emergency readmissions to have risen by 22.8% between 2012-13 and 2016-17. While there are some issues about the reliability and consistency of the data collected by Healthwatch England, the reported rate of growth raises questions about the appropriateness of some decisions to discharge and/or the support provided to help people recuperate. Over the same period we calculate overall emergency admissions to hospital rose by 10.2% (paragraphs 3.3 and 3.4).
16 Capacity in the community to prevent emergency admissions does not currently meet demand. In October 2017, the Department noted that there was not then a clear plan for how the £10 billion it estimated was spent on community health care could be better used to manage current and future demand and that NHS England’s proposals for programmes to focus on community care had stalled. Since then, NHS England and NHS Improvement have set up a project to develop community services to support the Five Year Forward View. The Department and NHS England told us that they believe by integrating care and bringing services together through new models of care they can prevent unnecessary admissions. In 2012, the National Audit of Intermediate Care calculated that the capacity of intermediate care – which helps prevent people going into hospital and facilitates their move out – needed to double to meet potential demand. In 2017, the Audit noted that there was no evidence to suggest that there had been the necessary change in investment and capacity to meet demand (paragraphs 3.7 to 3.12, figures 11 and 12).
17 The Department, NHS England and NHS Improvement do not fully understand the reasons for the considerable local variation in the rates of emergency admissions. After controlling for demographics, deprivation, health needs, and local costs, in 2016-17, the rates of emergency admissions varied across local areas. In 2016-17, the number of emergency admissions across England varied between 73 and 155 admissions per 1,000 weighted GP registered population. The Department, NHS England and NHS Improvement do not know what causes all these local variations and therefore cannot identify the extent to which they are caused by local health and social care practices which lead to better management of emergency admissions, or other factors (paragraphs 3.23 to 3.25 and Figures 13, 14 and 15).
10 Summary Reducing emergency admissions
18 NHS England does not yet have good enough data on emergency admissions. The available hospital data do not always accurately record the causes of people attending A&E, the severity of their complaint, the source of referral and their diagnosis once they have been seen. In their assessment of the current Accident and Emergency data set, NHS Digital and the Royal College of Emergency Medicine, noted that the data set only had records on where people come from for 5% of attendances, for example, a road traffic accident. This assessment estimated that only 50% of patients had a diagnosis of their medical condition recorded, and considered that the reporting of diagnosis was often poor. In response, from 5 October 2017, NHS England has required emergency departments to collect more comprehensive data (paragraphs 3.30 to 3.32).
19 A lack of linked data across health and social care means NHS England cannot assess the impact of out of hospital care on emergency admissions. With no national data collection on community care yet, and an inability to link hospital activity data with primary and social care data, NHS England cannot assess the impact of out-of-hospital care on rates of emergency admissions. The lack of linked data means that researchers cannot track patients as they flow through the different systems to identify the impact of various health and social care interventions on their health. NHS Digital and NHS England intend to publish the first phase of a new community data set to better understand capacity across all community health services, and the met and unmet need in Spring 2018 (paragraphs 3.33 and 3.34).
Conclusion on value for money
20 The impact on hospitals of rising emergency admissions poses a serious challenge to both the service and financial position of the NHS. Over the last four years, the NHS has done well to reduce this impact despite admitting more people as emergency admissions, largely by reducing length of stay and growing daycase treatment. However, it cannot know if its approach is achieving enduring results until it understands whether reported increases in readmissions are a sign that some people admitted as an emergency are being discharged too soon. The NHS also still has too many avoidable admissions and too much unexplained variation. A lot of effort is being made and progress can be seen in some areas, but the challenge of managing emergency admissions is far from being under control.

Reducing emergency admissions Summary 11
Recommendations
21 There are complex responsibilities for reducing emergency admissions. While these recommendations below are targeted at specific organisations, we are clear that all organisations need to work together more effectively. We recommend:
a The Department, NHS England and NHS Improvement should establish an evidence base for what works in reducing emergency admissions and use this to inform future national programmes. The Department, NHS England and NHS Improvement have not yet established a robust evidence base to show what works in reducing demand for emergency admissions. Many admission reduction interventions have not been tested at scale, and the Department, NHS England and NHS Improvement are unable to show whether any success is both sustainable and attributable to those interventions.
b NHS England and NHS Improvement should determine and accelerate the dissemination of the learnings from the new care models. Some of the new care models have reduced the rate of growth in emergency admissions, but NHS England and NHS Improvement have not yet determined which elements of the new care models have brought about the reduction.
c NHS England and NHS Digital should link hospital activity data with primary, community health care and social care data. This will enable health and social care practitioners to inform or supplement their choice of care so they can make the most informed decision about whether a patient requires emergency hospital treatment. It will also enable researchers and policy-makers to understand what health and social care interventions are effective in reducing demand for emergency admissions.
d The Department, NHS England and NHS Improvement should develop a data led understanding of what causes local variations and set out how and by when they will reduce those variations. There is considerable regional variation in the rates of emergency admissions which may be due to a number of factors including better management of emergency admissions, but the Department, NHS England and NHS Improvement do not understand fully the causes of these variations.
e The Department and NHS England should set out how community services will support reductions in emergency admissions. NHS England has stalled its plans to improve the effectiveness of community services although the Department, NHS England and NHS Improvement have begun to explore options for future work.
f NHS England and NHS Digital should build on the introduction of the Emergency Care Data Set to improve data on daycase emergency care and publish data on readmissions. There are several problems with the data on emergency admissions, including a lack of reliable information on causes of admission, source of referral, severity and diagnosis and whether variation in recorded bed use has resulted from inconsistencies in the way hospitals record stays of less than one day.
12 Part One Reducing emergency admissions
Part One
Trends in emergency admissions
1.1 This part of the report examines the trends and causes of emergency admissions and the pressures that they put on the NHS.
Why emergency admissions are important
1.2 NHS England defines an emergency admission to be “when admission is unpredictable and at short notice because of clinical need”. Some emergency admissions are clinically appropriate and unavoidable. Others could be avoided by providing alternative forms of urgent care, or by providing appropriate care and support earlier to prevent a person becoming unwell enough to require an emergency admission.
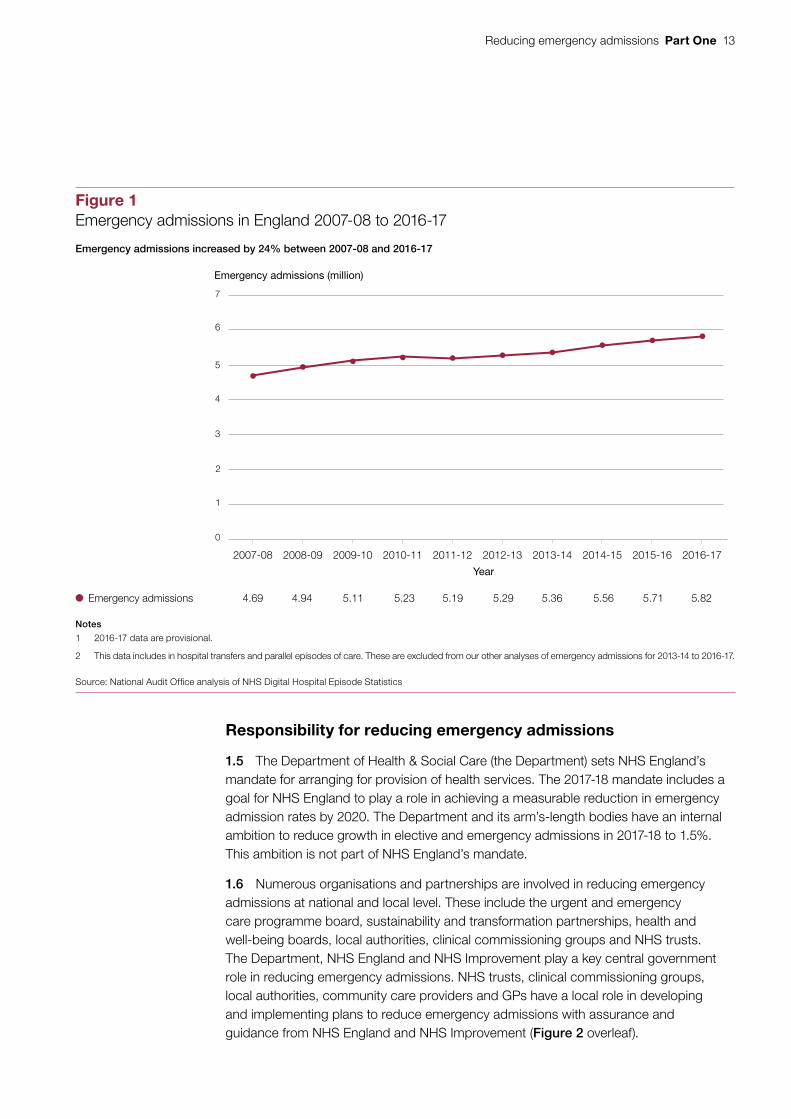
1.3 From 2007-08 to 2016-17, emergency admissions have grown by 24%, with an average annual rate of growth of 2.4% per year (Figure 1). In 2016-17, emergency admissions grew by 2.1% (Figure 3), and there were 5.8 million emergency admissions that year. The most recent data for 2017-18 are not directly comparable with the other data presented in the report as these are collated on a different basis and are not complete. These data indicate a growth in emergency admissions between April and September 2017-18 with a seasonal dip in the summer similar to that seen in previous years.
1.4 Emergency admissions can have a significant impact on people, particularly older people. As we have previously reported, older people can lose mobility very quickly if they do not keep active, and their ability to perform everyday activities can reduce while in hospital for a prolonged overnight stay. Older people are also much more likely to get hospital infections.1 Increasing emergency admissions can limit a hospital’s capacity to undertake routine elective care. Efforts to reduce emergency admissions can generate additional demand for general practice and local authorities’ social services. The requirement for hospitals to see, treat and either admit or discharge from accident and emergency departments (A&E) 95% of patients within four hours may be driving behaviours in A&E. Our report on emergency admissions in 2013 found that the four-hour standard had become a major factor in influencing admission behaviour in A&E departments, with a quarter of admissions from A&E departments occurring in the last 10 minutes of the four-hour period.2
1 Comptroller and Auditor General, Discharging older patients from hospital, Session 2016-17, HC 18, National Audit Office, May 2016.
2 Comptroller and Auditor General, Emergency admissions to hospital: managing the demand, Session 2013-14, HC 739, National Audit Office, October 2013.
Reducing emergency admissions Part One 13
Line chart 175mm template
Responsibility for reducing emergency admissions
1.5 The Department of Health & Social Care (the Department) sets NHS England’s mandate for arranging for provision of health services. The 2017-18 mandate includes a goal for NHS England to play a role in achieving a measurable reduction in emergency admission rates by 2020. The Department and its arm’s-length bodies have an internal ambition to reduce growth in elective and emergency admissions in 2017-18 to 1.5%. This ambition is not part of NHS England’s mandate.
1.6 Numerous organisations and partnerships are involved in reducing emergency admissions at national and local level. These include the urgent and emergency care programme board, sustainability and transformation partnerships, health and well-being boards, local authorities, clinical commissioning groups and NHS trusts. The Department, NHS England and NHS Improvement play a key central government role in reducing emergency admissions. NHS trusts, clinical commissioning groups, local authorities, community care providers and GPs have a local role in developing and implementing plans to reduce emergency admissions with assurance and guidance from NHS England and NHS Improvement (Figure 2 overleaf).
Emergency admissions 4.69 4.94 5.11 5.23 5.19 5.29 5.36 5.56 5.71 5.82
Figure 1Emergency admissions in England 2007-08 to 2016-17
Emergency admissions (million)
Year
Emergency admissions increased by 24% between 2007-08 and 2016-17
0
1
2
3
4
5
6
7
Notes
1 2016-17 data are provisional.
2 This data includes in hospital transfers and parallel episodes of care. These are excluded from our other analyses of emergency admissions for 2013-14 to 2016-17.
Source: National Audit Office analysis of NHS Digital Hospital Episode Statistics
2007-08 2008-09 2009-10 2010-11 2011-12 2012-13 2013-14 2014-15 2015-16 2016-17

14 Part One Reducing emergency admissions
<No data from link>
Figure 2Organisations and partnerships involved in reducing emergency admissions
There are a number of organisations and partnerships at national and local level involved in reducing emergency admissions
Source: National Audit Offi ce analysis of Department of Health & Social Care and NHS England documents
Social Care Primary Care Community CareUrgent and
Emergency Care
Provider/commissioner support
Commissioner
Regulator
Local partnershipsPolicy setting
Provider
Sector-led improvement
Department of Health & Social Care
Care Quality Commission
Local Government Association
Association of Directors of Adult Social Services
Local authorities with social care responsibilities
Health and well-being boards
A&E delivery boards
Ministry of Housing, Communities and Local Government
NHS ImprovementNHS England
NHS Benchmarking
Sustainability and transformation partnerships
Clinical commissioning groups
GPs Community care providers NHS trusts and foundation trusts
National
Local
Reducing emergency admissions Part One 15
Line chart 175mm template
Changes in the length of stay in hospitals after an emergency admission
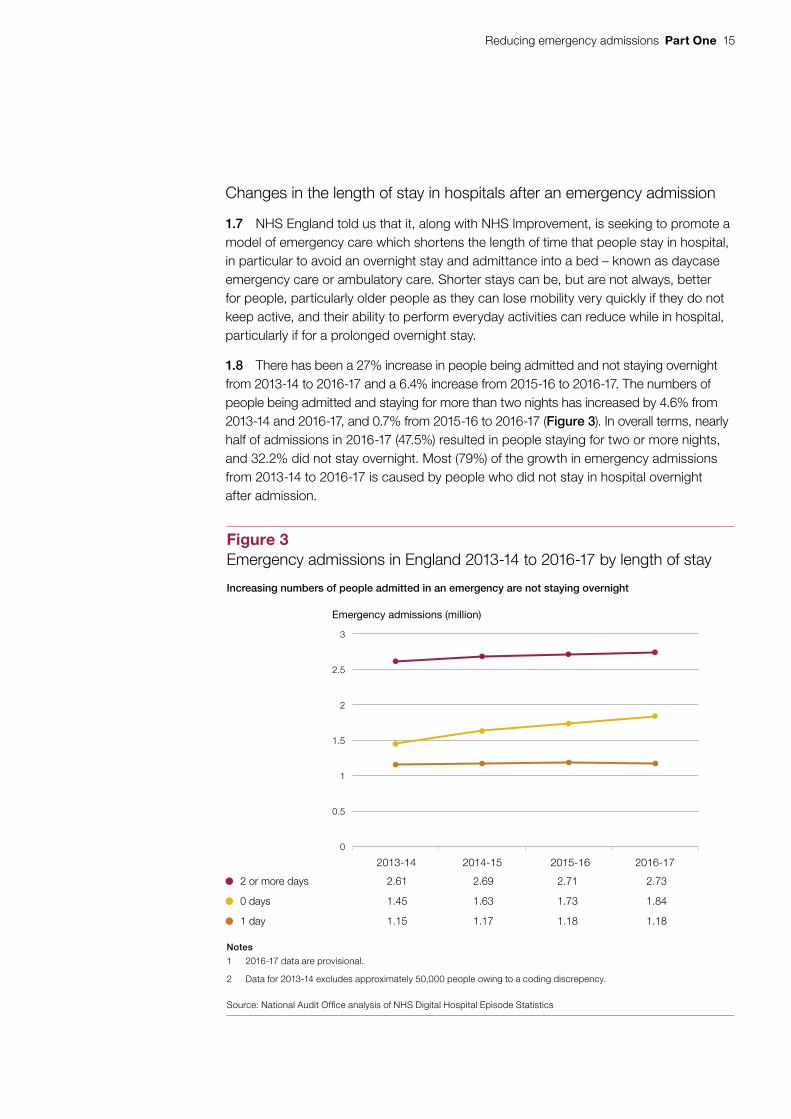
1.7 NHS England told us that it, along with NHS Improvement, is seeking to promote a model of emergency care which shortens the length of time that people stay in hospital, in particular to avoid an overnight stay and admittance into a bed – known as daycase emergency care or ambulatory care. Shorter stays can be, but are not always, better for people, particularly older people as they can lose mobility very quickly if they do not keep active, and their ability to perform everyday activities can reduce while in hospital, particularly if for a prolonged overnight stay.
1.8 There has been a 27% increase in people being admitted and not staying overnight from 2013-14 to 2016-17 and a 6.4% increase from 2015-16 to 2016-17. The numbers of people being admitted and staying for more than two nights has increased by 4.6% from 2013-14 and 2016-17, and 0.7% from 2015-16 to 2016-17 (Figure 3). In overall terms, nearly half of admissions in 2016-17 (47.5%) resulted in people staying for two or more nights, and 32.2% did not stay overnight. Most (79%) of the growth in emergency admissions from 2013-14 to 2016-17 is caused by people who did not stay in hospital overnight after admission.
Figure 3Emergency admissions in England 2013-14 to 2016-17 by length of stay
Emergency admissions (million)
2 or more days 2.61 2.69 2.71 2.73
0 days 1.45 1.63 1.73 1.84
1 day 1.15 1.17 1.18 1.18
Notes
1 2016-17 data are provisional.
2 Data for 2013-14 excludes approximately 50,000 people owing to a coding discrepency.
Source: National Audit Office analysis of NHS Digital Hospital Episode Statistics
Increasing numbers of people admitted in an emergency are not staying overnight
2013-14 2014-15 2015-16 2016-17
0
0.5
1
1.5
2
2.5
3

16 Part One Reducing emergency admissions
Line chart 175mm template
Changes in the use of bed days
1.9 The number of days that beds are used by people admitted in an emergency admission has increased from 32.41 million in 2013-14 to 33.59 million in 2016-17 (Figure 4). This is an increase of 3.6%, which is less than the 9.3% increase in emergency admissions for that period. The majority of bed days (96% in 2016-17) are used by people who stay for two days or more after being admitted as an emergency admission. Stays of longer than two days have grown slightly faster than short stays between 2015-16 and 2016-17.
Figure 4Emergency admissions and bed days in England from 2013-14 to 2016-17
Emergency bed days (million) Emergency admissions (million)
Bed days – short stay (less than 2 days) 1.26 1.29 1.31 1.31
Bed days – long stay (2 days or more) 31.14 31.39 31.73 32.28
Total bed days 32.41 32.68 33.04 33.59
Total number of emergency admissions 5.26 5.48 5.63 5.75
Notes
1 2016-17 data are provisional.
2 Analysis of emergency bed days is based on data supplied by NHS England and is calculated on the basis of finished discharge episodes which includes bed days for people admitted in a previous financial year.
Source: NHS England’s analysis of emergency bed days and National Audit Office analysis of emergency admissions using Hospital Episode Statistics
Between 2013-14 and 2016-17 the total number of emergency bed days increased by 3.6% while the total number of emergency admission increased by 9.3%
2013-14 2014-15 2015-16 2016-17
0
1
2
3
4
5
6
0
5
10
15
20
25
30
35

Reducing emergency admissions Part One 17
Possible changes in likelihood of admittance
1.10 Recent research of emergency admissions between April 2010 and March 2015 indicates that emergency departments may be less likely to admit people in an emergency (this is known as the ‘admission threshold’). The research found clinicians were admitting a similar proportion of patients to hospital despite increases in the complexity and acuity of patients who attend A&E. The research estimates that without these threshold changes, the number of emergency admissions could have been 11.9% higher in 2015 than was the case in 2010.3
Emergency admissions of older people
1.11 The increase in emergency admissions consists mainly of older people. Between 2013-14 and 2016-17, the majority of growth (53%) in emergency admissions came from people aged 65 and over. The increase in older people being admitted is to be expected, given the increase of older people in the population, but changes in the population do not fully account for increasing emergency admissions.
• In 2016-17, people aged 65 and over accounted for 43% of total emergency admissions although they made up around 18% of the population.
• Between 2013-14 and 2016-17, total emergency admissions for people aged 65 and over grew by 12%, while the population aged 65 and over grew by 6.2%.
• Between 2013-14 and 2016-17, emergency admissions for people aged 65 and over, that stayed for at least one night increased by 7.3%, still higher than the rate of growth in that section of the population.
The numbers of people aged 65 and over has been projected to increase by a further 20% between 2017 and 2027.4 The Department is aware that demographic changes are not the single cause of increasing emergency admissions and is doing further work to understand the other drivers.
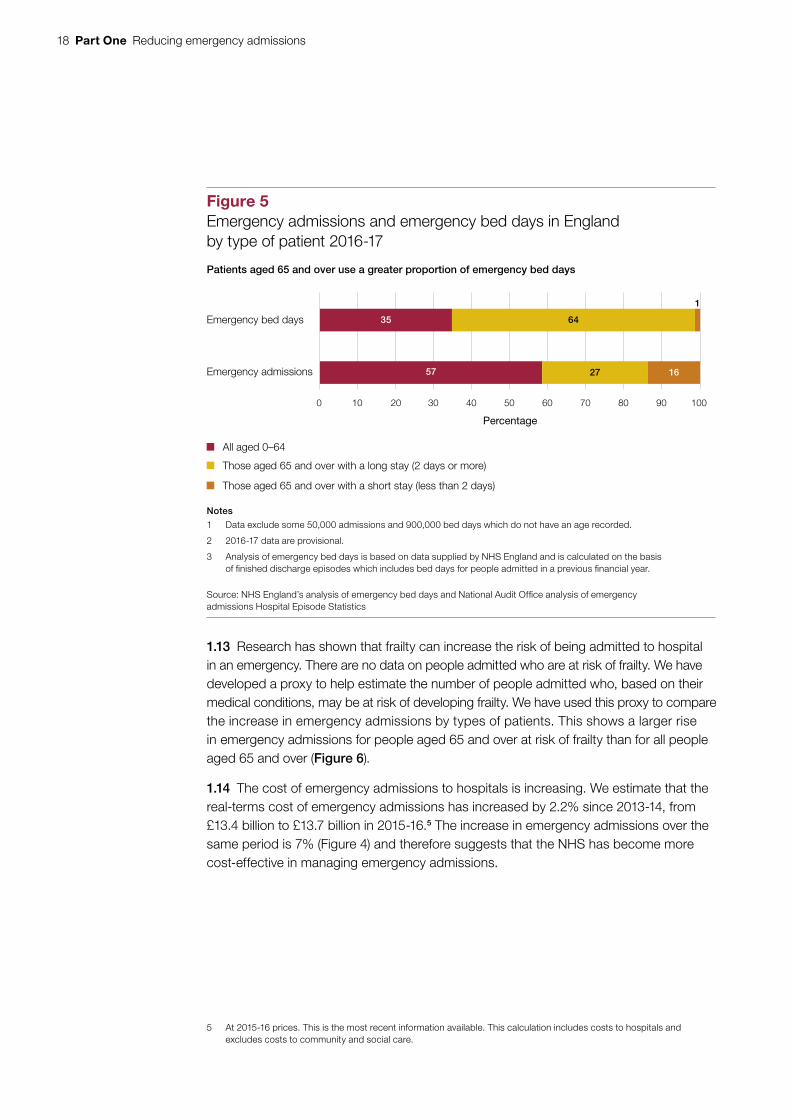
1.12 While people aged 65 and over account for the majority of the increase in emergency admissions in 2016-17, they are the minority of emergency admissions in total (43%). However, they represent a greater pressure than other people as they use more bed days than other people once admitted in an emergency (65% of bed days) (Figure 5 overleaf).
3 Steven Wyatt, Kieran Child, Andrew Hood, Matthew Cooke, Mohammed A Mohammed: ‘Changes in admission thresholds in English emergency departments’, Emergency Medicine Journal, 12 September 2017.
4 Office for National Statistics, Annual Mid-year Population Estimates: 2016 Statistical Bulletin, June 2017.
18 Part One Reducing emergency admissions
figure_two_bar_horizontal_135mm
1.13 Research has shown that frailty can increase the risk of being admitted to hospital in an emergency. There are no data on people admitted who are at risk of frailty. We have developed a proxy to help estimate the number of people admitted who, based on their medical conditions, may be at risk of developing frailty. We have used this proxy to compare the increase in emergency admissions by types of patients. This shows a larger rise in emergency admissions for people aged 65 and over at risk of frailty than for all people aged 65 and over (Figure 6).
1.14 The cost of emergency admissions to hospitals is increasing. We estimate that the real-terms cost of emergency admissions has increased by 2.2% since 2013-14, from £13.4 billion to £13.7 billion in 2015-16.5 The increase in emergency admissions over the same period is 7% (Figure 4) and therefore suggests that the NHS has become more cost-effective in managing emergency admissions.
5 At 2015-16 prices. This is the most recent information available. This calculation includes costs to hospitals and excludes costs to community and social care.
Figure 5Emergency admissions and emergency bed days in England by type of patient 2016-17
Patients aged 65 and over use a greater proportion of emergency bed days
Notes
1 Data exclude some 50,000 admissions and 900,000 bed days which do not have an age recorded.
2 2016-17 data are provisional.
3 Analysis of emergency bed days is based on data supplied by NHS England and is calculated on the basis of finished discharge episodes which includes bed days for people admitted in a previous financial year.
Source: NHS England’s analysis of emergency bed days and National Audit Office analysis of emergency admissions Hospital Episode Statistics
Emergency bed days
Emergency admissions
All aged 0–64
Those aged 65 and over with a long stay (2 days or more)
Those aged 65 and over with a short stay (less than 2 days)
0 10 20 30 40 50 60 70 80 90 100
35
57
64
27 16
1
Percentage

Reducing emergency admissions Part One 19
Line chart 175mm template
Figure 6Growth in emergency admissions in England 2013-14 to 2016-17 by type of patient
Emergency admissions (indexed: 2013-14 = 100)
Emergency admissions for patients of all ages 100 104.2 107.0 109.3
Emergency admissions for patients aged 100 106.5 108.7 111.9 65 and over
Emergency admissions for patients aged 100 109.3 114.1 120.4 65 and over at risk of frailty
Emergency admissions for patients that 100 106.2 109.8 113.8 NHS England considers could be avoided with effective community care and case management
Notes
1 Our frailty risk indicator includes emergency admissions for patients aged 65 and over with diagnoses for delirium, dementia, functional dependence,falls and fractures, incontinence, pressure ulcers and senility.
2 2016-17 data are provisional.
Source: National Audit Office analysis of NHS Digital Hospital Episode Statistics
100
112
114
116
118
120
102
104
106
108
110
2013-14 2014-15 2015-16 2016-17
People admitted at risk of frailty are showing the highest growth in emergency admissions

20 Part Two Reducing emergency admissions
Part Two
NHS England’s and partners’ response to increasing emergency admissions
2.1 This section of the report examines NHS England’s and partners’ programmes to reduce emergency admissions, and progress to date.
2.2 Providing cost-effective alternatives to reducing demand for emergency admissions needs input across the health and social care system. Actions to reduce emergency admissions can occur at all stages of a person’s care, depending on their needs. Interventions should aim to prevent a person becoming so unwell that they need emergency care, as well as stopping people being admitted as an emergency when they can receive appropriate care in the community. Figure 7 shows the ranges of interventions typically used.
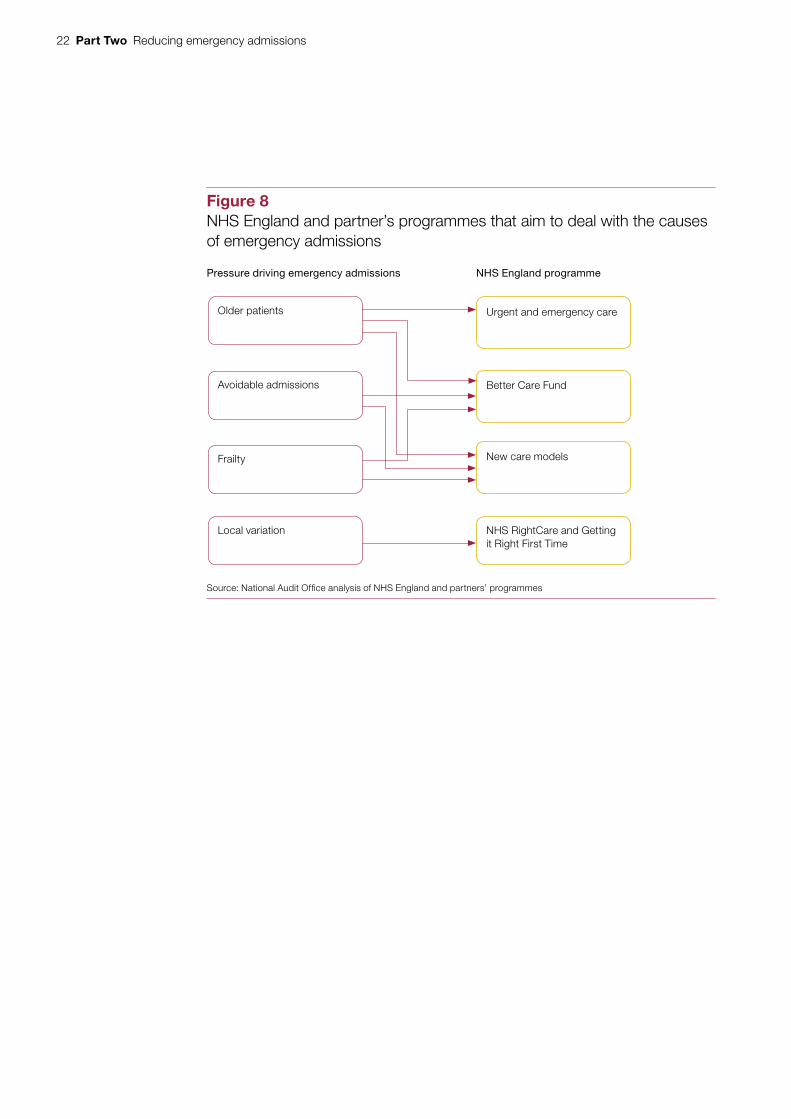
2.3 To meet its mandate to achieve a measurable reduction in emergency admissions by 2020, NHS England, with its partners, has developed a number of national programmes and interventions which aim to reduce emergency admissions. These programmes aim to integrate health and social care, improve access to primary care, improve the performance of accident and emergency (A&E) departments, including by providing daycase emergency care (ambulatory care), and improve out of hospital care. They all have additional objectives to reduce emergency admissions. We examine below (paragraphs 2.10 to 2.17) the national programmes’ contribution to the goal of reducing emergency admissions. Figure 8 on page 22 outlines how they seek to address the root causes of and pressures driving increased emergency admissions.
2.4 The main national programmes are:
• urgent and emergency care programme;
• the Better Care Fund;
• new care models; and
• NHS RightCare and Getting it Right First Time.

Reducing emergency admissions Part Two 21
<N
o d
ata
from
link
>
Fig
ure
7In
terv
entio
ns to
pre
vent
em
erge
ncy
adm
issi
ons
Sou
rce:
Nat
iona
l Aud
it O
ffi ce
Inte
rven
tio
ns
cut
acro
ss h
ealt
h, s
oci
al a
nd
co
mm
un
ity
care
‘Hea
r an
d tr
eat’
and
‘see
and
trea
t’ se
rvic
es to
pre
vent
the
need
for
an a
mbu
lanc
e or
con
veya
nce
to h
ospi
tal
So
cial
car
e
A&
E a
nd
o
utp
atie
nts
H A&E
Am
bu
lan
ce s
ervi
ces
Info
rmat
ion
Pri
mar
y ca
re
Sel
f‑ca
re
Co
mm
unit
y ca
re
GP
s ba
sed
in A
&E
Frai
lty u
nits
: mul
ti-di
scip
linar
y te
ams
that
ass
ess
and
trea
t old
er p
eopl
e’s
need
s at
an
early
sta
ge
Day
case
em
erge
ncy
care
(am
bula
tory
): di
agno
sis,
ob
serv
atio
n, tr
eatm
ent a
nd r
ehab
ilita
tion
of
patie
nts
not p
rovi
ded
with
in th
e tr
aditi
onal
ho
spita
l bed
bas
e or
with
in th
e tr
aditi
onal
ou
tpat
ient
ser
vice
s
GP
s id
entif
y pe
ople
at r
isk
of a
n em
erge
ncy
adm
issi
on
Impr
oved
acc
ess
to G
Ps
Urg
ent t
reat
men
t cen
tres
Exp
ande
d G
P p
ract
ices
pro
vidi
ng m
ulti-
disc
iplin
ary
care
in th
e co
mm
unity
Vacc
inat
ion
and
publ
ic h
ealth
ser
vice
s
Clin
ical
sup
port
for
care
hom
es
Hom
ecar
e
Re-
able
men
t: A
sses
smen
t and
sup
port
pro
vide
d to
peo
ple
in th
eir h
ome
(or c
are
hom
e)
aim
ing
to h
elp
them
rec
over
ski
lls a
nd c
onfid
ence
and
max
imis
e th
eir
inde
pend
ence
.
Sel
f-ca
re: p
atie
nts
are
help
ed to
man
age
thei
r ill
ness
.
Tele
heal
th/t
elec
are:
tech
nolo
gy to
hel
p pe
ople
mon
itor t
heir
own
heal
th
‘Ste
p-up
’: as
sess
men
t, di
agno
sis
and
trea
tmen
t pro
vide
d in
a c
omm
unity
bed
‘Cris
is/r
apid
res
pons
e’ a
sses
smen
t, di
agno
sis
and
trea
tmen
t pro
vide
d in
the
patie
nt’s
ow
n ho
me
NH
S 1
11
Loca
l aut
horit
y ca
re a
nd
supp
ort i
nfor
mat
ion
and
advi
ce s
ervi
ces
Pub
lic h
ealth
info
rmat
ion
cam
paig
ns, f
or e
xam
ple
smok
ing
cess
atio
n
22 Part Two Reducing emergency admissions
<No data from link>
Figure 8NHS England and partner’s programmes that aim to deal with the causes of emergency admissions
Older patients Urgent and emergency care
Avoidable admissions Better Care Fund
Local variation NHS RightCare and Getting it Right First Time
New care models
Source: National Audit Offi ce analysis of NHS England and partners’ programmes
Pressure driving emergency admissions NHS England programme
Frailty

Reducing emergency admissions Part Two 23
The urgent and emergency care programme
2.5 NHS England’s Next Steps on the NHS Five Year Forward View (March 2017) noted that A&E departments are struggling to cope with increasing demand for their services. It outlined the seven priorities for transforming the urgent and emergency care system that have formed the work-strands of the urgent and emergency care programme. This programme aims to improve urgent and emergency care and ease the pressure on the emergency system, including by reducing emergency admissions. These work-strands and priorities are:
• NHS 111 online providing online triage;
• NHS 111 calls with increased clinical input into calls, and dedicated care home call lines staffed by GPs;
• ambulances having more clinically focused responses;
• hospitals to stream people away from A&E to other forms of treatment where appropriate and promote good practice in hospital management;
• hospitals‑to‑home work with key partners to bring about timely discharge and prevent admission through improved assessments undertaken in the right setting;
• GP access providing access to evening and weekend appointments; and
• urgent treatment centres to provide alternative diagnostic facilities and treatment to A&E.
2.6 The GP access work-strand has since moved to the Primary Care Oversight Group but regional teams still report progress to the urgent and emergency care programme. The urgent and emergency care programme is run by a joint NHS England and NHS Improvement team, and supported by their regional offices. At the local level, NHS England expects sustainability and transformation partnerships to coordinate activity and A&E delivery boards to deliver the programme’s work-strands. Local authorities are represented on A&E delivery boards and in sustainability and transformation partnerships.

24 Part Two Reducing emergency admissions
The Better Care Fund
2.7 In April 2015, the then Department of Health, the then Department for Communities and Local Government, NHS England and the Local Government Association launched the Better Care Fund. The Better Care Fund requires local health bodies and local authorities in each health and wellbeing board area to pool funding, a minimum of £3.8 billion in 2015-16 and £3.9 billion in 2016-17 across England. Local bodies must produce joint plans for integrating health and social care services and reducing pressure on hospitals, and agree targets against a set of national performance metrics, including reducing emergency admissions. In 2015-16 and 2016-17, local areas voluntarily pooled more than the minimum required, taking the total to £5.3 billion and £5.9 billion respectively. The Spending Review and Autumn Statement 2015 announced new money for the Better Care Fund (the improved Better Care Fund) of £105 million for 2017-18, £825 million for 2018-19 and £1.5 billion for 2019-20. The Spring Budget 2017 subsequently increased this to £1.115 billion for 2017-18, £1.499 billion for 2018-19 and £1.837 billion for 2019-20. This money is to fund social care packages to be used for:
• meeting adult social care needs;
• reducing pressures on the NHS, including supporting more people to be discharged from hospital when they are ready; and
• ensuring that the local social care provider market is supported.
New care models
2.8 NHS England’s Five Year Forward View (October 2014) sets out plans to develop seven new care models that integrate services around the patient. NHS England is testing the new care models through 50 ‘vanguard’ sites. These are locally created health and care partnerships, comprising hospitals, clinical commissioning groups, GPs, care homes and others. Of particular relevance to reducing emergency admissions are:
• multispecialty community providers (14 sites): expanding GP practices; bringing in nurses, community health services and hospital specialists to provide integrated out-of-hospital care, shifting the majority of consultations and ambulatory care out of hospitals;
• primary and acute care systems (nine sites): hospital and primary care providers come together to provide NHS list-based GP and hospital services, together with mental health and community care services;
• urgent and emergency care (eight sites): urgent and emergency care services are redesigned to provide better integration between accident and emergency departments, GP out-of-hours services, urgent care centres, and other services. These were part of the urgent and emergency care programme but in March 2017 became part of the business as usual management of regional teams; and

Reducing emergency admissions Part Two 25
• enhanced health in care homes (six sites): care homes and local authority social services departments work together to develop new shared care models and support. This covers medical and medication reviews and rehabilitation services.
NHS RightCare and Getting it Right First Time
2.9 NHS RightCare and Getting it Right First Time are NHS England programmes that aim to help local areas understand how their performance compares with other similar areas. NHS RightCare provides data, tools and analytical support to commissioners at clinical commissioning group and sustainability and transformation partnership level. Getting it Right First Time is a national programme designed to improve medical care within the NHS providers by highlighting unwarranted variations. It aims to tackle variations in the way services are delivered across the NHS, and share best practice between trusts. It has a number of workstreams based on clinical specialities, including emergency medicine.
Progress in reducing emergency admissions
2.10 The Department of Health & Social Care (the Department) and its arm’s-length bodies have an internal ambition of 1.5% to reduce growth in demand for elective and emergency admissions. This ambition is not part of NHS England’s mandate. However, only two of the three programmes have specific targets to reduce emergency admissions. There is limited evidence to show that NHS England’s programmes have been effective in reducing emergency admissions. While there are positive trends in more people not staying overnight, it is not clear how much of this is linked to the urgent and emergency care programme. In particular, given that most of this work focuses on providing alternatives to A&E rather than improving care within A&E.
Urgent and emergency care programme
2.11 It is too early to identify the impact of the urgent and emergency care programme on reducing emergency admissions. The seven work-strands within it have multiple milestones with overall delivery by the end of 2018-19. There have been some successes: for example, by September 2017, 122 trusts with a major A&E department had front-door clinical streaming services in place.6 NHS England is currently unable to demonstrate that interventions now in place have led to the slight slow down in growth in emergency admissions seen in 2016-17; further work is underway by NHS England and NHS Improvement to evaluate interventions. The urgent and emergency care programme has not specified a target for trusts to reduce emergency admissions.
6 A major (Type 1) A&E department is a consultant-led 24-hour service with full resuscitation facilities and designated accommodation for A&E patients.
26 Part Two Reducing emergency admissions
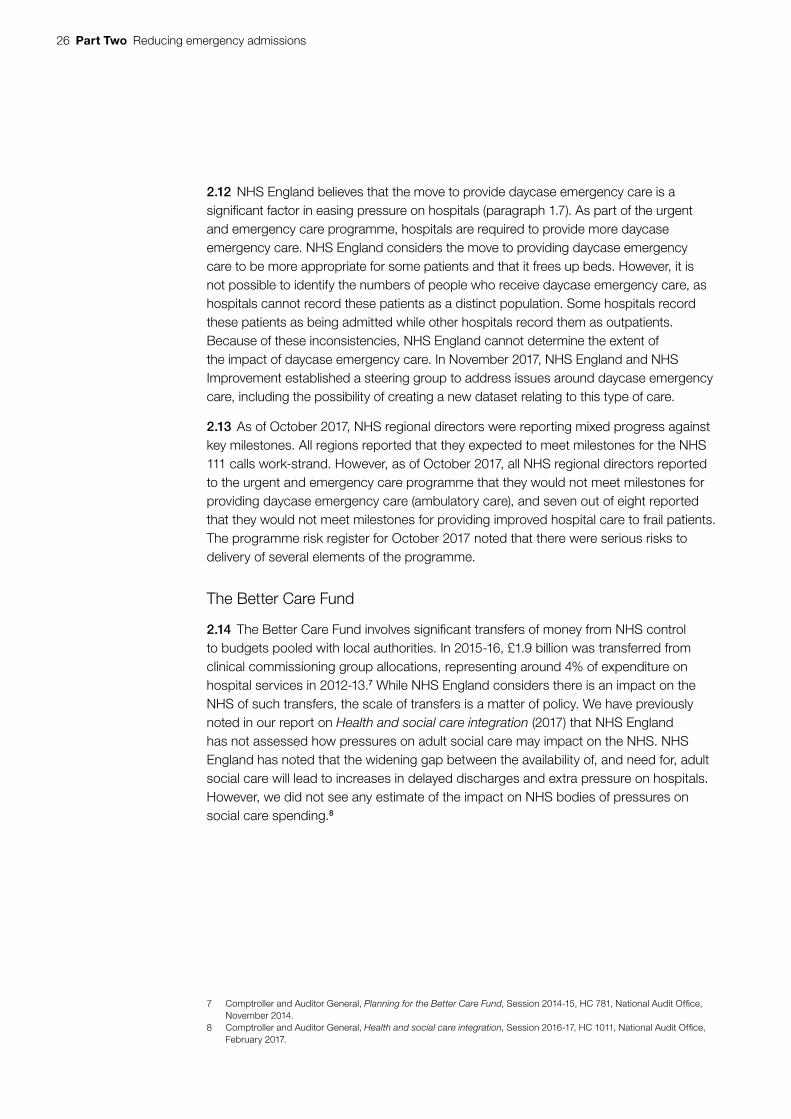
2.12 NHS England believes that the move to provide daycase emergency care is a significant factor in easing pressure on hospitals (paragraph 1.7). As part of the urgent and emergency care programme, hospitals are required to provide more daycase emergency care. NHS England considers the move to providing daycase emergency care to be more appropriate for some patients and that it frees up beds. However, it is not possible to identify the numbers of people who receive daycase emergency care, as hospitals cannot record these patients as a distinct population. Some hospitals record these patients as being admitted while other hospitals record them as outpatients. Because of these inconsistencies, NHS England cannot determine the extent of the impact of daycase emergency care. In November 2017, NHS England and NHS Improvement established a steering group to address issues around daycase emergency care, including the possibility of creating a new dataset relating to this type of care.
2.13 As of October 2017, NHS regional directors were reporting mixed progress against key milestones. All regions reported that they expected to meet milestones for the NHS 111 calls work-strand. However, as of October 2017, all NHS regional directors reported to the urgent and emergency care programme that they would not meet milestones for providing daycase emergency care (ambulatory care), and seven out of eight reported that they would not meet milestones for providing improved hospital care to frail patients. The programme risk register for October 2017 noted that there were serious risks to delivery of several elements of the programme.
The Better Care Fund
2.14 The Better Care Fund involves significant transfers of money from NHS control to budgets pooled with local authorities. In 2015-16, £1.9 billion was transferred from clinical commissioning group allocations, representing around 4% of expenditure on hospital services in 2012-13.7 While NHS England considers there is an impact on the NHS of such transfers, the scale of transfers is a matter of policy. We have previously noted in our report on Health and social care integration (2017) that NHS England has not assessed how pressures on adult social care may impact on the NHS. NHS England has noted that the widening gap between the availability of, and need for, adult social care will lead to increases in delayed discharges and extra pressure on hospitals. However, we did not see any estimate of the impact on NHS bodies of pressures on social care spending.8
7 Comptroller and Auditor General, Planning for the Better Care Fund, Session 2014-15, HC 781, National Audit Office, November 2014.
8 Comptroller and Auditor General, Health and social care integration, Session 2016-17, HC 1011, National Audit Office, February 2017.
Reducing emergency admissions Part Two 27
2.15 The Better Care Fund is showing limited progress in terms of reducing emergency admissions through more integrated health and social care services. Local health teams, with local authorities, set their own targets for reducing emergency admissions, based on targets in clinical commissioning groups’ operational plans. The majority of areas have not met their Better Care Fund metrics for reducing emergency admissions. Data for 2016-17 show 32% of local areas reporting they had met their metric to reduce emergency admissions for 2016-17. Across our case study visits we found local areas welcomed the additional resources from the improved Better Care Fund, but some found the restriction on its use meant they could not spend it in they way they wanted to help reduce emergency admissions.
New care models
2.16 NHS England has set the new care models clear targets for reducing emergency admissions based on slower increases in emergency admissions than other areas in the rest of England against a baseline year. NHS England’s analysis of results from two of the new care models is showing positive results (Figure 9 overleaf). Comparing the year to quarter one 2017-18 with the base year, quarter three 2014-15 to quarter two 2015-16, there is considerable variability in performance, with results ranging from a reduction of emergency admissions of 7.4% to increases of 11.4% for multi-speciality community providers and reductions of 6.8% and increases of 13.1% for primary and acute care systems. NHS England’s analysis of the new care models concluded that these early outcome indicators of small local programmes are not yet evidence of sustainable change. NHS England is routinely monitoring performance of the enhanced health in care homes vanguards but the data is difficult to interpret as there only six of them. While the evidence is positive, NHS England considers it will be difficult to isolate the elements causing the positive results. Individual reports show some positive results, for example, the Newcastle Gateshead vanguard has reported a 4.5% reduction in emergency admissions.
2.17 NHS England will stop the programme to develop new care models across England in March 2018, as planned. The Department’s mandate for NHS England required new care models to be providing care to 20% of the population by 2017-18 and to be providing care to 50% of the population of England by 2020. As of September 2017, they provided care to approximately 9.5% of the population. NHS England intends that areas will move towards care systems similar to the new care models but without additional funding. NHS England and NHS Improvement approved eight local areas to become accountable (now integrated) care systems, and a further two to become devolved health and social care systems. These will be given more autonomy over how they spend their resources and manage their own performance.

28 Part Two Reducing emergency admissions
Figure XX Shows...
Figure 9Growth in emergency admissions for new care models and the rest of England, the year to quarter one 2017-18 compared to the base year, quarter three 2014-15 to quarter two 2015-16
Growth in emergency admissions is slower in two types of vanguards compared withthe rest of England
Growth inemergencyadmissions
(%)
Target growth in emergency admissions
(%)
Primary andacute care systems
1.2 1.1
Multi-specialitycommunity providers
2.3 3.1
Rest of England 3.9 n/a
Note
1 Target growth rate equates to a growth rate of 0.8% or lower for primary and acute care systems and2.8% or lower for multi-speciality community providers compared to the rest of England base year,the year to September 2015.
Source: NHS England
Reducing emergency admissions Part Three 29
Part Three
Challenges in reducing emergency admissions
3.1 This section of the report examines the challenges to reducing emergency admissions, including other pressures on hospitals such as bed availability, bed occupancy rates, readmission rates, the capacity for community and social care, accountability and data limits.
Other pressures on hospitals
Bed availability
3.2 Bed closures are another pressure on the hospital system. NHS England statistics show that from 2010-11 to 2016-17, the average number of available general and acute beds has fallen by 6,268 beds (5.8%) (Figure 10 overleaf). Our previous work has found that bed occupancy above 85% can lead to regular bed shortages, periodic bed crises and increased numbers of hospital-acquired infections.9 Bed occupancy has been increasing since at least 2010-11, reaching a seasonal peak of 91.4% in the fourth quarter of 2016-17. In July 2017, NHS England and NHS Improvement recommended that bed occupancy should remain below 92%. In January 2018, NHS England and NHS Improvement’s National Emergency Pressures Panel recommended trusts defer their elective activity for January, in light of pressures on emergency care. NHS England expects to publish data on the level of activity that was affected in March 2018.
Readmission rates
3.3 Readmission rates can indicate the success of the NHS in helping people to recover effectively from illnesses or injuries. Readmissions can occur for a number of reasons and are not always preventable, but can serve as a warning indicator that local practices may not be providing the required quality of acute care and discharge planning, particularly when readmissions are increasing. NHS Digital no longer reports readmissions.
9 Comptroller and Auditor General, Emergency admissions to hospital: managing the demand, Session 2013-14, HC 739, National Audit Office, October 2013.

30 Part Three Reducing emergency admissions
Line chart 175mm template
3.4 A report by Healthwatch England in October 2017 on data from 72 trusts estimated the level of emergency readmissions to have risen by 22.8% between 2012-13 and 2016-17. Over the same period we calculate overall emergency admissions rose by 10.2%. Healthwatch England also found that increased numbers of people were being readmitted quickly after their initial discharge from hospital. The number of readmissions within 48 hours of discharge has risen by 27%, from 77,927 to 98,955 from 2012-13 to 2016-17. While there are some issues about the reliability and consistency of the data collected by Healthwatch England, the reported rate of growth raises questions about the appropriateness of some decisions to discharge and/or the support provided to help people recuperate.10
Interventions in the wider care systems
3.5 There are other interventions in community and social care that can help to reduce emergency admissions. These interventions include:
• intermediate care;
• identification of people at risk of an emergency admission and frailty; and
• public health.
10 Healthwatch England, What do the numbers say about emergency readmissions to hospital?, October 2017. Healthwatch England used data it obtained from 72 trusts, however they note that the data has some caveats in that trusts have not all shared the same data, nor had they shared it in the same way. For example, some have included information about readmissions from departments such as maternity and oncology and others have not.
Figure 10Change in the availability and occupancy of general and acute beds for hospitals in England 2010-11 to 2016-17
Available beds and average bed occupancy (indexed: 2010-11 = 100)
Available general and acute beds 100 97.0 96.1 96.0 96.0 94.5 94.2
Average general and acute bed occupancy 100 99.8 101.1 101.1 102.2 102.1 103.7
Note
1 Data include the number of available and occupied general and acute beds open overnight that are under the care of consultants.
Source: National Audit Office analysis of NHS England’s statistics
Growing bed occupancy and falling numbers of available beds is putting pressure on hospitals
2010-11 2011-12 2012-13 2013-14 2014-15 2015-16 2016-17
88
90
92
94
96
98
100
102
104
106
Reducing emergency admissions Part Three 31
3.6 There are challenges with all these interventions which currently limit their effectiveness in reducing emergency admissions.
Capacity in intermediate care
3.7 Intermediate care is a range of integrated services outside of hospitals that promote faster recovery from illness and maximise independent living, typically for older people living with frailty and high levels of need. It helps prevent people being admitted into hospital, and helps them get out of hospital. Intermediate care services can be commissioned by either local authorities or clinical commissioning groups and are typically provided by hospitals, community care providers or local authority social services. The National institute for Health and Care Excellence recommends that people should be assessed for intermediate care if they are at risk of hospital admission or have been in hospital and need help to regain independence.11
3.8 Our report on Sustainability and transformation in the NHS (2018) found that while developing preventative services was a strong feature of all the plans examined, most sustainability and transformation partnerships visited noted that they had made insufficient progress so far. Their need to make short-term immediate savings meant they were often overlooking investment in preventative services. The report noted that the NHS and local partnerships will need to find effective ways of managing demand for services or delivering services at a lower cost, or both. Without these, the NHS will have to make difficult choices about which services it can and cannot afford.12
3.9 The NHS records the numbers of people who attend accident and emergency departments (A&E) who have conditions where NHS England considers that effective community care and case management could help avoid an emergency admission (these conditions are called ‘ambulatory care sensitive conditions’). Our analysis shows that there has been a 14% increase in such admissions between 2013-14 and 2016-17 (Figure 6). In 2016-17 patients with such conditions formed 24% of all emergency admissions. In October 2017, the Department noted that there was not then a clear plan for how the £10 billion it estimated was spent on community health care could be better used to manage current and future demand and that NHS England’s proposals for programmes to focus on community care had stalled. Since then, NHS England and NHS Improvement have set up a project to develop community services to support the Five Year Forward View. The Department and NHS England told us that they believe by integrating care and bringing services together through new models of care they can prevent unnecessary admissions. The Department and NHS England consider that while community health services are important to reducing demand, they are part of a larger drive by the Department and NHS England to try to bring coherency across patient services.
11 National Institute for Health and Care Excellence, NICE guideline: Intermediate care including reablement, September 201712 Comptroller and Auditor General, Sustainability and transformation in the NHS, Session 2017–2019, HC 719,
National Audit Office, January 2018.
32 Part Three Reducing emergency admissions
Figure XX Shows...
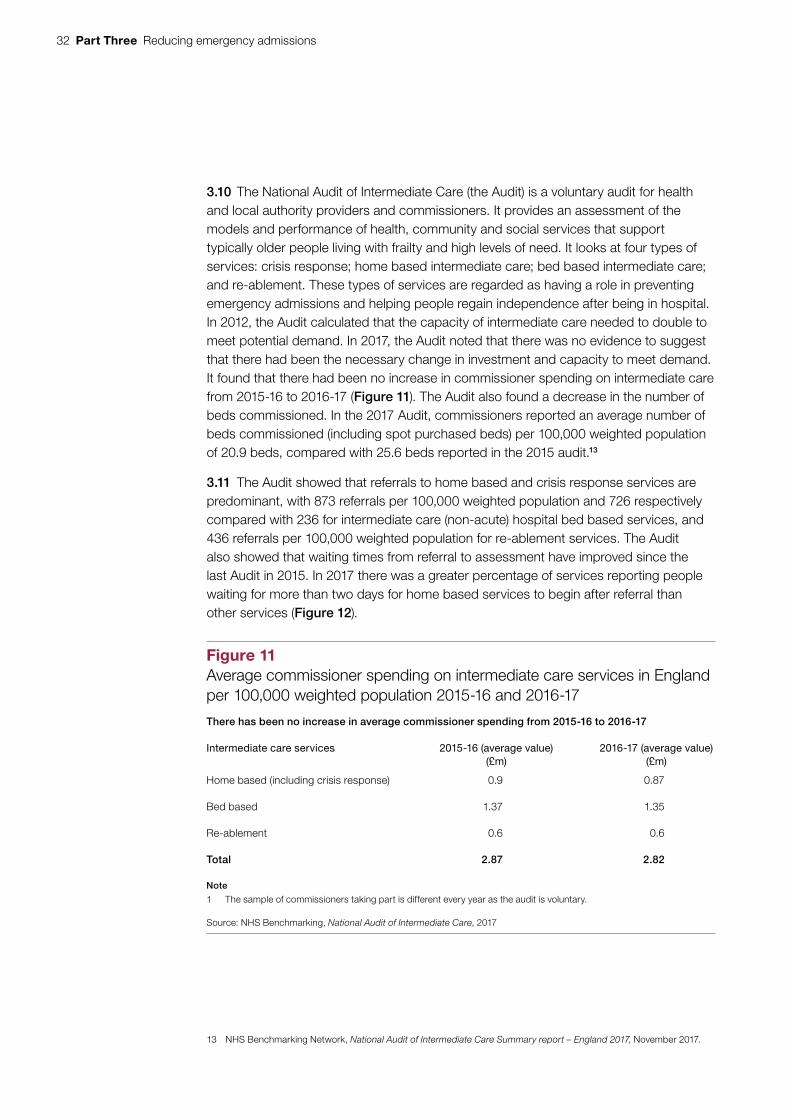
3.10 The National Audit of Intermediate Care (the Audit) is a voluntary audit for health and local authority providers and commissioners. It provides an assessment of the models and performance of health, community and social services that support typically older people living with frailty and high levels of need. It looks at four types of services: crisis response; home based intermediate care; bed based intermediate care; and re-ablement. These types of services are regarded as having a role in preventing emergency admissions and helping people regain independence after being in hospital. In 2012, the Audit calculated that the capacity of intermediate care needed to double to meet potential demand. In 2017, the Audit noted that there was no evidence to suggest that there had been the necessary change in investment and capacity to meet demand. It found that there had been no increase in commissioner spending on intermediate care from 2015-16 to 2016-17 (Figure 11). The Audit also found a decrease in the number of beds commissioned. In the 2017 Audit, commissioners reported an average number of beds commissioned (including spot purchased beds) per 100,000 weighted population of 20.9 beds, compared with 25.6 beds reported in the 2015 audit.13
3.11 The Audit showed that referrals to home based and crisis response services are predominant, with 873 referrals per 100,000 weighted population and 726 respectively compared with 236 for intermediate care (non-acute) hospital bed based services, and 436 referrals per 100,000 weighted population for re-ablement services. The Audit also showed that waiting times from referral to assessment have improved since the last Audit in 2015. In 2017 there was a greater percentage of services reporting people waiting for more than two days for home based services to begin after referral than other services (Figure 12).
13 NHS Benchmarking Network, National Audit of Intermediate Care Summary report – England 2017, November 2017.
Figure 11Average commissioner spending on intermediate care services in England per 100,000 weighted population 2015-16 and 2016-17
There has been no increase in average commissioner spending from 2015‑16 to 2016‑17
Intermediate care services 2015-16 (average value)(£m)
2016-17 (average value)(£m)
Home based (including crisis response) 0.9 0.87
Bed based 1.37 1.35
Re-ablement 0.6 0.6
Total 2.87 2.82
Note
1 The sample of commissioners taking part is different every year as the audit is voluntary.
Source: NHS Benchmarking, National Audit of Intermediate Care, 2017

Reducing emergency admissions Part Three 33
Figure XX Shows...
3.12 We analysed data from the Audit to identify if there was any observable relationship between spending on intermediate care and the number of emergency admissions in a clinical commissioning group area. Our analysis took account of differences in population, demographics, health needs, deprivation and local costs. We were unable to find a relationship between spending on intermediate care and levels of emergency admissions. In order to further explore the existence of a relationship or lack of relationship, we would need to be able to analyse the change over time in spend on intermediate care and the number of emergency admissions for clinical commissioning groups participating in the Audit. However, such data were not available to us during our fieldwork. It is important to note, however, that spending on the admission avoidance function of intermediate care currently represents only a very small part of a commissioner’s spend on emergency care and is therefore likely to have limited influence on emergency admission numbers.
Identification of people at risk of an emergency admission and frailty
3.13 NHS England is working to identify people who may be at risk of an emergency admission and frailty. Our analysis shows a larger rise in emergency admissions for people at risk of frailty than for people aged 65 and over (paragraph 1.13 and Figure 6). Between 2013-14 and 2016-17 NHS England provided additional funding to GPs to incentivise them to identify and manage a minimum of the top 2% of patients identified as seriously ill or at risk of emergency hospital admission. From 2017-18, GPs are now required to identify people aged 65 and over who may be living with moderate or severe frailty as they are most likely to be admitted to hospital. GP contract services data show that by quarter three of 2017-18, 295,180 people had been diagnosed with severe frailty (3% of people aged 65 and over) and 569,828 (6% of people aged 65 and over) with moderate frailty.14 There are a number of frailty indices that can help with identification.
14 NHS Digital, GMS PMS core contract data collection quarter 3 2017-18, November 2017
Figure 12Waiting times for intermediate care services in England 2017
A greater percentage of services report people wait for more than two days for home basedservices to begin after referral than bed based and re‑ablement services
Type of service Percentage of services reporting more than halfof people are waiting for
more than two days(%)
Percentage of servicesreporting no one is waiting
more than two days
(%)
Home based 33 16
Bed based 13 26
Re-ablement 28 25
Source: NHS Benchmarking, National Audit of Intermediate Care, 2017
34 Part Three Reducing emergency admissions
3.14 There are limits to NHS England’s current approach to frailty identification as it only focuses on people with the most severe type of frailty. GPs must undertake a clinical review for people assessed as having severe frailty but not those with moderate frailty, even though NHS England estimates that 12% of people aged between 65 to 95 years old have moderate frailty compared with 3% with severe frailty. As part of its evaluation of five new care models, NHS England noted that identification of ‘at risk’ patients formed a core part of the models. Its review found the five vanguard sites were focusing on the highest risk strata of the population, which was likely to limit its overall potential impact as NHS England calculated the majority of emergency admissions occur in the top 20%, not the top 2% of patients at risk.
Public health
3.15 Public health interventions can help with managing seasonal peaks in emergency admissions, particularly during winter with flu vaccination campaigns and promoting good hygiene during outbreaks of bugs such as norovirus. Around 900,000 more people were vaccinated against flu between 1 September and 31 December 2017 compared with the same period in the previous year.15 NHS England is responsible for vaccinations and local authorities are responsible for wider public health, which can also play a longer-term role in promoting good health and wellbeing through screening programmes. The benefits of these will only be seen in the long term. The public health grant paid to local authorities is £3.3 billion for 2017-18 but is set to be cut in real terms by around 4% a year from 2016-17 to 2020-21.
Governance and accountability
3.16 The demand board – co-chaired by the Department and NHS England – provides senior oversight of management of demand across the health system, including emergency admissions. The National Urgent and Emergency Care Director is a joint appointment between NHS England and NHS Improvement, aimed at ‘joining up’ the NHS response to emergency admissions.
Engagement with stakeholders
3.17 Reducing emergency admissions requires action across the health and social care systems, rather than a focus on activity in A&E departments alone. Therefore, engagement with key stakeholders in reducing emergency admissions is vital to success. NHS England recognises the importance of this engagement, and its efforts to reduce emergency admissions involve the Department, NHS England, NHS Improvement, sustainability and transformation partnerships, local authorities, acute hospital trusts and clinical commissioning groups.
15 Public Health England, Seasonal influenza vaccine uptake amongst GP patients in England: Provisional monthly data for 1 September 2017 to 31 December 2017.

Reducing emergency admissions Part Three 35
3.18 Engagement with local authorities can be challenging as local authorities are not part of the Department’s and NHS England’s chain of accountability as they are locally elected, and may have different local priorities to NHS England. In our previous reports, we have noted the limited levers NHS England has to influence local authorities.16
3.19 The Department and NHS England expect sustainability and transformation partnerships and accountable (now integrated) care systems will increasingly lead to more effective joint working between the health and social care sectors. Engagement with local authorities is patchy, but in our case study visits we saw it improving slowly through the work on sustainability and transformation partnerships and the new accountable (now integrated) care systems, with some local areas reporting good relationships.
3.20 Local areas have also reported improved integration through the Better Care Fund. Our report on Health and social care integration in 2017 found that 90% of local areas that agreed or strongly agreed that the delivery of Better Care Fund plans had a positive impact on integration locally.17 The Department and NHS England consider that the more direct setting of targets by the Department and the Ministry of Housing, Communities & Local Government for local authorities to reduce delayed transfers of care under the improved Better Care Fund has been a success. The Department and NHS England consider that this success is evidenced by the total number of beds being used for delayed transfers of care falling 1,972 from 6,660 in February 2017 to 4,688 in December 2017. However, the Local Government Association withdrew its support for national guidance of the Better Care Fund in July 2017 in response to a late change to the planning requirements that introduced centrally-set expectations that reducing delayed transfers of care, and announcements that funding for social care through the improved Better Care Fund grant would be reviewed for 2018-19 in areas considered to be poorly performing in terms of meeting targets for reducing delayed transfers of care.
3.21 It is difficult to get a comprehensive picture of local authority engagement with programmes to reduce emergency admissions, beyond the mandatory Better Care Fund, but the available evidence suggests that it is limited by financial pressures. The Local Government Association and the Association of Directors of Adult Social Services are represented on the urgent and emergency care programme board at national level. They have discussed the financial pressures and the approach to setting the targets as constraints impacting on the ability of local authorities to support the NHS to reduce emergency admissions. However, the Local Government Association has told us that the local authorities they work with are engaged in initiatives to reduce emergency admissions.
16 Comptroller and Auditor General, Local support to people with a learning disability, Session 2016-17, HC 1053, National Audit Office, March 2017.
17 Comptroller and Auditor General, Health and social care integration, Session 2016-17, HC 1011 National Audit Office, February 2017.

36 Part Three Reducing emergency admissions
3.22 The National Audit of Intermediate Care 2017 found some indications of increased joint working between clinical commissioning groups and local authorities when providing preventive care. Of commissioners who participated in the 2017 Audit, 86% noted that ‘multi-agency boards’ were in place, increasing from 68% in 2015. Participants also noted that strategic planning was being undertaken jointly by health and local government in 95% of commissioners. However, only 42% of respondents reported that they had a joint lead
commissioner for all intermediate care services.18
Local variation
3.23 There is considerable regional variation in the rates of emergency admissions, which may be due to a number of factors including demographics, health needs and variations in local management of emergency admissions. Emergency admissions are strongly associated with levels of deprivation in the surrounding area. In 2016-17, the rate of emergency admissions in the most deprived 10% of areas was 73% higher than the least deprived 10%.
3.24 We have stripped out the impact of a local area’s demographics, health needs, deprivation and local costs on emergency admissions to get a better picture of system performance at the level of clinical commissioning groups (Figure 13). This shows considerable regional variation in the rates of emergency admissions at the clinical commissioning group level (73 to 155 admissions per 1,000 weighted GP registered population).19 The Department, NHS England and NHS Improvement do not know what causes all of these local variations and therefore cannot identity the extent to which they are caused by local health and social care practices which lead to better management of emergency admissions, or other factors. They have not determined what scale of emergency admissions is appropriate. The NHS RightCare programme is an NHS England-supported programme designed to help local health teams improve their delivery of health care and reduce variation in the performance of health provision across different areas. The programme offers resources to help local areas understand how their local health system and performance varies from that of similar areas to help them address variations in healthcare provision.
3.25 There is also regional variation in trends in increases in emergency admissions per GP registered population ranging from -0.2% to 16.2% (NHS area teams) between 2013-14 and 2016-17 (Figure 14 on page 38). The Department and NHS England are unable to explain why only Greater Manchester shows an overall decrease in emergency admissions at area team level. There is also considerable variation at the clinical commissioning group level (-19.5% to 40.25% per GP registered population between 2013-14 and 2016-17) (Figure 15 on page 39). Because of methodological changes over time we were unable to strip out the impact of a local area’s demographics, health needs, deprivation and local costs on emergency admissions in our analysis of trends over time.
18 NHS Benchmarking Network, National Audit of Intermediate Care Summary report – England 2017, November 2017.19 Between 84 and 117 at the 10th and 90th percentile. An unknown amount of the variation will be due to changes
in data coding practices.
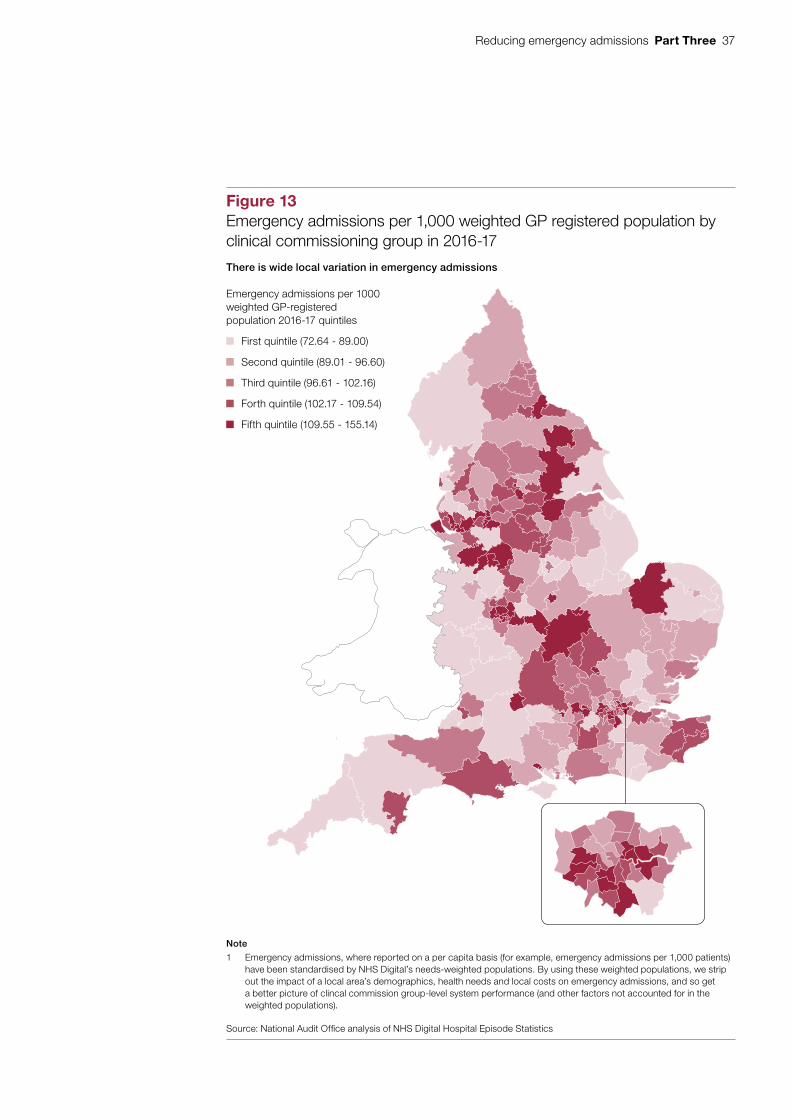
Reducing emergency admissions Part Three 37
Figure x shows...
Figure 13Emergency admissions per 1,000 weighted GP registered population by clinical commissioning group in 2016-17
There is wide local variation in emergency admissions
Note
1 Emergency admissions, where reported on a per capita basis (for example, emergency admissions per 1,000 patients) have been standardised by NHS Digital’s needs-weighted populations. By using these weighted populations, we strip out the impact of a local area’s demographics, health needs and local costs on emergency admissions, and so get a better picture of clincal commission group-level system performance (and other factors not accounted for in the weighted populations).
Source: National Audit Offi ce analysis of NHS Digital Hospital Episode Statistics
Emergency admissions per 1000 weighted GP-registered population 2016-17 quintiles
First quintile (72.64 - 89.00)
Second quintile (89.01 - 96.60)
Third quintile (96.61 - 102.16)
Forth quintile (102.17 - 109.54)
Fifth quintile (109.55 - 155.14)
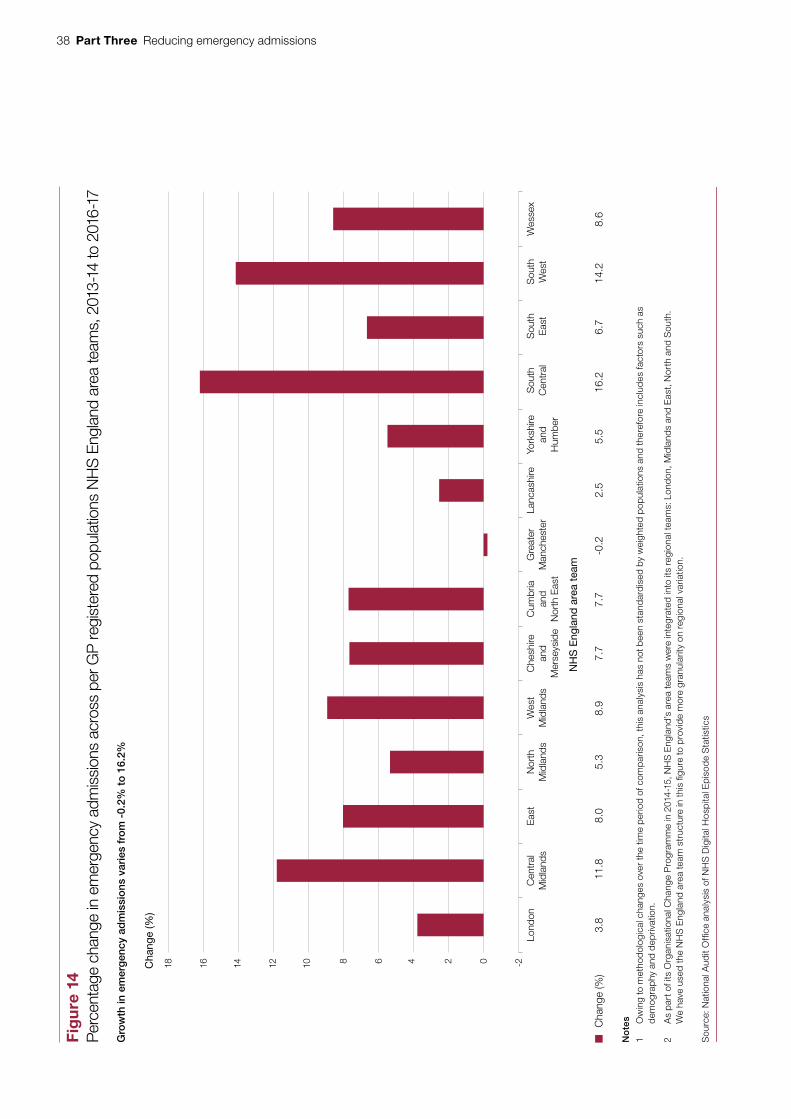
38 Part Three Reducing emergency admissionsfig
ure_
stac
ked
_bar
_135
mm
Fig
ure
14
Per
cent
age
chan
ge in
em
erge
ncy
adm
issi
ons
acro
ss p
er G
P re
gist
ered
pop
ulat
ions
NH
S E
ngla
nd a
rea
team
s, 2
013-
14 to
201
6-17
Cha
nge
(%)
Gro
wth
in e
mer
gen
cy a
dm
issi
ons
var
ies
fro
m -
0.2%
to
16.
2%
Lond
onC
entr
alM
idla
nds
Nor
thM
idla
nds
Wes
tM
idla
nds
Che
shire
an
d M
erse
ysid
e
Cum
bria
an
d N
orth
Eas
t
Gre
ater
M
anch
este
rLa
ncas
hire
York
shire
an
d H
umbe
r
Sou
th
Cen
tral
Sou
thE
ast
Sou
thW
est
Wes
sex
Eas
t-2681012141618 024
C
hang
e (%
) 3.
8 11
.8
8.0
5.3
8.9
7.7
7.7
-0.2
2.
5 5.
5 16
.2
6.7
14.2
8.
6
No
tes
1 O
win
g to
met
hod
olog
ical
cha
nges
ove
r th
e tim
e p
erio
d of
com
par
ison
, thi
s an
alys
is h
as n
ot b
een
stan
dar
dis
ed b
y w
eigh
ted
pop
ulat
ions
and
ther
efor
e in
clud
es fa
ctor
s su
ch a
s d
emog
rap
hy a
nd d
epriv
atio
n.
2 A
s pa
rt o
f its
Org
anis
atio
nal C
hang
e P
rogr
amm
e in
201
4-15
, NH
S E
ngla
nd’s
are
a te
ams
wer
e in
tegr
ated
into
its
regi
onal
team
s: L
ondo
n, M
idla
nds
and
Eas
t, N
orth
and
Sou
th.
We
have
use
d th
e N
HS
Eng
land
are
a te
am s
truc
ture
in t
his
figur
e to
pro
vid
e m
ore
gran
ular
ity o
n re
gion
al v
aria
tion.
Sou
rce:
Nat
iona
l Aud
it O
ffice
ana
lysi
s of
NH
S D
igita
l Hos
pita
l Ep
isod
e S
tatis
tics
NH
S E
ngla
nd a
rea
team

Reducing emergency admissions Part Three 39
Figure x shows...
Figure 15Change in emergency admissions per GP registered population by clinical commissioning group, 2013-14 to 2016-17
There are considerable variations in the rate of change in emergency admissions
Note
1 Owing to methodological changes over the time period of comparison, this map has not been standardised by weighted populations and therefore includes factors such as demography and deprivation.
Source: National Audit Offi ce analysis of NHS Digital Hospital Episode Statistics
% change in emergency admissions per GP-registered population, 2013-14 to 2016-17 quintiles
First quintile (-19.52% to -0.94%)
Second quintile (-0.93% to 4.14%)
Third quintile (4.15% to 9.41%)
Forth quintile (9.42% to 15.07%)
Fifth quintile (15.08% to 40.25%)

40 Part Three Reducing emergency admissions
Evidence base for interventions
3.26 Our previous reports have emphasised the need for robust evidence on what works. Interventions in the programmes to reduce emergency admissions are not always based on evidence of what works, which makes it difficult for NHS England and partners to target efforts on action that will give the biggest impact. Our report Health and social care integration, found that, while there are some positive examples of integration at the local level, to date many of the Department’s attempts to integrate have not demonstrated their effectiveness.20 The inability to establish their effectiveness is mirrored in many of the interventions to reduce emergency admissions – the evidence base for these interventions is mixed, and in some cases poor. There is disagreement among clinicians, other practitioners and evaluators about the efficacy of some of the interventions within the programmes. A literature review by the Nuffield Trust in 2017 found that the quality of the evidence of the effectiveness of interventions was mixed and while there was robust evidence that some interventions led to improved care, for others the evidence was poor or contradictory.21 NHS England has developed a model to help local health systems understand the impact of using the various interventions in the urgent and emergency care programme.22
3.27 The evidence base for the impact of reducing emergency admissions by increasing access to GPs is particularly contested. Increased GP access was one of the work-strands for the urgent and emergency care programme. Our 2017 report Improving patient access to general practice found that the Department and NHS England had not yet fully considered the consequences and cost-effectiveness of their commitment to extend access to general practice and it was unlikely to provide value for money.23 In 2015, an evaluation of 20 pilot schemes which increased access to GPs found limited impact on emergency admissions, although it did find a decrease in attendances to A&E. As we have reported previously, between 2014-15 and 2015-16 patients from practices with longer opening hours during the week and those opening on the weekends reported that they were, on average, less likely to see their preferred GPs. The GP patient survey shows that the percentage of patients who have a preferred GP reported seeing their preferred GP, fell from 65.3% in 2011-12 to 55.6% in 2016-17.24
20 Comptroller and Auditor General, Health and social care integration, Session 2016-17, HC 1011, National Audit Office, February 2017.
21 Nuffield Trust, Shifting the balance of care: great expectations, March 2017.22 The urgent and emergency care consolidated channel shift model.23 Comptroller and Auditor General, Improving patient access to general practice, Session 2016-17, HC 913,
National Audit Office, January 2017.24 NHS England, GP Patient Survey, July 2017. Available at: www.gp-patient.co.uk/SurveysAndReports
Reducing emergency admissions Part Three 41
3.28 In contrast, the ambulance work-strand in the urgent and emergency care programme has been evaluated and shown to bring benefits. This evaluation reviewed the first two phases of the ambulance response programme. Phase one assessed how 999 calls are triaged, and phase two assessed how calls are categorised and prioritised. Our study NHS Ambulance Services found that during 2015-16 ambulance trusts using ‘hear and treat’ and ‘see and treat’ care models avoided more than 458,000 accident and emergency attendances (11% of all journeys to accident and emergency departments), with associated savings of £63 million.25
3.29 NHS England has not identified which elements of the new care models are contributing to the positive results. NHS England is planning a four-year evaluation of the new care models, but considers that it could take five to 10 years before the programme shows results. NHS England told us that as of February 2018, local evaluations suggest population segmentation, multi-disciplinary team management, and care home interventions have contributed to reducing emergency admissions. NHS England and NHS Improvement are working to gain a better understanding of the effectiveness of other elements of the new care models. The National Institute for Health Research is evaluating the impact of initiatives in the Better Care Fund and will report in Spring 2018.
Data
3.30 There are several problems with data that restrict NHS England’s understanding of emergency admissions. The available hospital data do not always accurately record the causes of people attending A&E, the severity of their complaint, the source of referral and their diagnosis once they have been seen. In their assessment of the current A&E data set, NHS Digital and the Royal College of Emergency Medicine estimated that the data set only had records on where people come from for 5% of attendances, for example a road traffic accident. While the assessment noted that only 50% of patients had a diagnosis of their medical condition recorded, it considered that the reporting of diagnosis was often poor.
25 Comptroller and Auditor General, NHS Ambulance Services, Session 2016-17, HC 972, National Audit Office, January 2017.

42 Part Three Reducing emergency admissions
3.31 The data limitations have made it difficult for NHS England to target efforts accurately to reduce emergency admissions. In response, from October 2017, NHS England has launched a new dataset which requires major and specialist emergency departments26 to collect data on the reason for attendance, source of referral, the patient’s chief complaint, the severity of the problem and the diagnosis. This will record details including patient demographics, the source of referral, and clinical information. While this new dataset is not the complete solution to the problem, it is a significant step in the right direction and will provide information which has hitherto been missing. Healthwatch England has noted several problems with readmission data, including a lack of a shared definition of what is a readmission. It recommended improvements to help understand why people are readmitted and enable health professionals to identify people at risk of being readmitted.27 It may be possible to identify readmissions using the new emergency care data set.
3.32 There are also inconsistencies in how hospitals record patients who receive daycase emergency care. Some hospitals record these patients as an emergency admission, where others do not. There is no guidance to clarify how these patients should be recorded. The increase in people being admitted but not staying overnight could be due, in part, to these inconsistencies. This problem will not be resolved by the new data collection method. In November 2017, NHS England and NHS Improvement established a steering group to address issues around daycase emergency care, including the possibility of creating a new dataset relating to this type of care.
3.33 With no national data collection on community care yet, and an inability to link hospital activity data with primary and social care data, NHS England cannot assess the impact of out-of-hospital care on rates of emergency admissions. This means that researchers cannot track the patient as they flow through the different systems to identify the impact of various health and social care interventions on their health. Data on community care are very limited. NHS England, NHS Digital and NHS Improvement are currently working on a new community data set. Phase one is expected to be published in spring 2018, and will have details including, for example, who the person’s carer is and types of care received, medical history and accommodation. NHS England is considering the scope and requirements for phase two. The Department and NHS England consider the new dataset to be important to their understanding of how community health services are being delivered.
3.34 The inability to link data often also occurs at local level. Data do not follow the patient as they move through the health and social care system. This means that health and social care practitioners cannot easily access details about patients’ care across the system. NHS England told us that it has plans to launch an initiative to pilot an approach to linking care records at local level.
26 A major (type 1) A&E department is a consultant-led 24 hour service with full resuscitation facilities and designated accommodation for A&E patients. A specialist (type 2) A&E department is a consultant-led single speciality accident and emergency service with designated accommodation for the reception of patients.
27 Healthwatch England, ‘What do the numbers say about emergency readmissions to hospital’, October 2017.

Reducing emergency admissions Appendix One 43
Appendix One
Our audit approach
1 This report examines the progress that the Department of Health & Social Care (the Department), NHS England and other stakeholders have made in reducing emergency admissions. We examined whether:
• the Department, NHS England and other stakeholders understand what is causing increasing emergency admissions;
• the Department and NHS England have plans to reduce emergency admissions; and
• the Department and NHS England are implementing plans effectively.

44 Appendix One Reducing emergency admissions
Figure x shows our audit approach
Figure 16Our audit approach
The objective of government
How this will be achieved
Our evaluative criteria
Our evidence
(see Appendix Two for details)
Our conclusion
As part of our fieldwork we:
• analysed hospital data (see technical annex);
• interviewed central government representatives;
• analysed key central government documents including urgent and emergency care programme board minutes, risk registers and performance reports;
• conducted five fieldwork visits to Hull, Bradford, Rushcliffe, Cornwall and Manchester; and
• undertook a financial analysis to calculate the cost of emergency admissions.
Understanding the causes of emergency admissions
NHS England collects data on who and why patients are being admitted.
It analyses the impact of external factors.
It is aware of causes of regional variations.
It understands the drivers of the demand.
Progress in implementing plans and programmes
Programmes are meeting key milestones.
There is an increase in service provision.
Data shows emergency admissions are decreasing.
Programmes and plans to reduce emergency admissions
Efforts are applied across the whole health and social care system.
Stakeholders are engaged in the plans and programme.
Plans and programmes are evidence-based.
Programmes have robust governance, assurance and leadership.
To achieve a measureable reduction in emergency admissions by 2020.
Through the urgent and emergency care programme, the Better Care Fund and new models of care.
The impact on hospitals of rising emergency admissions poses a serious challenge to both the service and financial position of the NHS. Over the last four years, the NHS has done well to reduce this impact despite admitting more people as emergency admissions, largely by reducing length of stay and growing daycase treatment. However, it cannot know if its approach is achieving enduring results until it understands whether reported increases in readmissions are a sign that some people admitted as an emergency are being discharged too soon. The NHS also still has too many avoidable admissions and too much unexplained variation. A lot of effort is being made and progress can be seen in some areas, but the challenge of managing emergency admissions is far from being under control.

Reducing emergency admissions Appendix Two 45
Appendix Two
Our evidence base
1 We reached our independent conclusion on whether the Department of Health & Social Care (the Department), NHS England and partners have made good progress in implementing plans and programmes to reduce emergency admissions from evidence collected between July and November 2017.
2 We analysed data from:
• The Hospital Episode Statistics data warehouse, which contains details of all English NHS admissions, outpatient appointments and A&E. Patient data are provided by NHS trusts, and are subsequently cleaned and processed before being added to Hospital Episode Statistics. Where variations in hospital admission are examined at the clinical commissioning group level, NHS Digital’s GP Registered Populations are used to examine per capita and per needs-weighted capita admissions.
• Anonymised data provided by NHS commissioners and providers to the 2017 National Audit of Intermediate Care (the Audit). The Audit is a voluntary survey focusing on commissioners and providers’ community-based services for older people. We explored associations between intermediate care activity and emergency admissions by joining data extracted from Hospital Episode Statistics with data from the Audit.
• Summary data from NHS England’s 2016-17 Better Care Fund Whole-Year Performance Report. This report, used to track clinical commissioning groups’ performance against their targets extracts data from a range of sources. The performance report extracts acute care data from the NHS Secondary Uses Service, which processes data provided by NHS trusts in a different way than Hospital Episode Statistics. Data in this report concerning the BCF are therefore not directly comparable with our analysis of NHS Hospital Episode Statistics.
There is more detail about our data analysis in our technical appendix.
46 Appendix Two Reducing emergency admissions
3 We interviewed central government representatives from the Department, NHS England, NHS Improvement, the Care Quality Commission and the Ministry of Housing, Communities & Local Government.
4 We interviewed representatives from a range of other organisations active in the health and social care sector including the Local Government Association, the Association of Directors of Adult Social Services, the Royal College of Physicians, the Royal College of General Practitioners, the Health Foundation, the Society for Acute Medicine, NHS Benchmarking, NHS Elect, Oxford University and Bristol University.
5 We analysed programme documents from the urgent and emergency care programme, performance reports from the new care models and Better Care Fund metrics.
6 We reviewed government policy documents regarding commitments to reduce emergency admissions.
7 We reviewed clinical literature about the efficacy of a number of interventions to reduce emergency admissions.
8 We analysed financial data from the NHS payment-by-results system to provide us with a cost of emergency admissions. This method was based on the calculation from our report on Emergency admissions to hospital: managing the demand (2013), although owing to data limitations did not replicate it exactly.
9 We conducted five case study visits in October and November 2017 to Hull, Bradford, Rushcliffe, Cornwall and Manchester. We spoke with local authority directors of adult social services, social workers, community care workers, clinical commissioning group commissioners, directors of operations in trusts, clinical staff in trusts, heads of A&E delivery boards and GPs. This work was designed to understand:
• what local areas are doing to reduce emergency admissions and how this is progressing;
• the challenges that local areas face in reducing emergency admissions; and
• how local authorities, clinical commissioning groups and trusts are working together to reduce emergency admissions.

Reducing emergency admissions Appendix Three 47
Appendix Three
Technical note
Hospital Episode Statistics
1 Our primary analysis of hospital activity uses the NHS’s Hospital Episode Statistics (HES) Admitted Patient Care (APC) data warehouse. This contains details of every hospital stay in English NHS hospitals, in addition to English NHS commissioned activity in the independent sector. For each of their patients, hospitals are required to record information including the patient’s age, gender, diagnosis and any procedure undertaken so they can be paid for the care they deliver.
2 HES is the official data source used by organisations across the NHS for external reports. HES data are not directly comparable with data from NHS England’s Secondary Uses Service, which are commonly used by NHS organisations in their internal reports. NHS trusts provide the same patient-level data for use in HES and Secondary Uses Service data, however, the data sets use different cleaning and processing protocols before publication.
Reporting across financial years
3 Our analysis of HES data is based on people admitted as inpatients as an emergency in any of the four financial years from 2013-14 to 2016-17 (inclusive). We count an admission when a person starts an episode of emergency care that is flagged as the first episode in a sequence of episodes. Some people have two or more ‘first’ episodes starting on the same date and we count these people as having one admission on that date. As a result our number of admissions is lower than the number of ‘first’ episodes of care starting each year.
4 When reporting data in a time series, we have not weighted data from financial years by their respective number of working days. Where patient records are linked across years we have used the encrypted HES identification as recorded in HES. All 2016/17 HES data are provisional.
5 Our analysis of emergency bed days is based on data supplied by NHS England and is calculated on the basis of finished discharge episodes which includes bed days for people admitted in a previous financial year.

48 Appendix Three Reducing emergency admissions
Patient classification indicators
6 We constructed a series of patient classification indicators based on the technical guidance for a range of official NHS indicators to identify groups of patients for our analysis. Specifically, when counting patients with Ambulatory Care Sensitive Conditions (Acute and Chronic) we referred to NHS Outcomes Framework Indicators 2.6 and 3a. In developing our indicators, we consulted with NHS England and NHS Digital on their appropriateness, and on the interpretation of their technical guidance notes.
7 In the absence of any corresponding NHS guidance we adapted our frailty risk patient classification indicator based on a definition from Soong et al. 2015.28 Our frailty risk patient classification indicator identifies patients aged 65 and over who have any diagnoses for delirium, dementia, functional dependence, falls or fractures, incontinence, mobility problems, pressure ulcers or senility. We have included diagnoses from general disease categories only and have not included any sub-categories. We elected not to include diagnoses for anxiety and depression in our indicator of frailty risk.
8 Our frailty risk patient classification is unvalidated and has been developed for illustrative purposes only to estimate the number of patients admitted to hospital who may be at risk of frailty. We note that tools currently used by NHS organisations to identify frailty risk (for example, the Electronic Frailty Index) are validated for use with primary health care general practice data.
9 Due to differences in data sources (see above) our core definition of emergency admissions and interpretation challenges with technical guidance notes, data extracted from our patient classification indicators are not directly comparable with data extracted from the respective NHS outcomes frameworks from which our indicators are based.
28 J. Soong et al, Quantifying the prevalence of frailty in English hospitals, BMJ Open, 2015. Available at: http://bmjopen.bmj.com/content/5/10/e008456?utm_source=TrendMD&utm_medium=cpc&utm_campaign=BMJOp_TrendMD-0

Reducing emergency admissions Appendix Three 49
National Audit of Intermediate Care
10 Our analysis of intermediate care provision is based on a secondary review of the National Audit of Intermediate Care (the Audit) 2017 data. We collected 2017 Audit submission data from commissioners at a clinical commissioning group level covering the four main types of intermediate care service including:
• the total spend; and
• the total number of referrals, admissions, assessments or service users accepted.
11 We matched the data from the audit to corresponding HES data at a clinical commissioning group level covering:
• emergency admissions per 100,000 weighted population;
• emergency admissions with a length of stay of one, one to two, or two or more days per 100,000 weighted population; and
• emergency admissions for patients with conditions that NHS England considers could be avoided with effective community care and case management per 100,000 weighted population.
12 We have applied simple linear regression to all combinations of the matched data to identify if there is any observable relationship between the availability of intermediate care and the number of emergency admissions.
Standardisation
13 We have weighted variations in per capita emergency admissions at a clinical commissioning group (CCG) and NHS Region level using NHS England’s 2016-17 Acute and General weighted populations to better reflect the clinical needs of residents. These weighted populations are primarily used by NHS England to allocate funding to CCGs. They are based on the GP registered population of each CCG, and subsequently adjusted to reflect increases/decreases in each population’s need for health care services related to age (with older populations having a higher need per head than younger populations) and other factors including the healthiness of an area and the severity of health inequalities. Variations in the rate of change of per capita emergency admissions as reported at a CCG level use unweighted GP registered populations, due to changes in weighting methodologies during our time period of interest.

50 Appendix Three Reducing emergency admissions
Bed availability and occupancy
14 For our analysis of the change in the number of general and acute beds available and the average bed occupancy (Figure 10) we have used NHS England’s quarterly statistics for the availability and occupancy of beds overnight. We have counted General and Acute beds only and excluded beds unlikely to be used for acute emergency admissions including beds for mental illness, learning disabilities and maternity services. Average bed occupancy is based on the average of the percentage number of general acute beds occupied across the four quarters of each financial year.
Better Care Fund
15 Our analysis of the Better Care Fund uses summary data from NHS England’s 2016-17 BCF Whole-Year Performance Report. This report, used to track CCGs’ performance against their Better Care Fund targets, extracts data from a range of sources. The performance report extracts acute care data from the NHS Secondary Uses Service (SUS), which is commonly used for internal NHS reporting. As noted earlier, SUS processes data provided by NHS trusts in a different way than HES. Data in this report concerning the Better Care Fund are therefore not directly comparable with data extracted from NHS HES. Our analysis of the health vanguards and new models of care is based on secondary review of NHS England’s unpublished Operational Research and Evaluation Unit’s briefing note on Q1 NCM core metrics data, which is extracted from the SUS+ system. As described earlier, SUS+ data are not directly comparable with NHS HES data.
Financial analysis
16 Analysis of the financial costs of emergency admissions is based on NHS payment-by-results data, and uses a similar methodology to that used in the National Audit Office’s 2013 value-for-money report Emergency admissions to hospital: managing the demand. Due to changes in the structure of the Payments by Results database, the team made some minor methodological changes in how short stay admissions were counted meaning data are not directly comparable between reports. All costs are reported in 2016/17 prices through the use of HM Treasury’s GDP deflator (Autumn 2017).

This report has been printed on Evolution Digital Satin and contains material sourced from responsibly managed and sustainable forests certified in accordance with the FSC (Forest Stewardship Council).
The wood pulp is totally recyclable and acid-free. Our printers also have full ISO 14001 environmental accreditation, which ensures that they have effective procedures in place to manage waste and practices that may affect the environment.

£10.00
9 781786 041814
ISBN 978-1-78604-181-4
Design and Production by NAO External Relations DP Ref: 11693-001
You have reached the end of this document