report department for education - national audit office … · national audit office press office...
TRANSCRIPT

Reportby the Comptroller and Auditor General
Department for Education
Children in need of help or protection
HC 723 SESSION 2016-17 12 OCTOBER 2016

Our vision is to help the nation spend wisely.
Our public audit perspective helps Parliament hold government to account and improve public services.
The National Audit Office scrutinises public spending for Parliament and is independent of government. The Comptroller and Auditor General (C&AG), Sir Amyas Morse KCB, is an Officer of the House of Commons and leads the NAO, which employs some 785 people. The C&AG certifies the accounts of all government departments and many other public sector bodies. He has statutory authority to examine and report to Parliament on whether departments and the bodies they fund have used their resources efficiently, effectively, and with economy. Our studies evaluate the value for money of public spending, nationally and locally. Our recommendations and reports on good practice help government improve public services, and our work led to audited savings of £1.21 billion in 2015.

Report by the Comptroller and Auditor General
Ordered by the House of Commons to be printed on 10 October 2016
This report has been prepared under Section 6 of the National Audit Act 1983 for presentation to the House of Commons in accordance with Section 9 of the Act
Sir Amyas Morse KCB Comptroller and Auditor General National Audit Office
7 October 2016
HC 723 | £10.00
Department for Education
Children in need of help or protection

This report examines the Department’s progress in improving the system to help and protect children.
© National Audit Office 2016
The material featured in this document is subject to National Audit Office (NAO) copyright. The material may be copied or reproduced for non-commercial purposes only, namely reproduction for research, private study or for limited internal circulation within an organisation for the purpose of review.
Copying for non-commercial purposes is subject to the material being accompanied by a sufficient acknowledgement, reproduced accurately, and not being used in a misleading context. To reproduce NAO copyright material for any other use, you must contact [email protected]. Please tell us who you are, the organisation you represent (if any) and how and why you wish to use our material. Please include your full contact details: name, address, telephone number and email.
Please note that the material featured in this document may not be reproduced for commercial gain without the NAO’s express and direct permission and that the NAO reserves its right to pursue copyright infringement proceedings against individuals or companies who reproduce material for commercial gain without our permission.
Links to external websites were valid at the time of publication of this report. The National Audit Office is not responsible for the future validity of the links.
11246 10/16 NAO

The National Audit Office study team consisted of: Tom Arkell, Linda Mills, Annie Murthi, Tosin Omole, Sarah Perryman, Mathew Power and Heather Reeve-Black, under the direction of Ashley McDougall.
This report can be found on the National Audit Office website at www.nao.org.uk
For further information about the National Audit Office please contact:
National Audit Office Press Office 157–197 Buckingham Palace Road Victoria London SW1W 9SP
Tel: 020 7798 7400
Enquiries: www.nao.org.uk/contact-us
Website: www.nao.org.uk
Twitter: @NAOorguk
Contents
Key facts 4
Summary 5
Part OneThe demand for help and protection for children 11
Part TwoHow the system for helping and protecting children is working in practice 24
Part ThreeHow the Department aims to improve the system 38
Appendix OneOur audit approach 53
Appendix TwoOur evidence base 55

4 Key facts Children in need of help or protection
Key facts
391,000children under the age of 18 in England needing help or protection, from local authorities, on 31 March 2015
635,600referrals for children to receive help or protection during 2014-15
£1.8bnspent on children’s social work (including local authority functions in relation to child protection) by authorities in 2014-15, up 11% since 2012-13
2011 Professor Munro’s review on improving the child protection system published
124% rise in the number of enquiries per 10,000 children, where local authorities believe a child may be suffering, or likely to suffer, signifi cant harm, over the last 10 years
23% of local authorities with help and protection services that Ofsted judges as Good as at 25 August 2016
32% of local authorities for which there is no Ofsted judgement within the last three years
26 out of 152 local authorities in which the Department for Education is currently intervening because Ofsted has judged services Inadequate as at 20 September 2016
No correlation found between a local authority’s Ofsted inspection score, the number of children in need and how much is spent per child in need
2020 the year by which the Department for Education has committed to transform the quality of the child protection system

Children in need of help or protection Summary 5
Summary
1 The law defines children in need as children who are aged under 18 and need local authority services:
• to achieve or maintain a reasonable standard of health or development;
• to prevent significant or further harm; or
• because they are disabled.
2 In 2014-15, local authorities recorded 635,600 referrals (requests for services to be provided by children’s social care) because of concerns about a child’s welfare. Referrals can come from the children themselves, as well as teachers, GPs, the police, health visitors, family members or members of the public.1
3 When a local authority receives a referral, working with local partners, it assesses a child’s need for services. If an authority suspects a child is at risk of significant harm, it may need to do more to protect the child, including putting in place a child protection plan. In 2014-15, 62,200 children became the subject of a plan. Over the past 10 years, the rate of children under 18 starting on plans has risen by 94%.2
4 Local authorities have statutory duties for safeguarding and promoting the welfare of individual children in their area and are directly responsible for improving local services. Authorities work with agencies such as the police and health services to meet these duties and are accountable to their local communities and councillors for their performance. Although the Department for Education (the Department) is not legally responsible for improving local services, it is responsible for the legal and policy frameworks within which local authorities operate. The Department also publishes data and research; sets the framework against which Ofsted inspects each authority’s services; and intervenes where an authority fails to deliver services to an acceptable standard.
5 The Department for Communities and Local Government provides most funding for children’s services. In 2014-15, local authorities reported they had spent £1.8 billion on children’s social work (including local authority functions in relation to child protection) in England, an 11% increase on 2012-13.
1 HM Government, Working together to safeguard children: A guide to inter-agency working to safeguard and promote the welfare of children, March 2015.
2 The way that the Department for Education collects data on child protection has changed, so data may not be directly comparable (see Figures 4 and 6).

6 Summary Children in need of help or protection
6 In 2010, the Department considered that the child protection system in England was not working as well as it should. It commissioned the Munro Review of child protection.3 This report recommended major reform of children’s social work. The government has recognised, however, that help and protection for children still needs to improve further. In July 2016, the Department published Putting children first, setting out its vision for children’s social care by 2020.4
Scope of this report
7 This report examines the Department’s progress in improving the system to help and protect children. We look at the system from the point where someone contacts a local authority with concerns about a child to the point where the authority makes a child the subject of a child protection plan. The report examines:
• the demand for help and protection for children (Part One);
• how the system is working in practice (Part Two); and
• how the Department aims to improve the system (Part Three).
Key findings
Help and protection for children
8 The demand for help or protection is rising. As at 31 March 2015, 391,000 children in England, were assessed as being in need of help or protection. In 2013-14 there were 2.3 million initial contacts (up 65% since 2007/08). Over the last 10 years there has been a marked rise in serious cases requiring children to be protected from harm as:5
• the rate of enquiries made by local authorities when they believe a child may be suffering, or likely to suffer, significant harm increased by 124%; and
• the rate of children starting on child protection plans rose by 94% (paragraphs 1.10, 1.12, 1.14, 2.21 and Figure 6).
9 Average spending on a child in need has increased slightly in the past three years. Local authorities report how much they spend on children’s social work, including on their child protection functions. In 2014-15, local authorities reported spending £1.8 billion on children’s social work, 11% more in real terms than in 2012-13. This spending was equivalent to £2,300 per child in need, compared with around £2,200 per child in 2012-13 and 2013-14 (paragraph 1.6 and Figure 2).
3 E Munro, The Munro Review of Child Protection: Final Report – a child-centred system, Cm 8062, Department for Education, May 2011.
4 Department for Education, Putting children first: Delivering our vision for excellent children’s social care, July 2016.5 See footnote 2.
Children in need of help or protection Summary 7
10 Average spending on each child in need varies widely across England and is not related to quality. Average reported spending on children’s social work in 2014-15 ranged from an estimated spend of £340 per child in need in one authority to £4,970 per child in need in another. Neither the Department nor authorities understand why spending varies and the Department has been concerned about the quality of the spending data that local authorities report for some time. Our own analysis found no relationship between local authorities’ reported spending on each child in need and the quality of service (paragraphs 1.6, 2.6 and Figure 9).
How the system for helping and protecting children is working in practice
11 Nationally the quality of help and protection for children is unsatisfactory and inconsistent, suggesting systemic rather than just local failure. Ofsted has only judged services to help or protect children as Good in 23% of the 103 local authorities it has inspected since 2013. It has judged 20% of local authorities Inadequate. We found, in addition, that in the year ending 31 March 2015, there was wide variation in the effectiveness of work between local authorities as illustrated by two proxy measures. The rates of:6
• re-referrals to children’s social care during the year varied from 6% to 46%; and
• children with repeat child protection plans varied from 3% to 44% (paragraphs 1.15, 2.24, 2.30 and Figures 7 and 11).
12 Children in different parts of the country do not get the same access to help or protection. Local thresholds for help and protection services should ensure all children get access to the right help or protection at the right time. We found that thresholds were not always well understood or applied by local partners. In Ofsted’s view some local thresholds were set too high or low leading to inappropriate referrals or children left at risk. We also found in the year ending 31 March 2015 there was variation between local authorities in the rates of:7
• referrals accepted, from 226 to 1,863 per 10,000 children; and
• children in need, from 291 to 1,501 per 10,000 children.
In addition, children living in deprived areas are 11 times more likely to have a child protection plan than children living in the most affluent areas of England (paragraphs 1.8, 1.11, 2.6, 2.23 and Figure 5).
6 City of London and Isles of Scilly are excluded due to small numbers.7 See footnote 6.

8 Summary Children in need of help or protection
13 High caseloads, vacancies and use of agency workers are related to the quality of services. Social workers work in pressured circumstances that can sometimes lead to low morale, high vacancy and turnover rates, and a reliance on temporary staff. Ofsted has found local authorities it judges Good tend to be the ones that give their social workers manageable caseloads. In 2014-15:
• 16% of children’s social workers were agency staff. In authorities judged Good, the average was 7%, in authorities judged Inadequate it was 22%.
• 17% of children’s social worker posts were vacant. In authorities judged Good, the average was 11%, in authorities judged Inadequate it was 22% (paragraph 2.10).
14 Arrangements for developing, identifying and sharing good practice are piecemeal. Many local authorities demonstrate good practice, however, social workers and others do not find it easy to find out what works. Local authorities judged Good by Ofsted provide support to those judged as Inadequate. However, given only 24 out of 103 local authorities inspected so far are judged to be Good, spreading good practice is a challenge. The Department accepts the system for sharing good practice is weak. It has introduced an Innovation Programme and Partners in Practice initiative to develop new models of social work. There are also other ways of sharing good practice including benchmarking tools; local authority level practice sharing and peer review; and Ofsted’s inspection reports and ‘getting to good’ seminars. The Department plans to create a ‘What Works Centre’ for social work (paragraphs 2.14 to 2.18 and Figure 10).
15 There is little information on outcomes for children who are, or have been, in need of services. The Department measures volumes and timeliness of processes, but has no data on outcomes for children in need, except for educational outcomes. The Department and local authorities therefore do not understand which approaches provide the most effective help and protection. The Department’s data shows a big gap between the educational outcomes of children in need and all children. In 2014-15, 15% of children in need attained five or more A*-C grades at GCSE (including English and mathematics), compared to 54% of all children (paragraphs 2.30 to 2.33).
How the Department aims to improve the system
16 The Department sees its role as setting the goals and framework within which local authorities help and support children. The Department issues statutory guidance, which clearly sets out duties on local authorities to provide help or protection services and requires Ofsted to assess authorities against these standards. But the Department says that direct responsibility for improving services lies with local authorities themselves. The Department told us it has no responsibility to enforce change, beyond formal intervention in a failing local authority when Ofsted judges services to be Inadequate because of widespread or serious failures, which leave children being harmed, or at risk of harm (paragraph 1.2 and Figure 1).

Children in need of help or protection Summary 9
17 In 2010, the Department recognised that child protection services were not good enough. Following the 2011 Munro review of how to improve the system for child protection, commissioned by the Department in 2010, the Department accepted most of Munro’s recommendations. In 2012, it began to publish and collect more information to help local authorities assess their performance. The Department also launched a programme to reform social work, revised statutory guidance, established the first two children’s social care trusts and provided over £100 million funding for the Innovation Programme. However, in response to Munro’s review the Department did not set out what a reformed system would achieve for children (paragraphs 3.2 to 3.5 and Figure 12).
18 The Department’s initiatives have not yet resulted in good outcomes. Ofsted inspection results for services to help or protect children are not yet showing a marked improvement. Although the new inspection framework since November 2013 is more challenging, only 23% of all authorities inspected so far have received a Good judgement. For the 32 local authorities inspected before and after the introduction of the new framework, the judgement for 16 had improved, 13 had remained the same and three had declined (paragraphs 3.6 and 3.7).
19 In July 2016, the Department published its plans to transform all children’s services by 2020. The Department knows the quality of work with children and families is still inconsistent despite its efforts. In 2016, the Department set a goal that all vulnerable children, no matter where they live, should receive the same high quality care and support by 2020. The Department acknowledges its role in supporting local accountability by improving transparency but has no formal role in improving services (paragraphs 1.2, 3.9 to 3.11 and Figure 13).
20 The Department’s interventions to improve failed local services for children are neither risk-based nor early enough. The Department only intervenes when Ofsted has already found services to have failed local children. It does not plan to use performance information to anticipate risks of failure, even though Ofsted’s inspection programme means judgements on 32% of authorities are at least three years old. Neither the Department nor the 23% of authorities judged Good yet have the capacity and capability to intervene effectively on a wider scale (paragraphs 2.3, 3.28, 3.29 and Figure 15).
21 The Department could learn lessons from other parts of government about transforming a service successfully. The Department faces significant challenges in transforming children’s services, not least how to integrate this with a concurrent transformation of its wider operations by the end of 2017. Much transformation is going on across government that could provide lessons for the Department’s reform of children’s services. It is critical that the Department learns from practice and mistakes elsewhere. For example, the Youth Justice Board’s improvements to the youth justice system led to a reduction in recorded youth crime (paragraphs 3.33, 3.34 and Figure 18).
10 Summary Children in need of help or protection
Conclusion
22 In 2010, the Department commissioned the Munro review because it considered children’s services were not good enough. Six years later, far too many children’s services are still not Good: quality is generally significantly below par and does not correlate to spending levels, access to help or support is not equal across the country, and interventions to improve failed services have been ad hoc. This represents poor progress. The foundations of a cycle of improvement would involve understanding what works, timely measurement of the quality of protection activity across areas, pointing out poor performance and an effective response that improves services quickly. None of these are yet in place to the extent necessary to improve the services quickly enough.
23 While the Department is not solely responsible for improving the widespread failings of the system it is the only body that can oversee and push systemic change. However, even taking into account the challenge of reforming services delivered through local authorities, and the time needed to achieve systemic improvements, so far the outcomes have been disappointing. To achieve its new goal of improving the quality of all services by 2020 the Department will need to step forward and show a sense of urgency and determination in delivering on their responsibilities.
Recommendations
24 The Department should:
a Set out how and by when it will have the capacity and capability to transform children’s services by 2020.
b Set out how it reconciles the variability introduced by local thresholds for help and protection with its goal of all children having equal access to high-quality services.
c In consultation with Ofsted, set out how it can secure more timely assurances on the quality of services offered across all local authorities.
d Develop its intervention regime so that it uses lead indicators, such as re-referral rates, repeat child protection plans and social worker vacancy and agency staff rates, to anticipate and act on failing services before they fail.
e Develop better indicators to monitor the lives and outcomes for children and families who are, or have been, in contact with the child protection system, and hold local authorities to account for their performance.
f Build on its work to improve cost information on services, particularly local authorities’ financial returns so that cost-effectiveness can underpin decisions on practice.

Children in need of help or protection Part One 11
Part One
The demand for help and protection for children
1.1 This part of the report examines:
• roles, responsibilities and spending on help and protection;
• the rising demand for help and protection; and
• why more children need help or protection.
Roles, responsibilities and spending on help and protection
1.2 The Department for Education (the Department) is responsible for the legal and policy frameworks within which local authorities operate. It also works with the Department of Health, the Home Office, the Department for Communities and Local Government, and the Ministry of Justice to address threats to children’s welfare such as child sexual exploitation, radicalisation, and gang culture. The Department for Education issues statutory guidance, which clearly sets out the duty upon local authorities and their partners such as the police and health services to work together to protect children. The Department is also responsible for:8
• providing information to support benchmarking (of practice and costs) and local accountability;
• setting the framework against which Ofsted inspects local authority services; and
• intervening in a failing local authority when Ofsted judges services Inadequate because of widespread or serious failures, which leave children being harmed, or at risk of harm.
The Department told us that it has no responsibility beyond formal intervention for improving services. However, it does support local authorities to improve themselves and share and test good practice including through the Innovation Programme and Partners in Practice initiative. The roles and responsibilities of the Department and others are shown in Figure 1 overleaf.
8 Department for Education, Accountability System Statement for Education and Children’s Services, January 2015.

12 Part One Children in need of help or protection
Fig
ure
1Th
e sy
stem
for
supp
ortin
g ch
ildre
n in
nee
d of
hel
p or
pro
tect
ion
No
te
1 D
epar
tmen
t for
Com
mun
ities
and
Loc
al G
over
nmen
t pro
vid
es m
ost o
f the
fund
ing
to lo
cal a
utho
ritie
s fo
r sa
fegu
ard
ing
child
ren.
Sou
rce:
Acc
ount
abili
ty S
yste
m S
tate
men
t (Ja
nuar
y 20
15),
Kee
pin
g ch
ildre
n sa
fe in
ed
ucat
ion
(Jul
y 20
15),
Wor
king
toge
ther
to s
afeg
uard
chi
ldre
n (M
arch
201
5)
Oth
er b
od
ies
and
ind
ivid
ual
s
Pol
ice
Loca
l aut
horit
y no
n-ch
ildre
n se
rvic
es
Hea
lth s
ervi
ces
(eg
GP
s)
Sch
ools
and
col
lege
s
Hou
sing
Edu
catio
n se
rvic
es
Oth
er le
gal a
genc
y
Indi
vidu
als
Loca
l Saf
egua
rdin
g C
hild
ren
Bo
ard
s
Cor
e m
embe
rshi
p in
clud
es lo
cal
auth
oriti
es, h
ealth
bod
ies,
pol
ice
and
othe
rs, e
g fr
om v
olun
tary
and
in
depe
nden
t sec
tors
One
for
ever
y lo
cal a
utho
rity
area
Dev
elop
loca
l saf
egua
rdin
g po
licy
and
proc
ess
incl
udin
g se
tting
thre
shol
ds fo
r as
sess
men
t and
agr
eein
g se
rvic
es to
be
com
mis
sion
ed
Scr
utin
ise
loca
l arr
ange
men
ts
Insp
ectio
n da
ta
Col
labo
rate
Con
tact
s/re
ferr
als
Dep
artm
ent
for
Co
mm
un
itie
s an
d L
oca
l Go
vern
men
t
Pro
vide
s m
ajor
ity o
f cen
tral
go
vern
men
t fun
ding
Fund
ing
Insp
ects
Dat
aS
tatu
tory
gu
idan
ceIn
terv
enes
Rev
iew
s
Ser
vice
s
Lo
cal a
uth
ori
ties
(152
)
Pro
vide
sta
tuto
ry s
ervi
ces
Col
lect
dat
a
Pro
vide
fund
ing
(in a
dditi
on to
D
epar
tmen
t for
Com
mun
ities
and
Lo
cal G
over
nmen
t gra
nt)
Dep
artm
ent
for
Ed
uca
tio
n
Set
s po
licy
and
issu
es g
uida
nce
Sup
port
s lo
cal a
ccou
ntab
ility
Inte
rven
es if
per
form
ance
is p
oor
Col
lect
s, a
naly
ses,
pub
lishe
s da
ta
Pro
vide
s so
me
fund
ing
Ofs
ted
Insp
ects
loca
l aut
horit
y se
rvic
es fo
r ch
ildre
n in
nee
d of
hel
p or
pro
tect
ion
Rev
iew
s Lo
cal S
afeg
uard
ing
Chi
ldre
n B
oard
s
Ch
ildre
n an
d f
amili
es

Children in need of help or protection Part One 13
1.3 Local authorities have statutory duties to help or protect all children and young people in their area:
• They are also responsible for ensuring that funding for children’s services is spent with regularity and propriety and value for money is achieved.
• Their director of children’s services and lead member for children’s services are the key points of professional and political accountability. They are responsible for ensuring that services are delivered effectively.
1.4 Every local authority area has a Local Safeguarding Children’s Board (LSCB). Core membership of the LSCB includes the local authority; and health, education, police and youth justice services. The LSCB should:
• coordinate the work of statutory partners to safeguard local children and monitor and challenge the effectiveness of local practice to help improve front-line performance and management oversight; and
• agree intervention thresholds with the local authority and publish a threshold document setting out agreed criteria, including the level of need, for referring cases to children’s social care for assessment and for statutory services; and check that thresholds are understood and operate effectively.
1.5 Local authorities have reduced their overall spending in recent years due to a significant decrease in central government funding, but they have not reduced their spending on children’s services. Most funding for children’s services is not ring-fenced and comes from the Department for Communities and Local Government. How authorities spend their funding on different services will reflect the local context and each authority’s priorities.
1.6 Local authorities do not report their spending on help and protection services, but they do report how much they spend on children’s social work (including on child protection). In 2014-15, local authorities reported spending £1.8 billion on children’s social work, 11% more in real terms than in 2012-13 (Figure 2 overleaf). This spending was equivalent to £2,300 per child in need, slightly higher than in 2012-13 and 2013-14, when it was £2,200. Average reported spending on children’s social work in 2014-15 varied widely across England from an estimated spend of £340 per child in need in one authority to £4,970 per child in need in another. The Department does not know why spending on services varies so much, and has been concerned about the quality of the spending data that local authorities report for some time.

14 Part One Children in need of help or protection
The rising demand for services to help and protect children
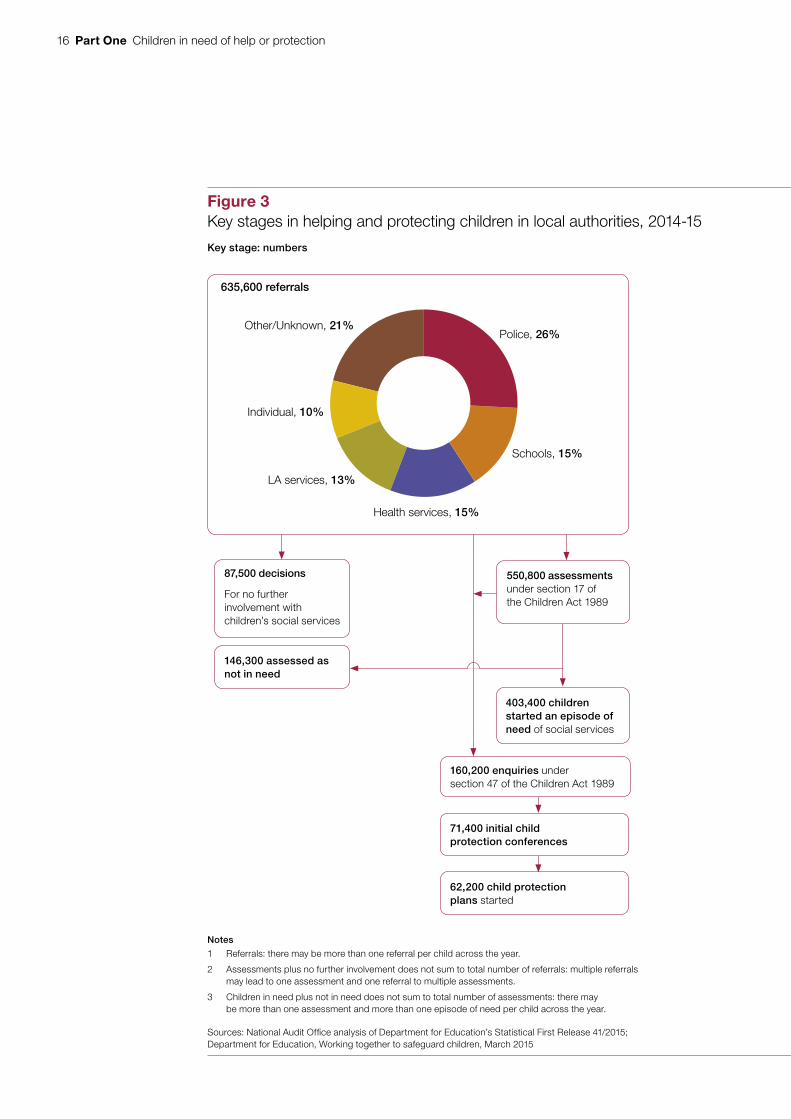
1.7 The key stages in helping and protecting children in local authorities are shown in Figure 3 on pages 16 and 17.
Referrals
1.8 In 2014-15, local authorities recorded 635,600 referrals to children’s social care. This number has increased by 15% in the past 10 years, from 552,000 in 2004-05. The rate of referrals has also increased in the past 10 years:
• from 499 per 10,000 children in 2004-05; to
• 548 per 10,000 children in 2014-15 (Figure 4 on page 18).
Figure 2Reported spending on children’s social work (including child protection), 2012-13 to 2014-15 (2014-15 prices)
Total expenditure on social work (£bn)
Real terms spending has risen by 11% over the past two years
Notes
1 Total expenditure, adjusted to 2014-15 prices using HM Treasury GDP deflators, June 2016.
2 Change in data definitions means a longer time series is unavailable.
Source: National Audit Office analysis of Section 251 data
0
0.2
0.4
0.6
0.8
1.0
1.2
1.4
1.6
1.8
2.0
2014-152013-142012-13
1.62
1.71
1.80
Children in need of help or protection Part One 15
Rates of referral vary widely across England from 226 referrals per 10,000 children in York to 1,863 referrals per 10,000 in Wakefield (Figure 5 on page 19).9
1.9 The Department does not analyse or act on different referral rates, even though rates vary so widely across the country. The Department relies on Ofsted inspections to consider whether appropriate referrals are made to children’s social care locally.
Assessments
1.10 On 31 March 2015, 3% of children under the age of 18 in England were assessed as being in need of help or protection, a total of 391,000 children. This number was 4% more than on 31 March 2010 and in line with the general increase in the child population. The number of children in need on 31 March in any year is much lower than the number of children that local authorities work with throughout the year. The total number of children counted as in need across the year (taking account of existing, closed and new cases) rose 13% between 2009-10 to 2014-15, from just under 695,000 to over 780,000.
1.11 In addition, in 2014-15:
• The rate of children in need varied across England from 291 per 10,000 children in Wokingham to 1,501 per 10,000 in Blackpool.
• 49% of assessments identified abuse or neglect as the primary reason for a child being in need of help or protection.
Of those children in need as at 31 March 2015:
• 53% were male, 45% female and 2% unborn or of unknown gender;
• 25% were black and minority ethnic (21% in the general population);10
• 30% were aged 10 to 15 years (the largest age group); and
• 13% had a disability.
9 City of London and Isles of Scilly are excluded due to small numbers.10 Office for National Statistics, 2011 Census.
16 Part One Children in need of help or protection
Figure 3Key stages in helping and protecting children in local authorities, 2014-15
Key stage: numbers
87,500 decisions
For no further involvement with children’s social services
146,300 assessed as not in need
403,400 children started an episode of need of social services
Notes
1 Referrals: there may be more than one referral per child across the year.
2 Assessments plus no further involvement does not sum to total number of referrals: multiple referrals may lead to one assessment and one referral to multiple assessments.
3 Children in need plus not in need does not sum to total number of assessments: there may be more than one assessment and more than one episode of need per child across the year.
Sources: National Audit Offi ce analysis of Department for Education’s Statistical First Release 41/2015; Department for Education, Working together to safeguard children, March 2015
4 Enquiries: there may be more than one enquiry per child across the year.
5 Conferences: there may be more than one initial child protection conference per child across the year.
6 Plans: children starting on a plan. Each child may start on a plan more than once across the year.
550,800 assessments under section 17 of the Children Act 1989
160,200 enquiries under section 47 of the Children Act 1989
71,400 initial child protection conferences
62,200 child protection plans started
Key stage: definition See paragraphs:
A request for services to be provided by children’s social care, may result in: 1.7, 1.8, 2.23, 2.25, 2.27, Figure 5
• an assessment of, or enquiry into child’s need;
• the provision of information or advice;
• referral to another agency; or
• no further action.
Local authority should respond within one working day.
A section 17 assessment decides whether to provide services to a child in order to safeguard and promote welfare. Local authority has 45 days from receiving the referral to assess and make decisions on next steps.
1.9–1.11, 1.17, 1.18, 2.21, 2.26
May be:
• referred to early help service;
• provided with information or advice; and
• referred to another agency.
2.21
Services for children in need may include: advice; counselling; home help; recreational activities.
1.11, 2.26, 2.33, 2.34
Used if referral or section 17 assessment gives local authority reasonable cause to suspect a child is suffering, or is likely to suffer, significant harm.
Decides if child is at continuing risk of harm. If so, an initial child protection conference must be convened within 15 working days.
1.12, Figure 6
Agencies come together to analyse all relevant information and plan how best to safeguard and promote the welfare of the child.
1.13, 1.14
The plan sets out actions, timescales, and a statement of what improvement is needed.
1.14, 1.15, Figures 6 and 7
Should be reviewed within three months of initial conference, and at least six monthly thereafter, until the plan ends.
Police, 26%Other/Unknown, 21%
Schools, 15%
Health services, 15%
LA services, 13%
Individual, 10%
635,600 referrals

Children in need of help or protection Part One 17
Figure 3Key stages in helping and protecting children in local authorities, 2014-15
Key stage: numbers
87,500 decisions
For no further involvement with children’s social services
146,300 assessed as not in need
403,400 children started an episode of need of social services
Notes
1 Referrals: there may be more than one referral per child across the year.
2 Assessments plus no further involvement does not sum to total number of referrals: multiple referrals may lead to one assessment and one referral to multiple assessments.
3 Children in need plus not in need does not sum to total number of assessments: there may be more than one assessment and more than one episode of need per child across the year.
Sources: National Audit Offi ce analysis of Department for Education’s Statistical First Release 41/2015; Department for Education, Working together to safeguard children, March 2015
4 Enquiries: there may be more than one enquiry per child across the year.
5 Conferences: there may be more than one initial child protection conference per child across the year.
6 Plans: children starting on a plan. Each child may start on a plan more than once across the year.
550,800 assessments under section 17 of the Children Act 1989
160,200 enquiries under section 47 of the Children Act 1989
71,400 initial child protection conferences
62,200 child protection plans started
Key stage: definition See paragraphs:
A request for services to be provided by children’s social care, may result in: 1.7, 1.8, 2.23, 2.25, 2.27, Figure 5
• an assessment of, or enquiry into child’s need;
• the provision of information or advice;
• referral to another agency; or
• no further action.
Local authority should respond within one working day.
A section 17 assessment decides whether to provide services to a child in order to safeguard and promote welfare. Local authority has 45 days from receiving the referral to assess and make decisions on next steps.
1.9–1.11, 1.17, 1.18, 2.21, 2.26
May be:
• referred to early help service;
• provided with information or advice; and
• referred to another agency.
2.21
Services for children in need may include: advice; counselling; home help; recreational activities.
1.11, 2.26, 2.33, 2.34
Used if referral or section 17 assessment gives local authority reasonable cause to suspect a child is suffering, or is likely to suffer, significant harm.
Decides if child is at continuing risk of harm. If so, an initial child protection conference must be convened within 15 working days.
1.12, Figure 6
Agencies come together to analyse all relevant information and plan how best to safeguard and promote the welfare of the child.
1.13, 1.14
The plan sets out actions, timescales, and a statement of what improvement is needed.
1.14, 1.15, Figures 6 and 7
Should be reviewed within three months of initial conference, and at least six monthly thereafter, until the plan ends.
Police, 26%Other/Unknown, 21%
Schools, 15%
Health services, 15%
LA services, 13%
Individual, 10%
635,600 referrals

18 Part One Children in need of help or protection
Figure 4Referrals per 10,000 children to local authorities’ children’s social care
Referrals per 10,000 of the child population
Note
1 If a child has more than one referral in a year, each referral is counted.
Source: National Audit Office analysis of Department for Education’s statistical first releases on Children in need and child protection, and Office for National Statistics’ mid-year population estimates for 0 to 17-year-olds
700
600
500
400
300
200
100
0
2001-02
The rate of referrals has increased in the past 10 years
2002-03 2003-04 2004-05 2005-06 2006-07 2007-08 2008-09 2009-10 2010-11 2011-12 2012-13 2013-14
2012Death of Daniel Pelka
2014-15
2007Death of Peter Connelly
Child protection data changed from aggregate level to child level in 2009-10. Data may not be directly comparable.

Children in need of help or protection Part One 19
Figure 5Number of referrals per 10,000 children by local authority
Note
1 Data unavailable for South Tyneside.
Source: Department for Education’s Statistical First Release 41/2015
200 to 400
401 to 600
601 to 800
801 to 1,000
1,000+
No data
Referrals per 10,000 children aged under 18 years
Referrals vary from 226 referrals per 10,000 children in York to 1,863 referrals in Wakefield
20 Part One Children in need of help or protection
Enquiries and child protection conferences
1.12 If, following a referral or an assessment, a local authority has reasonable cause to suspect a child is suffering, or is likely to suffer significant harm, it will carry out a section 47 enquiry. In 2014-15, authorities carried out 160,200 enquiries. In the past 10 years, the number of enquiries per 10,000 children has risen by 124% (Figure 6).
1.13 If an enquiry suggests that a child has, or is likely to, suffer significant harm, the local authority will hold an initial child protection conference. Just under one-half (45%) of all enquiries lead to a conference. Local authorities held 71,400 conferences in 2014-15, 10% more than in 2013-14.
Child protection plans
1.14 At the child protection conference, agencies come together to analyse all relevant information and plan how best to safeguard and promote the welfare of the child. On 31 March 2015, 49,700 children had a child protection plan. The number of plans started in 2014-15 also increased. During 2014-15, 62,200 children became the subject of a child protection plan compared to 59,800 in 2013-14. In the past 10 years, there has been a 94% rise in rates of children starting on child protection plans (Figure 6).
1.15 In 2014-15, 17% of children on a child protection plan became the subject of a plan for a second or subsequent time, an increase from 13% in 2010-11. This percentage varies across England, from 3% in Havering to 44% in Rutland (Figure 7 on page 22).11 There will always be some need for repeat child protection plans but large discrepancies between rates in local authorities suggest differences in local practice and a high proportion may suggest the authority is not intervening effectively to bring about sustainable changes.
11 See footnote 9.

Children in need of help or protection Part One 21
Figure 6Section 47 enquiries and child protection plans, England, 1991-92 to 2014-15
Rate per 10,000 children
160
140
120
100
80
60
40
20
0
Over 10 years, section 47 enquiries per 10,000 children rose by 124%, and rates of children starting on child protection plans rose by 94%
Source: National Audit Office analysis of Department for Education’s statistical first releases on Children in need and child protection, and Office for National Statistics’ mid-year population estimates
1992
1993
1994
1995
1996
1997
1998
1999
2000
2001
2002
2003
2004
2005
2006
2007
2008
2009
2010
2011
2012
2013
2014
2015
Children subject to section 47 enquiries which started during the year ending 31 March
Children who became the subject of a child protection plan during the year ending 31 March
Child protection data changed from aggregate level to child level in 2009-10. Data may not be directly comparable.

22 Part One Children in need of help or protection
Fig
ure
7P
erce
ntag
e of
repe
at c
hild
pro
tect
ion
plan
s by
loca
l aut
horit
y, 2
014-
15
Per
cent
age
of r
epea
t ch
ild p
rote
ctio
n p
lans
(%)
One
in s
ix c
hild
ren
(17%
) with
a c
hild
pro
tect
ion
pla
n in
pla
ce in
201
4-15
had
pre
vio
usly
bee
n th
e su
bje
ct o
f a
pla
n, b
ut lo
cal r
ates
var
y w
idel
y
No
te
1 D
arlin
gton
, City
of L
ond
on a
nd Is
les
of S
cilly
exc
lud
ed d
ue to
sm
all n
umb
ers.
Sou
rce:
Dep
artm
ent f
or E
duca
tion'
s S
tatis
tical
Firs
t Rel
ease
SFR
41/2
015
on C
hild
ren
in n
eed
and
child
pro
tect
ion
50 40 30 20 10 0E
nglis
h lo
cal a
utho
ritie
s
Nat
iona
l ave
rage
, 17%

Children in need of help or protection Part One 23
Why more children need help or protection
1.16 More children need help or protection for several reasons. High profile cases, such as Baby P and Daniel Pelka, can lead to more people reporting concerns to local authorities. There are also more children. Between 2010 and 2014, the number of children aged 0 to 17-years-old in England increased by 5% or 550,000.
1.17 In 2014-15, the most common risk to a child’s welfare was domestic violence (flagged in 48% of assessments) and mental health concerns (about the child or other family members – 33% of assessments). Published statistics show that the number of domestic abuse cases and mental health problems are growing.12
1.18 The government and local authorities are becoming more aware of threats to children’s welfare including radicalisation, child sexual exploitation or gang culture. These threats are still relatively rare. For example, child sexual exploitation was identified in just 3% of assessments. Local authorities told us, however, that they expect to see more cases in future as their awareness of child sexual exploitation and other risks grow.
12 HMIC, Increasingly everyone’s business: A progress report on the police response to domestic abuse, December 2015; Health and Social Care Information Centre, Mental health bulletin: Annual statistics, 2014-15, 2015.

24 Part Two Children in need of help or protection
Part Two
How the system for helping and protecting children is working in practice
2.1 This part of the report examines:
• the quality of child protection services;
• how the process works in local authorities; and
• the effectiveness of the system.
The quality of child protection services
2.2 For assurance on the quality of services to help and protect children, the Department for Education (the Department) sets the framework against which Ofsted inspects services against standards and good practice. Ofsted began inspecting local authority children’s services under a new single inspection framework in November 2013. Ofsted told us that when scheduling single inspections of local authority children’s services, it considers a range of information. This information includes previous inspection outcomes, information from other sources (such as whistleblowing, complaints or serious case reviews), and other inspections carried out in the local area by Ofsted or other inspectorates. Ofsted’s single inspections include a specific judgement on the experiences and progress of children who need help or protection, but Ofsted’s inspections do not consider the cost-effectiveness or value for money of children’s services.
2.3 Ofsted aimed to inspect all 152 authorities and their associated Local Safeguarding Children’s Board (LSCBs), by November 2016 but has now extended this deadline to the end of 2017. It has said that completing the cycle of inspections under the new single inspection framework was taking longer than expected. By 25 August 2016, Ofsted had published single inspection framework reports for 103 local authorities. This means Ofsted had inspected 68% of authorities within two years and 10 months and there will be a long gap between inspections of some authorities, with some not inspected since July 2011. The Department has not required any more timely examination of the quality of services. For example, in May 2015 Durham County Council withdrew from the Department’s Partners in Practice programme (paragraph 2.18) after Ofsted judged its children’s services to be Requiring Improvement. The last Ofsted report, published in 2012, had judged the authority’s services as Outstanding.

Children in need of help or protection Part Two 25
2.4 Ofsted has only judged services to help or protect children as Good in 23% of local authorities inspected since 2013. More than one half of authorities inspected (57%) were judged to Require Improvement to be Good. Ofsted is clear that none of these local authorities were failing, but were not yet Good because social work practice was not consistently effective. However, 20% of authorities were judged Inadequate because of failures which left children being harmed, or at risk of harm (Figure 8). The systemic weaknesses in help and protection services identified by Ofsted are not typical of education services and other areas of children’s services overseen by the Department. Help and protection services for children lag far behind schools and children’s homes for services judged Good.
Figure 8Ofsted judgements for help and protection services and LSCBs compared with judgements for schools and children’s homes
Of 103 local authorities inspected by Ofsted, 58 (57%) were judged Requiring Improvementand 21 (20%) Inadequate
Notes
1 Children in need of help or protection and LSCBs: results of 103 inspections/reviews by Ofsted between November 2013 and 25 August 2016.
2 Schools: Ofsted inspections of 21,003 schools to the end of July 2016.
3 Children's homes: Ofsted inspections of 3,119 children’s homes between 1 October 2014 and 31 March 2016.
Source: National Audit Office analysis of Ofsted reports on local authorities’ children’s services and schools; Ofsted Management information – schools 31 July 2016; Ofsted, Social Care, 2016
Percentage
Outstanding
Good
Requires Improvement
Inadequate
0 20 40 60 80 100
Children in need ofhelp and protection
Local SafeguardingChildren Boards
Children’s homes
Schools 21 1167
16 21 657
32 1751
23 2057
1

26 Part Two Children in need of help or protection
2.5 When Ofsted inspects a local authority’s children’s services it also reviews the effectiveness of the LSCB. The LSCB agrees intervention thresholds with the local authority for referring cases to children’s social care for assessment and for statutory services (paragraph 1.4). By 25 August 2016, Ofsted had reviewed 103 LSCBs and found 17% of these to be Inadequate and 51% Requiring Improvement (Figure 8). Ofsted did not review the effectiveness of LSCBs before November 2013. In response to the Wood Review of LSCBs published in 2016, the government has introduced the Children and Social Work Bill for revised multi-agency working arrangements, which is now in process.13
2.6 Ofsted has reported that Good help and protection services are not related to local levels of deprivation, number of local children, or region.14 Our own analysis found no correlation between local authorities’ spending on children in need and the quantity and quality of their services (Figure 9). Research does however show that children living in the most deprived 10% of neighbourhoods in England are 11 times more likely to have a child protection plan than children living in the least deprived 10%.15 We also found no relationship between Good help and protection services and the rate of re-referrals, repeat child protection plans and no further action taken on referrals. All this supports Ofsted’s view that, regardless of local context, providing services judged Good is possible and a standard that any authority can achieve and maintain.16
How the process works in local authorities
2.7 Both the Department and Ofsted have identified several factors that affect performance in local authorities.17,18 These include:
• the quality of social work practice and leadership;
• the overall system’s ability to learn effectively from good practice and from mistakes;
• the management of referrals and assessing children’s needs; and
• effective local partnership working and information sharing.
Social work practice and leadership
2.8 Good social work depends on strong leadership, manageable workloads, frequent and supportive supervision and time to reflect and focus on learning and development.19 A recent review commissioned by the Department concluded that social workers were not always ready for frontline practice when they leave social work education.20 In addition, Munro’s review in 2011 found that social workers were often too focused on complying with rules and regulations rather than spending time helping children and families.21 In response the Department has a programme of social work reform underway (paragraphs 3.13 to 3.15).
13 Department for Education, Wood Review of LSCBs, April 2016.14 Ofsted, The report of Her Majesty’s Chief Inspector of Education, Children’s Services and Skills 2016: social care,
June 2016.15 P Bywaters et al, ‘Child welfare inequalities: new evidence, further questions’, Child and Family Social Work, 2016, vol. 21,
pp. 369-80.16 See footnote 14.17 Education Select Committee, Department for Education Memorandum on Social Work Reform, January 2016.18 See footnote 14.19 Department for Education, Putting children first: Delivering our vision for excellent children’s social care, July 2016.20 M Narey, Making the education of social workers consistently effective, January 2014.21 E Munro, The Munro Review of Child Protection: Final Report – a child-centred system, Cm 8062, Department
for Education, May 2011.

Children in need of help or protection Part Two 27
Figure 9Reported spending per child in need, and Ofsted judgements of services for help and protection, by local authority, 2014-15
Spend per child in need (£)
We found no relationship between reported spending and Ofsted’s judgement of quality
Notes
1 Isles of Scilly and City of London excluded due to small numbers.
2 Ofsted judgements as at 26 August 2016.
Source: National Audit Office analysis of Section 251 data, children in need census data, and Ofsted inspection reports
5,000
4,500
4,000
3,500
3,000
2,500
2,000
1,500
1,000
500
0
Good
Requires Improvement
25,000
Children in need throughout 2014-15
Inadequate
20,00015,00010,0005,0000

28 Part Two Children in need of help or protection
2.9 Ofsted has judged the quality of leadership, management and governance of children’s services to be Good or Outstanding in only 31% of authorities. Ofsted found that in local authorities judged Inadequate, leaders and managers did not make good use of performance and management information to prioritise issues and to challenge staff. Ofsted also found that poor recording of data by authorities meant there were gaps in the data available to senior managers. Essex County Council and Somerset County Council told us that they have started to make better use of existing performance information on caseloads, timeliness and actions, so that it is easier for managers to measure performance in a systematic way. Managers also need to ensure that plans for child protection and children in need contain enough details; are audited frequently enough and with sufficient scrutiny; and identify and prioritise risks.22
2.10 Social workers work in pressured circumstances. This can lead to high caseloads, low morale, high vacancy and turnover rates and a reliance on temporary staff and is often the case where Ofsted had judged services for help and protection Inadequate. From our own analysis we found a relationship between the levels of caseloads, temporary staff, vacancy rates and Ofsted judgements.23 In 2014-15:
• 16% of children’s social workers were agency staff. The average was 7% in authorities judged Good and 22% in authorities judged Inadequate.
• 95% of local authorities judged Good had fewer agency staff than the national average of 16%.
• 75% of local authorities judged Inadequate had more agency staff than the national average of 16%.24
• 17% of children’s social worker posts were vacant. The average was 11% in authorities judged Good, and 22% in authorities judged Inadequate.
2.11 Ofsted has reported that the number of children in need per children’s social worker varies widely from seven to 34 across England. There is no single ‘right’ number for caseload: it depends on case risk and complexity. However, in most authorities judged Good, each social worker has about 10 to 14 cases. By contrast, Somerset told us its average caseload had been 35, when judged Inadequate in 2015, but due to significant financial investment caseloads have been reduced and are now maintained at an average of 14 children.
2.12 We have reported on the impacts of high caseloads elsewhere in government. Our report on transforming rehabilitation in the justice system found that high probation caseloads had reduced the supervision and training that probation officers receive and the service they provide.25
22 Ofsted, Common weaknesses in local authorities judged inadequate under the single inspection framework – a summary, November 2015.
23 A number of local authorities, who did not report data on their agency worker and vacancy rates, have been excluded.24 There are data on agency staffing for 20 of 21 authorities judged Inadequate.25 Comptroller and Auditor General, Transforming Rehabilitation, Session 2015-16, HC 951, National Audit Office, April 2016.

Children in need of help or protection Part Two 29
2.13 We found that some local authorities were increasing spending to recruit more social workers to reduce caseloads, or to offer incentives to attract permanent staff (and reduce agency costs). For example:
• Somerset told us that it had agreed to increase spending on safeguarding staff from £20 million to £26 million a year for four years.
• Manchester has announced an extra £10 million over five years for an additional 132 children’s services staff.
• Rochdale had invested £3 million in children’s services to address these issues and had improved from its 2012 judgement of Inadequate.
• Essex reduced agency staff from 300 to 34 over five years and saved £7 million in 2015-16.
Learning from good practice
2.14 Social workers and others do not always find it easy to find out what works. The Department accepts that a current weakness in the child protection system is the inability to learn effectively from good practice and mistakes.26
2.15 We found some examples of sharing of good practice, such as regional benchmarking clubs and peer review arrangements. Directors of Children’s Services also have their own formal and informal networks. Sources of good practice include:
• data benchmarking tools such as the Local Authority Interactive Tool and Local Government Inform;
• local authority level practice sharing and peer review, including through regional networks of the Association of Directors of Children’s Services;
• Ofsted’s inspection reports; practice notes which bring together key findings; and ‘getting to good’ Ofsted seminars;
• evaluation reports from the Department’s Innovation Programme;
• serious case reviews and the triennial analysis of serious case reviews 2011–2014; and
• academic and other bodies including Research in Practice.
26 Department for Education, Education Select Committee Memorandum: Social Work Reform, December 2015.

30 Part Two Children in need of help or protection
2.16 Local authorities judged Good by Ofsted may support authorities judged Inadequate or Requiring Improvement. The Department also has access to advisers including former Directors of Children’s Services and other experts to support improvements in local authorities. For example, the Department has paid Essex County Council (an authority judged Good by Ofsted) £177,000 for improvement support work with Somerset County Council between March 2015 and August 2016. However, only 24 out of the 103 local authorities inspected so far have help and protection services judged Good by Ofsted. This means there is a risk that Good local authorities will not have the capacity and resources to help the majority that need support.
2.17 The regional distribution of Good high-performing local authorities also poses challenges in sharing of good practice (Figure 10). In three regions – south-west England, East of England and the West Midlands – help and protection services are judged Good by Ofsted in only one local authority. Somerset County Council told us that as well as the support it received from Essex County Council, it had therefore joined the south-east benchmarking club to access advice on good practice.
2.18 In response:
• In 2014, the Department introduced the Innovation Programme to help local authorities try new approaches and learn from best practice.
• The Department announced that 11 local authorities would become Partners in Practice. These authorities will trial new ways of working and model excellent practice for other local authorities to learn from.
• The Department is launching a What Works Centre for social work (paragraph 3.14).
Managing referrals and assessing children’s needs
2.19 Anyone who has concerns about a child’s welfare can request services from their local authority. Requests can come from children themselves, teachers, GPs, the police, health visitors, family members and members of the public. Within local authorities, children’s social care should act as the principal point of contact for welfare concerns. Local authorities are responsible for clarifying the referrals process in their local area. This process should include clear protocols for professionals working with children, and clear signposting to contact details so people know who to contact:
• to request information; or
• to provide information about a child; or
• to request help or protection services (a referral).27
27 HM Government, Working together to safeguard children: A guide to inter-agency working to safeguard and promote the welfare of children, March 2015.

Children in need of help or protection Part Two 31
Figure 10The location of local authorities judged Good for help and protection by Ofsted as at August 2016
Ofsted judgement for ‘children who need help and protection’
Source: National Audit Offi ce analysis of 103 Ofsted reviews of local authorities as at 25 August 2016
Good
Requires Improvement or Inadequate
Not yet inspecteda
b
d
e
f
jk
l
n
o
pr
s
t
v
u
m
g h i
q
w
a Gateshead
b Hartlepool
c Stockton-on-Tees
d North Yorkshire
e Leeds
f Sheffield
g Derbyshire
h Nottinghamshire
i Lincolnshire
j Essex
k Westminster
l Kensington and Chelsea
m East Sussex
n Greenwich
o Hammersmith and Fulham
p Kingston upon Thames
q Hampshire
r Isles of Scilly
s Oxfordshire
t Staffordshire
u Cheshire West and Chester
v Trafford
w Salford
x Bury
c
x

32 Part Two Children in need of help or protection
2.20 There are different arrangements for contacting local authorities in England. In some areas the local authority is the first point of contact. In other areas it may be a multi-agency arrangement, often known as a Multi-Agency Safeguarding Hub (MASH). Physical co-location is an important feature of a MASH as the local authority, police, and health and education services can work together to pool information and assess referrals. However, it is not clear which arrangements work best, how much they cost and whether they deliver value for money.
2.21 It is not possible to say how many contacts local authorities receive as they are not required to count contacts. Local authorities told us that they face a challenge in managing the volume of contacts and referrals they receive as child protection is a statutory duty and demand for services can be unpredictable. The Association of Directors of Children’s Services told us that from its data collection it estimated that in 2013-14 local authorities had received 2.3 million initial contacts (up 65% since 2007-08) of which 660,000 became referrals. According to Ofsted an authority receiving 200 referrals each month may also receive 1,000 contacts that do not lead to referrals. Each time an authority is contacted, it will need to respond, if only to direct the caller to other services.
2.22 Without systematically and consistently counting contacts and referrals, the number of referrals an authority accepts will underestimate the volume of work authorities have to manage. We found that not all local authorities record all contacts and action taken. Local authorities should acknowledge receipt of referrals to the referrer, but we heard that schools and the police do not always get feedback on what happens to their referrals. Statutory guidance allows local authorities 45 working days to make an assessment and decide on next steps. In 2014-15, local authorities took, on average, 28 working days to do this.
2.23 To manage referrals and assess children’s needs for help or protection, each LSCB should agree thresholds with local partners, including the local authority. The thresholds should set out clearly the acceptance criteria for interventions. All local agencies should work to these agreed standards. Without clear thresholds for services that all professionals understand and apply consistently children are unlikely to receive the right help at the right time. Ofsted has found, in weaker local authorities:
• a lack of a common understanding or application of thresholds, as also identified in some serious case reviews;
• thresholds set too high or too low, meaning that some children were not being referred to social care or being referred inappropriately; and
• thresholds not accepted by partners leading to inappropriate referrals or children being left at risk. Somerset County Council told us that in the past 60% of their contacts came from the police but only 5% of case conferences related to concerns raised by the police. The police told us that it was important for local forces to refer any concerns about children to children’s social care, as the police could not determine appropriate action without full information from all local services. They consider they are obliged to make referrals even if they override any agreed local referral thresholds.
Children in need of help or protection Part Two 33
2.24 It is important that children referred to children’s social care get the right assessment and help as soon as possible. If they do not, they are likely to be re-referred into social care and may suffer further harm. In 2014-15, 24% of referrals related to children already referred in the previous 12 months. This percentage has changed little over the last four years. The percentage of re-referrals varied across England from 6% in Havering to 46% in Wakefield (Figure 11 overleaf).28 There will always be a need for re-referral as additional information comes to light but large discrepancies between rates in local authorities need to be examined and practice challenged. The Department collects and publishes data on re-referrals, but does not know why the differences are so great. The Department wants to see the re-referral rate fall over the course of this Parliament.29 The Department does not analyse or act on different re-referral rates, even though rates vary so widely across the country.
2.25 The way in which local authorities and their partners apply thresholds and manage contacts and referrals, affects the costs of helping and protecting children. The Department recently commissioned consultants to examine such costs and how and why they varied between authorities. The consultants carried out case studies in four authorities and identified three potential areas for improving the cost-effectiveness of child protection. These were:
• reducing ‘inappropriate’ contacts and referrals from partners through clear and well-communicated safeguarding thresholds;
• ensuring accurate decisions are taken as early as possible; and
• reducing the time spent on simple contacts and increased use of administrative support.
2.26 The consultants identified potential savings of up to £50 million a year from making these improvements. However, the Department told us that as there were only four case studies it could not guarantee the robustness of the findings and research was ongoing as part of a wider programme of government work in this area.
Local partnership working and information sharing
2.27 Several high-profile cases highlight the tragic consequences of local organisations not working together and sharing information appropriately. The Children Act 2004 requires each local authority to make arrangements to promote cooperation between the authority and each of its relevant partners to improve children’s well-being.
28 City of London and Isles of Scilly are excluded due to small numbers.29 Department for Education, Single departmental plan: 2015 to 2020, February 2016.

34 Part Two Children in need of help or protection
Figure 11Percentage of re-referrals by local authority, 2014-15
Nationally around one quarter of referrals are for children who were already referred in the previous 12 months, but local rates vary widely
Notes
1 If a child is referred more than once in the year, each referral is counted.
2 Data unavailable for South Tyneside or Cornwall. City of London and Isles of Scilly excluded due to small numbers.
Source: Department for Education’s Statistical First Release SFR41/2015 on Children in need and child protection
0% to 10%
11% to 20%
21% to 30%
31% to 40%
41% to 50%
No data
Percentage of re-referrals

Children in need of help or protection Part Two 35
2.28 According to Working together to safeguard children, all organisations in a local area should have arrangements for sharing information between themselves, other professionals and the LSCB.30 The guidance makes it clear that:
• fears about sharing information cannot be allowed to stand in the way of protecting the safety of children. Neither are the Data Protection Act and human rights law barriers to information sharing; and
• no professional should assume someone else will pass on information that they think may be critical to keeping a child safe.
2.29 However, we found examples for improving partnership working and information sharing, including with stronger leadership from central government:
• The child protection taskforce, set up by the Prime Minister in June 2015, is an example of how departments have come together to tackle child abuse. To date the Department for Education has led on much of the taskforce’s work. It will be important for all government departments to play a role and work together. This has not happened so far.
• Key partners do not always provide timely information or attend meetings and conferences. For example, during one inspection Ofsted found 36 cases of concern referred together in one batch from a hospital to a local authority.
We found some barriers to effective information-sharing, such as:
• Partners working on different IT systems without access to each other’s databases. Instead they ‘cut and pasted’ information from their own systems into a common information template – a manual and time-consuming process. There is also a risk that information on a child is not complete.
• Some partners, particularly GPs, may not provide information because of data protection concerns. The Department of Health told us that it considers guidance on this issue to be clear. This includes the fact that GPs can request payment for providing information or attending meetings.
30 See footnote 27.
36 Part Two Children in need of help or protection
However, we also found examples of where local authorities and others were seeking to improve the use and sharing of information:
• Gloucestershire Constabulary is funding the development of a statistical tool with BAE Applied Intelligence, to analyse and predict which children are likely to be most at risk, before children’s social care receives concerns.
• In Trafford, the children’s services team is liaising with GP groups to increase GPs’ engagement in partnership working and information sharing.
• As part of Operation Limelight, Hillingdon Children’s Services is working collaboratively with the Metropolitan Police, Border Force and Barnardo’s on prevention and detection work related to female genital mutilation among flights passing through Heathrow Airport from countries where this type of abuse is prevalent.
• NHS England is managing delivery of the Child Protection – Information Sharing system. By local authorities sharing information with the NHS on children who are on a child protection plan or looked-after, health staff in unscheduled health care settings such as A&E will be alerted to the child’s status. The plan is for the new system to be in use in 80% of such settings by 2018. Currently, around 17,400 children are flagged in the system as having a child prot ection plan, around 35% of children with plans.
The effectiveness of the system
2.30 The Department collects information on the number of referrals, assessments and child protection plans, and on the timeliness of processes, such as how long an assessment takes, or a plan lasts. There are few proxy measures of the effectiveness of the system which include data on re-referrals (paragraph 2.24 and Figure 11), the proportion of children needing repeat child protection plans (paragraph 1.15 and Figure 7), and the percentage of referrals resulting in no further action. The Department told us that a local authority with a high percentage of referrals resulting in no further action might want to consider how it works with partners to improve the appropriateness of referrals.
2.31 There are no national data that track children in need nor measure whether the services they received helped to keep them safe or improved their well-being. Local authorities record the risk factors to children when they are assessed, but when they close a case, they do not record whether or how well the risks identified have been managed. Re-referral rates may indicate how sustainably risks have been addressed.

Children in need of help or protection Part Two 37
2.32 There are limited data on outcomes for children in need, such as on teenage pregnancy or mental health, although the Department reports educational outcomes for children in need using data from the national pupil database. In 2014-15:
• 49% of children in need achieved level 4 or above in reading, writing and mathematics, compared to 80% of all children; and
• 15% of children in need achieved five or more A* to C grades at GCSE (including English and mathematics), compared to 54% of all children.
2.33 Working together to safeguard children states that effective services are ‘based on a clear understanding of the needs and views of children’.31 However, from our review of research and our own focus group with children we found that children considered that they were not always listened to, seen frequently enough by professionals, or asked for their views.
2.34 We saw examples of good practice in local authorities to capture the child’s voice including:
• children and families, or their advocates, attending and contributing to child protection conferences;
• children using mobile apps to feedback on services; and
• children having the opportunity to discuss their experiences in fora such as Islington’s Children’s Active Involvement Service.
31 See footnote 27.

38 Part Three Children in need of help or protection
Part Three
How the Department aims to improve the system
3.1 This part of the report examines:
• the Department for Education’s (the Department) progress to date;
• the Department’s plans to transform services; and
• lessons for the Department in transforming services.
The Department’s progress to date
3.2 Reform in children and families social work is not new. Over many years, individual child tragedies have led to many reviews and reports of children’s social care. In response, the government has changed the law, updated guidance, and introduced more processes.
3.3 However, despite much reform, in 2010, the Department considered some fundamental problems remained and too often vulnerable children and families’ lives were not improving. The Department commissioned Professor Eileen Munro to review the child protection system in England. Munro’s review, published in May 2011 recommended that regulation and prescription should be reduced rather than increased and that the child protection system should focus on the needs and experience of individual children.32 The review made 15 recommendations to government which included:
• revising statutory guidance Working together to safeguard children;33
• revising the inspection framework for child protection;
• developing a set of published performance information to help local authorities and partners benchmark performance, facilitate improvement and promote accountability; and
• appointing a Chief Social Worker in government, to advise on social work practice.
32 E Munro, The Munro Review of Child Protection: Final Report – a child-centred system, Cm 8062, Department for Education, May 2011.
33 HM Government, Working together to safeguard children: A guide to inter-agency working to safeguard and promote the welfare of children, March 2015.

Children in need of help or protection Part Three 39
3.4 In July 2011, the government responded positively to the Munro report accepting most of the recommendations in full and set timescales for implementing the recommendations. A progress report from Munro in May 2012 welcomed the changes being made to the child protection system, but called for faster progress and more attention being paid to how the recommendations linked together.
3.5 Our analysis of the Department’s progress is that it has implemented many of Munro’s recommendations. The Department has appointed a Chief Social Worker, revised and shortened statutory guidance, and collected and published more national and local information to help local authorities assess their performance. However, some recommendations were implemented a year or two later than originally planned. The principal activity of the Department between 2010 and 2016 is shown in Figure 12 overleaf.
3.6 Overall, six years after the Munro review was commissioned, Ofsted judges that fewer than one in four local authorities’ services for children in need of help or protection are Good. Ofsted’s judgements of the quality of services are less positive under the new inspection regime than under the previous inspection regime (which ran from July 2009 to July 2012). Under the previous regime:
• 43% of services were judged Good (compared to 23% in 2016); and
• 13% of services were judged Inadequate (compared to 20% in 2016).
3.7 According to Ofsted, inspections now focus more on practice than was the case under the previous inspection regime. As a result, the current help and protection judgement is widely regarded as a much harder test, although Ofsted has found some local authorities have improved the quality of services in this area. In 2012-13, Ofsted conducted child protection inspections in one third of local authorities where it had the highest level of concern. The methodology for these inspections was comparable to that for ‘help and protection’ under the current single inspection framework. For the 32 local authorities inspected under both frameworks, the judgement for 16 had improved, 13 had remained the same and three had declined.34
3.8 The Department considers Ofsted results show its reforms are having an impact. In March 2016 Ofsted judged overall children’s services as Outstanding in Kensington and Chelsea and in Westminster, the first time it had reached this judgement under its new inspection framework. Both local authorities were judged Good for their help and protection services.
34 Ofsted, The report of Her Majesty’s Chief Inspector of Education, Children’s Services and Skills 2016: social care, June 2016.
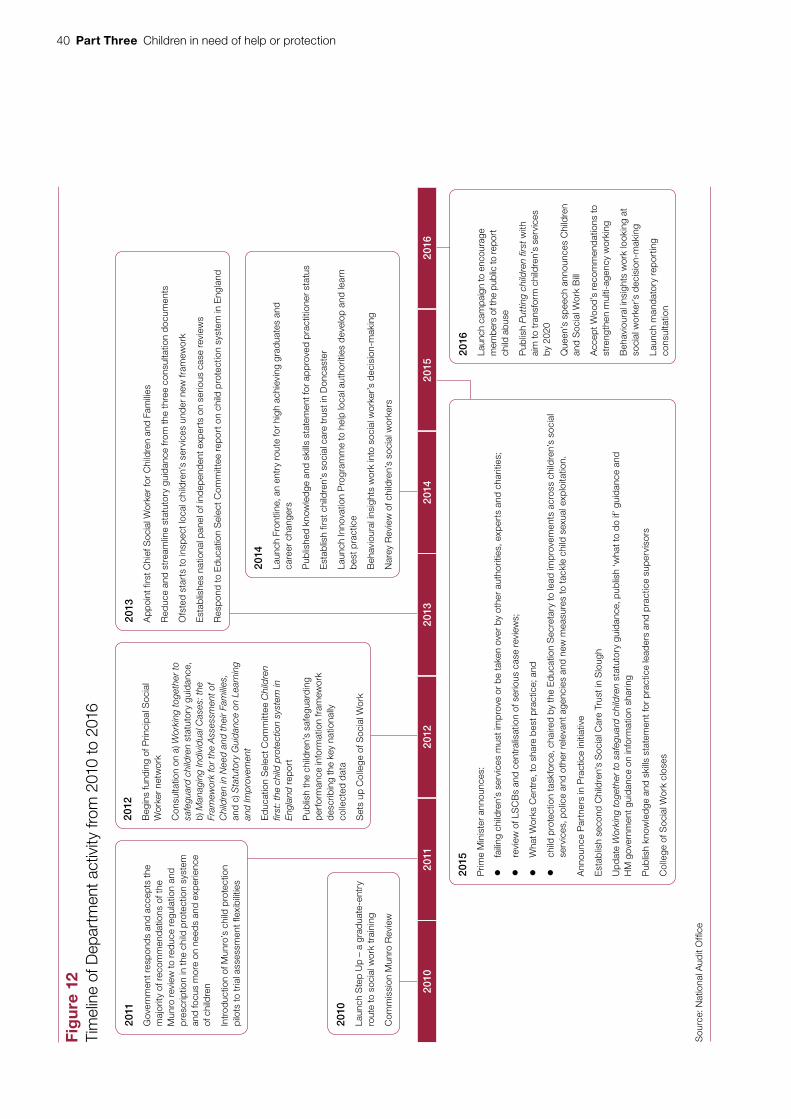
40 Part Three Children in need of help or protection
Fig
ure
12
Tim
elin
e of
Dep
artm
ent a
ctiv
ity fr
om 2
010
to 2
016
Sou
rce:
Nat
iona
l Aud
it O
ffi ce
2013
Ap
poi
nt fi
rst C
hief
Soc
ial W
orke
r fo
r C
hild
ren
and
Fam
ilies
Red
uce
and
stre
amlin
e st
atut
ory
guid
ance
from
the
thre
e co
nsul
tatio
n d
ocum
ents
Ofs
ted
star
ts to
insp
ect l
ocal
chi
ldre
n’s
serv
ices
und
er n
ew fr
amew
ork
Est
ablis
hes
natio
nal p
anel
of i
ndep
end
ent e
xper
ts o
n se
rious
cas
e re
view
s
Res
pon
d to
Ed
ucat
ion
Sel
ect C
omm
ittee
rep
ort o
n ch
ild p
rote
ctio
n sy
stem
in E
ngla
nd
2014
Laun
ch F
ront
line,
an
entr
y ro
ute
for
high
ach
ievi
ng g
rad
uate
s an
d ca
reer
cha
nger
s
Pub
lishe
d kn
owle
dge
and
ski
lls s
tate
men
t for
ap
pro
ved
pra
ctiti
oner
sta
tus
Est
ablis
h fir
st c
hild
ren’
s so
cial
car
e tr
ust i
n D
onca
ster
Laun
ch In
nova
tion
Pro
gram
me
to h
elp
loca
l aut
horit
ies
dev
elop
and
lear
n b
est p
ract
ice
Beh
avio
ural
insi
ghts
wor
k in
to s
ocia
l wor
ker’s
dec
isio
n-m
akin
g
Nar
ey R
evie
w o
f chi
ldre
n’s
soci
al w
orke
rs
2010
Laun
ch S
tep
Up
– a
grad
uate
-ent
ry
rout
e to
soc
ial w
ork
trai
ning
Com
mis
sion
Mun
ro R
evie
w
2012
Beg
ins
fund
ing
of P
rinci
pal S
ocia
l W
orke
r ne
twor
k
Con
sulta
tion
on a
) Wor
king
toge
ther
to
safe
guar
d ch
ildre
n st
atut
ory
guid
ance
, b)
Man
agin
g In
div
idua
l Cas
es: t
he
Fram
ewor
k fo
r th
e A
sses
smen
t of
Chi
ldre
n in
Nee
d an
d th
eir
Fam
ilies
, an
d c)
Sta
tuto
ry G
uid
ance
on
Lear
ning
an
d Im
pro
vem
ent
Ed
ucat
ion
Sel
ect C
omm
ittee
Chi
ldre
n fir
st: t
he c
hild
pro
tect
ion
syst
em in
E
ngla
nd r
epor
t
Pub
lish
the
child
ren’
s sa
fegu
ard
ing
per
form
ance
info
rmat
ion
fram
ewor
k d
escr
ibin
g th
e ke
y na
tiona
lly
colle
cted
dat
a
Set
s up
Col
lege
of S
ocia
l Wor
k
2011
Gov
ernm
ent r
esp
ond
s an
d ac
cept
s th
e m
ajor
ity o
f rec
omm
end
atio
ns o
f the
M
unro
rev
iew
to r
educ
e re
gula
tion
and
pre
scrip
tion
in th
e ch
ild p
rote
ctio
n sy
stem
an
d fo
cus
mor
e on
nee
ds
and
exp
erie
nce
of c
hild
ren
Intr
oduc
tion
of M
unro
’s c
hild
pro
tect
ion
pilo
ts to
tria
l ass
essm
ent f
lexi
bili
ties
2016
Laun
ch c
ampa
ign
to e
ncou
rage
m
embe
rs o
f the
pub
lic to
repo
rt
child
abu
se
Pub
lish
Put
ting
child
ren
first
with
ai
m to
tran
sfor
m c
hild
ren’
s se
rvic
es
by 2
020
Que
en’s
sp
eech
ann
ounc
es C
hild
ren
and
Soc
ial W
ork
Bill
Acc
ept W
ood’
s re
com
men
dat
ions
to
stre
ngth
en m
ulti-
agen
cy w
orki
ng
Beh
avio
ural
insi
ghts
wor
k lo
okin
g at
so
cial
wor
ker’s
dec
isio
n-m
akin
g
Laun
ch m
and
ator
y re
por
ting
cons
ulta
tion
2015
Prim
e M
inis
ter
anno
unce
s:
• fa
iling
chi
ldre
n’s
serv
ices
mus
t im
pro
ve o
r b
e ta
ken
over
by
othe
r au
thor
ities
, exp
erts
and
cha
ritie
s;
• re
view
of L
SC
Bs
and
cent
ralis
atio
n of
ser
ious
cas
e re
view
s;
• W
hat W
orks
Cen
tre,
to s
hare
bes
t pra
ctic
e; a
nd
• ch
ild p
rote
ctio
n ta
skfo
rce,
cha
ired
by th
e E
duc
atio
n S
ecre
tary
to le
ad im
pro
vem
ents
acr
oss
child
ren’
s so
cial
se
rvic
es, p
olic
e an
d ot
her
rele
vant
age
ncie
s an
d ne
w m
easu
res
to ta
ckle
chi
ld s
exua
l exp
loita
tion.
Ann
ounc
e P
artn
ers
in P
ract
ice
initi
ativ
e
Est
ablis
h se
cond
Chi
ldre
n’s
Soc
ial C
are
Trus
t in
Slo
ugh
Up
dat
e W
orki
ng to
geth
er to
saf
egua
rd c
hild
ren
stat
utor
y gu
idan
ce, p
ublis
h ‘w
hat t
o d
o if’
gui
dan
ce a
nd
HM
gov
ernm
ent g
uid
ance
on
info
rmat
ion
shar
ing
Pub
lish
know
led
ge a
nd s
kills
sta
tem
ent f
or p
ract
ice
lead
ers
and
pra
ctic
e su
per
viso
rs
Col
lege
of S
ocia
l Wor
k cl
oses
2010
2011
2012
2013
2014
2015
2016

Children in need of help or protection Part Three 41
The Department’s plans to transform services
3.9 Up to 2014, much of the Department’s activity on children’s services was in response to the Munro review (Figure 12). However, in 2015, the then Prime Minister set up a new child protection taskforce and announced the government was strengthening its approach to intervention in children’s services. In July 2016, the Department published a strategy to transform children’s services – Putting children first: Delivering our vision for excellent children’s social care – as it was concerned about continued inconsistency in the quality of work with children and families, despite its efforts to improve services in the previous six years.35
3.10 The Education Select Committee has voiced concerns about the continuous transformation in children’s social care over recent years without the necessary time to reflect, assess and embed new reforms.36 In July 2016, the Committee recommended that the government should publish a single national plan for implementing both new and previous reforms with clear expectations for local authorities and others on what is required along with achievable timescales. The Committee also recommended that the plan included how the Department would assess the success of its reform agenda by the end of the current Parliament in 2020. The Department’s new strategy was published after the Committee had completed its inquiry but it does respond to this recommendation in part. For example, the Department has a clear objective that, by 2020, all vulnerable children, no matter where they live, should receive the same high quality of care and support. However, it is not so clear how the Department plans to assess the success of its reforms.
3.11 The plans announced by the Department in July 2016 are structured around three areas (Figure 13 overleaf).
35 Department for Education, Putting children first: Delivering our vision for excellent children’s social care, July 2016.36 Education Select Committee, Social Work Reform, July 2016.

42 Part Three Children in need of help or protection
Figure 13The Department’s three areas for reform by 2020
Source: Department for Education, Putting children fi rst: Delivering our vision for excellent children’s social care, July 2016
• Invest in Frontline and Step Up to bring more high calibre recruits into social work
• Have an accredited practice leader in place in every local authority by 2020
• Establish a new programme to develop the most talented social workers into the practice leaders of the future
• Launch a programme for the development of new practice supervisors
• Continue to invest in existing teaching partnerships and support new ones, to raise standards of entry into social work
• Roll out a new system of assessment and accreditation for all child and family social workers, practice supervisors and practice leaders by 2020
• Establish a new specialist regulator for social workers in England
• Led by the new regulator, set new professional standards for social workers; new standards for qualifying education and training; and new specific standards for continuous professional development of social workers
People and leadership. Bring the best people into the profession; give them the right knowledge and skills for the vital work they do; and develop leaders equipped to nurture practice excellence:
• Expand the Innovation Programme
• Work with Partners in Practice
• Introduce new Power to Innovate
• Launch What Works Centre for children’s social care
• Establish new national framework for enquiries into cases of serious harm to children
• Develop effective responses to new and emerging threats
• Move to data-driven practice, and improve quality and collection of data
Practice and Systems. Create the right environment for excellent practice and innovation to flourish:
• Encourage bids for Innovation Programme funding from areas interested in testing out a new delivery model for all or part of a children’s social care service
• Review role of local authority in relation to children, including children’s social care
• Introduce new, more robust, flexible and proportionate inspection arrangements
• Introduce stronger statutory framework for multi-agency safeguarding arrangements, creating greater accountability for key agencies of health, police and the local authority
• Intervene decisively in cases of failure, removing service control from any local authority which has persistently or systemically failed and does not have immediate capacity to improve
Governance and accountability. Make sure what the Department is doing is working and develop innovative, new organisational models to improve services:

Children in need of help or protection Part Three 43
3.12 Below we examine some of the key areas of work the Department is planning under the three areas of reform.
People and leadership
3.13 The Department wants to bring the best people into the social work profession, give them the right knowledge and skills, and develop leaders equipped to nurture excellent practice.
3.14 The Department supports two fast-track training programmes for social workers. These are:
• Step Up to Social Work launched in 2010, a graduate recruitment scheme for those switching career who do not have a background in social care but do have some experience of working with children and young people. Local authority participation in Step Up is voluntary and has grown from 42 in 2010 to 103 in 2016 (68% of all local authorities). A 2013 evaluation of Step Up found that authorities valued the programme and believed it had generated a significant group of highly capable and committed new entrants to social work.37
• Frontline, launched in 2014 is based on the Teach First fast-track scheme for teachers. Frontline targets ‘high-flying’ graduates, particularly those from Russell Group universities, and trains them as children’s social workers. An evaluation of Frontline in 2016 found that although it was too early to assess the impact of the programme on outcomes for children and families, the initial evidence was mostly positive.38
3.15 The Department wants to ensure that by 2020, every local children’s social care workforce has the knowledge and skills to do highly challenging work. It will verify this through assessment and accreditation. The Queen’s speech in May 2016 announced further professional standards for social workers and a specialist regulator for social workers in England. We plan to return to the Department’s social work reform in a future study.
37 R Smith et al., Step up to Social Work Programme Evaluation 2012: The Regional Partnerships and Employers Perspectives, Department for Education, June 2013.
38 Department for Education, Independent evaluation of the Frontline pilot research report, March 2016.

44 Part Three Children in need of help or protection
Practice and systems
3.16 The Department wants to create the right environment for excellent practice and innovation to flourish.
The Innovation Programme
3.17 In 2014, the Department introduced the Innovation Programme to support local authorities and other organisations to try new approaches and share best practice. By June 2016, the Department had provided funding of £110 million to 53 projects. Currently:
• 90 local authorities take part in the programme; and
• 16 projects focus on child help and protection, including those relating to social work practice.
3.18 All projects must build-in an external evaluation of outcomes against pre-set criteria. The Department has no formal governance across the Innovation Programme. It considers each project individually as and when outcome evaluations become available. Based on these initial evaluations, the Department told us that it had ceased funding some projects and had increased funding to other projects. It plans to maintain funding for those that demonstrate the most potential to become scalable and transferrable models of innovative practice. However, implementation of proven good practice cannot be taken for granted. It is not yet clear how the Department will share good practice and innovation generated by the programme or what the model is for encouraging local take-up (but see below on its plans for a What Works Centre). The Department plans to expand the Innovation Programme through £200 million additional investment it announced in April 2016 for all of the Department’s innovation and improvement work for the next four years.
What Works Centre
3.19 In January 2016, the Department committed to establishing a What Works Centre. It aims to build a robust evidence base on ‘what works’ for children’s social care to help local practitioners and commissioners provide cost-effective, front-line services and achieve the best outcomes for children. The Department expects to launch the centre at the end of 2016 and it is to include learning from the Innovation Programme, Partners in Practice, Ofsted, serious case reviews, academic research, and other sources. The Department has set aside a budget of £20 million for the centre over four years, but has not let any contracts so far.
3.20 The Youth Justice Board launched a new online resource for youth justice professionals in June 2016 to share resources and disseminate effective practice. It may provide a useful example for the Department.

Children in need of help or protection Part Three 45
Using data to improve practice
3.21 The Department has a role in supporting local accountability by improving transparency. However, without accurate, complete and comparable data about, for example, the cost of help and protection services, it cannot provide information to support benchmarking or assess value for money.
3.22 Despite the wide variation in local authorities’ reported spending per child in need (paragraph 1.6 and Figure 14 overleaf), it is not clear what influences costs. For example, the data is not detailed enough for the Department to identify what authorities spend on help and protection, just the wider category of social work. The Department cannot explain the differences in spending between authorities on social work and has concerns about the quality of the data reported by authorities. There is a lack of consensus among authorities on how to cost services and complete their spending returns. Only one local authority we visited, Trafford, had calculated the local average annual cost for a child in need (£4,015), and a child on a protection plan (£10,037).
Governance and accountability
3.23 The Department wants to make sure that what it is doing with local authorities is working. The Department is also supporting the development of innovative organisational models for children’s social care such as trusts, including within devolution deals, so as to improve services.
3.24 As described in paragraphs 3.17 and 3.18 the Department is expanding its Innovation Programme and launching a What Works Centre to understand what works in children’s social care. The Department is also taking a more robust approach to intervention to ensure local authorities are more accountable for providing services.
Intervention in children’s services
3.25 The Department has the power to intervene in children’s services if a local authority is failing in any respect to perform its functions to an adequate standard (or at all).39 In December 2015, the Prime Minister announced the government was strengthening its approach to intervention, as in the past children’s services had been taken over on an ad hoc basis with no clear national response to failure.40 This stronger approach included plans to remove the control of services from any authority that had persistently or systemically failed and did not have the capacity and capability to improve itself in a reasonable time frame and bring in high-performing local authorities, experts in child protection and charities to deliver the services.41
39 Under the Education Act 1996 and Children Act 2004.40 Press Release, Prime Minister’s Office, December 2015.41 See footnote 35.

46 Part Three Children in need of help or protection
Fig
ure
14
Rep
orte
d sp
endi
ng o
n so
cial
wor
k (in
clud
ing
func
tions
in re
latio
n to
chi
ld p
rote
ctio
n) p
er c
hild
in n
eed,
by
loca
l aut
horit
y 20
14-1
5
Sp
end
per
chi
ld in
nee
d (£
)
The
r e is
a w
ide
rang
e o
f re
po
rted
sp
end
ing
per
chi
ld in
nee
d
No
te
1 U
nder
Sec
tion
251
of th
e A
pp
rent
ices
hip
s, S
kills
, Chi
ldre
n an
d Le
arni
ng A
ct 2
009,
loca
l aut
horit
ies
sub
mit
stat
emen
ts a
bou
t exp
end
iture
on
child
ren’
s so
cial
car
eto
the
Sec
reta
ry o
f Sta
te fo
r E
duca
tion.
Sou
rce:
Nat
iona
l Aud
it O
ffice
ana
lysi
s of
S25
1 an
d p
opul
atio
n d
ata
Eng
lish
loca
l aut
horit
ies
0
500
1,00
0
1,50
0
2,00
0
2,50
0
3,00
0
3,50
0
4,00
0
4,50
0
5,00
0
Nat
iona
l ave
rage

Children in need of help or protection Part Three 47
3.26 Government departments should be prepared to challenge and intervene when services are failing, so that poor performance can be identified and appropriate action taken to address it. In July 2016, the Department set out how its intervention regime would work in practice as shown in Figure 15 overleaf.
3.27 For an intervention regime to be effective, drawing on our body of work, we would expect the Department to:
• have an outward-looking culture and mindset and be prepared to challenge local performance, using intelligence and external evidence such as inspection findings;
• use mechanisms to get early warning of emerging risks to performance and reputation that may require action (such as leading indicators, or whistleblower information);
• have authority, whether contractual or legal, to terminate the activities of a local provider that cannot meet its obligations;
• be clear about who is responsible for intervening, the criteria for intervention and what intervention is appropriate; and have flexible contingency plans to respond quickly if a local service provider collapses; and
• have knowledge of what works and the capacity to bring about that change.
We compared the Department’s approach to intervention against these principles (Figure 16 on page 49).
3.28 The Department will continue to intervene only when local authorities’ services are failing and judged Inadequate by Ofsted, but the intervention regime is now clearer as shown in Figure 15. The Department has set out what action it will take and when, including the appointment of advisers and commissioners; and the conditions for establishing a trust to deliver a wide range of specified local authority children’s service functions on behalf of the authority.
3.29 The Department told us that it engages with failing local authorities immediately, once Ofsted has judged services Inadequate. It does not use leading indicators to provide an early warning of failures, only Ofsted’s inspection results. The Department’s interventions are therefore reactive, occurring once services for children have failed, although the Department is putting in place speedier triggers so an emergency Ofsted inspection can be ordered where there are concerns about an authority’s performance because of complaints from whistleblowers or other evidence of poor leadership. The Department has no plans to intervene in local authorities that are not judged as Inadequate by Ofsted, but instead plans to use its Innovation Programme, Partners in Practice and its What Works Centre to help improve the wider system for child protection.

48 Part Three Children in need of help or protection
Sufficientevidence of persistent or
systemicfailure?1,2
Figure 15The Department for Education’s intervention regime (as at December 2015)
Ofsted inspection report publsied with Inadequate judgement
Immediatelyexits intervention
Notes
1 Persistent failure: two or more inadequate judgements in a fi ve year period.
2 Systemic failure: Inadequate across all key Ofsted judgements.
3 Trust arrangements: Company limited by guarantee (Slough and Doncaster); community interest company; mutual; any other alternative delivery model.
Source: Department for Education, Putting children fi rst: Delivering our vision for excellent children’s social care, July 2016
Requires Improvement with inadequate sub-judgements
Department improvement adviser; diagnostic and Improvement Notice within three months
Department Progress Review within six months
Next Ofsted inspection report published (within 12–24 months)
Commissioner reports on improvement and options for removing service control (within three months)
Department issues Statutory Direction and appoints Commissioner
Stays in intervention for six months
Supervision and support for 12 months
Enforced Trust within 12 months3
Trust arrangements in partnership with local authority within 12 months3
Ofstedjudgement?
Local authority has capabilityto improve?
No
No
Good
Yes
Yes
Inadequate
No and is resistant Yes
No but is cooperative
Requires Improvements
Sufficient progress made?
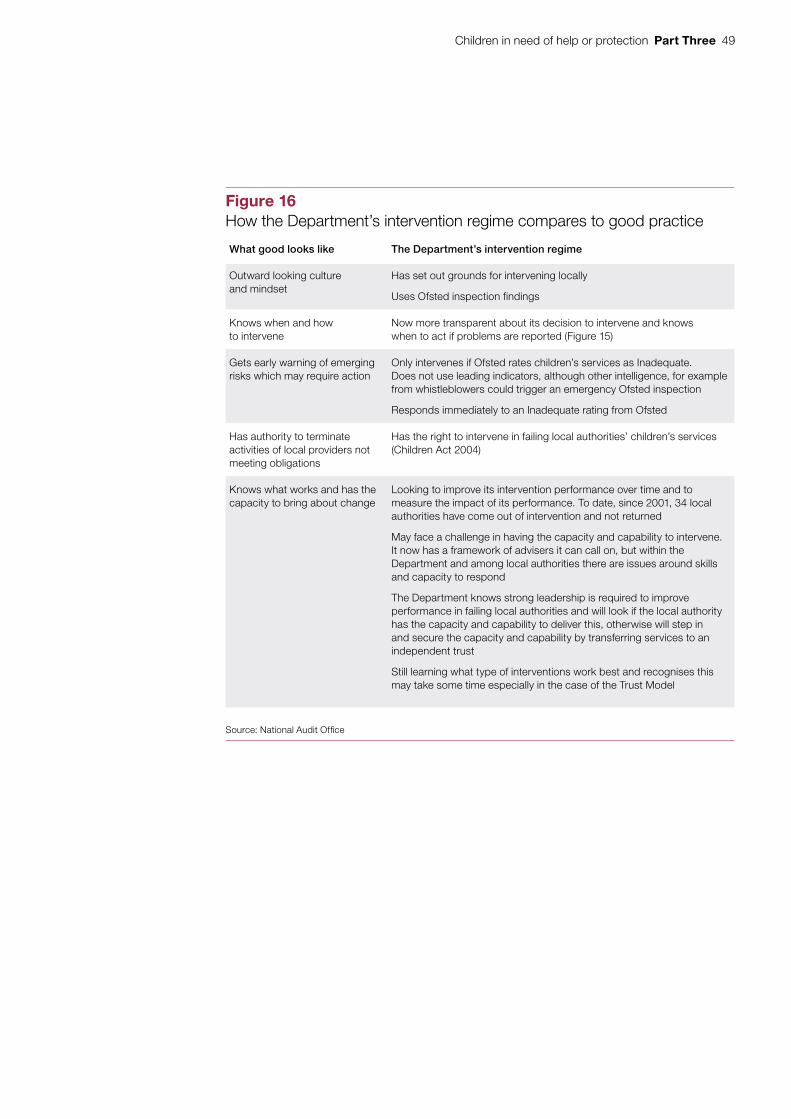
Children in need of help or protection Part Three 49
Figure 16How the Department’s intervention regime compares to good practice
What good looks like The Department’s intervention regime
Outward looking culture and mindset
Has set out grounds for intervening locally
Uses Ofsted inspection findings
Knows when and how to intervene
Now more transparent about its decision to intervene and knows when to act if problems are reported (Figure 15)
Gets early warning of emerging risks which may require action
Only intervenes if Ofsted rates children’s services as Inadequate. Does not use leading indicators, although other intelligence, for example from whistleblowers could trigger an emergency Ofsted inspection
Responds immediately to an Inadequate rating from Ofsted
Has authority to terminate activities of local providers not meeting obligations
Has the right to intervene in failing local authorities’ children’s services (Children Act 2004)
Knows what works and has the capacity to bring about change
Looking to improve its intervention performance over time and to measure the impact of its performance. To date, since 2001, 34 local authorities have come out of intervention and not returned
May face a challenge in having the capacity and capability to intervene. It now has a framework of advisers it can call on, but within the Department and among local authorities there are issues around skills and capacity to respond
The Department knows strong leadership is required to improve performance in failing local authorities and will look if the local authority has the capacity and capability to deliver this, otherwise will step in and secure the capacity and capability by transferring services to an independent trust
Still learning what type of interventions work best and recognises this may take some time especially in the case of the Trust Model
Source: National Audit Offi ce

50 Part Three Children in need of help or protection
3.30 The Department also wants to see local authorities judged Inadequate to make progress within six months of Ofsted publishing its report. However, according to the Institute of Government, failure can get worse before it gets better, although intervention can lead to improvements in the longer term. For example, in 2009, the Department issued an improvement notice to West Sussex children’s services. Despite a subsequent restructuring, a joint Ofsted and CQC inspection of safeguarding and looked-after children’s services in April 2010 judged parts of the service Inadequate. This had a negative effect at first, especially on recruitment and retention (paragraph 2.10). However, the intervention helped bring problems into the open and spurred the authority into taking action, for example by moving towards more effective reporting procedures and failure management. In January 2016, Ofsted announced that West Sussex Required Improvement.
3.31 The Department is still learning about what works best and leads to improvements and what it costs. A 2016 internal audit review on the Doncaster and Slough children’s trusts, concluded that the Department’s setting up of the trusts could have been better value for money. While the Department had not exceeded overall forecast spending on the trusts (about £3 million each), a significant proportion of spending on set-up costs had been on external consultants’ fees (due diligence, legal services and executive search). Internal audit said that improvements in project, cost and knowledge management arrangements could make setting up of trusts cheaper in the future.
3.32 As at September 2016, the Department was intervening in 26 local authorities (Figure 17). We calculated that 20% of children in need in 2014-15 lived in local authorities that were in intervention. This map excludes authorities not yet inspected by Ofsted since November 2013, under its new inspection framework. Since May 2010, 34 local authorities have come out of formal intervention and not returned. These authorities came out of intervention because Ofsted had re-inspected services and found them to be Good or Requiring Improvement. For these 34 authorities, the period of intervention was just over two years on average and ranged from 335 days to 10 years.
Lessons for the Department in transforming services
3.33 The Department faces some significant challenges in transforming children’s services, but it has accepted that it needs to do more to improve services, given the current inconsistency in the quality of services across England. In June 2016, the Department also announced its broader plan to introduce a new operating model for the organisation by the end of 2017, so it has the right skills, capacity and capability; and data and systems; to meet its objectives, including for children’s services.
3.34 Much transformation is going on across government that could provide lessons for the Department’s reform of children’s services and implementing its new operating model. For example, the Youth Justice Board’s improvements to the youth justice system have contributed to reductions in recorded youth crime. From our examination of transformation programmes across other parts of government (Figure 18 on page 52), it will be critical that the Department learns from practice and mistakes elsewhere.42
42 Comptroller and Auditor General, Lessons for major service transformation, May 2015.

Children in need of help or protection Part Three 51
Figure 17The Department’s intervention in local authorities (20 September 2016)
Source: National Audit Offi ce analysis of Department for Education’s published Improvement Notices and Directions
a Sunderland
b Darlington
c Doncaster
d Rotherham
e Leicester
f Norfolk
g Buckinghamshire
h Lambeth
i Bromley
j Wandsworth
k Slough
l Surrey
m Reading
n Isle of Wight
o Torbay
p Somerset
q West Berkshire
r Coventry
s Dudley
t Sandwell
u Birmingham
v Wirrall
w Knowsley
x Manchester
y Lancashire
z Cumbria
a
s
ut
cd
e
f
g
h
jk
l
n
o
p
q
r
w x
y
z
m
b
i
Direction
Notice
None
v
The Department was intervening in 26 local authorities
Intervention stage

52 Part Three Children in need of help or protection
Figure 18Lessons for major service transformation
Transformation programmes raise the greatest risks of failure
The Department should plan for the possibility of failure and how it would deal with it, including being clear on the risks of transformation and how it governs and integrates programmes.
Setting realistic goals and being honest about what really matters
Having a clear vision is important as is communicating it. But ambition should not be a barrier to honest conversations about what really matters, what can be delivered, or exploring alternatives for achieving objectives.
Policy development must take account of implementation
If policy is too complicated or expensive to administer, or unintended consequences are not identified early, it is unlikely to be as effective as originally intended.
Not be tempted to score benefits early
Business cases for major transformation programmes typically identify large benefits from undertaking a programme. But these benefits are uncertain and can be highly dependent on the ‘implementation path’, how the programme is introduced and decisions made along the way.
Identifying tangible short-term gains
Caution about what government can achieve in major transformation programmes is not a recipe for inactivity. By identifying tangible short-term gains government can balance the genuine need for flexibility with the demands of taxpayers and stakeholders for visible progress.
Recognise the (senior) organisational cost of transformation
Transformation programmes take a particularly heavy toll on senior leadership. While there is no easy formula for how much transformation an organisation can cope with, it is important to recognise that these are organisationally expensive in terms of leadership attention and capacity.
What it can learn from engagement
User engagement is one of the best ways to understand how a new programme will work in practice. Some of the biggest problems with reforms have arisen when people have not behaved as departments expected.
Anticipating the need to make changes in live running
One big lesson that government as a whole has learned is the need to avoid ‘big bang’ reforms wherever possible. Several departments have adopted incremental, pathfinder or test-and-learn approaches to introducing programmes, recognising that they will need to make changes even while the programme is being introduced.
Recognising the opportunities and limits of technology
The interaction between technology and major transformation programmes is now widely accepted. But the frequency with which IT projects appear to suffer problems shows that IT-enabled business change projects are something to be handled with care.
Set out clear decision-making and challenge
In every major programme departments have to decide about what to prioritise and what to compromise on. The challenge is understanding which elements of a programme are intrinsic to achieving its objectives, and which – while desirable – are not essential.
Source: Comptroller and Auditor General, Lessons for major service transformation, May 2015

Children in need of help or protection Appendix One 53
Appendix One
Our audit approach
1 This study focused on support for children and young people in need of help and protection. It examined:
• the demand for help and protection for children (Part One);
• how the system is working in practice (Part Two); and
• how the Department aims to improve the system (Part Three).
2 We used three evaluative criteria to determine whether the child protection system was working effectively. This report is the third in a series on children’s services. It follows our reports on children in care and care leavers’ transition to adulthood, which we drew on to inform our findings in this report.
3 We have summarised our audit approach in Figure 19 overleaf. We describe our evidence base in Appendix Two.

54 Appendix One Children in need of help or protection
Figure 19Our audit approach
The objective of the Department
How this will be achieved
Our study
Our evaluative criteria
Our evidence
(see Appendix Two for details)
Our conclusions
• We interviewed officials at the Department and other government departments and agencies.
• We consulted with stakeholder groups and sector experts.
• We conducted eight case studies to understand how local authorities meet their statutory duties.
• We reviewed Ofsted inspection reports about services for children in need of help and protection.
• We reviewed Ofsted reports on Local Safeguarding Children’s Boards.
• We analysed administrative and financial data at the local level.
• We reviewed existing literature on child protection and outcomes.
• We spoke to children and young people about what makes a good child protection system.
There is a clear framework for delivery and oversight of child protection services.
The system for child protection is being implemented effectively at the local level.
The Department knows what works, and supports and encourages efficient and cost-effective ways of working.
That all vulnerable children, no matter where they live, receive the same high quality of care and support. The Department for Education aims to transform services by 2020. Its vision for its reform is based around: people and leadership; practice and systems; and governance and accountability.
Currently, the Department provides statutory guidance to local authorities, collects information and makes data and research on good practice publicly available. It supports local accountability and intervenes in poor performing local authorities. Other government departments provide some funding. Local authorities deliver child protection services, while Ofsted inspects these against a framework underpinned by the regulations and standards set by the Department. Local Safeguarding Children’s Boards set the thresholds for child protection services.
We examined whether there is an effective system for child protection.
In 2010, the Department commissioned the Munro review because it considered children’s services were not good enough. Six years later, far too many children’s services are still not Good: quality is generally significantly below par and does not correlate to spending levels, access to help or support is not equal across the country and interventions to improve failed services have been ad hoc. This represents poor progress. The foundations of a cycle of improvement would involve understanding what works, timely measurement of the quality of protection activity across areas, pointing out poor performance and an effective response that improves services quickly. None of these are yet in place to the extent necessary to improve the services quickly enough.
While the Department is not solely responsible for improving the widespread failings of the system it is the only body that can oversee and push systemic change. However, even taking into account the challenge of reforming services delivered through local authorities, and the time needed to achieve systemic improvements, so far the outcomes have been disappointing. To achieve its new goal of improving the quality of all services by 2020 the Department will need to step forward and show a sense of urgency and determination in delivering on their responsibilities.

Children in need of help or protection Appendix Two 55
Appendix Two
Our evidence base
1 We concluded on the support available to children and young people in need of help or protection following our analysis of the evidence we collected between February and June 2016. Our audit approach is outlined in Appendix One.
2 We applied two frameworks to our analysis: an evaluative framework to consider an optimal child protection system, and an intervention framework to outline the principles for an effective intervention regime.
3 We investigated the challenges faced within the child protection system and reviewed the information and analysis available on how the system is working:
• We reviewed existing literature, academic research and published policy documents to inform our understanding of the child protection landscape, including publications by the Education Select Committee and Home Affairs Committee.
• We conducted over 20 interviews with stakeholders and sector experts to understand the challenges within the system, including:
• academics: Professor Eileen Munro, CBE, Professor Paul Bywaters, Dr Rick Hood, Professor Ray Jones, Professor Susan White and Professor June Thoburn;
• the Association of Directors of Children’s Services, and its Resource Committee;
• the Association of Independent Local Safeguarding Children Board Chairs;
• Barnardo’s;
• Chief Constable Simon Bailey, Norfolk Constabulary;
• Gloucestershire Constabulary;
• John Drew;
• the Early Intervention Foundation;

56 Appendix Two Children in need of help or protection
• the Family Rights Group;
• the Local Government Association;
• the National Association of Independent Reviewing Officers;
• The National Society for the Prevention of Cruelty to Children (NSPCC);
• Office of the Children’s Commissioner; and
• Alan Wood, about his review of local safeguarding children’s boards.
• We carried out descriptive analysis to understand the characteristics of children in need and their educational outcomes. We also analysed data on referrals and re-referrals: including reasons, rates, and variations across local authorities.
4 We investigated whether there was a clear framework in place for the delivery and oversight of child protection services:
• We reviewed statutory guidance issued to local authorities, including Working together to safeguard children and the Children Act 1989 and Children Act 2004.
• We interviewed officials from the Department for Education and other government departments, including the Department of Health and the Home Office. We asked about their objectives in relation to child protection, their use of data, and cross-government working.
5 We assessed whether the Department knows what works, and supports and encourages efficient and cost-effective ways of working:
• We reviewed key strategic documents that the Department provided on its efforts to drive improvement within the child protection sector, including the Innovation Programme, its work to understand costs, and its child abuse communications campaign.
• We carried out descriptive analysis of financial data from local authorities’ section 251 returns to calculate the average national spend on child protection services.43
• We consulted officials from agencies including the Office for Standards in Education, Children’s Services and Skills (Ofsted), the Office of the Children’s Commissioner, NHS England, and the police. We asked about their objectives, their use of data and whether they share good practice.
43 Section 251 returns are a requirement of the Apprenticeships, Skills, Children and Learning Act 2009. Local authorities must submit statements about their planned and actual expenditure on children’s social care. Local authorities submit their statements to the Secretary of State for Education.

Children in need of help or protection Appendix Two 57
6 We examined whether the system for child protection is being implemented effectively at the local level:
• We conducted eight case study visits to explore how different local authorities were meeting their child protection duties. Case studies varied by location, type of authority and their most recent Ofsted judgement. They included some local authorities under intervention from the Department. We visited: Buckinghamshire County Council, Doncaster Children’s Services Trust, Essex County Council, Lincolnshire County Council, London Borough of Islington, Rochdale Borough Council, Somerset County Council, and Trafford Council. At each authority we explored their:
• priorities and activities pertaining to child protection, including multi-agency working;
• view on the clarity of roles and responsibilities for delivery and oversight of child protection services;
• view on whether services and outcomes for children and families are improving; and
• methods for identifying and sharing good practice.
• We analysed data from the Department’s Children in Need Census to assess variation in local authorities’ performance.
• We analysed Ofsted inspection reports on services for children in need of help or protection and interviewed Ofsted officials to better understand the inspection framework.
• We also examined the role of Local Safeguarding Children Boards (LSCBs). This involved interviews with LSCB chairs on our case study visits, analysing Ofsted inspection reviews of LSCBs, and an interview with Alan Wood about his review of LSCBs.
7 We examined the sharing of good practice:
• We spoke to a number of individuals involved in child protection on our case study visits, including directors of children’s services, social workers, lead members, multi-agency safeguarding hub representatives, and LSCB chairs. We asked how they met their legal duties and shared best practice.
• We ran a focus group with children and young people with experience of the care system to discuss their views on what makes a good child protection system.
8 We assessed the Department’s approach to intervention:
• We reviewed documents that the Department provided on their intervention regime. We then drew on our previous work and knowledge of good practice and compared the Department’s regime for intervention against our own principles for effective intervention.

This report has been printed on Evolution Digital Satin and contains material sourced from responsibly managed and sustainable forests certified in accordance with the FSC (Forest Stewardship Council).
The wood pulp is totally recyclable and acid-free. Our printers also have full ISO 14001 environmental accreditation, which ensures that they have effective procedures in place to manage waste and practices that may affect the environment.

£10.00
9 781786 040787
ISBN 978-1-78604-078-7
Design and Production by NAO External Relations DP Ref: 11246-001