report department for communities and local government
TRANSCRIPT

Reportby the Comptroller and Auditor General
Department for Communities and Local Government
Financial sustainability of local authorities: capital expenditure and resourcing
HC 234 SESSION 2016-17 15 JUNE 2016

Our vision is to help the nation spend wisely.
Our public audit perspective helps Parliament hold government to account and improve public services.
The National Audit Office scrutinises public spending for Parliament and is independent of government. The Comptroller and Auditor General (C&AG), Sir Amyas Morse KCB, is an Officer of the House of Commons and leads the NAO, which employs some 810 people. The C&AG certifies the accounts of all government departments and many other public sector bodies. He has statutory authority to examine and report to Parliament on whether departments and the bodies they fund have used their resources efficiently, effectively, and with economy. Our studies evaluate the value for money of public spending, nationally and locally. Our recommendations and reports on good practice help government improve public services, and our work led to audited savings of £1.15 billion in 2014.
Report by the Comptroller and Auditor General
Ordered by the House of Commons to be printed on 14 June 2016
This report has been prepared under Section 6 of the National Audit Act 1983 for presentation to the House of Commons in accordance with Section 9 of the Act
Sir Amyas Morse KCB Comptroller and Auditor General National Audit Office
13 June 2016
HC 234 | £10.00
Department for Communities and Local Government
Financial sustainability of local authorities: capital expenditure and resourcing

This report examines trends in capital expenditure and resourcing and the implications for financial and service sustainability in local authorities.
© National Audit Office 2016
The material featured in this document is subject to National Audit Office (NAO) copyright. The material may be copied or reproduced for non-commercial purposes only, namely reproduction for research, private study or for limited internal circulation within an organisation for the purpose of review.
Copying for non-commercial purposes is subject to the material being accompanied by a sufficient acknowledgement, reproduced accurately, and not being used in a misleading context. To reproduce NAO copyright material for any other use, you must contact [email protected]. Please tell us who you are, the organisation you represent (if any) and how and why you wish to use our material. Please include your full contact details: name, address, telephone number and email.
Please note that the material featured in this document may not be reproduced for commercial gain without the NAO’s express and direct permission and that the NAO reserves its right to pursue copyright infringement proceedings against individuals or companies who reproduce material for commercial gain without our permission.
Links to external websites were valid at the time of publication of this report. The National Audit Office is not responsible for the future validity of the links.
11069 06/16 NAO
The National Audit Office study team consisted of: Alex Burfitt, Mark Burkett, Simon Lowe, Robindra Neogi, Cameron Paton and Declan Smyth, under the direction of Aileen Murphie.
This report can be found on the National Audit Office website at www.nao.org.uk
For further information about the National Audit Office please contact:
National Audit Office Press Office 157–197 Buckingham Palace Road Victoria London SW1W 9SP
Tel: 020 7798 7400
Enquiries: www.nao.org.uk/contact-us
Website: www.nao.org.uk
Twitter: @NAOorguk
Contents
Key facts 4
Summary 5
Part OneChallenges to capital resourcing 13
Part TwoCapital expenditure in local authorities 29
Part ThreeThe role of the Department 39
Appendix OneOur audit approach 47
Appendix TwoOur evidence base 49

4 Key facts Financial sustainability of local authorities: capital expenditure and resourcing
Key facts
£12.3bnlocal authority capital spending, 2014-15 (excluding education)
5.3%real-terms increase in capital spending (excluding education), 2010-11 to 2014-15
£148average cost per dwelling of servicing debt for single tier and county councils, 2014-15
0.2% real-terms increase in the value of departmental capital grants to local authorities (excluding education), 2010-11 to 2014-15
£58.7 billion local authority gross external debt, 2014-15
£25.4 billion local authority investments on deposit, 2014-15
9.9% or more of revenue spend taken up by debt costs in 2014-15 exceeded this level in a quarter of single tier and county councils
21% increase in capital spending via grants and loans from local authorities to other bodies
49% proportion of local authorities where real-terms capital spending fell, 2010-11 to 2014-15
Financial sustainability of local authorities: capital expenditure and resourcing Summary 5
Summary
1 Local authorities meet the costs of their statutory and discretionary services through a combination of revenue and capital expenditure. Revenue spending covers day-to-day costs such as wages. Capital expenditure relates to investments in assets such as buildings and transport infrastructure. In 2014-15, authorities spent £38.1 billion on revenue to support services and £12.3 billion on capital (excluding education).
2 Since 2010, the government has reduced funding for local government as part of its plan to address the fiscal deficit. Our previous work has shown that local authority revenue income, including council tax, fell by 25.2% in real terms from 2010-11 to 2015-16.1 This current study focuses on changes in capital resourcing and spending over this period.2 It examines the implications of these changes for authorities’ financial and service sustainability.
3 Local authority capital spending and resourcing operate within a different set of rules from revenue. But there are important interactions between the two. To identify the full range of financial challenges and opportunities faced by local authorities it is important to understand how the two sides of the system interact.
4 A key difference between capital and revenue is that authorities can use long-term borrowing to support capital spending. This gives them freedom to invest in their asset bases and also to pursue ‘invest to save’ schemes which can deliver revenue savings. However, authorities must ensure that borrowing is affordable and must meet debt servicing costs from revenue. These processes are largely self-regulated within the framework of the prudential code for capital finance.
1 Comptroller and Auditor General, Financial sustainability of local authorities 2014, Session 2014-15, HC 783, National Audit Office, November 2014.
2 Capital resourcing refers to the combination of up-front funding and longer-term financing that is used to support capital spending.

6 Summary Financial sustainability of local authorities: capital expenditure and resourcing
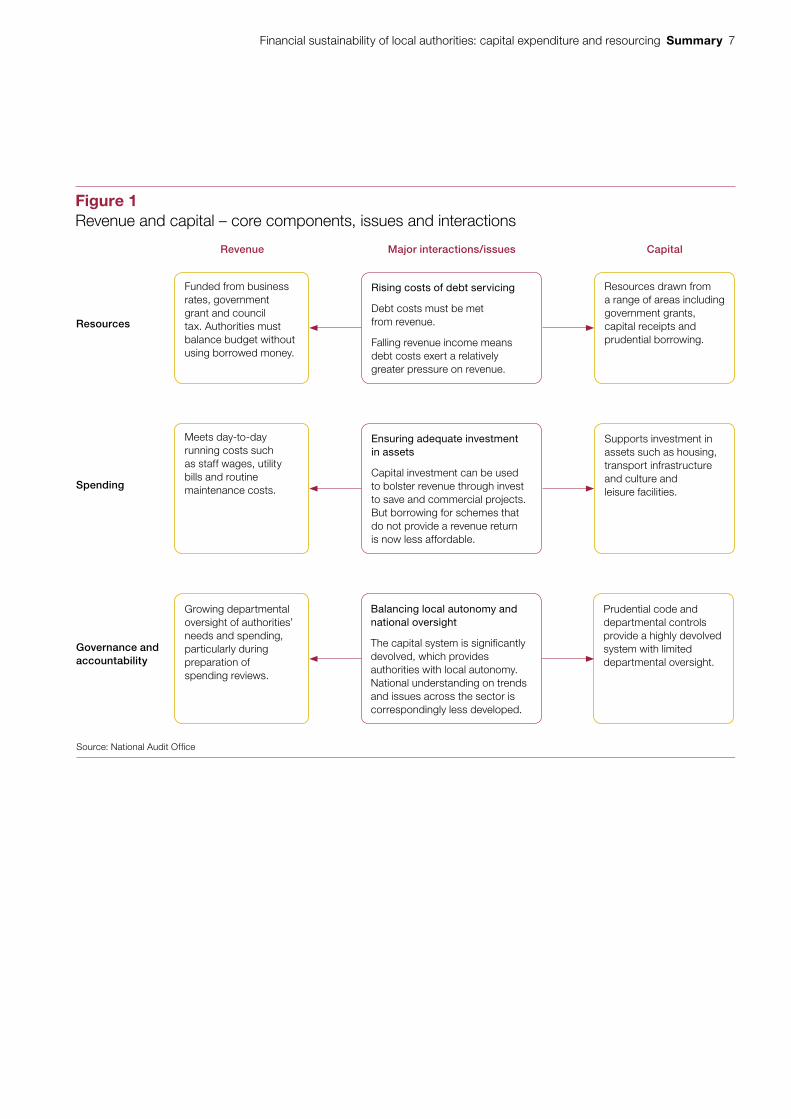
5 This system creates both opportunities and risks for local authority financial and service sustainability (Figure 1) and these form the focus of this study:
• Servicing debt costs from revenue – Local authorities have to meet debt costs from revenue which ensures borrowing remains affordable, but also means that when revenue is falling, the ‘fixed cost’ of servicing historic debt can exert increasing pressure on authorities’ dwindling revenue resources.
• Ensuring adequate investment in local authority assets – In the current context of falling revenue incomes, authorities’ ability to borrow to support long-term investment that does not deliver a direct revenue saving is restricted, even if it is needed to maintain key assets.
• Balancing local autonomy and national oversight – The devolved accountability system for capital provides authorities with substantial autonomy to develop investment strategies in line with local priorities and circumstances. However, this may also mean that there is less understanding in central government of capital issues, trends and challenges across the local authority sector.
The Department for Communities and Local Government
6 The Department for Communities and Local Government (the Department) has responsibility in government for the local government finance system. But accountability for capital is more devolved to authorities, with the Department taking a lighter-touch approach to assurance.
7 The Department does still retain some responsibilities for local authority capital spending and resourcing, however. In particular it:
• oversees a system to support authorities to remain financially sustainable – this involves providing funding for authorities to support their core services, including revenue funding that could be used to service debt; and
• maintains the system of local accountability, which enables the government to assure Parliament that authorities spend their resources, including capital, with regularity, propriety and value for money and that mechanisms are in place in the event of failure.
8 The Department therefore has a more limited role in relation to capital. However, the significance of capital within the local authority financial system, and the pressures it places on revenue income, means that it should still be part of the Department’s understanding of authorities’ financial and service sustainability. The Department should understand when authorities risk being unable to discharge their statutory duties. This includes understanding potentially significant changes in capital expenditure and resourcing.
Financial sustainability of local authorities: capital expenditure and resourcing Summary 7
Figure 1Revenue and capital – core components, issues and interactions
Funded from business rates, government grant and council tax. Authorities must balance budget without using borrowed money.
Meets day-to-day running costs such as staff wages, utility bills and routine maintenance costs.
Growing departmental oversight of authorities’ needs and spending, particularly during preparation of spending reviews.
Source: National Audit Offi ce
Revenue
Spending
Governance and accountability
Major interactions/issues Capital
Rising costs of debt servicing
Debt costs must be met from revenue.
Falling revenue income means debt costs exert a relatively greater pressure on revenue.
Ensuring adequate investment in assets
Capital investment can be used to bolster revenue through invest to save and commercial projects.But borrowing for schemes that do not provide a revenue return is now less affordable.
Balancing local autonomy and national oversight
The capital system is significantly devolved, which provides authorities with local autonomy. National understanding on trends and issues across the sector is correspondingly less developed.
Resources drawn from a range of areas including government grants, capital receipts and prudential borrowing.
Supports investment in assets such as housing, transport infrastructure and culture and leisure facilities.
Prudential code and departmental controls provide a highly devolved system with limited departmental oversight.
Resources
8 Summary Financial sustainability of local authorities: capital expenditure and resourcing
Our report
9 This report examines the implications of changes in capital expenditure and resourcing for local authority financial and service sustainability since 2010-11. It also examines the Department’s oversight role in relation to local authority financial and service sustainability. The report has three parts:
• Part One examines the challenges facing local authorities in resourcing their capital programmes and servicing debt;
• Part Two explores changes in authorities’ capital spending and the implications for services; and
• Part Three examines the Department’s role in overseeing a system to ensure that authorities remain financially sustainable.
A separate Methodology is available on the National Audit Office website: www.nao.org.uk/report/financial-sustainability-of-local-authorities-capital-expenditure-and-resourcing/.
10 In 2014-15, authorities incurred £3.5 billion of capital spending on education. Arrangements for local authority capital spending on education have been radically restructured since 2010-11. The Department for Education provides funding to local authorities to enable them to provide sufficient local school places and to maintain school buildings. However, aggregate funding which local authorities receive direct from the Department for Education has fallen since 2010-11 as many schools are no longer the responsibility of local authorities to maintain. Furthermore, the Building Schools for the Future programme – where funding was routed through local authorities – was cancelled and the new Priority Schools Building Programme is being centrally delivered by the Department for Education rather than through local authorities. The scale and significance of these changes is such that we will publish a separate report on this issue in 2016-17. Consequently, we have not focused on capital spending on education in this report. We have excluded it from our analysis where possible.
Key findings
Challenges to capital resourcing
11 Since 2010-11, local authorities have faced less pressure on their resources to support capital expenditure relative to revenue. Local authorities’ revenue spending power (government grant and council tax) fell by 25.2% in real terms from 2010-11 to 2015-16. In contrast, we estimate that capital grants to authorities (excluding education) increased by 0.2% from 2010-11 to 2014-15. The use of other forms of capital resource, such as capital receipts, also increased. Authorities have also had the option to borrow to support capital spending (paragraphs 1.8 to 1.12 and Figure 4).
Financial sustainability of local authorities: capital expenditure and resourcing Summary 9
12 The primary challenge facing authorities in managing their capital spending and resourcing has been to minimise the revenue cost of their capital programmes. Authorities meet debt servicing costs from revenue spending. In 2014-15, these costs accounted for £3.6 billion of revenue, equivalent to 7.8% of revenue spend (excluding education). Authorities’ key priorities are reducing these and ensuring that they do not go up as a result of new borrowing. They have adopted a range of prudent treasury management strategies including minimising external borrowing, and recalculating the minimum revenue provisions (MRP) they must set aside to cover debt repayments. They have also increased ‘internal borrowing’, where authorities fund capital spending from temporarily surplus cash. This avoids interest payments by deferring the need to borrow externally (paragraphs 1.15, 1.18 to 1.31, and 1.37 to 1.39, and Figures 5, 6, 7 and 8).
13 Authorities’ debt servicing costs have grown as a proportion of revenue spending. Mandatory capital costs to revenue fell by 4.3% in real terms between 2010-11 and 2014-15. However, revenue expenditure fell by 14.7%, making capital costs to revenue a relatively larger element of revenue expenditure. A quarter of single tier and county councils now spend the equivalent of 9.9% or more of their revenue expenditure on debt servicing. Metropolitan district councils are particularly exposed, with a quarter spending over 11.2% of their revenue spend on debt servicing. However, across the sector as a whole debt servicing costs as a share of revenue spend fell slightly in 2014-15, as a number of local authorities reduced their MRPs (paragraphs 1.41 to 1.45, and Figures 10 and 11).
14 If interest rates start to rise, new borrowing will become more expensive, and authorities may also take on more external debt in order to lock in relatively low interest rates. Authorities have used internal borrowing to keep the cost of debt servicing down. However, they may switch to external borrowing if an interest rate rise looks imminent in order to lock in borrowing at a relatively low rate. This will push up the cost of debt servicing. At the same time, authorities’ revenue incomes will be constrained by cuts in government funding. If authorities cannot reduce their debt servicing costs, this will place further pressure on revenue spending. Authorities may also decide that borrowing for new capital spending is unaffordable, reducing the scale of future capital programmes (paragraphs 1.46 to 1.47 and 1.52 to 1.53).
15 Counterparty risk has increased as levels of investments on deposit have grown. Local authorities in general are more exposed to counterparty risk – the possibility that an institution holding an investment fails – as levels of early repayment of debt have fallen and investments on deposit with third parties have grown. Early repayment of Public Works Loan Board (PWLB) debt fell from an annual average of £3.4 billion in the three years to 2010-11, to £186 million per year in the three years to 2015-16. Investments on deposit grew by £6.9 billion (37%) from 2010-11 to 2014-15. These changes may have been partly driven by the fall in interest rates in recent years which has increased the premium payable on early repayments by local authorities. However, authorities we spoke to said that changes to PWLB’s early repayment terms in 2007-08 (to protect the National Loans Fund) and to new loan terms in 2010-11 mean early repayment was now no longer value for money (paragraphs 1.32 to 1.36, and 1.54 and Figure 9).

10 Summary Financial sustainability of local authorities: capital expenditure and resourcing
Capital expenditure in local authorities
16 Capital spending by authorities increased slightly from 2010-11 to 2014-15, but this is not even across authorities or service areas. Overall spending increased by 5.3% in real terms. However, 49% of authorities reduced their capital expenditure during this period, with nearly three quarters (72%) of metropolitan district councils reducing their capital spending. These authorities have also seen the greatest reduction in average revenue income since 2010-11. Most service areas saw an increase in capital spend, but culture and related services was an exception: capital spending fell by 22% in this service area, including reductions of 33% on open spaces and 60% on libraries (paragraphs 2.2 to 2.3 and 2.7 to 2.10, and Figures 12, 14 and 15).
17 Authorities have focused capital spending on meeting their statutory responsibilities, engaging in ‘invest to save’ activities and promoting local growth. Authorities have prioritised investment in their assets to ensure that they meet their statutory obligations, such as ensuring that their assets comply with road safety or disability discrimination legislation. However, some have reduced revenue expenditure on routine maintenance, and others have reduced investment in more major capital works on their existing assets. All authorities we spoke to are engaged in invest to save schemes, frequently focused on rationalising their estate. Some authorities are developing capital investment strategies to secure revenue income. Authorities have also been prepared to invest in schemes to support local growth (paragraphs 2.11 to 2.24).
18 Authorities face a growing challenge to continue long-term investment in their existing assets. Capital strategies have begun to shift from focusing on managing assets, to generating revenue savings and commercial income. Total spending has remained stable, but increasingly capital activities are focused on invest to save and growth schemes that cover their costs or have potential to deliver a revenue return. However, many areas of authorities’ asset management programmes do not meet these criteria and are now seen as a lower priority. In particular, authorities told us they are delaying long-term investment in capital works on existing assets. This raises concerns about the possible degradation of authorities’ assets and pushes the costs of the maintenance backlog into the future (paragraphs 2.13 to 2.15 and 2.25 to 2.27).
The role of the Department
19 The Department takes assurance from its devolved framework for capital which is robust, but it needs to combine this with a deeper understanding of sector-wide issues. The devolved framework for capital, centred on the Chartered Institute for Public Finance and Accountancy’s (CIPFA) prudential code for capital finance, provides assurance on financial sustainability at the authority level. However, it does not provide a mechanism for identifying trends and issues across the sector. Consequently, the Department has limited insight into broad changes in authorities’ capital resourcing and spending, and associated risks. We have identified several trends, such as the use of internal borrowing, that the Department has not monitored. The Department needs to use data to improve its understanding of risks at the system level, and use this information to support future decision-making (paragraphs 3.5 to 3.8, and 3.20 to 3.24).
Financial sustainability of local authorities: capital expenditure and resourcing Summary 11
20 The Department rightly focused on revenue issues in the 2015 spending review but it will need to focus more on capital in future reviews. The Department is confident from its engagement with authorities that revenue pressures are their main concern. However, our analysis demonstrates that capital costs exert a significant pressure on authorities’ revenue resources. The Department told us it recognises that there is room for improvement in future spending reviews in relation to its understanding and inclusion of capital. We would support this, particularly in relation to understanding other departments’ plans for capital grants (paragraphs 3.10, and 3.13 to 3.18).
21 The Department made a significant change within the capital control framework in 2016-17 without assuring itself sufficiently on the likely outcomes. The Department allowed authorities to use capital receipts to support the revenue start-up costs of transformation projects for a three-year period from 2016-17 in what it described as “a radical shake-up of spending rules”. Before, receipts could only be used to pay off debt or invest in capital programmes. This represents a major shift within a system that has been effective in securing authorities’ financial sustainability and in ensuring that public resources invested in their asset bases are used to secure value for money. While there are challenges in estimating the level of take-up of this new flexibility, the Department could have done more modelling and consultation work to assure itself on potential outcomes given the significance of the change (paragraphs 1.16, and 3.27 to 3.32).
22 Authorities and the Department need to strike an appropriate balance between short-term and long-term considerations with regard to capital arrangements. A variety of decisions by authorities, including changing minimum revenue provision charges and reducing long-term maintenance spending, have prioritised the short term over the long term in their judgement of what is prudent. The Department has increased the scope for such decisions with the new capital receipts flexibility. As financial pressures continue and intensify, such choices may increase. While we recognise the importance of short-term requirements, local authorities and the Department must consider the long-term value-for-money impacts of decisions relating to capital investment and debt servicing (paragraphs 1.29 to 1.31, 2.13 to 2.15 and 3.31 to 3.32).
Conclusion on value for money
23 Local authorities’ capital programmes since 2010-11 have not been under the same pressure as their revenue income. Authorities have maintained their overall capital spending levels and have acted prudently, seeking to minimise or reduce the cost of debt servicing wherever possible. Despite authorities’ best efforts, debt servicing costs account for a significant share of revenue spending, and this is likely to increase further. This means further borrowing by some authorities may not be affordable, calling into question their capacity to invest in and maintain their core assets.

12 Summary Financial sustainability of local authorities: capital expenditure and resourcing
24 The Department needs to strengthen its understanding of the capital issues faced by local authorities. The Department is right to take confidence from the devolved capital control framework built around the prudential code, but this is not enough by itself. It should be complemented with an understanding of system-wide issues and risks that the Department does not currently have. This includes an understanding of the drivers behind, and implications of, local authorities pushing debt servicing costs into the future and delaying investment in capital works. Without this understanding of broader trends the Department will not be well placed to anticipate risks to value for money from changes in authorities’ capital programmes as they come under greater financial pressure.
Recommendations
a The Department should improve its understanding of capital expenditure and resourcing issues and risks across the sector. Working with CIPFA, the Department should analyse these issues based on its existing data.
b The Department should examine the variety of approaches to recalculating minimum revenue provisions currently used by local authorities, and consider whether it needs to review its existing guidance to the sector.
c The Department and HM Treasury should engage with local authorities to investigate the causes of and any possible systemic risks resulting from the build-up of investment cash held on deposit by local authorities.
d The Department needs to investigate the extent to which authorities are reducing their asset management programmes and assess the potential long-term implications.
e There should be a review of the current capital framework to ensure that it is likely to lead to decision-making that appropriately considers the long term given expected financial pressures:
• CIPFA should consider the long-term implications of decision-making in its planned review of the prudential code.
• In conjunction with this work the Department should review the other elements of the framework to ensure that the system as a whole will continue to be sufficiently robust.
• The Department must ensure that any future significant changes to the capital control framework are accompanied by meaningful and proportionate risk assessment.
f The Department should investigate whether the data it publishes on capital spending and resourcing could be made more relevant to local authorities.
Financial sustainability of local authorities: capital expenditure and resourcing Part One 13
Part One
Challenges to capital resourcing
1.1 Since 2010-11, the government has tried to cut the national deficit by reducing public spending. This has included cutting funding to local authorities.3 This part of the report explores how local authorities have addressed this in their resourcing arrangements for capital programmes.4 It examines:
• changes in the resources available to local authorities;
• steps authorities have taken to reduce their capital costs to revenue; and
• risks to financial sustainability from authorities’ capital resourcing arrangements.
Local authority capital expenditure and resourcing
Capital and revenue spend
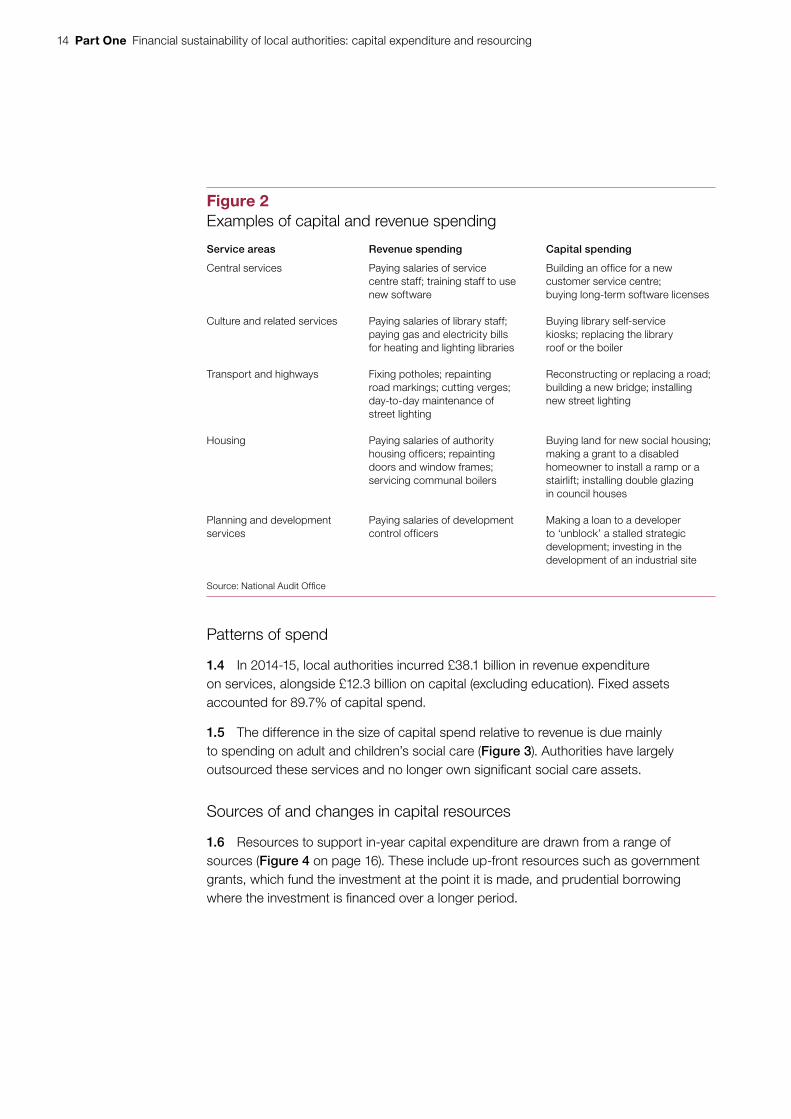
1.2 Local authorities meet the costs of their services through revenue and capital spend (Figure 2 overleaf). Revenue covers day-to-day costs in areas such as staff wages. Capital relates to investments in fixed assets such as buildings and transport infrastructure. Capital spending also includes providing capital grants and loans to other bodies.5
1.3 Individual authorities’ capital spending is shaped by the nature and scale of their asset bases. In 2013-14, local authorities as a whole held assets worth £168.5 billion (excluding education). This included £153.9 billion in operational assets such as council dwellings (£66.3 billion), infrastructure assets like roads (£30.8 billion) and other land and buildings (£44.6 billion). They also held £14.6 billion in non-operational assets including investment properties (£9.9 billion) and heritage assets (£3.6 billion).
3 By local authorities we mean the 353 councils in England. These include London borough councils, metropolitan district councils, county councils, unitary authorities and district councils.
4 Resourcing refers to the combination of up-front funding and longer-term financing that is used to support capital spending.
5 Capital spending can also include revenue spending capitalised by direction. This is where the Department allows an authority to resource revenue spend from capital sources such as borrowing and capital receipts.
14 Part One Financial sustainability of local authorities: capital expenditure and resourcing
Patterns of spend
1.4 In 2014-15, local authorities incurred £38.1 billion in revenue expenditure on services, alongside £12.3 billion on capital (excluding education). Fixed assets accounted for 89.7% of capital spend.
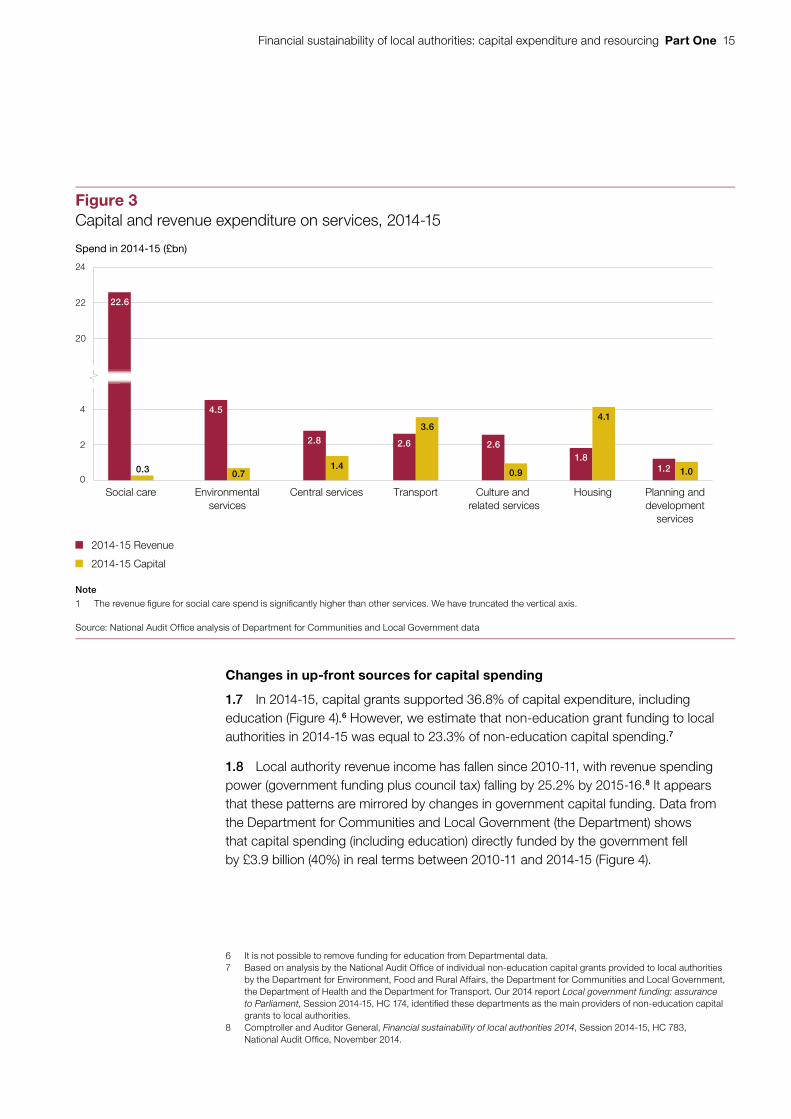
1.5 The difference in the size of capital spend relative to revenue is due mainly to spending on adult and children’s social care (Figure 3). Authorities have largely outsourced these services and no longer own significant social care assets.
Sources of and changes in capital resources
1.6 Resources to support in-year capital expenditure are drawn from a range of sources (Figure 4 on page 16). These include up-front resources such as government grants, which fund the investment at the point it is made, and prudential borrowing where the investment is financed over a longer period.
Figure 2Examples of capital and revenue spending
Service areas Revenue spending Capital spending
Central services Paying salaries of service centre staff; training staff to use new software
Building an office for a new customer service centre; buying long-term software licenses
Culture and related services Paying salaries of library staff; paying gas and electricity bills for heating and lighting libraries
Buying library self-service kiosks; replacing the library roof or the boiler
Transport and highways Fixing potholes; repainting road markings; cutting verges; day-to-day maintenance of street lighting
Reconstructing or replacing a road; building a new bridge; installing new street lighting
Housing Paying salaries of authority housing officers; repainting doors and window frames; servicing communal boilers
Buying land for new social housing; making a grant to a disabled homeowner to install a ramp or a stairlift; installing double glazing in council houses
Planning and development services
Paying salaries of development control officers
Making a loan to a developer to ‘unblock’ a stalled strategic development; investing in the development of an industrial site
Source: National Audit Offi ce
Financial sustainability of local authorities: capital expenditure and resourcing Part One 15
Changes in up-front sources for capital spending
1.7 In 2014-15, capital grants supported 36.8% of capital expenditure, including education (Figure 4).6 However, we estimate that non-education grant funding to local authorities in 2014-15 was equal to 23.3% of non-education capital spending.7
1.8 Local authority revenue income has fallen since 2010-11, with revenue spending power (government funding plus council tax) falling by 25.2% by 2015-16.8 It appears that these patterns are mirrored by changes in government capital funding. Data from the Department for Communities and Local Government (the Department) shows that capital spending (including education) directly funded by the government fell by £3.9 billion (40%) in real terms between 2010-11 and 2014-15 (Figure 4).
6 It is not possible to remove funding for education from Departmental data.7 Based on analysis by the National Audit Office of individual non-education capital grants provided to local authorities
by the Department for Environment, Food and Rural Affairs, the Department for Communities and Local Government, the Department of Health and the Department for Transport. Our 2014 report Local government funding: assurance to Parliament, Session 2014-15, HC 174, identified these departments as the main providers of non-education capital grants to local authorities.
8 Comptroller and Auditor General, Financial sustainability of local authorities 2014, Session 2014-15, HC 783, National Audit Office, November 2014.
Figure 3Capital and revenue expenditure on services, 2014-15
Spend in 2014-15 (£bn)
Note
1 The revenue figure for social care spend is significantly higher than other services. We have truncated the vertical axis.
Source: National Audit Office analysis of Department for Communities and Local Government data
0
2
4
20
22
24
Central services
2.8
1.4
Transport
2.6
3.6
Planning anddevelopment
services
1.2 1.0
Culture and related services
2.6
0.9
Housing
1.8
4.1
Environmentalservices
4.5
0.7
Social care
0.3
2014-15 Revenue
2014-15 Capital
22.6

16 Part One Financial sustainability of local authorities: capital expenditure and resourcing
1.9 However, it is likely that the bulk of the reduction in capital grants to local authorities over this period is the result of the restructuring of education funding arrangements (see paragraph 10). Our separate analysis of capital grants, which excludes those for education, indicates that capital grants to local authorities increased by 0.2% in real terms.9 Case study authorities reflected this picture of stability across non-education grants over this period.
1.10 Use of other sources of up-front funding, such as capital receipts, have increased since 2010-11 (Figure 4). One exception is support from other public and EU bodies, which fell by 24%.
9 See footnote 7.
Figure 4Resources used to support capital expenditure in 2014-15
In-year spend by source of finance, £bn (2014-15 prices)
Note
1 Includes resources for education. It is not possible to separate education from the rest of the data.
Source: National Audit Office analysis of Department for Communities and Local Government data
Centralgovernment
Housing revenueaccount/majorrepairs reserve
Capitalreceipts
Other publicand EU bodies
Directcontributionsfrom revenue
10
9
8
7
6
5
4
3
2
1
0
2010-11
2014-15
Contributionsfrom developers
Prudentialborrowing
9.7
5.8
1.4
2.2
1.41.7
1.10.8 0.7
1.2
0.6 0.7
3.73.4
Financial sustainability of local authorities: capital expenditure and resourcing Part One 17
1.11 Capital expenditure resourced via the housing revenue account increased by 58.3%. Housing revenue accounts are maintained by authorities that have not transferred their social housing stock to a registered social landlord. Rental income is held separately from general revenue income in the housing revenue account and associated major repairs reserve. It is used to support capital investment in social housing stock.
Borrowing
1.12 Authorities can borrow to support capital spend, servicing the debt from revenue sources. Borrowing includes external borrowing from bodies such as the Public Works Loan Board (PWLB). It also includes internal borrowing whereby authorities fund capital expenditure from a temporary surplus of cash. In-year capital spending supported by borrowing fell by 8.6% in real terms between 2010-11 and 2014-15.
Other capital financing options
1.13 Authorities can use a variety of credit arrangements, including the private finance initiative (PFI), to acquire capital assets. They must treat the cost of the capital element of these contracts as though it was borrowing. However, as the capital element of the payments under PFI contracts was usually supported by PFI grant, the net impact on authorities’ revenue resources was limited.
1.14 Until 2010-11, PFI was widely used by authorities. However, when new PFI grant stopped being allocated in 2010-11, the capital value of new contracts signed by authorities fell sharply. In the three years to 2011-12, authorities signed an average of £1.8 billion each year in new contracts. In the three years to 2014-15 the average was £780 million each year.
Capital challenges since 2010-11
1.15 The main issue facing case study authorities in their capital programmes has been ensuring that they put less pressure on their revenue spend. This section sets out how authorities’ capital programmes generate costs to their revenue side. It then examines authorities’ strategies to reduce these costs.
Capital costs to revenue
1.16 The framework in place for local authority capital expenditure and resourcing distinguishes between capital and revenue. This reflects significant differences in the resources that can be used to support the two types of spending. In particular, authorities cannot borrow to finance revenue spending other than in the very short term.10 They also cannot use capital receipts for revenue purposes.11 However, this has been relaxed for a three-year period from 2016-17 to allow them to meet the start-up revenue costs of transformation projects from their new receipts (see paragraph 3.27).
10 This is due to the nature of the statutory requirement for balanced revenue budgets.11 Other than to repay debt, to meet equal pay costs, or where a capitalisation direction has been issued.
18 Part One Financial sustainability of local authorities: capital expenditure and resourcing
1.17 Despite their general separation, the revenue and capital sides of authorities’ expenditure and resources do interact. Interactions include:
• Revenue maintenance costs
Routine maintenance and repair costs of local authority assets are met from revenue expenditure. Investment in more significant capital works to extend the life of an asset is met from capital spend.
• Mandatory debt servicing costs
Local authorities must meet interest payments from revenue resources. They also must set aside a minimum revenue provision (MRP) to repay the principal of any external debt.
• Voluntary debt servicing costs
Authorities can make overpayments on their MRP.
• Direct contributions from revenue to capital
Revenue income can be applied directly to capital expenditure.
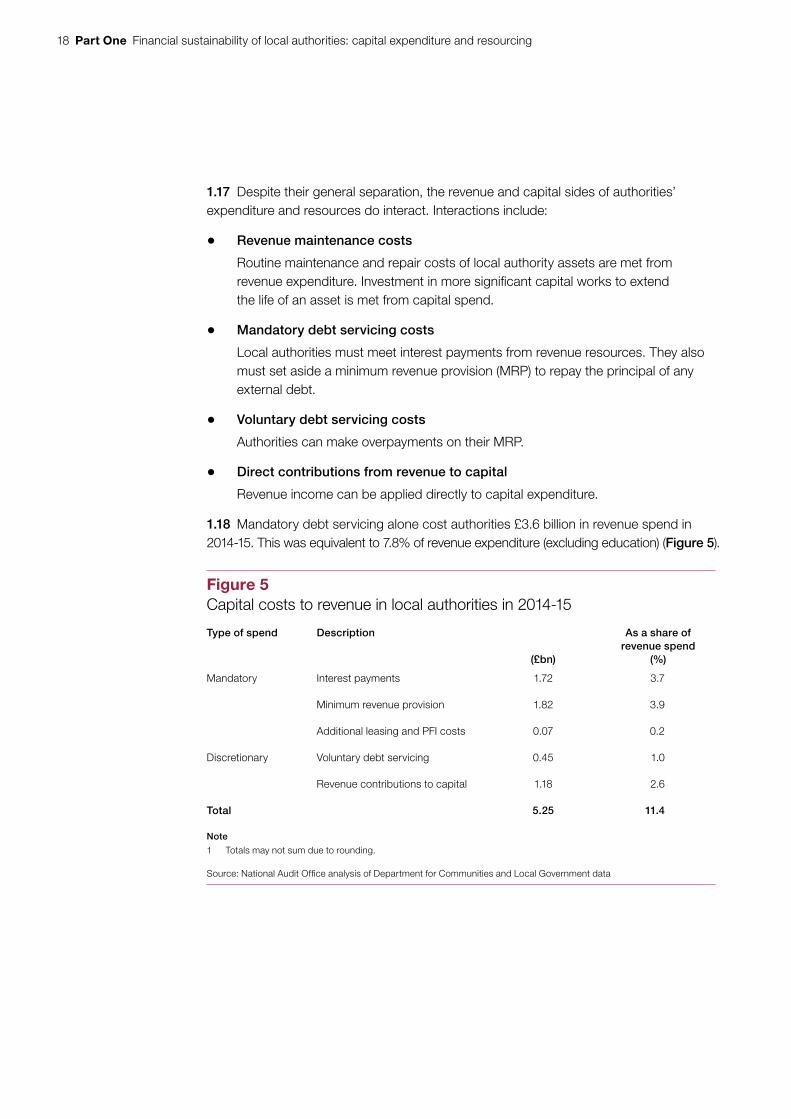
1.18 Mandatory debt servicing alone cost authorities £3.6 billion in revenue spend in 2014-15. This was equivalent to 7.8% of revenue expenditure (excluding education) (Figure 5).
Figure 5Capital costs to revenue in local authorities in 2014-15
Type of spend Description
(£bn)
As a share of revenue spend
(%)
Mandatory Interest payments 1.72 3.7
Minimum revenue provision 1.82 3.9
Additional leasing and PFI costs 0.07 0.2
Discretionary Voluntary debt servicing 0.45 1.0
Revenue contributions to capital 1.18 2.6
Total 5.25 11.4
Note
1 Totals may not sum due to rounding.
Source: National Audit Offi ce analysis of Department for Communities and Local Government data

Financial sustainability of local authorities: capital expenditure and resourcing Part One 19
Strategies to reduce capital costs to revenue
1.19 To reduce the pressures on their revenue income, authorities have tried to reduce their capital costs to revenue through a range of strategies.
Minimising new borrowing costs
1.20 Borrowing incurs debt servicing costs that have to be met from revenue resources. A common approach among authorities we spoke to was to seek to minimise new borrowing costs. This could be by avoiding new borrowing, or by concentrating new borrowing on financing invest to save schemes intended to provide compensating savings leading to no net cost. However, some authorities have taken advantage of low interest rates to invest in strategic priorities.
1.21 The general reluctance among our case study authorities to borrow more is reflected in the amount of gross external borrowing held by authorities. Although gross borrowing increased in 2011-12, this was because local authorities moved to self-financing their housing revenue accounts.12 Gross external borrowing remained relatively unchanged in cash terms from 2011-12 to 2014-15 (Figure 6). Gross external borrowing in 2014-15 stood at £58.7 billion.
12 Prior to 1 April 2012, local authorities with housing stock and an assumed deficit on their housing revenue account (HRA) received subsidy from government. Local authorities with housing stock and an assumed HRA surplus paid ‘negative subsidy’ to government. Moving to ‘self-financing’, and an end to further subsidy payments, involved 136 local authorities making payments to the Department totalling £13.4 billion (generally financed by borrowing), and 33 local authorities having £5.3 billion of debt paid off by the Department. (Department for Communities and Local Government, The Housing Revenue Account Self-financing Determinations, February 2012).
Figure 6Change in the stock of external borrowing, 2004-05 to 2014-15
Stock of external borrowing at 31 March, £bn (cash terms)
Gross external borrowing has remained relatively flat in cash terms since 2011-12
Source: National Audit Office analysis of Department for Communities and Local Government data
0
10
20
30
40
50
60
2004-05 2005-06 2006-07 2007-08 2008-09 2009-10 2010-11 2011-12 2012-13 2013-14 2014-15
37.6
42.9 44.147.4 48.4 48.4
50.2
58.1 58.8 58.0 58.7
20 Part One Financial sustainability of local authorities: capital expenditure and resourcing
Using lower-cost lenders
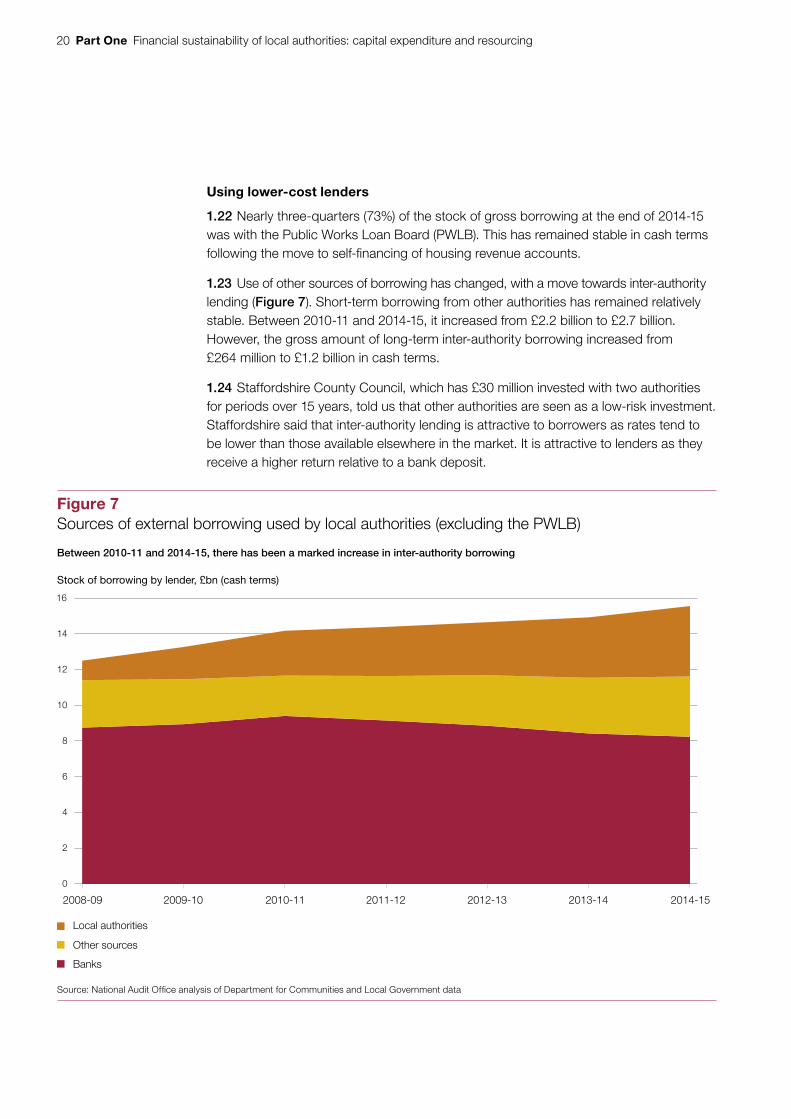
1.22 Nearly three-quarters (73%) of the stock of gross borrowing at the end of 2014-15 was with the Public Works Loan Board (PWLB). This has remained stable in cash terms following the move to self-financing of housing revenue accounts.
1.23 Use of other sources of borrowing has changed, with a move towards inter-authority lending (Figure 7). Short-term borrowing from other authorities has remained relatively stable. Between 2010-11 and 2014-15, it increased from £2.2 billion to £2.7 billion. However, the gross amount of long-term inter-authority borrowing increased from £264 million to £1.2 billion in cash terms.
1.24 Staffordshire County Council, which has £30 million invested with two authorities for periods over 15 years, told us that other authorities are seen as a low-risk investment. Staffordshire said that inter-authority lending is attractive to borrowers as rates tend to be lower than those available elsewhere in the market. It is attractive to lenders as they receive a higher return relative to a bank deposit.
Figure 7Sources of external borrowing used by local authorities (excluding the PWLB)
Stock of borrowing by lender, £bn (cash terms)
Between 2010-11 and 2014-15, there has been a marked increase in inter-authority borrowing
Source: National Audit Office analysis of Department for Communities and Local Government data
Banks
Other sources
Local authorities
0
2
4
6
8
10
12
14
16
2008-09 2009-10 2010-11 2011-12 2012-13 2013-14 2014-15

Financial sustainability of local authorities: capital expenditure and resourcing Part One 21
Increasing internal borrowing
1.25 Local authorities are able to ‘borrow’ internally. This is a treasury management practice whereby an authority delays the need to borrow externally by temporarily using cash it holds for other purposes, such as insurance funds held in earmarked reserves. This allows the authority to avoid paying interest costs until the original expenditure planned for the ‘borrowed’ cash falls due. The authority will then need to take out an external loan to replenish the cash it has spent.13
1.26 All case study authorities bar one said that they have or planned to use this approach to avoid interest payments. Many have accumulated large amounts of cash through earmarked reserves, balances and unpaid grants, and they have used this to support internal borrowing. Their view is that, in the current interest rate climate, cash used to avoid external borrowing provides a greater return than cash on deposit and avoids counterparty risk. Staffordshire County Council said that internal borrowing saves it around £2 million a year in interest costs.
1.27 We estimate that the value of gross internal borrowing among authorities was £12.1 billion in 2014-15 (Figure 8 overleaf).14 Most of this (£7.9 billion) appeared in the two years after the financial crisis as authorities changed their prudential borrowing arrangements fundamentally. Gross internal borrowing grew by a further £4.3 billion in cash terms from 2010-11 to 2014-15.
1.28 Our case study authorities generally did not feel that the availability of cash, and hence their ability to borrow internally, would tighten in the short-to-medium term. In fact, 31.8% of single tier and county councils saw an increase in both internal borrowing and investments from 2012-13 to 2014-15. This is in contrast to earlier periods when internal borrowing was associated with reductions in investments. Nonetheless, authorities were aware of the importance of the availability of cash, not least from their reserves, if they were to continue internal borrowing.
Reducing minimum revenue provision charges
1.29 Authorities have a statutory duty to set aside a prudent minimum revenue provision (MRP) to repay the principal of any debt, having regard to the Department’s statutory guidance. Subject to the guidance, authorities determine their own MRP charge.
1.30 Many of our case study authorities said they have either changed the way they calculate MRP or are considering doing so to reduce revenue costs. Across the sector as a whole, MRP charges peaked in 2012-13 at £2.0 billion. By 2014-15, they had fallen by 8.1% in real terms. Norfolk County Council told us it reduced its annual charge by around £10 million for 2016-17.
13 Department for Communities and Local Government, A guide to the local government capital finance system, internal departmental working paper, January 2016.
14 While there is an expectation that internal borrowing needs to be repaid, it does not represent a formal debt which necessarily needs to be settled in full in the same way as external borrowing. Our figures should be seen as illustrative of the scale of estimated internal borrowing, rather than as necessarily representing the scale of any associated liabilities.

22 Part One Financial sustainability of local authorities: capital expenditure and resourcing
1.31 Authorities have used MRP recalculations to achieve a variety of outcomes, such as spreading future charges over a longer period, taking a temporary break from payments or claiming back previous charges. In our view there is a lack of clarity in the sector about these. Some case study authorities were not aware of approaches taken by other authorities or expressed uncertainty as to whether their proposed approach would be deemed lawful by their external auditors.15
15 In February 2016, we issued guidance to auditors, stating that negative MRP charges are not lawful.
Stock of borrowing at 1 April, £bn (cash terms)
External borrowing
Estimated internal borrowing
Notes
1 Estimated internal borrowing is calculated as cumulative financing requirement minus the sum of external borrowing and other long-term liabilities.
2 See separate Methodology document for full method, treatment of data and limitations of the analysis.
Source: National Audit Office analysis of Department for Communities and Local Government data
Estimated internal borrowing has grown since 2008-09
-10
0
10
20
30
40
50
60
2004-05 2005-06 2006-07 2007-08 2008-09 2009-10 2010-11 2011-12 2012-13 2013-14 2014-15
Figure 8Cumulative change in external and estimated internal borrowing, 2004-05 to 2014-15

Financial sustainability of local authorities: capital expenditure and resourcing Part One 23
Refinancing and repaying debt early
1.32 Authorities can repay fixed-rate PWLB debt early, although they need to pay a premium to PWLB on top of the principal if interest rates have fallen since the loan was taken out. Authorities would be entitled to a discount on their repayment of principal if interest rates had increased more than a small margin relative to the loan.
1.33 Depending on the circumstances, repayment alone, or with refinancing, can have a number of benefits to the authority, including:
• reducing revenue costs by applying capital receipts, extending the length of debt or changing the lender;
• making better use of available cash, given the low interest received if held on deposit; and
• reducing counterparty risk associated with cash held on deposit.
1.34 However, in 2007-08, the PWLB introduced an additional margin to their early repayment terms in order to ensure that the National Loans Fund did not incur a loss on lending.16 HM Treasury is legally prohibited from setting rates that would involve the National Loans Fund lending at a loss. Subsequently, in 2010-11, changes to the terms available for new PWLB loans reduced interest rate differentials between old and new loans without affecting the size of premiums, making refinancing with the PWLB more costly. Following these two changes early repayment has fallen significantly. The average early repayment of debt was £186 million per year in 2013-14 to 2015-16, compared to £3.4 billion per year in 2008-09 to 2010-11.17
1.35 Authorities we spoke to said that while the fall in market interest rates had made repaying debt early more costly, the additional margin on PWLB debt premiums was also a significant factor and meant that early repayment was no longer value for money. Norfolk County Council told us that it would consider repaying elements of its PWLB debt, which could deliver material saving on its revenue costs, were it not for the repayment premium. The additional PWLB margin meant that even if early repayment did deliver revenue savings Norfolk County Council thought it was still not value for money.
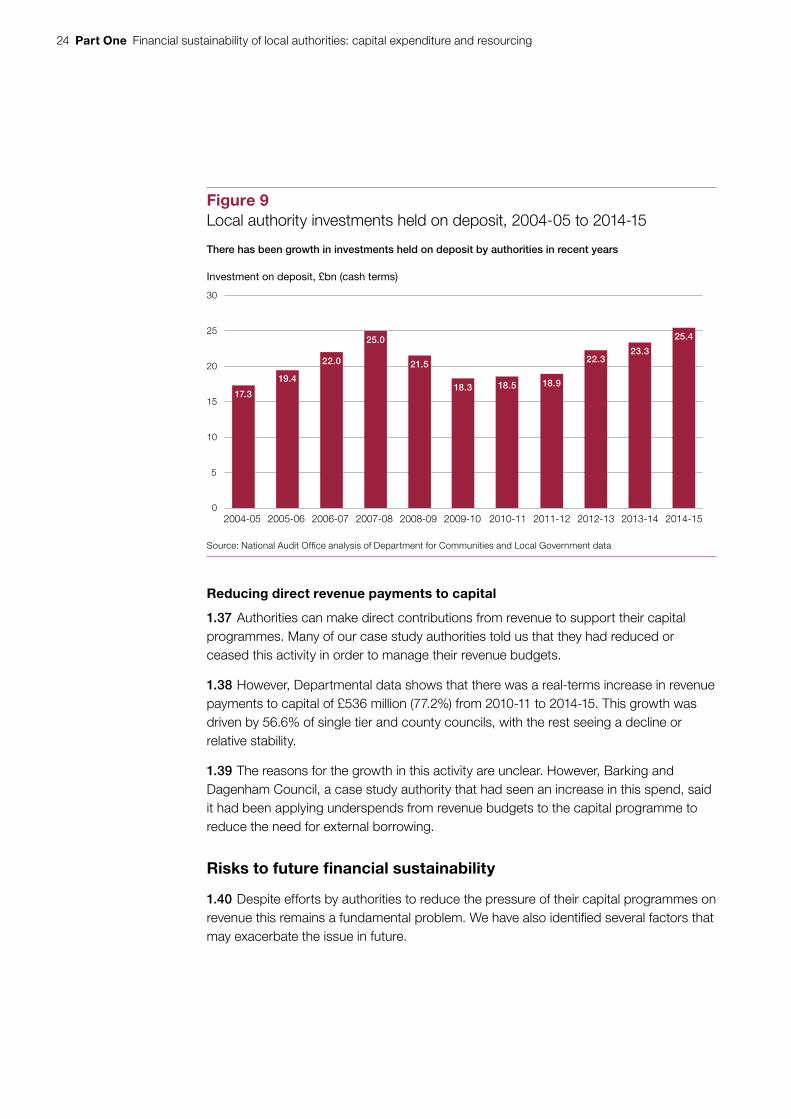
1.36 The drop in early settlement of debt may be a significant factor behind the growth in investments held on deposit by authorities as they continue to set aside resources to repay maturity loans.18 These investments grew by £6.9 billion to £25.4 billion from 2010-11 to 2014-15 (Figure 9 overleaf).
16 The additional margin was based on analysis of volatility in the gilt market. It meant that the values of the repaid loans were calculated using discount rates below the gilt yield curve. This meant that authorities using available cash to repay debt early face a loss relative to them investing it in gilts.
17 Figures are taken from PWLB annual reports and HM Treasury and are in cash terms. They are for the UK as a whole as disaggregated figures are not published. Accordingly, figures for English local authorities only will be lower.
18 Maturity loans mean that authorities pay interest each year but do not repay any principal until the end of the loan period. The purpose of MRP is to make authorities ‘save up’ sufficient resources during the loan period to repay at the end of the loan.
24 Part One Financial sustainability of local authorities: capital expenditure and resourcing
Reducing direct revenue payments to capital
1.37 Authorities can make direct contributions from revenue to support their capital programmes. Many of our case study authorities told us that they had reduced or ceased this activity in order to manage their revenue budgets.
1.38 However, Departmental data shows that there was a real-terms increase in revenue payments to capital of £536 million (77.2%) from 2010-11 to 2014-15. This growth was driven by 56.6% of single tier and county councils, with the rest seeing a decline or relative stability.
1.39 The reasons for the growth in this activity are unclear. However, Barking and Dagenham Council, a case study authority that had seen an increase in this spend, said it had been applying underspends from revenue budgets to the capital programme to reduce the need for external borrowing.
Risks to future financial sustainability
1.40 Despite efforts by authorities to reduce the pressure of their capital programmes on revenue this remains a fundamental problem. We have also identified several factors that may exacerbate the issue in future.
Figure 9Local authority investments held on deposit, 2004-05 to 2014-15
Investment on deposit, £bn (cash terms)
There has been growth in investments held on deposit by authorities in recent years
Source: National Audit Office analysis of Department for Communities and Local Government data
0
5
10
15
20
25
30
2004-05
17.3
2005-06
19.4
2006-07
22.0
2007-08
25.0
2008-09
21.5
2009-10
18.3
2010-11
18.5
2011-12
18.9
2012-13
22.3
2013-14
23.3
2014-15
25.4

Financial sustainability of local authorities: capital expenditure and resourcing Part One 25
Continued pressure from capital costs to revenue
Growth in debt servicing costs
1.41 Mandatory capital costs to revenue (MRP and interest payments) fell (4.3%) from 2010-11 to 2014-15 in real terms. However, over the same period revenue expenditure fell by 14.7%. Consequently, capital costs to revenue are now a more significant element of revenue expenditure.
1.42 In 2014-15, however, debt servicing costs fell more rapidly than revenue spend as a number of local authorities reduced their MRPs. As a result, across the sector as a whole aggregate debt servicing costs fell from 7.9% to 7.8% of aggregate revenue spend from 2013-14 to 2014-15.
Variation in debt servicing costs
1.43 Among single tier and county councils, debt servicing costs have increased from a median of 6.8% of revenue spend in 2010-11 to 7.5% in 2014-15 (Figure 10 overleaf).19 The upper quartile rose from 8.3% to 9.9% over the same period. However, the median and upper quartile fell slightly from highs in 2013-14 of 7.6% and 10% respectively.
1.44 The median figure for district authorities increased from 2.2% to 3% from 2010-11 to 2014-15.20 Growth in debt servicing costs as a share of revenue spend continued into 2014-15 for this type of authority.
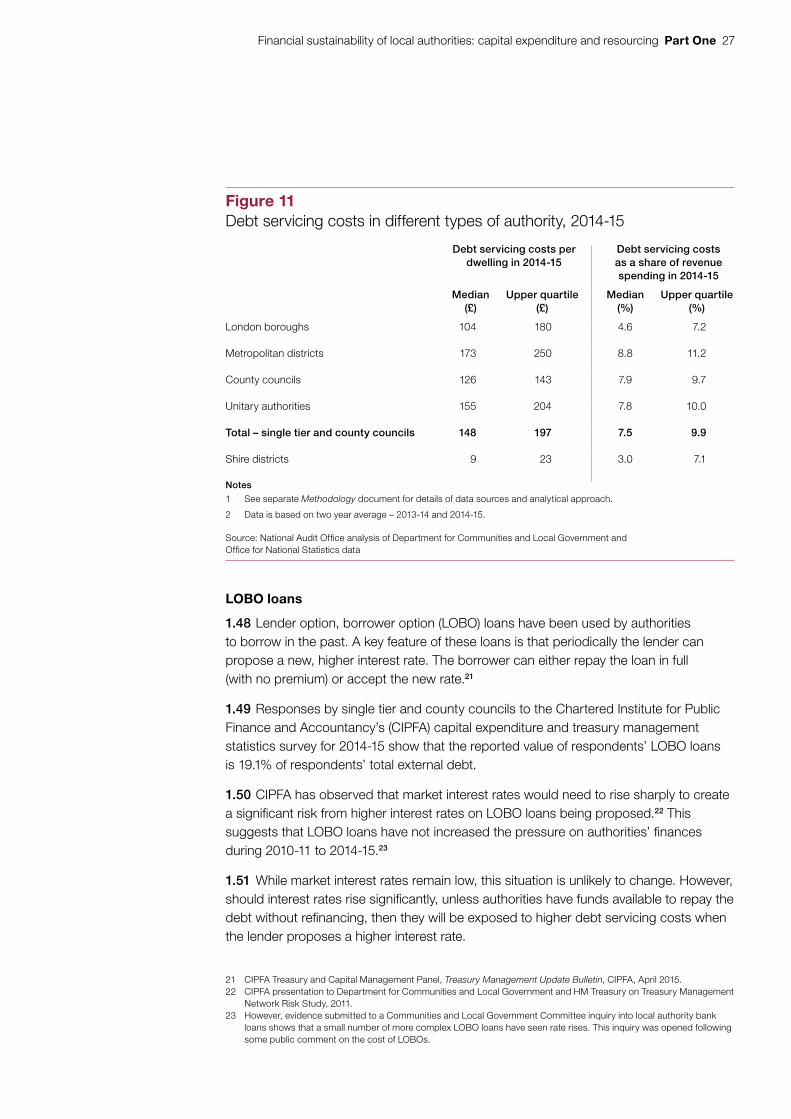
1.45 There are differences in these costs between different types of authority (Figure 11 on page 27). Capital costs to revenue are low in London boroughs and higher in metropolitan districts. In metropolitan districts, a quarter of authorities spend over £250 per dwelling on debt.
The outlook for capital costs to revenue
Risks from increased interest rates
1.46 Authorities have used internal borrowing to delay external borrowing and keep the costs of debt servicing repayments down. However, case study authorities told us that if interest rates looked likely to rise this may encourage them to switch to external borrowing to avoid the risk that, when they do return to the market, interest rates will have risen. However, even if authorities do return to external borrowing before rates rise, any switch to external borrowing will increase the cost of debt servicing relative to internal borrowing.
1.47 There may be some signs that authorities are shifting from internal borrowing. In-year data for 2014-15 shows that the stock of external borrowing increased by £872 million, while the stock of internal borrowing fell by £49 million. In-year figures for 2013-14 showed a £925 million reduction in the stock of external borrowing and a £1.47 billion increase in internal borrowing.
19 Based on a two-year average.20 Based on a two-year average.

26 Part One Financial sustainability of local authorities: capital expenditure and resourcing
Figure 10Change in debt servicing costs as a share of revenue expenditure in single tier and county councils
Debt servicing costs as a percentage of revenue expenditure (%)
Debt servicing costs as a share of revenue spending have increased
6
8
10
12
14
16
18
2009-10 and 2010-11 (average) 2013-14 and 2014-15 (average)
4
2
0
Single tier and county councils
Upper Quartile 8.3 9.9
Median 6.8 7.5
Lower Quartile 4.9 5.5
Notes
1 See separate Methodology document for details of data sources and analytical approach.
2 Data is based on two year averages – 2009-10 and 2010-11 compared to 2013-14 and 2014-15.
Source: National Audit Office analysis of Department for Communities and Local Government data
Financial sustainability of local authorities: capital expenditure and resourcing Part One 27
LOBO loans
1.48 Lender option, borrower option (LOBO) loans have been used by authorities to borrow in the past. A key feature of these loans is that periodically the lender can propose a new, higher interest rate. The borrower can either repay the loan in full (with no premium) or accept the new rate.21
1.49 Responses by single tier and county councils to the Chartered Institute for Public Finance and Accountancy’s (CIPFA) capital expenditure and treasury management statistics survey for 2014-15 show that the reported value of respondents’ LOBO loans is 19.1% of respondents’ total external debt.
1.50 CIPFA has observed that market interest rates would need to rise sharply to create a significant risk from higher interest rates on LOBO loans being proposed.22 This suggests that LOBO loans have not increased the pressure on authorities’ finances during 2010-11 to 2014-15.23
1.51 While market interest rates remain low, this situation is unlikely to change. However, should interest rates rise significantly, unless authorities have funds available to repay the debt without refinancing, then they will be exposed to higher debt servicing costs when the lender proposes a higher interest rate.
21 CIPFA Treasury and Capital Management Panel, Treasury Management Update Bulletin, CIPFA, April 2015.22 CIPFA presentation to Department for Communities and Local Government and HM Treasury on Treasury Management
Network Risk Study, 2011.23 However, evidence submitted to a Communities and Local Government Committee inquiry into local authority bank
loans shows that a small number of more complex LOBO loans have seen rate rises. This inquiry was opened following some public comment on the cost of LOBOs.
Figure 11Debt servicing costs in different types of authority, 2014-15
Debt servicing costs per dwelling in 2014-15
Debt servicing costsas a share of revenue spending in 2014-15
Median(£)
Upper quartile(£)
Median(%)
Upper quartile(%)
London boroughs 104 180 4.6 7.2
Metropolitan districts 173 250 8.8 11.2
County councils 126 143 7.9 9.7
Unitary authorities 155 204 7.8 10.0
Total – single tier and county councils 148 197 7.5 9.9
Shire districts 9 23 3.0 7.1
Notes
1 See separate Methodology document for details of data sources and analytical approach.
2 Data is based on two year average – 2013-14 and 2014-15.
Source: National Audit Offi ce analysis of Department for Communities and Local Government and Offi ce for National Statistics data
28 Part One Financial sustainability of local authorities: capital expenditure and resourcing
Pressure from further reductions in revenue income
1.52 The 2016-17 local government finance settlement set out the Department’s revenue funding plans for authorities up to 2019-20. They involve a 7.8% real-terms cut in spending power from 2015-16 to 2019-20. This is an easing in revenue income pressures experienced to date by authorities. Revenue spending power fell by an estimated 25.2% from 2010-11 to 2015-16. Nonetheless, it is a continuation in real-terms reductions. Unless authorities are able to reduce their capital costs to revenue further these will continue to account for a larger share of this decreasing revenue income.
Future affordability issues
1.53 Authorities face the twin challenge of an increase in the cost of debt servicing if interest rates rise, combined with continued reductions in revenue income. If authorities cannot reduce their capital costs in this context it will place further pressure on their revenue spending. Authorities may also decide, as indicated by some case study authorities, that further borrowing is unaffordable within the context of the prudential code. This will reduce the scale of authorities’ future capital programmes.
Other risks
Counterparty risk
1.54 Between 2010-11 and 2014-15, the amount of cash held by authorities increased. This has allowed them to borrow internally and lend to other authorities. However, a large amount of cash in the sector remains invested in other ways. Consequently, more local authority cash is exposed to counterparty risk – the possibility that an institution holding an investment fails. The move towards ‘bail-in’ arrangements in the event of a financial failure also affects counterparty risk by potentially reducing the amount an authority could recover in the event of failure.24
24 These arrangements are described in HM Treasury, Banking Act 2009: special resolution regime code of practice, March 2015.

Financial sustainability of local authorities: capital expenditure and resourcing Part Two 29
Part Two
Capital expenditure in local authorities
2.1 This section examines:
• changes in the scale of authorities’ capital programmes since 2010-11;
• the objectives they have pursued through their capital programmes; and
• the risks to service sustainability arising from changes in capital programmes.
Changes in spending
Aggregate change
2.2 Revenue spending on services fell by 11.6% in real terms from 2010-11 to 2014-15. Over the same period, capital spending increased by 5.3%, although there was a drop in spending up to 2012-13 (Figure 12 overleaf).
2.3 Overall capital spending increased from 2012-13 because of a rise in spending on transport, planning and development, and housing. This coincides with increases in capital grants for transport and highways, and for local growth (the Growing Places Fund). The upturn in spending on housing coincides with the reinvigorated Right to Buy programme introduced in 2012-13. This required authorities to reinvest receipts from Right to Buy sales in one-for-one replacements.25
Types of capital spending
2.4 Within the aggregate pattern there has been a change in the nature of local authorities’ spending (Figure 13 on page 31). Spending on fixed assets such as buildings increased by £402 million (3.8%) in real terms. The largest area of this spend was new construction, conversion and renovation. This accounted for 75% (£9.2 billion) of all capital spending in 2014-15, and grew by 3.4%. However, spending on financial support to other bodies via loans and grants increased by £220 million (21.2%).
25 Department for Communities and Local Government, Reinvigorating Right to Buy and One for One Replacement, March 2012.

30 Part Two Financial sustainability of local authorities: capital expenditure and resourcing
Figure 12Change in revenue and capital spend, 2010-11 to 2014-15
Spend, £bn (2014-15 prices)
45
40
35
30
25
20
15
10
5
0
Revenue spend on services has fallen consistently since 2010-11, but capital spending has increased since 2012-13
Revenue (£bn) 43.0 40.0 38.9 38.0 37.7
Capital (£bn) 11.7 10.3 9.6 10.8 12.3
Note
1 Revenue figures are for revenue service spend. This is different to the broader revenue spend figure used elsewhere in the report which includes non-service spend – see separate Methodology document.
Source: National Audit Office analysis of Department for Communities and Local Government data
2011-12 2012-13 2013-14 2014-152010-11

Financial sustainability of local authorities: capital expenditure and resourcing Part Two 31
2.5 Expenditure solely on loans increased from £122 million in 2010-11 to £325 million in 2014-15. Authorities may be borrowing from the Public Works Loan Board (PWLB) to support other local service providers that do not have access to the PWLB. Warrington Borough Council told us it had borrowed from the PWLB to finance loans to local housing associations.
2.6 Capital spending solely on grants remained stable. However, this was a net outcome of a drop in grants for housing, combined with growth in other services. Planning and development saw the use of grants increase from £75 million in 2010-11 to £240 million in 2014-15.
Figure 13Change in type of capital spend, 2010-11 to 2014-15
Change in spend 2010-11 to 2014-15, (%)(2014-15 prices)
Capital spending on financial support and intangible assets has grown fastest since 2010-11
Change in spend 2010-11 to 2014-15, (£m)(2014-15 prices)
350
300
250
200
150
100
50
0
-50
35
30
25
20
15
10
5
0
-5
Source: National Audit Office analysis of Department for Communities and Local Government data
Grants andLoans
Intangiblefixed assets
Acquisition ofland and existing
buildings
New constructionconversion and
renovation
Financial Support
Change (%) 21 16 10 3 0
Change (£m) 220 23 83 300 -3
Vehicles, plantand machinery
Fixed Assets
32 Part Two Financial sustainability of local authorities: capital expenditure and resourcing
Service spending changes
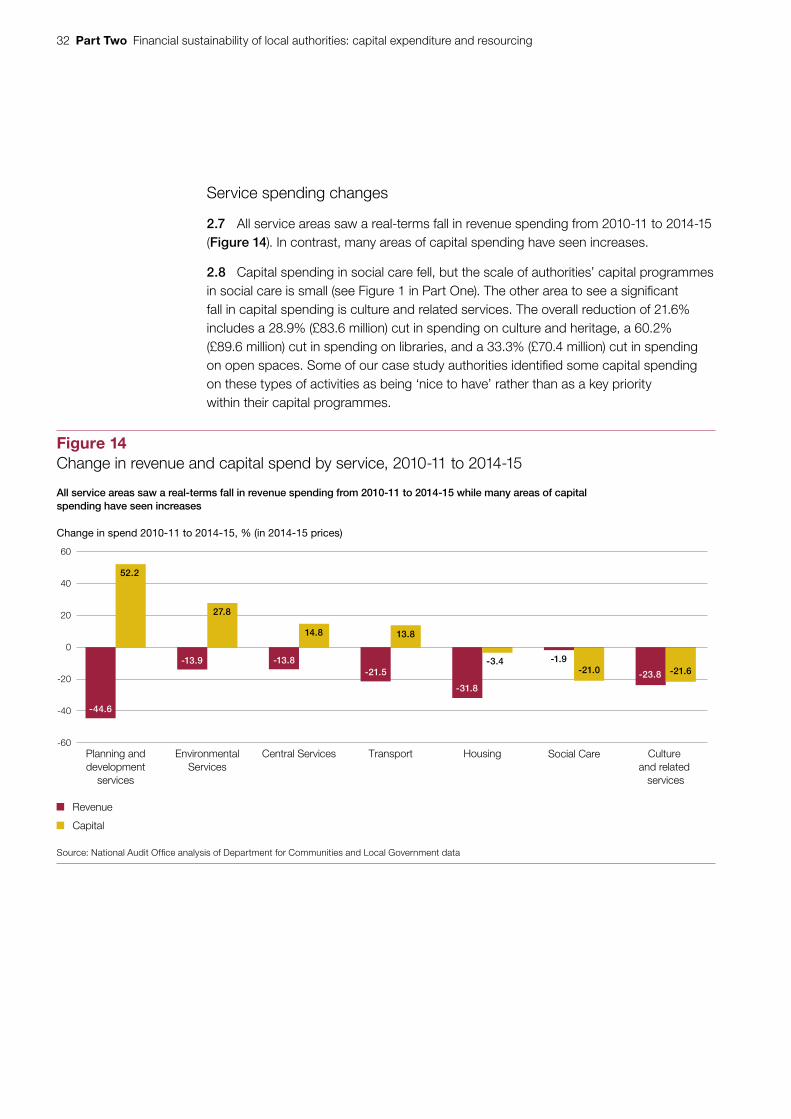
2.7 All service areas saw a real-terms fall in revenue spending from 2010-11 to 2014-15 (Figure 14). In contrast, many areas of capital spending have seen increases.
2.8 Capital spending in social care fell, but the scale of authorities’ capital programmes in social care is small (see Figure 1 in Part One). The other area to see a significant fall in capital spending is culture and related services. The overall reduction of 21.6% includes a 28.9% (£83.6 million) cut in spending on culture and heritage, a 60.2% (£89.6 million) cut in spending on libraries, and a 33.3% (£70.4 million) cut in spending on open spaces. Some of our case study authorities identified some capital spending on these types of activities as being ‘nice to have’ rather than as a key priority within their capital programmes.
Figure 14Change in revenue and capital spend by service, 2010-11 to 2014-15
All service areas saw a real-terms fall in revenue spending from 2010-11 to 2014-15 while many areas of capitalspending have seen increases
-60
-40
-20
0
20
40
60
Planning anddevelopment
services
EnvironmentalServices
Central Services Transport Housing Social Care Culture and related
services
-21.5
Source: National Audit Office analysis of Department for Communities and Local Government data
Revenue
Capital
Change in spend 2010-11 to 2014-15, % (in 2014-15 prices)
52.2
27.8
14.8 13.8
-3.4-21.6-23.8-21.0
-1.9
-31.8
-13.8-13.9
-44.6
Financial sustainability of local authorities: capital expenditure and resourcing Part Two 33
Variation between authorities
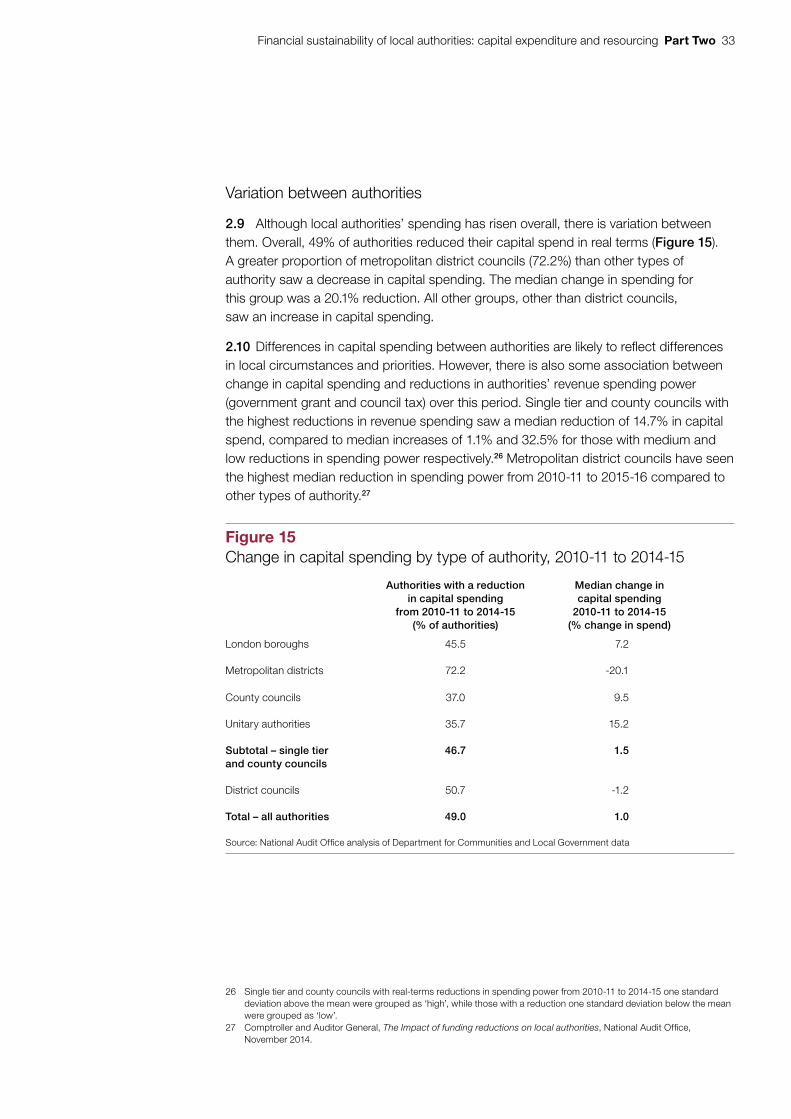
2.9 Although local authorities’ spending has risen overall, there is variation between them. Overall, 49% of authorities reduced their capital spend in real terms (Figure 15). A greater proportion of metropolitan district councils (72.2%) than other types of authority saw a decrease in capital spending. The median change in spending for this group was a 20.1% reduction. All other groups, other than district councils, saw an increase in capital spending.
2.10 Differences in capital spending between authorities are likely to reflect differences in local circumstances and priorities. However, there is also some association between change in capital spending and reductions in authorities’ revenue spending power (government grant and council tax) over this period. Single tier and county councils with the highest reductions in revenue spending saw a median reduction of 14.7% in capital spend, compared to median increases of 1.1% and 32.5% for those with medium and low reductions in spending power respectively.26 Metropolitan district councils have seen the highest median reduction in spending power from 2010-11 to 2015-16 compared to other types of authority.27
26 Single tier and county councils with real-terms reductions in spending power from 2010-11 to 2014-15 one standard deviation above the mean were grouped as ‘high’, while those with a reduction one standard deviation below the mean were grouped as ‘low’.
27 Comptroller and Auditor General, The Impact of funding reductions on local authorities, National Audit Office, November 2014.
Figure 15Change in capital spending by type of authority, 2010-11 to 2014-15
Authorities with a reduction in capital spending
from 2010-11 to 2014-15 (% of authorities)
Median change in capital spending
2010-11 to 2014-15 (% change in spend)
London boroughs 45.5 7.2
Metropolitan districts 72.2 -20.1
County councils 37.0 9.5
Unitary authorities 35.7 15.2
Subtotal – single tier and county councils
46.7 1.5
District councils 50.7 -1.2
Total – all authorities 49.0 1.0
Source: National Audit Offi ce analysis of Department for Communities and Local Government data
34 Part Two Financial sustainability of local authorities: capital expenditure and resourcing
Capital strategies
2.11 Authorities have adopted a range of strategic priorities. In general, we found that authorities were prioritising three objectives:
• fulfilling statutory obligations;
• invest to save activities; and
• promoting growth and regeneration.
Fulfilling statutory obligations
2.12 Authorities’ capital expenditure supports assets used to deliver a range of services. These assets in turn trigger statutory obligations in areas such as health and safety, fire prevention and disability access. Our case study authorities were clear that meeting these immediate legal obligations was a priority within their capital programmes.
2.13 However, away from ensuring that their assets met relevant legal standards, a number of authorities indicated that they were investing less in the upkeep of their existing asset base. Some case study authorities told us that they have reduced or plan to reduce revenue spend on routine repair and maintenance activities in response to revenue pressures. This may subsequently lead to a need for higher or earlier capital spend in order to ensure that the asset remains serviceable.
2.14 Other case study authorities told us they have reduced or are delaying long-term capital investment in capital works and asset management as resourcing this was becoming increasingly difficult. A key issue is that in general authorities we spoke to were unwilling to engage in borrowing to support capital investment that did not cover its costs by delivering revenue savings or income. For example, Portsmouth City Council has effectively excluded borrowing other than for invest to save (or invest to avoid cost increase) schemes as it would be unable to demonstrate that it is complying with the affordability criteria of the prudential code.
2.15 As a consequence, authorities are continuing to make immediate repairs to ensure they meet their statutory obligations, but they are delaying long-term investment in managing assets. For example, Dorset County Council has graded essential capital investment to deliver statutory duties as priority 1 but capital investment in other maintenance as priority 3. It judged a recent service bid for funding to maintain road surface skid resistance to be 50% priority 1 and 50% priority 3. Funding was only made available for the priority 1 element.
Financial sustainability of local authorities: capital expenditure and resourcing Part Two 35
Invest to save activities
2.16 Capital spending programmes have been shaped by the need to reduce pressures on revenue spending. Authorities have made capital investments to lower revenue maintenance costs or generate additional revenue income.
Reducing costs to revenue
2.17 All our case study authorities were involved in efforts to rationalise or restructure their assets to reduce revenue costs. Access to prudential borrowing meant that, in general, authorities would invest in this type of activity if a suitable business case existed:
• Staffordshire County Council built a new office building to replace 17 others. It financed investment costs by external borrowing. Debt servicing costs have been met by reductions in running costs. Energy costs, for instance, are now at 10% of their former level.
• Warrington Borough Council has invested in the replacement of both its IT hardware and its fleet of refuse vehicles. Both investments have generated savings through the need for fewer staff and reduced maintenance costs.
• Leeds City Council has invested in its residential accommodation for looked after children to reduce reliance on externally provided places. External places are funded from the revenue budget, and in the authority’s view are costly.
2.18 Schemes to rationalise assets often form part of wider service transformation programmes. Authorities were keen to stress that reducing their assets, such as numbers of buildings, did not necessarily affect their service provision. For example, Dorset is refocusing its youth service on support to vulnerable young people, in order to improve prevention and reduce demand for specialist services. Overall, 22 youth centres will be offered first for community use, then considered for sale if not taken up.
2.19 In many cases, these activities also allow authorities to generate capital receipts. However, there were differing views on the sale of assets to generate receipts. Some authorities, such as the London Borough of Newham, try to keep assets wherever possible, as members see them as important and they provide opportunities for commercial development. Others have adopted a different approach. Dorset, for instance, is using its partnership with a private property fund to rationalise its assets to ensure that it maximises receipts.
36 Part Two Financial sustainability of local authorities: capital expenditure and resourcing
Generating revenue returns
2.20 Authorities have been prepared to make capital investments if they feel there is potential to secure future revenue income. This reflects a recognition that the sector is moving towards a largely self-financing model:
• Mansfield District Council has a wide portfolio of investments in properties and businesses, increasingly based outside the authority to generate the best revenue return.
• Sevenoaks District Council has a property investment strategy which it anticipates will compensate, over a 10-year period, for the loss of its main government grant by 2018-19. The strategy aims to secure revenue income and support the local economy.
• Newham has set up a council-owned company to develop housing for rental at market rates. In the longer term this will pay a dividend to the authority which can be used to support revenue service spending.
2.21 While there was significant interest and activity in these types of schemes, most authorities were in the early stages of setting them up. Furthermore, some authorities felt that their potential to benefit from these initiatives was limited because of the nature of their local economy and property market.
2.22 There was also an understanding that these types of activities came with risks, particularly in relation to a fall in property values. Authorities have sought to protect themselves by designing schemes around rental incomes rather than sales.
Growth and regeneration
2.23 A final area of capital investment related to local growth. Most case study authorities had prioritised this and were prepared to make capital investments to support it. Frequently, these initiatives were supported by government schemes and bodies. Examples of capital investment to support growth include:
• Birmingham City Council is using funding from its Local Enterprise Partnership (LEP) and the opportunities provided by its city centre enterprise zone to develop sites for office and retail use and extend its metro system.
• Norfolk County Council will use project rate funding from the PWLB as part of its local growth deal to part fund a major new road.28 It will service the debt via a community infrastructure levy – a charge on new properties – overseen by the relevant district authorities.
• Staffordshire County Council invested money they had borrowed in a new junction on the M54 to help secure a Jaguar Land Rover manufacturing plant.
28 PWLB lending in respect of an infrastructure project nominated by a LEP has a 0.4% discount on the standard interest rate.
Financial sustainability of local authorities: capital expenditure and resourcing Part Two 37
2.24 Authorities were aware that local growth was likely to benefit them financially, particularly in the context of the move to the full localisation of business rates. However, there was also a significant amount of uncertainty over the likely implications of business rates localisation with authorities unsure as to how the final scheme would work. Consequently, we found limited evidence that the prospect of full localisation had started to shape authorities’ capital programmes at the current time.
Risks to service sustainability
2.25 Case study authorities were clear that their capital programmes have changed over the last five years, focusing less on investment that does not generate a return. However, despite these changes, their main concerns about providing services were on the revenue side. This is a reflection of the pressure they face on the revenue side. It also reflects the fact that service risks due to a lack of revenue resources are seen as short term and immediate, while service risks due to a lack of capital investment are viewed as long term and more distant.
2.26 Nonetheless, we still identified a range of issues and concerns in relation to authorities’ capital programmes:
• While generally case study authorities did not cite changes in capital grants as a major issue, most authorities with education responsibilities said that capital grant funding for education, and therefore their ability to fulfil their statutory duty to provide school places, was their main concern in relation to grants. We have not explored this issue in detail, however, as we will be considering it as part of our separate study on schools capital funding to be published in 2016-17.
• Several authorities told us they were reducing or planning to reduce investments in areas where they had fewer statutory service responsibilities. Consequently, they were investing less in assets such as youth centres, libraries, museums and parks. This is reflected in the national data on spending.
• While authorities have tried to sustain investment in long-term asset management, several authorities told us this was being cut back or delayed. Norfolk, for instance, has reduced its level of long-term investment in its road network. Some authorities also told us that they were reducing revenue spending on routine maintenance. Several authorities stated that they had growing maintenance backlogs in highways infrastructure and buildings.
• Some authorities have identified commercial investment, often based on investing in property, as a potential source of revenue income to replace declining government grants. As with any commercial investment, there are risks associated with these schemes. The financial sustainability of authorities that rely more on commercially generated revenue income will be at more risk.

38 Part Two Financial sustainability of local authorities: capital expenditure and resourcing
2.27 Overall, there has been a shift in the pattern of capital investment. Total spending has remained stable and some authorities are continuing to borrow. However, increasingly the focus of capital activities is on invest to save and growth schemes that have the potential to deliver a return to the authority. In contrast, authorities are not prepared to engage in borrowing to support spending that will not cover debt costs or generate a revenue return. This raises concerns about their ability to continue to invest in the long-term management of their core assets, and pushes the costs of the associated maintenance backlog into the future.
2.28 National data is not sufficiently detailed to allow the shift in the patterns of spending to be identified. For instance, 75% of total capital expenditure falls within the single category of new construction, conversion and renovation. This is broad enough to capture both invest to save schemes and long-term asset management. Spend in this category has increased by 3.4%. However, this headline figure hides the marked changes in investment strategies and the resulting nature of capital spending that we have identified in case study authorities.

Financial sustainability of local authorities: capital expenditure and resourcing Part Three 39
Part Three
The role of the Department
3.1 The Department for Communities and Local Government (the Department) has a key role in overseeing the financial sustainability of local authorities. It has two main responsibilities in relation to capital issues:
• overseeing a system to support authorities to remain financially sustainable in order to deliver their statutory responsibilities – this involves providing funding for authorities to support their core services, which includes revenue funding that may be used to service borrowing; and
• maintaining a system that provides assurance to Parliament about how local authorities use their resources, including preventing and responding to financial failure.
3.2 This section examines how the Department has discharged these duties.
Ensuring financial sustainability
3.3 The Department is responsible for the local government finance system within central government. The Department recognises that this responsibility covers capital and revenue issues.
3.4 We recognise that the accountability arrangements for capital are more devolved compared with revenue. Nonetheless, to take an informed view on whether there is sufficient funding to maintain financial sustainability, the Department needs to understand authorities’ capital resourcing and spending activities. To do this we expect the Department to:
• collect and analyse data on authorities’ capital resources, spending, assets and liabilities, and to understand the reasons for change; and
• use data and other information effectively to assess local authorities’ financial sustainability in spending reviews.

40 Part Three Financial sustainability of local authorities: capital expenditure and resourcing
Understanding change in capital spending and resourcing
3.5 The Department has a large amount of data covering capital resourcing and spending. However, this data could be used more effectively to allow the Department to develop a better understanding of issues in the sector.
3.6 Our analysis identified several trends that the Department did not monitor. These included the growth in internal borrowing, changes in levels of investment held on deposit by authorities, and increases in inter-authority borrowing. These are significant developments, which provide potential insights into how future patterns of resourcing and spending might develop.
3.7 The Department takes confidence in its devolved framework for capital, and accordingly undertakes limited analysis of national data. However, the framework provides assurance about financial sustainability at the individual authority level. It does not enable the Department to identify issues across the sector. Consequently, the Department has limited insight into broad changes in authorities’ capital resourcing and spending and what the risks associated with these changes are.
3.8 There is an opportunity for the Department to improve in this area by making better use of its data to inform itself of trends and risks at the system level to support future decision-making.
Spending reviews and local government finance settlements
3.9 The most important way that the Department fulfils its role in relation to financial sustainability is through contributing to spending reviews. The Department’s approach to the 2015 spending review improved on previous reviews.
3.10 The Department is confident from its engagement with authorities that revenue pressures, particularly in adult social care, are their main concern. The Department also views the risks associated with capital programmes and resourcing as long term, while those for revenue are seen as short term and immediate. Accordingly, it did not prioritise capital spending and resourcing issues within its approach to the 2015 spending review.
Revenue resources
3.11 The core element of the Department’s work on the 2015 spending review related to informing its submission to HM Treasury about the local government departmental expenditure limit. The limit sets the revenue resourcing envelope for government funding for authorities. To support its submission, the Department modelled income and demand pressures across different service areas at the authority level. This is an improvement on previous spending reviews where information used by the Department was more limited.29
29 Comptroller and Auditor General, Financial sustainability of local authorities 2014, Session 2014-15, HC 783, National Audit Office, November 2014.
Financial sustainability of local authorities: capital expenditure and resourcing Part Three 41
3.12 Debt servicing accounts for a significant share of authorities’ revenue expenditure. It was included in the baseline revenue spending element of the model. However, while the final model projected potential aggregate changes in debt servicing, it did not include authority level projections.
3.13 We recognise the challenges involved in these types of projections. However, we have identified a range of reasons why capital costs to revenue may rise over the medium term. In future spending reviews, the Department should consider ways to build on the improvements it has made to its modelling work by assessing potential changes in the capital costs to revenue in more detail.
Capital grants
3.14 Information that other departments provided to the Department to inform its spending review submission related solely to revenue. Other departments’ intentions for capital grants for authorities were contained in their own submissions to HM Treasury. These departments have ultimate responsibility for the levels of capital grants required to deliver their policies.
3.15 However, changes in capital grant funding levels and conditions can affect an authority’s broader financial position. For instance, if departments intend to reduce capital grants then authorities might look to replace these resources by borrowing or by using revenue resources. However, the Department did not collect information on departments’ intentions for capital grants and therefore does not understand the outlook for capital grant funding for authorities. The Department was therefore unable to adjust its own modelling to reflect any significant changes resulting from other departments’ plans for local authority capital grants.
3.16 Overall, it is unclear how much funding the government provides to authorities in capital grants. In previous local government settlements, the Department published indicative funding for capital grants to authorities across all relevant departments. These provided a valuable overview of the scale and source of capital grant funding for authorities.
Looking forward
3.17 The Department has been largely right to focus on revenue issues in the 2015 spending review, but it has underplayed the significance of capital spending and resourcing. Our analysis demonstrates that capital costs are putting a significant pressure on authorities’ revenue resources. We have also identified several reasons why capital costs to revenue may increase in the future.
3.18 The Department told us it recognises there is room for improvement in future spending reviews. It recognises, for instance, that the planned shift to 100% business rate retention will require it to give new priority to capital issues in future. We would support this. The Department should consider capital issues in more detail in its next spending review submission.

42 Part Three Financial sustainability of local authorities: capital expenditure and resourcing
Preventing financial failure
3.19 The Department is responsible for maintaining a core system that provides the necessary assurance about how local authorities use their resources, including preventing and responding to financial failure.
Preventing failure
The system governing local authority capital spending
3.20 Decision-making and accountability in relation to capital are highly devolved. Since 2004, authorities have had the freedom to decide levels of borrowing and consequently capital spending, and are able to decide where to put their investments.
3.21 This local decision-making sits within a wider capital framework (Figure 16), which forms part of the Department’s overall accountability system for local government. Key elements within the capital control framework include the following:
• The Department is responsible for the framework and accompanying legislation, is able to issue capitalisation directions and publishes guidance on a range of issues.
• HM Treasury sanctions key decisions taken by the Department that may have an effect on the national finances.
• The Chartered Institute of Public Finance and Accountancy (CIPFA) produces the prudential code for capital finance. This sets out guidelines for authorities to ensure that their capital programmes and borrowing are prudent, affordable and sustainable through the setting and monitoring of prudential indicators. Authorities are required by regulation to have regard to the code, for example when members are deciding how much the authority can afford to borrow.30
3.22 Taken together, the code and the Department’s controls form a framework that shapes authorities’ capital spending and resourcing. The Department believes these arrangements promote local decision-making while protecting local financial sustainability and ensuring that local decisions do not undermine government objectives for national debt and borrowing.
3.23 CIPFA is a key partner for the Department. It is the author of the prudential code and treasury management code.31 However, the Department remains responsible for the requirement for authorities to have regard to the codes. CIPFA has ongoing and regular contacts with the Department, for instance through its presence on CIPFA technical panels and boards.
30 The duty to set and keep under review an affordable borrowing limit comes from primary legislation.31 The prudential code was last amended in 2012. CIPFA told us it plans to review the code towards the end of 2016.
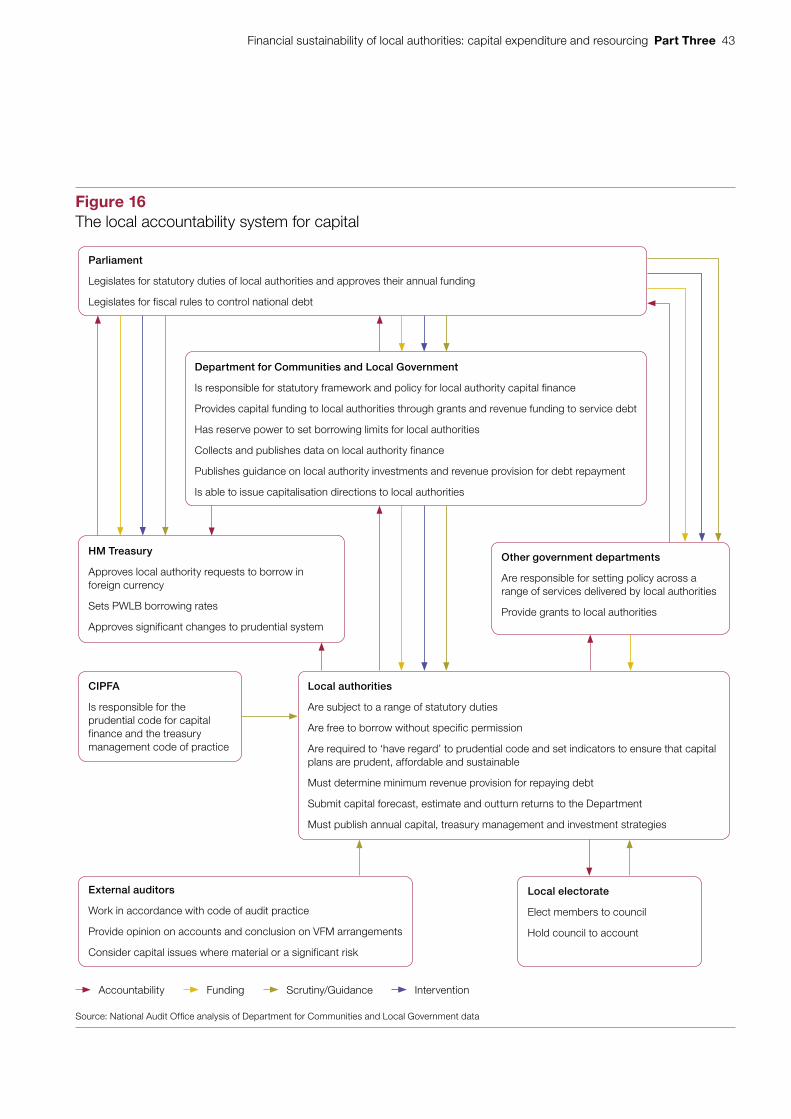
Financial sustainability of local authorities: capital expenditure and resourcing Part Three 43
Figure 16The local accountability system for capital
Parliament
Legislates for statutory duties of local authorities and approves their annual funding
Legislates for fiscal rules to control national debt
HM Treasury
Approves local authority requests to borrow in foreign currency
Sets PWLB borrowing rates
Approves significant changes to prudential system
External auditors
Work in accordance with code of audit practice
Provide opinion on accounts and conclusion on VFM arrangements
Consider capital issues where material or a significant risk
Local electorate
Elect members to council
Hold council to account
Local authorities
Are subject to a range of statutory duties
Are free to borrow without specific permission
Are required to ‘have regard’ to prudential code and set indicators to ensure that capital plans are prudent, affordable and sustainable
Must determine minimum revenue provision for repaying debt
Submit capital forecast, estimate and outturn returns to the Department
Must publish annual capital, treasury management and investment strategies
Source: National Audit Offi ce analysis of Department for Communities and Local Government data
Accountability Funding Scrutiny/Guidance Intervention
Other government departments
Are responsible for setting policy across a range of services delivered by local authorities
Provide grants to local authorities
Department for Communities and Local Government
Is responsible for statutory framework and policy for local authority capital finance
Provides capital funding to local authorities through grants and revenue funding to service debt
Has reserve power to set borrowing limits for local authorities
Collects and publishes data on local authority finance
Publishes guidance on local authority investments and revenue provision for debt repayment
Is able to issue capitalisation directions to local authorities
CIPFA
Is responsible for the prudential code for capital finance and the treasury management code of practice

44 Part Three Financial sustainability of local authorities: capital expenditure and resourcing
The effectiveness of the system
3.24 The Department believes the system has operated successfully. It takes assurance from the legal duties within the prudential framework, the accountability arrangements in place locally, and the work of local auditors. The Department recognises that each of the safeguards within the system could fail in isolated instances. However, it believes that collectively they form a robust system.
3.25 Authorities we spoke to were very supportive of the principles within the prudential code and were positive about the outcomes they have been able to achieve under the framework.
3.26 The evidence does not suggest any widespread problems with the prudential framework. However, the Department still has room to improve the level of assurance it receives about the effectiveness of the framework. This includes:
• The role of members
Authorities we spoke to were generally positive about members’ oversight in relation to capital projects. Views were mixed, however, about members’ ability to oversee the sustainability of capital spending and resourcing at the strategic level.
• The effectiveness of prudential indicators
Some authorities we spoke to felt that prudential indicators do not help elected members to understand the implications of their decisions. Audit Scotland recently reported that prudential indicators alone, without context and commentary on their implications, do not provide adequate explanation of the affordability of borrowing.32
• Departmental expectations of external audit
Auditors do not have a role in providing specific assurance on compliance with the prudential framework. External audit firms we spoke to told us that their work on financial statements covers material capital transactions. Any significant risks to financial sustainability they identified would be addressed in work on value-for-money arrangements. Other issues in authorities’ capital arrangements are not certain to be considered or reported by auditors.
• The availability and use of data
In general, our case study authorities made no use of the capital data published by the Department. There was little evidence of authorities benchmarking their performance against others. This reflects authorities’ views that it is difficult to compare capital activities between places as these will be shaped by local and historical factors. Nonetheless, this raises questions about whether the Department’s data could be more relevant to authorities.
32 Accounts Commission, Borrowing and treasury management in councils, Audit Scotland, March 2015.
Financial sustainability of local authorities: capital expenditure and resourcing Part Three 45
Changes within the system
3.27 In the spending review 2015, the government announced a significant new flexibility relating to the use of capital receipts. The Department has issued a direction allowing capital receipts received during 2016-17, 2017-18 and 2018-19 to be used during those years for the start-up revenue costs of projects to deliver ongoing savings, cost reductions or demand reductions.
3.28 The Department describes this as “a radical shake-up of spending rules”.33 No bidding is required, there is no limit on the value of receipts that authorities can use, accountability arrangements operate only at the local level and the savings need not accrue to the authority (they may accrue to another public sector body instead). The Department does, however, require authorities to return data annually on the level of receipts they have used flexibly.
3.29 In such circumstances, the Department should have a good understanding of the possible outcomes. However, its analysis was restricted to forming a rough estimate of the level of assets held by authorities that could potentially be sold, and did not attempt to quantify the potential level of take-up of the flexibility by authorities. It did not systematically consult the sector before the announcement. Informal feedback received by the Department after the announcement focused on technical aspects of the guidance. It gave little indication of the extent to which authorities were likely to use the flexibility. The Department did not formally investigate why a previous scheme, the Transformation Challenge Award, had a very low take-up, although it did re-examine the consultation responses received in advance of the scheme’s launch.
3.30 Authorities we spoke to had mixed views. Some told us their available assets would not yield meaningful capital receipts, or that any receipts were already required to fund capital spending. Others had already developed other ways to use their receipts flexibly, such as to meet minimum revenue provision (MRP) charges. Some were keener to explore the possibilities of the new flexibility.
3.31 While there are challenges in estimating the level of take-up of this new flexibility, the Department could have done more to inform itself of potential outcomes and the balance between possible benefits and risks. Authorities may fail to embrace the change, which would leave them short of the revenue funding and investment in reform that the Department hoped to encourage. Alternatively, authorities may sell assets at a scale that limits future capital spending, or invest in transformation schemes in which planned revenue savings are not delivered. Capital receipts can only be used once.
33 Department for Communities and Local Government, Councils given flexibility to use sales of surplus property to improve services, March 2016.

46 Part Three Financial sustainability of local authorities: capital expenditure and resourcing
3.32 The Department has said that its approach was proportionate since no central government resources were at stake. It has also stated that authorities were not obliged to adopt the flexibility and therefore take-up or lack of take-up by local authorities is not necessarily a measure of success. Nonetheless, the change represents a significant adjustment within a system that has been effective in securing the financial sustainability of authorities and in ensuring that government funding invested by authorities in their asset bases provides value for money.
Managing risks to financial sustainability
3.33 The Department uses a range of information sources to detect signs of risk around financial sustainability and service delivery in authorities. The Department draws on this information to provide advice around every six months to its Accounting Officer on the need for change in the elements of the local accountability system relating to financial sustainability. The system is set out in the Accounting Officer Accountability System Statement for Local Government and for Fire and Rescue Authorities.34
3.34 The most recent version of the advice available to us was produced in June 2015. The evidence it drew on includes published information and consultancy reports, contacts with authorities, engagement with experts and sector representatives, and the findings of local auditors. It included no explicit reference to capital spending or resourcing.
3.35 The Department told us that partly in response to a 2015 Committee of Public Accounts report35 it has developed a more systematic approach to collect and analyse a range of information on authorities. This includes assessments from other government departments. The purpose is to identify individual local authorities that have the strongest indicators of immediate risk around financial resilience and service delivery. The Department explained that summary information based on this monitoring and analysis is provided to the Accounting Officer every two months, and this also informs the advice provided twice a year.
3.36 The Department was continuing to refine its approach to monitoring and analysis when we met them in March 2016. We have not seen the advice to the Accounting Officer produced under the Department’s new approach. We have therefore not yet fully assessed the extent to which the new approach represents an improvement on previous arrangements. However, in principle, the new arrangements appear more systematic and comprehensive than before.
34 Department for Communities and Local Government, Accounting Officer Accountability System Statement for Local Government and for Fire and Rescue Authorities, April 2015.
35 HC Committee of Public Accounts, Financial sustainability of local authorities 2014, Thirty-fourth Report of Session 2014-15, HC 833, January 2015.

Financial sustainability of local authorities: capital expenditure and resourcing Appendix One 47
Appendix One
Our audit approach
1 This study provides further insight into local authorities’ financial sustainability. It builds on our report Financial sustainability of local authorities 2014 to include and examine local authorities’ capital spending and financing.36 This report examines the implications of changes in capital expenditure and resourcing for local authority financial and service sustainability since 2010-11. It also examines the role of the Department for Communities and Local Government (the Department) in delivering its functions in relation to local authority financial and service sustainability.
2 There were three main elements to our work:
• We gathered information from local authorities, the Department and key stakeholders. By local authorities we mean the 353 councils in England. These include London borough councils, metropolitan district councils, county councils, unitary authorities and district councils.
• We analysed how local authorities are responding to changes in funding and their efforts to minimise risk to financial and service sustainability.
• We reviewed the Department’s understanding of the financial challenges faced by local authorities, the implications for their financial and service sustainability and the effectiveness of the local accountability system.
3 Our audit approach is summarised in Figure 17 overleaf. Our evidence base is summarised in Appendix Two.
36 Comptroller and Auditor General, Financial sustainability of local authorities 2014, Session 2014-15, HC 783, National Audit Office, November 2014.

48 Appendix One Financial sustainability of local authorities: capital expenditure and resourcing
Figure 17Our audit approach
The objective of government
How this will be achieved
Our study
Our evaluative criteria
Our evidence
(see Appendix Two for details)
Our conclusions
We interviewed local authority finance directors and other key groups and analysed local authority financial information.
We reviewed accountability system assurance mechanisms, examined case study examples and interviewed key stakeholders.
To review the Department’s understanding of the impact of reductions in funding.
To review the Department’s oversight of the capital control framework.
To review the Department’s understanding of the effectiveness of the local accountability system to prevent financial and service failure.
We interviewed officials and reviewed departmental documents and data.
Central government’s objective
Reduce funding to local authorities.
Reducing revenue funding rather than capital funding and requiring authorities to fund services through local income.
Local government’s objective
Local authorities must provide services while ensuring financial sustainability.
Local authorities are pursuing a wide range of measures to reduce spending, requiring prudent and affordable capital investment in their asset bases.
Our study examined trends in capital spending and financing and the implications for financial and service sustainability in local authorities.
Local authorities’ capital programmes since 2010-11 have not been under the same pressure as their revenue income. Authorities have maintained their overall capital spending levels and have acted prudently, seeking to minimise or reduce the cost of debt servicing wherever possible. Despite authorities’ best efforts, debt servicing costs account for a significant share of revenue spending, and this is likely to increase further. This means further borrowing by some authorities may not be affordable, calling into question their capacity to invest in, and maintain, their core assets.
The Department needs to strengthen its understanding of the capital issues faced by local authorities. The Department is right to take confidence from the devolved capital control framework built around the prudential code, but this is not enough by itself. It should be complemented with an understanding of system-wide issues and risks that the Department does not currently have. This includes an understanding of the drivers behind, and implications of, local authorities pushing debt servicing costs into the future and delaying investment in capital works. Without this understanding of broader trends the Department will not be well placed to anticipate risks to value for money from changes in authorities’ capital programmes as they come under greater financial pressure.
Financial sustainability of local authorities: capital expenditure and resourcing Appendix Two 49
Appendix Two
Our evidence base
1 We reached our independent conclusions on the value-for-money risks of reducing local authority funding after analysing evidence collected between November 2015 and March 2016. Our audit approach is outlined in Appendix One. A separate Methodology document setting out the approach to our quantitative analysis is available on the NAO website: www.nao.org.uk/report/financial-sustainability-of-local-authorities-capital-expenditure-and-resourcing/.
2 We interviewed officials from government departments. We designed these interviews to focus on how the Department for Communities and Local Government (the Department):
• informs itself of the impact of funding changes on local authorities’ finances and services;
• assures itself that local authorities are financially sustainable; and
• assures itself that the local accountability system is robust.
As well as the Department, we spoke to officials at HM Treasury and the Debt Management Office.
3 We visited case study authorities. We spoke to finance teams at 13 local authorities: London Borough of Barking and Dagenham, Birmingham City Council, Darlington Borough Council, Dorset County Council, Leeds City Council, Mansfield District Council, London Borough of Newham, Norfolk County Council, Portsmouth City Council, Sevenoaks District Council, Scarborough Borough Council, Staffordshire County Council and Warrington Borough Council. We selected these in order to speak to a range of different types of local authority, in different regions, and facing different funding and service pressures. We used these visits to understand the financial challenges that authorities are facing and how they are using their capital strategies and treasury management practices to respond to these challenges.
4 We interviewed local government audit firms. We designed these interviews to provide further insight into how local authorities are responding to financial challenges through capital programmes and treasury management practices. The interviews also clearly outlined the role of audit firms within the devolved capital framework.
50 Appendix Two Financial sustainability of local authorities: capital expenditure and resourcing
5 We conducted interviews with other stakeholders. We spoke to the Local Government Association to get its views on how local authorities were coping with funding cuts and how they were using their capital programmes. We spoke to the Chartered Institute of Public Finance and Accountancy (CIPFA) about its responsibility for the prudential code for capital finance and its relationship with the Department. We also spoke to two treasury management advisory firms: Arlingclose and Capita Asset Services.
6 We reviewed departmental documents. This included a review of the Department’s accountability system statement for local government as well as guidance on local authority investments, minimum revenue provision and flexible use of capital receipts.
7 We reviewed the Department’s approach to the spending review 2015. We reviewed its modelling of local authority income and service pressures. We examined returns that were submitted to the Department by other government departments.
8 We carried out a review of our own research and external literature. We focused on our recent research covering financial sustainability as well as previous studies examining capital funding. We also reviewed external literature including parliamentary research briefings, and CIPFA’s prudential and treasury management codes. We also reviewed a number of local authority documents, including accounts, as well as strategies for capital programmes, treasury management and asset management.
9 We analysed quantitative data on local authority income, spending, borrowing and a range of items submitted as part of local authority capital and revenue returns:
• We collated data on capital spending and financing from capital outturn return forms.
• We constructed a measure of revenue costs of capital programmes and analysed how it changed over the period 2010-11 to 2014-15.
• We examined change in local authority capital and revenue spending across a range of service areas.
10 There are a number of technical decisions we made in undertaking our quantitative analysis. These are set out fully in the Methodology document accompanying this report on the NAO website.

This report has been printed on Evolution Digital Satin and contains material sourced from responsibly managed and sustainable forests certified in accordance with the FSC (Forest Stewardship Council).
The wood pulp is totally recyclable and acid-free. Our printers also have full ISO 14001 environmental accreditation, which ensures that they have effective procedures in place to manage waste and practices that may affect the environment.

£10.00
9 781786 040558
ISBN 978-1-78604-055-8
Design and Production by NAO External Relations DP Ref: 11069-001