report: appril–may - june
TRANSCRIPT
Objec
-
P
B
ctive Asses
Prepared for:
By:
ssment ofService
Re
Telecom ReTech GroA specialist
f Quality ofce Provider
eport: Ap
Regulatory oup@IMRBt unit of IMR
f Services rs – Bihar &
pril–May
Authority oB RB Internation
8 Balaji Estate,
for (QoS) f & Jharkha
- June -
of India
nal
, Guru Ravidass Phone: (91)-11
for Cellulaand Circle
2011
Marg, Kalkaji, N-4269-7800, Fax
Website
ar Mobile (W
New Delhi - 110x: (91)-11-42697e: www.imrbint.
Wireless)
00197802.com

Quality of Service – Audit module report for Bihar & Jharkhand Circle
2
Preface
TRAI, the regulatory watch dog for the Quality of Service for the telecom services – Basic (Wireline), Cellular Mobile (Wireless) and Broadband has commissioned this study with the objective of measuring Quality of Services under the parameters as per the published notifications.
The Audit module would assess the Quality of Service of telecom operators Basic (Wireline), Cellular Mobile (Wireless) and Broadband services) by auditing the service level records maintained by the operators, conducting drive tests as well as live measurements and comparing them with quality of service benchmarks stipulated by TRAI.
The Audit module for various circles within the Zones, due the sheer scale of data collection, have been distributed across various quarterly periods. IMRB International Auditors carried out Audits across Orissa, Bihar & Jharkhand, West Bengal, North-East, Assam and Kolkata circles in the second quarter of 2011. This report details the performance of various service providers in Bihar & Jharkhand circle against Quality of Services benchmarks for various parameters laid down by TRAI in respective regulations for Cellular (Mobile) services.

Quality of Service – Audit module report for Bihar & Jharkhand Circle
3
Table of contents Page no.
1.0 Background ................................................................................................................................................ 4 2.0 Objectives and Methodology .................................................................................................................... 5 3.0 Sampling methodology ............................................................................................................................. 6 3.0 Sampling methodology ............................................................................................................................. 6 4.0 Audit methodology .................................................................................................................................... 7 4.1 Cellular Mobile Services ........................................................................................................................... 7 5.0 Executive Summary ................................................................................................................................... 8 5.1 Service provider performance report based on one month data verification: Cellular Mobile Services
9 6.0 Detailed findings – Includes comparison between Live calling/Live measurements and One month data
collection ................................................................................................................................................. 17 6.1 Graphical/Tabular Representations for Cellular Mobile Services ....................................................... 17 7.0 Compliance reports: Results of Verification of PMR ............................................................................ 28 7.1 Cellular Mobile services .......................................................................................................................... 28 8.0 Conclusions ............................................................................................................................................. 31 9.0 Annexure - I .............................................................................................................................................. 32 9.1 Service provider performance report based on one month data ........................................................ 32 9.2 Monthly Point of Interconnection (POI) Congestion Report ................................................................ 32 9.3 Parameter wise performance reports for Cellular Mobile services ..................................................... 34

Quality of Service – Audit module report for Bihar & Jharkhand Circle
4
1.0 Background
The Telecom Regulatory Authority of India (TRAI) has a critical mandate to protect the interest of telecom consumers in addition to various other functions bestowed upon it. As part of the license conditions to telecom operators, it has the power and authority to measure the Quality of Service provided by various govt. (BSNL & MTNL) and private telecom operators. The parameters that need to be measured for Basic (Wireline) and Cellular Mobile (Wireless) services have been specified in the TRAI notification on Quality of Services of Basic (Wireline) and Cellular Mobile (Wireless) services dated 20th March, 2009. The parameters for Broadband Service have been specified in the TRAI notification for Quality of Services of Broadband Service Regulation, 2006
IMRB has been carrying out this exercise for TRAI since December 2007 to assess the quality of services being provided by Basic (Wireline), Cellular Mobile (Wireless) and Broadband service providers.
Audit module: To assess the quality of service of telecom operators Basic (Wireline), Cellular Mobile (Wireless) and Broadband services by auditing the service level records maintained by the operators, conducting drive tests as well as live measurements and comparing them with quality of service benchmarks stipulated by TRAI
This report highlights the findings for the Audit module for Bihar & Jharkhand circle that was covered in period of April-June 2011. The verification of records maintained by various operators of Cellular Mobile (Wireless) service was undertaken by the auditors of IMRB International during the period Oct-Dec 2010.
This report highlights the Audit Module findings for “Bihar & Jharkhand” circle for Cellular Mobile services
Quality of Service – Audit module report for Bihar & Jharkhand Circle
5
• Any changes or discrepancies found in the methodology were reported to the service providers and changes were suggested by IMRB Auditors.
• PMR verification was done as per the new parameters being reported to TRAI by all operators. • Live measurement and 1 month data collection was done as per the new regulations published
by TRAI on 20th March, 2009. • Separate formats were designed each for Basic (Wireline), Cellular mobile (Wireless) and
Broadband services to collect the information on various parameters
2.0 Objectives and Methodology
The primary objective of the Audit module is to Audit and Assess the Quality of Services being rendered by Basic (Wireline), Cellular Mobile (Wireless), and Broadband service against the parameters notified by TRAI. (The parameters of Quality of Services (QoS) have been specified by in the respective regulations published by TRAI). Following are the key activities undertaken by Auditors during the Audit process conducted at the operator’s premises
1. Verification of the data submitted by service providers: This involved verification of the quarterly Performance Monitoring Reports (PMR’s) and monthly Point of Interconnect (POI) Congestion reports being submitted by various service providers. The raw data in the records maintained by service providers was audited to assess the book keeping methodology.
2. Live measurement for three days: Network performance of service providers was assessed for three days in the month in which the Audit was carried out. Live figures from the server/ NMS software were recorded for various network related parameters.
3. Data verification for the month in which Audits were carried out: Subsequent to the visits for Audit during the live measurement at various Exchanges/ISP Nodes/Exchanges, data for all the network and Non network related parameters was collected from various service providers for the complete month in which the Audit was carried out. Raw data/records pertaining to these were also verified on sample basis to check the veracity of data provided by the operators.
4. Drive tests: Operator assisted drive test were conducted in three cities as per the norms stated in the tender. 5. Live calling: Live testing was done on a sample basis to check efficiency of various parameters
All Network related and Non network related parameters notified by TRAI in various regulations were Audited

Quality of Service – Audit module report for Bihar & Jharkhand Circle
6
3.0 Sampling methodology 3.1 Sampling for Cellular Mobile (Wireless) service providers Data pertaining to 100% of the Gateway MSC’s (GMSC’s) and Mobile Switching Centres (MSC’s) of all the Cellular Mobile Service Providers or Unified Access Service Providers (UASP) was collected and verified in specified circles/service areas. Following are the various operators covered in Bihar & Jharkhand circle Name of Operator Month of Audit Operator 1 Aircel April, 2011 Operator 2 Airtel April, 2011 Operator 3 BSNL April, 2011 Operator 4 Etisalat April, 2011 Operator 5 Idea April, 2011 Operator 6 MTS April, 2011 Operator 7 Reliance CDMA April, 2011 Operator 8 Reliance GSM April, 2011 Operator 9 S-Tel May, 2011 Operator 10 Tata Docomo April, 2011 Operator 11 Tata Indicom April, 2011 Operator 12 Uninor April, 2011 Operator 13 Vodafone April, 2011
Quality of Service – Audit module report for Bihar & Jharkhand Circle
7
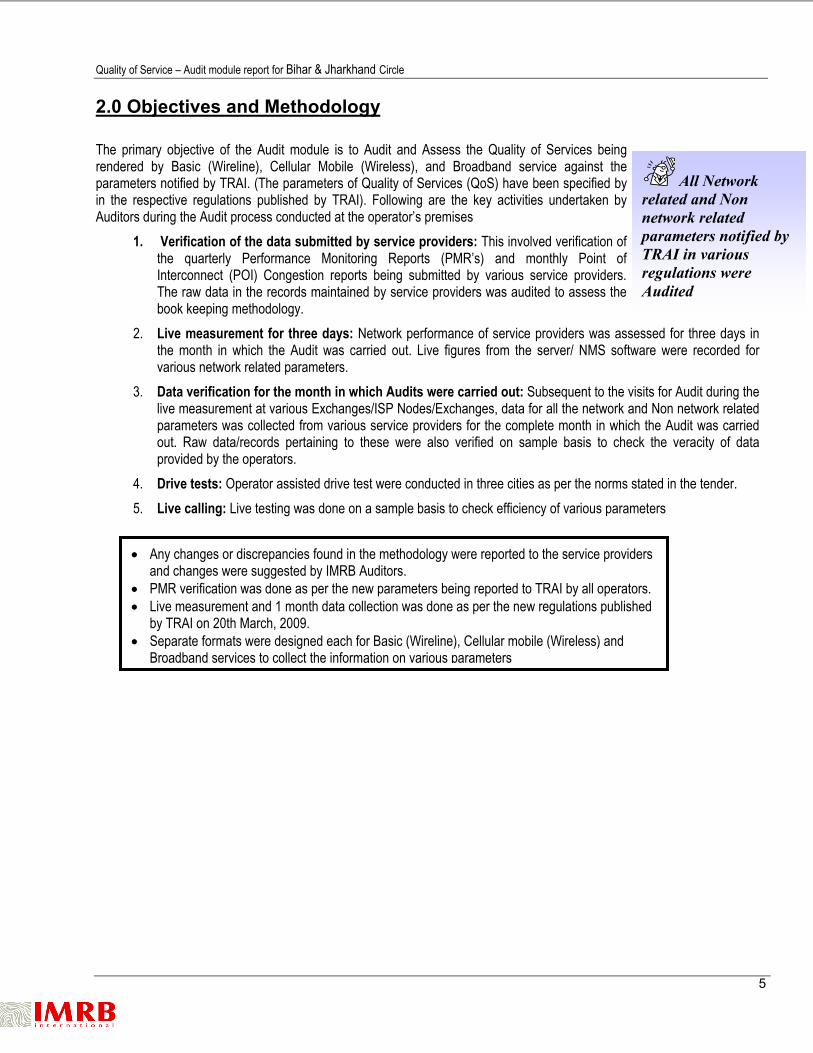
4.0 Audit methodology 4.1 Cellular Mobile Services In a nutshell the following activities were done while auditing for various parameters for Cellular Mobile Services:
S.no
AS REPORTED IN PMR
AS FOUND IN ACTUAL RECORDS AFTER VERIFICATION
AS FOUND IN VERIFICATIONFOR THE MONTH OF AUDIT
AS FOUND IN 3 DAY LIVE MEASUREMENT DATA
LIVE CALLING
OPERATOR ASSISSTED DRIVE TESTS
INDEPENDENT DRIVE TESTS
A
A (i)Yes Yes Yes
A (ii)
Yes Yes Yes Yes Yes YesA (iii) Yes Yes Yes Yes Yes YesA (iv) Yes Yes Yes Yes Yes YesA (v) Yes Yes Yes Yes YesA (vi) Yes Yes Yes Yes YesA (vii) Yes Yes YesB
B (i) Yes Yes Yes YesC
C (i) Yes Yes YesC (ii)
Yes Yes Yes YesC (iii)
Yes Yes Yes Yes
Period of all refunds/payments due to customers from date of resolution as in (ii) above
Service CoveragePoI Congestion
Customer Helpline
Response time to the customer for assistance
Billing Complaints
ParameterNetwork Performance
BTS accumulated down time
Call setup success rate (within licensee ownnetwork)
Billing complaints per 100 bills issued
%age of billing complaints resolved within 4 weeks
Blocked Call RateCall Drop rate% Connections with good voice quality
Quality of Service – Audit module report for Bihar & Jharkhand Circle
8
5.0 Executive Summary The objective assessment of Quality of Services (QoS) was carried out by IMRB International for all the Cellular mobile service providers during the period starting from April 2011 to June 2011 in Bihar & Jharkhand circle. The executive summary encapsulates the key findings of the Audit by providing: -
“Service provider performance report” for Cellular mobile service , which gives a glimpse of the performance of various operators against the benchmark specified by TRAI, during the month in which the Audit was carried out by IMRB Auditors
“Parameter wise critical findings” for Cellular mobile services: This indicates key observations and findings from different activities carried out during the Audit process
Quality of Service – Audit module report for Bihar & Jharkhand Circle
9
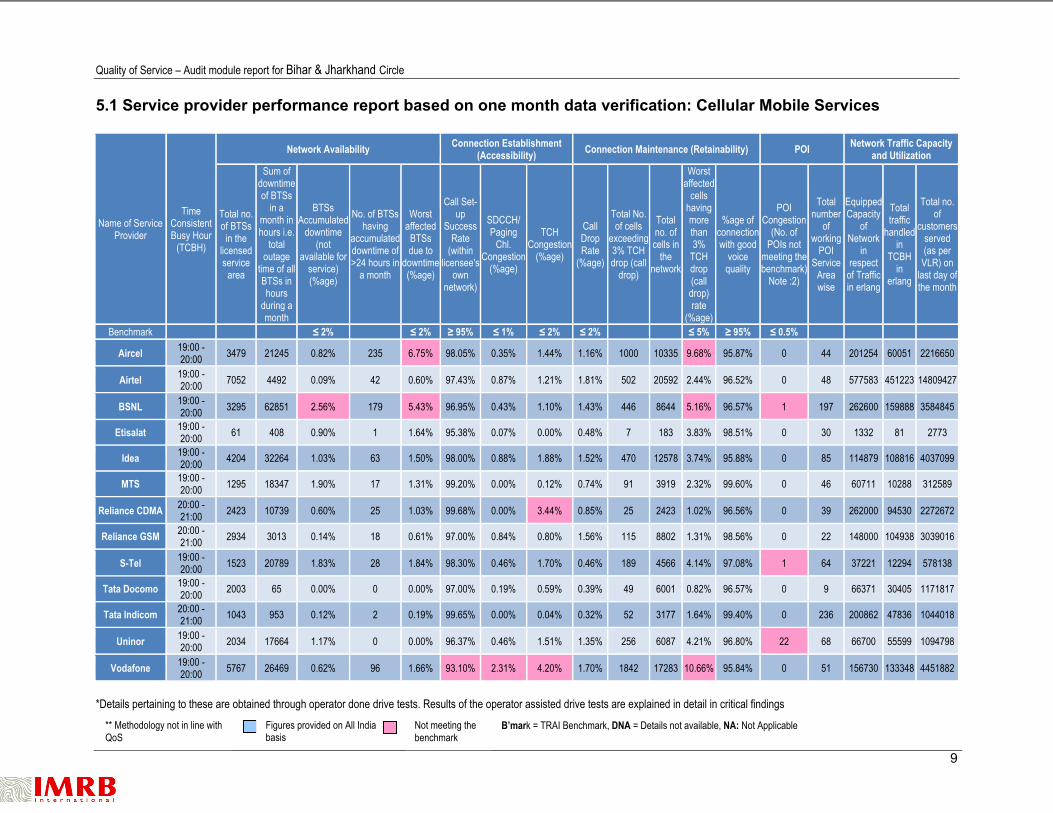
5.1 Service provider performance report based on one month data verification: Cellular Mobile Services
Name of Service Provider
Time Consistent Busy Hour
(TCBH)
Network Availability Connection Establishment (Accessibility) Connection Maintenance (Retainability) POI Network Traffic Capacity
and Utilization
Total no. of BTSs
in the licensed service
area
Sum of downtime of BTSs
in a month in hours i.e.
total outage
time of all BTSs in hours
during a month
BTSs Accumulated
downtime (not
available for service) (%age)
No. of BTSs having
accumulateddowntime of >24 hours in
a month
Worst affected
BTSs due to
downtime(%age)
Call Set-up
Success Rate
(within licensee's
own network)
SDCCH/ Paging
Chl. Congestion
(%age)
TCH Congestion
(%age)
Call Drop Rate
(%age)
Total No. of cells
exceeding3% TCH drop (call
drop)
Total no. of cells in
the network
Worst affected
cells having more than 3%
TCH drop (call drop) rate
(%age)
%age of connectionwith good
voice quality
POI Congestion
(No. of POIs not
meeting thebenchmark)
Note :2)
Total number
of working
POI Service
Area wise
EquippedCapacity
of Network
in respect
of Traffic in erlang
Total traffic
handledin
TCBH in
erlang
Total no. of
customersserved (as per VLR) on
last day ofthe month
Benchmark ≤ 2% ≤ 2% ≥ 95% ≤ 1% ≤ 2% ≤ 2% ≤ 5% ≥ 95% ≤ 0.5%
Aircel 19:00 - 20:00 3479 21245 0.82% 235 6.75% 98.05% 0.35% 1.44% 1.16% 1000 10335 9.68% 95.87% 0 44 201254 60051 2216650
Airtel 19:00 - 20:00 7052 4492 0.09% 42 0.60% 97.43% 0.87% 1.21% 1.81% 502 20592 2.44% 96.52% 0 48 577583 451223 14809427
BSNL 19:00 - 20:00 3295 62851 2.56% 179 5.43% 96.95% 0.43% 1.10% 1.43% 446 8644 5.16% 96.57% 1 197 262600 159888 3584845
Etisalat 19:00 - 20:00 61 408 0.90% 1 1.64% 95.38% 0.07% 0.00% 0.48% 7 183 3.83% 98.51% 0 30 1332 81 2773
Idea 19:00 - 20:00 4204 32264 1.03% 63 1.50% 98.00% 0.88% 1.88% 1.52% 470 12578 3.74% 95.88% 0 85 114879 108816 4037099
MTS 19:00 - 20:00 1295 18347 1.90% 17 1.31% 99.20% 0.00% 0.12% 0.74% 91 3919 2.32% 99.60% 0 46 60711 10288 312589
Reliance CDMA 20:00 - 21:00 2423 10739 0.60% 25 1.03% 99.68% 0.00% 3.44% 0.85% 25 2423 1.02% 96.56% 0 39 262000 94530 2272672
Reliance GSM 20:00 - 21:00 2934 3013 0.14% 18 0.61% 97.00% 0.84% 0.80% 1.56% 115 8802 1.31% 98.56% 0 22 148000 104938 3039016
S-Tel 19:00 - 20:00 1523 20789 1.83% 28 1.84% 98.30% 0.46% 1.70% 0.46% 189 4566 4.14% 97.08% 1 64 37221 12294 578138
Tata Docomo 19:00 - 20:00 2003 65 0.00% 0 0.00% 97.00% 0.19% 0.59% 0.39% 49 6001 0.82% 96.57% 0 9 66371 30405 1171817
Tata Indicom 20:00 - 21:00 1043 953 0.12% 2 0.19% 99.65% 0.00% 0.04% 0.32% 52 3177 1.64% 99.40% 0 236 200862 47836 1044018
Uninor 19:00 - 20:00 2034 17664 1.17% 0 0.00% 96.37% 0.46% 1.51% 1.35% 256 6087 4.21% 96.80% 22 68 66700 55599 1094798
Vodafone 19:00 - 20:00 5767 26469 0.62% 96 1.66% 93.10% 2.31% 4.20% 1.70% 1842 17283 10.66% 95.84% 0 51 156730 133348 4451882
*Details pertaining to these are obtained through operator done drive tests. Results of the operator assisted drive tests are explained in detail in critical findings
** Methodology not in line with QoS
Figures provided on All India basis
B’mark = TRAI Benchmark, DNA = Details not available, NA: Not Applicable Not meeting the benchmark

Quality of Service – Audit module report for Bihar & Jharkhand Circle
10
Critical findings: Cellular Mobile Services The audit for cellular mobile service providers were conducted at their respective MSCs in the Bihar & Jharkhand circle apart from Reliance Communication whose audit was conducted at their central NOC at Mumbai. The audit involved a three stage verification process which consisted of auditing the records of the service providers and verifying the data submitted to TRAI. The second step involved a three day live measurement of all the network parameters. Finally basis the three day live measurement the auditors needed to find out the busy hour for the service provider and collect the hourly data for this busy hour for the month in which the audit was conducted. Busy Hour of Various Service Providers
Service Provider Reported Time Consistent Busy Hour
Network Busy Hour found in 3 day live measurement
Aircel 19:00 - 20:00 19:00 - 20:00 Airtel 19:00 - 20:00 19:00 - 20:00 BSNL 19:00 - 20:00 19:00 - 20:00
Etisalat 19:00 - 20:00 19:00 - 20:00 Idea 19:00 - 20:00 19:00 - 20:00 MTS 19:00 - 20:00 19:00 - 20:00
Reliance CDMA 20:00 - 21:00 20:00 - 21:00
Reliance GSM 20:00 - 21:00 20:00 - 21:00
S-Tel 19:00 - 20:00 20:00 - 21:00
Tata Docomo 19:00 - 20:00 19:00 - 20:00
Tata Indicom 20:00 - 21:00 20:00 - 21:00
Uninor 19:00 - 20:00 19:00 - 20:00
Vodafone 19:00 - 20:00 19:00 - 20:00
The TCBH reported by all the service providers except S-Tel matched the network busy hour calculated by IMRB auditors for the Bihar & Jharkhand circle. BTSs Accumulated Downtime: In the Bihar & Jharkhand circle, BSNL experienced the highest outage in the month of audit, while Aircel had the highest no. of BTS(more than 235) having accumulated downtime of >24 hours in a month. Call Set-up Success Rate (CSSR): All the operators except Vodafone were comfortably meeting the benchmark on this parameter. During the audits the maximum CSSR was observed for Reliance CDMA with 99.68% of their calls getting completed. All the operators were found to be calculating the parameter as per the norm specified by TRAI. CSSR was established as the ratio of total number of successful call attempts (establishment) to the total number of call attempts made. Network Congestion parameters: SDCCH / Paging Channel Congestion, TCH and POI are part of the network congestion parameters. All the operators except Reliance CDMA and Vodafone for Traffic channel congestion are meeting the TRAI specified benchmarks on the congestion parameters. Reliance CDMA and Vodafone do not meet the TRAI specified benchmark with a Traffic Channel congestion of 3.44% and 4.2%, which was found during the one month data collected for the month of audit. Etisalat leads the way in network congestion parameters with almost negligible paging as well as traffic channel congestion. The calculation methodology of these parameters was found to be in complete accordance with what has been specified by TRAI. Both RCOM CDMA and Tata Teleservices measure paging channel utilization. When the value of this parameter is less than 100%, it is counted as 0% congestion. There were almost no POIs with congestion more than the benchmark (≤0.5%) except for 1 POIs for BSNL, 1 for S-Tel and 22 for Uninor.

Quality of Service – Audit module report for Bihar & Jharkhand Circle
11
Call Drop Rate: During the audit it was found that all the service providers were measuring this parameter as per the TRAI guidelines. The call drop rate was measured as the ratio of total calls dropped to the total number of call attempts for all operators. Also, all of service providers were found to be meeting the TRAI specified benchmark. The lowest call drop rate was of Tata Indicom at 0.32% while the highest was for Airtel at 1.81%. Connections with good voice quality: All the operators are measuring this parameter via their periodic drive tests. However, for some operators these parameters can be obtained at their switch as well. During the month audit it was found that all the service providers were measuring this parameter as per the TRAI guidelines and are meeting the TRAI benchmark for voice quality. Customer Care / Helpline Assessment For the accessibility of customer care aspect all the service providers meet the TRAI benchmark. Aircel, BSNL, Reliance GSM, Tata Docomo, Uninor and Vodafone do not meet the benchmark for the month of audit for the percentage of calls answered by the operators (voice to voice) within 60 seconds. Billing performance Except Tata Docomo(for postpaid) and Etisalat(for prepaid) all the operators were found to be meeting the benchmark of ≤ 0.1% complaints registered per 100 bills issued and the benchmark of 100% billing complaints being resolved within 4 weeks. In all cases where customers were due for refund, all the service providers except MTS meet the TRAI benchmark of 100% with 1 week. Inter operator calls assessment
Inter operator call Assessment To↓ From→ Aircel Airtel BSNL Etisalat Idea MTS Reliance
CDMA Reliance
GSM S-Tel Tata Docomo
Tata Indicom Uninor Vodafone
Aircel NA 100% 100% 100% 100% 97% 100% 100% 100% 99% 100% 91% 100%
Airtel 100% NA 100% 100% 100% 98% 99% 100% 89% 100% 100% 79% 100%
BSNL 100% 99% NA 100% 100% 97% 96% 100% 92% 100% 100% 98% 93%
Etisalat 95% 99% 100% NA 100% 100% 100% 100% 91% 98% 100% 100% 100%
Idea 100% 100% 100% 100% NA 96% 100% 100% 100% 100% 99% 100% 97%
MTS 93% 99% 100% 100% 96% NA 99% 100% 94% 100% 99% 97% 100%
Reliance CDMA 100% 100% 100% 100% 100% 98% NA 100% 98% 100% 100% 100% 98%
Reliance GSM 100% 100% 100% 100% 100% 100% 100% NA 99% 100% 100% 97% 100%
S-Tel 93% 99% 100% 100% 97% 95% 100% 100% NA 100% 99% 98% 100%
Tata Docomo 95% 89% 100% 100% 98% 99% 100% 100% 100% NA 99% 99% 98%
Tata Indicom 100% 95% 100% 100% 100% 96% 100% 100% 100% 100% NA 100% 100%
Uninor 93% 95% 100% 100% 96% 94% 99% 100% 97% 100% 100% NA 100%
Vodafone 100% 99% 100% 100% 100% 97% 99% 100% 99% 100% 100% 100% NA
In the inter-operator call assessment, calls were made from the test SIMs of service provider whose audit was being conducted to all the other service providers. Almost all service providers except BSNL, Reliance GSM and Etisalat had difficulty in connecting to the number of one or the other service provider. For most of the service providers it was difficult connecting to MTS, S-Tel and Uninor.
Inter calling among operators which faced heavy problems

Quality of Service – Audit module report for Bihar & Jharkhand Circle
12
Results of Operator assisted Drive test The drive test was conducted simultaneously for all the operators present in the Bihar & Jharkhand circle. There was in total of three drive tests conducted in the circle. These tests were conducted in the cities of Patna, Ranchi and Arrah. IMRB auditors were present in vehicles of every operator. A sample of 15 – 30 test calls were made along each of the routes. The holding period for all test calls was between 120 seconds to 180 seconds. The drive test vehicle across all routes plied at a speed of less than 20 km per hour. Taking into consideration the route that was taken for the drive test; most of the major areas Bihar & Jharkhand telecom circles were covered. For measuring voice quality RxQual samples for GSM operators and Frame Error Rate (FERs) for CDMA service providers were measured. RxQual greater than 5 meant that the sample was not of appropriate voice quality and for CDMA operators FERs of more than 4 were considered bad. Call drops were measured by the number of calls that were dropped to the total number of calls established during the drive test. Similarly CSSR was measured as the ratio of total calls established to the total call attempts made. Signal strength was measured in Dbm with strength > -75dbm for indoor, -85 dms for in-vehile and > -95 dbm outdoor routes. The drive tests in the Bihar & Jharkhand circle were conducted in the cities of Patna, Ranchi and Arrah was conducted along the following route: Type of location Patna Ranchi Arrah
Outdoor Peiphery of the city Zero Mile to Saguna Mode Patel Chowk to Booty Mode Mohaniya More to Railway Station
Congested area Gandhi Maidan to Gaye Ghat Lalpur Chowk to Birsa Chowk Overbridge to S.B.College Across the city Saguna Mode to Maurya Lok Argora Chowk to Hehal Railway Station to Overbridge
Indoor Office complex Twin Tower Hari Om Tower Near Ramna Maidan
Shopping complex Maurya Lok Capitol Hill Hotel Park View

Quality of Service – Audit module report for Bihar & Jharkhand Circle
13
The tables given below gives a glimpse of the results of the operator assisted drive test: Drive Test – Patna
Drive Test – Ranchi
B'mark Aircel Airtel BSNL Etisalat Idea MTS Reliance CDMA Reliance GSM S-Tel Tata Docomo Tata Indicom Uninor Vodafone
In door Outdoor In door Outdoor In door Outdoor In door Outdoor In door Outdoor In door Outdoor In door Outdoor In door Outdoor In door Outdoor In door Outdoor In door Outdoor In door Outdoor In door OutdoorVoice quality ≥ 95% 99.67% 96.75% 98.72% 98.35% 96.43% 94.53% NA NA 95.55% 94.04% 99.38% 97.49% 96.19% 85.74% 97.32% 91.09% 99.72% 95.13% NA NA 99.40% 98.90% 98.53% 95.32% 97.83% 95.85%
CSSR ≥ 95% 100.00% 100.00% 100.00% 100.00% 100.00% 98.08% NA NA 100.00% 99.35% 98.33% 99.33% 97.10% 100.00% 99.44% 96.77% 100.00% 100.00% NA NA 100.00% 100.00% 100.00% 98.68% 100.00% 100.00% %age Blockedcalls
0.00% 0.00% 0.00% 0.00% 0.00% 1.92% NA NA 0.00% 0.65% 1.67% 0.67% 2.90% 0.00% 0.56% 3.23% 0.00% 0.00% NA NA 0.00% 0.00% 0.00% 1.32% 0.00% 0.00%
Call drop rate
≤ 2% 0.00% 0.00% 0.00% 0.00% 0.00% 3.27% NA NA 0.00% 0.00% 0.00% 0.00% 0.00% 0.00% 0.00% 0.67% 0.00% 0.00% NA NA 0.00% 0.00% 0.00% 0.67% 0.00% 0.00%
Hands off successrate
100.00% 100.00% 100.00% 100.00% 100.00% 100.00% NA NA 100.00% 100.00% 100.00% 100.00% 100.00% 100.00% 100.00% 100.00% 100.00% 100.00% NA NA 100.00% 100.00% 100.00% 100.00% 100.00% 100.00%
B'mark Aircel Airtel BSNL Etisalat Idea MTS Reliance CDMA Reliance GSM S-Tel Tata Docomo Tata Indicom Uninor Vodafone
In door Outdoor In door Outdoor In door Outdoor In door Outdoor In door Outdoor In door Outdoor In door Outdoor In door Outdoor In door Outdoor In door Outdoor In door Outdoor In door Outdoor In door OutdoorVoice quality ≥ 95% 97.28% 98.15% 99.13% 98.90% 96.40% 90.99% NA NA 95.77% 95.01% 99.94% 97.39% 99.98% 99.18% 98.94% 95.81% 98.33% 97.28% 97.90% 95.31% 99.96% 99.58% 97.56% 96.30% 98.80% 96.98%
CSSR ≥ 95% 100.00% 98.90% 100.00% 100.00% 100.00% 100.00% NA NA 100.00% 100.00% 100.00% 100.00% 100.00% 100.00% 100.00% 99.44% 100.00% 100.00% 100.00% 99.36% 100.00% 100.00% 100.00% 98.73% 100.00% 100.00% %age Blockedcalls
0.00% 1.10% 0.00% 0.00% 0.00% 0.00% NA NA 0.00% 0.00% 0.00% 0.00% 0.00% 0.00% 0.00% 0.56% 0.00% 0.00% 0.00% 0.64% 0.00% 0.00% 0.00% 1.27% 0.00% 0.00%
Call drop rate
≤ 2% 0.00% 0.00% 0.00% 0.00% 0.00% 0.00% NA NA 0.00% 0.00% 0.00% 0.00% 0.00% 0.00% 0.00% 0.00% 0.00% 0.00% 0.00% 0.00% 0.00% 0.00% 0.00% 0.00% 0.00% 0.00%
Hands off successrate
100.00% 100.00% 100.00% 100.00% 100.00% 100.00% NA NA 100.00% 100.00% 100.00% 100.00% 100.00% 100.00% 100.00% 100.00% 100.00% 100.00% 100.00% 100.00% 100.00% 100.00% 100.00% 100.00% 100.00% 100.00%

Quality of Service – Audit module report for Bihar & Jharkhand Circle
14
Drive Test – Arrah
B'mark Aircel Airtel BSNL Etisalat Idea MTS Reliance CDMA Reliance GSM S-Tel Tata Docomo Tata Indicom Uninor Vodafone
In door Outdoor In door Outdoor In door Outdoor In door Outdoor In door Outdoor In door Outdoor In door Outdoor In door Outdoor In door Outdoor In door Outdoor In door Outdoor In door Outdoor In door OutdoorVoice quality ≥ 95% 98.78% 96.77% 98.16% 98.14% 95.82% 93.08% NA NA 98.12% 92.02% 99.68% 98.98% 98.31% 95.23% 94.48% 93.83% 98.02% 96.22% NA NA 100.00% 99.48% 98.72% 94.63% 98.45% 98.42%
CSSR ≥ 95% 100.00% 99.35% 100.00% 100.00% 100.00% 98.69% NA NA 98.46% 100.00% 100.00% 100.00% 100.00% 100.00% 98.41% 97.40% 100.00% 100.00% NA NA 100.00% 100.00% 98.31% 98.03% 100.00% 100.00% %age Blockedcalls
0.00% 0.65% 0.00% 0.00% 0.00% 1.31% NA NA 1.54% 0.00% 0.00% 0.00% 0.00% 0.00% 1.59% 2.60% 0.00% 0.00% NA NA 0.00% 0.00% 1.69% 1.97% 0.00% 0.00%
Call drop rate
≤ 2% 0.00% 0.00% 0.00% 0.00% 0.00% 0.00% NA NA 0.00% 0.00% 0.00% 0.00% 0.00% 0.00% 2.00% 0.00% 0.00% 0.00% NA NA 0.00% 0.00% 1.34% 1.72% 0.00% 0.00%
Hands off successrate
100.00% 100.00% 100.00% 100.00% 100.00% 100.00% NA NA 100.00% 100.00% 100.00% 100.00% 100.00% 100.00% 100.00% 100.00% 100.00% 100.00% NA NA 100.00% 100.00% 100.00% 100.00% 100.00% 100.00%
Not meeting the benchmark

Quality of Service – Audit module report for Bihar & Jharkhand Circle
15
Following were the areas where the signal strength was found to be inadequate for the operators: ALL SERVICE PROVIDERS Patna: There was interference and low signal strength recorded for most of the operators in the outdoor areas near Khajpura Shiv Temple, Bye Pass, Near Beur Jail, Near Mahendru, Mear Saguna More, Bari Road, Gola Road while in the indoor areas inadequate coverage was not found in any of the areas. Ranchi: There was interference and low signal strength recorded for most of the operators in the outdoor areas of Harmu, near Mecon, Deepatoli, Ratu Road, Amrood Bagan, Harbala Road, Ratan Talkies while in the indoor areas there was no inadequate coverage or interference recorded. Arrah: There was interference and low signal strength recorded for most of the operators in the outdoor areas of civil lines area, mohaniya road, near SB college, near Dharhara bridge, near railway station, Maula Bagh, Sital Tola, Bihari Mill while in the indoor areas no interference and inadequate coverage was recorded. Conclusions: Drive test was conducted by IMRB with the help of service providers to measure this parameter. In the drive test it was found that:
1. BSNL didn’t meet the TRAI benchmark for voice quality in all the 3 cities were drive test was conducted. Whereas Idea and Reliance GSM did not meet the voice quality benchmark in Patna and Arrah, Reliance CDMA did not meet the voice quality benchmark in Patna, S-Tel did not meet the voice quality benchmark in Ranchi and Uninor did not meet the voice quality benchmark in Arrah.
2. BSNL did not meet the TRAI benchmark for Call Drop Rate in Patna.
Quality of Service – Audit module report for Bihar & Jharkhand Circle
16
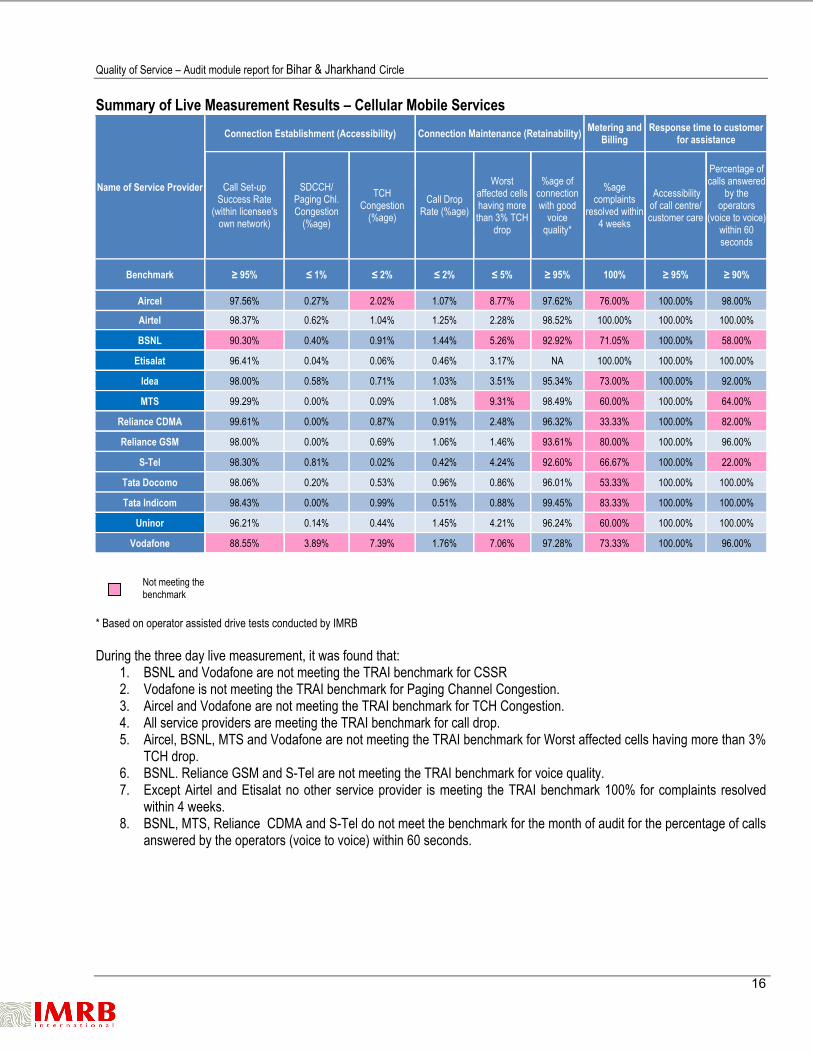
Summary of Live Measurement Results – Cellular Mobile Services
Name of Service Provider
Connection Establishment (Accessibility) Connection Maintenance (Retainability) Metering and Billing
Response time to customer for assistance
Call Set-up Success Rate
(within licensee's own network)
SDCCH/ Paging Chl. Congestion
(%age)
TCH Congestion
(%age) Call Drop
Rate (%age)
Worst affected cells having more than 3% TCH
drop
%age of connection with good
voice quality*
%age complaints
resolved within 4 weeks
Accessibility of call centre/ customer care
Percentage of calls answered
by the operators
(voice to voice)within 60 seconds
Benchmark ≥ 95% ≤ 1% ≤ 2% ≤ 2% ≤ 5% ≥ 95% 100% ≥ 95% ≥ 90%
Aircel 97.56% 0.27% 2.02% 1.07% 8.77% 97.62% 76.00% 100.00% 98.00%
Airtel 98.37% 0.62% 1.04% 1.25% 2.28% 98.52% 100.00% 100.00% 100.00%
BSNL 90.30% 0.40% 0.91% 1.44% 5.26% 92.92% 71.05% 100.00% 58.00%
Etisalat 96.41% 0.04% 0.06% 0.46% 3.17% NA 100.00% 100.00% 100.00%
Idea 98.00% 0.58% 0.71% 1.03% 3.51% 95.34% 73.00% 100.00% 92.00%
MTS 99.29% 0.00% 0.09% 1.08% 9.31% 98.49% 60.00% 100.00% 64.00%
Reliance CDMA 99.61% 0.00% 0.87% 0.91% 2.48% 96.32% 33.33% 100.00% 82.00%
Reliance GSM 98.00% 0.00% 0.69% 1.06% 1.46% 93.61% 80.00% 100.00% 96.00%
S-Tel 98.30% 0.81% 0.02% 0.42% 4.24% 92.60% 66.67% 100.00% 22.00%
Tata Docomo 98.06% 0.20% 0.53% 0.96% 0.86% 96.01% 53.33% 100.00% 100.00%
Tata Indicom 98.43% 0.00% 0.99% 0.51% 0.88% 99.45% 83.33% 100.00% 100.00%
Uninor 96.21% 0.14% 0.44% 1.45% 4.21% 96.24% 60.00% 100.00% 100.00%
Vodafone 88.55% 3.89% 7.39% 1.76% 7.06% 97.28% 73.33% 100.00% 96.00%
* Based on operator assisted drive tests conducted by IMRB During the three day live measurement, it was found that:
1. BSNL and Vodafone are not meeting the TRAI benchmark for CSSR 2. Vodafone is not meeting the TRAI benchmark for Paging Channel Congestion. 3. Aircel and Vodafone are not meeting the TRAI benchmark for TCH Congestion. 4. All service providers are meeting the TRAI benchmark for call drop. 5. Aircel, BSNL, MTS and Vodafone are not meeting the TRAI benchmark for Worst affected cells having more than 3%
TCH drop. 6. BSNL. Reliance GSM and S-Tel are not meeting the TRAI benchmark for voice quality. 7. Except Airtel and Etisalat no other service provider is meeting the TRAI benchmark 100% for complaints resolved
within 4 weeks. 8. BSNL, MTS, Reliance CDMA and S-Tel do not meet the benchmark for the month of audit for the percentage of calls
answered by the operators (voice to voice) within 60 seconds.
Not meeting the benchmark
Quality of Service – Audit module report for Bihar & Jharkhand Circle
17
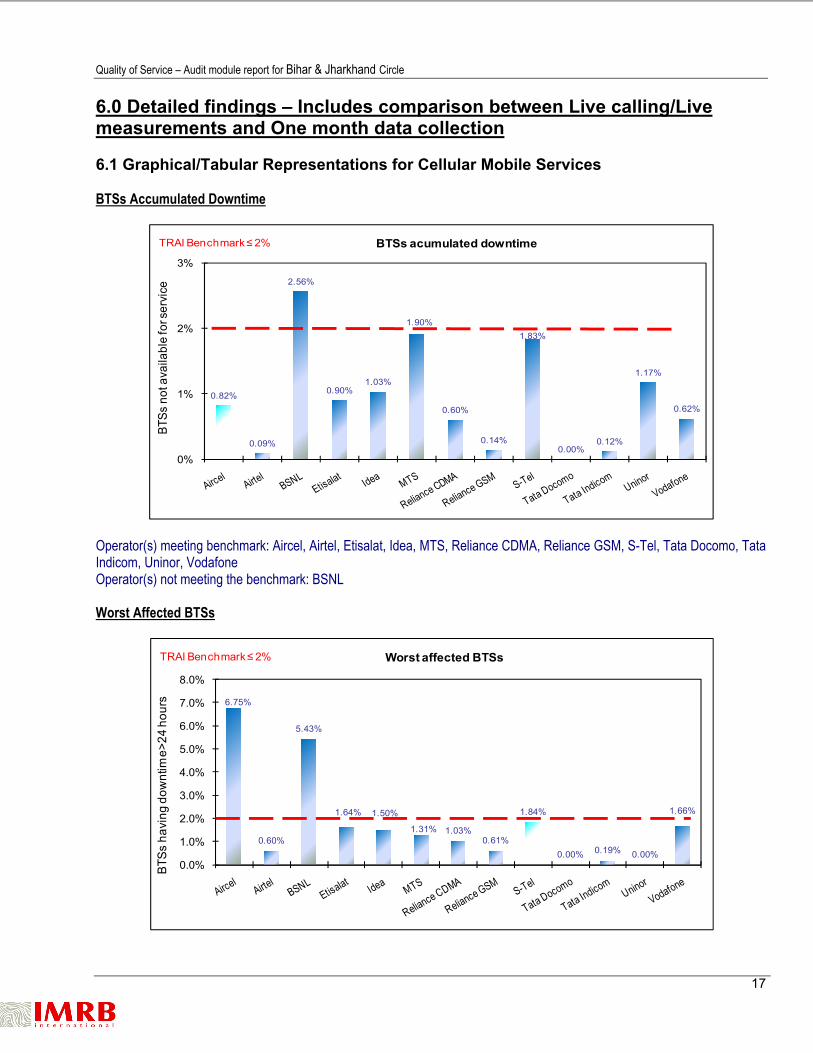
6.0 Detailed findings – Includes comparison between Live calling/Live measurements and One month data collection 6.1 Graphical/Tabular Representations for Cellular Mobile Services BTSs Accumulated Downtime
Operator(s) meeting benchmark: Aircel, Airtel, Etisalat, Idea, MTS, Reliance CDMA, Reliance GSM, S-Tel, Tata Docomo, Tata Indicom, Uninor, Vodafone Operator(s) not meeting the benchmark: BSNL Worst Affected BTSs
0.82%
0.09%
2.56%
0.90%1.03%
1.90%
0.60%
0.14%
1.83%
0.00%0.12%
1.17%
0.62%
0%
1%
2%
3%
BTSs
not
ava
ilabl
e fo
r ser
vice
BTSs acumulated downtimeTRAI Benchmark ≤ 2%
6.75%
0.60%
5.43%
1.64% 1.50%
1.31% 1.03%0.61%
1.84%
0.00% 0.19% 0.00%
1.66%
0.0%
1.0%
2.0%
3.0%
4.0%
5.0%
6.0%
7.0%
8.0%
BTSs
hav
ing
dow
ntim
e>24
hou
rs
Worst affected BTSsTRAI Benchmark ≤ 2%

Quality of Service – Audit module report for Bihar & Jharkhand Circle
18
Operator(s) meeting benchmark: Airtel, Etisalat, Idea, MTS, Reliance CDMA, Reliance GSM, S-Tel, Tata Docomo, Tata Indicom, Uninor, Vodafone Operator(s) not meeting the benchmark: Aircel, BSNL Call Set-up Success Rate (CSSR)
One month Operator(s) meeting benchmark: Aircel, Airtel, BSNL, Etisalat, Idea, MTS, Reliance CDMA, Reliance GSM, S-Tel, Tata Docomo, Tata Indicom, Uninor Operator(s) not meeting the benchmark: Vodafone Live measurement Operator(s) meeting benchmark: Aircel, Airtel, Etisalat, Idea, MTS, Reliance CDMA, Reliance GSM, S-Tel, Tata Docomo, Tata Indicom, Uninor Operator(s) not meeting the benchmark: BSNL, Vodafone Drive test All the operators meet the benchmark
98.1% 97.4% 97.0%95.4%
98.0%99.2% 99.7%
97.0%98.3%
97.0%
99.7%
96.4%
93.1%
97.56%
98.37%
90.30%
96.41%98.00%
99.29% 99.61%
98.00% 98.30% 98.06% 98.43%
96.21%
88.55%
99.6% 100.0% 99.2% NA
99.7%
99.7% 99.9% 98.1% 100.0% 99.5% 100.0%
98.8%
100.0%85%
87%
89%
91%
93%
95%
97%
99%
CSS
R (In
per
cent
age)
Call Set Up Success Rate
CCSR: One month CSSR: Live measurement CSSR: Drive test
TRAI Benchmark ≥ 95%
Quality of Service – Audit module report for Bihar & Jharkhand Circle
19
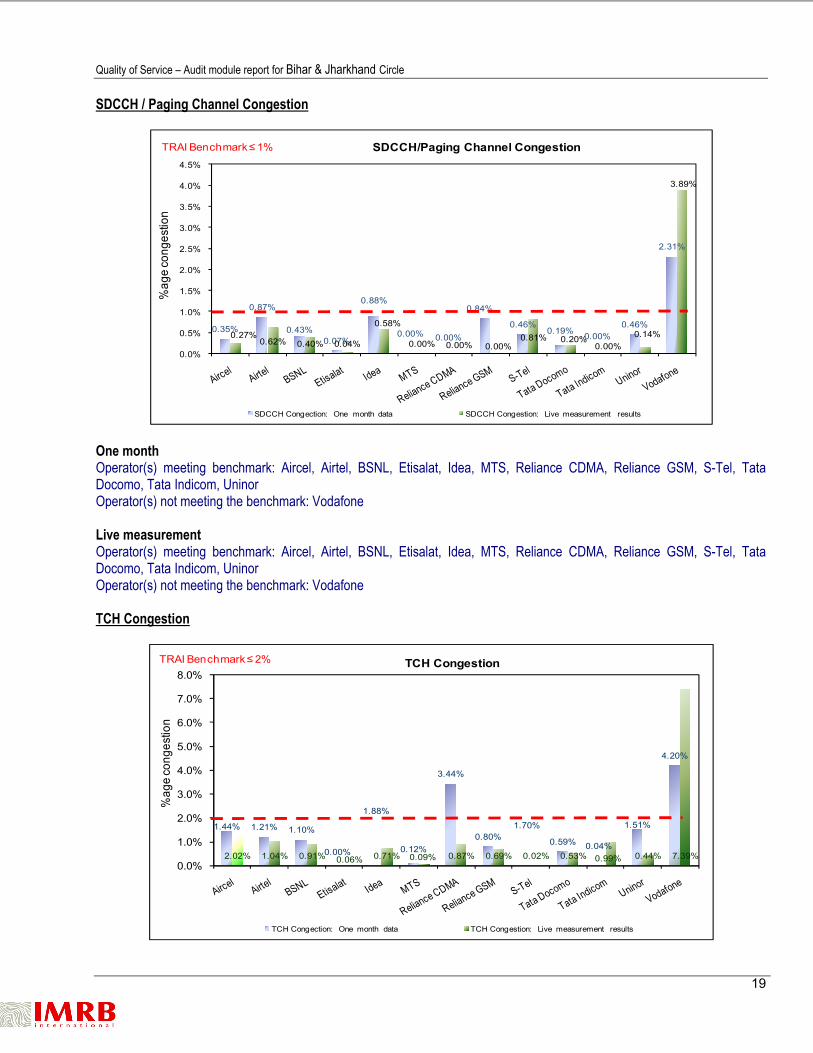
SDCCH / Paging Channel Congestion
One month Operator(s) meeting benchmark: Aircel, Airtel, BSNL, Etisalat, Idea, MTS, Reliance CDMA, Reliance GSM, S-Tel, Tata Docomo, Tata Indicom, Uninor Operator(s) not meeting the benchmark: Vodafone Live measurement Operator(s) meeting benchmark: Aircel, Airtel, BSNL, Etisalat, Idea, MTS, Reliance CDMA, Reliance GSM, S-Tel, Tata Docomo, Tata Indicom, Uninor Operator(s) not meeting the benchmark: Vodafone TCH Congestion
0.35%
0.87%
0.43%0.07%
0.88%
0.00% 0.00%
0.84%
0.46%0.19% 0.00%
0.46%
2.31%
0.27%0.62% 0.40% 0.04%
0.58%
0.00% 0.00% 0.00%0.81% 0.20%
0.00%0.14%
3.89%
0.0%
0.5%
1.0%
1.5%
2.0%
2.5%
3.0%
3.5%
4.0%
4.5%%
age
cong
estio
n SDCCH/Paging Channel Congestion
SDCCH Congection: One month data SDCCH Congestion: Live measurement results
TRAI Benchmark ≤ 1%
1.44% 1.21% 1.10%
0.00%
1.88%
0.12%
3.44%
0.80%1.70%
0.59% 0.04%
1.51%
4.20%
2.02% 1.04% 0.91% 0.06% 0.71% 0.09% 0.87% 0.69% 0.02% 0.53% 0.99% 0.44% 7.39%0.0%
1.0%
2.0%
3.0%
4.0%
5.0%
6.0%
7.0%
8.0%
%ag
e co
nges
tion
TCH Congestion
TCH Congection: One month data TCH Congestion: Live measurement results
TRAI Benchmark ≤ 2%

Quality of Service – Audit module report for Bihar & Jharkhand Circle
20
One month Operator(s) meeting benchmark: Aircel, Airtel, BSNL, Etisalat, Idea, MTS, Reliance GSM, S-Tel, Tata Docomo, Tata Indicom, Uninor Operator(s) not meeting the benchmark: Reliance CDMA, Vodafone Live measurement Operator(s) meeting benchmark: Airtel, BSNL, Etisalat, Idea, MTS, Reliance CDMA, Reliance GSM, S-Tel, Tata Docomo, Tata Indicom, Uninor Operator(s) not meeting the benchmark: Aircel, Vodafone Call Drop Rate
One month All the operators meet the benchmark Live measurement All the operators meet the benchmark Drive test Operator(s) meeting benchmark: Aircel, Airtel, BSNL, MTS, Reliance CDMA, Reliance GSM, S-Tel, Tata Docomo, Tata Indicom, Uninor, Vodafone Operator(s) not meeting the benchmark: Idea
1.2%1.8%
1.4%
0.5%
1.5%
0.7% 0.9%1.6%
0.5% 0.4% 0.3%
1.4%1.7%
1.1%1.3%
1.4%
0.5%
1.0% 1.1% 0.9%1.1%
0.4%
1.0%
0.5%
1.5% 1.8%
0.0% 0.0%
0.8%
0.0% 0.0% 0.0% 0.0%
0.6%
0.0% 0.0% 0.0%
0.6%
0.0%0.0%
0.5%
1.0%
1.5%
2.0%
2.5%
3.0%
3.5%
4.0%
4.5%
5.0%
%ag
e ca
lls d
ropp
ed
Call Drop Rate
Call drop rate: One month data Call drop rate: Live measurement results Call drop rate: Drive test
TRAI Benchmark ≤ 2%

Quality of Service – Audit module report for Bihar & Jharkhand Circle
21
Cells with more than 3% TCH Drop Rate
One month Operator(s) meeting benchmark: Airtel, Etisalat, Idea, MTS, Reliance CDMA, Reliance GSM, S-Tel, Tata Docomo, Tata Indicom, Uninor Operator(s) not meeting the benchmark: Aircel, BSNL, Vodafone Live measurement Operator(s) meeting benchmark: Airtel, Etisalat, Idea, Reliance CDMA, Reliance GSM, S-Tel, Tata Docomo, Tata Indicom, Uninor Operator(s) not meeting the benchmark: Aircel, BSNL, MTS, Vodafone Voice quality
9.68% 2.44%
5.16%
3.83% 3.74% 2.32% 1.02% 1.31% 4.14% 0.82% 1.64% 4.21% 10.66%
8.77%
2.28%
5.26%
3.17%
3.51%
9.31%
2.48%
1.46%
4.24%
0.86% 0.88%
4.21%
7.06%
0%
2%
4%
6%
8%
10%
12%%
age
calls
dro
pped
Cells having >3% TCH Drop
Cells having >3% TCH - 1 Month Cells having >3% TCH - Live measurement results
TRAI Benchmark ≤ 5%
95.87% 96.52% 96.57% 98.51% 95.88%99.60%
96.56% 98.56% 97.08% 96.57% 99.40% 96.80% 95.84%
97.62% 98.52% 92.92%
NA
95.34% 98.49% 96.32% 93.61% 97.06% 96.01% 99.45% 96.24% 97.28%
0%
20%
40%
60%
80%
100%
%ag
e co
nnec
tions
with
goo
d vo
ice
qual
ity
Voice Quality
Voice quality: One month data Voice quality: Drive test
TRAI Benchmark ≥ 95%

Quality of Service – Audit module report for Bihar & Jharkhand Circle
22
One month All the operators meet the benchmark Live measurement (Drive test) Operator(s) meeting benchmark: Aircel, Airtel, Idea, MTS, Reliance CDMA, Tata Docomo, Tata Indicom, Uninor, Vodafone Operator(s) not meeting the benchmark: BSNL, Reliance GSM, S-Tel Billing Disputes - Postpaid
Operator(s) meeting benchmark: Aircel, Airtel, BSNL, Idea, Reliance CDMA, Tata Indicom, Vodafone Operator(s) not meeting the benchmark: Tata Docomo Complaints - Prepaid
0.00% 0.00%
0.09%
NA
0.03%
NA 0.00% NA NA
0.18%
0.02%
NA
0.06%
0.00%
0.02%
0.04%
0.06%
0.08%
0.10%
0.12%
0.14%
0.16%
0.18%
0.20%
Per
cent
age
bills
dis
pute
d
Billing disputes - Postpaid TRAI Benchmark ≤ 0.1%
0.06%
0.00%
0.04%
0.27%
0.01%0.02%
0.01%0.00%
0.03% 0.03%0.01%
0.05%
0.01%
0.00%
0.05%
0.10%
0.15%
0.20%
0.25%
0.30%
Perc
enta
ge b
ills d
ispu
ted
Billing disputes - Prepaid TRAI Benchmark ≤ 0.1%

Quality of Service – Audit module report for Bihar & Jharkhand Circle
23
Operator(s) meeting benchmark: Aircel, Airtel, BSNL, Idea, MTS, Reliance CDMA, Reliance GSM, S-Tel, Tata Docomo, Tata Indicom, Uninor, Vodafone Operator(s) not meeting the benchmark: Etisalat Resolution of billing complaints
One month All the operators meet the benchmark Live measurement Operator(s) meeting benchmark: Airtel, Etisalat Drive Test Operator(s) not meeting the benchmark: Aircel, BSNL, Idea, MTS, Reliance CDMA, Reliance GSM, S-Tel, Tata Docomo, Tata Indicom, Uninor, Vodafone
100% 100% 100% 100% 100% 100% 100% 100% 100% 100% 100% 100% 100%
76%
100%
71%
100%
73%60%
33%
80%67%
53%
83%
60%73%
0%
20%
40%
60%
80%
100%
Perc
enta
ge ca
ses r
esol
ved
in 4
wee
ks
Resolution of billing complaints
Percentage cases resolved in 4 weeks:Audit results Percentage cases resolved in 4 weeks:Live measurement
TRAI Benchmark =100%
Quality of Service – Audit module report for Bihar & Jharkhand Circle
24
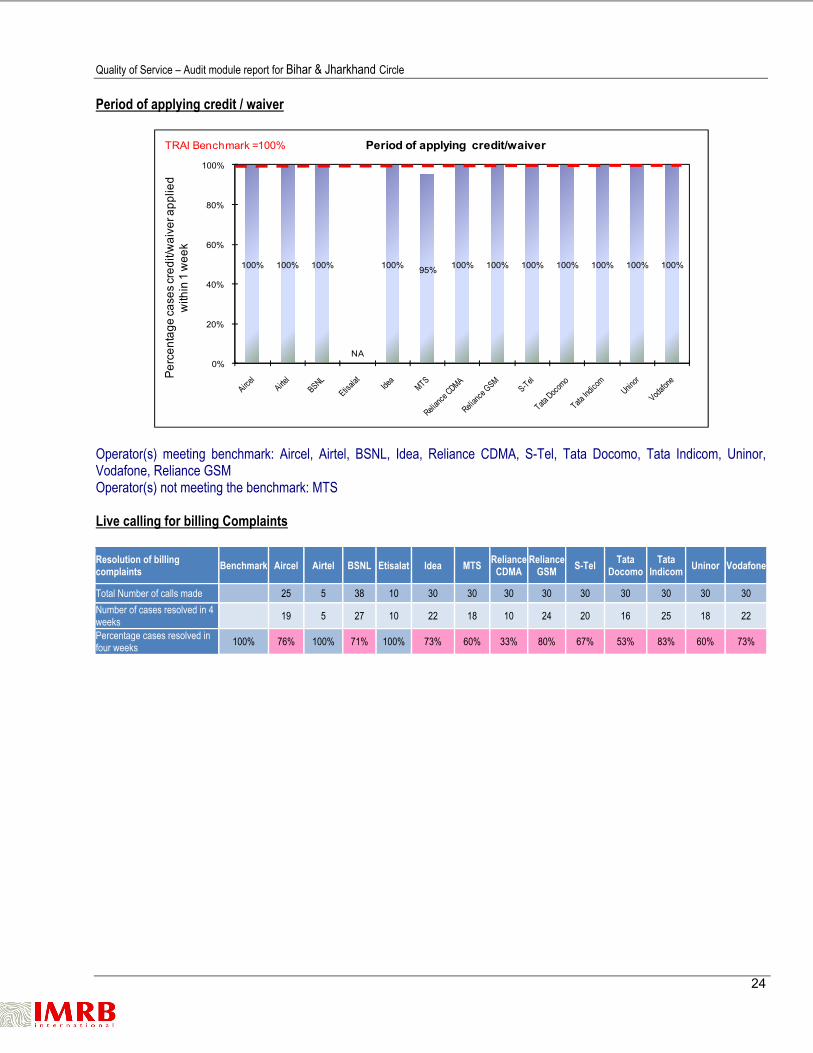
Period of applying credit / waiver
Operator(s) meeting benchmark: Aircel, Airtel, BSNL, Idea, Reliance CDMA, S-Tel, Tata Docomo, Tata Indicom, Uninor, Vodafone, Reliance GSM Operator(s) not meeting the benchmark: MTS Live calling for billing Complaints Resolution of billing complaints Benchmark Aircel Airtel BSNL Etisalat Idea MTS Reliance
CDMA Reliance
GSM S-Tel Tata Docomo
Tata Indicom Uninor Vodafone
Total Number of calls made 25 5 38 10 30 30 30 30 30 30 30 30 30 Number of cases resolved in 4 weeks 19 5 27 10 22 18 10 24 20 16 25 18 22
Percentage cases resolved in four weeks 100% 76% 100% 71% 100% 73% 60% 33% 80% 67% 53% 83% 60% 73%
100% 100% 100%
NA
100% 95% 100% 100% 100% 100% 100% 100% 100%
0%
20%
40%
60%
80%
100%Pe
rcen
tage
case
s cre
dit/w
aive
r app
lied
with
in 1
wee
k
Period of applying credit/waiverTRAI Benchmark =100%

Quality of Service – Audit module report for Bihar & Jharkhand Circle
25
Customer Care / Helpline: Calls answered
One month Operator(s) meeting benchmark: Aircel, BSNL, Etisalat, Idea, MTS, Reliance CDMA, Reliance GSM, Tata Indicom, Uninor, Vodafone Operator(s) not meeting the benchmark: Airtel, Tata Docomo Live measurement All the operators meet the benchmark Customer Care / Helpline: Calls answered voice to voice
100.00% 94.91% 96.47% 98.94% 97.11% 97.49% 100.00%100.00%
NA
71.29%
99.38% 96.24% 100.00%
100.00%100.00%100.00%100.00%100.00%100.00%100.00%100.00%100.00%100.00%100.00%100.00%100.00%
0%
20%
40%
60%
80%
100%
%ag
e ca
lls co
nnec
ted
and
answ
ered
Calls connected and answered
Percentage calls conncted and answered:One month data Percentage calls connected and answered:Live calling
TRAI Benchmark ≥95%
76.27%
93.97%
71.60%
92.53% 96.65% 91.00% 97.34%
69.53%
93.53% 88.07%96.32%
85.07%
64.00%
98.00% 100.00%
58.00%
100.00%
92.00%
64.00%
82.00%
96.00%
22.00%
100.00%100.00%100.00%96.00%
0%
20%
40%
60%
80%
100%
%ag
e ca
lls a
nsw
ered
in 6
0 se
cond
s
Calls answered in 60 seconds (Voice to Voice)
Percentage calls answered in 60 Seconds:One month data Percentage calls answered in 60 seconds: Live calling
TRAI Benchmark ≥ 90%

Quality of Service – Audit module report for Bihar & Jharkhand Circle
26
One month Operator(s) meeting benchmark: Airtel, Etisalat, Idea, MTS, Reliance CDMA, S-Tel, Tata Indicom Operator(s) not meeting the benchmark: Aircel, BSNL, Reliance GSM, Tata Docomo, Uninor, Vodafone Live measurement Operator(s) meeting benchmark: Aircel, Airtel, Etisalat, Idea, Reliance GSM, Tata Docomo, Tata Indicom, Uninor, Vodafone Operator(s) not meeting the benchmark: BSNL, MTS, Reliance CDMA, S-Tel Termination / Closure of service
All the operators meet the benchmark Refund of deposits
100.00%100.00%100.00%
NA
100.00%
NA
100.00%100.00%
NA
100.00%100.00%
NA
100.00%
0%
20%
40%
60%
80%
100%
Perc
enta
ge c
ases
clo
sure
atte
nded
with
in 7
day
s
Termination/Closure of serviceTRAI Benchmark =100%
0.00%
100.00%100.00%
NA
100.00%
NA
100.00%
100.00%
NA
88.89%100.00%
NA
100.00%
0%
20%
40%
60%
80%
100%
Perc
enta
ge c
ases
refu
nd p
rovi
ded
with
in 6
0 da
ys
Refund of deposts after closureTRAI Benchmark =100%

Quality of Service – Audit module report for Bihar & Jharkhand Circle
27
Operator(s) meeting benchmark: Airtel, BSNL, Idea, Reliance CDMA, Reliance GSM, Tata Indicom, Vodafone Operator(s) not meeting the benchmark: Tata Docomo Inter operator calls assessment
Inter operator call Assessment To↓ From→ Aircel Airtel BSNL Etisalat Idea MTS Reliance
CDMA Reliance
GSM S-Tel Tata Docomo
Tata Indicom Uninor Vodafone
Aircel NA 100% 100% 100% 100% 97% 100% 100% 100% 99% 100% 91% 100%
Airtel 100% NA 100% 100% 100% 98% 99% 100% 89% 100% 100% 79% 100%
BSNL 100% 99% NA 100% 100% 97% 96% 100% 92% 100% 100% 98% 93%
Etisalat 95% 99% 100% NA 100% 100% 100% 100% 91% 98% 100% 100% 100%
Idea 100% 100% 100% 100% NA 96% 100% 100% 100% 100% 99% 100% 97%
MTS 93% 99% 100% 100% 96% NA 99% 100% 94% 100% 99% 97% 100%
Reliance CDMA 100% 100% 100% 100% 100% 98% NA 100% 98% 100% 100% 100% 98%
Reliance GSM 100% 100% 100% 100% 100% 100% 100% NA 99% 100% 100% 97% 100%
S-Tel 93% 99% 100% 100% 97% 95% 100% 100% NA 100% 99% 98% 100%
Tata Docomo 95% 89% 100% 100% 98% 99% 100% 100% 100% NA 99% 99% 98%
Tata Indicom 100% 95% 100% 100% 100% 96% 100% 100% 100% 100% NA 100% 100%
Uninor 93% 95% 100% 100% 96% 94% 99% 100% 97% 100% 100% NA 100%
Vodafone 100% 99% 100% 100% 100% 97% 99% 100% 99% 100% 100% 100% NA
In the inter-operator call assessment, calls were made from the test SIMs of service provider whose audit was being conducted to all the other service providers. Almost all service providers except BSNL, Reliance GSM and Etisalat had difficulty in connecting to the number of one or the other service provider. For most of the service providers it was difficult connecting to MTS, S-Tel and Uninor.
The problems faced by the calling operator to other operators

Quality of Service – Audit module report for Bihar & Jharkhand Circle
28
7.0 Compliance reports: Results of Verification of PMR 7.1 Cellular Mobile services
Name of Service Provider
Network Availability Connection Establishment Connection Maintenance (Retainability) POI
Total no. of
BTSs in the
licensed service
area
Sum of downtime of BTSs
in a month in hours i.e.
total outage
time of all BTSs in hours
during a month
BTSs Accumulated
downtime (not
available for service) (%age)
No. of BTSs having
accumulated downtime of >24 hours in
a month
Worst affected
BTSs due to
downtime (%age)
Call Set-up
Success Rate
(within licensee’s
own network)
SDCCH/ Paging chl. Congestion
(%age)
TCH Congestion
(%age)
Call Drop Rate
(%age)
Total No. of cells
exceeding 3% TCH drop (call
drop
Total no. of
cells in the
network
Worst affected
cells having more than 3%
TCH drop (call drop) rate
(%age)
%age connection with good
voice quality
Point of interconnection
(POI) Congestion
Total number
of working
POI Service
Area wise
Benchmark ≤ 2% ≤ 2% ≥ 95% ≤ 1% ≤ 2% ≤ 2% ≤ 5% ≥ 95%
Aircel PMR 3345 12043 0.49% 110 3.29% 98.39% 0.19% 0.92% 1.70% 1576 10181 15.48% 94.95% 1 44
IMRB 3345 12043 0.49% 110 3.29% 98.39% 0.19% 0.92% 1.70% 1576 10181 15.48% 94.95% 1 44
Airtel PMR 6523 5593.5 0.12% 39.5 0.61% 97.40% 0.72% 1.59% 1.57% 613 19504 3.15% 98.64% 1 48
IMRB 6523 5593.5 0.12% 39.5 0.61% 97.40% 0.72% 1.59% 1.57% 613 19504 3.15% 98.64% 1 48
BSNL PMR 3237 61756 1.28% 161 1.83% 97.00% 0.45% 1.17% 1.32% 449 9622 5.09% 97.00% 1 208
IMRB 3245 61602 2.63% 159 4.28% 96.84% 0.43% 1.00% 1.61% 449 9645 5.08% 96.57% 1 204
Etisalat PMR 32 1449.15 6.09% 3 9.38% 99.75% 0.39% 0.00% 0.20% 2 95 2.11% 98.89% 0 20
IMRB 32 1449.15 6.09% 3 8.00% 99.79% 0.39% 0.00% 0.20% 2 95 2.11% 98.89% 0 20
Idea PMR 3826 29070 1.03% 52 1.36% 98.22% 0.71% 1.75% 1.45% 466 11567 4.03% 95.56% 0 83
IMRB 3826 29070 1.03% 52 1.36% 98.22% 0.71% 1.75% 1.45% 466 11567 4.03% 95.56% 0 83
MTS PMR 1294 17572.62 1.82% 22 1.70% 99.27% 0.00% 0.03% 0.22% 38 3882 0.98% 99.50% 0 35
IMRB 1294 17572.62 1.82% 22 1.70% 99.27% 0.00% 0.03% 0.22% 38 3882 0.98% 99.50% 0 35
Reliance CDMA
PMR 2423 10520 0.60% 25 1.02% 99.65% 0.00% 1.54% 0.89% 14 2423 0.56% 96.30% 0 39
IMRB 2423 10520 0.60% 25 1.02% 99.00% 0.00% 1.55% 0.89% 13 2423 0.54% 96.30% 0 39
Reliance GSM
PMR 2934 5579 0.26% 37.33 1.27% 97.51% 0.87% 1.45% 1.35% 222 8802 2.52% 95.83% 0 22
IMRB 2934 5579 0.26% 37.33 1.27% 97% 0.87% 1.46% 1.35% 222 8802 2.52% 95.83% 0 22
S-Tel PMR 1426 19726.67 1.88% 21 1.49% 97.22% 0.50% 0.55% 0.34% 209 4270 4.91% 97.21% 5 DNA
IMRB 1426 19726.67 1.88% 21 1.49% 97.22% 0.50% 0.55% 0.34% 209 4270 4.91% 97.21% 5 53
Tata Docomo
PMR 1908 237 2.00% 0 0.00% 97.22% 0.07% 0.47% 0.99% 133 5721 2.34% 96.61% 0 9
IMRB 1908 237 2.00% 0 0.00% 97.22% 0.07% 0.47% 0.99% 133 5721 2.34% 96.61% 0 9
Tata Indicom
PMR 1079 808 0.10% 1 0.09% 99.74% 0.00% 0.03% 0.34% 1 3257 0.03% 99.73% 0 212
IMRB 1079 808 0.10% 1 0.09% 99.74% 0.00% 0.03% 0.34% 1 3257 0.03% 99.73% 0 212
Uninor PMR 1842 3121.97 0.23% 4 0.21% 97.87% 0.27% 0.32% 1.67% 270 5505 4.90% 96.54% 16 DNA
IMRB 1842 3121.97 0.23% 4 0.21% 97.87% 0.27% 0.32% 1.67% 270 5505 4.90% 96.54% 16 64
Vodafone PMR 5028 16878.67 0.45% 74.67 1.48% 96.52% 1.16% 2.61% 1.30% 1157 15068 7.68% 96.18% 0 46
IMRB 5028 16878.67 0.45% 74.67 1.48% 95.85% 1.16% 2.61% 1.30% 1157 15068 7.68% 96.18% 0 46

Quality of Service – Audit module report for Bihar & Jharkhand Circle
29
Nam
e of Service Provide
r
Metering and Billing Response time to the customer for assistance
Termination/ closure of service
Metering and billing
credibility ‐ p
ost p
aid
No. of b
ills issued
during the pe
riod
No. of b
ills disputed
includ
ing billing
complaints du
ring
the pe
riod
Metering and billing
credibility ‐ p
re paid
No. of charging / cred
it / validity
com
plaints
during
the qu
arter
Total no. of p
re‐paid custom
ers at th
e en
d of th
e qu
arter
Resolutio
n of billing/charging
com
plaints
No. of b
illing/ (p
ost‐paid) and
charging,
cred
it / validity
(pre‐paid) com
plaints
resolved
with
in 4 weeks during the qu
arter
Total no. of b
illing (post‐paid) and
charging,
cred
it / validity
(pre‐paid)complaints
received
during the qu
arter
No. of b
illing complaints (post p
aid) and
charging, credit / validity
com
plaints (pre
paid) resolved in favour of the
customer
during
thequ
arter
No. of com
plaints disposed
on accoun
t of
not con
side
red as valid com
plaints du
ring
the qu
arter
Period
of app
lying cred
it / waiver /
adjustmen
t to custom
er/s accou
nt from
the
date of resolution of com
plaints
Accessibility of call cen
tre/ customer care
Total no. of call attem
pts to call cen
tre /
custom
er care no
s. during TC
BH (N
ote)
No. of calls con
nected
and
answered
successfully to
call cen
tre / custom
er care
nos. during TC
BH (N
ote)
Percen
tage of calls answered
by the
operators (voice to
voice) w
ithin 60 second
s
%age requ
est for Termination / Clou
se of
service complied with
in 7 days
Total N
o. of req
uest fo
r Term
ination /
Clou
re of service re
ceived
during the qu
arter
No. of reque
sts for Term
ination / Closure of
service complied with
in 7 days du
ring
the
quarter
Time taken for refun
d of dep
osits after
closure
Benchmark < 0.1%
< 0.1% 100%
within 4 weeks
100% Within 1 week
> 95% > 90%100% within 7 days
100% within 60 days
Aircel PMR 0.00% 3359 0 0.47% 19491 4177475 100% 14109 14109 13020 1089 100% 100% 313927 291016 54.3% 100% 12 12 100%
IMRB 0.00% 3359 0 0.47% 19491 4177475 100% 14109 14109 13020 1089 100% 100% 313927 291016 54.3% 100% 12 12 100%
Airtel PMR 0.03% 67387 17 0.00% 27 51789865 100% 44 44 44 0 100% 94% 166702847 157277665 84.0% 100% 291 291 100%
IMRB 0.03% 67387 17 0.00% 27 51789865 100% 44 44 44 0 100% 94% 166702847 157277665 84.0% 100% 291 291 100%
BSNL PMR 0.07% 98455 71 0.05% 4169 5217787 100% 3922 4242 3908 12 100% 100% 2670248 2504364 93.0% 100% 895 895 100%
IMRB 0.06% 96964 80 0.07% 4126 5209010 100% 4206 4206 370 3836 100% 96.89% 3841268 3675443 93.4% 95% 265 265 100%
Etisalat PMR NA NA NA 0.00% 6 4141 100% 6 6 0 6 NA 99% 1736 1601 92.2% NA NA NA NA
IMRB NA NA NA 0.00% 6 4141 100% 6 6 0 6 NA 99% 1736 1601 92.2% NA NA NA NA
Idea PMR 0.03% 19027 5 0.01% 727 12095921 100% 732 732 732 3963 100% 98% 2120398 2079448 94.0% 100% 197 197 100%
IMRB 0.03% 19027 5 0.01% 727 12095921 100% 732 732 732 3963 100% 98% 2120398 2079448 94.0% 100% 197 197 100%
MTS PMR NA NA NA 0.10% 610 639617 100% 610 610 594 16 100% 98% 51023 49270 96.6% NA NA NA NA
IMRB NA NA NA 0.10% 610 639617 100% 610 610 594 16 100% 98% 51023 49270 96.6% NA NA NA NA
Reliance CDMA
PMR 0.09% 225983 1264 0.06% 8626 3497185 100% 27141 27141 6134 21007 100% 100% 731042 731042 100.0% 100% 785 785 100%
IMRB 0.04% 225483 1264 0.06% 1977 3497185 100% 27141 27141 6134 21007 100% 100%731042 731042
100% 100% 2440 2440 100%
Reliance GSM PMR 0.07% 12131 40 0.04% 7997 4302696 100% 24030 24030 4713 19317 100% 84% 193082 163497 47.0% 100% 65 65 100%
IMRB 0.07% 12131 9 0.04% 1568 4302696 100% 24030 24030 4713 19317 100% 85%2739081 1298243
47% 100% 21 21 100%
S-Tel PMR NA NA NA 0.06% 736 1206467 100% 2207 2207 7 2200 100% 95% 1113754 1058066 95.0% NA NA NA NA
IMRB NA NA NA 0.06% 736 1206467 100% 2207 2207 7 2200 100% 95% 1113754 1058066 95.0% NA NA NA NA

Quality of Service – Audit module report for Bihar & Jharkhand Circle
30
Tata Docomo PMR 0.05% 9767 23 0.00% 6223 3127419 100% 6246 6246 16 6230 100% 95% 1223169 1149868 88.0% 100% 173 173 NA
IMRB 0.05% 9767 23 0.00% 6223 3127419 100% 6246 6246 16 6230 100% 95% 1223169 1149868 88.0% 100% 173 173 64%
Tata Indicom PMR 0.04% 101725 37 0.05% 1557 2834814 100% 1739 1741 1594 146 100% 99% 1085008 1070619 96.0% 100% 1839 1839 89%
IMRB 0.04% 101725 37 0.05% 1557 2834814 100% 1739 1741 1594 146 100% 99% 1085008 1070619 96.0% 100% 1839 1839 89%
Uninor PMR NA NA NA 0.10% 226800 2155143 100% 2268 2268 NA NA NA 91% 7349952 6651233 82.9% NA NA NA NA
IMRB NA NA NA 0.10% 226800 2155143 100% 2268 2268 0 2268 100% 91% 7349952 6651233 82.9% NA NA NA NA
Vodafone PMR 0.10% 24022 24 0.01% 1361 4549557 100% 1385 1385 1396 36 100% 100% 594493 501017 97.0% 100% 1206 1206 91%
IMRB 0.10% 24022 24 0.01% 1361 4549557 100% 1385 1385 1396 36 100% 100% 594493 501017 97.0% 100% 1206 1206 91%
Figures do not match with those reported in PMR Not meeting benchmark
Figures verified on all India basis B’mark = TRAI Benchmark, DNA = Details not available

Quality of Service – Audit module report for Bihar & Jharkhand Circle
31
8.0 Conclusions
8.1 Cellular Mobile services
1. In case of Aircel, worst affected BTS due to downtime, worst affected cells having more than 3% TCH Drop, voice quality, Metering and billing credibility - pre paid and percentage of calls answered by the operators (voice to voice) within 60 seconds is not meeting the benchmarks defined by TRAI.
2. In case of Airtel and Reliance GSM, Accessibility of call centre/ customer care and percentage of calls answered by the operators (voice to voice) within 60 seconds is not meeting the benchmarks defined by TRAI.
3. In case of BSNL, BTS Accumulated Downtime, worst affected BTS due to downtime, worst affected cells having more than 3% TCH Drop and Termination/Closures is not meeting the benchmarks defined by TRAI. Moreover, the figures reported by BSNLfor CSSR, Paging channel congestion, TCH Congestion, Call drop, worst affected cells having more than 3% TCH Drop, voice quality, Metering and billing credibility - pre paid, , Metering and billing credibility – post, Resolution of billing/charging complaints, Accessibility of call centre/ customer care, percentage of calls answered by the operators (voice to voice) within 60 seconds, %age request for Termination / Closure of service complied within 7 days and Metering and Billing credibility(Prepaid and Postpaid) does not match the figures obtained on verification.
4. In case of Etisalat, BTS Accumulated Downtime and worst affected BTS due to downtime is not meeting the benchmarks defined by TRAI. Moreover, the figures reported by Etisalat for CSSR does not match the figures obtained on verification.
5. In case of Vodafone, Paging Channel Congestion, TCH Congestion and worst affected cells having more than 3% TCH Drop is not meeting the benchmarks defined by TRAI.
6. In case of Tata Docomo, worst affected cells having more than 3% TCH Drop and Time taken for refund of deposits after closure is not meeting the benchmarks defined by TRAI.
7. In case of Tata Indicom, Time taken for refund of deposits after closure is not meeting the benchmarks defined by TRAI.
8. In case of Uninor, Accessibility of call centre/ customer care and percentage of calls answered by the operators (voice to voice) within 60 seconds is not meeting the benchmarks defined by TRAI. Moreover, the figures reported by Uninor for worst affected cells having more than 3% TCH Drop is not meeting the benchmarks defined by TRAI.
9. In case of Vodafone, Time taken for refund of deposits after closure is not meeting the benchmarks defined by TRAI. Moreover, the figures reported by Vodafone for CSSR is not meeting the benchmarks defined by TRAI.
10. Tthe figures reported by Reliance CDMA for CSSR, TCH Congestion, worst affected cells having more than 3% TCH Drop and Metering and billing credibility - pre paid is not meeting the benchmarks defined by TRAI.
11. Moreover, the figures reported by Reliance GSM for CSSR and TCH Congestion is not meeting the benchmarks defined by TRAI.

Quality of Service – Audit module report for Bihar & Jharkhand Circle
32
9.0 Annexure - I 9.1 Service provider performance report based on one month data
Name of Service Provider
Network Availability Connection Establishment (Accessibility)
Connection Maintenance (Retainability) Metering and Billing
Response time to customer for assistance
Termination / closure of service
BTSs Accumulated
downtime (not
available for service)
Worst affected
BTSs due to
downtime
Call Set-up
Success Rate
(within licensee's
own network)
SDCCH/ Paging
Chl. Congestion
TCH Congestion
Call Drop Rate
(%age)
Worst affected
cells having more than 3%
TCH drop
%age of connectionwith good
voice quality
Metering and billingcredibility (Postpaid)
Metering and
billing credibility(Prepaid)
%age complaintsresolved within 4 weeks
Period of applying
credit/waiverless than 1
week
Accessibility
of call centre/
customer care
Percentageof calls
answered by
operators within 60
sec
%age requests forTermination
complied within 7
days
Refund of
deposits after
closure within 60
days
Benchmark ≤ 2% ≤ 2% ≥ 95% ≤ 1% ≤ 2% ≤ 2% ≤ 5% ≥ 95% ≤ 0.1% ≤ 0.1% 100% 100% ≥ 95% ≥ 90% 100% 100%
Aircel 0.82% 6.75% 98.05% 0.35% 1.44% 1.16% 9.68% 95.87% 0.00% 0.06% 100.00% 100.00% 100.00% 76.27% 100.00% NA
Airtel 0.09% 0.60% 97.43% 0.87% 1.21% 1.25% 2.44% 96.52% 0.00% 0.00% 100.00% 100.00% 94.91% 93.97% 100.00% 100.00%
BSNL 2.56% 5.43% 96.95% 0.43% 1.10% 1.43% 5.16% 96.57% 0.09% 0.04% 100.00% 100.00% 96.47% 71.60% 100.00% 100.00%
Etisalat 0.90% 1.64% 95.38% 0.07% 0.00% 0.48% 3.83% 98.51% NA 0.27% 100.00% NA 98.94% 92.53% NA NA
Idea 1.03% 1.50% 98.00% 0.88% 1.88% 1.52% 3.74% 95.88% 0.03% 0.01% 100.00% 100.00% 97.11% 96.65% 100.00% 100.00%
MTS 1.90% 1.31% 99.20% 0.00% 0.12% 0.74% 2.32% 99.60% NA 0.02% 100.00% 95.00% 97.49% 91.00% NA NA Reliance
CDMA 0.60% 1.03% 99.68% 0.00% 3.44% 0.85% 1.02% 96.56% 0.00% 0.01% 100.00% 100.00% 100.00% 97.34% 100.00% 100.00%
Reliance GSM 0.14% 0.61% 97.00% 0.84% 0.80% 1.56% 1.31% 98.56% NA 0.00% 100.00% 100..00% 100.00% 69.53% 100.00% 100.00%
S-Tel 1.83% 1.84% 98.30% 0.46% 1.70% 0.46% 4.14% 97.08% NA 0.03% 100.00% 100.00% NA 93.53% NA NA Tata
Docomo 0.00% 0.00% 97.00% 0.19% 0.59% 0.39% 0.82% 96.57% 0.18% 0.03% 100.00% 100.00% 71.29% 88.07% 100.00% 88.89%
Tata Indicom 0.12% 0.19% 99.65% 0.00% 0.04% 0.32% 1.64% 99.40% 0.02% 0.01% 100.00% 100.00% 99.38% 96.32% 100.00% 100.00%
Uninor 1.17% 0.00% 96.37% 0.46% 1.51% 1.35% 4.21% 96.80% NA 0.05% 100.00% 100.00% 96.24% 85.07% NA NA
Vodafone 0.62% 1.66% 93.10% 2.31% 4.20% 1.70% 10.66% 95.84% 0.06% 0.01% 100.00% 100.00% 100.00% 64.00% 100.00% 100.00%
S-Tel did not provide the value for customer care access stating that they do not have the means of measuring this parameter and do not provide the value to TRAI. 9.2 Monthly Point of Interconnection (POI) Congestion Report
Name of the Service Provider
Name of POI not meeting the benchmark
Total No. of circuits on POI
Total No. of call attempts on POI
Total traffic served on POI (Erlang)
% of Congestion POI
Action already taken/ action plan for meeting the
benchmark
Aircel All POI's meeting TRAI specified benchmark
Airtel All POI's meeting TRAI specified benchmark
BSNL Bharti Airtel 108 E1 200505 2608 16.65% Congestion is due to faulty 28E
1s due to Airtel. Augmentation ofSTM-1 is under progress
Etisalat All POI's meeting TRAI specified benchmark
Idea All POI's meeting TRAI specified benchmark
MTS All POI's meeting TRAI specified benchmark

Quality of Service – Audit module report for Bihar & Jharkhand Circle
33
Reliance CDMA All POI's meeting TRAI specified benchmark
Reliance GSM All POI's meeting TRAI specified benchmark
S-Tel LOBRM1ATM4 61 2199 57.92 1.49 5 E1s augmentation plan
Tata Docomo All POI's meeting TRAI specified benchmark
Tata Indicom All POI's meeting TRAI specified benchmark
Uninor
Aircel (I/O) Patna 309 66717 308.6388889 65.84 Augmentation in progress
Airtel GSM GCS 3 (O)
Patna 92 82355 92 95.90 Port augmentation pending from Airtel
BSNL L1 (I/O) 513 94821 509.8611111 69.84 Augmentation in progress TATA CDMA
(O) Patna 278 30037 276.4722222 40.25 Augmentation in progress
TTSL NLD (I/O) 679 75780 669.6944444 8.59 Augmentation in progress
VSNL NLD (I/O) Patna 618 36528 578.0833333 3.08 Augmentation in progress
Airtel GSM GCS 2 (O)
Patna 154 55028 154 90.63 Port augmentation pending from Airtel
Idea(O) 557 157870 551.6666667 81.46 Augmentation in progress TATA
GSM(O) Patna
61 16670 60.83333333 68.75 Augmentation in progress
BSNL L1 (I/O)
Patliputra 15 1475 7.472222222 1.76 Augmentation in progress
Reliance CDMA
Danapur (I/O) 464 26153 410.8055556 0.53
TTSL NLD (I/O) Patna 835 89744 833 35.11 Augmentation in progress
Vodafone POI Rukanpura
(O) 1145 122411 1143.75 45.86 Augmentation in progress
Airtel POI Bhagalpur (O) 154 68012 153.9444444 91.87 Port augmentation pending from Airtel
Airtel O/G (Biscomaan)
Patna 215 73617 214.9722222 90.87 Port augmentation pending from Airtel
Airtel GCS 4, Muzaffarpur (
O ) 185 67109 184.9444444 91.26 Port augmentation pending from Airtel
Airtel GCS 5, Muzaffarpur (
O ) 309 133967 308.9722222 91.68 Port augmentation pending from Airtel
Airtel Muzaffarpur
GCS 6 463 220078 462.9722222 93.33 Port augmentation pending from Airtel
Airtel Marwari Awas 153 76232 152.9722222 93.61 Port augmentation pending from Airtel
Aircel (I/O) Ranchi 494 29989 388.5 7.78 Augmentation in progress
RANCHL1 L2 Tax(I/O) 308 505 8.611111111 6.46 Augmentation in progress
VSNL NLD (I/O) Ranchi 122 7474 107.1944444 22.50 Augmentation in progress
Vodafone All POI's meeting TRAI specified benchmark
Quality of Service – Audit module report for Bihar & Jharkhand Circle
34
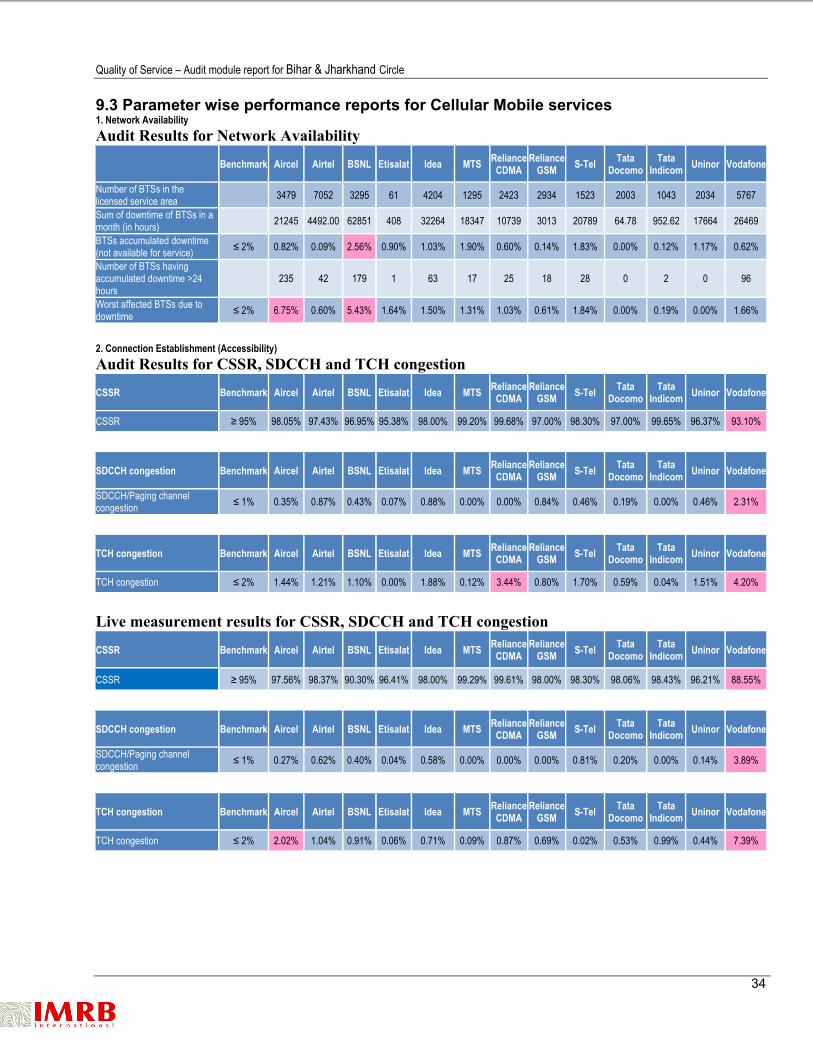
9.3 Parameter wise performance reports for Cellular Mobile services 1. Network Availability Audit Results for Network Availability
Benchmark Aircel Airtel BSNL Etisalat Idea MTS RelianceCDMA
RelianceGSM S-Tel Tata
Docomo Tata
Indicom Uninor Vodafone
Number of BTSs in the licensed service area 3479 7052 3295 61 4204 1295 2423 2934 1523 2003 1043 2034 5767
Sum of downtime of BTSs in a month (in hours) 21245 4492.00 62851 408 32264 18347 10739 3013 20789 64.78 952.62 17664 26469
BTSs accumulated downtime (not available for service) ≤ 2% 0.82% 0.09% 2.56% 0.90% 1.03% 1.90% 0.60% 0.14% 1.83% 0.00% 0.12% 1.17% 0.62%
Number of BTSs having accumulated downtime >24 hours 235 42 179 1 63 17 25 18 28 0 2 0 96
Worst affected BTSs due to downtime ≤ 2% 6.75% 0.60% 5.43% 1.64% 1.50% 1.31% 1.03% 0.61% 1.84% 0.00% 0.19% 0.00% 1.66%
2. Connection Establishment (Accessibility) Audit Results for CSSR, SDCCH and TCH congestion
CSSR Benchmark Aircel Airtel BSNL Etisalat Idea MTS RelianceCDMA
RelianceGSM S-Tel Tata
Docomo Tata
Indicom Uninor Vodafone
CSSR ≥ 95% 98.05% 97.43% 96.95% 95.38% 98.00% 99.20% 99.68% 97.00% 98.30% 97.00% 99.65% 96.37% 93.10%
SDCCH congestion Benchmark Aircel Airtel BSNL Etisalat Idea MTS RelianceCDMA
RelianceGSM S-Tel Tata
Docomo Tata
Indicom Uninor Vodafone
SDCCH/Paging channel congestion ≤ 1% 0.35% 0.87% 0.43% 0.07% 0.88% 0.00% 0.00% 0.84% 0.46% 0.19% 0.00% 0.46% 2.31%
TCH congestion Benchmark Aircel Airtel BSNL Etisalat Idea MTS RelianceCDMA
RelianceGSM S-Tel Tata
Docomo Tata
Indicom Uninor Vodafone
TCH congestion ≤ 2% 1.44% 1.21% 1.10% 0.00% 1.88% 0.12% 3.44% 0.80% 1.70% 0.59% 0.04% 1.51% 4.20%
Live measurement results for CSSR, SDCCH and TCH congestion
CSSR Benchmark Aircel Airtel BSNL Etisalat Idea MTS RelianceCDMA
RelianceGSM S-Tel Tata
Docomo Tata
Indicom Uninor Vodafone
CSSR ≥ 95% 97.56% 98.37% 90.30% 96.41% 98.00% 99.29% 99.61% 98.00% 98.30% 98.06% 98.43% 96.21% 88.55%
SDCCH congestion Benchmark Aircel Airtel BSNL Etisalat Idea MTS RelianceCDMA
RelianceGSM S-Tel Tata
Docomo Tata
Indicom Uninor Vodafone
SDCCH/Paging channel congestion ≤ 1% 0.27% 0.62% 0.40% 0.04% 0.58% 0.00% 0.00% 0.00% 0.81% 0.20% 0.00% 0.14% 3.89%
TCH congestion Benchmark Aircel Airtel BSNL Etisalat Idea MTS RelianceCDMA
RelianceGSM S-Tel Tata
Docomo Tata
Indicom Uninor Vodafone
TCH congestion ≤ 2% 2.02% 1.04% 0.91% 0.06% 0.71% 0.09% 0.87% 0.69% 0.02% 0.53% 0.99% 0.44% 7.39%

Quality of Service – Audit module report for Bihar & Jharkhand Circle
35
Drive test results for CSSR (Average of three drive tests) and blocked calls
CSSR Benchmark Aircel Airtel BSNL Etisalat Idea MTS RelianceCDMA
RelianceGSM S-Tel Tata
Docomo Tata
Indicom Uninor Vodafone
Total number of call attempts 672 634 642 NA 660 630 742 688 700 216 631 645 660 Total number of successful calls established 669 634 637 NA 658 628 741 675 700 215 631 637 660
CSSR ≥ 95% 99.55% 100.00% 99.22% NA 99.70% 99.68% 99.87% 98.11% 100.00% 99.54% 100.00% 98.76% 100.00%
Blocked calls Benchmark Aircel Airtel BSNL Etisalat Idea MTS RelianceCDMA
RelianceGSM S-Tel Tata
Docomo Tata
Indicom Uninor Vodafone
%age blocked calls 0.45% 0.00% 0.78% NA 0.30% 0.32% 0.13% 1.89% 0.00% 0.46% 0.00% 1.24% 0.00%
3. Connection Maintenance (Retainability) Audit Results for Call drop rate and for number of cells having more than 3% TCH
Call drop rate Benchmark Aircel Airtel BSNL Etisalat Idea MTS Reliance CDMA
Reliance GSM S-Tel Tata
Docomo Tata
Indicom Uninor Vodafone
Total number of calls established 4010719 732070585 DNA 152746 165319493 15466148 113656231 56568182 39016448 38130915 2784285 78008647 DNA
Total number of calls dropped 46581 718762439 DNA 737 2508959 114449 964305 884569 179364 148721 9007 1054231 DNA
Call drop rate ≤ 2% 1.16% 1.81% 1.43% 0.48% 1.52% 0.74% 0.85% 1.56% 0.46% 0.39% 0.32% 1.35% 1.70%
Cells having more than 3% TCH Benchmark Aircel Airtel BSNL Etisalat Idea MTS Reliance
CDMA Reliance
GSM S-Tel Tata Docomo
Tata Indicom Uninor Vodafone
Total number of cells in the network 10335 20592 8644 183 12578 3919 2423 8802 4566 6001 3177 6087 17283
Total number of cells having more than 3% TCH 1000 502 446 7 470 91 24.8 115 189 49 52 256 1842
Worst affected cells having more than 3% TCH ≤ 5% 9.68% 2.44% 5.16% 3.83% 3.74% 2.32% 1.02% 1.31% 4.14% 0.82% 1.64% 4.21% 10.66%
Live measurement results for Call drop rate and for number of cells having more than 3% TCH
Call drop rate Benchmark Aircel Airtel BSNL Etisalat Idea MTS RelianceCDMA
RelianceGSM S-Tel Tata
Docomo Tata
Indicom Uninor Vodafone
Total number of calls established 4250015 297641009.3 7204117 13771 204808532 16026849 2186654 2125359 4738826 18396953 120123592 100994765 DNA
Total number of calls dropped 45583 3707384 103961 64 2117568 173090 19899 22528 20133 176997 614833 1466258 DNA
Call drop rate ≤ 2% 1.07% 1.25% 1.44% 0.46% 1.03% 1.08% 0.91% 1.06% 0.42% 0.96% 0.51% 1.45% 1.76%
Cells having more than 3% TCH Benchmark Aircel Airtel BSNL Etisalat Idea MTS Reliance
CDMA Reliance
GSM S-Tel Tata Docomo
Tata Indicom Uninor Vodafone
Total number of cells in the network 10338 20833 8438 189 12553 3973 2423 9039 4572 5950 3177 6153 17283
Total number of cells having more than 3% TCH 907 476 444 6 441 370 60 132 194 51 28 259 1221
Worst affected cells having more than 3% TCH ≤ 5% 8.77% 2.28% 5.26% 3.17% 3.51% 9.31% 2.48% 1.46% 4.24% 0.86% 0.88% 4.21% 7.06%

Quality of Service – Audit module report for Bihar & Jharkhand Circle
36
Drive test results for Call drop rate (Average of three drive tests)
Call drop rate Benchmark Aircel Airtel BSNL Etisalat Idea MTS RelianceCDMA
RelianceGSM S-Tel Tata
Docomo Tata
Indicom Uninor Vodafone
Total number of calls established 669 634 637 NA 658 630 742 676 700 215 631 637 660
Total number of calls dropped 0 0 5 NA 0 0 0 4 0 0 0 4 0
Call drop rate ≤ 2% 0.00% 0.00% 0.78% NA 0.00% 0.00% 0.00% 0.59% 0.00% 0.00% 0.00% 0.63% 0.00%
4. Voice quality Audit Results for Voice quality Voice quality Benchmark Aircel Airtel BSNL Etisalat Idea MTS Reliance
CDMA Reliance
GSM S-Tel Tata Docomo
Tata Indicom Uninor Vodafone
Total number of sample calls
9595213504 88118675398 DNA 12850988 22157004973 504 113875782 56568182 39016448 5989592048 26577 129819006488 DNA
Total number of calls with good voice quality
9198664431 85049500242 DNA 12659372 21245041704 502 109962775 55753600 37875281 5784403048 26418 125662519052 DNA
%age calls with good voice quality
≥ 95% 95.87% 96.52% 96.57% 98.51% 95.88% 99.60% 96.56% 98.56% 97.08% 96.57% 99.40% 96.80% 95.84%
Drive test results for Voice quality (Average of three drive tests)
Voice quality Benchmark Aircel Airtel BSNL Etisalat Idea MTS RelianceCDMA
RelianceGSM S-Tel Tata
Docomo Tata
Indicom Uninor Vodafone
Total number of sample calls 1166127 3003899 520738 NA 471441 33315 53111 867624 1128629 354704 143122 1024708 934677 Total number of calls with good voice quality 1138318 2959494 483883 NA 449492 32812 51157 812174 1045435 340546 142340 986197 909291
%age calls with good voice quality ≥ 95% 97.62% 98.52% 92.92% NA 95.34% 98.49% 96.32% 93.61% 97.06% 96.01% 99.45% 96.24% 97.28%
5. POI Congestion Audit Results for POI Congestion
POI congestion Benchmark Aircel Airtel BSNL Etisalat Idea MTS RelianceCDMA
RelianceGSM S-Tel Tata
Docomo Tata
Indicom Uninor Vodafone
Total number of working POIs 44 48 197 30 85 46 39 22 64 9 236 68 51 No. of POIs not meeting benchmark 0 0 1 0 0 0 0 0 1 0 0 22 0
Total Capacity of all POIs (A) - in erlangs 61484 415166 DNA 1017.09 124583.58 15972 262000 148 16303.57 26488.86 76568 26781 108575
Traffic served for all POIs (B)- in erlangs 36630 347975 DNA 55.04 78162.48 7679 57406 73 9522.93 17478 36901.26 20420 84432
POI congestion ≤ 0.5% 0% 0% 0% 0% 0% 0% 0% 0% 0% 0% 0% 0% 0%

Quality of Service – Audit module report for Bihar & Jharkhand Circle
37
Live measurement results for POI congestion 6. Inter Operator Call Assessment
Inter operator call Assessment To↓ From→ Aircel Airtel BSNL Etisalat Idea MTS Reliance
CDMA Reliance
GSM S-Tel Tata Docomo
Tata Indicom Uninor Vodafone
Aircel NA 100% 100% 100% 100% 97% 100% 100% 100% 99% 100% 91% 100%
Airtel 100% NA 100% 100% 100% 98% 99% 100% 89% 100% 100% 79% 100%
BSNL 100% 99% NA 100% 100% 97% 96% 100% 92% 100% 100% 98% 93%
Etisalat 95% 99% 100% NA 100% 100% 100% 100% 91% 98% 100% 100% 100%
Idea 100% 100% 100% 100% NA 96% 100% 100% 100% 100% 99% 100% 97%
MTS 93% 99% 100% 100% 96% NA 99% 100% 94% 100% 99% 97% 100%
Reliance CDMA 100% 100% 100% 100% 100% 98% NA 100% 98% 100% 100% 100% 98%
Reliance GSM 100% 100% 100% 100% 100% 100% 100% NA 99% 100% 100% 97% 100%
S-Tel 93% 99% 100% 100% 97% 95% 100% 100% NA 100% 99% 98% 100%
Tata Docomo 95% 89% 100% 100% 98% 99% 100% 100% 100% NA 99% 99% 98%
Tata Indicom 100% 95% 100% 100% 100% 96% 100% 100% 100% 100% NA 100% 100%
Uninor 93% 95% 100% 100% 96% 94% 99% 100% 97% 100% 100% NA 100%
Vodafone 100% 99% 100% 100% 100% 97% 99% 100% 99% 100% 100% 100% NA
7. Metering and Billing credibility Audit Results for Billing performance
Billing Performance Benchmark Aircel Airtel BSNL Etisalat Idea MTS RelianceCDMA
RelianceGSM S-Tel Tata
Docomo Tata
Indicom Uninor Vodafone
Billing diputes – Postpaid Total bills generated during the period 1296 23592 47688 NA 6496 NA 76164 6937 NA 3939 36530 NA 8272
Total number of bills disputed 0 1 44 NA 2 NA 3 0 NA 7 6 NA 5
Percentage bills disputed ≤ 0.1% 0.00% 0.00% 0.09% NA 0.03% NA 0.00% NA NA 0.18% 0.02% NA 0.06%
Billing diputes - Prepaid
Number of complaints related to charging, credit & validity 2925 13 2487 53 287 192 335 62 423 1135 221 1254 354
Total number of prepaid customers in that period 4748431 19595741 5550379 19793 4726385 856879 3539418 4780681 1626127 3257016 2742958 2653372 5094157
Percentage of complaints ≤ 0.1% 0.06% 0.00% 0.04% 0.27% 0.01% 0.02% 0.01% 0.00% 0.03% 0.03% 0.01% 0.05% 0.01%
Resolution of billing complaints Total number of billing/charging complaints 2580 9 1338 38 1269 122 430 452 370 889 534 1254 2672
Total complaints considered invalid 1180 16023 1298 38 1007 32 157 255 367 881 307 0 767
Number of complaints resolved in 4 weeks from date of receipt for complaints listed in 5.3.1
2580 9 1338 38 1269 122 273 197 370 889 534 1254 2672
Percentage complaints resolved within 4 weeks of dateof receipt
100% 100% 100% 100% 100% 100% 100% 100% 100% 100% 100% 100% 100% 100%
Period of applying credit / waiver Total number of complaints where credit/waiver is required 902 9 40 0 220 19 2.73 1.97 3 8 227 1254 57
Percentage cases in which credit/waiver was received within 1 week
100% 100% 100% 100% NA 100% 95% 100% 100% 100% 100% 100% 100% 100%
The problems faced by the calling operator to other operators

Quality of Service – Audit module report for Bihar & Jharkhand Circle
38
Live calling results for resolution of billing complaints Resolution of billing complaints Benchmark Aircel Airtel BSNL Etisalat Idea MTS Reliance
CDMA Reliance
GSM S-Tel Tata Docomo
Tata Indicom Uninor Vodafone
Total Number of calls made 25 5 38 10 30 30 30 30 30 30 30 30 30 Number of cases resolved in 4 weeks 19 5 27 10 22 18 10 24 20 16 25 18 22
Percentage cases resolved in four weeks 100% 76% 100% 71% 100% 73% 60% 33% 80% 67% 53% 83% 60% 73%
8. Customer Care Audit results for customer care
Customer Care Assessment Benchmark Aircel Airtel BSNL Etisalat Idea MTS RelianceCDMA
RelianceGSM S-Tel Tata
Docomo Tata
Indicom Uninor Vodafone
Total number of call attempts to customer care for assistance
145257 69843975 3406862 5656 1590327 21445 1857372 1823820 NA 637746 3428845 5300333 134406
Number of calls getting connected and answered (electronically)
145257 66286310 3286473 5596 1544347 20906 1857372 1823820 NA 454654 3407559 5100872 134406
Percentage calls getting connected and answered ≥ 95% 100.00% 94.91% 96.47% 98.94% 97.11% 97.49% 100.00% 100.00% NA 71.29% 99.38% 96.24% 100.00%
Number of calls getting transferred to the operator (voice to voice)
145257 6480054 578547 3347 2545289 NA 608327 1282563 406947 158079 1103927 1844303 130237
Number of calls answered by operator (voice to voice) within 60 seconds
110790 6089556 414238 3097 2459986 NA 592174 891736 380610 139228 1063327 1569002 83351
Percentage calls answered within 60 seconds (V2V) ≥ 90% 76.27% 93.97% 71.60% 92.53% 96.65% 91.00% 97.34% 69.53% 93.53% 88.07% 96.32% 85.07% 64.00%
Live calling results for customer care
Customer Care Assessment Benchmark Aircel Airtel BSNL Etisalat Idea MTS RelianceCDMA
RelianceGSM S-Tel Tata
Docomo Tata
Indicom Uninor Vodafone
Total Number of calls received 50 50 50 50 50 50 50 50 50 50 50 50 50 Total Number of calls getting connected and answered 50 50 50 50 50 50 50 50 50 50 50 50 50
Percentage calls getting connected and answered ≥ 95% 100.00% 100.00% 100.00% 100.00% 100.00% 100.00% 100.00% 100.00% 100.00% 100.00% 100.00% 100.00% 100.00%
Live calling results for customer care (Voice to Voice)
Customer Care Assessment Benchmark Aircel Airtel BSNL Etisalat Idea MTS RelianceCDMA
RelianceGSM S-Tel Tata
Docomo Tata
Indicom Uninor Vodafone
Total Number of calls received 50 50 100 50 50 50 50 50 50 50 50 50 50 Total Number of calls answered within 60 seconds 49 50 58 50 46 32 41 48 11 50 50 50 48
Percentage calls answered within 60 seconds ≥ 90% 98.00% 100.00% 58.00% 100.00% 92.00% 64.00% 82.00% 96.00% 22.00% 100.00% 100.00% 100.00% 96.00%

Quality of Service – Audit module report for Bihar & Jharkhand Circle
39
9. Termination / closure of service Audit results for termination / closure of service
Termination Benchmark Aircel Airtel BSNL Etisalat Idea MTS RelianceCDMA
RelianceGSM S-Tel Tata
Docomo Tata
Indicom Uninor Vodafone
Total number of closure request 6 90 970 0 90 NA 278 6 NA 61 133 NA 351
Number of requests attended within 7 days 6 90 970 0 90 NA 278 6 NA 61 133 NA 351
Percentage cases in which termination done within 7 days 100% 100.00% 100.00% 100.00% NA 100.00% NA 100.00% 100.00% NA 100.00% 100.00% NA 100.00%
Audit results for refund of deposits
Refund Benchmark Aircel Airtel BSNL Etisalat Idea MTS RelianceCDMA
RelianceGSM S-Tel Tata
Docomo Tata
Indicom Uninor Vodafone
Total number of cases requiring refund of deposits 0 13 59 0 33 NA 177 24 NA 45 14 NA 8
Total number of cases where refund was made within 60 days
0 13 59 0 33 NA 177 24 NA 40 14 NA 8
Percentage cases in which refund was receive within 60 days
100% NA 100.00% 100.00% NA 100.00% NA 100.00% 100.00% NA 88.89% 100.00% NA 100.00%
11. Additional Network Related parameters
Audit Results for Total Traffic Handled in Erlang
Traffic in Erlang Aircel Airtel BSNL Etisalat Idea MTS RelianceCDMA
RelianceGSM S-Tel Tata
Docomo Tata
Indicom Uninor Vodafone
Eqipped capacity of the network 201254 577583.143 262600 1331.74 114878.777 60711 262000 148000 37221 66371 200862 66700.08 156729.65
Total taffic handled in erlang during TCBH 60051 451223.34 159888 80.84 108815.6601 10288.07 94530 104938 12294 30405 47836 55598.98 133348.383
Total number of customers as per VLR
Aircel Airtel BSNL Etisalat Idea MTS RelianceCDMA
RelianceGSM S-Tel Tata
Docomo Tata
Indicom Uninor Vodafone
Total no. of customers served (as per VLR) 2216650 14809427 3584845 2773 4037099 312589 2272672 3039016 578138 1171817 1044018 1094798 4451882
*****