report and recommendations on california american …
TRANSCRIPT
Docket: Exhibit Number Commissioner Administrative Law Judge Cal Advocates Witness
: : : : :
A.19-07-004 Cal Advocates - ____ Genevieve Shiroma Gerald F. Kelly Cameron Reed
REPORT AND RECOMMENDATIONS
ON CALIFORNIA AMERICAN WATER COMPANY’S
SAFETY, WATER QUALITY, SERVICE QUALITY AND
COMPLIANCE WITH COMMISSION RULES
Application 19-07-004
PUBLIC VERSION
San Francisco, California
February 18, 2020

i
TABLE OF CONTENTS
Contents
CHAPTER 1: SAFETY ............................................................................................ 1
A. INTRODUCTION ...........................................................................................................1
B. SUMMARY OF RECOMMENDATIONS .....................................................................3
C. DISCUSSION .................................................................................................................4
1) Cal Am’s Emergency Plan Lacks Critical Information and Its Districts’ Emergency Plans Should be Updated. ...............................................4
2) The Commission Should Remove $4.225 Million in IOTG Expenses Because Cal Am’s Proposed Earthquake Insurance Policy is Unreasonable. ....................................................................................................9
3) Cal Am Should Improve its Emergency Preparedness with a Comprehensive New Portable Generator Plan. ...............................................20
D. CONCLUSION .............................................................................................................25
CHAPTER 2: WATER QUALITY ........................................................................ 27
A. INTRODUCTION .........................................................................................................27
B. SUMMARY OF RECOMMENDATIONS ...................................................................28
C. DISCUSSION ...............................................................................................................28
1) Cal Am Should Inspect its Tanks Twice Annually, Consistent with Division of Drinking Water’s Recommendations. ..........................................28
2) Cal Am Should Create Notifications and Alerts to Ensure It Does Not Miss Required Sampling and Monitoring. ......................................................29
D. CONCLUSION .............................................................................................................31
CHAPTER 3: CUSTOMER SERVICE QUALITY ............................................... 32
A. INTRODUCTION .........................................................................................................32
B. SUMMARY OF RECOMMENDATIONS ...................................................................32
C. DISCUSSION ...............................................................................................................33
1) Cal Am Should Reduce its Abandoned Call Rate and Improve the Percentage of Bills Rendered Within Seven Days of the Billing Date ...........33
2) Cal Am Has a Generally Reasonable Rate of Customer Complaints and Inquiries. ...................................................................................................36
D. CONCLUSION .............................................................................................................38

ii
CHAPTER 4: COMPLIANCE WITH DECISION 18-12-021 ............................... 39
A. INTRODUCTION .........................................................................................................39
B. DISCUSSION ...............................................................................................................39
C. CONCLUSION .............................................................................................................41

iii
MEMORANDUM
The requests and data presented by California American Water (“Cal Am”) in
Application (“A.”) A.19-07-004 were examined in order to provide the Commission with
recommendations that represent the interests of ratepayers for safe and reliable service at
lowest cost. Mukunda Dawadi is Public Advocates Office’s project lead for the
proceeding. Richard Rauschmeier is the oversight supervisor and Kerriann Sheppard and
Robyn Purchia are legal counsels.
Although every effort was made to comprehensively review, analyze and provide
the Commission with recommendations on each ratemaking and policy aspect presented
in the application, the absence from the Public Advocates Office’s testimony of any
particular issue does not necessarily constitute its endorsement or acceptance of the
underlying request, methodology, or policy position related to that issue.
1
1
CHAPTER 1: SAFETY 2
A. INTRODUCTION 3
As a public utility, California-American Water Company (Cal Am) is 4
obligated to provide safe and reliable service. As part of its review of Cal Am’s 5
General Rate Case (GRC) application, the California Public Utilities Commission 6
(Commission) should examine Cal Am’s emergency preparedness and ability to 7
operate safely. 8
Public Utilities Code (Pub. Util. Code) Section (§) 451 requires that each 9
utility furnish and maintain adequate services, equipment, and facilities to provide 10
for safe service.1 Both the United States Congress, in the Public Health Security 11
and Bioterrorism Preparedness and Response Act of 2002 (2002 Bioterrorism 12
Act), and the California Legislature, in Assembly Bill 1650 on Public Utilities: 13
emergency and disaster preparedness, recognize that planning responses for 14
emergencies and disasters are critical for ensuring public safety.2 The California 15
Legislature codified this requirement in Pub. Util. Code §768.6 directing the 16
Commission to establish standards for emergency preparedness plans (EPPs) that 17
Class A water utilities are required to follow.3 The Assigned Commissioner’s 18
Scoping Memo and Ruling (Scoping Memo) recognizes Cal Am’s obligation to 19
1
Pub. Util. Code § 451.
2 2002 Bioterrorism Act - Title IV – Drinking Water Security and Safety directed community
water systems to conduct a vulnerability assessment and prepare an emergency response plan.
3 Pub.Util. Code §768.6 (f)(1) – “A water company regulated by the commission shall develop,
adopt, and update an emergency and disaster preparedness plan in compliance with the standards
established by the commission...”
2
2
provide safe and reliable service by asking whether there are any safety issues the 1
Commission needs to address.4 2
An emergency plan outlines a written methodology for responding to 3
emergencies and contains contact information for internal and external resources. 4
The emergency plan should help assure that the company is best able to protect 5
life and infrastructure during an emergency, as well as contain the information 6
needed to ensure continuity of operations and services.5 A company needs to 7
review the information within an emergency plan to keep it relevant and useful. 8
Companies should regularly update the emergency plan to correct outdated 9
information and to account for new hazards and threats. Emergency planning also 10
includes preparations undertaken before an emergency to hardened infrastructure 11
to make it more resilient to disruption. Companies should also ensure any steps 12
taken to mitigate or prepare for disasters are reasonable, which includes periodic 13
review of older mitigating measures. Recently, the United States Congress passed 14
the America’s Water Infrastructure Act of 2018 (AWIA) which requires all 15
community water systems serving 3,300 or more customers to conduct a risk 16
assessment.6 Following the risk assessment, the AWIA directs these community 17
water systems to revise their emergency plans to incorporate and address any 18
findings from the risk assessments.7 19
The following testimony examined Cal Am’s General Rate Case (GRC) 20
Application (A.)19-07-004, responses to data requests, discussions with engineers 21
4 Scoping Memo Question 7.
5 CPUC GO-166: Purpose http://www.cpuc.ca.gov/gos/GO166/GO166_startup_page.html.
6 American Water Infrastructure Act of 2018 section 1433 (a).
7 American Water Infrastructure Act of 2018 section 1433 (b).

3
3
from the Division of Drinking Water at the California Water Resources Control 1
Board (DDW), and publicly available sources and standards to evaluate Cal Am’s 2
safety preparedness and practices. 3
B. SUMMARY OF RECOMMENDATIONS 4
The Commission should adopt the following recommendations to improve 5
Cal Am’s emergency preparedness and take reasonable steps to prepare for future 6
emergencies: 7
Cal Am should complete their missing emergency plans for scenarios 19, 8
20, 21, 22, and 23 and submit revised emergency plans to the Commission 9
within 90 days of the issuance of the decision resolving this GRC. 10
Cal Am should schedule, conduct, and keep records of emergency exercises 11
including evacuation drills and emergency operations center exercises by its 12
next GRC. 13
The Commission should reduce Cal Am’s proposed Insurance Other Than 14
Group (IOTG) Expenses budget by $4.225 million dollars (Amortized over 15
2021, 2022, and 2023) because Cal Am’s proposed earthquake insurance 16
policy is unreasonable. 17
Cal Am should create a portable generator emergency plan to distribute and 18
deploy portable generators to its service areas to maintain power during an 19
emergency including a plan for Public Safety Power Shutoffs (PSPS). 20
The Commission should make the adjustments to Cal Am’s proposed 21
generator projects outlined in the testimony of the Public Advocates 22
Office’s witness, Justin Menda to remove $2,154,079 from rate base in 23
2021 and $2,995,054 from rate base in 2022 concerning standby generator 24
improvement proposed projects in Los Angeles, Monterey, Ventura, and 25
Sacramento. 26
4
4
C. DISCUSSION 1
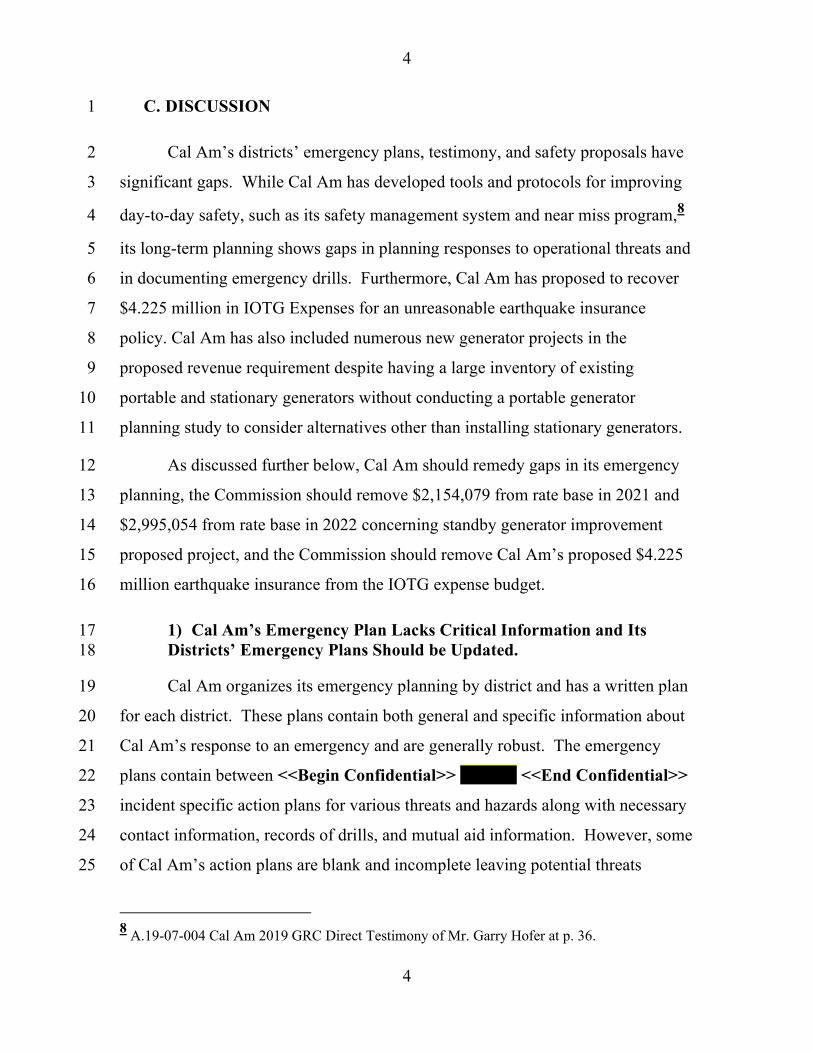
Cal Am’s districts’ emergency plans, testimony, and safety proposals have 2
significant gaps. While Cal Am has developed tools and protocols for improving 3
day-to-day safety, such as its safety management system and near miss program,8 4
its long-term planning shows gaps in planning responses to operational threats and 5
in documenting emergency drills. Furthermore, Cal Am has proposed to recover 6
$4.225 million in IOTG Expenses for an unreasonable earthquake insurance 7
policy. Cal Am has also included numerous new generator projects in the 8
proposed revenue requirement despite having a large inventory of existing 9
portable and stationary generators without conducting a portable generator 10
planning study to consider alternatives other than installing stationary generators. 11
As discussed further below, Cal Am should remedy gaps in its emergency 12
planning, the Commission should remove $2,154,079 from rate base in 2021 and 13
$2,995,054 from rate base in 2022 concerning standby generator improvement 14
proposed project, and the Commission should remove Cal Am’s proposed $4.225 15
million earthquake insurance from the IOTG expense budget. 16
1) Cal Am’s Emergency Plan Lacks Critical Information and Its 17 Districts’ Emergency Plans Should be Updated. 18
Cal Am organizes its emergency planning by district and has a written plan 19
for each district. These plans contain both general and specific information about 20
Cal Am’s response to an emergency and are generally robust. The emergency 21
plans contain between <<Begin Confidential>> <<End Confidential>> 22
incident specific action plans for various threats and hazards along with necessary 23
contact information, records of drills, and mutual aid information. However, some 24
of Cal Am’s action plans are blank and incomplete leaving potential threats 25
8 A.19-07-004 Cal Am 2019 GRC Direct Testimony of Mr. Garry Hofer at p. 36.

5
5
without plans or prepared responses. Furthermore, Cal Am generally has not 1
verified completion of emergency drills since <<Begin Confidential>> 2
<<End Confidential>>. These are significant gaps in emergency preparedness 3
that Cal Am should remedy immediately. 4
Cal Am should update and complete its emergency plan because threats 5
evolve and change annually. For example, the Department of Homeland Security 6
has phased out its color-coded terror alert levels for biannual bulletins in 2015 that 7
document how threats change such as terrorists using social media coordination 8
and the rise of homegrown terrorists.9 Furthermore, cyber attackers have 9
increasingly targeted water utilities in recent years.10 Both industrial control 10
systems and utility computer networks are vulnerable. Water utilities in other 11
states have been subject to cyber-attacks in 2018 and in 2019, including a 12
sophisticated ransomware attack that wiped out a North Carolina water utilities’ 13
computers and databases.11 The American Water Works Association (AWWA) 14
recognized cybersecurity as a top priority for the water and wastewater sectors. 15
The AWWA notes in a 2019 report on cybersecurity risk that cyberattacks are the 16
top threat facing business and critical infrastructure in the United States.12 The 17
9 The Bulletin for July 2019 can be found here:
https://www.dhs.gov/sites/default/files/ntas/alerts/19_0718_ntas-bulletin_0.pdf
10 Water Utilities are ‘The New Target of Cyber Attacks”
https://www.waterisac.org/portal/water-utilities-are-%E2%80%9C-new-target-cyber-
attacks%E2%80%9D-according-annual-cyber-threat-report
11 “Hackers force Water Utilities to Sink or Swim” E&E News
https://www.eenews.net/stories/1060131769
12 The AWWA Cybersecurity Risk and Responsibility in the Water Sector Report can be found
here:
(continued on next page)
6
6
AWWA noted that “a robust and tested cybersecurity program is critical to protect 1
public health and safety.”13 It is critical that utilities consider and plan for these 2
evolving threats each time it reviews its emergency plan. 3
Cal Am Should Update Its Districts’ Emergency Plans to 4
Complete Action Plans 19, 20, 21, 22, and 23. 5
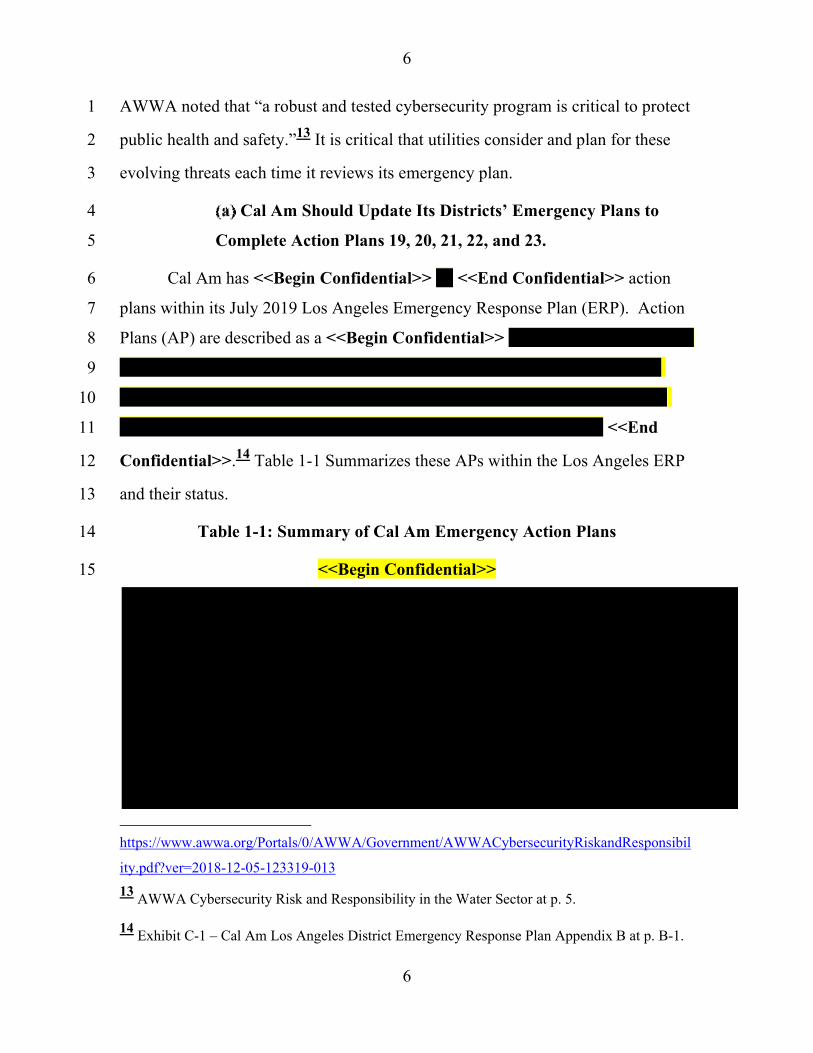
Cal Am has <<Begin Confidential>> <<End Confidential>> action 6
plans within its July 2019 Los Angeles Emergency Response Plan (ERP). Action 7
Plans (AP) are described as a <<Begin Confidential>> 8
9
10
<<End 11
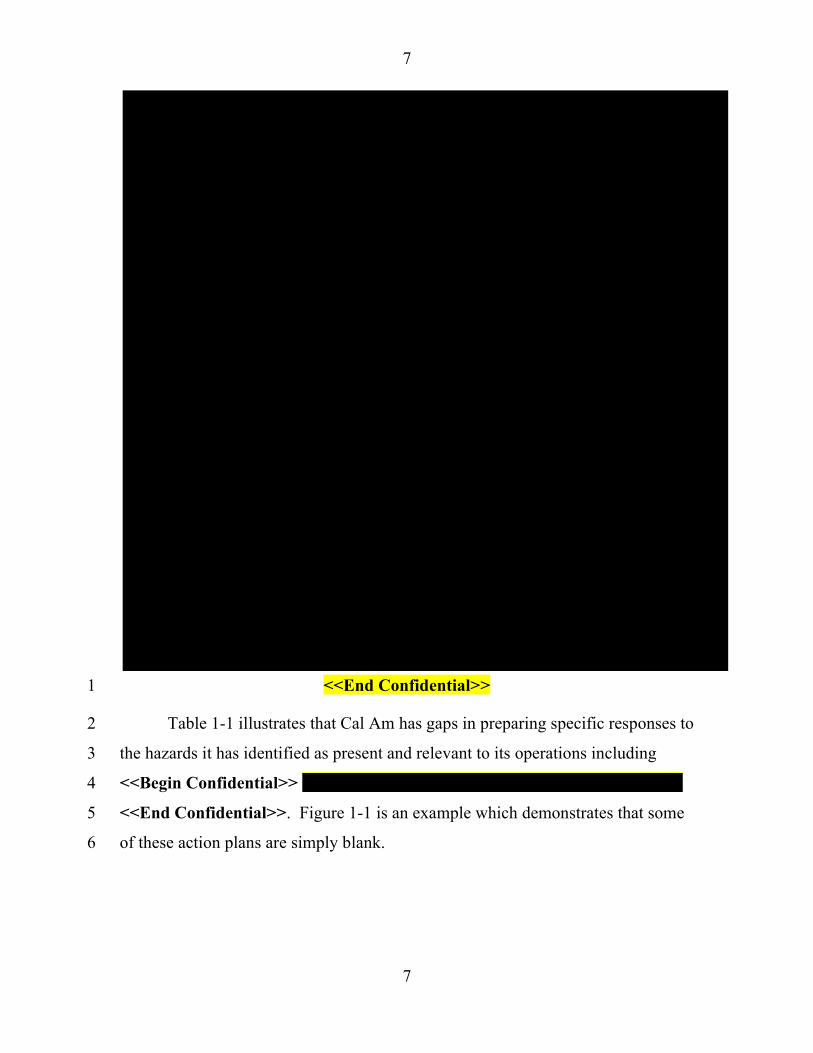
Confidential>>.14 Table 1-1 Summarizes these APs within the Los Angeles ERP 12
and their status. 13
Table 1-1: Summary of Cal Am Emergency Action Plans 14
<<Begin Confidential>> 15
https://www.awwa.org/Portals/0/AWWA/Government/AWWACybersecurityRiskandResponsibil
ity.pdf?ver=2018-12-05-123319-013
13 AWWA Cybersecurity Risk and Responsibility in the Water Sector at p. 5.
14 Exhibit C-1 – Cal Am Los Angeles District Emergency Response Plan Appendix B at p. B-1.
7
7
<<End Confidential>> 1
Table 1-1 illustrates that Cal Am has gaps in preparing specific responses to 2
the hazards it has identified as present and relevant to its operations including 3
<<Begin Confidential>> 4
<<End Confidential>>. Figure 1-1 is an example which demonstrates that some 5
of these action plans are simply blank. 6
8
8
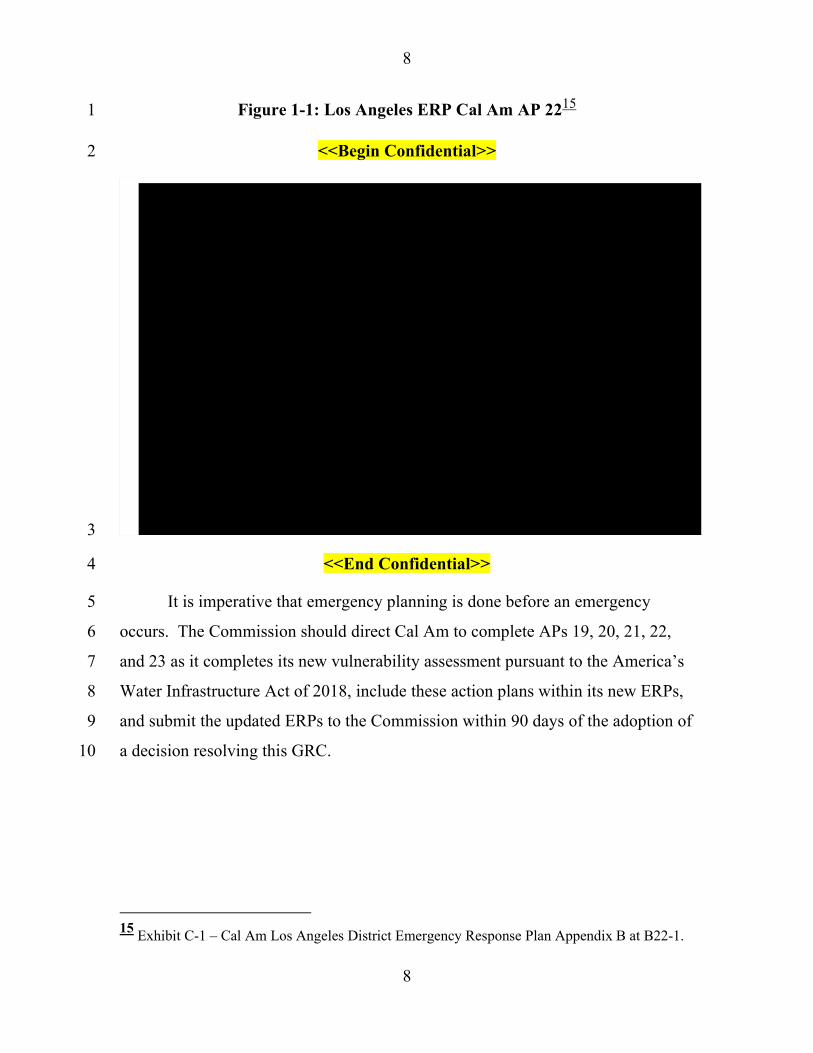
Figure 1-1: Los Angeles ERP Cal Am AP 2215 1
<<Begin Confidential>> 2
3
<<End Confidential>> 4
It is imperative that emergency planning is done before an emergency 5
occurs. The Commission should direct Cal Am to complete APs 19, 20, 21, 22, 6
and 23 as it completes its new vulnerability assessment pursuant to the America’s 7
Water Infrastructure Act of 2018, include these action plans within its new ERPs, 8
and submit the updated ERPs to the Commission within 90 days of the adoption of 9
a decision resolving this GRC. 10
15
Exhibit C-1 – Cal Am Los Angeles District Emergency Response Plan Appendix B at B22-1.
9
9
Cal Am Should Schedule and Document Annual Emergency 1
Drills. 2
Cal Am’s ERPs document emergency drills and exercises that the company 3
conducts to prepare for disasters.16 This documentation includes after action 4
reports with descriptions and notes taken during the exercise.17 Cal Am’s Los 5
Angeles ERP shows that completion of these emergency drills stopped being 6
documented in <<Begin Confidential>> <<End Confidential>>. Annual 7
drills are important as they allow Cal Am to rehearse responses to emergencies in 8
a safe environment before the occurrence of an actual emergency. This allows Cal 9
Am’s employees to become familiar with specific action plans, learn where 10
improvements are needed, and increases the effectiveness of emergency responses. 11
The Commission should direct Cal Am to resume conducting and documenting 12
annual emergency evacuations, fire drills, and emergency operations centers 13
exercises. 14
2) The Commission Should Remove $4.225 Million in IOTG Expenses 15 Because Cal Am’s Proposed Earthquake Insurance Policy is 16 Unreasonable. 17
Cal Am has requested $4.225 million in IOTG expenses, amortized over 18
three years, for an earthquake insurance policy. The insurance policy term is three 19
years. The payout for this plan scales with the size of the earthquake, and damage 20
sustained and is capped at a $50 million maximum payout.18 Cal Am generally 21
described the earthquake insurance as covering assets not located on fee simple 22
16
Exhibit C-1 – Cal Am Los Angeles District Emergency Response Plan at p. 6.
17 Exhibit C-1 – Cal Am Los Angeles District Emergency Response Plan at Appendix M.
18 A.19-07-004 Cal Am 2019 GRC Direct Testimony of Wes Owens at p. 21.
10
10
parcels or properties such as water mains.19 As discussed further below, the 1
Commission should exclude this unreasonable expense from the revenue 2
requirement. 3
Generally, insurance is contingency planning focused on mitigating 4
potential financial risk by guaranteeing compensation for loss in exchange for a 5
premium paid before a potential damaging event occurs.20 To evaluate the 6
reasonableness of such a contingency, the Commission should look at all the 7
factors that go into such contingency planning, including the hazard posed to Cal 8
Am by earthquakes, the potential for damage, the compensation guaranteed, the 9
circumstances of said compensation being awarded, and the cost of the premium. 10
The relationship between these factors dictates the extent of the financial risk to 11
Cal Am’s operation and how effective the earthquake insurance would be at 12
mitigating said financial risk. The sections below explore these factors in more 13
detail. 14
Cal Am’s Northern and Central Divisions Have Lower 15
Hazard from Significant Earthquakes. 16
The National Centers for Environmental Information (NCEI) of the 17
National Oceanic and Atmospheric Administration (NOAA) maintains a 18
Significant Earthquake Database with records on earthquakes from 2150 B.C. to 19
19
A.19-07-004 Cal Am 2019 GRC Direct Testimony of Richard Svindland at p. 16. In this
context Fee simple parcels are parcels of land that Cal Am has the title to. As such, the insurance
policy would cover infrastructure on land that Cal Am does not own.
20 Department of Homeland Security Ready.gov “Insurance is Financial Risk Mitigation” and
Investopedia “Insurance policies are used to hedge against the risk of financial losses, both big
and small, that may result from damage to the insured or [their] property.”
11
11
present day.21 The database contains information on earthquake magnitude, the 1
geographic location of the quake’s epicenter, and date. Overall, the database 2
provides a picture of where significant earthquakes happen around the world. The 3
NOAA database provides a specific view of earthquakes in California as well. 4
This data shows Cal Am’s northern and central districts face lower hazard from 5
significant earthquakes. 6
Geographic Information System (GIS) analysis of Cal Am’s service 7
territory and the database information shows the proximity of Cal Am’s water 8
systems to major earthquakes. GIS analysis results shows that aside from a 4.8 9
magnitude earthquake that occurred in 1969 four miles from Larkfield, Cal Am’s 10
northern and central divisions are not close to California’s historic, significant 11
earthquakes.22 Generally, earthquakes will cause less damage to infrastructure the 12
more distance between that infrastructure and the epicenter of an earthquake. 13
While earthquakes do not behave uniformly, the Commission can examine 14
previous earthquakes to understand the potential impact of future earthquakes. 15
21
National Geophysical Data Center / World Data Service (NGDC/WDS): Significant
Earthquake Database. National Geophysical Data Center, NOAA.
https://www.ngdc.noaa.gov/nndc/struts/form?t=101650&s=1&d=1 last visited 2/3/20. A
significant earthquake is defined as either: Causing $1 million or more in approximate damage,
causing 10 or more deaths, having a magnitude of 7.5 or greater, a Modified Mercalli Intensity of
X or greater, or causing a tsunami. Exhibit C-21 includes a table summarizing California’s
historic significant earthquakes with a recorded magnitude.
22 Attachment 1 provides the Public Advocates Office’s rendered maps of Cal Am’s service
territory and the Earthquake Database.
12
12
As an example, the 2019 Ridgecrest earthquake which occurred on a fault 1
line approximately 11 miles into the desert outside of Ridgecrest.23 Another 2
example is the 1994 Northridge earthquake in Los Angeles which exhibited very 3
strong shaking according to the Modified Mercalli Intensity (MMI) scale capable 4
of causing moderate damage up to 12.5 miles from the epicenter.24 These 5
earthquakes serve as reference points to examine the financial risk posed to Cal 6
Am’s water systems by historic, significant earthquakes. Generally, Cal Am’s 7
northern water systems are separated from the epicenters of recorded significant 8
earthquakes by more than 11 miles. GIS analysis shows that none of the 9
significant earthquakes within 25 miles of Cal Am’s northern or central division 10
systems have been at or above a 6.5 magnitude. This means Cal Am’s northern 11
California service areas are outside of the areas where the two example 12
earthquakes would cause significant damage. While earthquakes are not 13
uniformly consistent across the state and damage from earthquakes can vary based 14
on many factors such as ground conditions and fault type, the lower magnitude 15
and larger distances of historic earthquakes relative to Cal Am’s northern and 16
central districts illustrates Cal Am’s hazard from significant earthquakes is lower 17
than in its southern California districts. 18
Similarly, GIS analysis can approximate the significant earthquake hazard 19
in Cal Am’s southern California districts. The data shows that Cal Am’s southern 20
23
Eleven miles is picked as a representative distance based on the damage done by the recent 7.1
magnitude Ridgecrest earthquake which had an epicenter approximately 11 miles into the desert.
The 7.1 earthquake was preceded by a 6.4 magnitude earthquake with a similar epicenter which
did significantly less damage: https://www.cnbc.com/2019/07/06/powerful-southern-california-
quake-second-in-two-days-causes-damage-injuries.html.
24 See Figure 1-4 below which can also be found here: CISN ShakeMap for Northridge can be
found here at: https://www.cisn.org/shakemap/sc/shake/Northridge/intensity.html
13
13
districts and water systems are closer to areas where significant earthquakes have 1
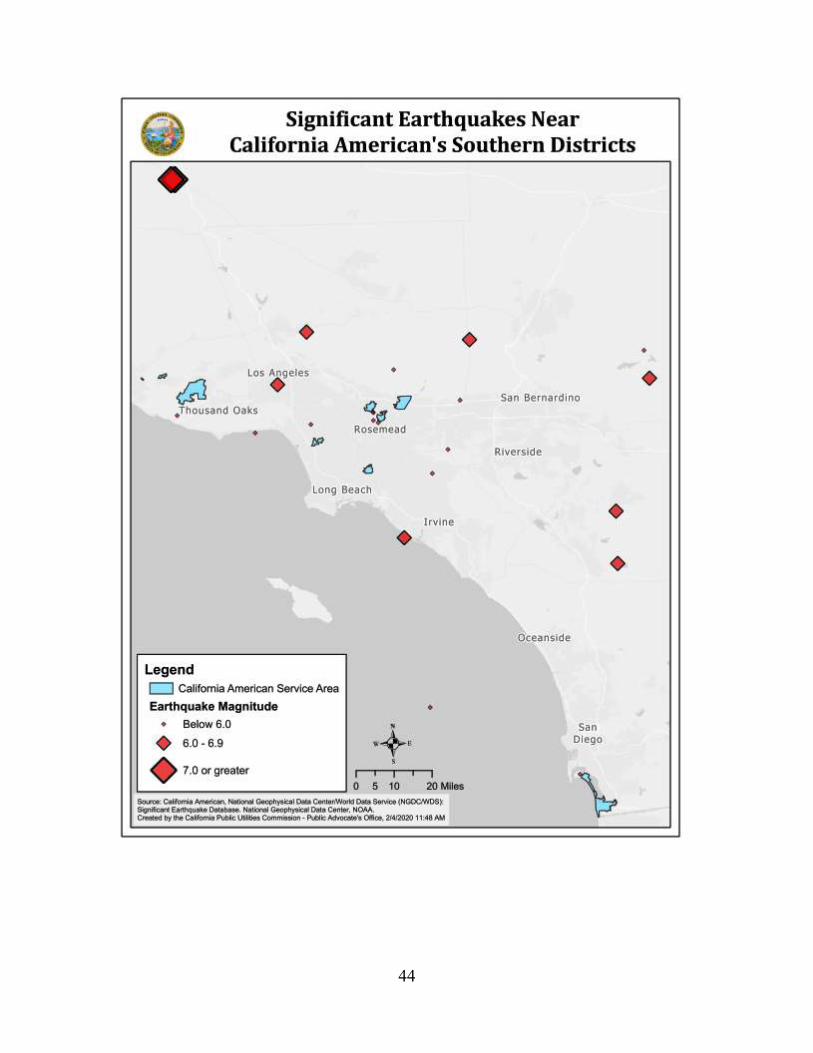
occurred in the past than in the northern and central divisions. Figure 1-2 2
illustrates the significant earthquakes near Cal Am’s southern California service 3
territory. 4
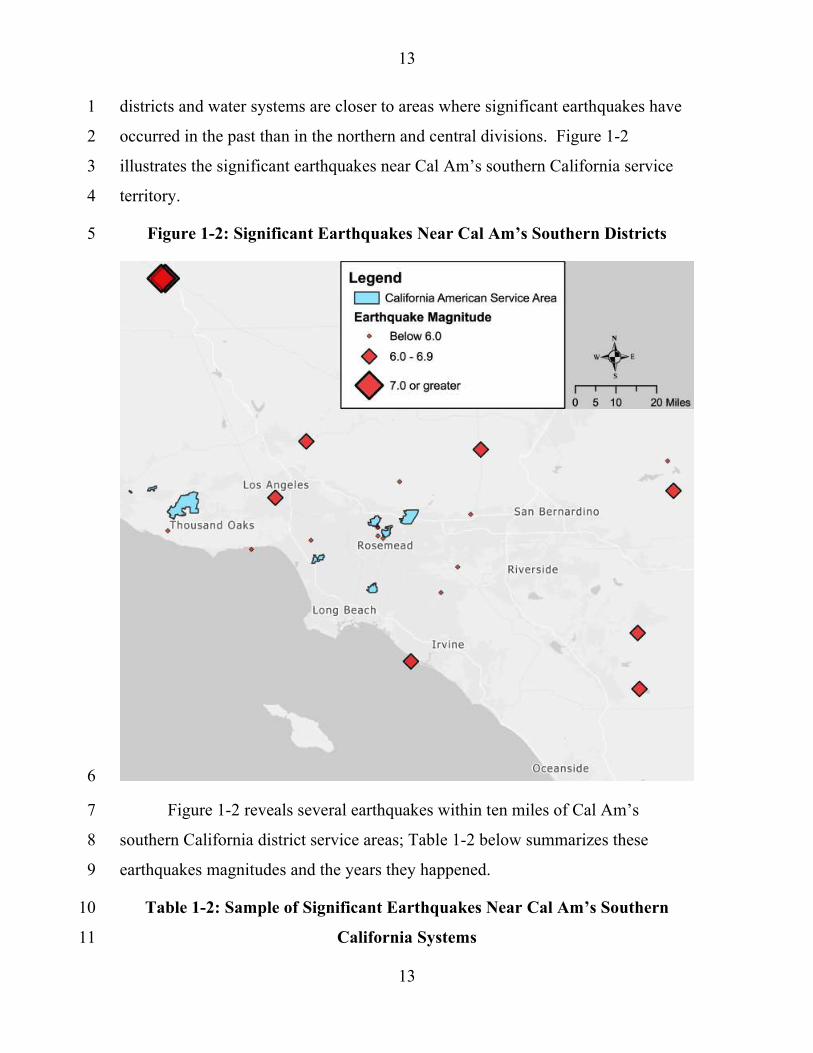
Figure 1-2: Significant Earthquakes Near Cal Am’s Southern Districts 5
6
Figure 1-2 reveals several earthquakes within ten miles of Cal Am’s 7
southern California district service areas; Table 1-2 below summarizes these 8
earthquakes magnitudes and the years they happened. 9
Table 1-2: Sample of Significant Earthquakes Near Cal Am’s Southern 10
California Systems 11
14
14
Year of
Earthquake
Magnitude Systems Nearby Approximate Distance
Epicenter to Centroid
(Miles)
1855 6.0 San Marino 1.6
1885 6.0 Duarte 8.22
1987 5.7 San Marino 1.6
1987 5.7 Bellflower 12.64
1973 5.7 Thousand Oaks 8.82
1862 5.9 Coronado 10.11
1994 6.7 Baldwin Hills,
Thousand Oaks,
San Marino
18.5
1
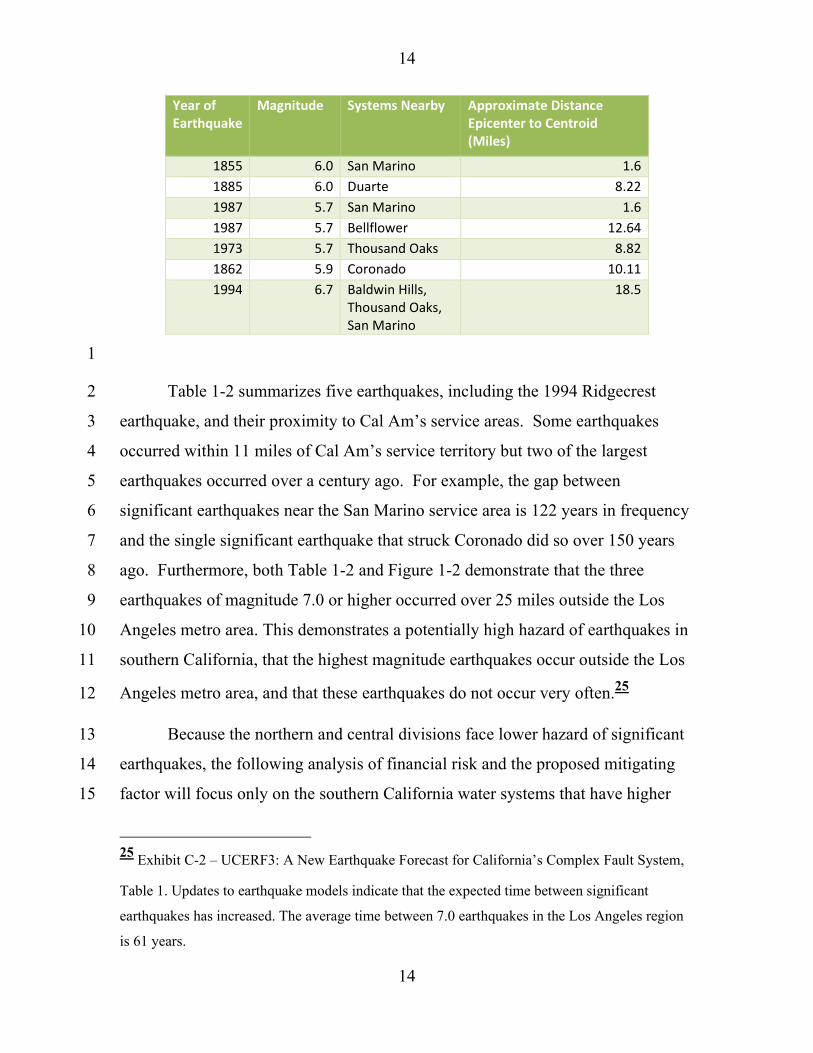
Table 1-2 summarizes five earthquakes, including the 1994 Ridgecrest 2
earthquake, and their proximity to Cal Am’s service areas. Some earthquakes 3
occurred within 11 miles of Cal Am’s service territory but two of the largest 4
earthquakes occurred over a century ago. For example, the gap between 5
significant earthquakes near the San Marino service area is 122 years in frequency 6
and the single significant earthquake that struck Coronado did so over 150 years 7
ago. Furthermore, both Table 1-2 and Figure 1-2 demonstrate that the three 8
earthquakes of magnitude 7.0 or higher occurred over 25 miles outside the Los 9
Angeles metro area. This demonstrates a potentially high hazard of earthquakes in 10
southern California, that the highest magnitude earthquakes occur outside the Los 11
Angeles metro area, and that these earthquakes do not occur very often.25 12
Because the northern and central divisions face lower hazard of significant 13
earthquakes, the following analysis of financial risk and the proposed mitigating 14
factor will focus only on the southern California water systems that have higher 15
25
Exhibit C-2 – UCERF3: A New Earthquake Forecast for California’s Complex Fault System,
Table 1. Updates to earthquake models indicate that the expected time between significant
earthquakes has increased. The average time between 7.0 earthquakes in the Los Angeles region
is 61 years.
15
15
earthquake hazards: Thousand Oaks, San Marino, Duarte, Baldwin Hills, 1
Bellflower, and Coronado. 2
Cal Am’s Proposed Insurance Policy Would Not Cover Most 3
Earthquakes Making the Policy Ineffective and Unreasonable. 4
The NOAA database confirms that Cal Am’s southern California service 5
areas are close to more significant earthquakes than Cal Am’s other service 6
territories; however, that alone does not make the proposed insurance policy 7
reasonable. While the potential for damage exists along with clear hazard, the 8
policy pay-out and triggering conditions will not lead to worthwhile compensation 9
in any significant earthquake consistent with history. 10
Although Cal Am said it has yet to select an insurance plan, it requested 11
recovery of $4.225 million in customer rates over three years. Under this plan, Cal 12
Am’s ratepayers would pay roughly $1.4 million each year for the amortized 13
policy premiums. This requested value closely matches with the 3-year premium 14
for <<Begin Confidential>> 15
16
. <<End Confidential>>26
This insurance plan would pay out <<Begin 17
Confidential>> 18
19
<<End Confidential>> Taking the policy into account, 20
Figure 1-3 shows the significant earthquakes in the past that would have been 21
eligible for compensation. 22
23
26
Exhibit C-3 – Cal Am Response to Public Advocates Office Data Request YCC 04 Q006.a
Attachment 1 Confidential
16
16
Figure 1-3: Los Angeles Area Earthquakes That Qualify for Coverage Based 1
on Magnitude 2
<<Begin Confidential>> 3
4
<<End Confidential>> 5
As demonstrated, the proposed policy is very limiting. Figure 1-3 shows 6
that <<Begin Confidential>> 7
<<End Confidential>> only 8
the 1994 Northridge earthquake and a 1971 San Fernando earthquake are close 9
enough to Cal Am’s territory to potentially cause damage that qualifies for 10
compensation. Compensation is awarded only if the earthquake inflicts <<Begin 11
17
17
Confidential>> 1
<<End Confidential>> At 2
6.7 magnitude, an earthquake on par with the Northridge earthquake would pay 3
out <<Begin Confidential>> <<End 4
Confidential>> assuming it damages Cal Am’s infrastructure at all. 5
This is further compounded by the distance between Cal Am’s water 6
systems and the two largest Los Angeles earthquakes. Figure 1-4 is a California 7
Integrated Seismic Network (CISN) ShakeMap that illustrates why this distance is 8
important. 9
10
18
18
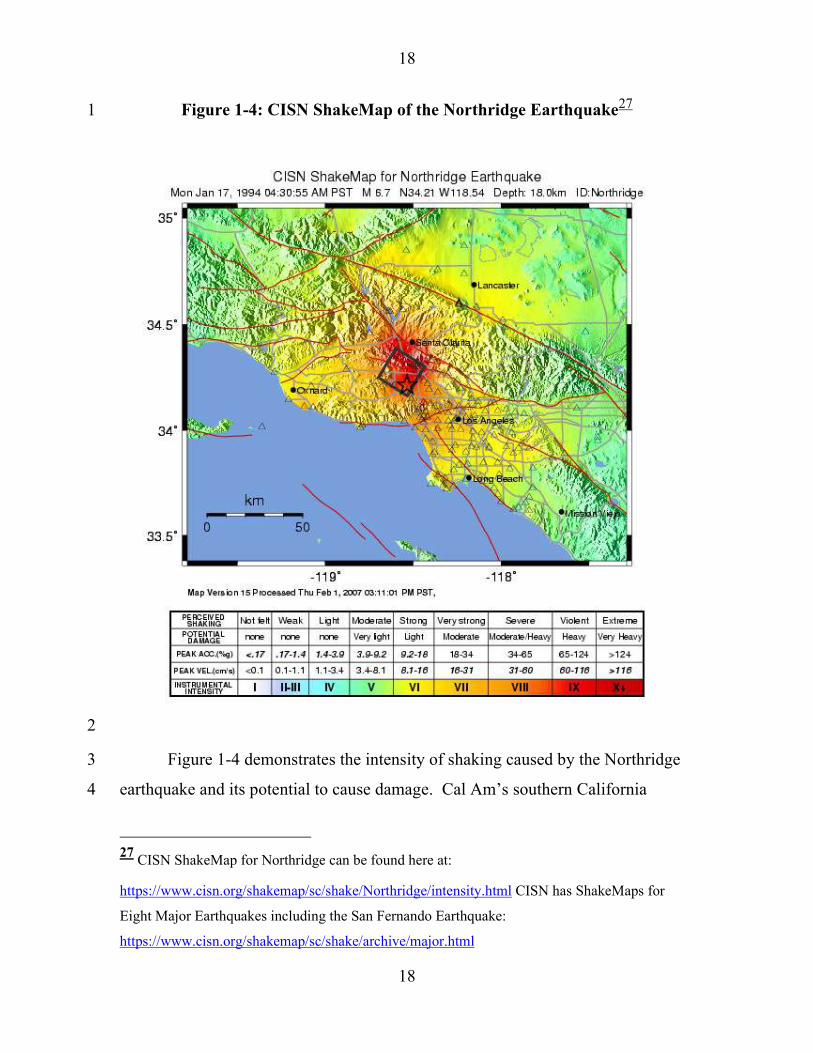
Figure 1-4: CISN ShakeMap of the Northridge Earthquake27 1
2
Figure 1-4 demonstrates the intensity of shaking caused by the Northridge 3
earthquake and its potential to cause damage. Cal Am’s southern California 4
27
CISN ShakeMap for Northridge can be found here at:
https://www.cisn.org/shakemap/sc/shake/Northridge/intensity.html CISN has ShakeMaps for
Eight Major Earthquakes including the San Fernando Earthquake:
https://www.cisn.org/shakemap/sc/shake/archive/major.html
19
19
service territory is over 15 miles from the epicenter of the 1994 earthquake and 1
generally experienced between a VI (6) on the Modified Mercalli Index where the 2
potential for damage is light to moderate. Based on historic data, it’s possible that 3
even if an earthquake occurred, the <<Begin Confidential>> 4
<<End Confidential>> would not trigger and Cal 5
Am would not receive an insurance payout. This scenario would leave ratepayers 6
potentially paying for both the disaster recovery and for the insurance premium. 7
<<Begin Confidential>> 8
<<End Confidential>>28
described above is one of 9
<<Begin Confidential>> <<End Confidential>> earthquake insurance 10
quotes that Cal Am attained as a gauge of market indications. The <<Begin 11
Confidential>> 12
<<End Confidential>> for earthquake insurance that 13
Cal Am received quotes for. The other options are <<Begin Confidential>> 14
<<End Confidential>> and have more onerous 15
terms and conditions on the policy such as a <<Begin Confidential>> 16
17
<<End Confidential>>.29 When considering the lower 18
financial risk significant earthquakes pose to Cal Am’s infrastructure and the cost 19
of quoted insurance premiums to ratepayers, none of the quoted insurance plans 20
provide a reasonable level of financial risk mitigation. 21
In summary, Cal Am’s proposed earthquake insurance policy is 22
unreasonable because its northern and central divisions do not face high financial 23
28
Exhibit C-3 – Cal Am Response to Public Advocates Office Data Request YCC 04 Q006.a
Attachment 1 Confidential
29 Exhibit C-3 – Cal Am Response to Public Advocates Office Data Request YCC 04 Q006.a
Attachment 1 Confidential

20
20
risk from significant earthquakes and the policy will not adequately mitigate the 1
financial risks significant earthquakes present in Cal Am’s southern California 2
districts. Furthermore, based on the insurance policy pay-out structure Cal Am’s 3
ratepayers would pay more in premiums than the policy would likely cover in 4
<<Begin Confidential>> <<End Confidential>>. For these reasons, the 5
Commission should not provide advanced ratepayer funding of Cal Am’s 6
proposed $4.225 million in IOTG expenses (amortized over three years). 7
3) Cal Am Should Improve its Emergency Preparedness with a 8 Comprehensive New Portable Generator Plan. 9
Cal Am has proposed several standby generator improvement programs for 10
its California districts.30 Cal Am states that it was important to transition to a 11
permanent stand-by generator program and claimed that the only alternative to 12
installing a plethora of fixed stand-by generators is to do nothing.31 Cal Am uses 13
this reasoning to justify roughly $10 million in proposed generator projects from 14
2019 through 2026.32 15
However, installing numerous back-up generators or doing nothing are not 16
the only two options available. For example, Cal Am should reevaluate its 17
approach to portable generators and how it can plan for PSPS events by 18
distributing its portable generators more evenly among its Los Angeles service 19
areas as opposed to centrally in the Rosemead operations center. Additionally, Cal 20
30
For Example, see the Los Angeles project in the A.19-07-004 Cal Am 2019 GRC Direct
Testimony of Ian Crooks at p. 176.
31 Exhibit C-5 – Cal Am Engineering Workbook Tab 028.
32 A.19-07-004 Cal Am 2019 GRC Results of Operation Model Chapter 07 Plant Forecast at Tab
“Y_CAPEX OTH By Project WS-2” under CAW Capital Expenditures Other Direct Costs for
2019-2022 for the stand-by generator improvement projects. Snapshot attached as Exhibit C-22.
21
21
Am already has a large inventory of existing fixed and portable generators that 1
protect against power outages. Accordingly, the Commission should adjust Cal 2
Am’s proposed capital projects budget as described in the testimony of Justin 3
Menda and referenced below. 4
Cal Am has an existing inventory of at least <<Begin Confidential>> 5
6
7
<<End Confidential>>33 Table 1-3 summarizes 8
Cal Am’s emergency generator inventory. 9
Table 1-3: Cal Am’s Emergency Generator Inventory 10
<<Begin Confidential>> 11
<<End Confidential>> 12
Table 1-3 shows that Cal Am has an existing inventory of portable and 13
fixed generators. Table 1-3 also shows that these generators are distributed 14
throughout Cal Am’s districts with a significant number of generators in the 15
Central and Northern districts, <<Begin Confidential>> 16
33
Exhibit C-4 – Cal Am Generator Inventory
22
22
<<End Confidential>>.34 Cal Am’s portable generators in Southern 1
California are mostly concentrated at either the <<Begin Confidential>> 2
3
4
<<End Confidential>>.35 These generators provide protection for 5
Cal Am’s operations in the event of commercial power outages. Generally, Cal 6
Am has installed generators for back-up power at its treatment plants, pump 7
stations, and wells.36 However, the recent PSPS events are not typical 8
commercial power outages. PSPS events are noticed proactive shutoffs that 9
should be addressed differently than standard contingency planning for 10
commercial power outages. 11
Typically, PSPS events are preceded by 24 to 48 hours of notice by the 12
power company.37 This allows one to two working days to deploy portable 13
generators to affected areas to keep systems operational during the power shutoffs. 14
A PSPS action plan would augment Cal Am’s readiness by identifying which sites 15
within a district need portable generators in the event of a PSPS. Furthermore, 16
working with local electric utilities to receive priority notifications would further 17
increase the amount of time available to acquire and deploy portable generators. 18
In addition, not all of Cal Am’s service areas face potential PSPS events. 19
For example, some are served by the Sacramento Municipal Utilities District, 20
34
Exhibit C-4 – Cal Am Generator Inventory
35 Exhibit C-4 – Cal Am Generator Inventory
36 Attachment 2 uses GIS analysis to show where Cal Am has distributed its emergency
generators in relation to its districts.
37 Decision 19-05-042 at p. 87. The Commission also adopted a 48 to 72 hour advanced notice
for priority notification entities.
23
23
which is not part of the PSPS program. Therefore, additional generators are not 1
needed for all of Cal Am’s service areas. PSPS events are dynamic and in 2
response to environmental conditions such as wind speeds, dry vegetation, and 3
low humidity.38 As such, portable generators are more flexible in allowing Cal 4
Am to respond to these events. Cal Am can look at what areas were affected or 5
threatened by PSPS events in 2019 to evaluate the need for portable generators. 6
Larkfield was affected by a PSPS event in October 25, 2019. As such, Larkfield is 7
a service area where additional portable generators are reasonable.39 8
Cal Am’s proposed plan to deploy dozens of new fixed generators across its 9
various districts outlined below is unreasonable. As Table 1-3 shows, Cal Am has 10
a large existing inventory of fixed and portable generators it can use to respond to 11
PSPS events and commercial power outages. Furthermore, Portable generators 12
provide flexibility in responding to PSPS events over fixed generators. This is 13
because PSPS events do not have defined footprints that can change even between 14
PSPS events in the same service areas. A fixed generator located at a facility that 15
is outside a PSPS area within a district is not useful in responding to a PSPS event 16
elsewhere. But a portable generator at that facility that can be moved to an 17
affected facility allows that generator to be useful during most potential PSPS 18
situations. Likewise, Cal Am’s proposed funding would construct fixed 19
generators in service areas with infrequent or no recorded PSPS events, such as the 20
Los Angeles County District,40 Ventura District,41 Sacramento District,42 and the 21
38
D.19-05-042 Finding of Fact 31 at p. 119.
39 Exhibit C-9 – PG&E report for October 23-25 PSPS events at p. AppA-5.
40 Exhibit C-5 – Cal Am Engineer Workbook Tab 028.
41 Exhibit C-6 – Cal Am Engineer Workbook Tab 128.
42 Exhibit C-7 – Cal Am Engineer Workbook Tab 092.
24
24
Monterey District.43 Stationary generators installed at areas not experiencing 1
power outages are not useful and cannot be repositioned to keep other 2
infrastructure experiencing power outages active. Portable generators have other 3
advantages, such as allowing Cal Am to maintain and test them in one location in 4
a district. This would help Cal Am avoid performing required testing and 5
maintenance of generators in potentially sensitive areas (i.e. near schools or 6
residential areas). As such, Cal Am should focus on performing a back-up 7
generator and PSPS study and creating an action plan as a compliment to the risk 8
assessment required by the AWIA. 9
Creating a back-up generator and PSPS action plan will allow Cal Am to 10
examine crucial information, such as which of their service areas are affected 11
regularly by PSPS events.44 This information is very important to understand the 12
risk of power shutoffs in the future and identify which areas may need fixed on-13
site generation, which areas Cal Am can deploy portable generators, and where 14
Cal Am can store portable generators for expedited deployment. The study should 15
also examine which areas do not have connections for back-up generators and 16
whether Cal Am needs to install transfer switches to facilitate the portable 17
generator coverage plan.45 A PSPS action plan and portable generator plan will 18
allow Cal Am to leverage its existing capital investment in portable generators. 19
43
Exhibit C-8 – Cal Am Engineer Workbook Tab 069.
44 Areas such as the Larkfield service territory. The Larkfield service area has been subject to at
least two PSPS events in Fall of 2019. As described in the testimony of Justin Menda, the
Commission should include $482,083 in rate base for 2021 and $534,558 in rate base for 2022 for
new generator projects in Sacramento, Larkfield, and Monterey.
45 Exhibit C-10 – January 13, 2020 Duarte Sanitary Survey at p. 3. DDW recommended that Cal
Am update its Emergency Response Plan to explore how to respond to a power outage that affects
all three Los Angeles water systems simultaneously.
25
25
As such, the Commission should direct Cal Am to conduct a study to 1
evaluate where it needs to store portable generators and what facilities need 2
transfer switches to mitigate a PSPS event affecting any of Cal Am’s water 3
systems. As this is a study of Cal Am’s current readiness for and vulnerability to 4
PSPS events, Cal Am should be able to complete this study with internal resources 5
as a component of the risk and vulnerability assessment required under AWIA 6
section 1433. Furthermore, the Commission should accordingly adjust Cal Am’s 7
capital budget as described in the testimony of Justin Menda to remove $2,154,079 8
from rate base in 2021 and $2,995,054 from rate base in 2022 in standby generator 9
improvement proposed projects in Los Angeles, Monterey, Ventura, and 10
Sacramento. The Commission should include Cal Am’s recommended $482,083 11
in 2021 and $534,558 in 2022 for capital budget to install standby generators in its 12
Larkfield service area. 13
D. CONCLUSION 14
Cal Am’s emergency preparedness is generally robust, but there are 15
significant gaps in Cal Am’s planning responses to operational threats and in 16
documenting emergency drills. The Commission should direct Cal Am to close 17
these gaps by completing its APs numbered 19-23, scheduling and documenting 18
emergency drills, and conduct an emergency back-up power study to redistribute 19
its portable generators and plan for a PSPS event. The Commission should 20
remove $4.225 million in IOTG expenses for earthquake insurance from the 21
proposed revenue requirement as the insurance is unreasonable because it does not 22
mitigate Cal Am’s financial risk from significant earthquakes. 23
Furthermore, the Commission should adjust Cal Am’s capital budget as 24
described in the testimony of Justin Menda to remove $2,154,079 from rate base 25
in 2021 and $2,995,054 from rate base in 2022 in standby generator improvement 26
proposed projects in Los Angeles, Monterey, Ventura, and Sacramento. Should 27

26
26
Cal Am need more generators in 2021 or 2022, Cal Am can purchase generators as 1
capital investments and the Commission can review the prudency of 2
reasonableness of those capital assets’ inclusion in rate base during Cal Am’s next 3
GRC.4
27
CHAPTER 2: WATER QUALITY 1
A. INTRODUCTION 2
As a public utility, Cal Am is required to deliver safe, high quality water to 3
its customers.46 Water quality is especially important to maintain public health 4
and public safety.47 To this end, the Commission should continue to review Cal 5
Am’s water quality reporting to ensure it is operating safely. 6
Water Quality requirements mean that utility-provided water should not be 7
harmful or dangerous to human health and as free from odors, taste, color, and 8
turbidity as practicable. Water utilities must provide water that does not exceed 9
maximum contaminant levels (MCLs) established by federal agencies, such as the 10
Environmental Protection Agency (EPA), and state authorities such as the 11
Division of Drinking Water (DDW) of the California State Water Resources 12
Control Board (SWRCB).48 13
MCLs covering substances that are health risks such as nitrates, lead, 14
uranium, and benzene are referred to as Primary MCLs.49 MCLs covering 15
aesthetic qualities such as taste, odor, and turbidity are referred to as secondary 16
maximum contaminant levels (SMCLs). Cal Am provides information on its 17
46
Pub. Util. Code § 451 and GO 103-A Section II. 2. A.
47 A.19-07-004 Cal Am 2019 GRC Direct Testimony of Mr. Garry Hofer, at p. 16:21-22.
48 MCLs refer to the maximum amount of a given contaminant what can be present in water.
Usually expressed in milligrams per liter or one part per million (ppm) or part per billion (ppb).
49 See California Code of Regulations Title 22 Division 4 Chapter 15 Article 4 and
https://www.waterboards.ca.gov/drinking_water/certlic/drinkingwater/Chemicalcontaminants.htm
l
28
MCL samples to customers through its Consumer Confidence Reports (CCR). In 1
preparing this testimony, the Public Advocates Office reviewed Cal Am’s CCRs, 2
direct testimony, responses to data requests, conversations with DDW engineers, 3
and the sanitary surveys from DDW. 4
B. SUMMARY OF RECOMMENDATIONS 5
The Commission should adopt the following recommendations to improve 6
Cal Am’s water quality monitoring: 7
Cal Am should inspect its tanks twice a year. If drone inspection 8
finds signs of corrosion or damage that would allow animal entry, 9
Cal Am should inspect the interior of the tank. 10
Cal Am should implement reasonable steps, such as email alerts or 11
notifications, to avoid missing required water sampling and 12
monitoring in the future. 13
C. DISCUSSION 14
1) Cal Am Should Inspect its Tanks Twice Annually, Consistent with 15 Division of Drinking Water’s Recommendations. 16
On June 29, 2018 engineers from DDW discovered a dead rodent inside the 17
Crest Reservoir in the Monterey District. Part of the reservoir’s hatch was 18
corroded, and the tank vent’s screens had large gaps that allowed small animal 19
ingress to the tank.50 Subsequently, DDW issued a compliance order for Cal Am 20
to inspect all finished water storage tanks on a semi-annual basis. 21
To comply with this order, Cal Am is proposing to perform one inspection 22
by unmanned aerial drone and another inspection using contractors with 23
50
A.19-07-004 Cal Am 2019 GRC – MDR II.G.5 at p. 24.
29
specialized fall protection equipment.51 Cal Am estimated an annual cost of 1
$72,000 to inspect approximately 55 tanks that lack adequate fall protection. The 2
Commission should approve this request. Furthermore, Cal Am should have the 3
drone inspection teams evaluate the condition of vent screens and tank hatches. 4
To protect public safety and health, the Commission should direct Cal Am to 5
inspect the interior of a tank if the drone inspection reveals significant corrosion or 6
large gaps in vent screens or hatches to ensure no small animals have gotten inside 7
the tank. 8
2) Cal Am Should Create Notifications and Alerts to Ensure It Does 9 Not Miss Required Sampling and Monitoring. 10
Generally, Cal Am has not exceeded or violated MCL standards for most 11
water systems since its last GRC.52 Some wells have high concentrations of 12
contaminants that are handled in treatment, such as raw arsenic at Well 01A in 13
Larkfield53 or the Arlington Well 2 that has triggered enhanced monitoring due to 14
high nitrate levels.54 The Sacramento district has several wells that are either 15
inactive or on standby for exceeding MCLs for nitrates, tetrachloroethylene, or 16
arsenic, and some wells occasionally have results exceeding MCLs that may need 17
to be placed on stand-by.55 18
51
A.19-07-004 Cal Am 2019 GRC – MDR II.G.10 at p. 2.
52 A.19-07-004 Cal Am 2019 GRC – MDR II.G.1.
53 A.19-07-004 Cal Am 2019 GRC – MDR II.G.6 at p. 31.
54 A.19-07-004 Cal Am 2019 GRC – MDR II.G.6 at p. 53.
55 A.19-07-004 Cal Am 2019 GRC – MDR II.G.1 at p. 2 and MDR II.G.6 at pp. 338, 404, 661.
“Standby” wells are wells that have been taken offline (made inactive) but are expected to return
to service at some point.
30
While Cal Am reports it has not violated any MCLs, there are some 1
inconsistencies in the company’s CCRs. For example, the 2017 CCR for Baldwin 2
Hills indicated that the SMCL for aluminum is 1 part per million (ppm) and that 3
the average amount detected from Weymouth was 170 ppm.56 The Public 4
Advocates Office previously highlighted anomalies regarding the aluminum MCL 5
and SMCL during Cal Am’s last GRC.57 This inconsistency has persisted since 6
reports from 2015.58 Cal Am has an obligation to operate its systems safely and 7
report information to its customers and the Commission clearly and correctly. 8
Furthermore, while Cal Am is generally complying with MCL standards 9
DDW issued several citations in 2018 because Cal Am missed required 10
monitoring standards. Cal Am missed samples for 1,2,3 trichloropropane in 2018 11
for San Marino,59 bacteriological samples in May 2017 for Garrapata,60 and failed 12
to collect upstream and downstream samples in Ventura in 2019 when a total 13
coliform sample tested positive.61 Cal Am should implement steps to ensure that 14
56
A.19-07-004 Cal Am 2019 GRC – MDR II.G.4 at p. 85.
57 See The Report and Recommendations on Rate Consolidation and General Aspects of Safety,
Reliability, and Customer Service in Application 16-07-002 sponsored by witness Richard
Rauschmeier at p. 19. “In reviewing the annual CCR for each water system, ORA noticed
anomalies in the reported primary and secondary detection level MCL amounts for Aluminum.”
58 A.19-07-004 Cal Am 2019 GRC – MDR II.G.4 at p. 186 for Thousand Oaks and p. 136 for
San Marino.
59 A.19-07-004 Cal Am 2019 GRC – MDR II.G.5 at p. 1.
60 A.19-07-004 Cal Am 2019 GRC – MDR II.G.5 at p. 10.
61 A.19-07-004 Cal Am 2019 GRC – MDR II.G.2 at p. 2.

31
sampling and monitoring standards are not missed in the future such as email 1
notifications or alerts. 2
Cal Am’s should incorporate these alerts and notifications for its water 3
quality monitoring into its proposed sampling and monitoring system (SAMS) 4
program.62 SAMS can send email and text notifications to Cal Am’s water quality 5
teams but does not have notifications for all monitoring requirements.63 Cal Am 6
should finish implementing notifications for all of its monitoring requirements for 7
all of its service areas to ensure it does not miss future sampling and monitoring. 8
Because Cal Am’s proposed SAMS program will implement a system to notify 9
Cal Am of upcoming water sampling, the Public Advocates Office does not 10
oppose Cal Am’s proposal for three SAMS modules of $131,500 in 2021, $99,000 11
in 2022, and $77,500 in 2023.64 12
D. CONCLUSION 13
Cal Am has a duty and obligation to ensure it is operating its water system 14
safely and reliably and deliver high quality water. Part of that duty and obligation 15
is to ensure water samples are taken when required, ensure tanks are regularly 16
inspected, and that customers and the Commission receive accurate information. 17
As such, the Commission should direct Cal Am to create notifications for 18
sampling and monitoring schedules and to inspect the interior of tanks when drone 19
inspections discover signs of corrosion or damage that would allow animal entry.20
62
A.19-07-004 Cal Am 2019 GRC Direct Testimony of Mr. Garry Hofer at p. 21:4-17.
63 Exhibit C-14 - Cal Am Response to Public Advocates Office Data Request CR5-04 Question
2.b.
64 A.19-07-004 Cal Am 2019 GRC Direct Testimony of Mr. Garry Hofer at p. 21:24-25.

32
1
CHAPTER 3: CUSTOMER SERVICE QUALITY 2
A. INTRODUCTION 3
General Order (GO) 103-A adopted reporting requirements and standards 4
for six customer service quality metrics including: (1) Telephone Performance 5
Standards, (2) Billing Performance Standards, (3) Meter Reading Performance 6
Standard, (4) Work Completion Performance Standards, (5) Response to Customer 7
and Regulatory Complaints Performance Standard, and (6) Service 8
Interruptions.65 Class A and B utilities must report on their compliance with these 9
standards in their annual report.66 The Commission should hold Cal Am 10
accountable to these standards, ensuring customers are receiving high quality 11
customer service. The following sections analyze Cal Am’s customer service 12
performance from 2014 through 2018 looking to GO 103-A standards, Consumer 13
Affairs Branch (CAB) complaints, customer inquiries to Cal Am, and service 14
interruptions. 15
B. SUMMARY OF RECOMMENDATIONS 16
To improve Cal Am’s customer service quality and comply with GO 103-A 17
standards, the Commission should adopt the following recommendations: 18
Cal Am should reduce its abandoned call rate below the 5% standard 19
established in GO 103-A. 20
65
General Order 103-A Appendix E
66 Class A and B Water Utilities do not report on Service Interruptions annually but must retain a
complete record of interruptions.
33
Cal Am should increase its percentage of bills rendered in seven 1
days to be consistently above 99% and meet the standard established 2
in GO 103-A. 3
C. DISCUSSION 4
1) Cal Am Should Reduce its Abandoned Call Rate and Improve the 5 Percentage of Bills Rendered Within Seven Days of the Billing Date 6
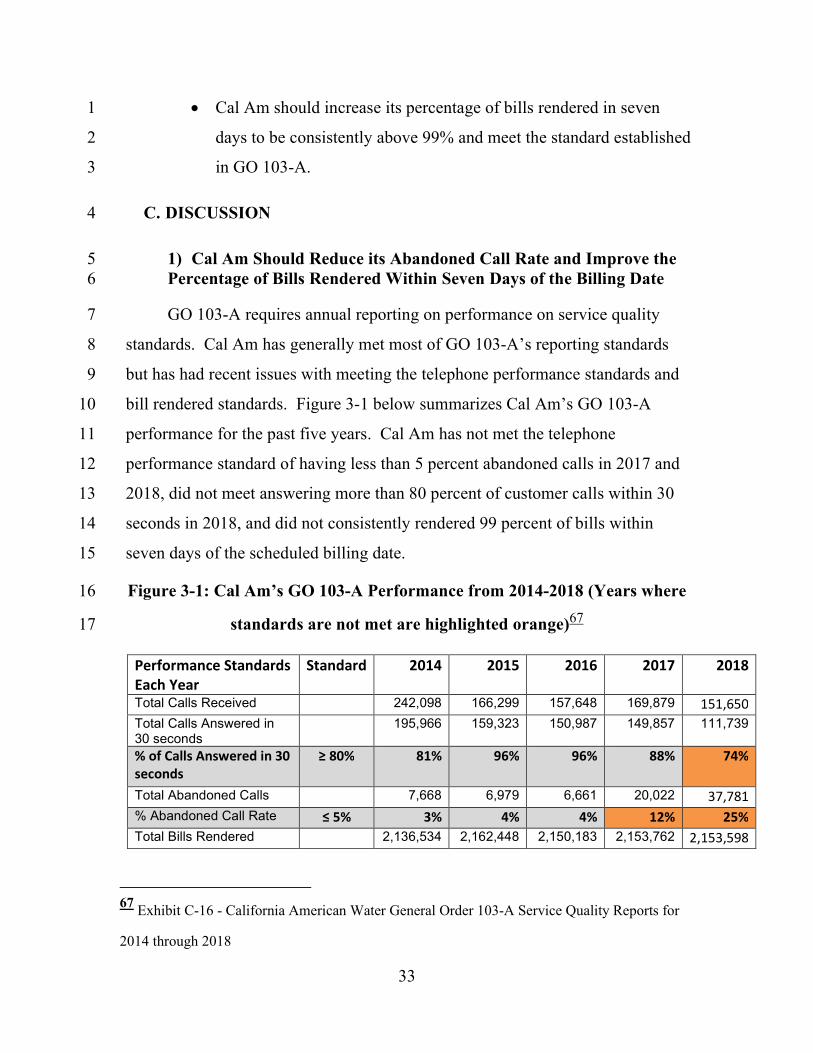
GO 103-A requires annual reporting on performance on service quality 7
standards. Cal Am has generally met most of GO 103-A’s reporting standards 8
but has had recent issues with meeting the telephone performance standards and 9
bill rendered standards. Figure 3-1 below summarizes Cal Am’s GO 103-A 10
performance for the past five years. Cal Am has not met the telephone 11
performance standard of having less than 5 percent abandoned calls in 2017 and 12
2018, did not meet answering more than 80 percent of customer calls within 30 13
seconds in 2018, and did not consistently rendered 99 percent of bills within 14
seven days of the scheduled billing date. 15
Figure 3-1: Cal Am’s GO 103-A Performance from 2014-2018 (Years where 16
standards are not met are highlighted orange)67 17
Performance Standards
Each Year
Standard 2014 2015 2016 2017 2018
Total Calls Received 242,098 166,299 157,648 169,879 151,650
Total Calls Answered in 30 seconds
195,966 159,323 150,987 149,857 111,739
% of Calls Answered in 30
seconds
≥ 80% 81% 96% 96% 88% 74%
Total Abandoned Calls 7,668 6,979 6,661 20,022 37,781
% Abandoned Call Rate ≤ 5% 3% 4% 4% 12% 25%
Total Bills Rendered 2,136,534 2,162,448 2,150,183 2,153,762 2,153,598
67
Exhibit C-16 - California American Water General Order 103-A Service Quality Reports for
2014 through 2018

34
Total Bills Rendered in 7 days
2,056,122 2,144,979 2,075,013 2,098,660 2,107,558
% Bills Rendered in 7
days
≥ 99% 96% 99% 97% 97% 98%
Total Inaccurate Bills 14,945 10,280 11,985 27,751 8,560
% of Inaccurate Bills ≤ 3% 0.69% 0.48% 0.55% 1.29% 0.40%
Total Payments Posted 1,843,763 1,834,845 1,840,408 1,880,583 1,927,756
Total Errored Payments 9,945 7,869 7,681 6,374 5,571
% Payment Posting Error ≤ 1% 0.54% 0.43% 0.43% 0.34% 0.29%
Total Number of Final Bills 24,108 20,960 22,197 23,690 22,465
Final Bills Issued after 14 days
2,936 3,877 2,525 2,772 2,214
% Final Read and Final
Bill Issued after 14 days
≤ 14 Days 12% 18% 11% 12% 10%
Total Scheduled Actual Meter Reads
2,081,012 2,078,653 2,081,730 2,074,583 2,104,149
Total Estimated Meter Reads
16,879 20,091 32,742 25,234 24,237
% Scheduled Meters not
Read
≤ 3% 0.84% 0.96% 1.60% 0.96% 1.10%
% Total Customer Met Appointments
≥ 95% 95% 96% 97% 96% 98.50%
% Total Missed Customer Appointments
≤ 5% 5% 4% 3% 3% 1%
Total Scheduled Work Orders Customer Requested
37,746 88,207 89,929 86,147 84,271
Total Completed Work Orders as Scheduled
55,344 82,824 85,699 82,359 88,803
Total Incomplete /Canceled Work Orders
5,856 5,303 4,230 3,788 3,885
% Customer Work Orders Not Completed
≤ 5% 15.50% 6.00% 5.00% 4.00% 4%
Total Number of Customers
173,354 174,765 177,614 177,521 177,501
# of CAB Formal and Informal Complaints
70 37 36 51 43
% Rate of Complaints to CAB
≤ .1% 0.04% 0.02% 0.02% 0.03% 0.02%
Figure 3-1 demonstrates clear issues with answering customer calls and 1
rendering customer bills promptly that Cal Am should address. In response to a 2
data request, Cal Am stated that the recent increases in customer call abandonment 3
were due to upgrades to a new Interactive Voice Response feature, a customer call 4
back feature, and a transition to a new telephone vendor. Cal Am took more time 5
implementing this upgrade than anticipated and customer faced long call wait 6
35
times during peak hours. Some customers choose to call local offices with 1
inquiries to avoid the lengthy wait time. In order to reduce wait times and the 2
abandoned call rate, Cal Am assigned its California Customer Advocacy Teams to 3
take customer calls.68 Cal Am states the upgrades are complete and the 4
abandoned call rate has dropped to around 6%.69 However, the 2019 abandoned 5
call rate data indicates a spike in abandoned call rates for July through September 6
of 2019. Furthermore, 6 percent average abandoned calls is still above the 5 7
percent or less standard set for abandoned call rate. As such, Cal Am still needs to 8
improve its performance to meet the less than 5 percent abandoned call rate 9
standard set forth in GO 103-A. 10
While GO 103-A does not contain punitive measures for failure to meet 11
performance standards, other Commission general orders related to service quality 12
do. GO 133-D sets a rule for imposing fines on reporting telecommunication 13
carriers that fail to meet GO 133-D’s performance standards for three or more 14
consecutive reporting units.70 This is called “chronic failure status.” GO 133-D 15
includes performance standards for taking customer calls, such as the percentage 16
of calls answered within 60 seconds.71 As such, it is reasonable for the 17
Commission to evaluate Cal Am’s performance on customer call standards using 18
GO 133-D’s framework as a proxy. 19
Under this framework, Cal Am would have entered chronic failure for the 20
percentage of bills rendered in seven days performance standard and could enter 21
68
Exhibit C-14 - Cal Am Response to Public Advocates Office DR CR5-04 Question 01
69 Exhibit C-14 - Cal Am Response to Public Advocates Office DR CR5-04 Question 01.
70 Commission GO 133-D at §9.
71 Commission GO 133-D at §3.5.
36
chronic failure for abandoned call rate if the average rate for 2019 remains above 5 1
percent. While GO 133-D does not apply to water utilities like Cal Am, the 2
Commission can use GO 133-D as a proxy and impose a fine or implement 3
another penalty if Cal Am continues to miss the performance standards in GO 4
103-A. 5
Cal Am should continue to make is Customer Advocacy Team available for 6
inquiries and reduce its abandoned call rate to pre-customer contact center upgrade 7
numbers. Furthermore, Cal Am should improve its performance and meet the 8
percentage of bills rendered in seven days performance standard. If Cal Am 9
continues to miss the performance standards set in GO 103-A in 2020, 2021, or 10
2022, the Commission should consider penalties such as fines or other measures to 11
encourage compliance with its GO 103-A. 12
2) Cal Am Has a Generally Reasonable Rate of Customer Complaints 13 and Inquiries. 14
Cal Am remarks that it has reduced its customer complaints in the recent 15
years. Figure 3-1 corroborates this claim, showing a reduction in informal and 16
formal complaints to CAB in 2015 and 2016 with a slight increase in 2017. Cal 17
Am’s customer complaint and inquiries shows a similar reduction, then increase in 18
the rate at which customers contacted Cal Am. Table 3-1 summarizes the total 19
customer contacts and average percentage of customers that contacted Cal Am 20
across all districts. 21
22
37
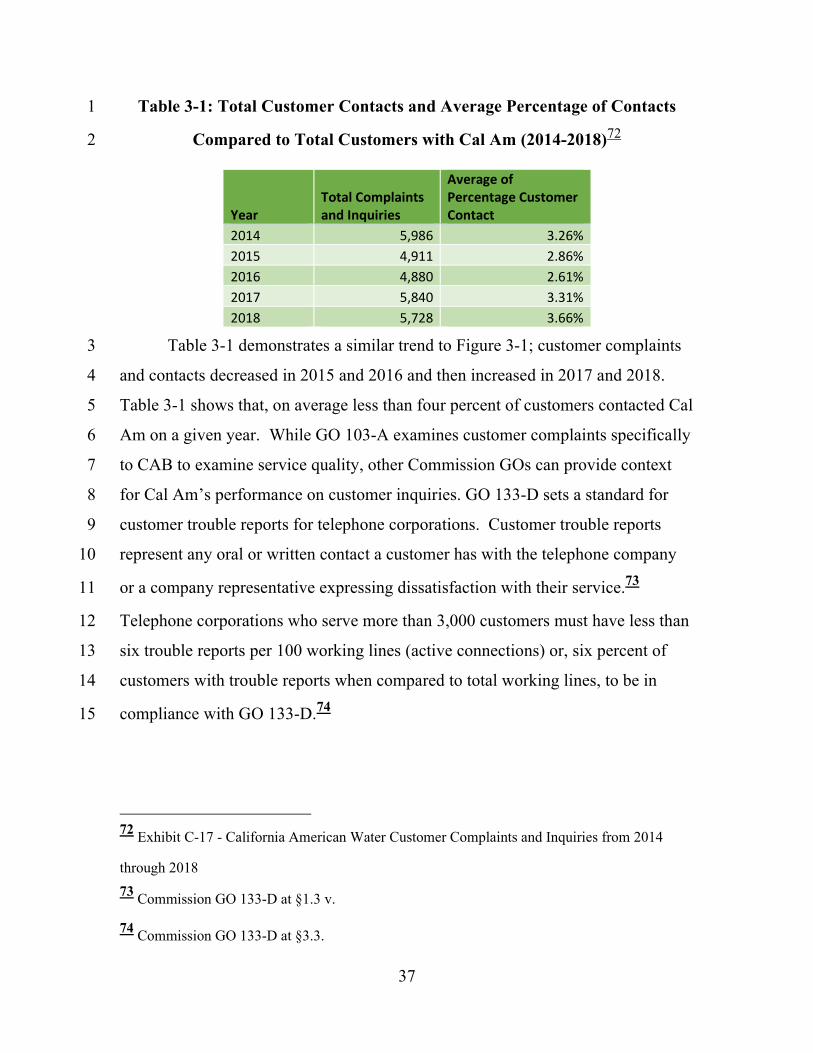
Table 3-1: Total Customer Contacts and Average Percentage of Contacts 1
Compared to Total Customers with Cal Am (2014-2018)72 2
Year
Total Complaints
and Inquiries
Average of
Percentage Customer
Contact
2014 5,986 3.26%
2015 4,911 2.86%
2016 4,880 2.61%
2017 5,840 3.31%
2018 5,728 3.66%
Table 3-1 demonstrates a similar trend to Figure 3-1; customer complaints 3
and contacts decreased in 2015 and 2016 and then increased in 2017 and 2018. 4
Table 3-1 shows that, on average less than four percent of customers contacted Cal 5
Am on a given year. While GO 103-A examines customer complaints specifically 6
to CAB to examine service quality, other Commission GOs can provide context 7
for Cal Am’s performance on customer inquiries. GO 133-D sets a standard for 8
customer trouble reports for telephone corporations. Customer trouble reports 9
represent any oral or written contact a customer has with the telephone company 10
or a company representative expressing dissatisfaction with their service.73 11
Telephone corporations who serve more than 3,000 customers must have less than 12
six trouble reports per 100 working lines (active connections) or, six percent of 13
customers with trouble reports when compared to total working lines, to be in 14
compliance with GO 133-D.74 15
72
Exhibit C-17 - California American Water Customer Complaints and Inquiries from 2014
through 2018
73 Commission GO 133-D at §1.3 v.
74 Commission GO 133-D at §3.3.
38
While GO 133-D does not apply to water companies, the customer trouble 1
reports standard is a useful proxy to contextualize the percentage of Cal Am’s 2
customer that reach out with inquiries and contacts and Cal Am’s service quality. 3
Using GO 133-D customer trouble reports standard as a framework, Table 3-1 4
shows that Cal Am has a reasonable rate of customer contacts and inquiries 5
compared to total customers. Table 3-1 aggregates customer contacts and inquiries 6
across all districts however, and specific data shows that Monterey and Baldwin 7
Hills have higher percentages of customer complaints and inquiries than other 8
districts.75 Still, the data in Attachment 3 to this testimony shows that each district 9
remains below the six percent comparative threshold for customer contacts. 10
Considering Cal Am’s customer contacts and CAB complaints have generally 11
reduced to reasonable levels, the Public Advocates Office does not oppose Cal 12
Am’s Special Request 14 to eliminate certain service quality and audit reporting 13
requirements, as described in the testimony of Daphne Goldberg. 14
D. CONCLUSION 15
The Commission should ensure that Cal Am is meeting its performance 16
obligations under General Order 103-A and provides high quality service to its 17
customers. If Cal Am continues to miss the performance standards set in GO 103-18
A in 2020, 2021, or 2022, the Commission should consider penalties such as fines 19
or other measures to encourage compliance with GO 103-A. While Cal Am’s call 20
performance service quality has not met Commission standards in recent years, 21
Cal Am’s customer complaints and contacts have reached a level that meets 22
Commission service quality standards. As such, the Public Advocates Office does 23
not oppose special request 14 to eliminate certain service quality reporting 24
required in D.06-11-050. 25
75
Attachment 3 tabulates these customer contacts and percentages.

39
CHAPTER 4: COMPLIANCE WITH DECISION 18-12-021 1
A. INTRODUCTION 2
Commission Decision (D.) 18-21-021 Ordering Paragraph (OP) 21 directed 3
Cal Am to provide confirmation that seven tank improvement projects for its 4
Monterey District were completed including: Lower Pasadera Tank, Upper 5
Pasadera Tank #1, Upper Pasadera Tank #2, Huckleberry Tank #2, Boots Tank, 6
Forest Lake Tank #1, and High Meadows Tank #1. OP 22 directed Cal Am to 7
provide historical expenses for Cal Am’s deferred tank maintenance program.76 8
D.18-21-021 ordered compliance with OPs 21 and 22 in Cal Am’s next GRC, as 9
such Cal Am must demonstrate compliance with OP 21 and 22 in A.19-07-004. 10
B. DISCUSSION 11
Cal Am’s direct testimony responded to OPs 21 and 22 by providing Table 12
XVII-G and XVII-H respectively.77 Table VXII-G simply noted the date at which 13
each tank improvement project was completed and explained that Cal Am chose to 14
rehabilitate the Forest Lake #2 Tank instead of the Forest Lake #1 Tank. In order 15
to confirm compliance with OP 21, the Commission should examine the most 16
recent reports to ensure the rehabilitations were completed. 17
In response to a data request, Cal Am provided tank inspection reports for 18
the seven tank rehabilitation projects.78 The inspection reports acknowledge that 19
76
D.18-12-021 at p. 325.
77 A.19-07-004 Cal Am 2019 GRC Direct Testimony of Ian Crooks at p. 267-268.
78 Exhibit C-13 – Cal Am Response to Public Advocates Office DR CR5-03
40
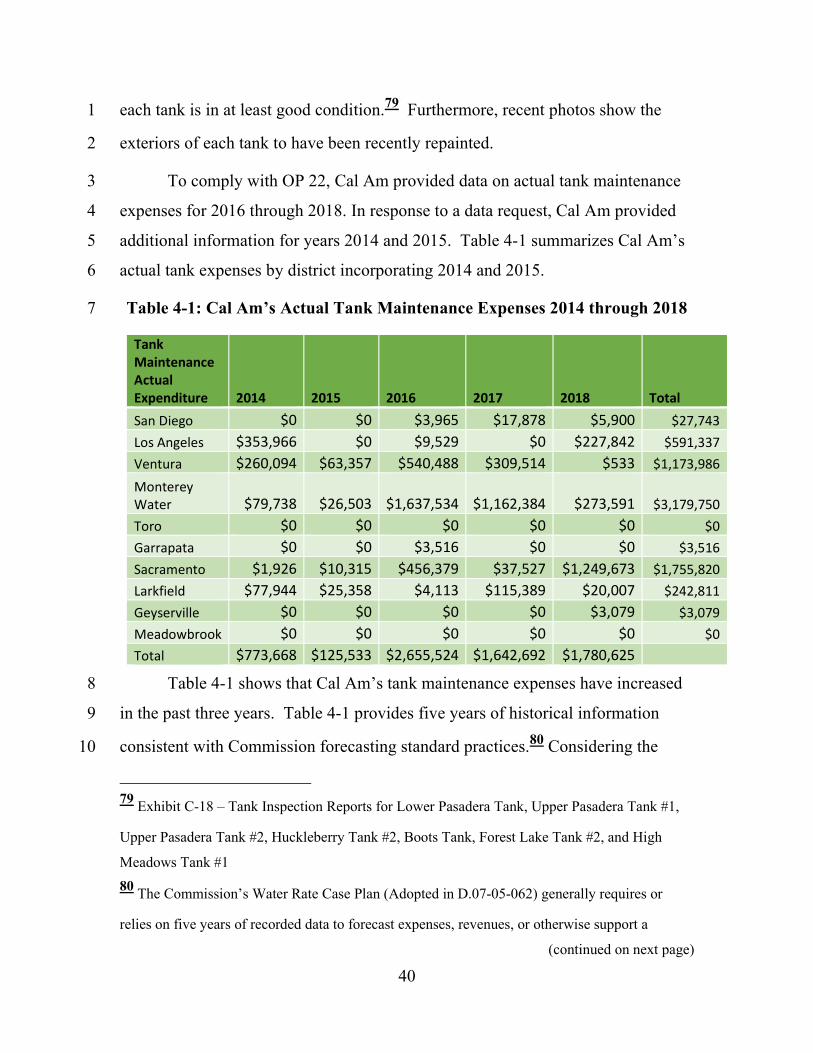
each tank is in at least good condition.79 Furthermore, recent photos show the 1
exteriors of each tank to have been recently repainted. 2
To comply with OP 22, Cal Am provided data on actual tank maintenance 3
expenses for 2016 through 2018. In response to a data request, Cal Am provided 4
additional information for years 2014 and 2015. Table 4-1 summarizes Cal Am’s 5
actual tank expenses by district incorporating 2014 and 2015. 6
Table 4-1: Cal Am’s Actual Tank Maintenance Expenses 2014 through 2018 7
Tank
Maintenance
Actual
Expenditure 2014 2015 2016 2017 2018 Total
San Diego $0 $0 $3,965 $17,878 $5,900 $27,743
Los Angeles $353,966 $0 $9,529 $0 $227,842 $591,337
Ventura $260,094 $63,357 $540,488 $309,514 $533 $1,173,986
Monterey
Water $79,738 $26,503 $1,637,534 $1,162,384 $273,591 $3,179,750
Toro $0 $0 $0 $0 $0 $0
Garrapata $0 $0 $3,516 $0 $0 $3,516
Sacramento $1,926 $10,315 $456,379 $37,527 $1,249,673 $1,755,820
Larkfield $77,944 $25,358 $4,113 $115,389 $20,007 $242,811
Geyserville $0 $0 $0 $0 $3,079 $3,079
Meadowbrook $0 $0 $0 $0 $0 $0
Total $773,668 $125,533 $2,655,524 $1,642,692 $1,780,625
Table 4-1 shows that Cal Am’s tank maintenance expenses have increased 8
in the past three years. Table 4-1 provides five years of historical information 9
consistent with Commission forecasting standard practices.80 Considering the 10
79
Exhibit C-18 – Tank Inspection Reports for Lower Pasadera Tank, Upper Pasadera Tank #1,
Upper Pasadera Tank #2, Huckleberry Tank #2, Boots Tank, Forest Lake Tank #2, and High
Meadows Tank #1
80 The Commission’s Water Rate Case Plan (Adopted in D.07-05-062) generally requires or
relies on five years of recorded data to forecast expenses, revenues, or otherwise support a
(continued on next page)
41
additional information Cal Am provided through data requests, Cal Am has 1
complied with D.18-12-021 OPs 21 and 22. 2
C. CONCLUSION 3
Cal Am has complied with OPs 21 and 22 and rehabilitated Lower Pasadera 4
Tank, Upper Pasadera Tank #1, Upper Pasadera Tank #2, Huckleberry Tank #2, 5
Boots Tank, Forest Lake Tank #2, and High Meadows Tank #1 as ordered by the 6
Commission in D.18-21-021. 7
8
revenue requirement.

42
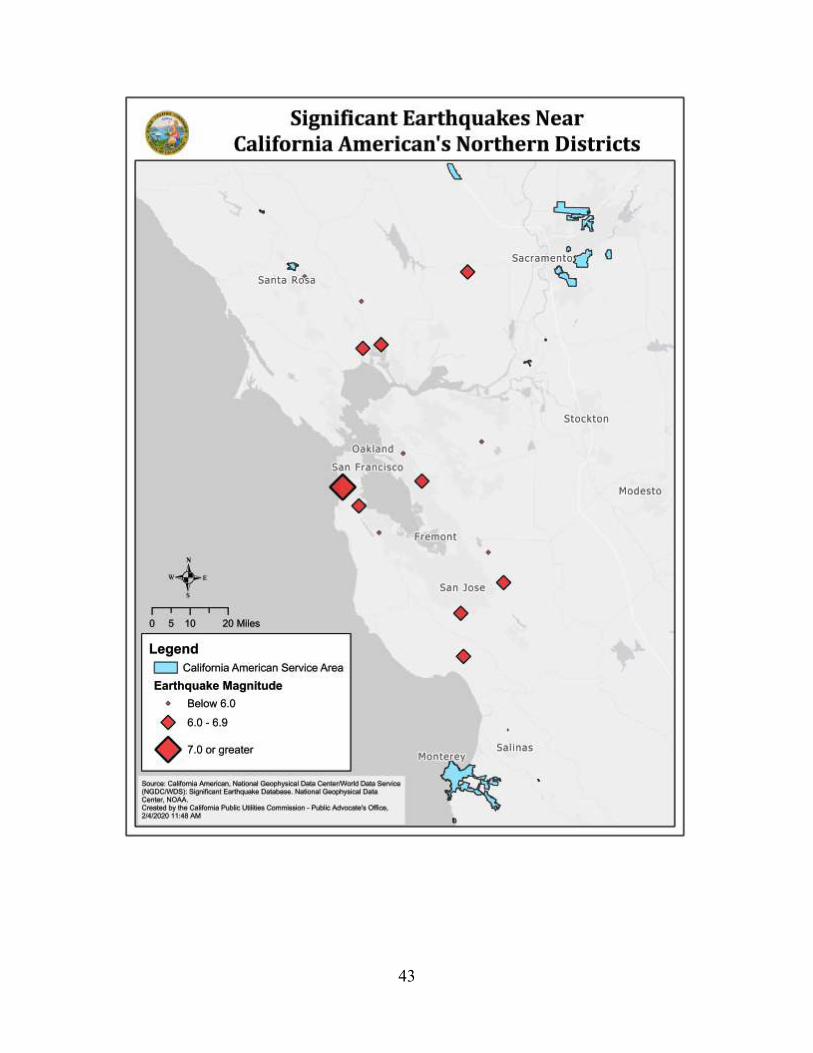
Attachment 1: Significant Earthquakes Near
California American Water’s
Districts
43
44
45
<<Begin Confidential>>
<<End Confidential>>
46
Attachment 2: Map of Cal Am’s Existing
Generators
[Confidential]

47
<<Begin Confidential>>

48

49

50
<<End Confidential>>

51
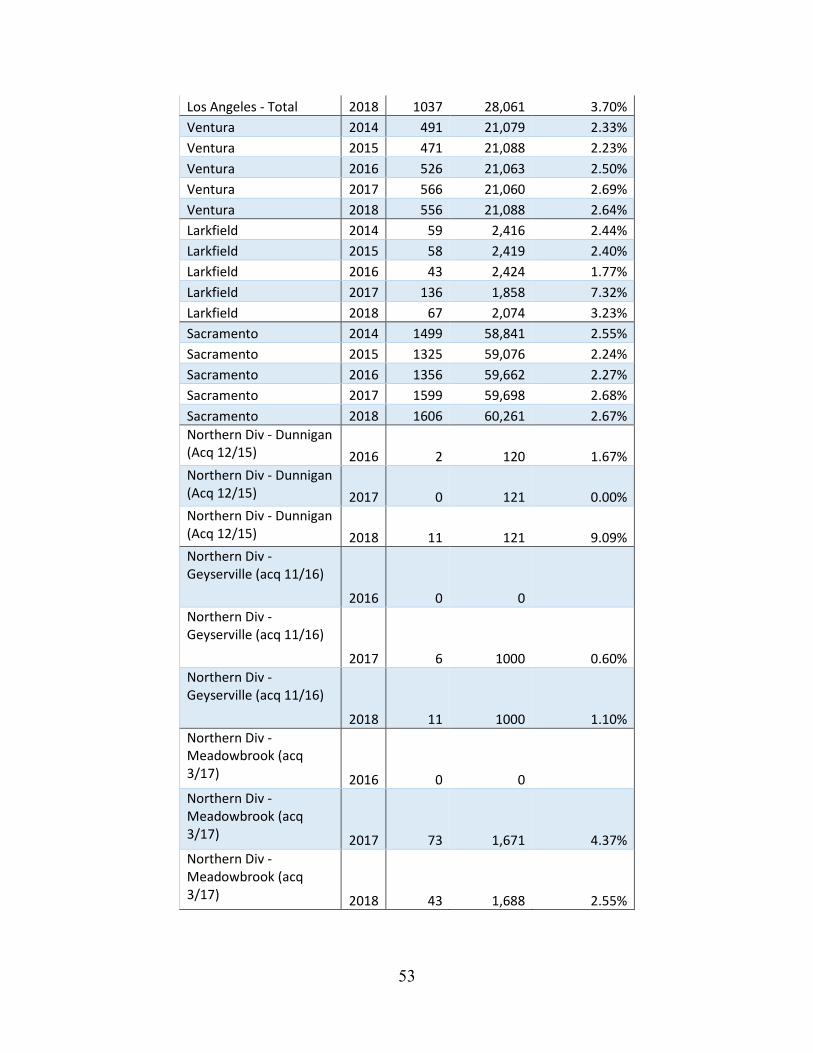
Attachment 3: Cal Am Customer Contacts and
Inquiries 2014 through 2018.
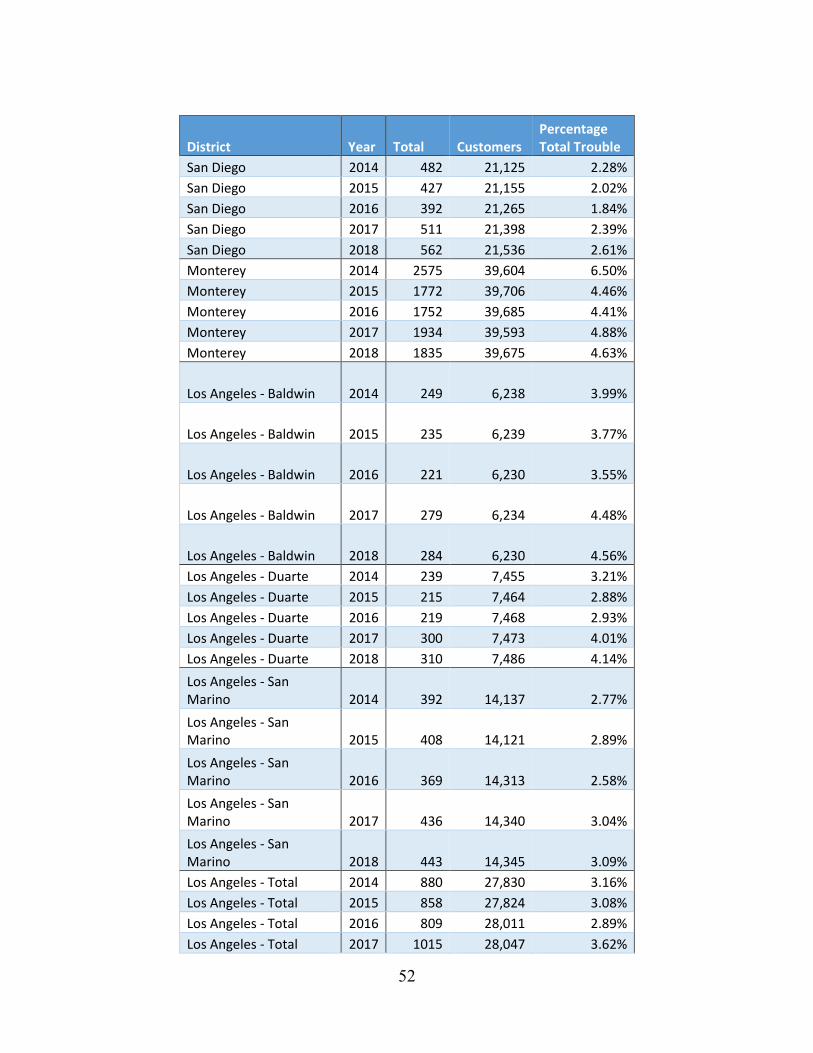
52
District Year Total Customers
Percentage
Total Trouble
San Diego 2014 482 21,125 2.28%
San Diego 2015 427 21,155 2.02%
San Diego 2016 392 21,265 1.84%
San Diego 2017 511 21,398 2.39%
San Diego 2018 562 21,536 2.61%
Monterey 2014 2575 39,604 6.50%
Monterey 2015 1772 39,706 4.46%
Monterey 2016 1752 39,685 4.41%
Monterey 2017 1934 39,593 4.88%
Monterey 2018 1835 39,675 4.63%
Los Angeles - Baldwin 2014 249 6,238 3.99%
Los Angeles - Baldwin 2015 235 6,239 3.77%
Los Angeles - Baldwin 2016 221 6,230 3.55%
Los Angeles - Baldwin 2017 279 6,234 4.48%
Los Angeles - Baldwin 2018 284 6,230 4.56%
Los Angeles - Duarte 2014 239 7,455 3.21%
Los Angeles - Duarte 2015 215 7,464 2.88%
Los Angeles - Duarte 2016 219 7,468 2.93%
Los Angeles - Duarte 2017 300 7,473 4.01%
Los Angeles - Duarte 2018 310 7,486 4.14%
Los Angeles - San
Marino 2014 392 14,137 2.77%
Los Angeles - San
Marino 2015 408 14,121 2.89%
Los Angeles - San
Marino 2016 369 14,313 2.58%
Los Angeles - San
Marino 2017 436 14,340 3.04%
Los Angeles - San
Marino 2018 443 14,345 3.09%
Los Angeles - Total 2014 880 27,830 3.16%
Los Angeles - Total 2015 858 27,824 3.08%
Los Angeles - Total 2016 809 28,011 2.89%
Los Angeles - Total 2017 1015 28,047 3.62%
53
Los Angeles - Total 2018 1037 28,061 3.70%
Ventura 2014 491 21,079 2.33%
Ventura 2015 471 21,088 2.23%
Ventura 2016 526 21,063 2.50%
Ventura 2017 566 21,060 2.69%
Ventura 2018 556 21,088 2.64%
Larkfield 2014 59 2,416 2.44%
Larkfield 2015 58 2,419 2.40%
Larkfield 2016 43 2,424 1.77%
Larkfield 2017 136 1,858 7.32%
Larkfield 2018 67 2,074 3.23%
Sacramento 2014 1499 58,841 2.55%
Sacramento 2015 1325 59,076 2.24%
Sacramento 2016 1356 59,662 2.27%
Sacramento 2017 1599 59,698 2.68%
Sacramento 2018 1606 60,261 2.67%
Northern Div - Dunnigan
(Acq 12/15) 2016 2 120 1.67%
Northern Div - Dunnigan
(Acq 12/15) 2017 0 121 0.00%
Northern Div - Dunnigan
(Acq 12/15) 2018 11 121 9.09%
Northern Div -
Geyserville (acq 11/16)
2016 0 0
Northern Div -
Geyserville (acq 11/16)
2017 6 1000 0.60%
Northern Div -
Geyserville (acq 11/16)
2018 11 1000 1.10%
Northern Div -
Meadowbrook (acq
3/17) 2016 0 0
Northern Div -
Meadowbrook (acq
3/17) 2017 73 1,671 4.37%
Northern Div -
Meadowbrook (acq
3/17) 2018 43 1,688 2.55%

54
Attachment 4: Witness Qualifications
55
QUALIFICATIONS AND PREPARED TESTIMONY
OF CAMERON REED
Q.1 Please state your name and business address.
A.1 My name is Cameron Reed and my business address is 505 Van Ness Ave, California 94102.
Q.2 By whom are you employed and in what capacity?
A.2 I am a Utilities Engineer in the Communication and Water Policy Branch of the Public Advocates Office of California Public Utilities Commission (Cal Advocates).
Q.3 Briefly describe your pertinent educational background.
A.3 I have a Bachelor of Science in Mechanical Engineering from the University of California-Davis. My studies included courses in engineering control systems, fluid mechanics, thermo-fluid mechanics, experimental methodology, and mechanical systems design.
Q.4 Briefly describe your professional experience.
A.4 I joined Communications and Water Policy branch of the Public Advocates Office as a Utilities Engineer in July of 2016. During my time at the Commission I have submitted testimony concerning Telecommunications Public Safety and/or Service Quality in three general rate case applications of small local exchange carriers: Sierra Telephone Company (Application 16-10-003), Ducor Telephone Company, (Application 17-10-003), and Foresthill Telephone Company (Application 17-10-004). I have submitted testimony regarding Public Safety and Cybersecurity in the Application of Pacific Gas and Electric for a Certificate of Public Convenience and Necessity to become a Competitive Local Exchange Carrier (Application 17-04-010). I have submitted opening, supplemental, and reply testimony on Safety, Service Quality, and Fifth Generation Wireless Networks in the consolidated Applications 18-07-011 and 18-07-12, the proposed merger of T-Mobile USA, Inc. and Sprint Communications Company. I have attended and completed the 38th Western National Association of Regulatory Utility Commissioners Utility Rate School.
Q.5 What is your responsibility in this proceeding?

56
A.5 I am responsible for the testimony on Cal Am’s Safety, Service Quality, Water Quality, and Compliance with Decision 18-12-021 regarding Ordering Paragraphs 21 and 22, as presented in this report.
Q.6 Does that conclude your direct testimony?
A.6 Yes, it does.