report 6m2016 eng - vtb · a member firm of ernst & young global limited ernst & younР llc...
TRANSCRIPT

VTB BANK
INTERIM CONDENSED CONSOLIDATED FINANCIAL STATEMENTS AND REPORT ON REVIEW OF INTERIM CONDENSED CONSOLIDATED FINANCIAL STATEMENTS
30 JUNE 2016

VTB BANK INTERIM CONDENSED CONSOLIDATED FINANCIAL STATEMENTS AND REPORT ON REVIEW
CONTENTS
REPORT ON REVIEW OF INTERIM CONDENSED CONSOLIDATED FINANCIAL STATEMENTS ....... 1
INTERIM CONSOLIDATED INCOME STATEMENT .................................................................................................. 2 INTERIM CONSOLIDATED STATEMENT OF COMPREHENSIVE INCOME ............................................................ 3 INTERIM CONSOLIDATED STATEMENT OF FINANCIAL POSITION ...................................................................... 4 INTERIM CONSOLIDATED STATEMENT OF CASH FLOWS ................................................................................... 5 INTERIM CONSOLIDATED STATEMENT OF CHANGES IN SHAREHOLDERS’ EQUITY ...................................... 7
SELECTED NOTES TO THE INTERIM CONDENSED CONSOLIDATED FINANCIAL STATEMENTS
1. Principal Activities .................................................................................................................................................................. 8 2. Basis of Preparation .............................................................................................................................................................. 9
DELVING INTO NUMBERS
3. Analysis by Segment ................................................. 11 4-11. Notes to Income Statements ...................................... 19 12-24. Notes to Statements of Financial Position ................. 22
RISK
25. Operating Environment of the Group .......................... 33 26. Fair Value of Financial Instruments ............................ 34 27. Capital Management and Capital Adequacy .............. 45
GROUP STRUCTURE
28. Business Combinations and Disposal of Subsidiaries<<<. ................................................... 46
29. Non-controlling Interests ............................................ 46
OFF BALANCE-SHEET ITEMS
30. Contingencies and Commitments............................... 46 31. Subsequent Events .................................................... 48
OTHER INFORMATION
32 Related Party Transactions .................................................................................................................................................. 48 33. Share-Based Payments ....................................................................................................................................................... 49 34. Basic and Diluted Earnings per Share ................................................................................................................................. 50 35. Adoption of New or Revised Standards and Interpretations ................................................................................................. 50 36 Changes in Presentation ..................................................................................................................................................... 52

A member firm of Ernst & Young Global Limited
Ernst & YounР LLC SadoЯnТcСОskaвa Nab., 77, bld. 1 Moscoа, 115035, RussТa TОl: +7 (495) 705 9700 +7 (495) 755 9700 Faб: +7 (495) 755 9701 ааа.Ов.com/ru
«Э э » ия, 115035, М
ич я ., 77, . 1 .: +7 (495) 705 9700
+7 (495) 755 9700 Ф : +7 (495) 755 9701
К : 59002827
Report on review of interim condensed consolidated financial statements
To the Shareholders and Supervisory Council of VTB Bank
Introduction
We have reviewed the accompanying interim condensed consolidated financial statements of VTB Bank (“the Bank”) and its subsidiaries (together the “Group”), which comprise the interim consolidated statement of financial position as
at 30 June 2016 and the related interim consolidated income statement, the interim consolidated statement of
comprehensive income for the three-month and six-month periods then ended, statements of cash flows and changes in shareholders’ equity for the six-month period then ended and selected explanatory notes. Management of the Bank
is responsible for the preparation and presentation of these interim condensed consolidated financial statements in
accordance with IAS 34, Interim Financial Reporting. Our responsibility is to express a conclusion on these interim
condensed consolidated financial statements based on our review.
Scope of review
We conducted our review in accordance with International Standard on Review Engagements 2410, Review of Interim
Financial Information Performed by the Independent Auditor of the Entity. A review of interim condensed consolidated
financial statements consists of making inquiries, primarily of persons responsible for financial and accounting
matters, and applying analytical and other review procedures. A review is substantially less in scope than an audit
conducted in accordance with International Standards on Auditing and consequently does not enable us to obtain
assurance that we would become aware of all significant matters that might be identified in an audit. Accordingly, we
do not express an audit opinion.
Conclusion
Based on our review, nothing has come to our attention that causes us to believe that the accompanying interim
condensed consolidated financial statements are not prepared, in all material respects, in accordance with IAS 34,
Interim Financial Reporting.
16 August 2016
Moscow, Russia

VTB BANK INTERIM CONSOLIDATED INCOME STATEMENT FOR THE THREE-MONTH AND SIX-MONTH PERIODS ENDED 30 JUNE (UNAUDITED) (IN BILLIONS OF RUSSIAN ROUBLES)
The notes № 1-36 form an integral part of these interim condensed consolidated financial statements. 2
For the three-month period
ended 30 June
For the six-month period ended 30 June Change for the
Note 2016 2015 2016 2015
three-month period
six-month period
Interest income 4 274.5 262.2 558.4 534.7 4.7% 4.4% Interest expense 4 (163.3) (194.5) (346.1) (420.6) -16.0% -17.7% Payments to deposit insurance system 4 (2.5) (2.0) (5.3) (4.0) 25.0% 32.5% Net interest income 4 108.7 65.7 207.0 110.1 65.4% 88.0%
Provision charge for impairment of debt financial assets
14, 15, 16, 24 (30.3) (25.2) (65.9) (73.6) 20.2% -10.5%
Net interest income after provision for impairment 78.4 40.5 141.1 36.5 93.6% 286.6%
Net fee and commission income 5 19.2 17.2 36.6 32.6 11.6% 12.3%
Gains net of losses arising from financial instruments
at fair value through profit or loss 6 6.0 2.0 11.9 18.5 200.0% -35.7% Gains net of losses from investment financial assets
available-for-sale 16 5.0 1.0 3.2 0.4 400.0% 700.0% (Losses net of gains)/gains net of losses arising from
foreign currencies 7 (7.2) 3.7 (15.6) 21.4 -294.6% -172.9% (Losses net of gains)/gains net of losses on initial
recognition of financial instruments and other gains on loans and advances to customers 0.2 (0.1) (0.2) (1.0) 300.0% -80.0%
Share in profit of associates and joint ventures 0.8 0.6 1.8 2.1 33.3% -14.3% Gain/(loss) from disposal of subsidiaries and
associates 3.4 (0.1) 3.4 (0.1) 3,500.0% 3,500.0% Gains net of losses/(losses net of gains) arising from
extinguishment of liabilities (0.1) – 1.9 – n/a n/a Provision charge for impairment of other assets, credit
related commitments and legal claims 9, 30 (32.0) (5.8) (37.0) (6.3) 451.7% 487.3% Other operating income 5.9 4.8 12.1 9.2 22.9% 31.5% Non-interest (losses) / gains (18.0) 6.1 (18.5) 44.2 -395.1% -141.9%
Net insurance premiums earned 11.1 48.9 33.8 59.5 -77.3% -43.2% Net insurance claims incurred, movement in liabilities
to policyholders and acquisition costs (7.9) (49.3) (28.7) (58.8) -84.0% -51.2% Revenues less expenses from insurance activity 3.2 (0.4) 5.1 0.7 900.0% 628.6%
Revenue from other non-banking activities 6.9 6.1 12.6 12.5 13.1% 0.8% Cost of sales and other expenses from other non-
banking activities (9.3) (9.3) (17.1) (17.6) 0.0% -2.8% Impairment of land, premises and intangible assets
other than goodwill used in non-banking activities (0.5) – (0.5) – n/a n/a Net loss from change in fair value of investment
property recognised on revaluation (2.8) (2.3) (5.0) (12.4) 21.7% -59.7% Revenues less expenses from other non-banking
operations (5.7) (5.5) (10.0) (17.5) 3.6% -42.9%
Other operating expense (12.8) (3.0) (19.2) (5.6) 326.7% 242.9% Impairment of land, premises and intangible assets
other than goodwill (0.7) – (1.0) – n/a n/a Staff costs and administrative expenses 8 (55.7) (51.2) (116.3) (105.8) 8.8% 9.9% Non-interest expenses (69.2) (54.2) (136.5) (111.4) 27.7% 22.5%
Profit/(loss) before tax 7.9 3.7 17.8 (14.9) 113.5% 219.5% Income tax expense 10 (4.9) (1.8) (10.1) (0.5) 172.2% 1,920.0% Net profit/(loss) after tax 3.0 1.9 7.7 (15.4) 57.9% 150.0% Profit / (loss) after tax from subsidiaries acquired
exclusively with a view to resale 18 11.8 (0.7) 7.7 (1.7) 1,785.7% 552.9%
Net profit/(loss) 14.8 1.2 15.4 (17.1) 1,133.3% 190.1%
Net profit/(loss) attributable to: Shareholders of the parent 16.0 2.5 17.7 (11.8) 540.0% 250.0% Non-controlling interests (1.2) (1.3) (2.3) (5.3) -7.7% -56.6% Basic and diluted earnings per share
(expressed in Russian roubles per share) 34 0.00080 (0.00062) 0.00093 (0.00174) 229.0% 153.4% Basic and diluted earnings per share before profit after
tax from subsidiaries acquired exclusively with a view to resale (expressed in Russian roubles per share) 34 (0.00011) (0.00057) 0.00033 (0.00161) -80.7% 120.5%

VTB BANK INTERIM CONSOLIDATED STATEMENT OF COMPREHENSIVE INCOME FOR THE THREE-MONTH AND SIX-MONTH PERIODS ENDED 30 JUNE (UNAUDITED) (IN BILLIONS OF RUSSIAN ROUBLES)
The notes № 1-36 form an integral part of these interim condensed consolidated financial statements. 3
For the three-month period
ended 30 June
For the six-month period ended 30 June
2016 2015 2016 2015
Net profit/(loss) 14.8 1.2 15.4 (17.1)
Other comprehensive income/(loss) Other comprehensive income/(loss) to be reclassified to profit or loss in subsequent
periods: Net result on financial assets available-for-sale, net of tax (2.2) (0.2) 1.9 5.5 Cash flow hedges, net of tax (0.7) 0.2 (0.7) (0.1) Share of other comprehensive loss of associates and joint ventures (0.7) (1.0) (1.8) (0.6) Effect of translation, net of tax (9.3) (4.1) (21.7) (13.1) Total other comprehensive loss to be reclassified to profit or loss in subsequent
periods (12.9) (5.1) (22.3) (8.3)
Other comprehensive income/(loss) not to be reclassified to profit or loss in
subsequent periods: Actuarial (losses net of gains) / gains net of losses arising from difference between
pension plan assets and obligations (1.2) 0.2 (1.2) 0.2 Land and premises revaluation, net of tax – (0.1) – – Total other comprehensive (loss) / income not to be reclassified to profit or loss in
subsequent periods (1.2) 0.1 (1.2) 0.2
Other comprehensive loss, net of tax (14.1) (5.0) (23.5) (8.1)
Total comprehensive (loss)/profit 0.7 (3.8) (8.1) (25.2) Total comprehensive (loss)/profit attributable to: Shareholders of the parent 2.1 (2.5) (5.1) (19.8) Non-controlling interests (1.4) (1.3) (3.0) (5.4)


VTB BANK INTERIM CONSOLIDATED STATEMENT OF CASH FLOWS FOR THE SIX-MONTH PERIOD ENDED 30 JUNE (UNAUDITED) (IN BILLIONS OF RUSSIAN ROUBLES)
The notes № 1-36 form an integral part of these interim condensed consolidated financial statements. 5
For the six-month period
ended 30 June
Note 2016 2015
Cash flows from operating activities Interest received 548.6 528.9 Interest paid (360.2) (393.8) Payments to deposit insurance system (5.1) (4.0) Gains on operations with financial assets at fair value through profit or loss 2.8 9.5 Income received from extinguishment of liability 0.1 – Losses on dealing in foreign currency (144.7) (7.7) Fees and commissions received 51.7 42.4 Fees and commissions paid (11.8) (9.7) Other operating income received 11.0 9.4 Other operating expenses paid (15.9) (7.2) Staff costs, administrative expenses paid (116.0) (112.1) Income received from non-banking activities 30.7 19.5 Expenses paid in non-banking activities (19.0) (19.5) Net insurance premiums received 44.8 64.8 Net insurance claims paid (20.5) (58.6) Income tax paid (12.3) (9.8) Cash flows (used in) / from operating activities before changes in operating
assets and liabilities (15.8) 52.1
Net decrease/(increase) in operating assets Net increase in mandatory cash balances with central banks (6.9) (8.3) Net decrease in restricted cash 1.0 – Net decrease in correspondent accounts in precious metals 0.9 0.5 Net (increase)/decrease in financial assets at fair value through profit or loss (7.2) 84.6 Net decrease/(increase) in due from other banks 503.8 (397.3) Net decrease in loans and advances to customers 176.5 532.7 Net decrease/(increase) in other assets 17.9 (7.3) Net (decrease)/increase in operating liabilities Net (decrease)/increase in due to other banks (97.1) 47.0 Net increase in customer deposits 816.6 408.1 Net decrease in debt securities issued other than bonds issued (65.3) (7.6) Net increase/(decrease) in other liabilities 17.2 (41.6) Net cash from operating activities 1,341.6 662.9
Cash flows used in investing activities Dividends and other distributions received 5.1 0.4 Proceeds from sales or maturities of investment financial assets available-for-sale 114.6 130.9 Purchase of investment financial assets available-for-sale (121.3) (119.4) Disposal of subsidiaries, net of cash 1.6 – Proceeds from sale of associates 0.7 – Purchase of investment financial assets held-to-maturity (24.8) (17.7) Proceeds from redemption of investment financial assets held-to-maturity 9.6 0.2 Purchase of land, premises and equipment (27.5) (20.9) Proceeds from sale of land, premises and equipment 1.3 0.8 Purchase or construction of investment property (3.5) (4.1) Proceeds from sale of investment property 2.4 1.9 Purchase of intangible assets (2.6) (3.0) Proceeds from sale of intangible assets 0.8 0.1 Net cash used in investing activities (43.6) (30.8)

VTB BANK INTERIM CONSOLIDATED STATEMENT OF CASH FLOWS FOR THE SIX-MONTH PERIOD ENDED 30 JUNE (UNAUDITED) (IN BILLIONS OF RUSSIAN ROUBLES) (CONTINUED)
The notes № 1-36 form an integral part of these interim condensed consolidated financial statements. 6
For the six-month period
ended 30 June
Note 2016 2015
Cash flows used in financing activities Proceeds from issuance of local bonds - 0.2 Repayment of local bonds (55.7) (25.6) Buy-back of local bonds (18.6) (9.1) Proceeds from sale of previously bought-back local bonds 48.0 5.3 Repayment of Eurobonds (16.5) (188.2) Buy-back of Eurobonds (8.9) (17.9) Proceeds from sale of previously bought-back Eurobonds 5.7 10.2 Proceeds from syndicated loans 0.5 5.6 Repayment of syndicated loans (121.3) (6.2) Proceeds from other borrowings and funds from local central banks 1,444.9 6,864.0 Repayment of other borrowings and funds from local central banks (2,543.7) (7,323.2) Buy-back of subordinated debt (8.8) (3.7) Proceeds from sale of previously bought-back subordinated debt - 4.9 Cash received from sale of treasury shares 17.6 6.9 Cash paid for treasury shares (17.5) (2.5) Proceeds from sale of non-controlling interests in subsidiaries 5.5 - Buy-back of perpetual loan participation notes (2.7) (0.4) Proceeds from sale of previously bought-back perpetual loan participation notes 2.8 0.2 Amounts paid on perpetual loan participation notes 24 (7.1) (5.9) Net cash used in financing activities (1,275.8) (685.4)
Effect of exchange rate changes on cash and cash equivalents (27.4) (16.7) Net decrease in cash and cash equivalents (5.2) (70.0)
At the beginning of period 11 561.6 687.7 At the end of period 11 556.4 617.7

VTB BANK INTERIM CONSOLIDATED STATEMENT OF CHANGES IN SHAREHOLDERS’ EQUITY FOR THE SIX-MONTH PERIOD ENDED 30 JUNE (UNAUDITED) (IN BILLIONS OF RUSSIAN ROUBLES)
The notes № 1-36 form an integral part of these interim condensed consolidated financial statements. 7
Attributable to shareholders of the parent
Share capital
Share premium
Perpetual loan participation
notes
Treasury shares and
bought back perpetual loan
participation loan notes
Other reserves (Note 23)
Retained earnings Total
Non-controlling interests
Total equity
Balance at 1 January 2015 352.1 433.8 126.6 (6.7) 42.8 169.3 1,117.9 13.1 1,131.0 Net result from treasury shares
transactions – – – 4.4 – 2.3 6.7 – 6.7
Net result from treasury perpetual loan participation notes transactions – – – (0.2) – 0.1 (0.1) – (0.1)
Loss for the period – – – – – (11.8) (11.8) (5.3) (17.1)
Other comprehensive income/(loss) – – – – (8.2) 0.2 (8.0) (0.1) (8.1)
Total comprehensive loss for the period – – – – (8.2) (11.6) (19.8) (5.4) (25.2)
Transfer of premises revaluation
reserve upon disposal or depreciation – – – – (0.1) 0.1 – – –
Share-based payments (Note 33) – – – – – (0.5) (0.5) – (0.5)
Acquisition of subsidiaries – – – – – – – 3.8 3.8 Acquisition of non-controlling
interests – – – – – (0.2) (0.2) 0.2 – Amounts due and paid on
perpetual loan participation notes (Note 24) – – – – – (11.7) (11.7) – (11.7)
Foreign exchange translation of perpetual loan participation notes – – (1.7) – – 1.7 – – –
Tax effect recognized on perpetual loan participation notes – – – – – 0.9 0.9 – 0.9
Dividends declared (Note 24) – – – – – (18.0) (18.0) – (18.0) Balance at 30 June 2015 352.1 433.8 124.9 (2.5) 34.5 132.4 1,075.2 11.7 1,086.9 Balance at 1 January 2016 659.5 433.8 164.0 (2.9) 72.2 127.6 1,454.2 (0.1) 1,454.1 Net result from treasury shares
transactions – – – 0.1 – 0.1 0.2 – 0.2 Net result from treasury perpetual
loan participation notes transactions – – – 0.1 – – 0.1 – 0.1
Profit for the period – – – – – 17.7 17.7 (2.3) 15.4 Other comprehensive
income/(loss) – – – – (21.7) (1.1) (22.8) (0.7) (23.5) Total comprehensive income/
(loss) for the period – – – – (21.7) 16.6 (5.1) (3.0) (8.1)
Transfer of premises revaluation
reserve upon disposal or depreciation – – – – (0.7) 0.7 – – –
Share-based payments (Note 33) – – – – – (0.3) (0.3) – (0.3) Increase in share capital of
subsidiaries – – – – – – – 0.5 0.5 Acquisition of subsidiaries – – – – – – – (0.5) (0.5)
Disposal of subsidiaries – – – – – (0.1) (0.1) 0.1 – Sale of non-controlling interests
(Note 29) – – – – – (0.9) (0.9) 6.2 5.3 Amounts paid on perpetual loan
participation notes (Note 24) – – – – – (7.1) (7.1) – (7.1) Foreign exchange translation of
perpetual loan participation notes – – (19.4) – – 19.4 – – –
Tax effect recognized on perpetual loan participation notes – – – – – (2.5) (2.5) – (2.5)
Dividends declared (Note 24) – – – – – (33.1) (33.1) – (33.1)
Other distributions (Note 24) – – – – – (11.0) (11.0) – (11.0) Balance at 30 June 2016 659.5 433.8 144.6 (2.7) 49.8 109.4 1,394.4 3.2 1,397.6

VTB BANK SELECTED NOTES TO THE INTERIM CONDENSED CONSOLIDATED FINANCIAL STATEMENTS 30 JUNE 2016
8
1. PRINCIPAL ACTIVITIES VTB Bank and its subsidiaries (the “Group”) comprise Russian and foreign commercial banks, insurance, leasing and other entities controlled by the Group. VTB Bank, formerly known as Vneshtorgbank (the “Bank”, or “VTB”), was formed as Russia’s foreign trade bank under the laws of the Russian Federation on 17 October 1990. In 1998, following several reorganizations, VTB was reorganized into an open joint stock company. In October 2006 the Group started re-branding to change its name from Vneshtorgbank to VTB. In March 2007, the Bank for Foreign Trade was renamed into “VTB Bank” (Open Joint-Stock Company). In June 2015 “VTB Bank” (open joint-stock company) was renamed into VTB Bank (Public Joint-Stock Company) in accordance with the legislative requirements. On 2 January 1991, VTB received a general banking license (number 1000) from the Central Bank of the Russian Federation (“CBR”). In addition, VTB holds licenses required for trading and holding securities and engaging in other securities-related activities, including acting as a broker, a dealer and a custodian, and providing asset management and special depositary services. VTB and other Russian banks within the Group are regulated and supervised by the CBR. Foreign banks within the Group operate under the bank regulatory regimes of their respective countries. On 10 May 2016, the Group completed a transfer to VTB Bank, PJCS of substantially all of the performing assets and certain customer accounts and other related liabilities of "Bank of Moscow", OJSC, its wholly-owned subsidiary. Concurrent with the transfer, the subsidiary was renamed to “BM-Bank”, PJSC, and its remaining assets represent predominantly loans subject to the CBR and DIA plan of support and certain other assets. On 29 December 2004, the Bank became a member of the obligatory deposit insurance system provided by the State Corporation “Deposit Insurance Agency” (“DIA”). The Group subsidiary banks in Russia: “Bank VTB 24”, PJSC, “BM-Bank”, OJSC and “Post Bank”, PJSC (former “Leto Bank”, PJSC – refer to Note 29) are also members of the obligatory deposit insurance system provided by DIA. The State deposit insurance scheme implies that DIA guarantees repayment of individual deposits up to the maximum total guaranteed amount of RUR 1.4 million with a 100% compensation of deposited amount from 29 December 2014.
On 5 October 2005, VTB re-registered its legal address to 29 Bolshaya Morskaya Street, Saint-Petersburg 190000, Russian Federation. VTB’s Head Office is located in Moscow. The Group operates in the corporate and investment banking, retail, real estate and other sectors. Corporate and investment banking include deposit taking and commercial lending in freely convertible currencies and in Russian roubles, support of clients’ export/import transactions, foreign exchange, securities trading and trading in derivative financial instruments. The Group’s operations are conducted in both Russian and international markets. The Group conducts its banking business in Russia through VTB as a parent and several subsidiary banks with its network of 40 full service branches, including 32 branches of VTB and 8 branches of “Bank VTB 24”, PJSC located in major Russian regions. The Group operates outside Russia through 13 subsidiary banks, located in Austria, Germany, France, Great Britain, Serbia, Armenia, Belarus, Kazakhstan, Azerbaijan, Ukraine (2 banks), Georgia and Angola; through 3 representative offices located in Italy, China and Kyrgyzskaya Republic; through 2 VTB branches in China and India and 2 branches of “VTB Capital”, Plc in Singapore and Dubai. The Group investment banking division also performs broker/dealer operations in the United States of America, securities dealing and financial advisory in Hong Kong and investment banking operations in Bulgaria. The number of employees of the Group as at 30 June 2016 was 90,055 (31 December 2015: 92,882) including non-banking operations employees. The average number of employees of the Group for the six-month period ended 30 June 2016 was 90,547 (for the six-month period ended 30 June 2015: 98,821), including non-banking operations employees. VTB’s majority shareholder is the Russian Federation, acting through the Federal Property Agency, which holds 60.9% of VTB’s issued and outstanding ordinary shares as at 30 June 2016 (31 December 2015: 60.9%). Unless otherwise noted herein, all amounts are expressed in billions of Russian roubles rounded off to one decimal.

VTB BANK SELECTED NOTES TO THE INTERIM CONDENSED CONSOLIDATED FINANCIAL STATEMENTS 30 JUNE 2016 (CONTINUED)
9
2. BASIS OF PREPARATION
These interim condensed consolidated financial statements as at 30 June 2016 and for the six-month period ended 30 June 2016 (“financial statements”) have been prepared in accordance with International Accounting Standard (IAS) 34 Interim Financial Reporting. As a result, they do not include all of the
information required by International Financial Reporting Standards (IFRS) for a complete set of financial statements. The Bank and its subsidiaries and associates maintain their accounting records in accordance with regulations applicable in their country of registration. These interim condensed consolidated financial statements are based on those accounting books and records, as adjusted and reclassified to comply with International Accounting Standard 34 Interim Financial Reporting.
These interim condensed consolidated financial statements have been prepared under the historical cost convention, as modified by the initial recognition of financial instruments based on fair value, by the revaluation of land, premises and investment properties, available-for-sale financial assets, and financial instruments categorized as at fair value through profit or loss, and by assets of disposal groups held for sale and property intended for sale in the ordinary course of business measured at fair value less costs to sell. The preparation of financial statements requires management to make estimates and assumptions that affect reported amounts. These estimates are based on information available as at the date of the financial statements. Actual results can differ significantly from such estimates. Judgments and significant estimates in these financial statements are consistent with those applied in the preparation of the Group’s annual financial statements for the year ended 31 December 2015. Income tax expense in respect of the current tax assets and liabilities is recognized based on the income tax
rates enacted by the end of the reporting period in relevant tax jurisdictions where the Group is present. Income tax expense in respect of the deferred tax assets and liabilities is measured at the income tax rates that are expected to apply to the period when deferred assets are realized or liabilities are settled based on the income tax rates officially enacted by the end of the reporting period. These interim condensed consolidated financial statements should be read in conjunction with the complete consolidated financial statements as at 31 December 2015. Operating results for the six-month period ended 30 June 2016 are not necessarily indicative of the results that may be expected for the year ending 31 December 2016. These interim condensed consolidated financial statements are presented in Russian roubles (RUR), the national currency of the Russian Federation, where the Bank is domiciled. As at 30 June 2016, the principal closing rate of exchange used for translating balances in USD to Russian roubles was USD 1 to RUR 64.2575 (31 December 2015: USD 1 to RUR 72.8827), and the principal closing rate of exchange used for translating balances in Euro was EUR 1 to RUR 71.2102 (31 December 2015: EUR 1 to RUR 79.6972).

VTB BANK SELECTED NOTES TO THE INTERIM CONDENSED CONSOLIDATED FINANCIAL STATEMENTS 30 JUNE 2016 (CONTINUED)
10
DELVING INTO NUMBERS
3 ANALYSIS BY SEGMENT<.<<<<<.<<11
4. INTEREST INCOME AND EXPENSE ............ 19
5. NET FEE AND COMMISSION INCOME ........ 19
6. GAINS NET OF LOSSES ARISING FROM FINANCIAL INSTRUMENTS AT FAIR VALUE THROUGH PROFIT OR LOSS .......... 20
7. (LOSSES NET OF GAINS) / GAINS NET OF LOSSES ARISING FROM FOREIGN CURRENCIES ................................................ 20
8. STAFF COSTS AND ADMINISTRATIVE EXPENSES .................................................... 20
9. ALLOWANCE FOR IMPAIRMENT OF OTHER ASSETS ............................................ 21
10. INCOME TAX ................................................. 21
11. CASH AND SHORT-TERM FUNDS ............... 22
12. NON-DERIVATIVE FINANCIAL ASSETS AT FAIR VALUE THROUGH PROFIT OR LOSS, INCLUDING PLEDGED UNDER REPURCHASE AGREEMENTS..................... 22
13. DERIVATIVE FINANCIAL INSTRUMENTS .... 23
14. DUE FROM OTHER BANKS, INCLUDING PLEDGED UNDER REPURCHASE AGREEMENTS .............................................. 24
15. LOANS AND ADVANCES TO CUSTOMERS, INCLUDING PLEDGED UNDER REPURCHASE AGREEMENTS ....... 24
16. INVESTMENT FINANCIAL ASSETS, INCLUDING PLEDGED UNDER REPURCHASE AGREEMENTS ..................... 27
17. INVESTMENTS IN ASSOCIATES AND JOINT VENTURES ......................................... 28
18. DISPOSAL GROUPS HELD FOR SALE ........ 29
19. DUE TO OTHER BANKS ............................... 29
20. CUSTOMER DEPOSITS ................................ 29
21. OTHER BORROWED FUNDS ....................... 30
22. DEBT SECURITIES ISSUED ......................... 30
23. OTHER RESERVES ...................................... 30
24. DIVIDENDS, AMOUNTS PAID UNDER PERPETUAL LOAN PARTICIPATION NOTES AND OTHER DISTRIBUTIONS ........ 31

VTB BANK SELECTED NOTES TO THE INTERIM CONDENSED CONSOLIDATED FINANCIAL STATEMENTS 30 JUNE 2016 (CONTINUED)
11
3. ANALYSIS BY SEGMENT
In accordance with IFRS 8, Operating Segments, the Group has defined five reportable segments.
• Corporate-Investment banking (CIB).
• Mid-Corporate banking (MCB).
• Retail business (RB).
• Treasury.
• Other business. The Group has also separately disclosed its Corporate Centre. The composition of reportable segments is approved by resolutions of VTB Group’s Management Committee, the body that on a regular basis assesses performance of reportable segments and allocates resources to them.
As at 30 June 2016, the Group’s reportable segments and their compositions remained as disclosed in the consolidated financial statements as at 31 December 2015 except for the changes described below.
During the six-month period ended 30 June 2016, the Group reallocated certain operations between Loans and Deposits and Transaction Banking product lines within CIB and MCB reportable segments including operations with term deposits, issued securities, factoring and overdrafts. As a result, segment information for the six-month period ended 30 June 2016 and 2015 is not presented on a comparable basis because the necessary information was not readily available and the cost to develop it would have been excessive.
VTB BANK SELECTED NOTES TO THE INTERIM CONDENSED CONSOLIDATED FINANCIAL STATEMENTS 30 JUNE 2016 (CONTINUED)
12
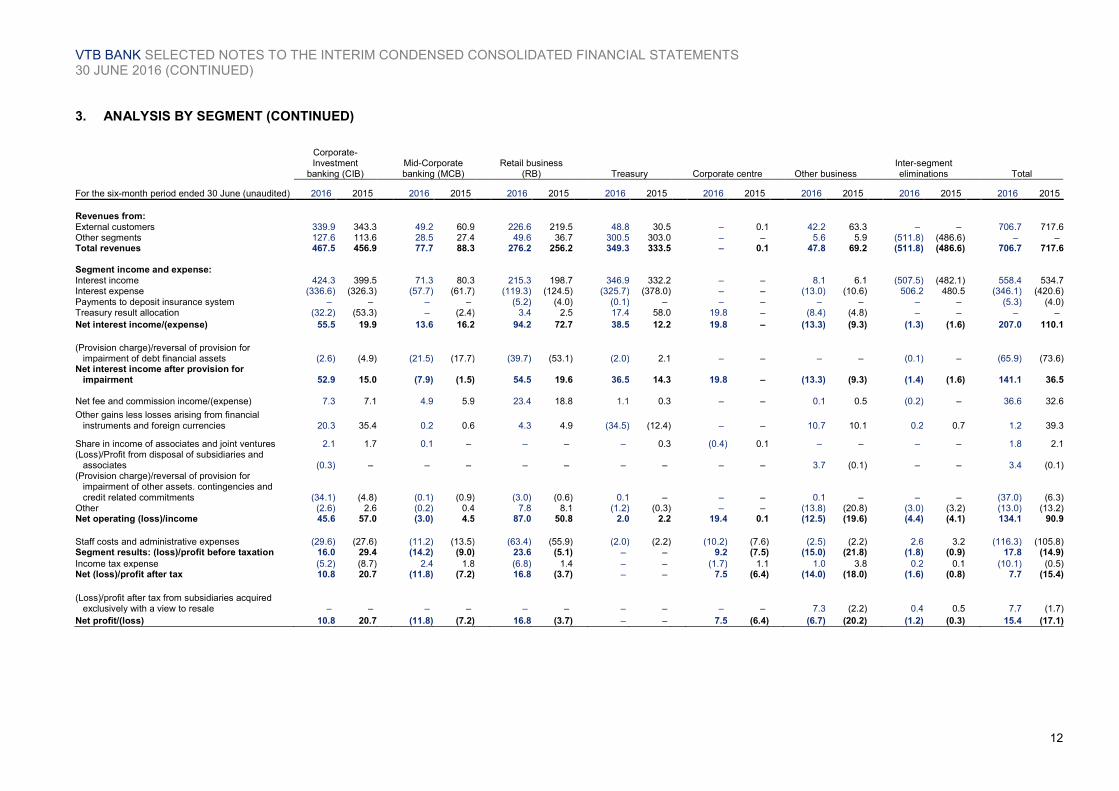
3. ANALYSIS BY SEGMENT (CONTINUED)
Corporate-Investment
banking (CIB) Mid-Corporate banking (MCB)
Retail business (RB) Treasury Corporate centre Other business
Inter-segment eliminations Total
For the six-month period ended 30 June (unaudited) 2016 2015 2016 2015 2016 2015 2016 2015 2016 2015 2016 2015 2016 2015 2016 2015
Revenues from: External customers 339.9 343.3 49.2 60.9 226.6 219.5 48.8 30.5 – 0.1 42.2 63.3 – – 706.7 717.6Other segments 127.6 113.6 28.5 27.4 49.6 36.7 300.5 303.0 – – 5.6 5.9 (511.8) (486.6) – – Total revenues 467.5 456.9 77.7 88.3 276.2 256.2 349.3 333.5 – 0.1 47.8 69.2 (511.8) (486.6) 706.7 717.6 Segment income and expense: Interest income 424.3 399.5 71.3 80.3 215.3 198.7 346.9 332.2 – – 8.1 6.1 (507.5) (482.1) 558.4 534.7Interest expense (336.6) (326.3) (57.7) (61.7) (119.3) (124.5) (325.7) (378.0) – – (13.0) (10.6) 506.2 480.5 (346.1) (420.6)Payments to deposit insurance system – – – – (5.2) (4.0) (0.1) – – – – – – – (5.3) (4.0)Treasury result allocation (32.2) (53.3) – (2.4) 3.4 2.5 17.4 58.0 19.8 – (8.4) (4.8) – – – –
Net interest income/(expense) 55.5 19.9 13.6 16.2 94.2 72.7 38.5 12.2 19.8 – (13.3) (9.3) (1.3) (1.6) 207.0 110.1
(Provision charge)/reversal of provision for
impairment of debt financial assets (2.6) (4.9) (21.5) (17.7) (39.7) (53.1) (2.0) 2.1 – – – – (0.1) – (65.9) (73.6)Net interest income after provision for
impairment 52.9 15.0 (7.9) (1.5) 54.5 19.6 36.5 14.3 19.8 – (13.3) (9.3) (1.4) (1.6) 141.1 36.5 Net fee and commission income/(expense) 7.3 7.1 4.9 5.9 23.4 18.8 1.1 0.3 – – 0.1 0.5 (0.2) – 36.6 32.6
Other gains less losses arising from financial instruments and foreign currencies 20.3 35.4 0.2 0.6 4.3 4.9 (34.5) (12.4) – – 10.7 10.1 0.2 0.7 1.2 39.3
Share in income of associates and joint ventures 2.1 1.7 0.1 – – – – 0.3 (0.4) 0.1 – – – – 1.8 2.1(Loss)/Profit from disposal of subsidiaries and
associates (0.3) – – – – – – – – – 3.7 (0.1) – – 3.4 (0.1)(Provision charge)/reversal of provision for
impairment of other assets. contingencies and credit related commitments (34.1) (4.8) (0.1) (0.9) (3.0) (0.6) 0.1 – – – 0.1 – – – (37.0) (6.3)
Other (2.6) 2.6 (0.2) 0.4 7.8 8.1 (1.2) (0.3) – – (13.8) (20.8) (3.0) (3.2) (13.0) (13.2)Net operating (loss)/income 45.6 57.0 (3.0) 4.5 87.0 50.8 2.0 2.2 19.4 0.1 (12.5) (19.6) (4.4) (4.1) 134.1 90.9
Staff costs and administrative expenses (29.6) (27.6) (11.2) (13.5) (63.4) (55.9) (2.0) (2.2) (10.2) (7.6) (2.5) (2.2) 2.6 3.2 (116.3) (105.8)Segment results: (loss)/profit before taxation 16.0 29.4 (14.2) (9.0) 23.6 (5.1) – – 9.2 (7.5) (15.0) (21.8) (1.8) (0.9) 17.8 (14.9)
Income tax expense (5.2) (8.7) 2.4 1.8 (6.8) 1.4 – – (1.7) 1.1 1.0 3.8 0.2 0.1 (10.1) (0.5)Net (loss)/profit after tax 10.8 20.7 (11.8) (7.2) 16.8 (3.7) – – 7.5 (6.4) (14.0) (18.0) (1.6) (0.8) 7.7 (15.4)
(Loss)/profit after tax from subsidiaries acquired exclusively with a view to resale – – – – – – – – – – 7.3 (2.2) 0.4 0.5 7.7 (1.7)
Net profit/(loss) 10.8 20.7 (11.8) (7.2) 16.8 (3.7) – – 7.5 (6.4) (6.7) (20.2) (1.2) (0.3) 15.4 (17.1)

VTB BANK SELECTED NOTES TO THE INTERIM CONDENSED CONSOLIDATED FINANCIAL STATEMENTS 30 JUNE 2016 (CONTINUED)
13
3. ANALYSIS BY SEGMENT (CONTINUED)
Corporate-Investment
banking (CIB) Mid-Corporate banking
(MCB) Retail business (RB) Treasury Corporate centre Other business Inter-segment eliminations Total
30 June 2016
(unaudited) 31 December
2015
30 June 2016
(unaudited) 31 December
2015
30 June 2016
(unaudited) 31 December
2015
30 June 2016
(unaudited) 31 December
2015
30 June 2016
(unaudited) 31 December
2015
30 June 2016
(unaudited) 31 December
2015
30 June 2016
(unaudited) 31 December
2015
30 June 2016
(unaudited) 31 December
2015
Cash and short-term funds 33.9 39.9 – 1.1 207.7 153.8 319.6 375.4 – – 2.4 0.5 – – 563.6 570.7
Mandatory cash balances with central banks – – – – 17.8 16.6 59.1 54.2 – – – – – – 76.9 70.8
Due from other banks. including pledged under repurchase agreements 311.2 312.8 – – 112.1 122.6 448.2 901.2 – – 25.4 21.6 – – 896.9 1,358.2
Loans and advances to customers. including pledged under repurchase agreements 5,388.0 6,139.5 644.4 711.5 2,028.5 1,971.5 602.7 606.0 – – 9.3 9.0 – – 8,672.9 9,437.5
Other financial instruments 522.1 587.6 2.1 2.6 81.0 55.1 186.0 216.6 – – 99.6 104.3 – – 890.8 966.2 Investments in associates and
joint ventures 68.1 70.2 0.3 0.3 – – 8.0 8.8 19.0 24.2 0.1 0.8 – – 95.5 104.3 Other assets items 447.9 431.9 90.0 83.9 140.1 181.2 14.6 11.3 – – 444.3 425.9 – – 1,136.9 1,134.2 Net amount of intersegment
settlements – – 77.0 – 1,210.3 1,288.4 1,184.4 2,244.2 – – – – (2,471.7) (3,532.6) – – Segment assets 6,771.2 7,581.9 813.8 799.4 3,797.5 3,789.2 2,822.6 4,417.7 19.0 24.2 581.1 562.1 (2,471.7) (3,532.6) 12,333.5 13,641.9
Due to other banks 106.6 79.4 3.0 0.5 17.6 26.4 666.4 1,117.6 – – 1.1 0.1 – – 794.7 1,224.0
Customer deposits 3,441.7 3,212.3 695.0 589.7 3,323.1 3,280.3 395.8 178.0 – – 3.5 6.7 – – 7,859.1 7,267.0 Other borrowed funds 149.4 120.3 – – 18.6 20.2 713.1 1,971.8 – – 8.4 9.2 – – 889.5 2,121.5 Debt securities issued 24.4 29.2 10.2 34.4 38.2 50.8 382.7 507.5 – – – 1.6 – – 455.5 623.5 Subordinated debt – – – – 2.2 2.1 236.4 260.7 – – – – – – 238.6 262.8 Other liabilities items 339.4 386.1 8.1 7.8 100.8 82.2 43.3 11.9 – – 206.9 201.0 – – 698.5 689.0 Net amount of intersegment
settlements 2,130.9 3,082.5 – 69.9 – – – – – – 340.8 380.2 (2,471.7) (3,532.6) – – Segment liabilities 6,192.4 6,909.8 716.3 702.3 3,500.5 3,462.0 2,437.7 4,047.5 – – 560.7 598.8 (2,471.7) (3,532.6) 10,935.9 12,187.8
Net profit / (loss) after tax by segment for the six-month period ended 30 June
10.8 -11.8
16.8
7.5 -6.7
-1.2 15.4
2016
20.7 -7.2
-3.7-6.4
-20.2
-0.3
-17.12015
RBMCBCIB Corporate
center
Other
business
Inter-segment
eliminations
Total
55%
6%
21%
13%
5%
30 June 2016
CIB
MCB
RB
Treasury
Other
37%
7%32%
22%
2%
30 June 2016
CIB
MCB
RB
Treasury
Other
Segment assets Segment liabilities

VTB BANK SELECTED NOTES TO THE INTERIM CONDENSED CONSOLIDATED FINANCIAL STATEMENTS 30 JUNE 2016 (CONTINUED)
14
3. ANALYSIS BY SEGMENT (CONTINUED)
Corporate-Investment banking (CIB) by product lines
Investment
banking Loans and deposits
Transaction banking
Inter-CIB eliminations
Total CIB
For the six-month period ended 30 June (unaudited) 2016 2015 2016 2015 2016 2015 2016 2015 2016 2015
Revenues from:
External customers 106.9 113.2 221.7 224.0 11.3 6.1 – – 339.9 343.3Other segments 79.3 68.7 4.9 27.4 43.6 17.7 (0.2) (0.2) 127.6 113.6Total revenues 186.2 181.9 226.6 251.4 54.9 23.8 (0.2) (0.2) 467.5 456.9 Segment income and expense Interest income 160.9 142.0 215.1 240.1 48.4 17.5 (0.1) (0.1) 424.3 399.5Interest expense (123.3) (120.3) (179.2) (201.6) (34.2) (4.5) 0.1 0.1 (336.6) (326.3)Treasury result allocation (2.1) (2.3) (30.0) (51.0) (0.1) – – – (32.2) (53.3)Net interest income 35.5 19.4 5.9 (12.5) 14.1 13.0 – – 55.5 19.9 (Provision charge)/reversal of
provision for impairment of debt financial assets (1.8) (1.0) (0.6) (3.9) (0.2) – – – (2.6) (4.9)
Net interest income after provision for impairment 33.7 18.4 5.3 (16.4) 13.9 13.0 – – 52.9 15.0
Net fee and commission
income/(expense) 1.0 0.9 0.3 0.2 6.0 6.0 – – 7.3 7.1Other gains less losses arising from
financial instruments and foreign currencies 20.7 32.3 (0.4) 3.1 – – – – 20.3 35.4
Share in income of associates and joint ventures 1.7 1.3 0.4 0.4 – – – – 2.1 1.7
(Loss)/Profit from disposal of subsidiaries and associates (0.3) – – – – – – – (0.3) –
(Provision charge)/reversal of provision for impairment of other assets. contingencies and credit related commitments 0.7 (0.5) (29.3) 0.6 (5.5) (4.9) – – (34.1) (4.8)
Other (0.3) (0.1) (2.1) 2.6 (0.2) 0.1 – – (2.6) 2.6Net operating income/(expense) 57.2 52.3 (25.8) (9.5) 14.2 14.2 – – 45.6 57.0 Staff costs and administrative
expenses (15.9) (15.1) (8.6) (8.2) (5.1) (4.3) – – (29.6) (27.6)Segment results: (loss)/profit
before taxation 41.3 37.2 (34.4) (17.7) 9.1 9.9 – – 16.0 29.4 Income tax expense (9.7) (7.5) 6.3 0.7 (1.8) (1.9) – – (5.2) (8.7)Net profit/(loss) after tax 31.6 29.7 (28.1) (17.0) 7.3 8.0 – – 10.8 20.7Net profit/(loss) 31.6 29.7 (28.1) (17.0) 7.3 8.0 – – 10.8 20.7
Net operating income before provisions for the six-month period ended 30 June:
structure (CIB)
Net operating income and administrative expenses for the six-month period ended 30 June:
dynamics (CIB)
82.3
66.7
29.6 27.6
2016 2015
Net operatingincome beforeprovisions
Staff costs andadministrativeexpenses
66%
9%
24%
1%Net interest income
Net fee andcommissionincome/(expense)
Other gains lesslosses arising fromfinancial instrumentsand foreigncurrencies
Other income
30%
11%53%
6%
2016 2015

VTB BANK SELECTED NOTES TO THE INTERIM CONDENSED CONSOLIDATED FINANCIAL STATEMENTS 30 JUNE 2016 (CONTINUED)
15
3. ANALYSIS BY SEGMENT (CONTINUED)
Corporate-Investment banking (CIB) by product lines
Investment banking Loans and deposits Transaction banking Inter-CIB eliminations Total CIB
30 June 2016
(unaudited) 31 December
2015
30 June 2016
(unaudited) 31 December
2015
30 June 2016
(unaudited) 31 December
2015
30 June 2016
(unaudited) 31 December
2015
30 June 2016
(unaudited) 31 December
2015
Cash and short-term funds 33.3 39.6 0.6 0.3 – – – – 33.9 39.9
Due from other banks. including pledged under repurchase agreements 180.7 167.8 130.5 145.0 – – – – 311.2 312.8
Loans and advances to customers. including pledged under repurchase agreements 1,142.6 1,921.2 4,169.2 4,218.3 76.2 – – – 5,388.0 6,139.5
Other financial instruments 511.0 576.8 11.1 10.8 – – – – 522.1 587.6
Investments in associates and joint ventures 68.1 70.2 – – – – – – 68.1 70.2
Other assets items 124.0 99.3 292.8 309.2 31.1 23.4 – – 447.9 431.9 Net amount of
intersegment settlements 486.5 48.9 – – 1,439.9 674.0 (1,926.4) (722.9) – –
Segment assets 2,546.2 2,923.8 4,604.2 4,683.6 1,547.2 697.4 (1,926.4) (722.9) 6,771.2 7,581.9
Due to other banks 90.6 67.4 15.9 12.0 0.1 – – – 106.6 79.4 Customer deposits 1,974.0 2,204.8 4.7 371.1 1,463.0 636.4 – – 3,441.7 3,212.3 Other borrowed funds 2.6 3.1 146.8 117.2 – – – – 149.4 120.3 Debt securities issued 18.8 24.4 0.4 4.8 5.2 – – – 24.4 29.2 Other liabilities items 268.4 353.8 47.2 19.9 23.8 12.4 – – 339.4 386.1 Net amount of
intersegment settlements – – 4,057.3 3,805.4 – – (1,926.4) (722.9) 2,130.9 3,082.5
Segment liabilities 2,354.4 2,653.5 4,272.3 4,330.4 1,492.1 648.8 (1,926.4) (722.9) 6,192.4 6,909.8
Mid-Corporate banking (MCB) by product lines
Investment banking Loans and deposits Transaction banking Total MCB
For the six-month period ended 30 June (unaudited) 2016 2015 2016 2015 2016 2015 2016 2015
Revenues from:
External customers 0.5 0.7 43.2 53.3 5.5 6.9 49.2 60.9Other segments – – – 20.2 28.5 7.2 28.5 27.4Total revenues 0.5 0.7 43.2 73.5 34.0 14.1 77.7 88.3 Segment income and expense Interest income 0.1 0.2 42.5 72.9 28.7 7.2 71.3 80.3Interest expense (0.1) (0.2) (36.6) (60.8) (21.0) (0.7) (57.7) (61.7)Treasury result allocation – – 0.3 (2.4) (0.3) – – (2.4)Net interest income – – 6.2 9.7 7.4 6.5 13.6 16.2(Provision charge)/reversal of provision for
impairment of debt financial assets – – (21.5) (17.7) – – (21.5) (17.7)Net interest income after provision for
impairment – – (15.3) (8.0) 7.4 6.5 (7.9) (1.5) Net fee and commission income/(expense) – – 0.1 0.1 4.8 5.8 4.9 5.9Other gains less losses arising from financial
instruments and foreign currencies 0.2 0.5 – 0.1 – – 0.2 0.6
Share in income of associates and joint ventures – – 0.1 – – – 0.1 – (Provision charge)/reversal of provision for
impairment of other assets. contingencies and credit related commitments – – 0.2 – (0.3) (0.9) (0.1) (0.9)
Other – – – 0.2 (0.2) 0.2 (0.2) 0.4Net operating income/(expense) 0.2 0.5 (14.9) (7.6) 11.7 11.6 (3.0) 4.5 Staff costs and administrative expenses – – (5.8) (7.6) (5.4) (5.9) (11.2) (13.5)Segment results: (loss)/profit before taxation 0.2 0.5 (20.7) (15.2) 6.3 5.7 (14.2) (9.0)
Income tax expense – (0.1) 3.7 3.1 (1.3) (1.2) 2.4 1.8Net (loss)/profit after tax 0.2 0.4 (17.0) (12.1) 5.0 4.5 (11.8) (7.2)Net (loss)/profit 0.2 0.4 (17.0) (12.1) 5.0 4.5 (11.8) (7.2)

VTB BANK SELECTED NOTES TO THE INTERIM CONDENSED CONSOLIDATED FINANCIAL STATEMENTS 30 JUNE 2016 (CONTINUED)
16
3. ANALYSIS BY SEGMENT (CONTINUED)
Mid-Corporate banking (MCB) by product lines
Investment banking Loans and deposits Transaction banking Inter-MCB eliminations Total MCB
30 June 2016
(unaudited) 31 December
2015
30 June 2016
(unaudited) 31 December
2015
30 June 2016
(unaudited) 31 December
2015
30 June 2016
(unaudited) 31 December
2015
30 June 2016
(unaudited) 31 December
2015
Cash and short-term funds – – – – – 1.1 – – – 1.1
Loans and advances to customers. including pledged under repurchase agreements 0.7 0.5 642.3 711.0 1.4 – – – 644.4 711.5
Other financial instruments 1.9 2.4 0.2 0.2 – – – – 2.1 2.6
Investments in associates and joint ventures – – 0.3 0.3 – – – – 0.3 0.3
Other assets items 0.2 0.1 56.8 58.4 33.0 25.4 – – 90.0 83.9 Net amount of
intersegment settlements – – – – 694.2 212.2 (617.2) (212.2) 77.0 –
Segment assets 2.8 3.0 699.6 769.9 728.6 238.7
(617.2) (212.2) 813.8 799.4
Due to other banks – – 1.8 0.5 1.2 – – – 3.0 0.5 Customer deposits 0.1 0.2 0.6 371.6 694.3 217.9 – – 695.0 589.7 Debt securities issued – – – 34.4 10.2 – – – 10.2 34.4 Other liabilities items – – 2.3 2.3 5.8 5.5 – – 8.1 7.8 Net amount of
intersegment settlements 2.2 2.1 615.0 280.0 – – (617.2) (212.2) – 69.9
Segment liabilities 2.3 2.3 619.7 688.8 711.5 223.4
(617.2) (212.2) 716.3 702.3
Net operating income before provisions for the six-month period ended 30 June:
structure (MCB)
Net operating income and administrative expenses for the six-month period ended 30 June:
dynamics (MCB)
18.6
23.1
11.2
13.5
2016 2015
Net operatingincome beforeprovisions
Staff costs andadministrativeexpenses
72%
26%
1%1%Net interest income
Net fee andcommissionincome/(expense)
Other gains lesslosses arising fromfinancial instrumentsand foreigncurrencies
Other income
70%
25%
3%2%
2016 2015

VTB BANK SELECTED NOTES TO THE INTERIM CONDENSED CONSOLIDATED FINANCIAL STATEMENTS 30 JUNE 2016 (CONTINUED)
17
3. ANALYSIS BY SEGMENT (CONTINUED) Retail business (RB) by product lines
Retail banking Insurance Inter-RB eliminations Total RB
For the six-month period ended 30 June (unaudited) 2016 2015 2016 2015 2016 2015 2016 2015
Revenues from:
External customers 203.6 195.8 23.0 23.7 – – 226.6 219.5Other segments 51.8 35.6 2.0 2.4 (4.2) (1.3) 49.6 36.7Total revenues 255.4 231.4 25.0 26.1 (4.2) (1.3) 276.2 256.2 Segment income and expense Interest income 213.1 197.3 2.6 2.0 (0.4) (0.6) 215.3 198.7Interest expense (119.4) (124.9) – – 0.1 0.4 (119.3) (124.5)Payments to deposit insurance system (5.2) (4.0) – – – – (5.2) (4.0)Treasury result allocation 3.4 2.5 – – – – 3.4 2.5Net interest income 91.9 70.9 2.6 2.0 (0.3) (0.2) 94.2 72.7 (Provision charge)/reversal of provision for
impairment of debt financial assets (39.3) (52.8) – – (0.4) (0.3) (39.7) (53.1)Net interest income after provision for
impairment 52.6 18.1 2.6 2.0 (0.7) (0.5) 54.5 19.6 Net fee and commission income/(expense) 26.5 19.2 (0.2) (0.1) (2.9) (0.3) 23.4 18.8Other gains less losses arising from financial
instruments and foreign currencies 4.4 4.0 (0.1) 0.9 – – 4.3 4.9Provision charge for impairment of other assets,
contingencies and credit related commitments (2.7) (0.3) (0.3) (0.3) – – (3.0) (0.6)Other (2.6) 0.5 9.0 6.8 1.4 0.8 7.8 8.1Net operating income/(expense) 78.2 41.5 11.0 9.3 (2.2) – 87.0 50.8 Staff costs and administrative expenses (59.7) (52.8) (3.5) (3.2) (0.2) 0.1 (63.4) (55.9)Segment results: (loss)/profit before taxation 18.5 (11.3) 7.5 6.1 (2.4) 0.1 23.6 (5.1) Income tax expense (5.4) 2.1 (1.9) (0.7) 0.5 – (6.8) 1.4Net profit/(loss) after tax 13.1 (9.2) 5.6 5.4 (1.9) 0.1 16.8 (3.7)Net profit/(loss) 13.1 (9.2) 5.6 5.4 (1.9) 0.1 16.8 (3.7)
Net operating income before provisions for the six-month period ended 30 June:
structure (RB)
Net operating income and administrative expenses for the six-month period ended 30 June:
dynamics (RB)
129.7
104.5
63.4 55.9
2016 2015
Net operatingincome beforeprovisions
Staff costs andadministrativeexpenses
73%
18%
3%6%
Net interest income
Net fee andcommissionincome/(expense)
Other gains lesslosses arising fromfinancial instrumentsand foreigncurrencies
Other income
69%
18%
5%
8%
2016 2015

VTB BANK SELECTED NOTES TO THE INTERIM CONDENSED CONSOLIDATED FINANCIAL STATEMENTS 30 JUNE 2016 (CONTINUED)
18
3. ANALYSIS BY SEGMENT (CONTINUED)
Retail business (RB) by product lines
Retail banking Insurance Inter-RB eliminations Total RB
30 June 2016
(unaudited) 31 December
2015
30 June 2016
(unaudited) 31 December
2015
30 June 2016
(unaudited) 31 December
2015
30 June 2016
(unaudited) 31 December
2015
Cash and short-term funds 207.6 153.2 0.1 0.6 – – 207.7 153.8 Mandatory cash balances with central banks 17.8 16.6 – – – – 17.8 16.6 Due from other banks. including pledged
under repurchase agreements 81.7 98.2 30.4 24.4 – – 112.1 122.6 Loans and advances to customers. including
pledged under repurchase agreements 2,028.5 1,971.5 – – – – 2,028.5 1,971.5 Other financial instruments 66.3 43.7 14.7 11.4 – – 81.0 55.1 Other assets items 120.9 159.4 19.2 21.8 – – 140.1 181.2 Net amount of intersegment settlements 1,191.1 1,275.9 19.2 12.5 – – 1,210.3 1,288.4 Segment assets 3,713.9 3,718.5 83.6 70.7 – – 3,797.5 3,789.2
Due to other banks 17.6 26.4 – – – – 17.6 26.4 Customer deposits 3,323.1 3,280.3 – – – – 3,323.1 3,280.3 Other borrowed funds 18.6 20.2 – – – – 18.6 20.2 Debt securities issued 38.2 50.8 – – – – 38.2 50.8 Subordinated debt 2.2 2.1 – – – – 2.2 2.1 Other liabilities items 36.0 28.8 64.8 53.4 – – 100.8 82.2 Segment liabilities 3,435.7 3,408.6 64.8 53.4 – – 3,500.5 3,462.0
Other business
Construction and development Other
Inter–Other eliminations
Total Other business
For the six–month period ended 30 June
(unaudited) 2016 2015 2016 2015 2016 2015 2016 2015
Revenues from:
External customers 8.7 4.9 33.5 58.4 – – 42.2 63.3Other segments 1.5 1.6 4.3 4.4 (0.2) (0.1) 5.6 5.9Total revenues 10.2 6.5 37.8 62.8 (0.2) (0.1) 47.8 69.2 Segment income and expense Interest income 1.5 1.6 6.8 4.6 (0.2) (0.1) 8.1 6.1Interest expense (8.9) (6.8) (4.3) (3.9) 0.2 0.1 (13.0) (10.6)Treasury result allocation – – (8.4) (4.8) – – (8.4) (4.8)Net interest income (7.4) (5.2) (5.9) (4.1) – – (13.3) (9.3)Net interest income after provision for
impairment (7.4) (5.2) (5.9) (4.1) – – (13.3) (9.3) Net fee and commission income/(expense) – – 0.1 0.5 – – 0.1 0.5Other gains less losses arising from financial
instruments and foreign currencies 3.9 4.6 6.8 5.5 – – 10.7 10.1(Loss)/Profit from disposal of subsidiaries and
associates – – 3.7 (0.1) – – 3.7 (0.1)Provision charge for impairment of other assets,
contingencies and credit related commitments – – 0.1 – – – 0.1 – Other (4.3) (16.8) (9.5) (4.0) – – (13.8) (20.8)Net operating income/(expense) (7.8) (17.4) (4.7) (2.2) – – (12.5) (19.6) Staff costs and administrative expenses (0.1) (0.2) (2.4) (2.0) – – (2.5) (2.2)Segment results: (loss)/profit before taxation (7.9) (17.6) (7.1) (4.2) – – (15.0) (21.8) Income tax expense (0.7) 3.0 1.7 0.8 – – 1.0 3.8Net (loss)/profit after tax (8.6) (14.6) (5.4) (3.4) – – (14.0) (18.0) (Loss)/profit after tax from subsidiaries acquired
exclusively with a view to resale – – 7.3 (2.2) – – 7.3 (2.2)Net loss (8.6) (14.6) 1.9 (5.6) – – (6.7) (20.2)

VTB BANK SELECTED NOTES TO THE INTERIM CONDENSED CONSOLIDATED FINANCIAL STATEMENTS 30 JUNE 2016 (CONTINUED)
19
3. ANALYSIS BY SEGMENT (CONTINUED) Other business
Construction and
development Other Inter–Other eliminations
Total Other business
30 June 2016
(unaudited) 31 December
2015
30 June 2016
(unaudited) 31 December
2015
30 June 2016
(unaudited) 31 December
2015
30 June 2016
(unaudited) 31 December
2015
Cash and short–term funds 0.2 0.2 2.2 0.3 – – 2.4 0.5 Due from other banks. including pledged
under repurchase agreements – – 25.4 21.6 – – 25.4 21.6 Loans and advances to customers. including
pledged under repurchase agreements 1.0 0.6 8.3 8.4 – – 9.3 9.0 Other financial instruments – – 99.6 104.3 – – 99.6 104.3 Investments in associates and joint ventures – – 0.1 0.8 – – 0.1 0.8 Other assets items 325.3 316.4 119.0 109.5 – – 444.3 425.9 Segment assets 326.5 317.2 254.6 244.9 – – 581.1 562.1
Due to other banks 1.0 – 0.1 0.1 – – 1.1 0.1 Customer deposits – – 3.5 6.7 – – 3.5 6.7 Other borrowed funds 2.9 3.2 5.5 6.0 – – 8.4 9.2 Debt securities issued – – – 1.6 – – – 1.6 Other liabilities items 71.5 68.9 135.4 132.1 – – 206.9 201.0 Net amount of intersegment settlements 282.6 277.5 58.2 102.7 – – 340.8 380.2 Segment liabilities 358.0 349.6 202.7 249.2 – – 560.7 598.8
4. INTEREST INCOME AND EXPENSE
For the three-month period ended 30 June (unaudited)
For the six-month period ended 30 June (unaudited)
2016 2015 2016 2015
Interest income Loans and advances to customers 250.3 240.9 511.0 493.4 Due from other banks 14.0 13.3 26.1 24.9 Other financial assets, including securities 5.2 3.5 11.0 4.9 Financial assets not at fair value through profit or loss 269.5 257.7 548.1 523.2 Financial assets at fair value through profit or loss 5.0 4.5 10.3 11.5 Total interest income 274.5 262.2 558.4 534.7
Interest expense Customer deposits (119.0) (104.0) (233.9) (214.1) Due to other banks and other borrowed funds (30.7) (72.5) (83.3) (166.6) Debt securities issued (8.0) (12.3) (17.6) (27.7) Subordinated debt (5.6) (5.7) (11.3) (12.2) Total interest expense (163.3) (194.5) (346.1) (420.6)
Payments to deposit insurance system (2.5) (2.0) (5.3) (4.0)
Net interest income 108.7 65.7 207.0 110.1
5. NET FEE AND COMMISSION INCOME
For the three-month period ended 30 June (unaudited)
For the six-month period ended 30 June (unaudited)
2016 2015 2016 2015
Commission on settlement transactions 14.7 12.8 28.8 24.8 Commission on guarantees issued and trade finance 2.8 3.6 5.7 7.5 Commission on cash transactions 2.8 1.3 4.5 2.5 Agents' fee received for insurance products distribution and other
services 2.9 2.0 4.3 3.5 Commission on operations with securities and capital markets 1.8 1.2 3.1 2.2 Other 1.0 0.8 3.1 1.7 Total fee and commission income 26.0 21.7 49.5 42.2
Commission on settlement transactions (4.7) (3.1) (8.9) (6.4) Commission on cash transactions (0.7) (0.7) (1.3) (1.4) Other (1.4) (0.7) (2.7) (1.8) Total fee and commission expense (6.8) (4.5) (12.9) (9.6)
Net fee and commission income 19.2 17.2 36.6 32.6

VTB BANK SELECTED NOTES TO THE INTERIM CONDENSED CONSOLIDATED FINANCIAL STATEMENTS 30 JUNE 2016 (CONTINUED)
20
6. GAINS NET OF LOSSES ARISING FROM FINANCIAL INSTRUMENTS AT FAIR VALUE THROUGH PROFIT OR LOSS
For the three-month period ended 30 June (unaudited)
For the six-month period ended 30 June (unaudited)
2016 2015 2016 2015
Gains net of losses arising from trading financial instruments 6.3 0.9 13.1 18.2 Gains net of losses/(losses net of gains) arising from financial
instruments designated as at fair value through profit or loss 0.9 0.5 0.5 (1.1) (Losses net of gains) / gains net of losses from associates and joint-
ventures designated as at fair value through profit or loss (1.2) 0.6 (1.7) 1.4 Total gains net of losses arising from financial instruments at
fair value through profit or loss 6.0 2.0 11.9 18.5
7. (LOSSES NET OF GAINS) / GAINS NET OF LOSSES ARISING FROM FOREIGN CURRENCIES
For the three-month period ended 30 June (unaudited)
For the six-month period ended 30 June (unaudited)
2016 2015 2016 2015
Losses net of gains arising from dealing in foreign currencies (53.6) (20.5) (166.9) (12.9) Foreign exchange translation gains net of losses 46.4 24.2 151.3 34.3 Total (losses net of gains)/gains net of losses arising from
foreign currencies (7.2) 3.7 (15.6) 21.4
Losses net of gains arising from dealing in foreign currencies represent foreign currency trading results and changes in value of foreign currency derivative positions, including those economically hedging net foreign currency positions.
8. STAFF COSTS AND ADMINISTRATIVE EXPENSES
For the three-month period ended 30 June (unaudited)
For the six-month period ended 30 June (unaudited)
2016 2015 2016 2015
Staff costs 32.5 29.2 67.8 60.3 Defined contribution pension expense 2.8 3.1 7.7 7.2
Depreciation and other expenses related to premises and
equipment 4.9 5.2 9.5 10.2 Leasing and rent expenses 3.0 3.0 6.1 6.2 Amortization and other expenses related to intangibles, except for
amortization of core deposit and customer loan intangible 2.7 1.6 5.3 3.3 Advertising expenses 2.3 1.6 4.2 3.4 Taxes other than on income 1.2 1.1 2.9 2.6 Charity 1.2 0.9 2.9 1.6 Amortization of core deposit and customer loan intangible 1.1 1.2 2.3 2.4 Post and telecommunication expenses 1.1 1.3 2.3 2.4 Professional services 1.2 1.3 2.2 2.8 Security expenses 0.4 1.0 0.9 1.9 Transport expenses 0.1 0.2 0.3 0.5 Insurance costs – – 0.1 0.1 Other 1.2 0.5 1.8 0.9 Total staff costs and administrative expenses 55.7 51.2 116.3 105.8
For the three-month and six-month periods ended 30 June 2016, the cost of sales and other expenses from other non-banking activities included staff costs of RUR 1.9 billion and RUR 3.7 billion, respectively, and depreciation and amortisation related to premises, equipment and intangible assets of RUR 0.8 billion and RUR 1.6 billion,
respectively (for the three-month and six-month periods ended 30 June 2015: staff costs of RUR 2.1 billion and RUR 4.2 billion, respectively, and depreciation and amortisation related to premises, equipment and intangible assets of RUR 1.1 billion and RUR 2.0 billion, respectively).

VTB BANK SELECTED NOTES TO THE INTERIM CONDENSED CONSOLIDATED FINANCIAL STATEMENTS 30 JUNE 2016 (CONTINUED)
21
9. ALLOWANCE FOR IMPAIRMENT OF OTHER ASSETS The movements in allowances for impairment of other assets accounted at amortised cost were as follows: 1 January 2015 3.6 Provision for impairment during the period 0.8 Write-offs (0.4) Effect of translation (0.1) 30 June 2015 (unaudited) 3.9 1 January 2016 4.8 Provision for impairment during the period 0.2 Write-offs (0.6) Recoveries of amounts written-off in previous period 0.1 Effect of translation (0.1) 30 June 2016 (unaudited) 4.4
10. INCOME TAX Income tax expense comprises the following:
For the three-month period ended 30 June (unaudited)
For the six-month period ended 30 June (unaudited)
2016 2015 2016 2015
Current tax expense 5.5 3.8 11.1 7.1 Deferred income tax benefit due to the origination
and reversal of temporary differences (0.6) (2.0) (1.0) (6.6) Income tax expense for the period 4.9 1.8 10.1 0.5
The Group's effective income tax rate for the six-month ended 30 June 2016 was 56.7% (for the six-month ended 30 June 2015: (3.4%)). The effective income tax rate for the six-month ended 30 June 2016 differs from the theoretical tax rate mainly due to non-deductible expenses. The following tables provide disclosure of income tax effects relating to each component of other comprehensive income/(loss) for the three and six months ended 30 June 2016 and 2015: For the three-month period ended 30 June (unaudited)
2016 2015
Before tax
Tax (expense)/
recovery Net of tax Before tax
Tax (expense)/
recovery Net of tax
Net result on financial assets
available-for-sale (2.8) 0.6 (2.2) (0.2) – (0.2) Cash flow hedges (0.7) - (0.7) 0.2 – 0.2 Share of other comprehensive loss
of associates and joint ventures (0.7) - (0.7) (1.0) – (1.0) Effect of translation (9.3) - (9.3) (4.7) 0.6 (4.1) Actuarial (losses net of gains) / gains net of losses arising from difference between pension plan assets and obligations (1.2) - (1.2) 0.2 – 0.2 Land and premises revaluation - - - (0.1) – (0.1) Other comprehensive (loss)/
income (14.7) 0.6 (14.1) (5.6) 0.6 (5.0)
For the six-month period ended 30 June (unaudited)
2016 2015
Before tax
Tax (expense)/
recovery Net of tax Before tax
Tax (expense)/
recovery Net of tax
Net result on financial assets
available-for-sale 2.5 (0.6) 1.9 6.6 (1.1) 5.5 Cash flow hedges (0.7) - (0.7) (0.1) – (0.1) Share of other comprehensive loss
of associates and joint ventures (1.8) - (1.8) (0.6) – (0.6) Effect of translation (22.2) 0.5 (21.7) (13.1) – (13.1) Actuarial (losses net of gains) / gains net of losses arising from difference between pension plan assets and obligations (1.2) - (1.2) 0.2 – 0.2 Other comprehensive (loss)/
income (23.4) (0.1) (23.5) (7.0) (1.1) (8.1)

VTB BANK SELECTED NOTES TO THE INTERIM CONDENSED CONSOLIDATED FINANCIAL STATEMENTS 30 JUNE 2016 (CONTINUED)
22
11. CASH AND SHORT-TERM FUNDS
30 June 2016
(unaudited) 31 December 2015
Cash on hand 130.8 145.5 Cash balances (other than mandatory) with central banks 315.5 297.8 Correspondent accounts with other banks - Russia 78.3 51.8 - OECD 32.6 60.9 - Other countries 6.4 14.7 Total correspondent accounts with other banks 117.3 127.4 Total cash and short-term funds 563.6 570.7
Less: correspondent accounts in precious metals (5.3) (6.2) Less: restricted cash (1.9) (2.9) Total cash and cash equivalents 556.4 561.6
12. NON-DERIVATIVE FINANCIAL ASSETS AT FAIR VALUE THROUGH PROFIT OR LOSS, INCLUDING PLEDGED UNDER REPURCHASE AGREEMENTS
30 June 2016
(unaudited) 31 December 2015
Financial assets held for trading, including pledged under repurchase agreements 267.8 267.5 Financial assets designated as at fair value through profit or loss 37.5 40.6 Total non-derivative financial assets at fair value through profit or loss,
including pledged under repurchase agreements 305.3 308.1
Financial assets held for trading, including pledged under repurchase agreements
30 June 2016
(unaudited) 31 December 2015
Financial assets held for trading Debt securities
- Bonds and eurobonds of Russian companies and banks 103.0 77.3 - Bonds and eurobonds of the Russian Federation 43.7 22.3 - Bonds and eurobonds of foreign governments 28.3 35.9 - Bonds and eurobonds of foreign companies and banks 16.6 37.5 - Russian municipal bonds 7.7 11.5
Total debt securities 199.3 184.5 Equity securities 5.2 5.5 Trading credit products 4.0 6.5 Total financial assets held for trading 208.5 196.5 Financial assets held for trading, pledged under repurchase agreements Debt securities
- Bonds and eurobonds of Russian companies and banks 47.8 49.5 - Bonds and eurobonds of the Russian Federation 8.4 19.9 - Bonds and eurobonds of foreign governments 2.3 –
Total debt securities 58.5 69.4 Equity securities 0.8 1.6 Total financial assets held for trading, pledged under repurchase agreements 59.3 71.0 Total financial assets held for trading, including pledged under repurchase
agreements 267.8 267.5
As at 30 June 2016, the bonds and eurobonds of Russian companies and banks are mostly those issued by banks and companies from the railway transportation and finance sectors; equity securities are mostly represented by foreign insurance and oil companies. Financial assets designated as at fair value through profit or loss
30 June 2016
(unaudited) 31 December 2015
Reverse sale and repurchase agreements to maturity 21.0 24.2 Equity securities 15.7 16.4 Debt securities
- Bonds and eurobonds of foreign companies 0.8 – Total debt securities 0.8 – Total financial assets designated as at fair value through profit or loss 37.5 40.6
As at 30 June 2016, most of the equity securities were issued by Russian retail and finance companies.

VTB BANK SELECTED NOTES TO THE INTERIM CONDENSED CONSOLIDATED FINANCIAL STATEMENTS 30 JUNE 2016 (CONTINUED)
23
13. DERIVATIVE FINANCIAL INSTRUMENTS Foreign exchange and other financial instruments are generally traded in an over-the-counter market with professional market counterparties on standardized contractual terms and conditions. The table below includes derivative contracts outstanding: 30 June 2016 (unaudited) 31 December 2015
Positive fair value Negative fair value Positive fair value Negative fair value
Derivative financial assets and liabilities at fair
value through profit or loss held for trading Foreign exchange and precious metals contracts
forwards 3.8 (3.9) 4.9 (5.1) futures 2.3 (1.7) 1.3 (7.2) swaps 5.4 (9.4) 6.2 (12.4) options 2.6 (4.2) 11.3 (14.2)
Contracts with securities
forward sale of equity securities 18.1 – 19.4 – forward sale of debt securities 0.1 – – – options 3.2 (1.9) 9.2 (7.0) swaps – – 1.7 –
Interest rate contracts
single currency interest rate swaps 36.0 (32.6) 28.3 (24.8) cross currency interest rate swaps 137.3 (129.6) 197.9 (196.2) swaptions 0.1 (0.1) – – cap/floor – (0.5) – (0.4) interest rate futures 0.1 – – –
Contracts with other basic variables
CDS protection sold 1.6 (8.1) 2.5 (2.0) CDS protection purchased 0.3 (0.9) 1.3 (1.4) futures on indexes – (0.1) – (0.3) options on indexes 2.8 (2.2) 2.0 (1.9) commodity swaps 2.4 (1.4) 0.1 (0.1) commodity futures 0.1 (1.0) 0.1 (0.1) commodity options 6.4 (5.2) 7.0 (6.8) commodity forwards 1.0 (0.5) – –
Embedded derivatives on structured instruments
embedded foreign exchange derivatives 7.6 (2.8) 11.4 (4.0) embedded derivatives on credit risk – – 0.2 –
Total derivative financial assets and liabilities at
fair value through profit or loss held for trading 231.2 (206.1) 304.8 (283.9)
Derivative financial assets and liabilities
designated as hedging instruments Derivatives held as fair value hedges
interest rate swaps – (0.8) – – Derivatives held as cash flow hedges
foreign exchange swaps – (0.4) – (0.1) foreign exchange forwards – (0.3) – (0.1)
Total derivative financial assets and liabilities designated as hedging instruments – (1.5) – (0.2)
Total derivative financial assets and liabilities 231.2 (207.6) 304.8 (284.1)

VTB BANK SELECTED NOTES TO THE INTERIM CONDENSED CONSOLIDATED FINANCIAL STATEMENTS 30 JUNE 2016 (CONTINUED)
24
14. DUE FROM OTHER BANKS, INCLUDING PLEDGED UNDER REPURCHASE AGREEMENTS
30 June 2016
(unaudited) 31 December 2015
Due from other banks
- Russia 438.1 428.6 - OECD 139.2 196.2 - Other countries 307.6 731.5
Total gross due from other banks 884.9 1,356.3 Less: Allowance for impairment (2.3) (3.1) Total net due from other banks 882.6 1,353.2 Due from other banks pledged under repurchase agreements
- Russia 14.3 5.0 Total gross due from other banks, pledged under repurchase agreements 14.3 5.0 Total due from other banks, including pledged under repurchase agreements 896.9 1,358.2
The movements in allowances for impairment of due from other banks, including pledged under repurchase agreements, by classes were as follows:
Russia OECD Other Total
1 January 2015 1.5 0.1 2.6 4.2 Reversal of provision for impairment during the
period – – (0.6) (0.6) Effect of translation (0.1) – 0.2 0.1 30 June 2015 (unaudited) 1.4 0.1 2.2 3.7 1 January 2016 1.8 0.1 1.2 3.1 Effect of translation – – (0.8) (0.8) 30 June 2016 (unaudited) 1.8 0.1 0.4 2.3
15. LOANS AND ADVANCES TO CUSTOMERS, INCLUDING PLEDGED UNDER REPURCHASE AGREEMENTS
30 June 2016
(unaudited) 31 December 2015
Loans to legal entities
- Current activity financing 5,109.4 5,339.3 - Project finance and other 1,610.3 1,629.9 - Finance leases 263.3 261.0 - Reverse sale and repurchase agreements 157.5 309.5
Total gross loans to legal entities 7,140.5 7,539.7 Less: Allowance for loans to legal entities impairment (485.4) (478.8) Net loans to legal entities 6,655.1 7,060.9
Loans to individuals
- Mortgages 921.6 875.1 - Consumer loans and other 895.6 857.3 - Credit cards 129.4 124.1 - Car loans 90.1 100.2 - Reverse sale and repurchase agreements 6.2 3.3
Total gross loans to individuals 2,042.9 1,960.0 Less: Allowance for loans to individuals impairment (203.9) (193.2) Net loans to individuals 1,839.0 1,766.8
Loans and advances to customers pledged under repurchase agreements
- Current activity financing 179.1 610.3 Total gross loans and advances to customers pledged under repurchase
agreements 179.1 610.3 Less: Allowance for loans pledged under REPO impairment (0.3) (0.5) Net loans and advances pledged under repurchase agreements 178.8 609.8
Total loans and advances to customers, including pledged under repurchase agreements 8,672.9 9,437.5

VTB BANK SELECTED NOTES TO THE INTERIM CONDENSED CONSOLIDATED FINANCIAL STATEMENTS 30 JUNE 2016 (CONTINUED)
25
15. LOANS AND ADVANCES TO CUSTOMERS, INCLUDING PLEDGED UNDER REPURCHASE AGREEMENTS (CONTINUED)
Finance leases represent loans to leasing companies and net investment in leases. As at 30 June 2016, included in gross loans are finance lease receivables of RUR 162.8 billion (31 December 2015: RUR 178.5 billion), equal to the net investment in lease before allowance for impairment. As at 30 June 2016, the total amount of outstanding loans issued by the Group to 10 largest groups of interrelated borrowers comprises RUR 2,064.6 billion, or 22.1% of the gross loan portfolio, including loans pledged under repurchase agreements (31 December 2015: RUR 2,439.1 billion or 24.1%).
As at 30 June, the gross amount of non-performing loans which the Group defines as impaired loans with repayments overdue by over 90 days was RUR 663.6 billion or 7.1% of the aggregate of the gross loan portfolio, including loans pledged under repurchase agreements (31 December 2015: RUR 635.4 billion, or 6.3%). At 30 June 2016, as a result of debt settlement during the first quarter 2016 the Group recognised RUR 35.1 billion of premises, RUR 2.1 billion of investment property and RUR 9.1 billion of other assets and recorded an impairment of RUR 2.9 billion of the other assets in Other operating expenses and an impairment of RUR 0.2 billion of the premises in impairment of land, premises and intangible assets other than goodwill.
Economic sector risk concentrations within the customer loan portfolio are as follows:
30 June 2016 (unaudited) 31 December 2015
Amount % Amount %
Individuals 2,042.9 21.8 1,960.0 19.4 Building construction 977.0 10.4 1,007.8 10.0 Manufacturing 865.3 9.2 888.5 8.8 Government bodies 815.4 8.7 884.3 8.7 Metals 812.4 8.7 1,217.6 12.0 Oil and Gas 797.0 8.5 900.5 8.9 Trade and commerce 475.3 5.1 540.4 5.3 Transport 472.0 5.0 402.5 4.0 Energy 464.3 5.0 387.9 3.8 Finance 434.5 4.6 509.9 5.0 Chemical 433.1 4.6 634.9 6.3 Telecommunications and media 286.7 3.1 243.0 2.4 Food and agriculture 196.0 2.1 200.1 2.0 Coal mining 160.8 1.7 187.1 1.9 Aircraft 11.1 0.1 12.3 0.1 Other 118.7 1.4 133.2 1.4 Total gross loans and advances to customers,
including pledged under repurchase agreements 9,362.5 100.0 10,110.0 100.0
Finance industry includes loans issued to holding companies of industrial groups, mergers and acquisitions financing, and loans to leasing, insurance and other non-bank financial companies.
VTB BANK SELECTED NOTES TO THE INTERIM CONDENSED CONSOLIDATED FINANCIAL STATEMENTS 30 JUNE 2016 (CONTINUED)
26
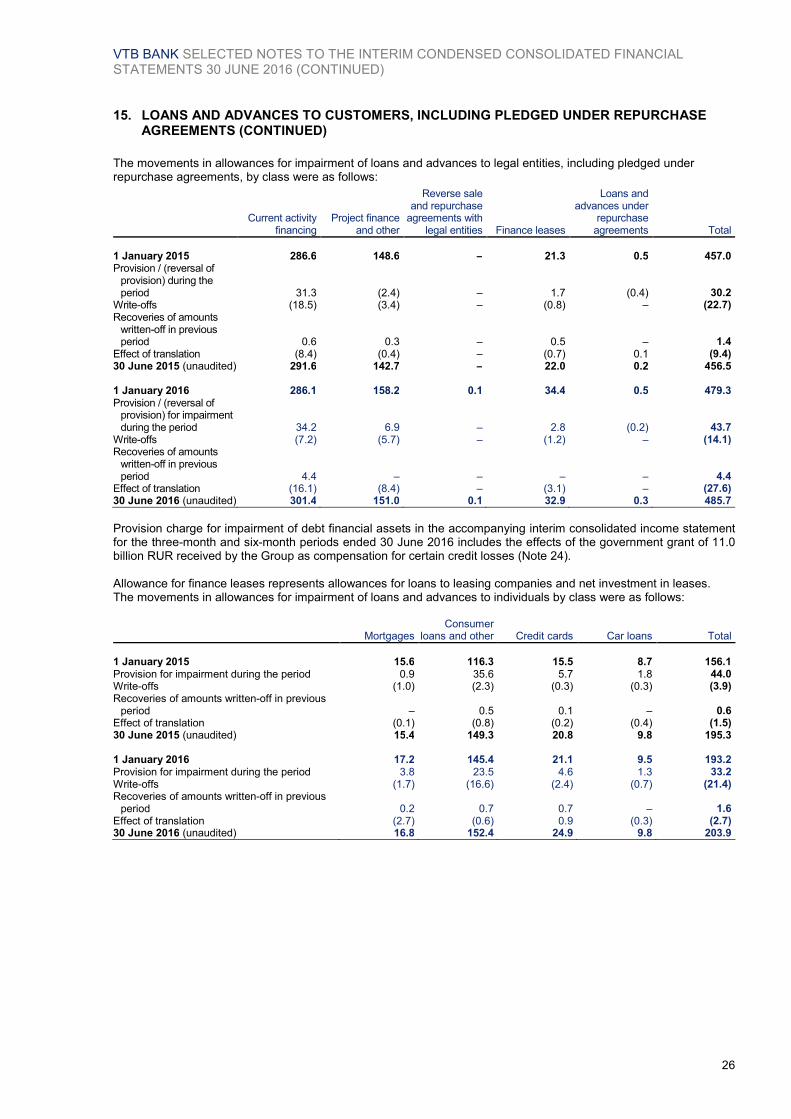
15. LOANS AND ADVANCES TO CUSTOMERS, INCLUDING PLEDGED UNDER REPURCHASE AGREEMENTS (CONTINUED)
The movements in allowances for impairment of loans and advances to legal entities, including pledged under repurchase agreements, by class were as follows:
Current activity
financing Project finance
and other
Reverse sale and repurchase
agreements with legal entities Finance leases
Loans and advances under
repurchase agreements Total
1 January 2015 286.6 148.6 – 21.3 0.5 457.0 Provision / (reversal of
provision) during the period 31.3 (2.4) – 1.7 (0.4) 30.2
Write-offs (18.5) (3.4) – (0.8) – (22.7) Recoveries of amounts
written-off in previous period 0.6 0.3 – 0.5 – 1.4
Effect of translation (8.4) (0.4) – (0.7) 0.1 (9.4) 30 June 2015 (unaudited) 291.6 142.7 – 22.0 0.2 456.5 1 January 2016 286.1 158.2 0.1 34.4 0.5 479.3 Provision / (reversal of
provision) for impairment during the period 34.2 6.9 – 2.8 (0.2) 43.7
Write-offs (7.2) (5.7) – (1.2) – (14.1) Recoveries of amounts
written-off in previous period 4.4 – – – – 4.4
Effect of translation (16.1) (8.4) – (3.1) – (27.6) 30 June 2016 (unaudited) 301.4 151.0 0.1 32.9 0.3 485.7
Provision charge for impairment of debt financial assets in the accompanying interim consolidated income statement for the three-month and six-month periods ended 30 June 2016 includes the effects of the government grant of 11.0 billion RUR received by the Group as compensation for certain credit losses (Note 24). Allowance for finance leases represents allowances for loans to leasing companies and net investment in leases. The movements in allowances for impairment of loans and advances to individuals by class were as follows:
Mortgages Consumer
loans and other Credit cards Car loans Total
1 January 2015 15.6 116.3 15.5 8.7 156.1 Provision for impairment during the period 0.9 35.6 5.7 1.8 44.0 Write-offs (1.0) (2.3) (0.3) (0.3) (3.9) Recoveries of amounts written-off in previous
period – 0.5 0.1 – 0.6 Effect of translation (0.1) (0.8) (0.2) (0.4) (1.5) 30 June 2015 (unaudited) 15.4 149.3 20.8 9.8 195.3 1 January 2016 17.2 145.4 21.1 9.5 193.2 Provision for impairment during the period 3.8 23.5 4.6 1.3 33.2 Write-offs (1.7) (16.6) (2.4) (0.7) (21.4) Recoveries of amounts written-off in previous
period 0.2 0.7 0.7 – 1.6 Effect of translation (2.7) (0.6) 0.9 (0.3) (2.7) 30 June 2016 (unaudited) 16.8 152.4 24.9 9.8 203.9

VTB BANK SELECTED NOTES TO THE INTERIM CONDENSED CONSOLIDATED FINANCIAL STATEMENTS 30 JUNE 2016 (CONTINUED)
27
16. INVESTMENT FINANCIAL ASSETS, INCLUDING PLEDGED UNDER REPURCHASE AGREEMENTS
30 June 2016
(unaudited) 31 December 2015
Investment financial assets available-for-sale, including pledged under repurchase
agreements 202.5 210.7 Investment financial assets held-to-maturity, including pledged under repurchase
agreements 151.8 142.6 Total investment financial assets, including pledged under repurchase
agreements 354.3 353.3
Investment financial assets available-for-sale, including pledged under repurchase agreements
30 June 2016
(unaudited) 31 December 2015
Investment financial assets available-for-sale Debt securities
- Bonds and eurobonds of foreign governments 63.9 81.3 - Bonds and eurobonds of the Russian Federation 60.8 25.8 - Bonds and eurobonds of Russian companies and banks 16.9 20.3 - Bonds and eurobonds of foreign companies and banks 16.1 16.6 - Russian municipal bonds 2.0 2.2 - Promissory notes of Russian companies and banks 0.2 0.2
Total debt securities 159.9 146.4 Equity securities 37.8 43.7 Total investment financial assets available-for-sale 197.7 190.1 Investment financial assets available-for-sale, pledged under repurchase
agreements Debt securities
- Bonds and eurobonds of foreign governments 3.2 2.6 - Bonds and eurobonds of Russian companies and banks 1.5 5.2 - Bonds and eurobonds of foreign companies and banks 0.1 0.3 - Bonds and eurobonds of the Russian Federation – 12.5
Total debt securities 4.8 20.6 Total investments financial assets available-for-sale, pledged under
repurchase agreements 4.8 20.6 Total investment financial assets available-for-sale, including pledged under
repurchase agreements 202.5 210.7
As of 30 June 2016, the bonds and eurobonds of foreign governments are mostly those issued by the German and USA governments and municipal bodies. As at 30 June 2016, the bonds and eurobonds of Russian companies and banks are mostly those issued by companies from the oil, manufacturing and metal sectors; equity securities are mostly the shares of Russian energy and metal companies.
During six-month period ended 30 June 2016, the Group recognized reversal of impairment loss of RUR 2.0 billion before tax, and realised portion of positive revaluation of financial assets available-for-sale transferred to income statement due to the sale of financial assets available-for-sale at gain of RUR 1.2 billion before tax (six-month period ended 30 June 2015: RUR 3.1 billion of impairment and RUR 3.5 billion of positive revaluation respectively).

VTB BANK SELECTED NOTES TO THE INTERIM CONDENSED CONSOLIDATED FINANCIAL STATEMENTS 30 JUNE 2016 (CONTINUED)
28
16. INVESTMENT FINANCIAL ASSETS, INCLUDING PLEDGED UNDER REPURCHASE AGREEMENTS (CONTINUED)
Reclassifications
During six-month period ended 30 June 2016 the Group reclassified certain financial assets that met the definition of loans and receivables out of investment financial assets available-for-sale category to due from other banks. The Group considered holding these investments for the foreseeable future or till maturity, due to lower market liquidity and reduced price transparency as well as positive outlook
for the issuers’ credit risk. The effective interest rate on the reclassified financial assets as determined on the reclassification date ranged from 6.4% to 6.8%. As at the date of reclassification the Group expected to recover the estimated cash flows of RUR 13.0 billion, of which the amount of RUR 2.4 billion were redeemed during six-month period ended 30 June 2016.
Due from other banks
Fair value as at the date of reclassification 12.4 Carrying amount as at 30 June 2016 8.4 Fair value as at 30 June 2016 8.4 Loss recognized after reclassification in other comprehensive income for the six-month period ended
30 June 2016 (1.2) Loss recognized after reclassification in profit or loss for the six-month period ended 30 June 2016 (0.5)
Investment financial assets held-to-maturity, including pledged under repurchase agreements
30 June 2016
(unaudited) 31 December 2015
Investment financial assets held-to-maturity
- Bonds and eurobonds of the Russian Federation 80.5 16.0 - Bonds and eurobonds of Russian companies and banks 59.0 52.7 - Bonds and eurobonds of foreign governments 0.5 0.4 - Bonds and eurobonds of foreign companies and banks 0.4 0.2
Total gross investment financial assets held-to-maturity 140.4 69.3 Less: Allowance for impairment (0.1) (0.1) Total net investment financial assets held-to-maturity 140.3 69.2 Investment financial assets held-to-maturity, pledged under repurchase
agreements - Bonds and eurobonds of Russian companies and banks 11.5 8.5 - Bonds and eurobonds of the Russian Federation – 64.9
Total gross investment financial assets held-to-maturity, pledged under repurchase agreements 11.5 73.4
Total net investment financial assets held-to-maturity, pledged under repurchase agreements 11.5 73.4
Total investment financial assets held-to-maturity, including pledged under
repurchase agreements 151.8 142.6
As at 30 June 2016, the bonds and eurobonds of Russian companies and banks are mostly those issued by companies from the oil and gas sectors.
17. INVESTMENTS IN ASSOCIATES AND JOINT VENTURES
30 June 2016
(unaudited) 31 December 2015
Investments in associates and joint ventures designated as at fair value through profit or loss 61.8 63.5
Investments in associates and joint ventures accounted under equity method 33.7 40.8 Total investments in associates and joint ventures 95.5 104.3
In February 2016 Bank of Moscow, OJSC sold 49.0% of shares in associated entity “Perovskoe”, OJSC to a third party for the total consideration of RUR 0.7 billion with no gain or loss recognized.
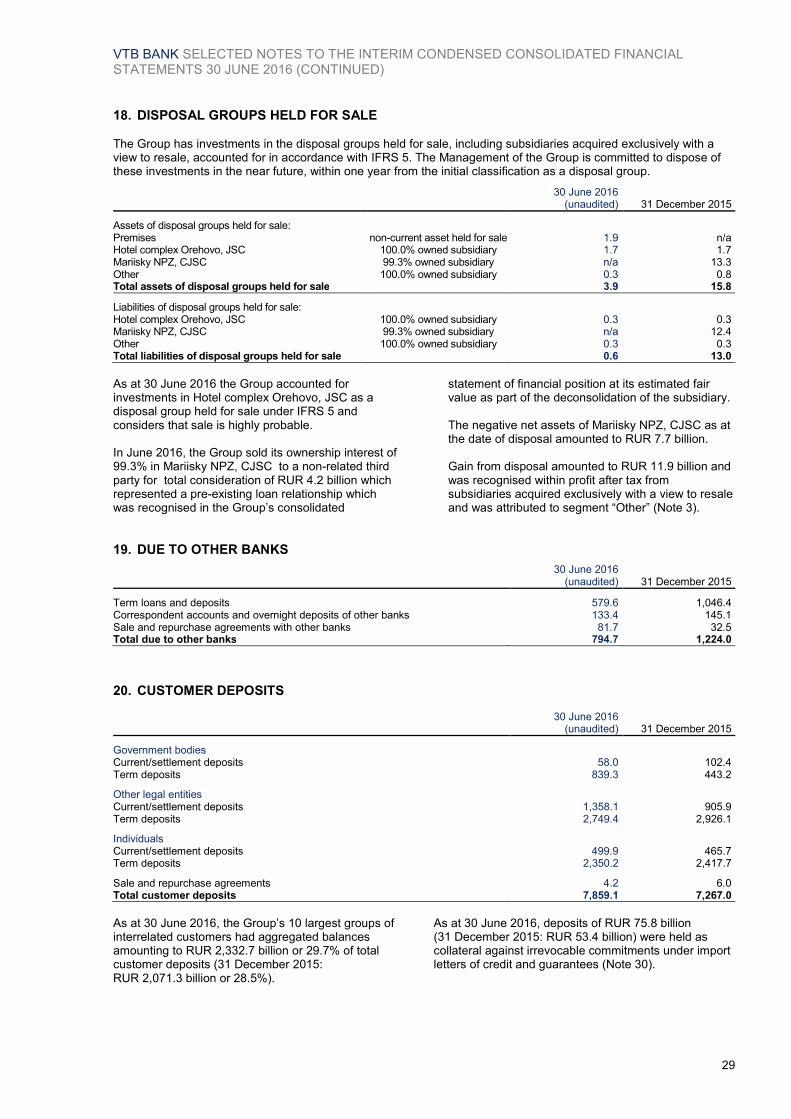
VTB BANK SELECTED NOTES TO THE INTERIM CONDENSED CONSOLIDATED FINANCIAL STATEMENTS 30 JUNE 2016 (CONTINUED)
29
18. DISPOSAL GROUPS HELD FOR SALE The Group has investments in the disposal groups held for sale, including subsidiaries acquired exclusively with a view to resale, accounted for in accordance with IFRS 5. The Management of the Group is committed to dispose of these investments in the near future, within one year from the initial classification as a disposal group.
30 June 2016
(unaudited) 31 December 2015
Assets of disposal groups held for sale: Premises non-current asset held for sale 1.9 n/a Hotel complex Orehovo, JSC 100.0% owned subsidiary 1.7 1.7 Mariisky NPZ, CJSC 99.3% owned subsidiary n/a 13.3 Other 100.0% owned subsidiary 0.3 0.8 Total assets of disposal groups held for sale 3.9 15.8
Liabilities of disposal groups held for sale: Hotel complex Orehovo, JSC 100.0% owned subsidiary 0.3 0.3 Mariisky NPZ, CJSC 99.3% owned subsidiary n/a 12.4 Other 100.0% owned subsidiary 0.3 0.3 Total liabilities of disposal groups held for sale 0.6 13.0
As at 30 June 2016 the Group accounted for investments in Hotel complex Orehovo, JSC as a disposal group held for sale under IFRS 5 and considers that sale is highly probable. In June 2016, the Group sold its ownership interest of 99.3% in Mariisky NPZ, CJSC to a non-related third party for total consideration of RUR 4.2 billion which represented a pre-existing loan relationship which was recognised in the Group’s consolidated
statement of financial position at its estimated fair value as part of the deconsolidation of the subsidiary. The negative net assets of Mariisky NPZ, CJSC as at the date of disposal amounted to RUR 7.7 billion. Gain from disposal amounted to RUR 11.9 billion and was recognised within profit after tax from subsidiaries acquired exclusively with a view to resale and was attributed to segment “Other” (Note 3).
19. DUE TO OTHER BANKS
30 June 2016
(unaudited) 31 December 2015
Term loans and deposits 579.6 1,046.4 Correspondent accounts and overnight deposits of other banks 133.4 145.1 Sale and repurchase agreements with other banks 81.7 32.5 Total due to other banks 794.7 1,224.0
20. CUSTOMER DEPOSITS
30 June 2016
(unaudited) 31 December 2015
Government bodies Current/settlement deposits 58.0 102.4 Term deposits 839.3 443.2
Other legal entities Current/settlement deposits 1,358.1 905.9 Term deposits 2,749.4 2,926.1
Individuals Current/settlement deposits 499.9 465.7 Term deposits 2,350.2 2,417.7
Sale and repurchase agreements 4.2 6.0 Total customer deposits 7,859.1 7,267.0
As at 30 June 2016, the Group’s 10 largest groups of interrelated customers had aggregated balances amounting to RUR 2,332.7 billion or 29.7% of total customer deposits (31 December 2015: RUR 2,071.3 billion or 28.5%).
As at 30 June 2016, deposits of RUR 75.8 billion (31 December 2015: RUR 53.4 billion) were held as collateral against irrevocable commitments under import letters of credit and guarantees (Note 30).

VTB BANK SELECTED NOTES TO THE INTERIM CONDENSED CONSOLIDATED FINANCIAL STATEMENTS 30 JUNE 2016 (CONTINUED)
30
21. OTHER BORROWED FUNDS
30 June 2016 (unaudited) 31 December 2015
Funds from local central banks: 625.7 1,751.6 - Term deposits from local central banks 423.8 946.6 - Sale and Repurchase Agreements 201.9 805.0
Syndicated loans 19.1 156.8 Other borrowings 244.7 213.1 Total other borrowed funds 889.5 2,121.5
As at 30 June 2016, the carrying amount of the DIA deposit amounted to RUR 77.9 billion (31 December 2015: RUR 73.7 billion) and was included in Other Borrowings. The contractual amount of the deposit was RUR 269.0 billion as at 30 June 2016 (31 December 2015: RUR 269.4 billion). The deposit was collateralized by loans and advances to customers with the carrying amount of RUR 53.5 billion and direct debit mandate on cash balance with CBR as at 30 June 2016 (31 December 2015: RUR 119.2 billion).
In April 2016, the Group redeemed a syndicated loan of USD 2.0 billion with a floating rate of LIBOR plus 1.5% p.a. upon maturity. As at redemption date the carrying amount of the syndicated loan was RUR 132.9 billion. As at 30 June 2016, funds from local central banks contain the amount of RUR 405.9 billion (31 December 2015: RUR 929.0 billion) secured by pledged loans to customers in the amount of RUR 600.9 billion (31 December 2015: RUR 1,070.9 billion).
22. DEBT SECURITIES ISSUED
30 June 2016
(unaudited) 31 December 2015
Bonds 382.6 479.5 Promissory notes 56.1 126.4 Deposit certificates 16.8 17.6 Total debt securities issued 455.5 623.5
The bonds represent eurobonds issued mostly under EMTN and ECP programs and local bonds issued by VTB and other Group members with the carrying amounts at the end of the reporting periods as follows:
Rates, p.a. Maturity 30 June 2016
(unaudited)
31 December 2015
USD Eurobonds (EMTN) 6.00% to 6.88% 2017-2035 270.8 307.8 Local bonds 3.00% to 24.00% 2016-2046 61.9 98.9 CHF Eurobonds (EMTN) 2.90% to 3.15% 2016-2018 30.0 34.2 Other Eurobonds 2.25% to 7.50% 2016-2017 19.9 38.6 Total bonds 382.6 479.5
Promissory notes represent notes primarily issued in the local market as an alternative to customer/bank deposits. As at 30 June 2016 promissory notes issued included both discount and interest bearing promissory notes denominated mainly in RUR with maturity ranging from demand to December 2044 (31 December 2015: from demand to December 2044).
23. OTHER RESERVES Movements in other reserves were as follows:
Unrealised gain / (loss) on financial assets available-for-sale and cash
flow hedge
Land and premises
revaluation reserve
Currency translation difference Total
1 January 2015 (18.7) 17.2 44.3 42.8 Total comprehensive income/(loss) for the period 5.5 (0.1) (13.6) (8.2) Transfer of premises revaluation reserve upon
disposal or depreciation – (0.1) – (0.1) 30 June 2015 (unaudited) (13.2) 17.0 30.7 34.5
1 January 2016 (5.3) 22.2 55.3 72.2 Total comprehensive income/(loss) for the period 1.3 – (23.0) (21.7) Transfer of premises revaluation reserve upon
disposal or depreciation – (0.7) – (0.7) 30 June 2016 (unaudited) (4.0) 21.5 32.3 49.8

VTB BANK SELECTED NOTES TO THE INTERIM CONDENSED CONSOLIDATED FINANCIAL STATEMENTS 30 JUNE 2016 (CONTINUED)
31
24. DIVIDENDS, AMOUNTS PAID UNDER PERPETUAL LOAN PARTICIPATION NOTES AND OTHER DISTRIBUTIONS
In June 2016, Annual General Meeting of VTB shareholders declared dividends for ordinary shares in the total amount of RUR 15.2 billion for 2015 (RUR 0.00117 per ordinary share); for preference shares in the total amount of RUR 0.1 billion (RUR 0.0000042 per preference share) and for Type A preference shares in the total amount of RUR 17.8 billion (RUR 0.0058 per Type A preference share). Dividends declared were paid in July-August 2016. In June 2015, Annual General Meeting of VTB shareholders declared dividends for ordinary shares in the total amount of RUR 15.2 billion for 2014 (RUR 0.00117 per ordinary share) and for preference shares in the total amount of RUR 2.8 billion (RUR 0.00013 per preference share). Dividends declared were paid in July-August 2015.
Under the revised terms of the Perpetual Loan Participation Notes, the Group’s coupon payment for the next coupon period no longer becomes mandatory when the dividends on ordinary shares are declared or paid within six months prior to the coupon payment date, and accordingly, coupon amounts due under Perpetual Loan Participation Notes are recorded on their payment dates in June and December of each year, subject to VTB’s decision to make such payments.
Other distributions represent a deemed profit distribution of RUR 11.0 billion to the majority shareholder of the Bank. Management determined that the dividends on the preference shares for 2015 were reduced by RUR 11.0 billion which represented, in substance, a government grant compensating the Bank for current period and prior period credit losses on certain corporate loans which were subject to a pre-existing arrangement between the Bank and several government agencies. The government grant was recognised as an offset to credit losses in the line item Provision charge for impairment of debt financial assets in the accompanying interim consolidated statement of income for the three-month period ended 30 June 2016. The deemed distribution and the related government grant had no net effect on the retained earnings or total equity of the Bank at 30 June 2016.

VTB BANK SELECTED NOTES TO THE INTERIM CONDENSED CONSOLIDATED FINANCIAL STATEMENTS 30 JUNE 2016 (CONTINUED)
32
RISK
25. OPERATING ENVIRONMENT OF THE GROUP<<<<<<<<<<<<<<<<<<<<<<<........... 33
26. FAIR VALUE OF FINANCIAL INSTRUMENTS<<<<<<<.<<<<<<<<<<<<<<<<<..<<. 34
27. CAPITAL MANAGEMENT AND CAPITAL ADEQUACY<<<<<<<<..<<<<<<<<<<<<.......... 45

VTB BANK SELECTED NOTES TO THE INTERIM CONDENSED CONSOLIDATED FINANCIAL STATEMENTS 30 JUNE 2016 (CONTINUED)
33
25. OPERATING ENVIRONMENT OF THE GROUP
The Russian Federation The majority of the Group’s operations are conducted in the Russian Federation (Russia). The Russian Federation displays certain characteristics of an emerging market. Its economy is particularly sensitive to oil and gas prices. The legal, tax and regulatory frameworks continue to develop and are subject to frequent changes and varying interpretations. Since 2014 the Russian economy has been negatively impacted by a decline in oil prices and ongoing political tension in the region and international sanctions against certain Russian companies and individuals. During the six-month period ended 30 June 2016, the following were the key changes in select macro-economic indicators:
• the CBR exchange rate appreciated from RUR 72.8827 to RUR 64.2575 per USD;
• the CBR key interest rate decreased from 11.0% p.a. to 10.5% p.a.;
• the RTS stock exchange index increased from 757.0 to 930.8.
These tendencies may have a further significant impact on the Group’s future operations and financial position, the effect of which is difficult to predict. The future economic and regulatory situation and its impact on the Group’s operations may differ from management’s current expectations. Also, factors, including contraction of real incomes of households, reduced corporate liquidity and profitability and increased corporate and personal insolvencies, may affect the Group’s borrowers’ ability to repay the amounts due to the Group. In addition, adverse changes in economic conditions may result in deterioration in the value of collateral held against loans and other obligations. To the extent that information is available, the Group has reflected revised estimates of expected future cash flows in its impairment assessment. Ukraine In 2014 and 2015, the economic and political situation in Ukraine deteriorated significantly. As a result, Ukraine has experienced a fall in gross domestic product, a significant negative balance of payments and a sharp reduction in foreign currency reserves. The National Bank of Ukraine imposed certain restrictions on foreign currency operations. Restrictions have also been introduced for certain cross-border settlements, including payments of dividends. International rating agencies have downgraded sovereign debt ratings for Ukraine. Although the situation has largely stabilized by now, the GDP dynamics has stabilized and the monetary restrictions are being gradually phased out, they still
shaped the operating environment in early 2016 to a considerable degree. As at 30 June 2016 and 31 December 2015, the Group’s investments in Ukrainian sovereign and municipal securities as well as loans to Ukrainian government fully or majority owned enterprises amounted to less than 0.1% of the Group’s total assets. The Group continues to monitor the situation in Ukraine and take appropriate actions in order to minimize the effects of these risks. The risk assessment is reviewed constantly to reflect the current situation. The combination of the above events has resulted in a tighter credit conditions and deterioration of asset quality. Further significant negative developments in Ukraine could adversely impact the results and financial position of the Group and of the Group's Ukrainian subsidiaries in a manner not currently determinable. Other jurisdictions
In addition to Russia, the Group conducts operations in Belarus, Kazakhstan, Azerbaijan, Armenia and Georgia, certain European countries (Austria, Germany, France, Great Britain and Serbia) and several other countries. Difficult economic and financial market situation in certain of these jurisdictions led to a decrease or negative growth of GDP, currency devaluation, reduced consumption, as well as a decline in investment activities. Since the second half of 2014 the Group operates under limited sectorial sanctions imposed by several countries on the Group. The Group considers these sanctions in its activities, continuously monitors them and analyses the effect of the sanctions on the Group’s financial position and its financial performance. While management believes it is taking appropriate measures to support the sustainability of the Group’s business in the current circumstances, unexpected further deterioration in the areas described above could negatively affect the Group’s results and financial position in a manner not currently determinable.

VTB BANK SELECTED NOTES TO THE INTERIM CONDENSED CONSOLIDATED FINANCIAL STATEMENTS 30 JUNE 2016 (CONTINUED)
34
26. FAIR VALUE OF FINANCIAL INSTRUMENTS Fair value is the price that would be received to sell an asset or paid to transfer a liability in an orderly transaction between market participants at the measurement date. The fair value measurement is based on the presumption that the transaction to sell the asset or transfer the liability takes place either:
• in the principal market for the asset or liability; or
• in the absence of a principal market, in the most advantageous market for the asset or liability.
The principal or the most advantageous market must be accessible by the Group. The fair value of an asset or a liability is measured using the assumptions that market participants would use when pricing the asset or liability, assuming that market participants act in their economic best interest. A fair value measurement of a non-financial asset takes into account a market participant's ability to generate economic benefits by using the asset in its highest and best use or by selling it to another market participant that would use the asset in its highest and best use.
Fair value measurements are analysed by level in the fair value hierarchy as follows: (i) Level 1 are measurements at quoted prices (unadjusted) in active markets for identical assets or liabilities, (ii) Level 2 measurements are valuations techniques with all material inputs observable for the asset or liability, either directly (that is, as prices) or indirectly (that is, derived from prices), and (iii) Level 3 measurements are valuations not based on observable market data (that is, unobservable inputs). Management applies judgment in categorising financial instruments using the fair value hierarchy. If a fair value measurement uses observable inputs that require significant adjustment based on unobservable inputs, that measurement is a Level 3 measurement. The significance of a valuation input is assessed against the fair value measurement of a financial instrument in its entirety.

VTB BANK SELECTED NOTES TO THE INTERIM CONDENSED CONSOLIDATED FINANCIAL STATEMENTS 30 JUNE 2016 (CONTINUED)
35
26. FAIR VALUE OF FINANCIAL INSTRUMENTS (CONTINUED) The following table shows an analysis of assets and liabilities recorded at fair value by level of the fair value hierarchy as at 30 June 2016:
Quoted prices in active markets
Significant observable
inputs
Significant unobservable
inputs
Level 1 Level 2 Level 3 Total
Financial assets measured at fair value Non-derivative financial assets at fair value through profit or
loss, including pledged under repurchase agreements Financial assets held for trading
- Debt securities 126.2 64.8 8.3 199.3 - Trading credit products – – 4.0 4.0 - Equity securities 5.2 – – 5.2
Financial assets held for trading, pledged under repurchase agreements - Debt securities 25.4 32.9 0.2 58.5 - Equity securities 0.8 – – 0.8
Financial assets designated as at fair value through profit or loss - Debt securities – 0.8 – 0.8 - Reverse sale and repurchase agreements to maturity – 21.0 – 21.0 - Equity securities 10.0 – 5.7 15.7
Derivative financial assets at fair value through profit or loss Trading derivative financial instruments
- Interest rate contracts – 148.5 25.0 173.5 - Foreign exchange and precious metals contracts – 14.1 – 14.1 - Contracts with securities – 3.3 18.1 21.4 - Other basic assets contracts – 14.2 0.4 14.6 - Embedded derivatives on structured instruments – – 7.6 7.6
Investment financial assets available-for-sale, including pledged under repurchase agreements
Investment financial assets available-for-sale - Debt securities 76.7 80.0 3.2 159.9 - Equity securities 16.5 0.2 21.1 37.8
Investment financial assets available-for-sale, pledged under repurchase agreements - Debt securities 1.7 3.1 – 4.8
Investments in associates and joint ventures designated as at fair value through profit or loss – – 61.8 61.8
Other financial assets Amounts in course of settlement related to regular way transactions
with financial instruments – 0.2 – 0.2 Other financial assets accounted at fair value – 2.1 – 2.1 Financial liabilities measured at fair value Derivative financial liabilities Trading derivative financial instruments
- Interest rate contracts – 162.8 – 162.8 - Foreign exchange and precious metals contracts – 19.2 – 19.2 - Contracts with securities – 1.9 – 1.9 - Other basic assets contracts – 19.4 – 19.4 - Embedded derivatives on structured instruments – – 2.8 2.8
Hedging derivative financial instruments
- Derivatives held as fair flow hedges – 0.8 – 0.8 - Derivatives held as cash flow hedges – 0.7 – 0.7
Other financial liabilities Obligation to deliver securities 42.3 0.2 – 42.5 Non-controlling interests in consolidated mutual funds – – 2.5 2.5 Amounts in course of settlement related to regular way transactions
with financial instruments – 0.3 – 0.3 Other financial liabilities accounted at fair value – 0.3 3.3 3.6

VTB BANK SELECTED NOTES TO THE INTERIM CONDENSED CONSOLIDATED FINANCIAL STATEMENTS 30 JUNE 2016 (CONTINUED)
36
26. FAIR VALUE OF FINANCIAL INSTRUMENTS (CONTINUED) The following table shows an analysis of assets and liabilities recorded at fair value by level of the fair value hierarchy as at 31 December 2015:
Quoted prices in active markets
Significant observable
inputs
Significant unobservable
inputs
Level 1 Level 2 Level 3 Total
Financial assets measured at fair value Non-derivative financial assets at fair value through profit or
loss, including pledged under repurchase agreements Financial assets held for trading
- Debt securities 98.3 70.8 15.4 184.5 - Trading credit products – – 6.5 6.5 - Equity securities 5.5 – – 5.5
Financial assets held for trading, pledged under repurchase agreements - Debt securities 35.9 32.9 0.6 69.4 - Equity securities 1.6 – – 1.6
Financial assets designated as at fair value through profit or loss - Debt securities – – – – - Reverse sale and repurchase agreements to maturity – 24.2 – 24.2 - Equity securities 10.3 – 6.1 16.4
Derivative financial assets at fair value through profit or loss Trading derivative financial instruments
- Interest rate contracts – 187.8 38.4 226.2 - Foreign exchange and precious metals contracts – 19.2 4.5 23.7 - Contracts with securities – 10.9 19.4 30.3 - Other basic assets contracts – 12.7 0.3 13.0 - Embedded derivatives on structured instruments – 0.2 11.4 11.6
Investment financial assets available-for-sale, including pledged under repurchase agreements
Investment financial assets available-for-sale - Debt securities 69.1 67.1 10.2 146.4 - Equity securities 17.8 – 25.9 43.7
Investment financial assets available-for-sale pledged under repurchase agreements - Debt securities 2.0 18.5 0.1 20.6
Investments in associates and joint ventures designated as at fair value through profit or loss – – 63.5 63.5
Other financial assets Amounts in course of settlement related to regular way transactions
with financial instruments – 0.1 – 0.1 Other financial assets accounted at fair value – 0.1 – 0.1 Financial liabilities measured at fair value Derivative financial liabilities Trading derivative financial instruments
- Interest rate contracts – 221.4 – 221.4 - Foreign exchange and precious metals contracts – 38.9 – 38.9 - Contracts with securities – 7.0 – 7.0 - Other basic assets contracts – 12.6 – 12.6 - Embedded derivatives on structured instruments – – 4.0 4.0
Hedging derivative financial instruments
- Derivatives held as cash flow hedges – 0.2 – 0.2 Other financial liabilities Obligation to deliver securities 36.9 0.3 – 37.2 Non-controlling interests in consolidated mutual funds – – 2.7 2.7 Amounts in course of settlement related to regular way transactions
with financial instruments – 0.3 – 0.3 Other financial liabilities accounted at fair value – 0.1 4.2 4.3

VTB BANK SELECTED NOTES TO THE INTERIM CONDENSED CONSOLIDATED FINANCIAL STATEMENTS 30 JUNE 2016 (CONTINUED)
37
26. FAIR VALUE OF FINANCIAL INSTRUMENTS (CONTINUED) For financial instruments that are recognised at fair value on a recurring basis, the Group determines whether transfers have occurred between Levels in the hierarchy by re-assessing categorisation (based on the lowest level input that is significant to the fair value measurement as a whole) at the end of each reporting period.
Financial assets at fair value through profit or loss are mainly dependent on the change of input variables used to determine fair value, such as interest rates, credit spreads, and foreign exchange rates. A significant portion of the available-for-sale financial assets in Level 3 is invested in shares of non-listed companies which are valued based on non-market observable information. Changes in assumptions can lead to adjustments in the fair value of these investments.
Movement in Level 3 financial instruments measured at fair value
A reconciliation of movements in Level 3 of the fair value hierarchy by class of financial instruments for the six-month period ended 30 June 2016 is as follows:
Non-derivative financial assets at fair
value through profit or loss Investment financial assets
available-for-sale, including pledged under repurchase
agreements
Investments in associates and
joint ventures at fair value through
profit or loss
Trading derivative
financial assets and liabilities
(net)
Other financial liabilities
Financial assets held for trading,
including pledged under repurchase
agreements
Financial assets designated as
at fair value through profit
or loss
Non-controlling interests in
consolidated mutual funds
Other financial liabilities
accounted at fair value
Fair value at 1 January 2016 22.5 6.1 36.2 63.5 70.0 (2.7) (4.2)
Gains/(losses) recognised in income statement (1.9) (0.4) 0.6 (1.7) (15.9) 0.2 0.9
- of which unrealised gains or (losses) (1.5) (0.4) 1.0 (1.7) (17.4) 0.2 0.9
Gains/(losses) recognized in other comprehensive income – – (3.8) – (0.5) – –
Purchase 7.2 – 5.8 – – – – Sale (5.5) – (1.8) – – – –
Settlement (4.7) – (1.8) – (5.3) – – Transfers into Level 3 6.2 – 2.2 – – – – Transfers out of
Level 3 (11.3) – (0.7) – – – – Transfers into
categories not measured at fair value – – (12.4) – – – –
Fair value at 30 June 2016 (unaudited) 12.5 5.7 24.3 61.8 48.3 (2.5) (3.3)
A reconciliation of movements in Level 3 of the fair value hierarchy by class of financial instruments for the six-month period ended 30 June 2015 is as follows:
Non-derivative financial assets at fair
value through profit or loss Investment financial assets
available-for-sale, including pledged under repurchase
agreements
Investments in associates and
joint ventures at fair value through
profit or loss
Trading derivative
financial assets and liabilities
(net)
Other financial liabilities
Financial assets held for trading,
including pledged under repurchase
agreements
Financial assets designated as
at fair value through profit
or loss
Non-controlling interests in
consolidated mutual funds
Other financial liabilities
accounted at fair value
Fair value at 1 January 2015 56.5 6.2 46.3 60.7 45.0 (2.6) (3.3)
Gains/(losses) recognised in income statement 1.5 (1.6) 5.0 1.4 4.8 (0.3) (0.1)
- of which unrealised gains or (losses) 1.9 – (0.3) 1.4 2.0 (0.3) (0.1)
(Losses) recognised in other comprehensive income (0.3) – (6.8) – (0.6) – –
Purchase 8.4 3.2 7.1 – (1.7) – – Sale (17.7) (4.4) (14.8) – – – –
Settlement (2.9) – (1.6) – (4.2) – Transfers into Level 3 14.4 – 0.7 – – – – Transfers out of
Level 3 (19.4) – (2.8) – – – – Transfer out of Level 3
into categories not measured at fair value (9.4) – – – – – –
Fair value at 30 June 2015
(unaudited) 31.1 3.4 33.1 62.1 43.3 (2.9) (3.4)

VTB BANK SELECTED NOTES TO THE INTERIM CONDENSED CONSOLIDATED FINANCIAL STATEMENTS 30 JUNE 2016 (CONTINUED)
38
26. FAIR VALUE OF FINANCIAL INSTRUMENTS (CONTINUED) Transfers between levels
For the six-month period ended 30 June 2016 (unaudited)
Reason for transfer (valuation at the reporting date)
Non-derivative financial assets held for trading, including
pledged under repurchase agreements
Investments financial assets available-for-
sale, including pledged under repurchase
agreements Total
From Level 1: - to Level 2 valuation models with market
observable inputs 36.7 1.2 37.9 - to Level 3 valuation models with non-
market-observable inputs 1.8 1.0 2.8 From Level 2: - to Level 1 active market quotes 31.9 1.2 33.1 - to Level 3 valuation models with non-
market-observable inputs 4.4 1.2 5.6 From Level 3: - to Level 1 active market quotes 5.3 0.6 5.9 - to Level 2 valuation models with market
observable inputs 6.0 0.1 6.1 Total 86.1 5.3 91.4
For the six-month period ended 30 June 2015 (unaudited)
Reason for transfer (valuation at the reporting date)
Non-derivative financial assets held for trading, including
pledged under repurchase agreements
Investments financial assets available-for-
sale, including pledged under repurchase
agreements Total
From Level 1: - to Level 2 valuation models with market
observable inputs 19.1 4.9 24.0 - to Level 3 valuation models with non-
market-observable inputs 0.6 0.3 0.9 From Level 2: - to Level 1 active market quotes 32.7 12.2 44.9 - to Level 3 valuation models with non-
market-observable inputs 13.8 0.4 14.2 From Level 3: - to Level 1 active market quotes 11.7 1.6 13.3 - to Level 2 valuation models with market
observable inputs 7.7 1.2 8.9
Total 85.6 20.6 106.2

VTB BANK SELECTED NOTES TO THE INTERIM CONDENSED CONSOLIDATED FINANCIAL STATEMENTS 30 JUNE 2016 (CONTINUED)
39
26. FAIR VALUE OF FINANCIAL INSTRUMENTS (CONTINUED) Impact on fair value of Level 3 financial instruments of changes to key assumptions The following table shows the quantitative information as at 30 June 2016 (unaudited) about significant unobservable inputs used in the fair value measurement categorized within Level 3 of the fair value hierarchy:
Fair
value Valuation techniques Unobservable input
description Reasonable range (values
used)
Non-derivative financial assets at fair value through profit or loss
Financial instruments held for trading, including pledged under repurchase agreements Debt securities Finance companies and banks 3.1 Discounted Cash flow Uncertainty factor -8.3%-8.3% (0.0%) 0.4 Other n/a n/a Finance Companies Servicing
Mortgage And Real Estate Debts 1.9 Other n/a n/a Oil 0.1 Other n/a n/a Government bodies 0.7 Other n/a n/a Other economic sectors 2.3 Other n/a n/a Trading credit products Railway transportation 4.0 Discounted Cash flow Uncertainty factor -8.3%-8.3% (0.0%) Financial assets designated as at fair value through profit or loss Equity securities Finance companies 2.9 Gordon and Comparable
method Cost of Equity 23.5%-25.5% (24.5%) Terminal growth 2.0%-6.0% (4.0%) Terminal ROE 12.7%-14.7% (13.7%) Other economic sectors 2.8 Other n/a n/a Derivative financial instruments Equity derivatives 18.1 Discounted Cash flow Credit Spread 4.5%-6.5% (5.5%) Index derivatives 0.4 Other n/a n/a Embedded derivatives on structured
instruments 7.6 Discounted Cash flow Credit spread 3.8%-5.8% (4.8%) (2.8) Black model Implied volatility 14.0%-83.0% (29.9%) Interest rate derivatives 23.7 Discounted Cash flow Credit spread 2.6%-4.6% (3.6%) 1.3 Other n/a n/a Investment financial assets available-for-sale, including pledged under repurchase agreements Debt securities Finance companies and banks 1.4 Discounted Cash flow Uncertainty factor -8.3%-8.3% (0.0%) 0.2 Other n/a n/a Other economic sectors 1.6 Other n/a n/a Equity securities Finance companies and banks 1.9 Discounted Cash flow Discount rate that can be
changed based on changes in
macroeconomic backdrop 9.5%-13.5% (11.8%) exit multiple 0.5-0.9 (0.7)
4.8 Gordon and Comparable
method Cost of Equity 23.5%-25.5% (24.5%) Terminal growth 2.0%-6.0% (4.0%) Terminal ROE 12.5%-14.5% (13.5%) 1.0 Other n/a n/a Manufacturing 4.3 Comparative method EV/EBITDA
(defence/security systems) 5.6-19.2 (10.4) EV/EBITDA
(microelectronics) 3.3-72.6 (10.8) Non-ferrous metals 7.0 Discounted Cash flow Weighted average cost of
capital 15.0%-14.0% (15.0%) Terminal growth 3.0%-4.0% (4.0%) Other economic sectors 2.1 Other n/a n/a

VTB BANK SELECTED NOTES TO THE INTERIM CONDENSED CONSOLIDATED FINANCIAL STATEMENTS 30 JUNE 2016 (CONTINUED)
40
26. FAIR VALUE OF FINANCIAL INSTRUMENTS (CONTINUED) Impact on fair value of Level 3 financial instruments of changes to key assumptions (continued)
Fair
value Valuation techniques Unobservable input
description Reasonable range (values
used)
Investments in associates and joint ventures designated as at fair value through profit or loss Telecommunications 53.6 Discounted Cash flow Weighted average cost of
capital 16.0%-17.0% (16.0%) Terminal growth 1.0%-3.0% (3.0%)
CAGR 2015-2027 of
subscriber base 6.0%-6.4% (6.4%)
CAGR 2015-2027 of
ARPU 1.4%-1.6% (1.6%) CAPEX/Revenue 10.0%-15.0% (10.0%) Air transport 6.7 Discounted Dividend flow Base equity cost of capital 7.5%-8% (7.5%) Risk free rate 10.1% -10.6% (10.1%)
RUB/EUR rate at the end of the period (1H 2016 -
2039) 10.0%-15.0% (0.0%)
depreciation
RUR Inflation (CPI) from
2019 5.0%-5.5% (5.5%)
Growth rate of international airlines traffic
in 2017-2018 0.0%-0.0% (2.6%-8.8%) Other economic sectors 1.5 Discounted Cash flow;
EV/EBITDA multiple Change in Growth of
Cards Sold (%) -2.0% - 2.0% (0.0%)
Change in PT Growth per
Client (%) 1.0%-5.0% (3.0%) WACC 12.1%-14.1% (13.1%)
Weight of DCF and multiple valuations
0.0%-100.0% (50.0% - 50.0%)
Non-derivative financial liabilities measured at fair value Non-controlling interests in
consolidated mutual funds (2.5) Net asset value n/a n/a Other financial liabilities accounted at
fair value (3.3) Discounted Dividend flow Base equity cost of capital 7.5%-8% (7.5%) Risk free rate 10.1% -10.6% (10.1%)
RUB/EUR rate at the end of the period (1H 2016 -
2039) 10.0%-15.0% (0.0%)
depreciation
RUR Inflation (CPI) from
2019 5.0%-5.5% (5.5%)
Growth rate of international airlines traffic
in 2017-2018 0.0%-0.0% (2.6%-8.8%)

VTB BANK SELECTED NOTES TO THE INTERIM CONDENSED CONSOLIDATED FINANCIAL STATEMENTS 30 JUNE 2016 (CONTINUED)
41
26. FAIR VALUE OF FINANCIAL INSTRUMENTS (CONTINUED) Impact on fair value of Level 3 financial instruments of changes to key assumptions (continued)
The following table shows the quantitative information as at 31 December 2015 about significant unobservable inputs used in the fair value measurement categorized within Level 3 of the fair value hierarchy:
Fair
value Valuation techniques Unobservable input
description Reasonable range (values
used)
Non-derivative financial assets at fair value through profit or loss
Financial instruments held for trading, including pledged under repurchase agreements Debt securities Finance companies and banks 0.7 Discounted Cash flow Counterparty
Credit spread 1.5%-1.7% (1.6%) 4.5 Discounted Cash flow Uncertainty factor -8.3%-8.3% (0.0%) 3.1 Other n/a n/a Finance Companies Servicing
Mortgage And Real Estate Debts 1.7 Discounted Cash flow Credit spread 1.0%-3.0% (2.0%) 2.0 Other n/a n/a Government bodies 1.7 Other n/a n/aOther economic sectors 2.3 Other n/a n/a Trading credit products Railway transportation 4.3 Discounted Cash flow Uncertainty factor -8.3%-8.3% (0.0%)Other economic sectors 2.2 Other n/a n/a Financial assets designated as at fair value through profit or loss Equity securities Finance companies 3.1 Gordon and Comparable
method Cost of Equity 23.5%-25.5% (24.5%) Terminal growth 2.0%-6.0% (4.0%) Terminal ROE 12.7%-14.7% (13.7%)Other economic sectors 3.0 Other n/a n/a Derivative financial instruments Equity derivatives 19.4 Discounted Cash flow Credit Spread 4.5%-6.5% (5.5%)Index derivatives 0.3 Other n/a n/aEmbedded derivatives on structured
instruments 11.4 Modified Black model Credit spread 2.5%-6.5% (4.5%) (4.0) Black model Implied volatility 14.0%-83.0% (48.5%)Foreign exchange 4.2 Interest rate parity Overnight BYR yield 16.0%-46.9% (29.9%) 0.3 Other n/a n/aInterest rate derivatives 36.8 Discounted Cash flow Credit spread 4.3%-6.3% (5.3%) 1.6 Other n/a n/aInvestment financial assets available-for-sale, including pledged under repurchase agreements Debt securities Finance companies and banks 1.5 Discounted Cash flow Uncertainty factor -8.3%-8.3% (0.0%)
6.6 Discounted Cash flow USD yields of RB banks
bonds 3.5%-7.5% (6.5%) 0.2 Other n/a n/a Other economic sectors 2.0 Other n/a n/a Equity securities Finance companies and banks 2.2 Discounted Cash flow Discount rate that can be
changed based on changes in
macroeconomic backdrop 9.5%-13.5% (11.5%) exit multiple 0.5-0.9 (0.7)
5.1 Gordon and Comparable
method Cost of Equity 23.5%-25.5% (24.5%) Terminal growth 2.0%-6.0% (4.0%) Terminal ROE 12.7%-14.7% (13.7%) 1.1 Other n/a n/a Manufacturing 4.3 Comparative method EV/EBITDA
(defence/security systems) 5.6-19.2 (10.4)
EV/EBITDA
(microelectronics) 3.3-72.6 (10.8) Non-ferrous metals 8.5 Discounted Cash flow Weighted average cost of
capital 15.0%-14.0% (15.0%) Terminal growth 3.0%-4.0% (4.0%)

VTB BANK SELECTED NOTES TO THE INTERIM CONDENSED CONSOLIDATED FINANCIAL STATEMENTS 30 JUNE 2016 (CONTINUED)
42
26. FAIR VALUE OF FINANCIAL INSTRUMENTS (CONTINUED)
Impact on fair value of Level 3 financial instruments of changes to key assumptions (continued)
Fair
value Valuation techniques Unobservable input
description Reasonable range (values
used)
Investment financial assets available-for-sale, including pledged under repurchase agreements (continued) Equity securities (continued) Air transport 2.5 Market comparable
companies EV/pax, comparable
airports 59.6-72.9 (66.3)
Discount to comparable
airports 15.0%-35.0% (25.0%) Other economic sectors 2.2 Other n/a n/a Investments in associates and joint ventures designated as at fair value through profit or loss Telecommunications 53.6 Discounted Cash flow Weighted average cost of
capital 16.0%-17.0% (16.0%) Terminal growth 1.0%-3.0% (3.0%)
CAGR 2015-2027 of
subscriber base 6.0%-6.4% (6.4%)
CAGR 2015-2027 of
ARPU 1.4%-1.6% (1.6%) CAPEX/Revenue 10.0%-15.0% (10.0%) Air transport 8.4 Discounted Dividend flow Base equity cost of capital 7.5%-8% (7.5%) Risk free rate 11.1% -11.6% (11.1%)
RUB/EUR rate at the end of the period (1H 2016 -
2039) 10.0%-15.0% (0.0%)
depreciation
RUR Inflation (CPI) from
2019 5.0%-6.5% (6.5%)
Growth rate of international airlines traffic
in 2017-2018 0.0%-0.0% (2.6%-8.8%) Other economic sectors 1.5 Discounted Cash flow;
EV/EBITDA multiple Change in Growth of
Cards Sold (%) -2.0% - 2.0% (0.0%)
Change in PT Growth per
Client (%) 1.0%-5.0% (3.0%) WACC 12.4%-14.4% (13.4%)
Weight of DCF and multiple valuations
0.0%-100.0% (50.0% - 50.0%)
Non-derivative financial liabilities measured at fair value Non-controlling interests in
consolidated mutual funds (2.7) Net asset value n/a n/a Other financial liabilities accounted at
fair value (4.2) Discounted Dividend flow Base equity cost of capital 7.5%-8.0% (7.5%) Risk free rate 11.1% -11.6% (11.1%)
RUB/EUR rate at the end of the period (1H 2016-
2039) 10.0%-15.0% (0.0%)
depreciation
RUR Inflation (CPI)
from 2019 5.0%-6.5% (6.5%)
Growth rate of international airlines traffic
in 2017-2018 0.0%-0.0% (2.6%-8.8%)
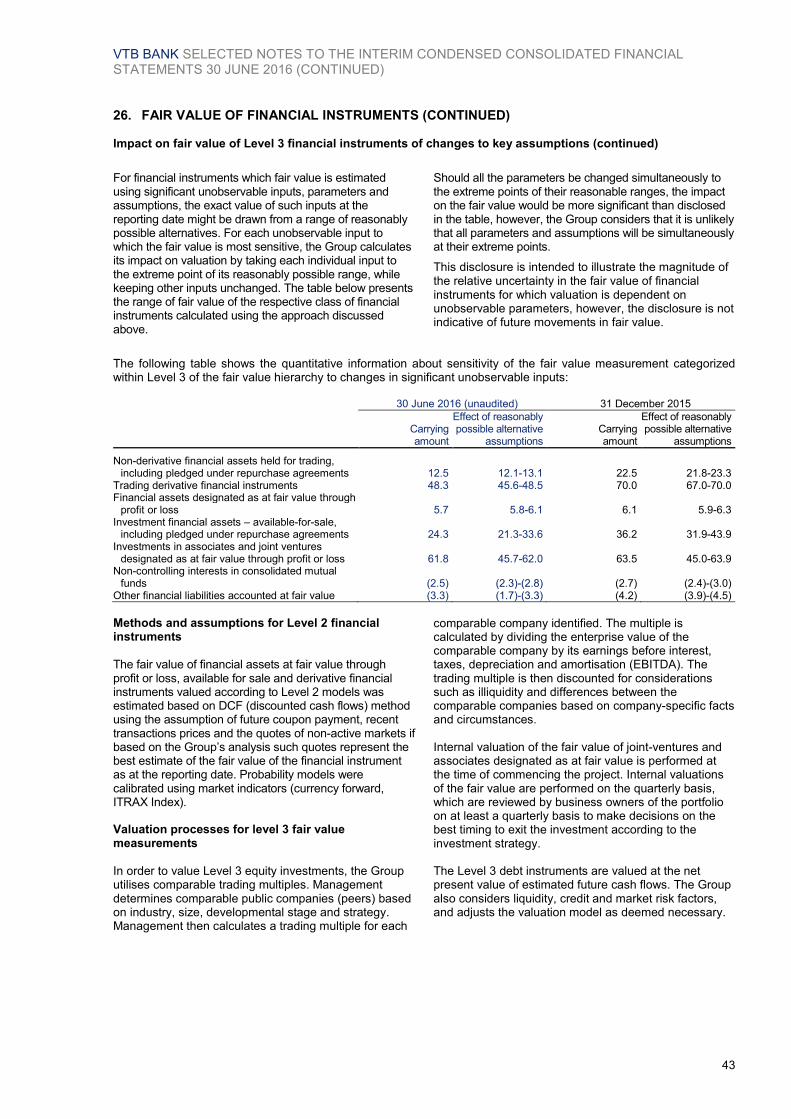
VTB BANK SELECTED NOTES TO THE INTERIM CONDENSED CONSOLIDATED FINANCIAL STATEMENTS 30 JUNE 2016 (CONTINUED)
43
26. FAIR VALUE OF FINANCIAL INSTRUMENTS (CONTINUED) Impact on fair value of Level 3 financial instruments of changes to key assumptions (continued)
For financial instruments which fair value is estimated using significant unobservable inputs, parameters and assumptions, the exact value of such inputs at the reporting date might be drawn from a range of reasonably possible alternatives. For each unobservable input to which the fair value is most sensitive, the Group calculates its impact on valuation by taking each individual input to the extreme point of its reasonably possible range, while keeping other inputs unchanged. The table below presents the range of fair value of the respective class of financial instruments calculated using the approach discussed above.
Should all the parameters be changed simultaneously to the extreme points of their reasonable ranges, the impact on the fair value would be more significant than disclosed in the table, however, the Group considers that it is unlikely that all parameters and assumptions will be simultaneously at their extreme points.
This disclosure is intended to illustrate the magnitude of the relative uncertainty in the fair value of financial instruments for which valuation is dependent on unobservable parameters, however, the disclosure is not indicative of future movements in fair value.
The following table shows the quantitative information about sensitivity of the fair value measurement categorized within Level 3 of the fair value hierarchy to changes in significant unobservable inputs: 30 June 2016 (unaudited) 31 December 2015
Carrying amount
Effect of reasonably possible alternative
assumptions Carrying amount
Effect of reasonably possible alternative
assumptions
Non-derivative financial assets held for trading,
including pledged under repurchase agreements 12.5 12.1-13.1 22.5 21.8-23.3 Trading derivative financial instruments 48.3 45.6-48.5 70.0 67.0-70.0 Financial assets designated as at fair value through
profit or loss 5.7 5.8-6.1 6.1 5.9-6.3 Investment financial assets – available-for-sale,
including pledged under repurchase agreements 24.3 21.3-33.6 36.2 31.9-43.9 Investments in associates and joint ventures
designated as at fair value through profit or loss 61.8 45.7-62.0 63.5 45.0-63.9 Non-controlling interests in consolidated mutual
funds (2.5) (2.3)-(2.8) (2.7) (2.4)-(3.0) Other financial liabilities accounted at fair value (3.3) (1.7)-(3.3) (4.2) (3.9)-(4.5)
Methods and assumptions for Level 2 financial instruments The fair value of financial assets at fair value through profit or loss, available for sale and derivative financial instruments valued according to Level 2 models was estimated based on DCF (discounted cash flows) method using the assumption of future coupon payment, recent transactions prices and the quotes of non-active markets if based on the Group’s analysis such quotes represent the best estimate of the fair value of the financial instrument as at the reporting date. Probability models were calibrated using market indicators (currency forward, ITRAX Index). Valuation processes for level 3 fair value measurements
In order to value Level 3 equity investments, the Group utilises comparable trading multiples. Management determines comparable public companies (peers) based on industry, size, developmental stage and strategy. Management then calculates a trading multiple for each
comparable company identified. The multiple is calculated by dividing the enterprise value of the comparable company by its earnings before interest, taxes, depreciation and amortisation (EBITDA). The trading multiple is then discounted for considerations such as illiquidity and differences between the comparable companies based on company-specific facts and circumstances. Internal valuation of the fair value of joint-ventures and associates designated as at fair value is performed at the time of commencing the project. Internal valuations of the fair value are performed on the quarterly basis, which are reviewed by business owners of the portfolio on at least a quarterly basis to make decisions on the best timing to exit the investment according to the investment strategy. The Level 3 debt instruments are valued at the net present value of estimated future cash flows. The Group also considers liquidity, credit and market risk factors, and adjusts the valuation model as deemed necessary.

VTB BANK SELECTED NOTES TO THE INTERIM CONDENSED CONSOLIDATED FINANCIAL STATEMENTS 30 JUNE 2016 (CONTINUED)
44
26. FAIR VALUE OF FINANCIAL INSTRUMENTS (CONTINUED)
Fair value of financial assets and liabilities not carried at fair value The following describes the methodologies and assumptions used to determine fair values for those financial instruments which are not already recorded at fair value in the financial statements.
Assets for which fair value approximates carrying value. For financial assets and financial liabilities that are liquid or having a short term maturity it is assumed that the carrying amounts approximate to
their fair value. This assumption is also applied to customer current/settlement deposits without a specific maturity.
Fixed and variable rate financial instruments. For quoted debt instruments the fair values are determined based on quoted market prices. The fair values of unquoted debt instruments are estimated by discounting future cash flows using rates currently available for debt on similar terms, credit risk and remaining maturities.
Set out below is a comparison by class of the carrying amounts and fair values of the Group’s financial instruments that are not carried at fair value in the consolidated statement of financial position. The table does not include the fair values of non-financial assets and non-financial liabilities. 30 June 2016 (unaudited) 31 December 2015
Carrying amount Fair value Carrying amount Fair value
Financial assets for which fair values are
disclosed Cash and short-term funds 563.6 563.6 570.7 570.7 Mandatory cash balances with central banks 76.9 76.9 70.8 70.8 Due from other banks, including pledged under
repurchase agreements 896.9 913.8 1,358.2 1,359.4 - Russia 450.6 459.4 431.8 433.7 - OECD 139.1 139.6 196.1 195.0 - Other countries 307.2 314.8 730.3 730.7
Loans and advances to customers, including pledged under repurchase agreements 8,672.9 8,751.4 9,437.5 9,406.9 - Loans to legal entities 6,833.9 6,888.5 7,670.7 7,617.8 - Loans to individuals 1,839.0 1,862.9 1,766.8 1,789.1
Investment securities held-to-maturity, including pledged under repurchase agreements 151.8 161.8 142.6 146.2
Financial assets within assets of disposal groups held for sale – – 7.1 7.1
Other financial assets 42.7 42.7 95.1 95.1 Financial liabilities for which fair values are
disclosed Due to other banks 794.7 798.0 1,224.0 1,233.9 Customer deposits 7,859.1 7,850.5 7,267.0 7,243.8
- Deposits of legal entities 5,009.0 5,000.7 4,383.6 4,370.1 - Deposits of individuals 2,850.1 2,849.8 2,883.4 2,873.7
Other borrowed funds 889.5 929.1 2,121.5 2,154.8 Debt securities issued 455.5 475.4 623.5 633.4 Subordinated debt 238.6 243.1 262.8 257.9 Financial liabilities within liabilities of disposal groups
held for sale – – 12.4 12.4 Other financial liabilities 67.7 67.7 26.6 26.6

VTB BANK SELECTED NOTES TO THE INTERIM CONDENSED CONSOLIDATED FINANCIAL STATEMENTS 30 JUNE 2016 (CONTINUED)
45
27. CAPITAL MANAGEMENT AND CAPITAL ADEQUACY The Group’s policy is to maintain a strong capital base so as to maintain investor, creditor and market confidence and to sustain future development of its business. Capital adequacy ratio in accordance with statutory requirements
The CBR requires Russian banks to maintain a minimum total capital adequacy ratio of 8% of risk-weighted assets, determined in accordance with CBR’s requirements. In other countries the Group members comply with the regulatory capital requirements of the local central banks or other supervisory authorities.
As at 30 June 2016 and 31 December 2015 the Bank’s capital adequacy ratio in accordance with CBR requirements exceeded the minimum level. Capital adequacy ratio in accordance with the Basel Accord guidelines
The Group’s international risk based capital adequacy ratio is computed in accordance with the Basel Accord guidelines issued in 1988, with subsequent amendments including the amendment to incorporate market risks.
These ratios exceeded the minimum ratio of 8.0% recommended by the Basel Accord as disclosed below:
30 June 2016
(unaudited)
31 December 2015
Tier 1 capital Share capital 659.5 659.5 Share premium 433.8 433.8 Treasury shares (2.2) (2.3) Perpetual loan participation notes excluding bought back 144.1 163.4 Retained earnings 109.4 127.6 Unrealized gain on financial assets available-for-sale and cash flow hedge (4.0) (5.3) Currency translation difference 32.3 55.3 Non-controlling interests 3.2 (0.1) Deducted: Goodwill (115.8) (116.1) Total Tier 1 capital 1,260.3 1,315.8 Tier 2 capital Land and premises revaluation reserve 21.5 22.2 Subordinated debt 211.8 237.1 Total Tier 2 capital 233.3 259.3 Total capital before deductions 1,493.6 1,575.1 Deducted: equity investments in financial institutions and subordinated debt
provided (55.2) (59.2) Total capital after deductions 1,438.4 1,515.9 Risk-weighted assets Credit risk 8,924.6 10,074.3 Market risks 570.3 555.8 Total risk-weighted assets 9,494.9 10,630.1 Tier 1 capital ratio to total risk-weighted assets 13.3% 12.4% Total capital ratio to total risk-weighted assets 15.1% 14.3%
Group capital, calculated in accordance
with the Basel Accord
-59 -55
1,316 1,260
259233
31 Dec 2015 30 Jun 2016
Tier 2 capital
Tier 1 capital
Less investments
1,516 1,438
12.4% 13.3%
14.3% 15.1%Total capital to totalRWA
Tier 1 capital tototal RWA
VTB BANK SELECTED NOTES TO THE INTERIM CONDENSED CONSOLIDATED FINANCIAL STATEMENTS 30 JUNE 2016 (CONTINUED)
46
28. BUSINESS COMBINATIONS AND DISPOSAL OF SUBSIDIARIES In June 2016, the Group disposed of its shares in OJSC “Chaika” for the total consideration of RUR 2.0 billion. The gain from disposal of subsidiary amounted to RUR 0.7 billion.
In June 2016, the Group lost control over a number of subsidiaries due to the bankruptcy proceedings and deconsolidated them. The total gain from deconsolidation of these subsidiaries amounted to RUR 3.0 billion.
29. NON-CONTROLLING INTERESTS In January 2016 the Group’s subsidiary “Bank VTB 24”, PJSC and Russian Post, a government controlled entity, entered into a binding agreement to create a “Post Bank” on the basis of “Leto Bank”, PJSC. As a part of the transaction “Bank VTB 24”, PJSC sold 49.99% of shares in “Leto Bank”, PJSC to a subsidiary of Russian Post for the total consideration of RUR 5.5 billion. Since the Group retained control
over “Leto Bank”, PJSC the difference between the non-controlling interest recorded and the fair value of the consideration received is recorded directly in equity as a reduction of retained earnings. Post Bank started its operations during the first quarter of 2016 and provides a range of banking services through post offices. In March 2016 “Leto Bank”, PJSC was renamed into “Post Bank”, PJSC.
30. CONTINGENCIES AND COMMITMENTS Legal proceedings
From time to time and in the normal course of business, claims against the Group are received. As at the reporting date the Group had several unresolved legal claims. Management assessed probable outflow of resources and the respective provision has been made. The movements in provisions for legal claims were as follows:
1 January 2015 – Provision for impairment during the period – 30 June 2015 (unaudited) – 1 January 2016 0.4 Provision for impairment during the period 0.7 30 June 2016 (unaudited) 1.1
Tax contingencies
Major part of the Group’s business activity is carried out in the Russian Federation. Russian tax, currency and customs legislation as currently in effect is vaguely drafted and is subject to varying interpretations, selective and inconsistent application and changes, which can occur frequently, at short notice and may apply retrospectively. Management’s interpretation of such legislation as applied to the transactions and activity of the Group may be challenged by the relevant state authorities. The Russian transfer pricing legislation as currently in effect allows the Russian tax authorities to apply transfer pricing adjustments and impose additional profits tax and VAT liabilities in respect of all “controlled” transactions if the transaction price differs from the market level of prices unless the Group is able to demonstrate the use of market prices with respect to the “controlled” transactions supported by appropriate transfer pricing documentation and proper reporting to the Russian tax authorities. During the six-month period ended 30 June 2016 the Group determined its tax liabilities arising from “controlled” transactions using actual transaction prices.
Apart from the Russian Federation, the Group also operates in a number of foreign jurisdictions. The Group includes companies incorporated outside of Russia that are taxed pursuant to the provisions of the tax legislation of the jurisdictions of incorporation of the respective companies. Tax liabilities of the Group are determined on the basis that non-Russian companies of the Group do not have a permanent establishment in Russia, do not qualify as Russian tax residents and hence are not subject to Russian profits tax except for Russian tax withheld at source (i.e. dividend, interest, certain capital gains, etc.). Russian tax laws that were in effect before 1 January 2015 did not contain detailed rules on taxation of foreign companies. It is possible that with the evolution of these rules and changes in the approach of the Russian tax authorities and courts as to their interpretation and application, the non-taxable status of some or all of the foreign companies of the Group in Russia may be challenged, in which case the foreign companies may be taxed according to the rules similar to the rules applicable to the Russian entities.

VTB BANK SELECTED NOTES TO THE INTERIM CONDENSED CONSOLIDATED FINANCIAL STATEMENTS 30 JUNE 2016 (CONTINUED)
47
30. CONTINGENCIES AND COMMITMENTS (CONTINUED)
Tax contingencies (continued)
Effective 1 January 2015 the concepts of “tax residency” for foreign legal entities, “beneficial ownership” and rules for taxation of undistributed profit of controlled foreign companies in Russia were introduced into the Russian tax legislation. The introduction of these concepts generally leads to an increase in the administrative (including tax) burden for the Russian entities that have subsidiary structures incorporated outside of Russia. Interpretation of the above provisions of the Russian tax legislation in conjunction with the recent trends in law enforcement practice in taxation suggest that the tax authorities and courts are taking more assertive positions in their interpretation of the legislation and assessments and, as a result, it is possible that transactions and activities that have not been challenged in the past may be challenged in the future. As such, significant additional taxes, penalties and late payment interest may be assessed by the relevant authorities. Fiscal periods remain open and subject to review by the tax authorities for a period of three calendar years immediately preceding the year in which the decision to conduct a tax review is taken. Under certain circumstances tax reviews may cover longer periods. As at 30 June 2016, management believes that its interpretation of the relevant legislation is appropriate and that the Group’s tax, currency and customs positions should be sustained vis-a-vis tax authorities and courts. Credit related commitments
One of the Group’s subsidiaries is involved in a legal case related to its performance guarantee of RUR 5.7 billion as at 30 June 2016 (31 December 2015: RUR 5.7 billion) issued to a third party which is a government-controlled entity. In March 2016, the Moscow District Arbitration Court issued a final ruling in favor of the third party. Group management believes the ultimate loss, if any, under the guarantee will be significantly lower than
the notional amount of the guarantee and will depend, among other matters, on the outcome of a continuing legal case between the third party beneficiary of the guarantee and its supplier. Accordingly, management established a reserve of RUR 2.3 billion as at 30 June 2016 based on its current best estimate of the loss under the guarantee. The primary purpose of these instruments is to ensure that funds are available to a customer as required. Guarantees that represent irrevocable assurances that the Group will make payments in the event that a customer cannot meet its obligations to third parties carry the same credit risk as loans. Documentary and commercial letters of credit, which are written undertakings by the Group on behalf of a customer authorizing a third party to draw drafts on the Group up to a stipulated amount under specific terms and conditions, are collateralized by cash deposits and therefore carry less risk than direct borrowings. Commitments to extend credit represent unused portions of authorizations to extend credit in the form of loans, guarantees or letters of credit. With respect to credit risk on commitments to extend credit, the Group is potentially exposed to loss in an amount equal to the total unused commitments. However, the likely amount of loss is less than the total unused commitments since most commitments to extend credit are contingent upon customers maintaining specific credit standards and/or the Bank confirming its willingness to extend a loan. The Group monitors the term to maturity of credit related commitments because longer-term commitments generally have a greater degree of credit risk than shorter-term commitments.
The total outstanding contractual amount of irrevocable undrawn credit lines, letters of credit and guarantees does not necessarily represent future cash requirements, as these financial instruments may expire or terminate without being funded.
Outstanding credit related commitments are as follows:
30 June 2016
(unaudited) 31 December 2015
Guarantees issued 757.0 970.6 Letters of credit 75.6 111.6 Undrawn credit lines 12.1 25.4 Commitments to extend credit 3.5 4.8 Less: provision for credit related commitments (48.4) (14.3) Net credit related commitments 799.8 1,098.1
The Bank has received export letters of credit for further advising to its customers. The total amount of received letters of credit as at 30 June 2016 was RUR 266.7 billion (31 December 2015: RUR 283.3 billion).
Commitments under import letters of credit and guarantees are collateralized by customer deposits of RUR 75.8 billion (31 December 2015: RUR 53.4 billion) (Note20).
As at 30 June 2016, the guaranties issued for largest interrelated foreign entity accounted for RUR 72.3 billion or 9.6% of the guarantees issued. (31 December 2015: interrelated foreign entity RUR 81.4 billion or 8.4% of the guarantees issued).
As at 30 June 2016, the 10 largest groups of interrelated customers accounted for RUR 317.5 billion or 41.9% of the guarantees issued (31 December 2015: RUR 386.8 billion or 39.9% of the guarantees issued).

VTB BANK SELECTED NOTES TO THE INTERIM CONDENSED CONSOLIDATED FINANCIAL STATEMENTS 30 JUNE 2016 (CONTINUED)
48
30. CONTINGENCIES AND COMMITMENTS (CONTINUED)
Credit related commitments (continued)
The movements in provisions for credit related commitments were as follows:
1 January 2015 21.3 Provision during the period 5.5 Write-offs due to execution (2.3) Effect of translation 0.1 30 June 2015 (unaudited) 24.6 1 January 2016 14.3 Provision during the period 36.1 Write-offs due to execution (1.6) Effect of translation (0.4) 30 June 2016 (unaudited) 48.4
Provisions for credit-related commitments are recorded within other liabilities.
Purchase commitments
As at 30 June 2016 the Group had RUR 86.7 billion of outstanding commitments for the purchase of precious metals (31 December 2015: RUR 61.5 billion). As the price of these contracts is linked to the fair value of precious metals at the date of delivery, no gain or loss is recognized on these contracts.
31. SUBSEQUENT EVENTS In July 2016, VTB redeemed its Series 6 local bond in the total amount of RUR 11.4 billion upon maturity.
32. RELATED PARTY TRANSACTIONS
Parties are considered to be related if one party has the ability to control the other party or exercise significant influence over the other party in making financial or operational decisions as defined by IAS 24, Related Party Disclosures. In considering each possible related party relationship, attention is directed to the substance of the relationship, not merely the legal form. A government-related entity is an entity that is controlled, jointly controlled or significantly influenced by a government.
Transactions and balances with related parties comprise transactions and balances with Russian government-related entities and associates and joint ventures and are stated in the tables below:
Statements of financial position 30 June 2016 (unaudited) 31 December 2015
Government-
related entities
Associates and joint ventures
and other Government-
related entities
Associates and joint ventures
and other
Assets Cash and short-term funds 322.3 0.4 202.6 0.2 Mandatory cash balances with central banks 64.6 – 56.5 – Non-derivative financial assets at fair value through profit or
loss, including pledged under repurchase agreements 122.9 – 104.2 – Derivative financial assets 91.0 – 100.6 – Due from other banks, including pledged under repurchase
agreements 359.5 253.5 389.5 683.3 Loans and advances to customers, including pledged under
repurchase agreements 2,339.9 196.3 2,353.9 176.6 Allowance for loan impairment (27.3) (3.7) (26.6) (7.8) Investment financial assets, including pledged under
repurchase agreements 208.4 – 192.3 – Other assets 3.8 0.2 58.2 – Liabilities Due to other banks 276.1 175.3 238.2 524.8 Customer deposits 2,773.6 49.7 2,177.3 55.2 Derivatives financial liabilities 33.5 0.2 36.3 – Other borrowed funds 701.5 0.1 1,815.8 0.1 Subordinated debt 105.3 – 104.9 – Other liabilities 22.8 33.1 11.7 4.5 Credit Related Commitments Guarantees issued 291.2 100.5 376.5 178.1 Import letters of credit 1.7 – 1.7 – Undrawn credit lines – 0.1 0.3 0.1

VTB BANK SELECTED NOTES TO THE INTERIM CONDENSED CONSOLIDATED FINANCIAL STATEMENTS 30 JUNE 2016 (CONTINUED)
49
32. RELATED PARTY TRANSACTIONS (continued)
Income statements
For the six-month period
ended 30 June (unaudited)
2016 2015
Interest income Loans and advances to customers 127.9 114.6 Securities 12.9 9.4 Due from other banks 15.3 18.8 Interest expense Customer deposits (90.1) (100.7) Due to other banks and other borrowed funds (57.1) (142.1) Subordinated debt (6.1) (6.7) Provision charge for impairment of debt financial assets (4.1) (2.0) Provision charge for credit related commitments (29.3) (0.1)
Following further centralisation of decision-making and control functions at Group level, including the transfer of the majority of Bank of Moscow assets and liabilities to VTB Bank in May 2016 (Note 1), in the second quarter 2016, the Group revised the composition of key management personnel, as defined by IAS 24, Related Party Disclosures. Following the revised composition, key management personnel includes certain senior members (executive body) of the Group Management Committee, Heads of Global Business Lines, all
members of the Management Board of VTB Bank, as well as all members of the Supervisory Council of VTB Bank, and their aggregate remuneration for the six-month period ended 30 June 2016 amounted to RUR 0.8 billion (six-month period ended 30 June 2015: RUR 0.6 billion). Compensation of key management personnel consists primarily of short-term employee benefits, including pension contributions. Loans to the key management personnel as at 30 June 2016 amounted to RUR 0.1 billion (31 December 2015: RUR 0.2 billion).
33. SHARE-BASED PAYMENTS
Shares Plan. As at 30 June 2016 the total value of the award granted under the Shares Plan was RUR 1.0 billion (31 December 2015: RUR 1.1 billion) represented by 15.7 billion shares of VTB (31 December 2015: 18.4 billion). GDRs Plan. As at 30 June 2016 the total value of the award granted under the GDRs Plan was RUR 1.5 billion (31 December 2015: RUR 1.8 billion) represented by 9.8 million GDRs of VTB (31 December 2015: 9.6 million). Each GDR contains 2,000 VTB shares.
For the three-month and six-month periods ended 30 June 2016 the Group recognised in Staff costs the amount of RUR 0.2 billion and RUR 0.4 billion, respectively, (for the three-month and six-month periods ended 30 June 2015: RUR 0.1 billion and RUR 0.4 billion, respectively) as expenses related to the above equity-settled share-based payment transactions.

VTB BANK SELECTED NOTES TO THE INTERIM CONDENSED CONSOLIDATED FINANCIAL STATEMENTS 30 JUNE 2016 (CONTINUED)
50
34. BASIC AND DILUTED EARNINGS PER SHARE Basic earnings per share are calculated by dividing the net profit or loss attributable to ordinary shareholders of the parent by the weighted average number of ordinary shares in issue during the period, excluding the average number of ordinary shares purchased by the Group and held as treasury shares. The Group has no dilutive potential ordinary shares; therefore, the diluted earnings per share are equal to basic earnings per share.
For the three-month period
ended 30 June (unaudited) For the six-month period
ended 30 June (unaudited)
2016 2015 2016 2015
Weighted average number of ordinary shares
in issue 12,921,185,884,788 12,863,663,450,386 12,918,364,883,562 12,837,757,219,470
Net profit/(loss) attributable to shareholders of the parent 16.0 2.5 17.7 (11.8)
Amounts due and paid on perpetual loan participation notes, net of tax (5.7) (10.5) (5.7) (10.5)
Total net profit/(loss) attributable to shareholders of the parent 10.3 (8.0) 12.0 (22.3)
Basic and diluted earnings per share (expressed in Russian roubles per share) 0.00080 (0.00062) 0.00093 (0.00174)
Profit / (loss) after tax from subsidiaries acquired exclusively with a view to resale 11.8 (0.7) 7.7 (1.7)
Basic and diluted earnings per share based on profit after tax from subsidiaries acquired exclusively with a view to resale (expressed in Russian roubles per share) 0.00091 (0.00005) 0.00060 (0.00013)
Total net profit /(loss) attributable to shareholders of the parent net of profit after tax from subsidiaries acquired exclusively with a view to resale (1.5) (7.3) 4.3 (20.6)
Basic and diluted earnings per share before profit after tax from subsidiaries acquired exclusively with a view to resale (expressed in Russian Roubles per share) (0.00011) (0.00057) 0.00033 (0.00161)
35. ADOPTION OF NEW OR REVISED STANDARDS AND INTERPRITATIONS The accounting policies adopted in the preparation of the interim condensed consolidated financial statements are consistent with those followed in the preparation of the Group’s annual financial statements for the year ended 31 December 2015, except for the adoption of new standards and interpretations as at 1 January 2016 noted below: IFRS 14 Regulatory Deferral Accounts (issued in January 2014 and effective for annual periods beginning on or after 1 January 2016). IFRS 14 permits first-time adopters to continue to recognise amounts related to rate regulation in accordance with their previous GAAP requirements when they adopt IFRS. However, to enhance comparability with entities that already apply IFRS and do not recognise such amounts, the standard requires that the effect of rate regulation must be presented separately from other items. An entity that already presents IFRS financial statements is not eligible to apply the standard.
Amendments to IAS 16 and IAS 38 Clarification of Acceptable Methods of Depreciation and Amortisation (issued on 12 May 2014 and effective for the periods beginning on or after 1 January 2016). The amendments have clarified that the use of revenue-based methods to calculate the depreciation of an asset is not appropriate because revenue generated by an activity that includes the use of an asset generally reflects factors other than the consumption of the economic benefits embodied in the asset. The amendments have clarified that revenue is generally presumed to be an inappropriate basis for measuring the consumption of the economic benefits embodied in an intangible asset. This presumption, however, can be rebutted in certain limited circumstances. These amendments do not have any impact to the Group given that the Group has not used a revenue-based method to depreciate its noncurrent assets.

VTB BANK SELECTED NOTES TO THE INTERIM CONDENSED CONSOLIDATED FINANCIAL STATEMENTS 30 JUNE 2016 (CONTINUED)
51
35. ADOPTION OF NEW OR REVISED STANDARDS AND INTERPRITATIONS (CONTINUED) Amendments to IAS 16 and IAS 41 Bearer Plants (issued on 30 June 2014 and effective for annual periods beginning 1 January 2016). The amendments change the financial reporting for bearer plants. In accordance with these amendments bearer plants should be accounted for in the same way as property, plant and equipment in IAS 16 Property, Plant and Equipment. These amendments had no impact on the Group's financial position since the Group does not own or control bearer plants. Amendments to IAS 27 Equity Method in Separate Financial Statements (issued on 12 August 2014 and effective for annual periods beginning 1 January 2016). The amendments will allow entities to use the equity method to account for investments in subsidiaries, joint ventures and associates in their separate financial statements. The amendments are not applicable for consolidated financial statements of the Group. Amendments to IFRS 11 Joint Arrangements (issued on 6 May 2014 and effective for the periods beginning on or after 1 January 2016). The amendments add new guidance on how to account for the acquisition of an interest in a joint operation that constitutes a business. The amendments specify the appropriate accounting treatment for such acquisitions. These amendments do not have any impact on the Group as there has been no interest acquired in a joint operation during the period. Annual Improvements to IFRSs 2014 (issued on
25 September 2014 and effective for annual periods beginning on or after 1 January 2016). The amendments impact 4 standards. IFRS 5 was amended to clarify that change in the manner of disposal (reclassification from “held for sale” to “held for distribution” or vice versa) does not constitute a change to a plan of sale or distribution, and does not have to be accounted for as such. The amendment to IFRS 7 adds guidance to help management determine whether the terms of an arrangement to service a financial asset which has been transferred constitute continuing involvement, for the purposes of disclosures required by IFRS 7. The amendment also clarifies that the offsetting disclosures of IFRS 7 are not specifically required for all interim periods, unless required by IAS 34. The amendment to IAS 19 clarifies that for post-employment benefit obligations, the decisions regarding discount rate, existence of deep market in high-quality corporate bonds, or which government bonds to use as a basis, should be based on the currency that the liabilities are denominated in, and not the country where they arise. IAS 34 will require a cross reference from the interim financial statements to the location of “information disclosed elsewhere in the interim financial report”. These amendments had no impact on the Group’s financial position.
Amendments to IAS 1 Disclosure Initiative (effective for annual periods beginning on or after 1 January 2016, with early adoption permitted). The amendments to IAS 1 clarify, rather than significantly change, existing IAS 1 requirements. The amendments clarify:
• The materiality requirements in IAS 1
• That specific line items in the statement(s) of profit or loss and OCI and the statement of financial position may be disaggregated
• That entities have flexibility as to the order in which they present the notes to financial statements
• That the share of OCI of associates and joint ventures accounted for using the equity method must be presented in aggregate as a single line item, and classified between those items that will or will not be subsequently reclassified to profit or loss
Furthermore, the amendments clarify the requirements that apply when additional subtotals are presented in the statement of financial position and the statement(s) of profit or loss and OCI. These amendments do not have any impact on the Group. Amendments to IFRS 10, IFRS 12 and IAS 28 Investment Entities: Applying the Consolidation Exception (applied retrospectively and are effective for annual periods beginning on or after 1 January 2016, with early adoption permitted). The amendments address issues that have arisen in applying the investment entities exception under IFRS 10 Consolidated Financial Statements. The amendments to IFRS 10 clarify that the exemption from presenting consolidated financial statements applies to a parent entity that is a subsidiary of an investment entity, when the investment entity measures all of its subsidiaries at fair value. Furthermore, the amendments to IFRS 10 clarify that only a subsidiary of an investment entity that is not an investment entity itself and that provides support services to the investment entity is consolidated. All other subsidiaries of an investment entity are measured at fair value. The amendments to IAS 28 Investments in Associates and Joint Ventures allow the investor, when applying the equity method, to retain the fair value measurement applied by the investment entity associate or joint venture to its interests in subsidiaries. These amendments do not have any impact on the Group as the Group does not apply the consolidation exception.

VTB BANK SELECTED NOTES TO THE INTERIM CONDENSED CONSOLIDATED FINANCIAL STATEMENTS 30 JUNE 2016 (CONTINUED)
52
36. CHANGES IN PRESENTATION Payments to Deposit Insurance System and Other operating expense
Starting 2015 the Group presents payments to deposit insurance system directly related to interest-bearing liabilities as a separate line of the net interest income. Starting 2015, the Group decided to present certain expenses directly related to non-interest gains in the consolidated income statement consistently with the presentation of the other operating income having separated them from the staff and administrative expenses. Accordingly the presentation of the comparative figures has been adjusted to be consistent with the new presentation. The effect of changes on the interim consolidated income statement for the three-month and six-month periods ended 30 June 2015 (unaudited) is as follows: As previously reported Reclassification As reclassified
For the three-month
period ended
For the six-month
period ended
For the three-month
period ended
For the six-month
period ended
For the three-month
period ended
For the six-month
period ended
30 June 2015 30 June 2015 30 June 2015
Payments to deposit insurance system – – (2.0) (4.0) (2.0) (4.0) Other operating expense – – (3.0) (5.6) (3.0) (5.6) Revenue from other non-banking activities 3.8 0.1 2.3 12.4 6.1 12.5 Net loss from change in fair value of investment
property recognised on revaluation – – (2.3) (12.4) (2.3) (12.4) Staff costs and administrative expenses (56.2) (115.4) 5.0 9.6 (51.2) (105.8)
The effect of corresponding reclassifications on disclosure of the interim consolidated statement of cash flows for the six-month period ended 30 June 2015 (unaudited) is as follows: As previously reported Reclassification As reclassified
Cash flows from operating activities Payments to deposit insurance system – (4.0) (4.0) Other operating expenses paid – (7.2) (7.2) Staff costs, administrative expenses paid (123.3) 11.2 (112.1)
The effect of reclassification of the comparative information in Staff Costs and Administrative Expenses note (Note 8) for the three-month and six-month periods ended 30 June 2015 (unaudited) was as follows:
As previously reported Reclassification As reclassified
For the three-month
period ended
For the six-month
period ended
For the three-month
period ended
For the six-month
period ended
For the three-month
period ended
For the six-month
period ended
30 June 2015 30 June 2015 30 June 2015
Depreciation and other expenses related to
premises and equipment 6.3 12.4 (1.1) (2.2) 5.2 10.2 Taxes other than on income 1.4 3.1 (0.3) (0.5) 1.1 2.6 Insurance costs 0.2 0.4 (0.2) (0.3) – 0.1 Amortization of core deposit and customer loan
intangible 1.3 2.6 (0.1) (0.2) 1.2 2.4 Payments to deposit insurance system 2.0 4.0 (2.0) (4.0) – – Other 1.8 3.3 (1.3) (2.4) 0.5 0.9