repairing and conserving australia’s saltmarshes and … mcleod et al... · repairing and...
TRANSCRIPT

RepairingandconservingAustralia’s
saltmarshesandseascapes
ColinCreighton,TerryWalshe,IanMcLeod,Vishnu
Prahalad,MarcusSheavesandMattTaylor
TropWATERReportNo.17/12
June2017

RepairingandconservingAustralia’ssaltmarshes
andseascapes
AReportfortheNationalEnvironmentalScienceProgram,Marine
BiodiversityHub
ReportNo.17/12
June2017
PreparedbyColinCreighton,TerryWalshe,IanMcLeod,VishnuPrahalad,MarcusSheavesandMattTaylor
CentreforTropicalWater&AquaticEcosystemResearch(TropWATER)
JamesCookUniversityTownsville
Phone:(07)47814262Email:[email protected]
Web:www.jcu.edu.au/tropwater/
Informationshouldbecitedas:CreightonC,WalsheT,McLeodIM,PrahaladV,SheavesMandTaylorM(2017)RepairingandconservingAustralia’s saltmarshes and seascapes. Centre for Tropical Water & Aquatic Ecosystem Research(TropWATER)Publication,JamesCookUniversity,Townsville,124pp.Forfurtherinformationcontact:IanMcLeodCentreforTropicalWater&AquaticEcosystemResearch(TropWATER)JamesCookUniversityian.mcleod1@jcu.edu.auTropWATERATSIPBuilding145JamesCookUniversityTownsville,QLD4811This publication has been compiled by the Centre for Tropical Water & Aquatic Ecosystem Research(TropWATER),JamesCookUniversity.This report is licensedby theUniversityof Tasmania foruseunder aCreativeCommonsAttribution4.0AustraliaLicence.For licence conditions, see https://creativecommons.org/licenses/by/4.0/. Enquiries about reproduction,including downloading or printing the web version, should be directed to [email protected] about reproduction, includingdownloadingorprinting thewebversion, shouldbedirected toTropWATER@jcu.edu.au.AcknowledgmentsThisworkwasundertakenfortheMarineBiodiversityHub,acollaborativepartnershipsupportedthroughfundingfromtheAustralianGovernment’sNationalEnvironmentalResearchProgram(NESP).NESPMarineBiodiversity Hub partners include the University of Tasmania, CSIRO, Geoscience Australia, AustralianInstitute of Marine Science, Museum Victoria, Charles Darwin University, the University of WesternAustralia, Integrated Marine Observing System, NSW Office of Environment and Heritage, NSWDepartmentofPrimaryIndustries.TheNationalEnvironmentalScienceProgrammefundedthisreport.TheAuthorswould liketothanktheMarineBiodiversityHubteam,especiallyNicBax,PaulHedgeandAnnabelOzimecforprovidingsupport.KeywordsRestorationEcology;EcosystemRepair;SaltMarsh;Seascapes;Prawns;NetPrimaryProductivity.Photo credit (cover): Top left -Mark Ziembicki; Top right –Matt Taylor, Bottom left –VishnuPrahalad,Bottomright–IanMcLeod.

RepairingAustralia’sseascapes–TropWATERReportno.17/122017
Pagei
EXECUTIVESUMMARYTropWATER,JamesCookUniversity,Townsville,QLD,AustraliaAustralia's coastal marine biodiversity and accompanying benefits such as fisheries have been markedly reduced due to loss of essential inshore habitats. These coastal habitats provide a nursery ground for a multitude of animals, including fish, prawns and birds. Many species depend on inshore habitat during critical early life-stages characterised by rapid growth and development (coastal dependency). These coastal tidally linked wetlands (commonly known as ‘seascapes’) comprise mangrove-lined channels, salt marshes, mud flats, sedge lands and sub tidal and inter tidal channels and gutters. Much of the losses in habitat have occurred as a function of Australia's development for urban, infrastructure and agricultural uses - all of benefit to Australia's economy. While better planning and management could have reduced the impact on our coastal marine biodiversity much of the task ahead for Australia is about land use optimisation - seeking the best patterns of use and management that will maximise overall community benefits. Essentially re-creating or repairing key components of coastal habitat for benefits whether it is commercial or recreational fishing, water quality, biodiversity or carbon sequestration. If these restoration efforts are planned and implemented carefully Australia can maximise benefits from its coastal resources while achieving urban, infrastructure and agricultural development. Optimisations by repair and improved management to maximise coastal benefits is gaining momentum internationally. In Australia this is occurring through the work of multiple community interest groups - recreational and commercial fishers, conservation groups, bird observers and natural resource management organisations to name a few. In many cases their work is encouraged by local, state and federal government agencies,. In a modern landscape where there is competition between land uses for scarce resources, such as occurs for virtually all Australia's coasts, benefit statements are essential. The types of questions often asked include:
• what benefit will accrue from repair? • what are the nature of these benefits? • what is the break even point for investment in repair - or when will the economic benefits of
repair exceed the costs? • what are the current benefits that will be foregone?
This research project has attempted to answer the first two of these questions for three broad landscapes - coastal tropical, subtropical and temperate. The project recognised that to accurately answer all four questions it is best undertaken on a location-by-location basis. Therefore the broad goal of this project was to develop scientific information using key indicator-species that can be readily valued financially. Fish and crustaceans have a clear economic marketplace value as a food so the focus was on selected fish and crustacean species. Monetary priced benefits and estimates of increase in monetary benefit in the seafood marketplace can be readily verified for any increase in productivity for taxa such as prawn species because of their clear economic worth. Tables 1 and 2 in chapter 1 summarise the approach taken in the three case study sites. Each of the broad climatic landscapes have differing features in terms of their natural attributes, beneficial species, current protection arrangements and management activities. NSW the subtropical case study certainly has the most advanced suite of features – saltmarshes are recognised as an endangered habitat, protection is in place for what remains and NSW has a very active recreational and commercial fishing lobby, including levy funds and supportive agencies. At the other end of the spectrum Tasmania has no protection or management systems in place and

RepairingAustralia’sseascapes–TropWATERReportno.17/122017
Pageii
indeed up till this project there has been virtually no information of the likely fisheries productivity of these coastal landscapes. Chapter 2 is a descriptive chapter that investigates the most appropriate ways to make estimates of secondary production in saltmarsh systems. Chapters 3-6 summarise the findings from the three case-studies. Chapter 3 (Tropical case study) details the value of estuarine habitats to banana prawns in North Queensland. Chapters 4 and 5 (Subtropical case-studies) explore the benefits of wetland restoration to School Prawns in New South Wales, from a modelling and field-based perspective respectively. Finally, Chapter 6 (Temperate case-study) describes the value of wetland restoration to Tasmanian fish populations. Each chapter is written in the form of a draft scientific article ready for peer review. This has been intentionally done as there is a paucity of relevant literature and a clear need to communicate rapidly and with a sound scientific basis to a whole range of stakeholders. These four chapters stand alone, detailing findings and benefits for the three climate landscapes. Each can be applied across their specific climate landscapes to aid in the discussions and deliberations towards understanding the benefits of protection and repair of wetlands. Furthermore, they can provide sufficient indicator information of likely financial benefits that can then be factored into investment planning such as break-even analysis. Chapter 7 brings the three case studies together, articulating likely benefits and opportunities, both financial and non-financial. It concludes with a call for action, recognising we may never have the most precise scientific estimates of likely improvement flowing from coastal marine biodiversity repair but we do know the benefits will be substantial. The next phases of this work as can be expected vary for each climate landscape. For coastal tropical landscapes of the Great Barrier Reef the Reef Plan 2050 already calls for the repair where possible of these coastal marine seascapes. The next task is to bring together the multiple layers of GIS-based mapping on coastal seascapes and determine which subset of these are the most prospective for repair. For subtropical seascapes the next phase will to be to work on the entire Clarence Estuary. This is the biggest and most productive estuary in NSW and worthy of detailed multi-disciplinary research across ecology, hydrology, flood management, economics and social issues to develop a draft blueprint for repair at the whole of estuary scale. The first task for restoring Tasmanian temperate seascapes is most probably legislative - to gain formal recognition and protection of existing remnants. In parallel, especially for areas such as the case study, repair works could start immediately, benefitting coastal marine biodiversity at no cost to other land uses.

RepairingAustralia’sseascapes–TropWATERReportno.17/122017
Pageiii
TABLEOFCONTENTSEXECUTIVESUMMARY..............................................................................................................................i
TABLEOFCONTENTS...............................................................................................................................iii
Chapter1–Buildingafunctionalunderstandingofcoastalecosystems...................................................6
1.1Definitions.....................................................................................................................................61.2 Thebiologicalandecologicalfunctionofseascapes.....................................................................6
Soilsandvegetation.....................................................................................................................6Coastalwaterqualityandnetprimaryproductivity.....................................................................7Primaryproductivity,foodchainsandbiodiversity.......................................................................7Nurseryhabitat............................................................................................................................7Shorelineprotection....................................................................................................................8
1.3 Habitatlossinseascapes..............................................................................................................8Shiftingbaselinesofproductivityforestuaries.............................................................................9
1.4 LinkstoGovernmentpolicyobjectives.........................................................................................91.5 Phase1NESPFindings................................................................................................................11
Phase1Outputs.........................................................................................................................12Phase2Tasks.............................................................................................................................12Rationaleforthesiteselectionofthe3casestudies..................................................................13Outcomessoughtandtheirapplication......................................................................................14
1.6References...................................................................................................................................16
Chapter2-DevelopingachievablemeasuresoffisheriesvaluesfornorthernAustralia’scoastalwetlandsandestuaries....................................................................................................................................18
2.1ExecutiveSummary......................................................................................................................182.2Introduction.................................................................................................................................19
Background................................................................................................................................19Objectives..................................................................................................................................20
2.3MeasuresofEstuaryandCoastalWetlandValue..........................................................................20Background................................................................................................................................20Methodsusedinthevaluationofwetlandhabitats...................................................................21Pre-requisites for thedevelopmentofachievable, robustandvalidmeasuresofECWvalue fornorthernAustralia.....................................................................................................................24
2.4EstimatingFisheriesProduction....................................................................................................252.5SamplingMethodsforEstimatingDensityandProduction...........................................................26
Background................................................................................................................................26Detailsofappropriategears.......................................................................................................26
2.6 Considerations for theDevelopment ofAppropriateMeasures ofValue forNorthernAustralianECWs.................................................................................................................................................28
Meaningfullylinkingestimatesofbiomassdensitytoareasofhabitat.......................................28Theecologicalcontextofthespeciesanditslinktoproductivity................................................29Thestateofunderstandingofspeciesandcommunityecology..................................................31Conclusion.................................................................................................................................32
2.7References...................................................................................................................................34
Chapter3-ImprovingOurAbilitytoEstimatetheValueofEstuarineNurseryHabitatstoJuvenileBananaPrawns(Fenneropenaeusmerguiensis)inNorthQueenslandEstuaries.............................................40
3.1Abstract.......................................................................................................................................403.2Introduction.................................................................................................................................40
Productionestimates.................................................................................................................41SourcesofNutrition...................................................................................................................42
3.3Methods......................................................................................................................................43

RepairingAustralia’sseascapes–TropWATERReportno.17/122017
Pageiv
EvaluatingF.merguiensisproductivity.......................................................................................43Sourcesofnutrition...................................................................................................................45
3.4Results.........................................................................................................................................46EvaluatingF.merguiensisproductivity.......................................................................................46Sourcesofnutrition...................................................................................................................51
3.5Discussion....................................................................................................................................53Sourcesofvariabilityinbiomassdensityestimates...........................................................53Evaluatingtheimportanceofparticularhabitattypestoprawnnutrition........................53Evaluatingthevalueandvalidityofproductivityestimatesatdifferentscales.................54
3.6References...................................................................................................................................58
Chapter4-Utilisationofarestoredwetlandbyacommerciallyimportantspeciesofpenaeidshrimp...62
4.1Abstract.......................................................................................................................................624.2Introduction.................................................................................................................................634.3MaterialsandMethods................................................................................................................64
Studyarea..................................................................................................................................64Samplingdesignandapproach...................................................................................................65Sampleprocessinganddataanalysis..........................................................................................65
4.4Results.........................................................................................................................................654.5Discussion....................................................................................................................................70
Patternsinabundance...............................................................................................................70Implicationsforfisheriesproductivityandfuturehabitatrehabilitation.....................................71Conclusionsandfuturework......................................................................................................71
4.6References...................................................................................................................................72
Chapter 5 - The potential benefits for School Prawn (Metapenaeus macleayi) from targeted habitatrepairinthelowerClarenceRiverestuary.........................................................................................75
5.1Abstract.......................................................................................................................................755.2Introduction.................................................................................................................................765.3MaterialsandMethods................................................................................................................77
Studyarea..................................................................................................................................77Habitatmapping........................................................................................................................78Determinationofrecruitmentsubsidyfromhabitatrepair.........................................................78Simulationmodel.......................................................................................................................78
5.4Results.........................................................................................................................................805.4Discussion....................................................................................................................................84
Broaderbenefitsderivedfromrepair.........................................................................................84Implicationsforrepair................................................................................................................84Comparisonofscenarios............................................................................................................86Conclusions................................................................................................................................87
5.5References...................................................................................................................................88
Chapter6-FishuseofTasmaniansaltmarshwetlands:benefitsforfishfromtidalrestorationandcoastalrehabilitation....................................................................................................................................91
6.1Abstract.......................................................................................................................................916.2Introduction.................................................................................................................................926.3Materialsandmethods................................................................................................................93
Studyarea..................................................................................................................................93Samplingdesign.........................................................................................................................94Samplingprocedure...................................................................................................................95Dataanalysis..............................................................................................................................95
6.4Results.........................................................................................................................................966.5Discussion..................................................................................................................................103

RepairingAustralia’sseascapes–TropWATERReportno.17/122017
Pagev
Fishspeciescompositionanddensity.......................................................................................103Patternsoffishuseandimplicationsforcoastalrehabilitation................................................103Differenceinfishusebetweenunalteredandalteredsaltmarshes...........................................104Valueofsaltmarshforfishandseascapefoodweb..................................................................106Managementimplications.......................................................................................................106Conclusion...............................................................................................................................106
6.6References.................................................................................................................................108
Chapter7-BuildingaBusinessCaseforSeascapeRepairandProtection.............................................111
7.1-Seascapes–achecklistoftheirecosystemservices..................................................................1117.2 Valuingthebenefitsofrepairtoseascapes..............................................................................112
EastCoastTropical...................................................................................................................112EastCoastSubtropical..............................................................................................................113EastCoastTemperate..............................................................................................................115
7.3Aframeworkforinformingfutureinvestmentinseascaperepairandlearning...........................116Consideringasinglecandidateproject.....................................................................................116Consideringmultiplecandidateprojects..................................................................................117Prioritizationwhenwehavenointerestinlearning.................................................................117Prioritizationwhenweareabletolearn..................................................................................119ConcludingComments.............................................................................................................121
7.4References.................................................................................................................................123

RepairingAustralia’sseascapes–TropWATERReportno.17/122017
Page6
CHAPTER1–BUILDINGA FUNCTIONALUNDERSTANDINGOFCOASTALECOSYSTEMS1.1Definitions
Saltmarshesgenerally refers tothemosaicofcoastalwetlandvegetationtypesthatoccupyareasof lowenergywithintermittenttidalinundation,typicallyinbays,inletsandestuaries,onshelteredsoftsubstrateforeshores,oftenoccurringbehindmangroves.Seascapes is a broadermore functional definition for themosaic of intertidal, sub-tidal and supra-tidalareasthat includechannels,gutters,mudflats,mangroveclumpsandfringes liningchannelsandvariouscommunities of salt marsh vegetation. The seascapes concept conceptualizes a nursery as “a spatiallyexplicit seascape consisting of multiple mosaics of habitat patches that are functionally connected” byNuagelkerken et al (2015) to foster investigation and analysis of the functional attributes of theseimportant ecosystems. These seascapes serve multiple functions including sediment trapping, nutrientcycling, dissipation ofwave energy, fish and prawnnursery, carbon sequestration and resting / feedingareasforbirds.Thenurseryconceptherereferstothelifecycleofmostofourinshorespecies–havingtheearlypartoftheirlifehistorywithintheshelteredwatersofestuaries,embaymentsandwetlands.1.2 Thebiologicalandecologicalfunctionofseascapes
Seascapes are functionally part of the continuum that drives coastal ecological productivity (e.g.Laegdsgaard2006;VictorianSaltmarshStudy2011;SaintilanandRogers2013;Creightonetal.2015),bylinkingmangroves to freshwaterwetlands.The sustainabilityof seascapes relieson tidal inundationandfreshwater inputs fromrain,groundwater flowsand rivers. Inputsof freshwater can influencesoil andwater salinities and the nutrient dynamics andmovement of sediments (e.g. Victorian Saltmarsh Study2011).Theirprovisionofecosystemservicesreliesonconnectivitybetweenlandandseabeingmaintainedsobothfreshwaterandtidalwaterhaveadequateopportunitiestomeet.BarrierstoconnectivityoccuralongalmosteveryriverandestuaryinthemorepopulatedpartsofAustralia(Creightonetal.2015).Re-instatingconnectivityforbiological,chemicalandhydrologicalfluxesiskeytore-establishingnetprimaryproductivity.SoilsandvegetationSeascape sediments generally consist of poorly sorted anoxic sandy silts and clays. Carbonateconcentrationsare low,concentrationsoforganicmaterialarehighandthesedimentsmayhavesalinitylevelsthataremuchhigherthanthatofseawater.Acidsulfatesoilshavethepotentialtobecomeoxidised,releasing significant amounts of sulphuric acid into coastal waterways leading to chronic poor waterqualityandfishkills(Creighton2013).Vegetatedsaltmarsh-communitiescanbedominatedbyasingleplantspeciesoroccurasamosaic,withthediversityofplant species increasing inhigherelevatedareas thatare less frequently inundated.Thecombinationofsalinity,elevationandinundationthatisresponsibleformanyofthepatternsseeninthedistribution of saltmarsh plant species has been extensively studied (examples include Adam 1981a; b;1990; King 1981; Zedler et al. 1995; Streever and Genders 1997). Zonation patterns of vegetation insaltmarsheshasbeendescribedindetail(e.g.Zedleretal.1995;StreeverandGenders1997).Vegetationis usually zoned parallel to the shoreline, and there is a general broad scale zonation from the estuarylandward.Thezonescanbedescribedaslower,midandupperlevels,usuallyeachwithadistinctmosaicofspeciesthatisoftencomplicatedbysmall-scalepatchiness.Succulentsdominatethelowermarsh(e.g.Sarcocorniaspp.),whilethemid-marshusuallycontainsspeciessuchasSporobolusspp.andSamolusspp.TheuppermarshisamosaicofspeciesincludingJuncuskraussiiandBaumeajuncea.Theareabehindtheuppermarsh under natural conditions can be brackish to fresh back swamps dominated by sedges and

RepairingAustralia’sseascapes–TropWATERReportno.17/122017
Page7
casuarinas (e.g. Casuarina glauca) in the saltier, sometimes tidally inundated areas transitioning tomelaleucas(e.g.Melaleucaquinquenerva)andvariousreedsandsedges(e.g.Phragmitesaustralis)inthefreshswampsandtheneucalyptsandangophoras(e.g.Angorphoracostata).CoastalwaterqualityandnetprimaryproductivitySeascapes,asareallcoastalwetlands,aresometimesdescribedas‘nature’skidneys’,helpingtomaintainwaterqualitybycollecting,assimilatingandrecyclingnutrientsandcontaminantsfromrunoff(reviewedinCreighton2013).Aswaterflowslows,sedimentsandchemicalsdropoutofthewatercolumn,dissolvedoxygenlevelsincreaseandnutrientlevelsreduce.Highratesofproductivityleadtohighratesofmineraluptake, and decomposition processes take place in wetland sediments. Seascapes remove nitrates andphosphates processing and transferring these inputs into biological outputs such as diatoms andphytoplankton−essentialcomponentsofthecoastalandmarinefoodchain.Seascapesalsoperformnecessarywaterquantityfunctions,moderatingtherateofcatchmentrunoff.Byreducing strength of flow and ensuring a more dampened water flow hydrograph these brackishecosystemsarekeytofosteringhighlevelsofcoastalnetprimaryproductivity.Indeedabrackishestuarinesystemlinkedtobothfreshandtidalwaterisoneoftheworld’smostproductiveecosystems.Inparallelwiththeirroleinmoderatingandslowingcatchmentrunoff,seascapeswiththeiroften-sandysediments,gutters and channels play a role in coastal groundwater recharge. This again results in longer returnperiods and expanses of brackish water between fresh and seawater, leading to highly productiveecosystems and thus net primary productivity. From awater quality perspective, these ecosystems areassimilatingnutrientsandtranslatingthemintothebasicbuildingblocksfornetprimaryproductivity,suchasdiatomsandphytoplankton.Primaryproductivity,foodchainsandbiodiversitySeascapes by virtue of being highly productive linked ecosystems and communities provide substrate,shelterand food foradiverse rangeof species including fish, invertebrates,mammals,birdsandplants.Soilsof saltmarshescontaina lotofdecomposingplantmaterial that feedawide rangeoforganisms infoodwebs,frombacteriaandfungithroughtomammals(VictorianSaltmarshStudy2011).Theproductionofbiomassintheseecosystemscanbeoverthreetimeshigherthaninaterrestrialecosystem.Theaboveground net primary productivity of Australian coastal saltmarsh plants has been estimated to rangebetween3-13tonnesha-1year-1(CongdonandMcComb1980;ClarkeandJacoby1994;ascitedinVictorianSaltmarshStudy2011).Specialised plants provide the foundation for food chains in seascapes. As plants die and decompose,bacteriaand fungibreakdowntheplantdetritus,converting it intocarbohydratesandproteins thataremore easily digestible by crabs, finfish and filter feeders such as oysters or mussels. Algae also play asignificantrole infuellingthebiotaandhighproductivityoftheseecosystems. Inaddition,thesaltmarshcomponent sequesters significant quantities of carbon both in plants and in the sediment below them.Colloquiallypartof ‘bluecarbon’,saltmarshesareamongthehighestcarbonsequestersofallvegetationcommunities(Lawrenceetal2012).Protectionofexistingsaltmarshensuresthatthisaccumulatedcarbonisnotreleasedascarbondioxideintotheatmosphere.Repairingsaltmarshes,mangrovesandseagrasseswilladdtothevolumeofcarbonsequesteredintheAustralianlandscape.“Bluecarbon”unfortunatelyisnot yet part of Australia’s National Carbon Accounts so no Australia-wide estimates of sequestrationbudgetsandfluxesisavailable.NurseryhabitatSeascapesprovidehabitatandshelterandthereforeoftenactasnurserygroundsformanycommerciallyimportant fish, as well as for fish and crustacean species that are part of the coastal andmarine foodchain. Commercial and recreationally important species that exploit seascapes in their nursery phasesinclude yellowfin bream (Acanthopagrus australis), dusky flathead (Platycephalus fuscus), sand whiting(Sillagociliate),severalmulletsspecies(e.g.seamullet,Mugilcephalus),garfish(Arrhamphussclerolepis),mulloway (Argyrosomus japonicus]) eels and many crustaceans such as mud crabs (Scylla serrate) and

RepairingAustralia’sseascapes–TropWATERReportno.17/122017
Page8
prawns (e.g. School prawn,Metapenaeus macleayi; Banana prawn, Fenneropenaeus merguiensis; andwesternschoolprawns,Metapenaeusdalli)(Daly2013,Creighton2013).Themultiplehabitatsandmosaicpatternsof seascapes functionasnurserygroundsandunique feedingandhabitatopportunitiesforlarvae,severalspeciesofthreatenedmicro-batsandbirdssuchasmigratoryshorebirds (Saintilan and Rogers, 2013). Birds are diverse including foraging rails, crakes, plovers, stilts,avocets, ibis, egrets and ducks, and roosting swans, cormorants and pelicans (e.g. Land ConservationCouncil 1993 as cited by Victorian Saltmarsh Study 2011). Migratory birds protected under federallegislationandinternationaltreaties(e.g.ChinaAustraliaMigratoryBirdAgreementorCAMBAandJapanAustraliaMigratoryBirdAgreementorJAMBA)roostandfeedinthemultiplemicro-habitatsprovided.ShorelineprotectionSeascapesprotectshorelinesfromerosionbybufferingwaveactionandtrappingsediments.Theyreduceflooding by slowing and absorbing rainwater and protect water quality by filtering runoff, and bymetabolisingexcessnutrients(e.g.http://oceanservice.noaa.gov/facts/saltmarsh.html).Seascapesprotectestuaryforeshoresbydissipatingtheenergyofwindandwaveactionandprovidinganaturalbufferthathelpsminimise erosion (e.g.Moller et al., 1996).With predicted increases in storm surge intensity andrisingsealevelsassociatedwithachangingclimate,theselandscapeswillbecomeincreasinglyimportantinprotectingestuaryforeshores(Creighton2014).1.3 Habitatlossinseascapes
Seascapesarethreatenedbyvirtueoftheircoastallocationandcloseproximitytourbanareas.Theirflatprofile, apart from the various gutters and tidal channels, makes them amenable to being filled anddrained, and converted to sports fields, houses, and canal- or industrial estates. Saltmarshes havefurthermore been drained, sometimes filled and levees constructed to exclude tidal inundation withincoastal floodplainenvironments,aspartof landdevelopment foragriculture (e.g.cane lands)orgrazing(e.g.pondedpastures)Lossofseascapesisoneofthekey-contributingagentstothelossofamenityandconditionofourcoastalresources.AnAustralia-wideassessmentof1000estuariesandembaymentsundertakenbytheNationalLandandWaterResourcesAuditof1997-2002(NationalLandandWaterResourcesAudit2002)indicatedthat30%weremodifiedtosomedegree.ThemosthighlydegradedwereinNewSouthWales,where40%wereclassifiedas‘extensivelymodified’and10%were‘nearpristine’.Sincethatreview,urbanpopulationshavecontinuedtogrowrapidly,andincreasingpressuresforindustrialandagriculturaldevelopmentinthecoastal zone have resulted in ongoing degradation of Australia’s estuaries and embayments. Thisdegradationhashadseriouseffectsonbiodiversity,carbonsequestration(e.g.Lawrenceetal2012)andcommercialandrecreationalfishing(Creightonetal2015).Specificquantitative informationon the lossof critical habitat is available fromanumberofhabitat-orregion-specific studies toexpandupon theNational LandandWaterResourcesAudit’s (2002)Australia-wide assessment. Saintilan and Williams (2000), for example, reviewed the record of loss of coastalsaltmarsh ineasternAustralia sinceWorldWar2, and reported lossesas100% forpartsofBotanyBay,NewSouthWalesovertheperiod1950-1994and67%fortheHunterRiver(excludingHexham)from1954-1994.HartyandCheng(2003)reportedalossof78%ofsaltmarshesinBrisbaneWater,nearGosford,NewSouthWales,between1954and1995.SinclairandBoon(2012)showedthatthestate-widelossofcoastalwetlands(mainlymangrovesandseascapes)inVictoriasinceEuropeancolonisationhasbeenvariously5-20%byareaacrossthestate,withthegreatestlossesoccurringinheavilyurbanisedareassuchasaroundPortPhillipBay(~50%loss)andinagriculturallydevelopedregionssuchasGippsland(e.g.60%lossfromAndersonInletinSouthGippsland).As noted under the National Land and Water Resources Audit (2002) and the National VegetationInformationSystem, there isnoconsistentand functionallyAustralia-widemapof saltmarsh landscapes,

RepairingAustralia’sseascapes–TropWATERReportno.17/122017
Page9
either pre 1770 or current. This was detailed in Creighton et al. (2015; Phase I of this project) whenattemptsweremadetocollateareasofpriorandcurrentsaltmarshinthecasestudyStates.Historically,vegetationmappinghasusuallybeenundertakenataStateorregionalscaleandhasvariedinattributes Stateby State.Oftenmappinghasbeen strictly fromabotanical perspective,nominating keyplantspeciesorsometimescomplexesofspecies.Areassuchasfringingmangroves,tidalguttersandmudflats thatare functionallypartof the seascapeshavebeenomitted from thepriormapping. Fromanetprimaryproductivity or biodiversity perspective virtually all this priormapping is onlymarginally useful.Indeed the recognition of ecological function and biodiversity outcomes is key to our rationale for thisprojecttoexplorethesecoastalsystemsfromaseascapesperspective.
Humandevelopmentcanaltersaltmarshesandmangroves.Photocredit:PaulBoon
ShiftingbaselinesofproductivityforestuariesIt follows thatwith the losses of habitat, connectivity, tidal flows and changes to catchment hydrologytherehavebeensubstantialreductionsinestuaryproductivity.Creighton(1984)exploresthisconceptfortheCamdenHavenandproposessubstantialinvestmentinrepairactions(Creighton2015).Pauly (1995)contendsshiftingbaselinesarekeytounderstandinghowfisheriesmanagementhas failed.EssentiallythissyndromeaccordingtoPaulyhasarisenbecauseeachgenerationofmanagementacceptsas a baseline the stock size and species composition as known early in their careers and uses theseperceivedbaselinestoevaluatemanagementactions.Withongoingstockandspeciesdeclinetheresultisagradual shiftof thebaseline,anaccommodationbymanagementof thedisappearanceof speciesandacceptance of the reduction of net primary productivity. This then adversely impacts on managementdecisions and most importantly perceptions and motivations for repair of fisheries habitats especiallyessentialnurseryareasandconditionssuchasseascapesandtidalflowsandfluxes.1.4 LinkstoGovernmentpolicyobjectives

RepairingAustralia’sseascapes–TropWATERReportno.17/122017
Page10
AustralianandstateGovernmentpolicyandregulationshaverecognizedtheimportanceofthesecoastallandscapes.Examplesinclude:
• EPBCAct-SubtropicalandTemperateCoastalSaltmarshThreatenedCommunityRecoveryPlan;• Capricorn (Dawson) subspecies of the yellow chat (Epthianura crocea macgregori) is listed as
“Critically Endangered”. Salt marsh in the Fitzroy River Delta and Torilla Plains is critical forbreeding,feedingandshelterforthisspecies.
• VariousState-basedhabitatretentionandmanagementlegislationandpolicies

RepairingAustralia’sseascapes–TropWATERReportno.17/122017
Page11
1.5 Phase1NESPFindings
For Australia’s seascape landscapes information is readily available on vegetation types and themix ofspeciesthatmakeupthemosaicofwetlandsfrommangrovesthroughthetidalheightspectrumofinter-tidal, to supra-tidal and highest astronomic tides to the fresh water systems of sedges, reeds, andMelaleucadominatedwetlands. Formoststates,thesevegetationtypesarereliablymappedandspatialdata sets are readily available. Likewise, for most states the areas of wetland loss can be broadlyestimated and the cause of loss detailed. Similarly, current threats to wetland integrity are welldocumented.InstatessuchasNewSouthWalesandQueensland,thisinformationhasalsoledtovariousmechanismstoprotectremainingseascapes.For all states, key sites for repair can be at least broadly identified. Likewise, the role of seascapes inmarine net primary production, crustacean and fish nursery phases, carbon sequestration, nutrientassimilation,coastal foreshoreprotection,birdhabitatandrelatedecological functions isbroadlyknownandgenerallyparallelsthatfoundglobally.ThissynopsisalsofoundthatAustraliacannotyetcategoricallyascribe levels of net primary production to seascapes or indeed estimate the biomass of high value,fecund, annual and high profile species such as prawns, let alone quantify food chains and the equallycomplexissueofquantifyingtheirroleinfishpopulations.Inbrief,thefindingsofPhase1NESPprojectwere:
§ Salt marshes and seascapes generally are undervalued by the Australian community, asdemonstrated by their alteration and by the general lack of understanding as to their role inestuaryproductivitysuchasprawnbiomass;
§ Substantialareashavebeenlost,especiallytoagriculture;§ In some areas urban development planning (often infrastructure such as road and rail) has not
accountedfortheneedfortidalflowstoensureongoingfunctionandconnectivity;§ Theleveloflegalprotectionvariesacrossstatesfromsubstantial(e.g.QueenslandandNSW)tonil
(e.g.Tasmania);§ Mapping and spatial data sets have often focused on vegetation type rather than function.
Definitionsofvegetationtypeandwetlandtypearenotalwaysconsistentacrossstates;§ ChangessuchaspercentlossofsaltmarshessinceEuropeansettlementarewelldefinedforsome
statessuchasQueensland,butnotforotherssuchasNSW;§ Ecosystemserviceswilldifferdependingonthecomplex,thegeographyandestuarytype;§ Likewise, articulating the key benefits as an input to business cases for repairwill need to vary
acrossstatesandlocalities;§ Therefore a ‘one size fits all’ approach communicating the value in terms of broad ecosystem
servicesisunlikelytowork;§ Therearemanysitesforrepairforeachstateandthereisvalueincontinuingtodevelopbenefit
statements than can be used as part of the decision-making processes towards protection andrepair;
§ This work is probably best done at the seascape level – recognising the inter-dependence andinter-relationshipsof thevariouswetlandvegetationtypes inestuaryproductivity fromsub-tidalsuchasseagrassestotidalsuchasmangroves,saltmarshesandmudflatstothefreshtobrackishbackswamps.
Given this assessment, key knowledge gaps and priorities for research and management identified inPhase1were:
§ Build a more seascapes-level scale of knowledge and appreciation on the role, function andbenefitsofcoastalwetlands;
§ Improveunderstandingofthedifferentbenefitsprovidedbytheseseascapesindifferentregions(e.g.quantifyingfishproduction,shorelineprotection,carbonsequestration);

RepairingAustralia’sseascapes–TropWATERReportno.17/122017
Page12
§ Develop tailoredcommunicationmediabasedon thebenefitsprovidedby these seascapeswiththeir different suites of vegetation communities comprising the mosaic commonly known ascoastalwetlands;
§ Focus on benefits and functions that are directly relevant to coastal stakeholders such asrecreationalandcommercial fishers.Forexample,promotionof their role in fishproductionwillmostlikelyresonatewithfishersandcanbeusedtopotentiallyengagethesegroupsinseascapesconservation andprotection. This also opens up resourcing opportunities to formpublic-privatepartnershipssuchasthevariousrecreationalfishingtrustfunds;
§ Prioritiserestorationsitesineachstateandundertakecasestudiesontheseprioritiestofosteranincreaseinrepairinvestment;
§ Develop other benefit statements as potential markets emerge (e.g. models for carbonsequestrationthatcouldbeusedincarbonmarkets).
Certainly,ifabusinesscaseistobedevisedforinvestmentinseascaperepairthenquantificationoftheirpotential value and returns to the health and productivity of coastal and marine systems is essential.There aremany competing demands on both public and private investment streams. Quantification ofpotential benefits using simple readily understood indices is essential so that the costs and benefits ofinvestmentinrepaircanbecomparedtootherpossibleinvestmentactivities.Readily identifiable and high value indicators of biomass such as prawns could be useful as an initialindicatorofvalue.Atabroaderscale,quantificationofallecosystemservicesthattheseseascapesprovideshould be prioritised. However, this broader-scale quantification will require substantial resources.Accordingly, thissecondphaseof theprojectwill focus firstandforemostonquantifyinghighvalueandreadilyunderstoodindicatorsofbenefits.Phase1OutputsReports:
• CreightonC,GilliesCLandMcLeodIM(Eds)(2015)Saltmarshhabitats:Asynopsistounderpinthe
repair and conservation of Australia’s environmentally, socially and economically important
baysandestuaries.TropWATERReport15/59,JamesCookUniversity,Townsville,88pp• Five Regional Reports (GBR region, New South Wales, Victoria, Tasmania, South Australia and
WesternAustralia)• Allreportsavailablefordownloadfrom:www.saltmarshrestoration.org.au•
Website
• www.saltmarshrestoration.org.au• This website includes background information relevant to the project and an information Hub
wherepeoplecandownloadtheNESPreportsandotherrelevantdocuments.Phase2TasksTheprimaryobjectiveistoprovideinformation,factsandfiguresthatcanbeusedbythoseadvocatingtheprotectionandrepairoftheseimportantcoastalsystems(Table1).Thisinvolves
1. Estimating the benefits of seascape repair for an easily publicly understood indicator – e.g. keyprawnandfishspecies.
2. Undertaking this work in three case studies, wherever possible in parallel with potential repairworkssothatveryconcretecasestudiesareavailabletodemonstratethebenefitsofrepair:

RepairingAustralia’sseascapes–TropWATERReportno.17/122017
Page13
§ Tropical–QldDryTropics,probablyBurdekin/CapeBowlingGreenregionwithitsextensiveseascapes,especiallyexistinggoodconditionseascapestodemonstratelikelyrepairbenefitsofareasthathavebeenlosttopondedpasturesand/ortidalimpoundments
§ Sutropical - NSW’s largest estuary the Clarence focusing on Lake Wooloweyah and bothexisting seascape landscapes such as parts ofMicalo Island and the potential for repair offloodmitigated landscapes such as theextensiveback swampof LakeWooloweyah’s southwesternforeshoreadjacenttoYuragirNationalPark
§ Temperate – Tasmania and probably involving natural areas as well as areas for potentialrepairsuchasPittWater.
Table1:SummaryofActivitiesActivities1.QuantifythebenefitsofsaltmarshrepairusingprawnsandfishassimpleindicatorsCollect data to address theknowledge gaps on the keyecosystem benefits provided byseascapes by quantifyingexamplesofproductivity
Tropical
Focus on banana prawns as an example of a keycommercial and recreational species. Work involvedevaluating the quality of productivity estimates thatwere possible and validating food web links thatsupportproductivity.
Subtropical
Quantitative sampling of School Prawn within arestoredwetland,toidentifythepotentialrecruitmentsubsidythatmaybederivedfromsimilarhabitatrepairelsewhere. Apply this data in a fishery model toevaluate a habitat repair scenario for LakeWooloweyah in the Clarence River, to quantify thepotential economic outcomes that can be derivedthroughtheassociatedrecruitmentsubsidy forSchoolPrawn.
Temperate
Fishsampledinlargenumbers(>80fishper100m2)in“altered”saltmarshes,includingthosebehindnaturallybreached levees. This indicates potential fisheriesbenefits from planned breaching of further levees, innegotiationwithlandmanagers,toexpandfishhabitatandbroaderseascapeproductivity.
2.BuildasummaryBusinessCasethatarticulatesbenefitsandidentifiesopportunitiesforrepairCollate findings from these3 case studiesand integratewithproposed repair investments toassess theeconomicandenvironmentalbenefitsofrepair.
Rationaleforthesiteselectionofthe3casestudiesWithlimitedresourcesintheNESPproject,researchwasconcentratedonAustralia’seastcoastwhilestillattempting to cover the range of ecological productivity, social and policy issues thatwill impact uponrepair motivations within the community. The matrix summarizes the underpinning rationale to casestudyselection(Table2).Table2:CasestudyselectiontoinformseascaperepairandprotectionmotivationsClimateZone CaseStudy Biophysical
ProductivityKnowledge
CommunityAwareness
PolicyFramework
Tropical Bowling Green,NorthQld
Sufficient to compileopportunities forproductivityimprovements [e.g.
Ponded pastures and thebenefits of their removalalready demonstrated [e.g.Cape Bowling Green
Saltmarshes, mangroves andtidal channels protectedunder Fisheries Act. Majorinvestment in repair

RepairingAustralia’sseascapes–TropWATERReportno.17/122017
Page14
banana prawns]. Thebanana prawn exampleallowsassessmentofwhatproductivityestimatesarepossible given currentknowledge and availabletechniques. Other speciesyet to be well quantifiedin terms of productivityreturns and will requiremore extensive datacollection
National Park BiodiversityFundproject].Localanglinggroups aware of the valueof wetlands as arecommercialfishers.
proposed under Reef Plan2050.
Subtropical Clarence,NSW Limited knowledge ofbiologicalproductivityandchanges to net primaryproductivityofestuaries.Generally well developedknowledge of species lifehistory, both crustaceanand fin fish so thatnursery habitat needs arewelldocumented.
School Prawn are a highlyvalued commodity by bothprofessional andrecreational fishers.Momentum for seascaperepair building andinvestmentsourcessuchasRecreational Fishing Fundsincreasingly interested inseascaperepair.
Coastalsaltmarshhabitatandassociated ecologicalcommunity is listed as an“endangered ecologicalcommunity” under NSWThreatened SpeciesConservation Act. StateFisheries agencies identified“restore key habitat areas toenhance natural productivitywithinaquaticecosystems”asaKeyResultArea instrategicplan.
Temperate Northern coast,Tasmania
Verylimitedknowledgeofsaltmarshes in relation tothe seascapes – onlyrecently mapped anddocumented. Almost noinformation available onfishuseofsaltmarshes.
Building awareness ofsaltmarshes and theirseascapes from abiodiversity perspective.Improving awareness oftheir value for fisheries.Starting a conversation onsaltmarsh and seascapemanagement from afisheriesperspective.
No recognition ofsaltmarshes and theirseascapes and their valueswithinStatelegislation.Someprotection afforded underthe State planning regime,subjecttoenforcement..
Outcomessoughtandtheirapplication
1) Improved understanding of prawn / fisheries productivity and broader ecosystem benefits ofseascapesinthreecontrastingcommunities(temperate,sub-tropicalandtropical);
2) Quantificationofeasilyunderstandable,ecosystembenefits (e.g.prawnproduction)providedbyseascapes inwhichtocommunicatetheirvalue in termsofbenefits tocoastalstakeholders (e.g.recreationalfishers)andthebroaderAustralianpublic.
3) Communication resources that simply articulate the value of seascapes and their need forprotection,conservationandrepair.
Thisinvestmentwillprovidebaseinformationrequiredtoinformandscopelarge-scalerepairinvestmentopportunities for Australia’s most threatened coastal marine habitats. Equally importantly, it will beparalleledbyinvestmentsinhands-onrepairinanumberofsmalltomediumscaleprojects.Estuary habitat repair is a developing area of community interest, especially in those states withrecreational fishing license fees, as habitat improvements generally rank at the top of the investmentprioritiesofrecreationalfishingcommunities. Importantly, ‘habitat’ isalsothecommongroundbetweentherecreationalandcommercialfishingsectorsandenvironmentalgroups.Thepracticaloutcomesthisprojectwilldeliverinclude:

RepairingAustralia’sseascapes–TropWATERReportno.17/122017
Page15
1. Improvedunderstandingofthelocation,ecologyandfunctionalroleofsaltmarshesandtheirrolein supporting the ecological health and productivity of estuaries (documented in journal papersandinmedia);
2. Summaryevidenceoftheproductivityandeconomicbenefitsthatareexpectedtobegeneratedwithrepair;
3. Framework for data collection, analysis and reporting to accompany/evaluate any repairinvestmentandbest-practicerestoration;
4. Provideaneasilyunderstandabledemonstrationof thebenefitsof seascapesand their repair tothecommunity(e.g.prawnproductivity).
RepairingAustralia’sseascapes–TropWATERReportno.17/122017
Page16
1.6References
AdamP.1981a.Australiansaltmarshes.Wetlands(Australia)1:8_10.
AdamP.1981b.SaltmarshplantsofNSW.Wetlands(Australia)1(1):11_19.
AdamP.1990.SaltmarshEcology.CambridgeUniversityPress,Cambridge.
Creighton,C1984TheCamdenHavenFishingandOysterIndustriesUniversityofNewEnglandandNSWCoastalCouncil
Creighton,C.2013.RevitalizingAustralia’sEstuaries.FRDCReport2012-036http://frdc.com.au/research/Documents/2012-036-Business-Case.pdf
Creighton,C.2014.MarineAustralia–DirectionsformanagementandfurtherresearchFRDC2009/074FisheriesResearchandDevelopmentCorporation,Canberra.
Creighton,C.,Boon,P.,Brookes,J.,andSheaves,M.2015.RepairingAustralia’sestuariesforimprovedfisheriesproduction:Whatbenefits,atwhatcost?JournalofMarineandFreshwaterResearch66:493-507
Creighton,CGilliesC,McLeodIM(InReview).Saltmarshhabitats:AsynopsistounderpintherepairandconservationofAustralia’senvironmentally,sociallyandeconomicallyimportantbaysandestuaries.TropWATERReport15/59fortheNESPBiodiversityHub.
Daly,T.2013CoastalSaltMarshNSWDepartmentofPrimaryIndustriesPrimeFact1256
GreatBarrierReefNRMgroups(2015)InvestmentPlan–respondingtotheLongTermSustainabilityPlan2050
KingR.J.1981.Mangrovesandsaltmarshplants.In:ClaytonM.N.andKingR.J.(eds),MarineBotany:AnAustralasianPerspective.LongmanCheshire,Melbourne
Laegdsgaard,P.2006.Ecology,disturbanceandrestorationofcoastalsaltmarshinAustralia:areview.WetlandsEcologyandManagement14:379-399
Lawrence,A.J.,Baker,E.,Lovelock,C.E.2012.Optimisingandmanagingcoastalcarbon:ComparativesequestrationandmitigationopportunitiesacrossAustralia’slandscapesandlanduses,FRDCReport2011/084,FisheriesResearchandDevelopmentCorporation,Canberra
Moller,G.1996.AnecologicalandphysicalassessmentoftheconditionofstreamsintheHerbertRivercatchment.Unpublishedreport.Brisbane:QueenslandDepartmentofNaturalResources:88pp.
Nagelkerken,Sheaves,Baker&Connolly.2015.Theseascapenursery:anovelspatialapproachtoidentifyandmanagenurseriesforcoastalmarinefaunaFishandFisheries2015,16,362–371
NationalLandandWaterResourcesAudit.2002.AustralianCatchment,RiverandEstuaryAssessment2002CommonwealthofAustralia,Canberra
PaulyD.1995.Anecdotesandtheshiftingbaselinesyndromeoffisheries.TrendsinEcologyandEvolution10,430.
Saintilan,N.&Rogers,K.2013.ThesignificanceandvulnerabilityofAustraliansaltmarshes:implicationsformanagementinachangingclimate.MarineandFreshwaterResearch,64(1),66-79.
SaintilanN,WilliamsRJ.2000.ThedeclineofsaltmarshinsoutheastAustralia:resultsofrecentsurveysWetlands(Australia)18,49-59.
SinclairS,BoonPI.2012.ChangesintheareaofcoastalmarshinVictoriasincethemid19thcentury.Cunninghamia12,153-176.
StreeverW.J.andGendersA.J.1997.Effectofimprovedtidalflushingandcompetitiveinteractionsattheboundarybetweensaltmarshandpasture.Estuaries20(4):807_818.

RepairingAustralia’sseascapes–TropWATERReportno.17/122017
Page17
VictorianSaltmarshStudy.2011.MangrovesandcoastalsaltmarshofVictoria:distribution,condition,threatsandmanagement.InstituteforSustainabilityandInnovation,VictoriaUniversity,Melbourne.Boon,PAllen,TBrook,JCarr,GFrood,DHarty,CHoye,JMcMahon,AMathews,SRosengren,NSinclair,SWhite,MandYugovic,J.
ZedlerJ.B.,NelsonP.andAdamP.1995.PlantcommunityorganizationinNewSouthWalessaltmarshes:Speciesmosaicsandpotentialcauses.Wetlands(Australia)14:1_18.

RepairingAustralia’sseascapes–TropWATERReportno.17/122017
Page18
CHAPTER 2 - DEVELOPING ACHIEVABLE MEASURES OF FISHERIESVALUES FOR NORTHERN AUSTRALIA’S COASTAL WETLANDS ANDESTUARIESMarcusSheaves1,2,KátyaGAbrantes1
1CollegeofScienceandEngineering,JamesCookUniversity,Townsville,QLD,Australia2TropWATER,JamesCookUniversity2.1ExecutiveSummary
Healthyestuariesandcoastalwetlands(ECWs)andtheirhabitatsplayvitalrolesinsupportingcoastalfoodwebs and fisheries production, acting as critical feeding, nursery and reproductive areas for manyimportant species.However,Queensland’sECWsare severelydegradeddue to impactsof adiversityofanthropogenicstressors.Asaconsequence,ECWfunctionhasbeencompromisedbysubstantiallossesofsome of Queensland’s most productive of aquatic habitats. Careful management and repair andrevitalisation actions are therefore urgently needed. These actions need to be well targeted, carefullyprioritised, and their success evaluated. Fundamental to this is the need to be able tovalue ECWs andtheir habitats. However, a number of gaps in the current scientific knowledge of northern Australianwetlandslimitourabilitytoassesswetlandvalue.Theseincludethelackofunderstandingoftheexactwaywetlandsandtheirhabitatssupportimportantfisheriesspecies,andhowthevaluesofwetlandsandtheirhabitats can be measured in robust and valid ways, so that fisheries benefits can be validly linked towetlandhabitatfunction.
Thisstudyinvestigateshowthevalueofcoastalwetlandsandestuariescanbemeasuredinrobust,validandmeaningfulways.Thesemeasuresneedtoberelevantatthescaleofunitoroutcometobeevaluated,broadly meaningful and easy to communicate to end-users. Quality estimates of the production ofexploited species are of particular value in a fisheries context. However, a substantial body of data areneededforthecalculationofproductionestimates.Biomassestimatesaremoreachievableand,aslongastheirlimitationsareunderstood,canprovideusefulmeasuresofestuaryorcoastalwetlandhabitatvaluethatareeasilyunderstoodandeasilycommunicated.Most common sampling approaches are unsuitable for estimating density, the most fundamentalcomponent of fisheries biomass and production estimates. However, cast nets and beam trawls haveproven effective for providing suitable data on penaeid prawns and bait fish in north Queenslandestuaries,andhavethepotentialtobedevelopedintousefulestimatesofproductionperareaoftropicalestuaryorcoastalwetlandhabitat.Substantialdata-setsofthesetypesexistbutadditionalresearchanddevelopmentarerequiredbeforesuchdatacanusefullyberelatedtospecificareasofestuaryorcoastalwetland.Because samples frommethods suitable for larger species cannotbe related toanarea fishedtheycannotprovidespatiallyexplicitestimatesbutonlyestimatesrelativetotheeffortneededtocatchthe fish. If we are to fully account for the value of the different ECW habitats to fisheries, it is alsoimportant to understand the ecological context around the species-productivity and species-habitatlinkages,andtoconsiderallthevariablesthatinfluencetheselinkages.Substantial additional studies are required to produce workable and valid estimates of biomass andproductionthataretrulyrepresentative.

RepairingAustralia’sseascapes–TropWATERReportno.17/122017
Page19
2.2Introduction
BackgroundEstuaries and CoastalWetlands (ECWs) provide humanswith a range of goods (e.g. food, constructionmaterials),services(e.g.tourism,recreational)andculturalbenefits(Barbier2007).Importantly,theyplayvital roles in supporting coastal food-webs and fisheries production (Weinstein & Litvin 2016). Forinstance,innorthernAustralia,importantfisheriesspeciessuchasbarramundi(Latescalcarifer),mangrovejack (Lutjanus argentimaculatus), banana prawns (Fenneropenaeus merguiensis) and mud crabs (Scyllaserrata)areprofoundlyestuarydependent.Thisdependenceresultsfromtherelianceofcriticallifehistoryphasesonhabitatssuchasmangroves(Robertson&Duke1987,Sheavesetal.2007b),seagrass(Colesetal. 1987,Watson et al. 1993) and saltmarshes (Russell & Garrett 1983); on the occurrence of suitableenvironmentalconditionsinthosehabitats(Sheaves1996);andontheprimaryproduction(Hughesetal.2009) and integration of external or allochthonous nutrient subsidies (Abrantes & Sheaves 2008) thatoccurs there. Consequently,maintaining and improving ECW function and quality is critical to ensuringcontinuedfisheriesproductivity(Walkeretal.2004).
FreshwaterwetlandinGiru,Queensland.Photocredit:CarlaWegscheidlQueensland’s ECWs are severely degraded and impacted by a diversity of anthropogenic stressorsincludingexpandingagriculture,developmentofcoastalcommercialactivitiesandports,andincreasinglyurbanisation (Grechetal.2011).MuchofQueensland’soriginal lowland forest (Mooreetal.2007),andlargeareasoffreshwaterwetlandsandbrackishswamps(Russelletal.2011,Saintilan&Rogers2013)havebeenconvertedtoagricultural landoverthelast100years,andca.8.5%ofthetotalareaofestuariesintheGreatBarrierReefregionhasbeenlostsinceEuropeansettlement(Sheavesetal.2014).Thehistoricalwetlandandriparianlosscontinuestoday(Sheavesetal.2014).Muchofthisdeteriorationistheresultoflossoftidalwetlandarea,includingmangrovesandsaltmarsh,andthisiscompoundedbythelargeareasfromwhich fisheries species are excludedbybarriers (e.g.weirs, tidal exclusionbunds, sanddams, androad and rail crossings). Connectivity is further reduced by inefficient culverts and crossings, andmacrophyte chokes. The different anthropogenic impacts generate a complexity of consequences andoutcomes,includingforexampleincreasingsedimentloads(Alongi&McKinnon2005),decliningestuarinewaterquality(Coxetal.2005),increasingexposuretoacidsulphatesoilsandblackwaterevents(Powell&Martens2005,Wongetal.2010,Hladyzetal.2011),andtoxiccyanobacteriablooms(Albertetal.2005).Allof thesepose risks for theconditionof coastalbioticassemblagesand theirhabitats (Fabriciusetal.2005).Theconsequencesarefarreaching.ECWfunctionhasbeencompromisedbysubstantiallossesofsomeofQueensland’smostproductiveofaquatichabitats(Boysetal.2012,Heatherington&Bishop2012).Theseimpactsarecompoundedbyimpededhydrologicalandbiologicalconnectivity(Sheaves&Johnston2008)

RepairingAustralia’sseascapes–TropWATERReportno.17/122017
Page20
that interrupts the delivery of allochthonous nutrients and limits access for fauna to highly productivewetlandareas,compromisingnurserygroundvalue(Sheavesetal.2014).The widespread damage to Queensland’s ECWs means there is an urgent need for their remediation(Sheavesetal.2014,Creightonetal.2015).Repairingthesekeyecosystemscanleadtoaraftofbenefits:increased fisheries output and ecosystem resilience, enhanced food security and livelihoods, and theprotection of ecological assets of national and global significance (Sheaves et al. 2014). Works areunderwaytorepairandrevitalisewetlandsandestuariesalongtheGreatBarrierReef(GBR)coast.Forthesuccessoftheserepairinitiatives,itisimperativethattheyarewelltargeted,carefullyprioritisedandtheirsuccess adequately evaluated. Fundamental to this is the need to be able to value ECW services andensurethatoutcomesaremeasureableinmeaningfulways(Wegscheidletal.2017).However,anumberof gaps in the scientific knowledge of northern Australian wetlands limit our ability to assess wetlandvalue. Two of the key gaps are: a lack of understanding of (1) the exact way that wetlands and theirhabitatssupportimportantfisheriesspecies,and(2)howthevaluesofwetlandsandtheirhabitatscanbemeasured in robust and validways, so that fisheries benefits (in terms of production) can be linked towetlandhabitatfunction.ObjectivesTheaimofthisstudyistoinvestigatehowthevalueofnorthernAustralia’scoastalwetlandsandestuariescanbemeasuredinrobust,validandmeaningfulways.Consequently,weinvestigatethepre-requisitesforthedevelopmentofachievablemeasuresoffisheriesbenefitsthatcanbeattributedtoECWs.Indoingthiswe(a)examinetheneedformeasuresofECWvalueandwhatformappropriateestimatesshouldtake,(b)assessappropriatemethodsforcollectingandanalysingnecessarydata,and(c)determinetheadditionalstudiesneededtoconverttheavailabledataintouseablemeasuresoffisheriesbenefits.2.3MeasuresofEstuaryandCoastalWetlandValue
BackgroundThe services provided by ecosystems are critical to human societies and contribute directly (e.g. foodsecurity) and indirectly to humanwelfare and economies (Costanza et al. 1997). ECWs are particularlyimportantbecauseof thediversityof services theyprovide (e.g. fisheries,nurserygrounds, filteringanddetoxification, blue carbon) (Barbier 2000). Despite arguments that wetlands and estuaries should beprotectedpurelyongroundsoftheirintrinsicecologicalvalue,thereisstillaneedtoattributeavaluetothesesystems,bothbecausethereareequallyvalidmoralargumentsrelatedtothepotentialfoodsecurityvalues stemming from altering wetlands (Costanza et al. 1997) and because arguments about intrinsicecological value are difficult for decisionmakers to evaluate when balanced against tangible economicgains(Freeman1991).Infact,thedecisionssocietymakesaboutecosystemsimplyvaluation(Costanzaetal.1997),andaslongasweareforcedtomakechoicesweareintrinsicallybasingthosechoicesonsomemeasuresofvalue(Costanza&Folke1997).Accurate, robust and valid measures of the value of ECWs are critical for many reasons. For instance,comprehensiveestimatesareneededtoensurethevaluesofECWsaregivenappropriateweightinpolicyandmanagementdecisions(Costanzaetal.1997),andthatoffsetsandecosystemrepaircanbeprioritisedand their outcomesmeasured (Sheaves et al. 2014, Creighton et al. 2015). However, and despite theirwidelyrecognisedimportance,manyofthebenefitsfromhealthyCWEsareundervaluedduetothehighcomplexityofvaluationmethods(Branderetal.2006,Barbier2012).Indeed,manyfactorsmakeitdifficulttoestimatethevalueofecosystemservicesofECWsbecausetheirvaluesaremultifacetedandinteractincomplex ways (Costanza et al. 1997), with high levels of connectivity among components, meaningmanagementoftheentireseascapewillusuallybenecessarytopreservesynergisticeffects(Barbier2000).The importance of ECWs can be both physical (habitat) and trophic, and depends on various factorsincluding for example landscape and hydrological conditions, meaning that their value to fisheriesproductioncangreatlydifferevenamongsimilarsystems(Rozas&Zimmerman2000,Minelloetal.2008,
RepairingAustralia’sseascapes–TropWATERReportno.17/122017
Page21
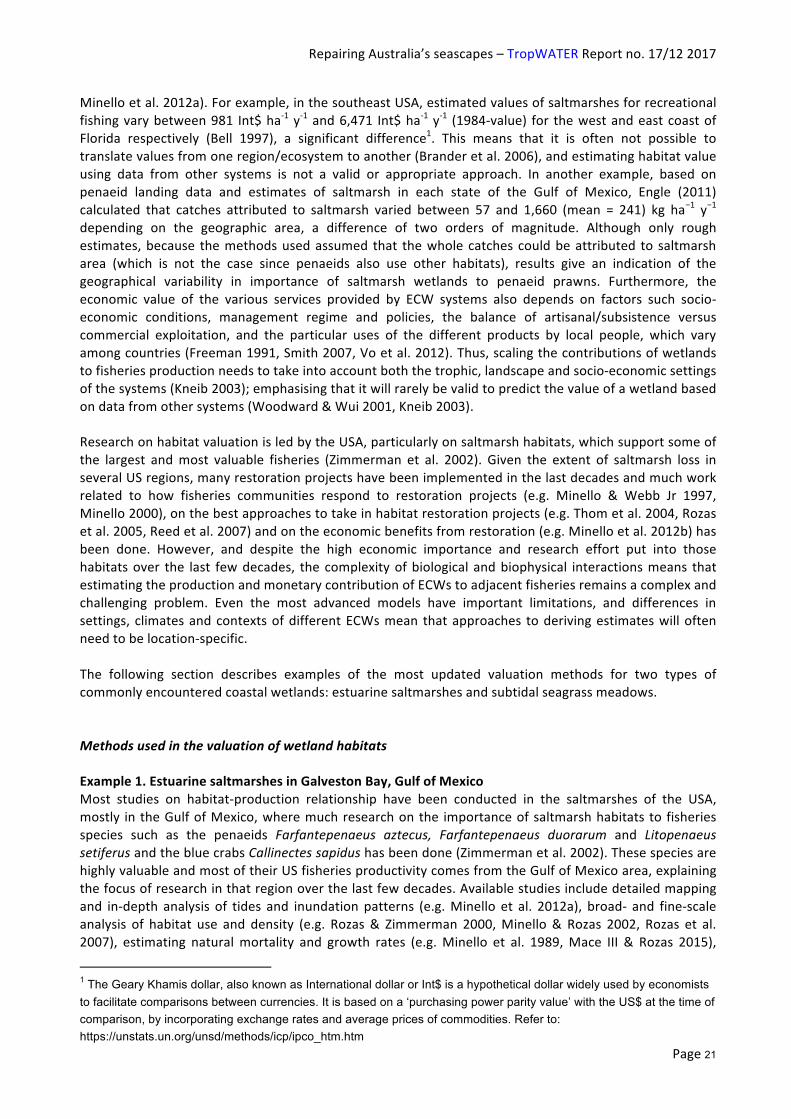
Minelloetal.2012a).Forexample,inthesoutheastUSA,estimatedvaluesofsaltmarshesforrecreationalfishingvarybetween981 Int$ha-1y-1and6,471 Int$ha-1y-1 (1984-value) for thewestandeastcoastofFlorida respectively (Bell 1997), a significant difference1. This means that it is often not possible totranslatevaluesfromoneregion/ecosystemtoanother(Branderetal.2006),andestimatinghabitatvalueusing data from other systems is not a valid or appropriate approach. In another example, based onpenaeid landing data and estimates of saltmarsh in each state of the Gulf of Mexico, Engle (2011)calculated that catches attributed to saltmarsh varied between 57 and 1,660 (mean = 241) kg ha−1 y−1depending on the geographic area, a difference of two orders of magnitude. Although only roughestimates,because themethodsusedassumed that thewholecatchescouldbeattributed to saltmarsharea (which is not the case since penaeids also use other habitats), results give an indication of thegeographical variability in importance of saltmarsh wetlands to penaeid prawns. Furthermore, theeconomic value of the various services provided by ECW systems also depends on factors such socio-economic conditions, management regime and policies, the balance of artisanal/subsistence versuscommercial exploitation, and the particular uses of the different products by local people, which varyamongcountries(Freeman1991,Smith2007,Voetal.2012).Thus,scalingthecontributionsofwetlandstofisheriesproductionneedstotakeintoaccountboththetrophic,landscapeandsocio-economicsettingsofthesystems(Kneib2003);emphasisingthatitwillrarelybevalidtopredictthevalueofawetlandbasedondatafromothersystems(Woodward&Wui2001,Kneib2003).ResearchonhabitatvaluationisledbytheUSA,particularlyonsaltmarshhabitats,whichsupportsomeofthe largest andmost valuable fisheries (Zimmerman et al. 2002). Given the extent of saltmarsh loss inseveralUSregions,manyrestorationprojectshavebeenimplementedinthelastdecadesandmuchworkrelated to how fisheries communities respond to restoration projects (e.g. Minello & Webb Jr 1997,Minello2000),onthebestapproachestotakeinhabitatrestorationprojects(e.g.Thometal.2004,Rozasetal.2005,Reedetal.2007)andontheeconomicbenefitsfromrestoration(e.g.Minelloetal.2012b)hasbeen done. However, and despite the high economic importance and research effort put into thosehabitatsover the last fewdecades, the complexityofbiological andbiophysical interactionsmeans thatestimatingtheproductionandmonetarycontributionofECWstoadjacentfisheriesremainsacomplexandchallenging problem. Even the most advanced models have important limitations, and differences insettings, climatesandcontextsofdifferentECWsmean thatapproaches toderivingestimateswilloftenneedtobelocation-specific.The following section describes examples of the most updated valuation methods for two types ofcommonlyencounteredcoastalwetlands:estuarinesaltmarshesandsubtidalseagrassmeadows.MethodsusedinthevaluationofwetlandhabitatsExample1.EstuarinesaltmarshesinGalvestonBay,GulfofMexicoMost studies on habitat-production relationship have been conducted in the saltmarshes of the USA,mostly intheGulfofMexico,wheremuchresearchonthe importanceofsaltmarshhabitats to fisheriesspecies such as the penaeids Farfantepenaeus aztecus, Farfantepenaeus duorarum and LitopenaeussetiferusandthebluecrabsCallinectessapidushasbeendone(Zimmermanetal.2002).ThesespeciesarehighlyvaluableandmostoftheirUSfisheriesproductivitycomesfromtheGulfofMexicoarea,explainingthefocusofresearchinthatregionoverthelastfewdecades.Availablestudiesincludedetailedmappingand in-depth analysis of tides and inundation patterns (e.g.Minello et al. 2012a), broad- and fine-scaleanalysis of habitat use and density (e.g. Rozas& Zimmerman 2000,Minello& Rozas 2002, Rozas et al.2007), estimating naturalmortality and growth rates (e.g.Minello et al. 1989,Mace III & Rozas 2015),
1 The Geary Khamis dollar, also known as International dollar or Int$ is a hypothetical dollar widely used by economists to facilitate comparisons between currencies. It is based on a ‘purchasing power parity value’ with the US$ at the time of comparison, by incorporating exchange rates and average prices of commodities. Refer to: https://unstats.un.org/unsd/methods/icp/ipco_htm.htm

RepairingAustralia’sseascapes–TropWATERReportno.17/122017
Page22
identificationofthetrophicimportanceofsaltmarshandofmarshfloodingtothesespecies(e.g.Bakeretal.2013),etc.CatchdataintheGulfofMexicohasalsobeenmethodicallyrecordedfordecades(e.g.Hart2012, Hart & Nance 2013). All this prior information is needed to obtain accurate estimates of theimportanceofthedifferenthabitatstofisheriesproduction(Minelloetal.2008,Minelloetal.2012b).Minelloetal. (2008)providesthemostcomprehensiveproductionestimatesforafisheryspeciesfromanatural saltmarsh wetland published to date. They used new data as well as prior information ontopography,hydrology,habitatuse, growthandmortality rates, etc. obtainedover almost3decadesofresearch toproduceproductionestimatesofpenaeid (F.aztecus,L. setiferus)andbluecrab (C. sapidus)juvenilesintheregularlyfloodedsaltmarshwetlandsoflowerGalvestonBay,Texas.Briefly,theirmethodconsistsonusingfine-scaledataonjuveniledensitiesindifferenthabitats,includingatthemarshedgeandat different distances from edge both towards themarsh interior and towards openwater, to producesmall-scale distributionmodels. These datawere then combinedwith detailed habitat, topography andbathymetryGISmappingoftheareatocalculatethetotalareaofeachhabitatandsub-habitatcategory,so that thepopulation size in theoverall area couldbeestimated.Animal sizeswere alsomeasured tocalculate length frequencies and species-specific length-weight relationships, to be used to produce anestimateofbiomass(basedontheestimateofpopulationsize).Subsequently,dailyincreasesinbiomassforeachsizeclasswereprojectedusingestimatedgrowthrates,andthevalues forall sizesaveragedtoestimate themeanpotentialdaily increase inmassper individual.Thisvaluewas thenmultipliedby thepreviouslycalculatedpopulationsizetoestimatedailyproduction inthatarea,producingbasedatathatcouldthenbetransformedintoannualproductionperhectare.Using this method, Minello et al. (2008) estimated a production from the lower Galveston Bay marshcomplexof128kgha-1y-1 forF.aztecus,109kgha-1y-1 forL.setiferusand170kgha-1y-1 forC.sapidus,whichwas3.1, 2.5 and8.8 timeshigher than in shallowopenwater, respectively. They also found thatalthoughonly15%of theavailablehabitatwas saltmarsh, thishabitat supported45%ofbrown shrimp,34%ofwhiteshrimpand53%ofthebluecrabpopulation.Therefore,usingthismethod,itispossiblenotonly to calculate theoverallproduction inanarea,butalso to theproduction that canbeattributed toparticularhabitatswithinthesystem.
Coomerasaltmarsh,SouthQueensland.PhotoCredit:NormDuke

RepairingAustralia’sseascapes–TropWATERReportno.17/122017
Page23
Thismethodwould be themost appropriate to be use in northernAustralia’smangrove and saltmarshwetlands.However,muchofthebasicresearchinthatregionisstillneededbeforewecanmakeaccuratepredictionsofhabitatvalue.AustraliansaltmarshesarealsoverydifferenttothoseintheUSA,astheyarehigher in the intertidal, typically landward of mangrove forests, and have shorter and less frequentinundationperiods(Connolly2009,Davisetal.2012).Inthenorthernhemisphere,however,saltmarshesextend into themid-intertidal zone andmangrove forests are less extensive and less dense, or absent.Therefore, the functional importance of saltmarsh either as habitat provider or a source of nutrition islikely to be different to that in the northern hemisphere, and because of their higher position in theintertidalthisfunctionalityismoredifficulttoascertain.Thisisalsotrueformangrovewetlands,whicharenotaccessibleformuchofthetidalcycleandaredifficulttoeffectivelyandquantitativelysampleusingtheavailablesamplingmethods.Example2.SeagrassmeadowsinSouthernAustraliaForlowintertidalandsubtidalwetlandssuchasseagrassmeadows,themostadvancedvaluationstudiesuseaseagrassresidency index(SRI)toestimatetheproportionoffish landingsthatcanbeattributedtoseagrassarea(e.g.McArthur&Boland2006,Jacksonetal.2015).SRIvaluesforeachspeciesarebasedonpublisheddata and expert opiniononhabitat use, specifically on theproportionof timeeach life-stagespendsintheseagrasshabitat(McArthuretal.2000).In southern Australia, McArthur and Boland (2006) used a model based on SRI and 16 years ofcomprehensive spatial and temporal catch-per-unit-effort (CPUE) data to estimate the contribution ofseagrass habitats and impacts of seagrass loss on various fisheries species.Briefly, their study areawasdivided intoa~1˚latitudeby~1˚longitudegridof fishingblocks,andmultiple linear regressionsbetweencatch (kgof liveweight), effort (boatdays) and seagrassarea (determinedbymapping) for all non-zeroeffortfishingblockswererunforallspecieswithSRI>0.30,i.e.forspeciesperceivedtohaveatleastsomedependence on seagrass habitats. Using this model, they estimated that South Australian seagrassmeadowshadaneconomiccontributionof~$A114My-1 to fisheries.Thismethod ishoweverreliantonbroad and untested assumptions, is very general and has important limitations. For example, theinformation used on proportion of time that the different life stages reside in the different habitats islimited for most species and geographical regions. Additionally, using this approach it is difficult toincorporatespatialandtemporalvariationinhabitatuse(Jacksonetal.2015).Furtherlimitationsarethatestimates did not take into account differences among seagrass communities or densities across theregion,andthateffortwasmeasuredinnumberofboatdays,irrespectiveofboatsizeornumberoffishersintheboat.Overall,whiletheseestimatesprovidesomegeneraluseful insights, therangeof limitationsmeanthattheestimatesproducedcannotbeconsideredasreliablequantificationofactualfisheriesvalue.Inanotherapproach,alsousedforoysterreefs(Petersonetal.2003,zuErmgassenetal.2016),BlandonandzuErmgassen(2014)estimatedtheenhancementofjuvenilefishabundanceprovidedbythepresenceofseagrasshabitatsbyconductingameta-analysisofjuvenilefishabundanceinseagrassvs.unvegetatedsites in southern Australia. There, the average enhancement for each species was calculated based ondensitydata foreachspeciesandeachstudyusingtheequation:Enhancement=ρseagrass -ρunvegetated (ρ=densityof0.5yrold fish, in indm-2). Thepotential annualproductionattributable to seagrasswas thencalculatedbasedontheaverageenhancementaswellasonspecies-specificgrowthmodels,age-specificweight (using published length-weight relationships) and species-specific natural mortality rates (takenfrom Fishbase (Froese & Pauly 2017) or from published studies), to estimate the per-unit-areaaugmentationofproductionthatresultedfromthepresenceofseagrasstocommercialfishbiomassand,subsequently,totheeconomy.Resultsfromthatstudysuggestthatseagrassenhancesthebiomassofthe12commercialfisheriesconsideredby0.98kgm-2y-1,correspondingto~$A230,000ha-1y-1.

RepairingAustralia’sseascapes–TropWATERReportno.17/122017
Page24
AswiththeapproachbasedonSRI,thismethodalsohaslimitations.Firstly,thestudiesconsideredinthemeta-analysisencompassedareaswithdifferent climatesandecology,butdidnotaddress the resultingdifferencesinseagrasscommunities,eventhoughitisknownthatthedegreeofenhancementoffisheriesproduction resulting from a habitat can differ among regions (zu Ermgassen et al. 2016). Moreover,samplingeffortandsamplingmethodsalsovariedamongstudies,andmoststudiesusedmethodssuchasbeach seines and push nets (and of different mesh sizes), which are not appropriate for providingestimates of biomass density per area, and also can not provide comparable data because they do nothavesimilarcatchingcharacteristics.Also,studiesassumedthatallindividualscapturedwerejuvenilesofsimilar age, and used length-weight relationships and growth and natural mortality rates from similarspeciesasproxieswhenspecies-specificparameterswereunavailable,despitethattheuseof inaccurateparameterscangreatlyaffectproductionestimates(zuErmgassenetal.2016).Clearly,itisunlikelythateithermethodcouldproducepreciseestimates.Indeed,thetwomethodsledtoverydifferentresults forthesamespecies,eventhoughtheywereconducted inthesamebroadregion.For example, for garfish (Hyporhamphus melanochir), Blandon and zu Ermgassen (2014) estimated anenhancementof0.02×10-5kgha-1,worth$A0.06ha-1,muchlowerthanthevaluesof0.68kgha-1($A3.9ha-1) estimated by McArthur and Boland (2006). In contrast, for King George whiting (Sillaginodespunctata),theestimatedenhancementwashigherusingthemethodofBlandonandzuErmgassen(2014)(4.64×10⁻³kgha-1;$A824ha-1)thanwhenusingthemethodofMcArthurandBoland(2006)(0.49kgha-1;$A6ha-1).Thisillustratesthelimitationsofcurrentlyavailablevaluationmethodsforseagrasshabitats,andunderlines that caremust be taken when extrapolating results from one region to another, and whencomparingthevalueofhabitatsusingresultsfromdifferentstudies.Pre-requisitesforthedevelopmentofachievable,robustandvalidmeasuresofECWvaluefornorthernAustraliaAsclearfromthepreviousexamplesofhabitatvaluation,whetherthefinaloutputisacomplexecological-economicmodel(Barbier2007)oranestimateofthevalueofaparticularhabitatorareatobemanagedorrepaired,therearetwocrucialpre-requisitesforestimatingthevalueofaECW:
1. obtainingestimates of the areal extent of the units of interest and the habitats that comprisethem,and
2. usinghighqualitymeasuresofthevalueoftheparticularunits(habitats,estuaryreachesetc.).FornorthernQueenslandestuaries,thefirstprerequisiteispartiallysatisfiedbecauserecentextensiveanddetailedGIStopographicmapping(e.g.bytheQueenslandWetlandProgram)meansthatappropriatehighqualitymapping isavailable for the intertidalandsubtidalpart.However,detailedbathymetry is lackingformostestuariesmeaningestimatesrelatingtosubtidalareaswillbelessprecisethanthoserelatingtotheintertidalcomponents.Inthecaseofhighqualitymeasures,thevalueofthedifferenthabitatunitsshouldbe(1)measureableatthescaleoftheunitoroutcometobeevaluated,(2)broadlymeaningfuland(3)easytocommunicatetoend-users. High quality estimates of production (the expected increase in biomass over time for apopulation (Chapman 1978)) of exploited species are of particular value in a fisheries context (e.g.McArthur & Boland 2006, Barbier 2007) because they provide detailed information on the value of ahabitatunit,bydetailingtheamountofbiomassproducedfromthatunitoveraspecifictimeperiod.Notonly is production per unit area of fisheries species directly relevant to end users, and so easy tocommunicate, but it provides the added advantage of integrating across complex factors such asconnectivityandnurserygroundprovision,thatareoftenhardtoassignadefensiblevaluesto(Costanzaetal.2006).However,evenifthesetwobasicpre-requisitesaresatisfiedthereisthefurtherrequirementthat:

RepairingAustralia’sseascapes–TropWATERReportno.17/122017
Page25
1. the spatio-temporal nature of organismal utilisation of units needs to be such that it allows
unambiguousallocationofaspecificcomponentofproductiontotheparticularunit inquestion.This condition is very difficult to satisfy, particularly in the case ofmobile organism thatmovebetween different units and different types of units over time, or when the same life stageoccupiesanumberofdifferenthabitatsatonetime.
2.4EstimatingFisheriesProduction
Production isclassicallydefinedas the“totalelaborationof fish tissueduringanygiventime intervalΔt,includingwhatisformedbyindividualsthatdonotsurvivetotheendofΔt“(Ivlev1966).Itisexpressedinunits of quantity per areaper time, typically kg ha-1 y-1 for fishery populations. Its calculation thereforerequires informationonchangesinpopulationsizeandbiomassthroughrelativelyshortperiodsoftime,alongwithrecruitment,growthandmortalityrates,sothatannualproductioncanbeestimatedbyaddingupproductionoverallshortintervalstomakeupayear.Therefore,estimatingproductionreliesonalargeamount of long-term data obtained by time-consuming studies, and most methods of productioncalculationrelyonanumberofassumptionsaboutforexamplerecruitment,changesinmortalitywithsize(age)andmigration.Standingstockbiomass(thebiomassofaspeciesinadefinedareaatapointintime(Rozasetal.2005))isthemostbasicparameterneededtoestimateproductionandistypicallycalculatedusingabundance-by-lengthdataandlength-weightrelationships.Thefirststepneededtocalculatebiomassinvolvesestimatingthe densities of the different sizes in the different habitats, so that the abundance-by-size can beestimated.Thesevaluesarethenmultipliedbytherespectivemeanweightsof thedifferentsizeclasses(basedonlength-weightrelationships)toestimatebiomass.Formanyspecies,length-weightrelationshipsareavailablefromtheliteratureand/oronFishbase(Froese&Pauly2017)butformoreaccurateresultsthese parameters need to be calculated directly from the studied populations. Growth and mortalityestimates of fisheries species are typically obtained from mark-recapture (Pine et al. 2003), length-frequencyanalysis(Pauly&Morgan1987)ortheanalysisofperiodicmarkingsongrowingstructuressuchasotolithsandscalesinteleostsandcartilageinelasmobranchs(e.g.Newmanetal.1996,Russetal.1998,Walkeretal.1998).Other factorsalsoneedtobe taken intoaccountwhenestimatingproduction.Forexample, forsystemsincludingmangroves(Bakeretal.2015)andsaltmarshes(Connolly1999,Minelloetal.2012a,Bakeretal.2013),therecanbesubstantialspatialandtemporalvariationsofaccessibility(bothphysicalandtrophic)tothedifferenthabitats,relatedtothespatialarrangementofhabitatsandtodifferencesintopography,hydrology, and consequent differences in flooding patters (area, duration, frequency and depth) andconnectivity (Zimmerman et al. 2002, Baker et al. 2015). This leads to spatial/temporal differences infunctionalvaluesprovidedbythedifferenthabitatsanddifferentpartsofthehabitats(e.g.edgevs.insideof saltmarsh/mangrove forest) (Roth et al. 2008,Minello et al. 2012a, Baker et al. 2015). These factorsshouldalsobeconsideredwhenestimatingthecontributionsofthedifferenthabitatstofisheriesspecies,buttheyaredifficulttoidentifyandquantify.Insummary,acomprehensivebodyofdataareneededforthecalculationofproductionestimatesforaspeciesfromawetland(Figure1),includingdataon:
(i) theextentofeachhabitattype,(ii) replicatesmall-scaleestimatesofdensitywithineachhabitat,(iii) spatialarrangementofhabitats,(iv) sizefrequencyofthespecies,(v) size-weightrelationships,and(vi) growthandmortalityrates.

RepairingAustralia’sseascapes–TropWATERReportno.17/122017
Page26
Dataon(i)and(ii)allowpopulationabundancetobeestimated,while(iv)and(v)allowabundancetobeconvertedtobiomass.Samplingbiomassovertimeandcombiningitwithgrowthandmortalityrates(vi)allows abundance estimates to be converted to estimates of biomassproduction over a periodof time(e.g.annually)(Minelloetal.2008).
Figure1.Stepsneededforthecalculationofproductionestimatesforaspeciesfromasinglehabitat.2.5SamplingMethodsforEstimatingDensityandProduction
BackgroundAsexplainedabove,themostfundamentalcomponentoffisheriesbiomassandproductionestimatesaremeasuresofdensity.Therearemanymethodsandgears tosample fisheriesspecies thatprovidecatch-per-unit-effort(CPUE)data(e.g.Table1).However,fewoftheavailablegearssampleadefinablevolumeofwater or area of wetland, a basic requirement to enable the conversion of CPUE into ameasure ofdensity. Of those that do provide area-based estimates, many can only be deployed in a few specificsituations, restricting their usefulness for comparisons among habitat types (Rozas & Minello 1997,Connolly1999,Baker&Minello2011).Eventhosethathavebeensuccessfullyusedtoprovideestimatesofdensity(e.g.dropsamplers(Minelloetal.2008),popnets(Serafyetal.1988),castnets(Sheavesetal.2016a))haveimportantlimitations.Dropsamplersandpopnetsarelimitedtoshallowwaterapplicationsand,becauseoperatorsneedtoenterthewatertoharvestcatches,theyareunsuitableinareas,suchastropicalAustralia,whereestuarinecrocodilesoccur.Castnetscanbeusedwithouttheneedtoenterthewaterbuthavethelimitationsofbeinglesseffectiveonlargefish,whichmaybeabletoescapeasthenetsinks,andinnotprovidingacompletelyconsistentsamplingarea.Beamtrawlshavealsoprovedeffectivein providing estimates of density per unit area, particularly for sampling deeper open bottom habitatsincludingseagrassbeds(Watsonetal.1993).DetailsofappropriategearsCastnetsareparticularlyusefulforsamplingshrimpsandprawnsbecausetheirescaperesponsetendstobetactileratherthanvisual(Watsonetal.1992),meaningtheyshowlittleresponseuntilthenetcoversand captures them,andeven if theyarealarmed their escapedirection is random (Watsonet al. 1992,Xiao&Greenwood1993).Castnetsareparticularlyusefulinthestructurallycomplexhabitatsoftropicalestuaries,where submerged timber, or ‘snags’, are common (Sheaves 1992), because they canbeusedacrossmosthabitats(Sheavesetal.2007a,Johnston&Sheaves2008).Infact,ifvisibilityisgoodtheycanevenbedeployeddirectlyadjacenttosnags,somethingnotpossiblewithmostothernettingapproaches.Theconsistencyof theareasampledbycastnetscanbe improvedby theuseofexperiencedoperators
EstimateofPopulationAbundance
(i)Extentofhabitat
(ii)Replicateestimatesofwithin-habitatdensity
(iii)Speciessizefrequency
(iv)Size-weightrelationships
(v)growthandmortalityrates
EstimateofStandingStockBiomass
EstimateofBiomassProduction
Integrationovertime

RepairingAustralia’sseascapes–TropWATERReportno.17/122017
Page27
(Johnston&Sheaves2007)and theyhaveprovedsuccessful forestimatingdensitiesof smaller fisheriesspecies in tropical estuaries (Sheavesetal. 2007b). Thus,onbalance, castnetsprovidea simpleway toestimate density of shrimps and prawns in many tropical estuary and coastal wetlands (Sheaves et al.2016a).Althoughnotasreliablyeffectiveonfish,becausethepossibilityofavoidanceishigher,castnetsarestilloneofthemosteffectivewaysofsamplingsmallerfish(e.g.herringsandsilverbiddies)intropicalestuaries(Sheavesetal.2007b)andsoprovidesomeofthebetterestimatesofdensityforbaitfishspecies.Table1.Comparisonof theeffectivenessof somegearscommonlyused to sampleestuaryandwetlandfisheriesspecies.
GearMeasureofarea?
Samplinghabitats
Comments
Beamtrawl Sweptarea Smoothunstructuredbottoms
Suitableforprawnsbecauseofrandomescaperesponse.Donotenclosesoinefficientformobilefishspecies.Difficulttodeployinshallowwater.
Castnets Enclosedradius
Manyhabitats;canbeusedclosetostructure
Canbeusedacrossmanyhabitatsexceptforheavilystructuredones.Areasampledcanhowevervaryandmoremobilespeciescanescape.Mostsuitableforprawnsbecauseofrandomescape.
Dropsampler Enclosedradius
Openareasandlightvegetation
Accuratesampleoncedeployedbutvesselneedstobedeployedclosetothesamplinglocationpotentiallycausingfishtomoveaway.Onlyusableinveryshallowwater.
Electrofishing No Mosthabitats Onlyeffectiveinverylowsalinities.
Fishtraps No Mosthabitats Attractfishwithbaitsounsuitablefordensityestimates
Fykenets No Blockingdrains Usedtoblockchannelsdrainingareasofwetlandsodifficulttodefineareasampled.
Gillnets No Unstructuredopenwater
Designedtointerceptmovingfishsocannotbeusedtorelatecatchtoarea.Efficiencydependentonday-to-daybehaviour.
Lift/popnets Enclosedradius
Openareasandaquaticvegetation
Needtobesetonthesubstratepriortosamplingsomaybiassamples.Onlyuseableinveryshallowwater.Operatorsneedtoenterwatersounsuitableincrocodile/hippopotamusriskareas.
Seinenets Sweptarea Smoothunstructuredbottoms
Onlyuseableonsmoothbottomswithconsolidatedsediments.Also,needtobedeployedadjacenttoashoreline.
Video(baited) No Mosthabitats Area‘fished’difficulttodefinebecausebaitisusedtoattract.
Video(unbaited)
No Mosthabitats Mainlimitationsarewaterclarityanddifficultyindefiningareasampled.Mostusefulfordetectingpresenceinahabitat.
Beamtrawlscanprovideestimatesofdensityviatheswept-areamethodbutsuffertherestrictionsthattheyaredifficult tooperate inveryshallowwaterandcanonlybeused inareas lackinghardstructuressuch as snags or rocks. However, beam trawls have proven useful in estimating densities of seagrass-associatedprawnssuchasPenaeusesculentus,P.semisulcatusandMetapenaeusendeavouri(e.g.Watson

RepairingAustralia’sseascapes–TropWATERReportno.17/122017
Page28
etal.1993,Loneraganetal.1995).Consequently,samplesofpenaeidprawnsandbaitfishcapturedwithboth cast nets and beam trawls combined have the potential to be developed into useful estimates ofproductionperareaofECWhabitat.Estimating the production of larger species such as barramundi (Lates calcarifer) is more difficult, andtends to rely on CPUE rather than density per unit area, making it difficult to meaningfully translateestimates tovariables suchas theareaofwetland.Traditionally, stocksof species likebarramundihavebeen assessed on the basis of commercial catches from the gill net fishery (e.g. Staunton-Smith et al.2004).Thesedatacanprovide indicesofabundancebut,becauseofthediversityof factorsaffectinggillnetcatchesandbecausegillnetcatchescannotberelatedtoaspecificfishedarea(Table1),suchindicesareonlysuitableforestimatesofrelativeratherthanabsoluteproduction.Consequently,becauseoftheabilitytoobtainestimatesofbiomassperunitarea,measuresoftheproductionofprawnsandbaitfishprovide the greatest opportunity for development as fisheries-based indices of value for northernAustralia’sECWs.2.6 Considerations for the Development of Appropriate Measures of Value for Northern
AustralianECWs
UsingproductionofspeciesofcommercialandrecreationalimportanceasindicatorsoftheproductivityofECWhabitats has the substantial advantages of being broadlymeaningful and easy to communicate toend-users.However, therearethreekeyconsiderationsthatstillneedtobetaken intoaccounttomoreaccuratelyvalueECWsandtheircomponenthabitats:
(i) linkingestimatesofbiomassdensitytoareasofhabitatinameaningfulandvalidway,(ii) takingintoaccounttheecologicalcontextofthespeciesanditslinktoproductivity,(iii) consideringthestateofunderstandingofspeciesandcommunityecology.
MeaningfullylinkingestimatesofbiomassdensitytoareasofhabitatAsmentionedabove,samplingmethodssuchascastnetsandbeamtrawlscanprovidereliableestimatesofdensityperunitareaforthehabitats inwhichtheycanbedeployed.However,anumberofstepsareneededtoconverttheseintobiomassestimates.Theproblemisrelativelysimpleiftheunitofinterestisasinglehabitattypewherebiomassdensitycanbeassumedtobe,onaverage,homogeneous.Thestepsarethenstraightforward(Figure2):
1. Collectsufficientbiomassdensitysamplestoensurethat:a. Thepatternofwithin habitat variability iswell understood. Thiswill allowevaluationof
the extent to which the assumption that the species biomass density is homogenousacrossthehabitattype,andsowhetheritisreasonabletouseanaveragevalue(e.g.themeanbiomass)asanestimateforthewholehabitat;
b. themeanbiomassisaccuratelyandpreciselyestimated;and2. use this mean biomass as an estimate of the biomass per unit area for the habitat, and the
estimatedvariabilitytoprovideameasureofuncertaintyabouttheestimate.However,becauseECWsarecomposedofmosaicsofhabitats,theproblemwillusuallybemorecomplex.Takeforinstancetheproblemofestimatingstandingstockforanestuaryreach.Thereachwill(i)comprisea number of different habitats, each with intrinsically different densities of the target species, and (ii)includebothhabitatsthatareefficientlysampledusingtheparticulargearandthosethataren’t.Additionalstepsarethereforenecessary(Figure2):

RepairingAustralia’sseascapes–TropWATERReportno.17/122017
Page29
1. Areasinwhichthetargetspeciesarewellsampledcanbetreatedasin(1)above.2. Comparable estimateswill need to bemade for areas inwhich samplingwith the standard
gearisinefficient.Thiswilloftenbedifficult.Forinstance,althoughcastnetsareinefficientforstructurally complexhabitats like fallen timber,other samplingmethodsarealsounsuitable.Whilethereisnoperfectapproachtosolvingthisproblemthereareworkablesolutions.Oneisto use a technique such as unbaited video (Meynecke et al. 2008, Kimball & Able 2012,Sheaves et al. 2016b) to determine the extent towhich the species utilises the difficult-to-samplehabitatandusethis informationtoconstructapproximatebiomassdensityestimatesforthosehabitats,togetherwithmeasuresoftheuncertaintyinvolvedintheestimates.
3. Once the total area of each habitat type is known, standing stock estimates for the wholeestuarycanbeconstructed.
Figure2.Stepsneededtoconvertbiomassperunitareatoanestimateofstandingstock.Although estimates will never be perfect, this protocol can provide useful approximations of biomass,providingwell founded estimateswith a defined level of uncertainty.However, the issue of the spatio-temporalnatureoforganismalutilisationofunitsneedstoconsidered,butthisconditionisverydifficulttosatisfyformobileorganisms(seeabove).TheecologicalcontextofthespeciesanditslinktoproductivityNot only are there readily available methods for sampling biomass per unit area for species such aspenaeidprawns, that canprovidevaliddata forestimatingbiomass,but theecological contextof thesespeciesmakes them good candidates for linking their productivity to ECWhabitat area. The foodwebsleading topenaeids, suchasbananaprawnsFenneropenaeusmerguiensis, are relatively simpleandwellunderstood (Loneraganet al. 1997,Abrantes&Sheaves2009a, 2010,Abranteset al. 2015). These foodwebsareshort(seeFigure3),enablingdirectlinkstobemadebetweentheprawnsandtheECWresourcesthat support their productivity. In contrast, not only it is difficult to obtain density data for large fishpredatorssuchasbarramundi(Latescalcarifer),butthefoodwebsleadingtohightrophiclevelspeciesaretypically much more complex (e.g. Figure 4), making it much more difficult to relate their biomass toparticular resources. In fact, highly mobile species like barramundi are likely to depend on a complexmosaic of interlinked habitats throughout their life history (Nagelkerken et al. 2015) meaning moreintegratedmeasuresofthevalueofwetlandstohigherlevelpredatorsareneeded.
Collect:sufficientbiomassdatatoensure
homogeneity
Estimate:meanbiomassdensityforthe
habitat
Develop:approachestoestimateuseofhabitatrelativetowellsampled
habitats
Construct:approximatebiomassdensityestimatefor
thehabitat
Determine:relativeareaofeachhabitat
Combine:estimatesofbiomassfromeach
habitat

RepairingAustralia’sseascapes–TropWATERReportno.17/122017
Page30
Figure 3. Simplified schematic food web leading to Fenneropenaeus merguiensis at the mangrove-dominated Hinchinbrook Channel, North Queensland (adapted from Abrantes and Sheaves (2009b)),showingthemaintrophicpathways.1–mangrovedetritus;2–microphytobenthos;3–greenfilamentousalgae; 4 – seagrass, seagrass detritus and seagrass epiphytes; 5 – phytoplankton; 6 – upper intertidalbenthic fauna; 7 – lower intertidal and subtidal benthic fauna; 8 – zooplankton. Figures and symbolscourtesy of the Integration and Application Network, University ofMaryland Centre for EnvironmentalScience(ian.umces.edu/imagelibrary).
Figure 4. Simplified schematic the food web leading to barramundi Lates calcarifer at the mangrove-dominated Hinchinbrook Channel, North Queensland (adapted from Abrantes and Sheaves (2009b)),showingthemaintrophicpathways.1–mangroves;2–mangrovedetritus;3–microphytobenthos;4–green filamentous algae; 5 – seagrass (including seagrass detritus and seagrass epiphytes); 6 –phytoplankton;7–terrestrialinsects;8–sesarmidcrabsandmangrovesnails;9–upperintertidalbenthic

RepairingAustralia’sseascapes–TropWATERReportno.17/122017
Page31
fauna;10–phytodetritivorousfish;11–lowerintertidalandsubtidalbenthicfauna;12–zooplankton;13–macrobenthiccarnivores (fish);14–plantivorous fish.Figuresandsymbolscourtesyof the Integrationand Application Network, University of Maryland Center for Environmental Science(ian.umces.edu/imagelibrary).Oneapproachtoovercometheproblemswithobtainingmeaningfulestimatesforlargepredatorsistousethe density of easily measured surrogate species (e.g. Lewandowski et al. 2010, Mellin et al. 2011,Fontaine et al. 2015) as relevant indicators of the support that ECWs provide for these predators.Measuringtheproductivityofpenaeidprawnsisoneobviousoptionbecausethesearekeypreyofmanycommercially importantpredatorssuchasbarramundi, trevallies (Caranx spp.),queenfish (Scomberoidesspp.), threadfin salmons (Eleutheronema tetradactylum and Polydactylus spp.) and snappers (Lutjanusspp.)(Robertson1988,Salinietal.1990,Salinietal.1998,Baker&Sheaves2005).Forexample,Fujiwaraetal.(2016)investigatedtheimportanceofpenaeidsinsupportingcommerciallyimportantfishintheGulfofMexicousingdatacollectedover28yearstoanalysetherelationshipsbetweenCPUEoffishpredatorsandthoseoftheirpenaeidpreyindifferentareasandseasons.Resultsfromthatstudycouldthenbeusedin conjunction with those from studies on the importance of coastal wetland habitats to penaeids toextrapolatetheimportanceofthosehabitatstothecommercialfishpredators.Asecondalternativeistomeasure the density of small planktivorous fish such as herring (Herklostichthys spp.), also keycomponentsoffoodwebslinkingprimaryproductivitytohighorderpredators(e.g.Salinietal.1990,Baker&Sheaves2005).Estimatesofplanktivoreandpenaeidbiomasscanbeobtainedsimultaneouslybycastnetting (Sheaves et al. 2016a), making this process even more valuable as a tool to measure ECWproductivity. However, on a cautionary note, many of these species demonstrate substantial spatio-temporalvariabilityindensityandbiomass(Sheaves&Johnston2010).ThestateofunderstandingofspeciesandcommunityecologyEven forwell-studied species there is often a deficit in the information needed to effectivelymake thespecies-productivity link. This limits the reliability with which biomass production can be linked toparticularhabitatunits.Forexample,eventhoughtheissuesseemreasonablystraightforwardforspecieslike F. merguiensis, this is not necessarily the case. Commercial fisheries for F. merguiensis occur inoffshorewatersbut their juveniles are strongly associatedwithmangroveestuaries (Vanceet al. 1990),meaningthereisanapparentlinkwithmangrovewetlands.Indeed,offshorecatchesofadultprawnsarecorrelatedwith theextentofmangrove forests (Mansonetal.2005).However, theextent towhich theapparentrelationshipbetweenjuvenilepenaeidsandmangrovesreflectsspecificutilisationofmangroves,orjusttheuseofshallow,organicallyrich,muddyhabitatshasbeenquestioned(Lee2004).Forexample,astudyfocussingonjuvenileF.merguiensiswithin30mangroveestuariesspanning650kmofthecoastofnorth-easternAustralia(Sheavesetal.2012)assessedtheprawn-mangroverelationshipamongandwithinestuaries.Thestudyindicatedthat(i)attheamong-estuariesscalemangroveextentappearedtoinfluenceCPUEbutwasextensively confoundedwith theeffectsof twonon-mangrovevariables: intertidalextentand substrate type, (ii) connectivity with mangrove forests was not influential, pointing to the likelyimportance of the non-mangrove variables rather thanmangrove extent, and (iii) at thewithin-estuaryscale CPUE showed no correlation with mangrove variables but rather correlated with the extent ofshallow water, again implicating the role of a complex of ECW habitats in supporting juvenile F.merguiensis populations. This idea is strengthened by studies that indicate that wetlands wheremangroves are not the dominant vegetation are also important habitats for juvenile F. merguiensis(Sheavesetal.2007b).Consequently,thereisaclearneedtodevelopamoreexplicitunderstandingoftheways inwhichcoastalwetlands supporteven species suchasF.merguiensis thatarewell recognisedashaving strong links tomangroves.Developing amore sophisticated knowledgeof the specificways thatECWhabitats influence fisheriespopulations is clearly critical ifweare to fully account for the valueofthesehabitatstofisheries.

RepairingAustralia’sseascapes–TropWATERReportno.17/122017
Page32
Therefore, although the basic information on biomass density is available for key species such as F.merguiensis in north Queensland estuaries, substantial research is still needed before these can beconvertedtovalidestimatesofbiomassandproduction.Thisincludesboththecarefulandcomprehensivesamplingneeded toprovideestimates forall thehabitatswell-sampledby thesamplinggearemployed,detailedestimatesoftheextentofeachhabitattype,andextensivestudiestodevelopthebestpossibleestimates for habitats that cannot be sampledusing conventional gears. There is also a critical need todevelopamoredetailedknowledgeoftheexactwaysECWhabitatsinfluencefisheriespopulations,tofullyaccountforthevalueofthesehabitatstofisheriesConclusionEstimates of biomass density over time provide a full picture of the time-integrated production from ahabitatorarea,andarethereforethemostcomprehensivewaytoassesshabitatvalue.However,inallbuta few casesmany of the necessary key data are unavailable, either because it is logistically difficult tocollect such data, or because the dynamics of species populations relative to individual target habitatsprevents thedevelopmentofvalidestimates (Table2).Particularlywhere thereare logicaldifficulties inproducingvalidproductionestimates, it is likelytobemostprofitableto focuson lowervalueestimatesthatcanalsoprovideuseful information.For instance, initialwork innorthernAustralia’sestuariescouldbedirectedtoproducinghighqualityestimatesofbiomass.Althoughnotintegratedovertime,andsonotprovidingdirect informationon the increase inbiomass in aunitof time,biomassestimatesare readilyachievableandcanprovideusefulrelativemeasuresofestuaryorcoastalwetlandhabitatvaluethatareeasily understood and easily communicated, as long as their limitations as snapshots in time arerecognised. For a particular point in time, standing stock biomass provides awell-established and validbasisforevaluatingthecontributionsfromECWhabitatsandabasicmeasureofhowthosecontributionsarelikelytochangeunderdifferentscenarios.Table2.DataneededtoproduceestimatesofbiomassandproductionfornorthAustralianestuaries. Biomass Production
Dataneeded - Arealextentoftheunitsofinterestandthehabitatsthatcomprisethem,atappropriatescales
- Densitywithineachhabitat,atappropriatescales
- Size-frequencyinthedifferenthabitats
- Size-weightrelationship- Alsoneedstoconsiderfactors
suchasspatialarrangementofhabitats,includingdetailsonaccessibility/connectivity
Inadditiontothedataneededto
estimatebiomass,productionestimatesrequire:
-Biomassestimatesovertime
- Growthrates- Size/stage-specificmortality
rates- Recruitmentrates- Migrationinformation
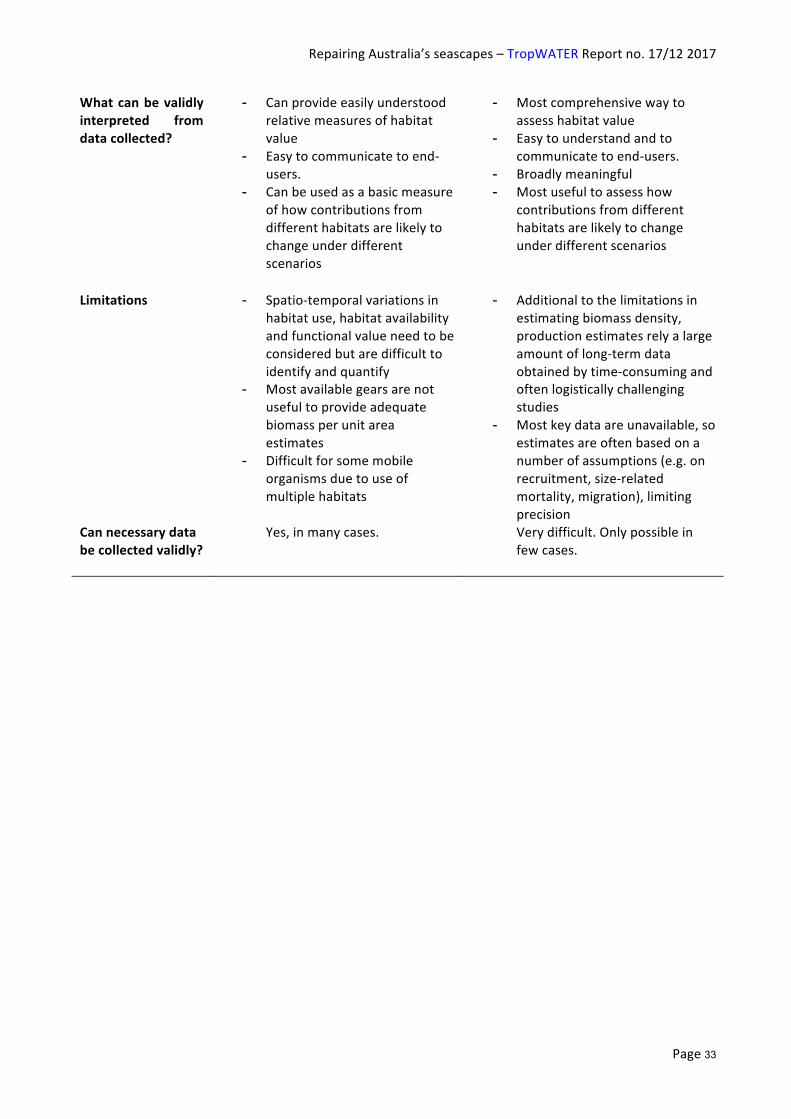
RepairingAustralia’sseascapes–TropWATERReportno.17/122017
Page33
Whatcanbevalidlyinterpreted fromdatacollected?
- Canprovideeasilyunderstoodrelativemeasuresofhabitatvalue
- Easytocommunicatetoend-users.
- Canbeusedasabasicmeasureofhowcontributionsfromdifferenthabitatsarelikelytochangeunderdifferentscenarios
- Mostcomprehensivewaytoassesshabitatvalue
- Easytounderstandandtocommunicatetoend-users.
- Broadlymeaningful- Mostusefultoassesshow
contributionsfromdifferenthabitatsarelikelytochangeunderdifferentscenarios
Limitations - Spatio-temporalvariationsinhabitatuse,habitatavailabilityandfunctionalvalueneedtobeconsideredbutaredifficulttoidentifyandquantify
- Mostavailablegearsarenotusefultoprovideadequatebiomassperunitareaestimates
- Difficultforsomemobileorganismsduetouseofmultiplehabitats
- Additionaltothelimitationsinestimatingbiomassdensity,productionestimatesrelyalargeamountoflong-termdataobtainedbytime-consumingandoftenlogisticallychallengingstudies
- Mostkeydataareunavailable,soestimatesareoftenbasedonanumberofassumptions(e.g.onrecruitment,size-relatedmortality,migration),limitingprecision
Cannecessarydatabecollectedvalidly?
Yes,inmanycases. Verydifficult.Onlypossibleinfewcases.

RepairingAustralia’sseascapes–TropWATERReportno.17/122017
Page34
2.7References
AbrantesK,SheavesM(2008)Incorporationofterrestrialwetlandmaterialintoaquaticfoodwebsinatropicalestuarinewetland.EstuarineCoastalandShelfScience80:401-412
AbrantesK,SheavesM(2009a)SourcesofnutritionsupportingjuvenilepenaeidprawnsinanAustraliandrytropicsestuary.MarineandFreshwaterResearch60:949-959
AbrantesK,SheavesM(2009b)Foodwebstructureinanear-pristinemangroveareaoftheAustralianWetTropics.Estuarine,CoastalandShelfScience82:597–607
AbrantesK,SheavesM(2010)Importanceoffreshwaterflowinterrestrial-aquaticenergeticconectivityinintermittentlyconnectedestuariesoftropicalAustralia.MarineBiology157:2071-2086
AbrantesKG,JohnstonR,ConnollyRM,SheavesM(2015)Importanceofmangrovecarbonforaquaticfoodwebsinwet–drytropicalestuaries.EstuariesandCoasts38:383-399
AlbertS,O’NeilJM,UdyJW,AhernKS,O’SullivanCM,DennisonWC(2005)BloomsofthecyanobacteriumLyngbyamajusculaincoastalQueensland,Australia:disparatesites,commonfactors.MarinePollutionBulletin51:428-437
AlongiDM,McKinnonAD(2005)Thecyclingandfateofterrestrially-derivedsedimentsandnutrientsinthecoastalzoneoftheGreatBarrierReefshelf.MarinePollutionBulletin51:239-252
BakerR,SheavesM(2005)Redefiningthepiscivoreassemblageofshallowestuarinenurseryhabitats.MarineEcologyProgressSeries291:197-213
BakerR,MinelloTJ(2011)Trade-offsbetweengearselectivityandlogisticswhensamplingnektonfromshallowopenwaterhabitats:agearcomparisonstudy.GulfandCaribbeanResearch23:37-48
BakerR,FryB,RozasLP,MinelloTJ(2013)Hydrodynamicregulationofsaltmarshcontributionstoaquaticfoodwebs.MarineEcologyProgressSeries490:37-52
BakerR,SheavesM,JohnstonR(2015)Geographicvariationinmangrovefloodingandaccessibilityforfishesandnektoniccrustaceans.Hydrobiologia762:1-14
BarbierEB(2000)Valuingtheenvironmentasinput:reviewofapplicationstomangrove-fisherylinkages.EcologicalEconomics35:47-61
BarbierEB(2007)Valuingecosystemservicesasproductiveinputs.EconomicPolicy22:178-229
BarbierEB(2012)Progressandchallengesinvaluingcoastalandmarineecosystemservices.ReviewofEnvironmentalEconomicsandPolicy6:1-19
BellFW(1997)TheeconomicvaluationofsaltwatermarshsupportingmarinerecreationalfishinginthesoutheasternUnitedStates.EcologicalEconomics21:243-254
BlandonA,zuErmgassenPS(2014)QuantitativeestimateofcommercialfishenhancementbyseagrasshabitatinsouthernAustralia.Estuarine,CoastalandShelfScience141:1-8
BoysCA,KroonFJ,GlasbyTM,WilkinsonK(2012)Improvedfishandcrustaceanpassageintidalcreeksfollowingfloodgateremediation.JournalofAppliedEcology49:223-233
BranderLM,FloraxRJ,VermaatJE(2006)Theempiricsofwetlandvaluation:acomprehensivesummaryandameta-analysisoftheliterature.EnvironmentalandResourceEconomics33:223-250
ChapmanD(1978)Productioninfishpopulations.In:GerkingS(ed)Ecologyoffreshwaterfishproduction.Whiley,NewYork
ColesR,LeeLongW,SquireB,SquireL,BibbyJ(1987)Distributionofseagrassesandassociatedjuvenilecommercialpenaeidprawnsinnorth-easternQueenslandwaters.MarineandFreshwaterResearch38:103-119

RepairingAustralia’sseascapes–TropWATERReportno.17/122017
Page35
ConnollyRM(1999)Saltmarshashabitatforfishandnectoniccrustaceans:challengesinsamplingdesignsandmethods.AustralEcology24:422-430
ConnollyRM(2009)FishonAustraliansaltmarshes.In:SaintilanN(ed)Australiansaltmarshecology.CSIROPublishing,Collingwood
CostanzaR,d'ArgeR,deGrootR,FaberS,GrassoM,HannonB,LimburgK,NaeemS,O'NeillR,ParueloJ,RaskinR,SuttonP,VandenBeltM(1997)Thevalueoftheworld'secosystemservicesandnaturalcapital.
CostanzaR,FolkeC(1997)Valuingecosystemserviceswithefficiency,fairnessandsustainabilityasgoals.Nature’sservices:Societaldependenceonnaturalecosystems:49-70
CostanzaR,WilsonMA,TroyA,VoinovA,LiuS,D'AgostinoJ(2006)ThevalueofNewJersey'secosystemservicesandnaturalcapital.
CoxME,MossA,SmythGK(2005)WaterqualityconditionandtrendinNorthQueenslandwaterways.MarinePollutionBulletin51:89-98
CreightonC,BoonPI,BrookesJD,SheavesM(2015)RepairingAustralia'sestuariesforimprovedfisheriesproduction–whatbenefits,atwhatcost?MarineandFreshwaterResearch66:493-507
DavisB,JohnstonR,BakerR,SheavesM(2012)Fishutilisationofwetlandnurserieswithcomplexhydrologicalconnectivity.PLOSONE7:e49107
EngleVD(2011)EstimatingtheprovisionofecosystemservicesbyGulfofMexicocoastalwetlands.Wetlands31:179-193
FabriciusK,De’athG,McCookL,TurakE,WilliamsDM(2005)Changesinalgal,coralandfishassemblagesalongwaterqualitygradientsontheinshoreGreatBarrierReef.MarinePollutionBulletin51:384-398
FontaineA,DevillersR,Peres-NetoPR,JohnsonLE(2015)Delineatingmarineecologicalunits:anovelapproachfordecidingwhichtaxonomicgrouptouseandwhichtaxonomicresolutiontochoose.DiversityandDistributions21:1167-1180
FreemanAM(1991)Valuingenvironmentalresourcesunderalternativemanagementregimes.EcologicalEconomics3:247-256
FroeseR,PaulyD(2017),Editors.FishBase.WorldWideWebelectronicpublication.www.fishbase.org(01/2017).
FujiwaraM,ZhouC,AcresC,Martinez-AndradeF(2016)InteractionbetweenpenaeidshrimpandfishpopulationsintheGulfofMexico:Importanceofshrimpasforagespecies.PLOSONE11:e0166479
GrechA,ColesR,MarshH(2011)Abroad-scaleassessmentoftherisktocoastalseagrassesfromcumulativethreats.MarinePolicy35:560-567
HartRA(2012)Stockassessmentofbrownshrimp(Farfantepenaeusaztecus)intheUSGulfofMexicofor2011.NOAATechnicalMemorandumNMFS-SEFSC638:37
HartRA,NanceJM(2013)ThreedecadesofUSGulfofMexicowhiteshrimp,Litopenaeussetiferus,commercialcatchstatistics.MarineFisheriesReview75:43-47
HeatheringtonC,BishopMJ(2012)Spatialvariationinthestructureofmangroveforestswithrespecttoseawalls.Marine&FreshwaterResearch63:926-933
HladyzS,WatkinsSC,WhitworthKL,BaldwinDS(2011)Flowsandhypoxicblackwatereventsinmanagedephemeralriverchannels.JournalofHydrology401:117-125
HughesR,WilliamsS,DuarteC,HeckKj,WaycottM(2009)Associationsofconcern:decliningseagrassesandthreateneddependentspecies.FrontiersinEcologyandtheEnvorinment7:242-246

RepairingAustralia’sseascapes–TropWATERReportno.17/122017
Page36
IvlevVS(1966)Thebiologicalproductivityofwaters.JournaloftheFisheriesBoardofCanada23:1727-1759
JacksonEL,WildingC,AttrillMJ(2015)Useofaseagrassresidencyindextoapportioncommercialfisherylandingvaluesandrecreationfisheriesexpendituretoseagrasshabitatservice.ConservationBiology29:899-909
JohnstonR,SheavesM(2007)Smallfishandcrustaceansdemonstrateapreferenceforparticularsmall-scalehabitatswhenmangroveforestsarenotaccessible.JournalofExperimentalMarineBiologyandEcology353:164-179
JohnstonR,SheavesM(2008)Cross-channeldistributionofsmallfishintropicalandsubtropicalcoastalwetlandsistrophic-,taxonomic-,andwetlanddepth-dependent.MarineEcology-ProgressSeries357:255-270
KimballME,AbleKW(2012)Tidalmigrationsofintertidalsaltmarshcreeknektonexaminedwithunderwatervideo.NortheasternNaturalist19:475-486
KneibR(2003)Bioenergeticandlandscapeconsiderationsforscalingexpectationsofnektonproductionfromintertidalmarshes.MarineEcologyProgressSeries264:279-296
LeeSY(2004)Relationshipbetweenmangroveabundanceandtropicalprawnproduction:are-evaluation.MarineBiology145:943-949
LewandowskiAS,NossRF,ParsonsDR(2010)Theeffectivenessofsurrogatetaxafortherepresentationofbiodiversity.ConservationBiology24:1367-1377
LoneraganNR,WangY-G,KenyonRA,StaplesDJ,VanceDJ,HealesDS(1995)EstimatingtheefficiencyofasmallbeamtrawlforsamplingtigerprawnsPenaeusesculentusandP.semisulcatusinseagrassbyremovalexperiments.MarineEcologyProgressSeries118:139-148
LoneraganNR,BunnSE,KellawayDM(1997)AremangrovesandseagrassessourcesoforganiccarbonforpenaeidprawnsinatropicalAustralianestuary?Amultiplestable-isotopestudy.MarineBiology130:289-300
MaceIIIMM,RozasLP(2015)EstimatingnaturalmortalityratesofjuvenilewhiteshrimpLitopenaeussetiferus.EstuariesandCoasts38:1580-1592
MansonF,LoneraganN,HarchB,SkilleterG,WilliamsL(2005)Abroad-scaleanalysisoflinksbetweencoastalfisheriesproductionandmangroveextent:acase-studyfornortheasternAustralia.FisheriesResearch74:69-85
McArthurLC,BolandJW,EdyvaneKS,JonesGK(2000)Developmentofaseagrass-fishhabitatmodel—I:ASeagrassResidencyIndexforeconomicallyimportantspecies.In:ScottLC,BolandJW,EdyvaneKS,JonesG(eds)Environmetrics,Book11
McArthurLC,BolandJW(2006)TheeconomiccontributionofseagrasstosecondaryproductioninSouthAustralia.EcologicalModelling196:163-172
MellinC,DeleanS,CaleyJ,EdgarG,MeekanM,PitcherR,PrzeslawskiR,WilliamsA,BradshawC(2011)Effectivenessofbiologicalsurrogatesforpredictingpatternsofmarinebiodiversity:aglobalmeta-analysis.PLoSOne6:e20141
MeyneckeJ-O,PooleGC,WerryJ,LeeSY(2008)UseofPITtagandunderwatervideorecordinginassessingestuarinefishmovementinahighintertidalmangroveandsaltmarshcreek.EstuarineCoastalandShelfScience79:168–178
MinelloT,WebbJrJ(1997)UseofnaturalandcreatedSpartinaalterniflorasaltmarshesbyfisheryspeciesandotheraquaticfaunainGalvestonBay,Texas,USA.MarineEcologyProgressSeries151:165-179
MinelloTJ,ZimmermanRJ,MartinezEX(1989)MortalityofyoungbrownshrimpPenaeusaztecusinestuarinenurseries.TransactionsoftheAmericanFisheriesSociety118:693-708

RepairingAustralia’sseascapes–TropWATERReportno.17/122017
Page37
MinelloTJ(2000)Temporaldevelopmentofsaltmarshvaluefornektonandepifauna:utilizationofdredgedmaterialmarshesinGalvestonBay,Texas,USA.WetlandsEcologyandManagement8:327-342
MinelloTJ,RozasLP(2002)NektoninGulfcoastwetlands:Fine-scaledistributions,landscapepatterns,andrestorationimplications.EcologicalApplications12:441–455
MinelloTJ,MatthewsGA,CaldwellPA,RozasLP(2008)PopulationandproductionestimatesfordecapodcrustaceansinwetlandsofGalvestonBay,Texas.TransactionsoftheAmericanFisheriesSociety137:129-146
MinelloTJ,RozasLP,BakerR(2012a)Geographicvariabilityinsaltmarshfloodingpatternsmayaffectnurseryvalueforfisheryspecies.EstuariesandCoasts35:501-514
MinelloTJ,RozasLP,CaldwellPA,LieseC(2012b)Acomparisonofsaltmarshconstructioncostswiththevalueofexportedshrimpproduction.Wetlands32:791-799
MooreM,PowerT,MarsdenT(2007)FishcommunityconditionoftheMackayWhitsundayregion.QueenslandDepartmentofPrimaryIndustriesandFisheries,Brisbane,Australia
NagelkerkenI,SheavesM,BakerR,ConnollyRM(2015)Theseascapenursery:anovelspatialapproachtoidentifyandmanagenurseriesforcoastalmarinefauna.FishandFisheries16:362-371
NewmanSJ,WilliamsD,RussGR(1996)Agevalidation,growthandmortalityratesofthetropicalsnappers(Pisces:Lutjanidae)Lutjanusadetii(Castelnau,1873)andL.quinquelineatus(Bloch,1790)fromthecentralGreatBarrierReef,Australia.MarineandFreshwaterResearch47:575-584
PaulyD,MorganG(1987)Length-basedmethodsinfisheriesresearch,Vol13.WorldFish
PetersonCH,GrabowskiJH,PowersSP(2003)Estimatedenhancementoffishproductionresultingfromrestoringoysterreefhabitat:quantitativevaluation.MarineEcologyProgressSeries264:249-264
PineWE,PollockKH,HightowerJE,KwakTJ,RiceJA(2003)Areviewoftaggingmethodsforestimatingfishpopulationsizeandcomponentsofmortality.Fisheries28:10-23
PowellB,MartensM(2005)Areviewofacidsulfatesoilimpacts,actionsandpoliciesthatimpactonwaterqualityinGreatBarrierReefcatchments,includingacasestudyonremediationatEastTrinity.MarinePollutionBulletin51:149-164
ReedDJ,BeallA,MartinezL,MinelloTJ,O'ConnellAU,RozasLP,PenlandS,CashnerRC,CommagereAM(2007)Modelingrelationshipsbetweentheabundanceoffisheryspecies,coastalwetlandlandscapes,andsalinityintheBaratariaBasin,Louisiana.FinalreporttoNOAANationalMarineFisheriesServiceandtheLouisianaCoastalWetlandsConservationandRestorationTaskForce,TheUniversityofNewOrleans,148p
RobertsonAI,DukeNC(1987)Mangrovesasnurserysites:ComparisonsoftheabundanceandspeciescompositionoffishandcrustaceansinmangrovesandothernearshorehabitatsintropicalAustralia.Marinebiology,Heidelberg96:193-205
RobertsonAI(1988)Abundance,dietandpredatorsofjuvenilebananaprawns,Penaeusmerguiensis,inatropicalmangroveestuary.AustralianJournalofMarineandFreshwaterResearch39:467-478
RothB,RoseK,RozasL,MinelloT(2008)RelativeinfluenceofhabitatfragmentationandinundationonbrownshrimpFarfantepenaeusaztecusproductioninnorthernGulfofMexicosaltmarshes.MarineEcologyProgressSeries359:185-202
RozasLP,MinelloTJ(1997)Estimatingdensitiesofsmallfishesanddecapodcrustaceansinshallowestuarinehabitats:areviewofsamplingdesignwithfocusongearselection.Estuaries20:199-213
RozasLP,ZimmermanRJ(2000)Small-scalepatternsofnektonuseamongmarshandadjacentshallownonvegetatedareasoftheGalvestonBayEstuary,Texas(USA).MarineEcologyProgressSeries193:217-239
RepairingAustralia’sseascapes–TropWATERReportno.17/122017
Page38
RozasLP,CaldwellP,MinelloTJ(2005)Thefisheryvalueofsaltmarshrestorationprojects.JournalofCoastalResearch:37-50
RozasLP,MinelloTJ,ZimmermanRJ,CaldwellP(2007)Nektonpopulations,long-termwetlandloss,andtheeffectofrecenthabitatrestorationinGalvestonBay,Texas,USA.MarineEcologyProgressSeries344:119-130
RussGR,LouDC,HiggsJB,FerreiraBP(1998)Mortalityrateofacohortofthecoraltrout,Plectropomusleopardus,inzonesoftheGreatBarrierReefMarineParkclosedtofishing.MarineandFreshwaterResearch49:507-511
RussellD,PrestonK,MayerR(2011)Recoveryoffishandcrustaceancommunitiesduringremediationoftidalwetlandsaffectedbyleachatefromacidsulfatesoilsinnorth-easternAustralia.WetlandsEcologyandManagement19:89-108
RussellDJ,GarrettRN(1983)Usebyjuvenilebarramundi,Latescalcarifer(Bloch),andotherfishesoftemporarysupralittoralhabitatsinatropicalestuaryinnorthernAustralia.AustJMarFreshwatRes34:805-811
SaintilanN,RogersK(2013)ThesignificanceandvulnerabilityofAustraliansaltmarshes:implicationsformanagementinachangingclimate.MarineandFreshwaterResearch64:66-79
SaliniJP,BlaberSJM,BrewerDT(1990)DietsofpiscivorousfishesinatropicalAustralianestuary,withspecialreferencetopredationonpenaeidprawns.MarineBiology105:363-374
SaliniJP,BrewerDT,BlaberSJM(1998)DietarystudiesonthepredatoryfishesoftheNormanRiverestuary,withparticularreferencetopenaeidprawns.Estuarine,CoastalandShelfScience46:837-847
SerafyJ,HarrellR,StevensonJ(1988)Quantitativesamplingofsmallfishesindensevegetation:Designandfieldtestingofportable“pop-nets”.JournalofAppliedIchthyology4:149-157
SheavesM(1992)Patternsofdistributionandabundanceoffishesindifferenthabitatsofamangrove-linedtropicalestuary,asdeterminedbyfishtrapping.Australianjournalofmarineandfreshwaterresearch43:1461-1479
SheavesM(1996)DospatialdifferencesintheabundanceoftwoserranidfishesinestuariesoftropicalAustraliareflectlongtermsalinitypatterns?MarineEcology-ProgressSeries137:39-49
SheavesM,ConnollyR,JohnstonR(2007a)AssessmentofTechniquesforDeterminingtheHealthofTropicalEstuarineEcosystems.MarineandTropicalSciencesResearchFacility,Cairns
SheavesM,JohnstonR,AbrantesK(2007b)Fishfaunaofdrytropicalandsubtropicalestuarinefloodplainwetlands.MarineandFreshwaterResearch58:931-993
SheavesM,JohnstonR(2008)Influenceofmarineandfreshwaterconnectivityonthedynamicsofsubtropicalestuarinewetlandfishmetapopulations.MarineEcology-ProgressSeries357:225-243
SheavesM,JohnstonR(2010)ImplicationsofspatialvariabilityoffishassemblagesformonitoringofAustralia'stropicalestuaries.AquaticConservation-MarineandFreshwaterEcosystems20:348-356
SheavesM,JohnstonR,ConnollyRM,BakerR(2012)Importanceofestuarinemangrovestojuvenilebananaprawns.Estuarine,CoastalandShelfScience114:208-219
SheavesM,BrookesJ,ColesR,FreckeltonM,GrovesP,JohnstonR,WinbergP(2014)RepairandrevitalisationofAustralia'stropicalestuariesandcoastalwetlands:opportunitiesandconstraintsforthereinstatementoflostfunctionandproductivity.MarinePolicy47:23-36
SheavesM,BakerR,AbrantesKG,ConnollyRM(2016a)Fishbiomassintropicalestuaries:Substantialvariationinfoodwebstructure,sourcesofnutritionandecosystem-supportingprocesses.EstuariesandCoasts:1-14

RepairingAustralia’sseascapes–TropWATERReportno.17/122017
Page39
SheavesM,JohnstonR,BakerR(2016b)Useofmangrovesbyfish:newinsightsfromin-forestvideos.MarineEcologyProgressSeries549:167-182
SmithMD(2007)Generatingvalueinhabitat-dependentfisheries:theimportanceoffisherymanagementinstitutions.LandEconomics83:59-73
Staunton-SmithJ,RobinsJB,MayerDG,SellinMJ,HallidayIA(2004)Doesthequantityandtimingoffreshwaterflowingintoadrytropicalestuaryaffectyear-classstrengthofbarramundi(Latescalcarifer)?MarineandFreshwaterResearch55:787-797
ThomCSB,LaPeyreMK,NymanJA(2004)EvaluationofnektonuseandhabitatcharacteristicsofrestoredLouisianamarsh.EcologicalEngineering23:63-75
VanceDJ,HaywoodMDE,StaplesDJ(1990)Useofamangroveestuaryasanurseryareabypostlarvalandjuvenilebananaprawns,PenaeusmerguiensisdeMann,innorthernAustralia.Estuarine,CoastalandShelfScience31:689-701
VoQT,KuenzerC,VoQM,ModerF,OppeltN(2012)Reviewofvaluationmethodsformangroveecosystemservices.EcologicalIndicators23:431-446
WalkerB,HollingCS,CarpenterSR,KinzigA(2004)Resilience,adaptabilityandtransformabilityinsocial-ecologicalsystems.Ecologyandsociety9:5
WalkerTI,TaylorBL,HudsonRJ,CottierJP(1998)Thephenomenonofapparentchangeofgrowthrateingummyshark(Mustelusantarcticus)harvestedoffsouthernAustralia.FisheriesResearch39:139-163
WatsonJ,WorkmanI,HatawayB(1992)ThebehavioroffishandshrimpencounteringtrawlsintheSoutheasternUSpenaeidshrimpfishery.MTS92:336-341
WatsonRA,ColesRG,LongWJL(1993)Simulationestimatesofannualyieldandlandedvalueforcommercialpenaeidprawnsfromatropicalseagrasshabitat,NorthernQueensland,Australia.AustralianJournalofMarineandFreshwaterResearch44:211-219
WegscheidlC,SheavesM,CreightonC,McLeodI,GillesC,HedgeP(inreview)Australia’scoastalseascapes–acaseforcollectingandcommunicatingquantitativeevidencetofostersustainablecoastaldevelopment,protectionandrepair.
WeinsteinMP,LitvinSY(2016)Macro-RestorationofTidalWetlands:AWholeEstuaryApproach.EcologicalRestoration34:27-38
WongVNL,JohnstonSG,BushRT,SullivanLA,ClayC,BurtonED,SlavichPG(2010)Spatialandtemporalchangesinestuarinewaterqualityduringapost-floodhypoxicevent.EstuarineCoastalandShelfScience87:73-82
WoodwardRT,WuiY-S(2001)Theeconomicvalueofwetlandservices:ameta-analysis.EcologicalEconomics37:257-270
XiaoY,GreenwoodJG(1993)ThebiologyofAcetes(Crustacea;Sergestidae).OceanographyandMarineBiology:AnAnnualReview31:259-444
ZimmermanRJ,MinelloTJ,RozasLP(2002)SaltmarshlinkagestoproductivityofpenaeidshrimpsandbluecrabsinthenorthernGulfofMexico.ConceptsandControversiesinTidalMarshEcology.Springer
zuErmgassenPS,GrabowskiJH,GairJR,PowersSP(2016)Quantifyingfishandmobileinvertebrateproductionfromathreatenednurseryhabitat.JournalofAppliedEcology53:596-606
RepairingAustralia’sseascapes–TropWATERReportno.17/122017
Page40
CHAPTER 3 - IMPROVING OUR ABILITY TO ESTIMATE THE VALUE OFESTUARINE NURSERY HABITATS TO JUVENILE BANANA PRAWNS(FENNEROPENAEUSMERGUIENSIS)INNORTHQUEENSLANDESTUARIESKátyaGAbrantes1,MarcusSheaves1,2,JakobFries1
1CollegeofScienceandEngineering,JamesCookUniversity,Townsville,QLD,Australia2TropWATER,JamesCookUniversity3.1Abstract
Estimates of the value of different habitats can provide an objective basis for the prioritisation ofconservationandrestorationactions.The fisheriesproductionthatcanbeattributedtoaparticularunit(e.g.awetland,amangroveforestorawholeestuary) isoneobviousmeasure,butonethathasprovendifficulttoestimateeffectively.Weusedthecasestudyoftheuseofatropicalestuarybyjuvenilebananaprawns,Fenneropenaeusmerguiensis,toassessthepotentialtoproducevaluableproductionestimates,intermsoflogicalconstrainsandestimatederrorstructure,atthreespatio-conceptualscales:(i)theestuaryreach, (ii) the whole estuary, and (iii) the contribution of the estuary to the exploited stock. Becausehabitatswithlowoccupancycanhavehightrophicvalue,wealsousedstableisotopeanalysistoassesstheimportanceofmangrovesandsaltmarshesasultimatesourcesofnutritiontoF.merguiensisinfourNorthQueensland estuaries. Estimates of production showed high spatial and temporal variability. This resultwas not unexpected; evaluating patterns of abundance ofmobile organisms is always difficult because,ratherthanafewprominentparametersdetermininghowmanyindividualsoccurinaparticularplaceataparticularpointintime,localabundanceistheresultoftheinteractionofawidearrayoffactors,whathasbeendescribedasacausal thicket.Of the threeconceptual scales investigated,estimates for thewholeestuary were the most viable. Estimates for individual estuary reaches or habitat types require theunreasonable assumption that prawns remain in the one area during their time in the estuary, whileestimatesofcontributionofanestuarytotheoffshorefisheryrequiredifficulttoobtaininformation,suchastheproportionthatdifferentestuariescontributetooffshorestock(s).StableisotopeanalysisindicatedthatF.merguiensisjuvenilesusedavarietyofprimaryproducersassourcesofnutrition,suggestingthatnoparticular type of habitat is of critical nutritive importance, addingweight to the idea that productivityoutcomes for F.merguiensis are likely to bemost usefully and validly assessed at thewhole-of-estuaryscale. Interest in repair investments ishigh. So tooareexpectationsby these investors that science canprovideaccuratequantificationofpotentialproductivitybenefit.Indeedthesystemsandinteractionsaretoo complex for accuratequantification.Weprovidevery conservativeestimatesofproductivitybenefitusing Banana Prawns as an index of likely productivity change. Even these conservative estimatesdemonstratethelikelyoutstandingbenefitsofseascaperepair.3.2Introduction
Penaeidprawnsarecommerciallyimportantthroughouttheirdistributionduetotheirhighdensities,veryhighreproductiveoutput,andfastgrowthratesthatallowharvestingwithinayear.Theirtypicallife-cycleinvolves adults that occur in near- and offshore waters, and larvae that migrate to estuarine wetlandhabitats,whichareusedasnurseryareas.Due to theirhigheconomic importance,penaeidbiologyandfisheriesaresomeofthemostwell-studied.However,evenwithinaregion,landingscanvarysubstantiallyboth among andwithin years due to the complex range of factors that affect recruitment, growth andsurvival, includingbothbiologicalandclimaticpredictors (Robinsetal.2005,Diopetal.2007).Typically,theabundanceofcommercial-sizedpenaeidprawns ispredictedusingoneofthreeapproaches:1)adultabundance is related to biological factors such as the abundance of post-larvae or juveniles in relatedhabitats, 2) adult abundance is related to environmental parameters (e.g. rainfall, habitat type andavailability,temperature),or3)stock-recruitmentmodelsareusedtorelatetheabundanceofpenaeidsat

RepairingAustralia’sseascapes–TropWATERReportno.17/122017
Page41
thereproductivestageinonegenerationtothenumbersenteringthefisheryinthefollowinggeneration.Modelshavealsobeendeveloped thatcombine the threeapproaches (Diopetal.2007). It is thusclearthat the abundanceof early life-history stages and theecological conditions in adjacent coastal nurseryhabitatsarecriticalfactorsaffectingadultabundanceand,therefore,potentialfisheriesoutput.Infaceofthe worldwide increase in coastal habitat degradation due to various anthropogenic actions (e.g.agriculture,urbanisation),itisimperativetoidentifyandattributeavaluetothemostimportanthabitatssupportingtheearlylife-historystagesofpenaeidprawns,sothatthesecanbeprioritisedinconservationand/orrestorationprojects,ensuringcontinuingprofitablefisheries(Sheavesetal.2014).The banana prawn, Fenneropenaeus merguiensis, is an important fishery species in northern Australia,wheretherehasbeenextensiveresearchonthespecies’biologyandecology(e.g.Vanceetal.1990,Vanceet al. 1996, Loneragan et al. 1997, Vance et al. 1998, Kenyon et al. 2004). Juvenile F. merguiensis areparticularlyassociatedwithmangroveestuaries(Vanceetal.1990,Kenyonetal.2004),andF.merguiensiscatches have been found to be correlated to the extent of mangrove forests along adjacent coasts(Manson et al. 2005), making this species an ideal model to study habitat-production relationships.However,becauseseveralfactorssynergisticallyaffectprawncatches(Vanceetal.1985,Diopetal.2007),becausemany factorsother than thepresencesofmangrovesdrive abundances (Sheaves et al. 2012a),and because catches typically occur in offshore habitats that are distant and different to the coastaljuvenilehabitats,itisverydifficulttoattributeamonetaryvalueperareatothedifferentjuvenilehabitats,i.e.toestimatethevalueforfisheriesproductionthatarisesfromthepreservationorrestorationofaunitofeachofthedifferentjuvenilehabitats(Sheaves&Abrantes2017).ProductionestimatesThe first step in addressing habitat valuation in terms of fisheries output would be to determine theimportanceofthedifferentjuvenilehabitats.Measuresofproduction(theincreaseinbiomassovertimefor a population (Chapman 1978)) are particularly useful in habitat valuation (e.g. McArthur & Boland2006,Barbier2007)becausetheyattributeavaluetoahabitatunitbydetailingtheamountofbiomassproduced from that unit over a specific time period. Although basic information on biomass density isavailable for F. merguiensis for several North Queensland (Australia) estuaries (Sheaves et al. 2012a;Sheaves,Abrantes,unpubl.data),substantialresearchisstillneededbeforethiscanbeconvertedtovalidestimatesoftotalbiomassand/orproduction(Sheaves&Abrantes2017),particularlyifthepurposeistolinkproductiontospecifichabitatunits(e.g.specificareasofintertidalwetland).Indeed,biomassdensityneeds to be estimated for the different habitats at finer scales, and the results then combined withdetailedhabitatmapping(includingtopographyandbathymetry),andgrowthrates,size-relatedmortalityrates, recruitmentandemigration ratesneed tobeestimated (Minelloetal. 2008,Minelloetal. 2012).Studiesarealsoneededtodevelopthebestpossibleestimatesofbiomassdensityforhabitatsthatcannotbesampledusingconventionalgears(Sheaves&Abrantes2017).Although production estimates provide themost complete picture of the value of a habitat or area, inmanycasesthenecessarybasedataarestillunavailable,bothbecauseitistime-consumingandlogisticallydifficulttocollect,andbecausethedynamicsofspeciespopulationsrelativeto individualtargethabitatsprevents the development of valid estimates (Sheaves&Abrantes 2017). Consequently, itwill often bemore reasonable and profitable to direct work towards producing high quality estimates of biomassdensity(i.e.biomassperunitarea)forthedifferenthabitatunits.Althoughnotintegratedovertime,andsonot providingdirect informationon the increase in biomass per time, biomass density estimates areusually more achievable and can provide useful relative measures of habitat value that are easilyunderstood and easily communicated, as long as their limitations as snapshots in time are recognised(Sheaves&Abrantes2017).Foraparticularpointintime,standingstockbiomassdensityprovidesawell-establishedandvalidbasisforevaluatingthecontributionsfromestuaryandcoastalwetlandhabitatsandabasicmeasureofhowthosecontributionsarelikelytochangeunderdifferentscenarios.

RepairingAustralia’sseascapes–TropWATERReportno.17/122017
Page42
SourcesofNutritionFenneropenaeusmerguiensisarekeycomponentsofwell-knownfoodwebs(e.g.Figure1).Theyareoflowtrophic level and feedmostlyondetritusof variousorigins (up to75%)and small benthic invertebratessuch as crustaceans and gastropods (Chong & Sasekumar 1981, Robertson 1988). Stable isotope-basedstudieshavebeenusedtoidentifytheultimatesourcesofnutritionforF.merguiensisjuvenilesinseveralNorthQueenslandsystemsincludingrivers(Loneraganetal.1997),estuarinecreeks(Abrantesetal.2015),floodplain pools (Sheaves et al. 2007a, Abrantes& Sheaves 2009b) and semi-enclosed coastal channels(Abrantes & Sheaves 2009a). Although those studies suggest that mangroves can be importantcontributorstojuvenilenutrition,butnostudyhasconfirmedifthissourceisofcriticalimportanceorifF.merguiensis juveniles can exclusively rely on other sources when mangroves are not present. Stableisotope analysis of carbon (δ13C) andnitrogen (δ15N) areuseful in coastal foodweb studies because (1)they often differ among different types of primary producers (e.g. seagrass, mangroves, microalgae;particularly for δ13C) (France 1995, France 1996) and (2) because they changepredictability as they arepassedon fromfoodsource toconsumer (DeNiro&Epstein1978,1981,McCutchanetal.2003).Stableisotopeanalysiscanthereforebeusedtodetermineifmangrovesand/orsaltmarsharecrucialsourcesofnutrition to F. merguiensis juveniles in North Queensland estuaries, so that the trophic importance ofthesehabitatscanbeevaluated.
Figure 1. Simplified schematic food web leading to F. merguiensis at the mangrove-dominatedHinchinbrook Channel, NorthQueensland (adapted fromAbrantes and Sheaves (2009a)). 1 –mangrovedetritus;2–microphytobenthos;3–greenfilamentousalgae;4–seagrass,seagrassdetritusandseagrassepiphytes;5–phytoplankton;6–upperintertidalbenthicfauna;7–lowerintertidalandsubtidalbenthicfauna; 8 – zooplankton. Figures and symbols courtesy of the Integration and Application Network,UniversityofMarylandCentreforEnvironmentalScience(ian.umces.edu/imagelibrary)Inthecurrentstudy,we(a)usemeasurementsofbiomassdensityinatypicalNorthQueenslandestuarinesystem to assess the suitability of the currently available methods of biomass/production/productivityestimation for the particular case of the banana prawns F.merguiensis in this region. In particular, weevaluate thepotential toproducevaluableestimates, in termsof logical constrainsandestimatederrorstructure,atthreespatio-conceptualscales:(i)estuaryreach,(ii)thewholeestuaryseascape,and(iii)thecontributionoftheestuarytotheoffshoreexploitedstock.Notethatevenif/whenhighqualityestimatesofbiomassproductionareavailable,moreinformationislikelytoberequiredtotrulyassessproductivity.Thisisbecauseevenhabitatswithlowoccupancycanhaveatrophicimportancethroughtheprovisionofessential nutrients needed for growth and development. Consequently, to identify themain sources ofnutritionsupportingF.merguiensisjuveniles,wealso(b)usedstableisotopeanalysisofcarbon(δ13C)andnitrogen (δ15N) to investigate the importance of mangroves and saltmarshes as ultimate sources ofnutritiontoF.merguiensisinfourNorthQueenslandestuaries.

RepairingAustralia’sseascapes–TropWATERReportno.17/122017
Page43
SaltmarshandmangrovehabitatnearCairns,NorthQueensland.Photocredit:RossJohnston
3.3Methods
EvaluatingF.merguiensisproductivityThe productivity part of this study was conducted in Alligator Creek (Figure 2), a short and narrow(maximum width ~150 m) creek typical of Australia’s wet-dry tropics. The wet-dry tropical climate ischaracterised by distinct and short wet seasons and long dry seasons when very little rainfall occurs.Alligator Creek is mostly bordered by mangrove forest, particularly in the downstream reach, andsaltmarsh alsooccurs in someareas (Table 1). Tides are semi-diurnal (maximum range~4m). Samplingwasconductedinthreeestuarinereaches:downstream,mid-estuaryandupstream,eachsampledoveralength of ~1.5 km. The downstream reach was the area immediately inside the estuary mouth, theupstreamreachwasthelimitofnavigationofour4.3mboat,andthemid-estuarywasapproximatelyhalf-waybetweenthedownstreamandupstreamreaches.Table3.Proportionofedgehabitat(mean±SD)inthedownstream,mid-estuaryandupstreamreachesofAlligatorCreek.
Proportionofedgehabitat(%)
Reach Mangrove SaltmarshDownstream 94±7 6±7Mid-estuary 66±13 34±13Upstream 79±16 21±16

RepairingAustralia’sseascapes–TropWATERReportno.17/122017
Page44
Figure2.MapshowingthelocationsofthestudysitesinNorthQueensland.Samplingwas conductedover the2015-2016wet season (December2015 toApril 2016), toencompasstheperiodofhighF.merguiensis juvenileabundanceinnorthernAustralia(Staples&Vance1986,1987).Prawnswere captured during 11 tripswith a 5mmmeshmonofilament draw-string cast net (samplingdiameter: ~2.4m; sampling area: ~4.5m2) deployed from a small boat by an experienced operator.Samplingwasdoneduringthe lowerpartof thetideswhenanimalsare forcedoutof theedgehabitatsand intothemainchannel.Duringeachtrip,15,20or30castnetreplicatesweretakenalongthecreekbanks(≤~2mfromcreekmargin)ateachofthethreereaches.Allprawnscollectedwerestoredinice.Inthe laboratory, prawnswere identified and F.merguiensis counted,measured andweighed. Numericaldensity (in ind.net-1) and biomass density (in g.net-1) were then calculated for each reach, and used toestimate total abundance and total biomass per reach. Here,measured densities per netwere used asrepresentative of the area along the 2m wide creek margins, as F. merguiensis typically occur alongshallowwatercreekedges(Johnston&Sheaves2007).Theremainingestuarinearea(i.e.themiddleofthecreek,beyondthe2mwideedges)wasconsideredtocontainfewprawns,i.e.densitieswereconsideredto

RepairingAustralia’sseascapes–TropWATERReportno.17/122017
Page45
beclosetozero(R.Johnstonpers.com.).Thelength-weightrelationship(Figure3),acrucialparameterforproductionestimateswasalsoestimated,andrelativeabundance-by-lengthwasanalysedforeachreachandtriptoidentifymovementsamongreachesandrecruitment/emigrationevents.
Figure3.Length-weightrelationshipforF.merguiensiscollectedatAlligatorCreek:W=2E-0.6×L3.2,R²=0.98(n=1006).SourcesofnutritionFenneropenaeusmerguiensis juveniles and a range of available primary producers were collected fromfour representative systems inNorthQueensland:Deluge Inlet, CocoaCreek,DoughboyCreek, and twoun-vegetated semi-isolated floodplain pools in the Ross River estuary, one surrounded by mangrovevegetationandonebysaltmarsh,withonlyafewsmallmangrovetreespresent(Figure2).DelugeInletisamangrove-dominatedsystemthatflowsintotheHinchinbrookChannel.Seagrassbedsoccuratthemouthof the inlet and in the Channel. Cocoa and Doughboy creeks are short and narrow mangrove-fringedsystems typical of theNorthQueensland coast.Mangrove forest ismore abundant atDoughboyCreek,with a percentage cover of 50% compared to 19% at CocoaCreek (percentage cover calculated for thearea within 1km from the creek margins) (Abrantes et al. 2015). Saltmarsh occurs landward of themangrovefringeandseagrassisalsopresentatthemouthofCocoaCreek.ThetwoRossRiverfloodplainpoolsarerelativelysmallandshallow(<1matlowtide)andareintermittentlyconnectedatspringtidestootherpoolsandtothemainestuarythroughnarrowchannels.Thesedifferentsystemswereconsideredasthey encompass the range of systems and habitats available to F. merguiensis juveniles in NorthQueensland.Juvenile sizes rangedbetween30and45mmTL,withexceptionof theHinchinbrookChannel,where itwasonlypossibletocollectlarger(50-55mmTL)juveniles.Detailsofanimalcollectionsandstableisotopesample processing and analysis can be found in Abrantes and Sheaves (2009a, b) and Abrantes et al.(2015).ToquantifytheimportanceofthedifferentprimaryproducerstoF.merguiensisjuveniles,stableisotope-basedBayesianmixingmodelswererun,usingthepackagesimmr(StableIsotopeMixingModelinRv.3;Parnelletal.2013)inR(RDevelopmentCoreTeam2013).DetailsofthismodelcanbefoundinParnelletal.(2010,2013).Trophicdiscriminationfactorsof1.0±0.5‰forδ13Cand2.8±0.5‰forδ15Nwereused,

RepairingAustralia’sseascapes–TropWATERReportno.17/122017
Page46
asappropriatefornon-acidtreatedmuscletissue(McCutchanetal.2003),andjuvenileswereconsideredto be of trophic level of 2.5 (Abrantes & Sheaves 2009b). Results on the importance ofmangrove andsaltmarsh were considered as indicators of the likely trophic value of these habitats to F. merguiensisjuveniles. 3.4Results
EvaluatingF.merguiensisproductivityBecause F.merguiensis juveniles occurmostly along the shallow, 2mwide, edges (Johnston& Sheaves2007), with few prawns occurring beyond this area (R. Johnston pers. com.), we focus our results andassessmentsondensities (pernet)withinthe2mcreekmargins, ratherthanaveragedensitiesovertheoverallcreekarea.Bothaveragenumericaldensityandbiomassdensityvariedgreatlyamongtripsandreaches(Figure4).Ingeneral,fewprawnswerecapturedinthefirsttwotrips(mid-December2015),butcatchesincreasedfromthethirdtriponwards(Figure4).Catchesweretypicallymuchhigherinthedownstreamreachthaninthemid-estuary and the upstream reaches. In the upstream reach, average numerical and biomass densitywere very low, generally <5 ind.net-1 and <3 g.net-1 respectively (Figure 4), corresponding to <3,000juveniles, weighing ≤4 kg, for the overall upstream reach area. Only in trips 8 and 9 was upstreamabundance (15,136.2 and 7,693.5 individuals respectively) and biomass (5.3 and 7.2 kg respectively)higher,suggestingapeakinabundanceandbiomasspriortoemigrationfromtheestuary.
Figure4.Averagedensity(top)andbiomassdensity(bottom)ofF.merguiensis inAlligatorCreek(forthe2m wide edge area) over the 2015-2016 wet season, and rainfall recorded for Townsville (the closestweather station, ~27 km away) for the same period (Bureau of Meteorology, www.bom.au, accessed09/02/17). For rainfall, values correspond to the total rain (mm) that fell between that date and theprevious sampling trip, apart from Trip 1, for which rainfall of the previous 15 days is indicated. Tripnumbersareindicatedinthetoppanel.

RepairingAustralia’sseascapes–TropWATERReportno.17/122017
Page47
FortheoverallAlligatorCreekestuary,andbasedonthemeanabundance/biomassvaluesforeachreach,we estimated a maximum abundance of 154,044 ± 1,898 SE individuals (for Trip 9) and a maximumbiomassof369.3±1.3kg(Trip8).Despitethelargenumberofreplicatestakenateachreach/time(upto30;seeFigure6),therewasveryhighvariabilityinnumericalandbiomassdensityamongreplicatesamples(Figure5).Forexample,inTrip9(08/03/16), the trip with highest downstream numerical density (see Figure 4), downstream catchesrangedfrom0to185ind.net-1(Figure5)eventhoughthedifferentreplicatesampleswerecollectedfromthe same type of habitat. This maximum density, if considered as representative of the overalldownstream edge area, would lead to an estimate of total abundance of 782,229 individuals, with abiomass of 2,011 kg for this area, showing the substantial variation in spatial distribution and theimportanceofusingaccuratevaluesfortheestimationoftotalabundanceandbiomass.
Figure5.Boxandwhiskerplotsshowingthemedian(linewithintheboxes),interquartilerange(boxes),10thand90thpercentiles(whiskers)andoutliers(x)ofnumericdensity(numberofindividualspernet;top)andbiomassdensity(weightpernet;bottom)ofF.merguiensiscollectedinAlligatorCreek(forthe2mwideedgeareaonly)overthe2015-2016wetseason,illustratingthevariabilityincatchesamongsamplingtrips(Trip1to11;seetripdatesinFigure3),estuaryreaches(D=downstream;M=mid-estuary;U=upstreamreach),andamongreplicates.

RepairingAustralia’sseascapes–TropWATERReportno.17/122017
Page48
Inthedownstreamreach,numericaldensityincreasedtowardsthepeakoftherainyseason(March2016),up to amaximumof an average27 ind.net-1 (Figure5). This led to anestimatedabundanceof 113,881individuals for the overall downstream area,weighing 250 kg. This average numerical density (per net)correspondsto41.1ind.m2forthe2mbandalongthecreekedges,butonlyto1.8ind.m-2fortheoveralldownstreamreacharea,asvery fewF.merguiensisoccur in themiddleof thecreeks (R. Johnstonpers.com.).Aswithnumericaldensity,biomassdensityalsoincreasedfromverylowaveragevalues(<5g.net-1)attheendof2015toamaximumof~80g.net-1(~337.4kgforthewholereach)inFebruary2016(Trip8;Figure 4), likely because of an increase in prawn abundance combinedwith growth of individuals. Thisaveragebiomassdensityof80g.net-1correspondstoadensityof17.8g.m-2alongthemargins,buttoonly0.8g.m-2 if considering theoveralldownstreamreacharea.This illustrates the importanceof theuseofadequatemethodological approaches and adequate results presentation/interpretation. For example, ifthecross-creekdistributionofF.merguiensis juvenileswasnotknown,replicatesampleswould likelybetaken from different distances from the edge, including in mid-creek, and average values would becalculated based on samples from all areas, leading to erroneous density, abundance and biomassestimates. This also shows the importance of creek width and edge convolution on thesenumerical/biomassdensityestimates.After thepeaks indensity,valuesdecreasedsharply (Figure4),probablybecauseofemigrationof largerjuvenilesoutoftheestuary,alikelyresponsetoheavyrainfall,aknowndriverofF.merguiensisemigrationfromestuaries(Staples&Vance1986,1987).Althoughthisemigrationresultedinadecreaseinbiomass,continuing recruitment resulted in a further increase in numerical density, beyond the date of peakbiomass density. This explains the fact that the peak of biomass density occurred before the peak innumericaldensity(Figure4).Indeed,itcanbeseeninFigure6thatinTrip8(17/02/16)twodistinguishablecohortswerepresent,butthelargest(>100mmtotallength(TL))cohortwasalmostcompletelyabsentonthe following trip (Trip 9, 08/03/16) (Figure 6), implying thatmany larger individualsmoved out of theestuarywiththerainsthatfell inthefirstpartofMarch(seeFigure4), leadingtoadecrease inbiomassdensity(Figure4).
AerialphotooftheAlligatorCreekestuary,Townsville,Queensland.Photocredit:CarlaWegscheidl/DAF

RepairingAustralia’sseascapes–TropWATERReportno.17/122017
Page49
Figure6.SizefrequencydistributionofF.merguiensiscapturedinthedownstream,mid-estuaryandupstreamreachesofAlligatorCreek,betweenDecember2015andApril2016(i.e.overthewetseason).Samplesize,inbrackets,isalsoindicatedforeachtrip,andcorrespondstothenumberofreplicatestakenfromeachofthethreereaches.

RepairingAustralia’sseascapes–TropWATERReportno.17/122017
Page50
Figure6(contd.)SizefrequencydistributionofF.merguiensiscapturedinthedownstream,mid-estuaryandupstreamreachesofAlligatorCreek,betweenDecember2015andApril2016(i.e.overthewetseason).Samplesize,inbrackets,isalsoindicatedforeachtrip,andcorrespondstothenumberofreplicatestakenfromeachofthethreereaches.

RepairingAustralia’sseascapes–TropWATERReportno.17/122017
Page51
TherewasalsoasmallerpeakofrainfallattheendofDecember2015thatagaincoincidedwithasmallpeak in F.merguiensis numerical (average 9 ind.net-1) and biomass density (average 20 g.net-1) for thedownstreamreach(Figs.4).Thisalsocoincidedwithsmalldips inthemid-estuaryreach,suggestingthatanimalsmovedfromthemid-estuarytothedownstreamreachwiththerainfall,beforesomemovingoutof the estuary andothers dispersing again through themoreupstreamareas. Indeed, it canbe seen inFigure6thatwhileinTrips2(22/12/15)andTrip4(05/01/16)prawnswerepresentinthemid-estuaryandupstreamreachesinsubstantialdensity,inTrip3(30/12/15)veryfewindividualswerecapturedinthosereaches (Figs. 4-6). This was likely due to the reduction in salinity in the more upstream parts of theestuaryduetotherainfallthatoccurredbetweenTrips2and3(seeFigure4).Notethatsalinitychangesduetorainfallarelesspronouncedatthedownstreamareasduetoeffectivetidalmixing.InTrip4,itcanalso be seen that the largest sizes (>~65mm TL) that were present in Trip 3 are no longer present inabundanceinanyofthethreereaches(Figure6),suggestingemigrationofthoselargerindividualsoutoftheestuaryaftertherains.Both numerical density and biomass density in themid-estuary were typically much lower than in thedownstreamreach,butasimilarpatternwaspresent,withbothparametersincreasingtowardsthepeakofthewetseason,anddecreasingafterthemainrains(Figure3).SourcesofnutritionStable isotope results show thatF.merguiensis juveniles relyona rangeofavailable sources (Figs.7-9).The95%credibility intervals (CI)ofmangrovecontribution included0%forallestuaries,meaning that itwasnotpossibletopositivelyidentifyacriticalcontributionofmangroves.However,mangrovescouldbeimportantcontributorsparticularlyforDoughboyandCocoaCreeks,wheretheupperlimitsofthe95%CIwere relatively high (67% and 57% respectively; Figure 8). For Deluge Inlet (Figure 7) and for themangrove-linedpoolintheRossRiverfloodplain(Figure9),mangrovecontributionwaslimited,with95%CIsofonly2-26%and0-17%respectively.
Figure7.PosteriordensitycurvesoftheproportionalsourcecontributionstoF.merguiensisjuvenilesatDelugeInlet,basedonstable-isotopebasedBayesianmixingmodel.

RepairingAustralia’sseascapes–TropWATERReportno.17/122017
Page52
Figure8.PosteriordensitycurvesoftheproportionalsourcecontributionstoF.merguiensisjuvenilesatCocoaCreek(leftpanel)andDoughboyCreek(rightpanel),basedonstable-isotopebasedBayesianmixingmodels.
Figure9.PosteriordensitycurvesoftheproportionalsourcecontributionstoF.merguiensisjuvenilesatamangrove-lined(top)andasaltmarsh-lined(bottom)floodplainpooloftheRossRiverfloodplain,Townsville,basedonstable-isotopebasedBayesianmixingmodels.Saltmarshand itsepiphyteswerealso important inthesaltmarsh-dominatedfloodplainpoolof theRossRiverestuary(15-82%;Figure9),butitsimportancewaslimitedatCocoaandDoughboyCreeks(1-42%and

RepairingAustralia’sseascapes–TropWATERReportno.17/122017
Page53
1-43% respectively; Figure 8) where saltmarsh availability is much lower. Similarly, seagrass has someimportance inDeluge Inlet (13-55%;Figure7),whereextensiveseagrassmeadowsoccur(LeeLongetal.1998), but the importance of this sourcewas limited in Cocoa Creek (2-42%; Figure 8),where seagrasscoverissparseandlimitedtothecreekmouth.3.5Discussion
Suitabilityofavailablemethodsofbiomass/production/productivityestimationSourcesofvariabilityinbiomassdensityestimatesOverall, therewashigh spatial and temporal variability inF.merguiensis juvenilenumerical density andbiomass density in the Alligator Creek estuary. The reasons for this variability are complex, but notunexpected.Evaluatingpatternsofabundanceofmobileorganismsisalwaysdifficultbecause,ratherthanafewprominentparametersdetermininghowmanyindividualsoccurinaparticularplaceataparticularpoint in time, local abundance is the resultof the interactionofawidearrayof factors,whathasbeendescribedasacausalthicket(Harris&Heathwaite2012).Causalthicketsarecharacterisedbythepresenceofmany interacting and synergistic drivers that change in their relative importance in determining thelocationandabundanceof individuals fromtimeto timeandplace toplace,and thatareoftenstronglyaliased and invariably include substantial indeterminacy (Harris & Heathwaite 2005). Some of thecomplicatingdriversareobvious,e.g.numbersandbiomassaresimultaneouslyinfluencedbyemigration,recruitment,within-systemmovementsandmortality,aswellaschangesinthephysicalenvironmentsuchasrainfall-drivensalinitydepression.Theinfluencesofthesefactorsareclearinthepresentcasestudy.Forinstance, simultaneous growth and emigration of individuals already in the population, coincidentwithrecruitmentofnewindividualsresultedinchangesinbiomassdensityapparentlydecoupledfromchangesinnumericdensitypernet.Otherdriversarelikelytobeimportantoverlongertimescales.Forinstance,this studywas conducted during an El Niño event, duringwhich rainfall in North Queenslandwaswellbelowaverage(BureauofMeteorology,www.bom.gov.au,accessed09/02/17),soresultspresentedhereareunlikelytoberepresentativeofthoseunderdifferentclimatephases.Indeed,thestructureofnektonassemblagesinnortheasternAustralianestuaries(Sheavesetal.2007b)andthesourcesofnutritionthatsupport them (Abrantes & Sheaves 2010) are fundamentally different during extended wet versusextendeddryperiods.Substantial variations in F. merguiensis distribution and abundance have been reported by severalpreviousstudies.Althoughjuvenilesareknowntomostlyoccuralongmangrove-linedbanks(Vanceetal.1990,Kenyonetal.2004), thereareconsiderablevariations indensitybothamongandwithinestuaries(Sheaves et al. 2012b). For example,within a system, densities in smaller creeks are often higher thanthoseinthemainriver(Vanceetal.1998,Vanceetal.2002,Kenyonetal.2004).Depth,bankslopeandtheproximitytomangrovesarealsoimportantfactorsaffectingdensities(Vanceetal.1990,Vanceetal.2002).Moreover, juvenilescanmoveupto200mintomangroveforestsathightide(Vanceetal.1996,Rönnbäck et al. 1999, Vance et al. 2002) and use the adjacent banks during the low-tide periodswhenwatersaremostlyoutsideoftheforests(Robertson1988;Vanceetal.1996,2002),meaningthatdensitiesvarythroughthetidalcycles.Despitetheirwillingnesstomoveintomangroves,athightides,densitiesofF.merguiensishavebeenfoundtobehigheratcreekedgesthanintheinsideofmangroveforests(Meageret al. 2003) and there are also spatial variations in density within the mangrove forest, at differentdistancesfromthemangroveedge(Vanceetal.2002).EvaluatingtheimportanceofparticularhabitattypestoprawnnutritionThere is noevidence thatmangroves, saltmarshorotherparticularwetlandhabitat types areof criticaltrophicimportancetoF.merguiensisjuveniles.ThestableisotopeanalysisinthecurrentstudyunderlinesthatF.merguiensis juveniles canusea rangeofprimaryproducersas sourcesofnutrition, and that theimportanceofthedifferentsourcesdependsontherelativeavailability,aspreviouslyreportedforotherestuarine species (e.g.Bouillonet al. 2004,Abranteset al. 2013). Indeed, the importanceofmangrove-derived carbon for F. merguiensis has been found to depend on the extent of mangrove forest in the
RepairingAustralia’sseascapes–TropWATERReportno.17/122017
Page54
estuaries, and this importance is significant only in systems where more productive habitats such asseagrass beds are not present (Abrantes et al. 2015). In systems with seagrass beds, even if extensivemangroveforestsarepresent,theimportanceofmangrovecarbonislimitedandF.merguiensisjuvenilestypically relymostly on a range of aquatic sources (Loneragan et al. 1997, Abrantes & Sheaves 2009a,Abrantesetal.2015).ThelackofevidencethatanyparticularhabitattypeiscriticallyimportanttothenutritionofF.merguiensisjuvenilesmeans that the value of the habitats used (e.g.mangroves) ismost likely primarily related tophysicalconditions,ratherthantoatrophicfunction.Thesephysicalconditionscouldbeafunctionofthepresence of mangroves themselves and/or to the provisioning of vast intertidal banks and/or shallowwaterhabitat,factorsthathavebeenreportedasimportantpredictorsofF.merguiensiscatchesinNorthQueenslandestuaries(Sheavesetal.2012b).Thelackofaspecifictrophicrelationshipbetweenparticularwetland habitat types and F. merguiensis juveniles adds weight to the argument that productivityoutcomes for F.merguiensis are likely to bemost usefully and validly assessed at thewhole-of-estuaryscale,andthatitwillrarelybepossibletolinkbiomasstospecificwetlandunitsEvaluatingthevalueandvalidityofproductivityestimatesatdifferentscalesIt is clear thatquantifyingnumerical density, populationnumbers, biomassdensity and total biomass iscomplex, even if an adequate sampling design is combined with fine-scale mapping. Consequently,although themethodological approachusedherewasuseful to identify importanthabitatusepatterns,thehigh variability among replicate samplesand the logical issues involvedmean that formost tropicalestuary situations it will be impossible to obtain numerical or biomass density estimates with lowvariabilityandforwhichtheparticularregulatingfactorsareunambiguouslyknown.The potential for mobile fauna such as F. merguiensis to move longitudinally in an estuary over shortperiods of time creates an important additional problem if the aim is to link increase in biomass toparticularareasoftheestuaryortoparticularhabitatunits.Sincebiomassdensityestimatesareacriticalto calculate productivity, and a detailed understanding of movement is necessary to allow thatproductivity to be attributed to specific habitats, there are likely to be very few cases where biomassincreaseorproductivitycanbereliablyattributedatthewithin-estuaryscale. It ishowever importanttonote thatmany of the sources of indeterminate variability are related to among-habitatwithin-estuaryscales.Thisimpliesthatcarefullycollecteddatathatcoverthewholeestuaryarelikelytoprovideameansforunderstanding,addressingand integratingvariability, for instancedue tomovementamong reaches.Thus, it is possible that in many cases estimates of whole-of-estuary productivity i.e., estimates thatintegrateacrossthewholeestuaryareachievable.A diversity of factors need to be taken into account when estimating biomass and production forF.merguiensis’ estuarine populations, in evaluating the contribution of particular tidal wetlands tobiomass production, and ultimately in linking particular habitat units to the productivity of offshorefisheriesstocks(Figure10).Firstly,adetailedsamplingoftheavailablehabitatsatdifferenttemporalandspatial scales is critical, but this is logistically difficult and time consuming. Indeed, penaeid densities(Minello 1999, Shervette & Gelwick 2008), biomass and production (Minello et al. 2008) vary amonghabitatsanddependonarangeoffactorssuchasfloodingpatterns(duration,frequencyanddepth),theassemblage of habitats, habitat fragmentation (which influences amount ofmarsh/water edge), overallarrangementofhabitatsinthecoastalseascape,salinityandtemperature(Rozas&Minello1999,Minelloetal.2003,Minelloetal.2008,Rothetal.2008,Bakeretal.2015).Therefore,notonlymusttheareaofthe different habitats be adequately measured, but the access to these habitats also needs to beconsidered, and this is influenced by topography, hydrology, and connectivity between the differenthabitats(Zimmermanetal.2002).Differentscalesofhabitatshouldalsobetakenintoaccount(e.g.edgevs.differentdistancesfromtheedge).Allthesefactorscanaffecthabitatavailabilityandhabitatuseandvalue,andneedtobeconsideredinbiomassandproductionestimationmodels.

RepairingAustralia’sseascapes–TropWATERReportno.17/122017
Page55
Figure10:Thecomplexityofestimating(a)productionandvalueforonehabitat,(b)productionforonesystem(estuary),(c)fisheriesvalueofonesystem(measuredascontributiontooffshorefisheriesstock),and(d)indicativecost-benefitfunctionmodelshowingcurvesforchangesincertaintyofmeaningfulinterpretation,cumulativeerrorofestimatesandcumulativedifficultyofcollectingvaliddata,versusthelikelihoodofavalidestimate.Theapproximatepotentialrangeofestimates(a),(b)and(c)areindicatedbelowthefigure.Note:Thecurvesareillustrativeonlyandnotintendedtorepresentspecificfunctions.Theyarebasedonthelogicthat(i)thecertaintyofmeaningfulinterpretationislikelytobeapproximatelysigmoidalinshapeandtodecrease,while(ii)thecumulativeerroranddifficultyofcollectingvaliddataarebothlikelycontinuallyincrease,asthenumberandcomplexityofparameterstobeestimatedincreases.
a) Estimatingproductionfromandvalueofonehabitat
EstimateofPopulationAbundance
EstimateofStanding
StockBiomass
EstimateofBiomass
Production
(iii)speciessizefrequency
(iv)size-weightrelationships
(i)extentofhabitat
(ii)replicateestimatesofwithin-habitatdensity
(v)growth,mortality,recruitment&emigrationrates
(vi)proportionoftimespendinhabitat
integrationovertime
EstimateofValue
oftheHabitat
(vii)proportionofnutritionderivedfrom
thehabitat
(viii)growthadvantageduetorefugevalueof
habitat
b)Estimatingproductionfromonesystem
StandingStock
BiomassofeachReach
Estimateoftime-specificStandingStockBiomassof System
EstimateofSystemBiomass
Production
(x)arealextentofeachreach
(ix)standingstockbiomassofeach
habitatintegration
Integrationovertime
c) Estimatingfisheriesvalueofonesystem(i.e.tooffshorefisheriesstock)
SystemcontributiontoFisheriesBiomass
(xiii)mortalityduring
emigrationtooffshore
fishingarea
(xii)proportionofstockcontributed
bysystem
(xi)SystemBiomass
Production
EstimatingFisheriesValueofOneSystem
EstimatingProductionfromOneSystem
EstimatingProductionfromandValueofOne
Habitat
d) Cost-benefitfunction
Decreasinglikelihoodofavalidestimate→
Increasin
gcertainty/error/difficulty→
Increasingnumberandcomplexityofparameterstobeestimated→

RepairingAustralia’sseascapes–TropWATERReportno.17/122017
Page56
Growth rates and natural mortality rates are other key parameters needed to estimate penaeidproduction. Growth rates can be estimated usingmethods such asmark-recapture (e.g. Knudsen et al.1996,Webb& Kneib 2004, Braccini et al. 2013), length-frequency analysis andmodal progression (e.g.Staples1980b,Haywood&Staples1993,Watsonetal.1993),aswellasmesocosm(e.g.Rozas&Minello2009, 2011) and caging experiments (e.g. Shervette & Gelwick 2008, Baker &Minello 2010).Mortalityestimatescanalsobederivedusingmark-recapturestudies(e.g.Knudsenetal.1996,Montgomeryetal.2012,MaceIII&Rozas2015)orcatch-curveorcohortprogressionanalyses(Wang&Haywood1999,Baker&Minello2010,MaceIII&Rozas2015).
Thesebiologicalparametersaredifficulttoestimateforjuvenilesincoastalwetlands.Forexample,cohortanalysis isdifficult toapplydue to longperiodsof continuous recruitmentandwhen therearemultiplewaves of recruitment and/or immigration (Staples 1980a, Haywood & Staples 1993, Baker & Minello2010).Also,penaeidjuvenilesonlyuseestuarinenurseriesforrelativelyshortperiodsoftime,andtypicallyusedifferentpartsoftheestuaryastheygrow,sodifferentsizedjuvenilesoccurindifferentareas(Vanceetal.1998,Vanceetal.2002,Kenyonetal.2004)makingitdifficulttofollowcohortsortorelateincreaseinbiomass tonutritionderived fromparticularhabitatunits.Tag-recapturemethodsarealsodifficult touseduetothesmallsizeofprawnjuveniles,andbecauseoftheirhighabundancesandveryhighnaturalmortalityrates.Moreover,penaeidfecundity(Crocos&VanderVelde1995)andrecruitment(Garcia1985,Vanceetal.1985,Vanceetal.1998,Zhouetal.2009)oftenvaryseasonallyandamongyears;growthratescanvarywithtemperature(Staples1980a),salinityandfoodavailability(Rozas&Minello2011); juveniledensities not only vary seasonally but also through day-night and tidal cycles (Vance & Staples 1992,Griffiths1999),andmortalityratesvarywithpenaeidsizesandamongyears,habitattypeandcomplexity,andwith predator density (Minello et al. 1989,Macia et al. 2003). It is therefore clear that significantresearch is needed beforewe can accurately estimateF.merguiensis production for NorthQueenslandestuaries,beforewecanvalidlyattributeaneconomicvaluetothedifferentjuvenilehabitats,andbeforewecanestimatethelikelybenefitsfromhabitatpreservationorrepair.
Alltheseandarangeofotherconsiderationsmakeestimatingproductionandvalueacomplexissue.UsingourF.merguiensisexample,wecouldconsiderthreedifferenttypesorstagesofestimates(Figure10):(i)estimatesofproductionandvalueof justoneestuarinehabitat (Figure10a), (ii)estimatesofproductionfromone(estuarine)system(Figure10b),and(iii)estimatesoffisheriesvaluesofonesystemtothefishery(i.e. the offshore stock) (Figure 10c). Each of these is dependent on having a range of data and on thequalityandvalidityofthosedata.Estimatingproductionfromasinglehabitatrequiresadiversityofdata(Figure10a).Muchofit isdifficulttocollectbutpotentiallyestimable(e.g.extentofhabitat,speciessizefrequency).Othernecessarydata(e.g.growth,mortality,recruitmentandemigrationrates,proportionoftimespentinahabitat,etc.)isprobablybeyondourcurrentabilitiesandsome(e.g.thegrowthadvantageduetorefugeinahabitat)arevirtuallyimpossibletocollectwithanyavailabletechnology.Moreover,eachof the estimates needed to calculate production is associated to a certain level of uncertainty (error),whichisoftensubstantial(noteforinstancethesubstantialvariabilityinthedensityestimates(Figure4)),eachaddingtotheuncertaintyofthecombinedestimate.Thecomplexityanduncertaintymeanthatboththecumulativedifficultyincollectingvaliddataandthecumulativeerroroftheestimatesishigh,leadingtoalowlikelihoodofavalidestimateandlowcertaintyofmeaningfulinterpretation(Figure10d).
Estimating the production from one whole system (Figure 10b) is likely to involve a lower level ofuncertainty (assuming that prawns remain within the overall estuary for their juvenile phase) becausesome of the more problematic estimates (e.g. proportion of time spent in each habitat, the growthadvantageduetorefugevalue)arenotrequired,andtheadditionalestimates(extentofeachreach)willusuallybeviabletoestimate.Consequently,thecertaintyofmeaningfulinterpretationandlikelihoodofavalidestimateare likely tobehigher than forestimatesof thevalueof individualhabitats (Figure10d).However,whileestimatingtheproductionfromawholesystemislikelytobemorefeasiblethanassessingproductionforindividualhabitats,suchestimatesaresensitivelydependentonthequalityofdataandonthe assumptions underpinning the various estimates. Consequently, both these provisos need to be

RepairingAustralia’sseascapes–TropWATERReportno.17/122017
Page57
exhaustivelyassessedandthevalueandreliabilityofestimatescriticallyappraisedbeforeanyquantitativeusecouldbemadeofthem.
The final stage of estimates is to evaluate the contribution of prawns fromone system to the fisheriesstock(forF.merguiensisthiswouldbeintheoffshoreadultpopulation)(Figure10c).Thisisapotentiallyusefulestimatebecauseitallowstheattributionofadollarvaluetoaparticularsystem.However,theseestimates require the calculation of some problematic values. For instance, juveniles from severalestuaries usually contribute to the same offshore fishery.Moreover, recruitment can vary greatly evenamongadjacentestuarinesystemsduetothehydrologicalpatternandthespatialarrangementofhabitatswithin systems, and systemswithin the area (Staples 1979, Staples&Vance 1987, Kenyon et al. 2004),meaningthatdifferentestuarieswill likelycontributedifferentlytotheoffshorefishery.Withinthesamesystem,differentcohortscanalsocontributedifferentlytotheoffshorefishery,andthiscanvaryamongyears(Haywood&Staples1993).Moreover,thesamespeciescanhavedifferencesinrecruitmentpatternsindifferent fisheries, andcanenter the fisheriesatdifferentagesandgrowthphasesdependingon thesystem(Watsonetal.1996).Asaresult,itisvitaltoknowtheproportionofthestockcontributedbyeachsystem. Some biochemical techniques (e.g. stable isotope analysis) have potential to assist with thisquestion but these are only usefulwhere there aremeasurable differences in biochemical compositionamong the potential source estuaries. Even more difficult to estimate is the loss of individuals (andthereforebiomass) duringmigration to the adult grounds andprior to sampling/fishing. The substantialdifficulty of estimating these parameters probably makes the likelihood of a valid estimate at least asunlikelyasobtainingavalidestimateforasinglehabitat(Figure10d).
Added to thedifficulties associatedwith valid data collection andparameter estimation, are the criticallimitsplacedonestimationbythepresenceofpervasivecomplexitythatputslimitsonwhatispossibletopredict (Harris&Heathwaite 2005). For instance, it is nowunderstood that cause and effect are rarelylinearly related but rather under the influence of causal thickets (Harris & Heathwaite 2012) andextensivelyaliased (Harris&Heathwaite2005).Additionally, even inwell-studied systems theremaybepervasiveirreducibleuncertainty(Lo&Mueller2010).Thus,itislikelythatinmanycasedetailedlevelsofestimationwillbeunachievable.In conclusion, even for a well-studied species such as F. merguiensis there is still a deficit in theinformation needed tomake a precise species-productivity link, and substantial research is still neededbeforetheavailablebroad-scalebiomassestimatescanbeconvertedtovalidestimatesof totalbiomassand production, and before these can usefully be related to particular habitats. Being able to estimateproductivity and attribute it sensitively to particular units (awetlandor an estuary) is a very importantaspirationalgoal.However,withcurrenttechnologies,andtechnologieslikelytocomeonlineintheshorttomediumterm,formostsituationsitisprobablyunattainableatanacceptablelevelofcertainty.

RepairingAustralia’sseascapes–TropWATERReportno.17/122017
Page58
3.6References
AbrantesK,SheavesM(2009a)Foodwebstructureinanear-pristinemangroveareaoftheAustralianWetTropics.EstuarCoastShelfSci82:597–607
AbrantesK,SheavesM(2009b)Sourcesofnutritionsupporting juvenilepenaeidprawns inanAustraliandrytropicsestuary.MarFreshwatRes60:949-959
AbrantesK,SheavesM(2010)Importanceoffreshwaterflowinterrestrial-aquaticenergeticconectivityinintermittentlyconnectedestuariesoftropicalAustralia.MarineBiology157:2071-2086
Abrantes KG, Barnett A,Marwick TR, Bouillon S (2013) Importance of terrestrial subsidies for estuarinefoodwebsincontrastingeastAfricancatchments.Ecosphere4:Art14
AbrantesKG,JohnstonR,ConnollyRM,SheavesM(2015)Importanceofmangrovecarbonforaquaticfoodwebsinwet–drytropicalestuaries.EstuariesandCoasts38:383-399
BakerR,MinelloTJ(2010)GrowthandmortalityofjuvenilewhiteshrimpLitopenaeussetiferusinamarshpond.MarEcolProgSer413:95-104
Baker R, SheavesM, Johnston R (2015) Geographic variation inmangrove flooding and accessibility forfishesandnektoniccrustaceans.Hydrobiologia762:1-14
BarbierEB(2007)Valuingecosystemservicesasproductiveinputs.EconomicPolicy22:178-229Bouillon S,Moens T,Overmeer I, KoedamN,Dehairs F (2004) Resource utilization patterns of epifauna
frommangroveforestswithcontrastinginputsof localversusimportedorganicmatter.MarEcolProgSer278:77–88
BracciniJM,TroynikovVS,CourtneyAJ,DieDJ,ProsserA,MontgomerySS(2013)Stochasticgrowthoftheeasternkingprawn(Melicertusplebejus(HESS,1865))harvestedoffeasternAustralia.Crustaceana86:651-660
ChapmanD(1978)Productioninfishpopulations.In:GerkingS(ed)Ecologyoffreshwaterfishproduction.Whiley,NewYork
ChongVC,SasekumarA(1981)FoodandfeedinghabitsofthewhiteprawnPenaeusmerguiensis.MarEcolProgSer5:185-191
CrocosP,VanderVeldeT(1995)Seasonal,spatialandinterannualvariabilityinthereproductivedynamicsofthegroovedtigerprawnPenaeussemisulcatus inAlbatrossBay,GulfofCarpentaria,Australia:theconceptofeffectivespawning.MarBiol122:557-570
DeNiroMJ,EpsteinS (1978) Influenceofdiet in thedistributionofcarbon isotopes inanimals.GeochimCosmochimActa42:495–506
DeNiroMJ,EpsteinS(1981)Influenceofdietonthedistributionofnitrogenisotopesinanimals.GeochimCosmochimActa45:341–351
Diop H, Keithly WR, Kazmierczak RF, Shaw RF (2007) Predicting the abundance of white shrimp(Litopenaeussetiferus)fromenvironmentalparametersandpreviouslifestages.FishRes86:31-41
FranceRL (1995)Carbon-13enrichment inbenthiccompared toplanktonicalgae: foodweb implications.MarEcolProgSer124:307-312
FranceRL(1996)Scopeforuseofstablecarbonisotopesindiscerningtheincorporationofforestdetritusintoaquaticfoodwebs.Hydrobiologia325:219–222
GarciaS (1985)Reproduction,stockassessmentmodelsandpopulationparameters inexploitedpenaeidshrimppopulation.
GriffithsSP(1999)EffectsoflunarperiodicityoncatchesofPenaeusplebejus(Hess)inanAustraliancoastallagoon.FishRes42:195-199
HarrisG,HeathwaiteAL(2005)Inadmissibleevidence:knowledgeandpredictioninlandandriverscapes.JournalofHydrology304:3-19
Harris GP, Heathwaite A (2012) Why is achieving good ecological outcomes in rivers so difficult?FreshwaterBiology57:91-107
Haywood MDE, Staples DJ (1993) Field estimates of growth and mortality of juvenile banana prawns(Penaeusmerguiensis).MarBiol116:407-416
JohnstonR,SheavesM(2007)Small fishandcrustaceansdemonstrateapreference forparticularsmall-scalehabitatswhenmangroveforestsarenotaccessible.JournalofExperimentalMarineBiologyandEcology353:164-179

RepairingAustralia’sseascapes–TropWATERReportno.17/122017
Page59
Kenyon R, Loneragan N,Manson F, Vance D, VenablesW (2004) Allopatric distribution of juvenile red-legged banana prawns (Penaeus indicus H. Milne Edwards, 1837) and juvenile white bananaprawns (Penaeus merguiensis De Man, 1888), and inferred extensive migration, in the JosephBonaparteGulf,northwestAustralia.JExpMarBiolEcol309:79-108
KnudsenEE,RogersBD,PailleRF,HerkeWH,GeaghanJP(1996)Juvenilewhiteshrimpgrowth,mortality,and emigration in weired and unweired Louisiana marsh ponds. North American Journal ofFisheriesManagement16:640-652
LeeLongW,McKenzieL,RoelofsA,MakeyL,ColesRG,RoderCA(1998)BaselinesurveyofHinchinbrookregionseagrasses-October(Spring)1996.ResearchPublicationNo.51.GreatBarrerReefMarineParkAuthority,Townsville.
Lo A, Mueller M (2010)WARNING: Physics envy may be hazardous to your wealth! Available at SSRN1563882
LoneraganNR,BunnSE,KellawayDM(1997)AremangrovesandseagrassessourcesoforganiccarbonforpenaeidprawnsinatropicalAustralianestuary?Amultiplestable-isotopestudy.MarBiol130:289-300
Mace III MM, Rozas LP (2015) Estimating natural mortality rates of juvenile white shrimp Litopenaeussetiferus.EstuariesandCoasts38:1580-1592
Macia A, Abrantes KGS, Paula J (2003) Thorn fish Terapon jarbua (Forskål) predation on juvenilewhiteshrimpPenaeusindicusH.MilneEdwardsandbrownshrimpMetapenaeusmonoceros(Fabricius):the effect of turbidity, prey density, substrate type andpneumatophore density. J ExpMarBiolEcol291:29-56
Manson F, LoneraganN,Harch B, SkilleterG,Williams L (2005) A broad-scale analysis of links betweencoastalfisheriesproductionandmangroveextent:acase-studyfornortheasternAustralia.FishRes74:69-85
McArthurLC,BolandJW(2006)TheeconomiccontributionofseagrasstosecondaryproductioninSouthAustralia.Ecologicalmodelling196:163-172
McCutchan JH, Lewis JrWM, Kendall C,McGrath CC (2003) Variation in trophic shift for stable isotoperatiosofcarbon,nitrogenandsulfur.Oikos102:378-390
Meager J, Vance D, Williamson I, Loneragan N (2003) Microhabitat distribution of juvenile Penaeusmerguiensis de Man and other epibenthic crustaceans within a mangrove forest in subtropicalAustralia.JExpMarBiolEcol294:127-144
Minello TJ (1999) Nekton densities in shallow estuarine habitats of Texas and Louisiana and theidentificationofessentialfishhabitat.AmericanFisheriesSocietySymposium22:43–75
Minello TJ, Able KW, Weinstein MP, Hays CG (2003) Salt marshes as nurseries for nekton: testinghypothesesondensity,growthandsurvivalthroughmeta-analysis.MarEcolProgSer246:39-59
MinelloTJ,MatthewsGA,CaldwellPA,RozasLP(2008)PopulationandproductionestimatesfordecapodcrustaceansinwetlandsofGalvestonBay,Texas.TransAmFishSoc137:129-146
MinelloTJ,RozasLP,CaldwellPA,LieseC(2012)Acomparisonofsaltmarshconstructioncostswiththevalueofexportedshrimpproduction.Wetlands32:791-799
Minello TJ, Zimmerman RJ, Martinez EX (1989) Mortality of young brown shrimp Penaeus aztecus inestuarinenurseries.TransAmFishSoc118:693-708
MontgomeryS,BarchiaI,WalshC(2012)EstimatingratesofmortalityinstocksofMetapenaeusmacleayiinestuariesofeasternAustralia.FishRes113:55-67
ParnellAC, IngerR,BearhopS, JacksonAL (2010)SourcePartitioningUsingStable Isotopes:CopingwithTooMuchVariation.PlosOne5:e9672
ParnellAC,PhillipsDL,BearhopS,SemmensBX,WardEJ,MooreJW,JacksonAL,GreyJ,KellyDJ,IngerR(2013)Bayesianstableisotopemixingmodels.Environmetrics24:387-399
RDevelopmentCoreTeam(2013)R:ALanguageandEnvironmentforStatisticalComputing.RFoundationforStatisticalComputing,Vienna,Austria.
RobertsonAI(1988)Abundance,dietandpredatorsofjuvenilebananaprawns,Penaeusmerguiensis,inatropicalmangroveestuary.AustJMarFreshwatRes39:467-478

RepairingAustralia’sseascapes–TropWATERReportno.17/122017
Page60
Robins JB, Halliday IA, Staunton-Smith J, Mayer DG, Sellin MJ (2005) Freshwater-flow requirements ofestuarine fisheries in tropicalAustralia: a reviewof the stateof knowledge and applicationof asuggestedapproach.MarFreshwatRes56:343–360
Rönnbäck P, Troell M, Kautsky N, Primavera JH (1999) Distribution pattern of shrimp and fish amongAvicenniaandRhizophoramicrohabitatsinthePagbilaomangroves,Philippines.EstuarCoastShelfSci48:223-234
RothB,RoseK,RozasL,MinelloT (2008)Relative influenceofhabitat fragmentationand inundationonbrownshrimpFarfantepenaeusaztecusproduction innorthernGulfofMexicosaltmarshes.MarEcolProgSer359:185-202
RozasLP,MinelloTJ(1999)Effectsofstructuralmarshmanagementonfisheryspeciesandothernektonbeforeandduringaspringdrawdown.WetlandsEcologyandManagement7:121-139
Rozas LP,Minello TJ (2009)Usingnekton growthas ametric for assessinghabitat restorationbymarshterracing.MarEcolProgSer394:179-193
RozasLP,MinelloTJ(2011)Variationinpenaeidshrimpgrowthratesalonganestuarinesalinitygradient:implicationsformanagingriverdiversions.JExpMarBiolEcol397:196-207
SheavesM,AbrantesK, JohnstonR (2007a)Nurserygroundvalueofanendangeredwetland to juvenileshrimps.WetlandsEcologyandManagement15:311-327
Sheaves M, Abrantes KG (2017) Developing achievable measures of fisheries values for northernAustralia’scoastalwetlandsandestuaries.NESPMarineBiodiversityHubReport,Australia.
Sheaves M, Brookes J, Coles R, Freckelton M, Groves P, Johnston R, Winberg P (2014) Repair andrevitalisationofAustralia׳stropicalestuariesandcoastalwetlands:Opportunitiesandconstraintsforthereinstatementoflostfunctionandproductivity.MarinePolicy47:23-38
Sheaves M, Johnston R, Connolly R, Baker R (2012a) Importance of Estuarine Mangroves to JuvenileBananaPrawns.Esuarine,CoastalandShelfScience114:208-219
SheavesM, Johnston R, Connolly RM, Baker R (2012b) Importance of estuarine mangroves to juvenilebananaprawns.EstuarCoastShelfSci114:208-219
SheavesM,JohnstonR,MolonyB,ShepardG(2007b)Theeffectof impoundmentsonthestructureandfunctionoffishfaunainahighlyregulateddrytropicsestuary.EstuariesandCoasts30:507-517
Shervette VR, Gelwick F (2008) Relative nursery function of oyster, vegetated marsh edge, andnonvegetatedbottomhabitatsforjuvenilewhiteshrimpLitopenaeussetiferus.WetlandsEcologyandManagement16:405-419
Staples DJ (1979) Seasonal migration patterns of postlarval and juvenile banana prawns PenaeusmerguiensisdeMan,inthemajorriversoftheGulfofCarpentaria,Australia.AustJMarFreshwatRes30:143-157
StaplesDJ(1980a)Ecologyofjuvenileandadolescentbananaprawns,Penaeusmerguiensis,inamangroveestuaryandadjacentoff-shoreareaoftheGulfofCarpentaria.1. Immigrationandsettlementofpostlarvae.AustJMarFreshwatRes31:635-652
StaplesDJ(1980b)Ecologyofjuvenileandadolescentbananaprawns,Penaeusmerguiensis,inamangroveestuaryandadjacentoff-shoreareaoftheGulfofCarpentaria.2.Emigration,populationstructureandgrowthofjuveniles.AustJMarFreshwatRes31:653-665
StaplesDJ,VanceDJ(1986)EmigrationofjuvenilebananaprawnsPenaeusmerguiensisfromamangroveestuary and recruitment to offshore areas in the wet-dry tropics of the Gulf of Carpentaria,Australia.MarEcolProgSer27:239-252
StaplesDJ,VanceDJ (1987)Comparativerecruitmentof thebananaprawn,Penaeusmerguiensis, in fiveestuariesofthesouth-easternGulfofCarpentaria,Australia.AustJMarFreshwatRes38:29-45
VanceD, StaplesD (1992) Catchability and sampling of three species of juvenile penaeid prawns in theEmbleyRiver,GulfofCarpentaria,Australia.MarineEcology-ProgressSeries87:201-201
VanceD, StaplesD,Kerr J (1985) Factors affecting year-to-year variation in the catchofbananaprawns(Penaeusmerguiensis)intheGulfofCarpentaria,Australia.JournalduConseil42:83-97
VanceDJ,HaywoodMDE,HealesDS,KenyonRA, LoneraganNR (1998)Seasonalandannualvariation inabundance of postlarval and juvenile banana prawns Penaeus merguiensis and environmentalvariation in twoestuaries in tropical northeasternAustralia: a six year study.Mar Ecol Prog Ser163:21-36
RepairingAustralia’sseascapes–TropWATERReportno.17/122017
Page61
VanceDJ,HaywoodMDE,HealesDS,KenyonRA,LoneraganNR,PendreyRC(1996)Howfardoprawnsandfishmoveintomangroves?DistributionofjuvenilebananaprawnsPenaeusmerguiensisandfishinatropicalmangroveforestinnorthernAustralia.MarEcolProgSer131:115-124
VanceDJ,HaywoodMDE,HealesDS,KenyonRA,LoneraganNR,PendreyRC(2002)Distributionofjuvenilepenaeidprawns inmangroveforests inatropicalAustralianestuary,withparticularreferencetoPenaeusmerguiensis.MarEcolProgSer228:165-177
VanceDJ,HaywoodMDE,StaplesDJ(1990)Useofamangroveestuaryasanurseryareabypostlarvalandjuvenilebananaprawns,PenaeusmerguiensisdeMann, innorthernAustralia.EstuarCoastShelfSci31:689-701
Wang Y-G, HaywoodMDE (1999) Size-dependent natural mortality of juvenile banana prawns PenaeusmerguiensisintheGulfofCarpentaria,Australia.MarFreshwatRes50:313-317
WatsonR,TurnbullC,DerbyshireK(1996)Identifyingtropicalpenaeidrecruitmentpatterns.MarFreshwatRes47:77-85
Watson RA, Coles RG, Long WJL (1993) Simulation estimates of annual yield and landed value forcommercialpenaeidprawnsfromatropicalseagrasshabitat,NorthernQueensland,Australia.AustJMarFreshwatRes44:211-219
Webb S, Kneib RT (2004) Individual growth rates andmovement of juvenilewhite shrimp (Litopenaeussetiferus)inatidalmarshnursery.FisheryBulletin102:376-388
Zhou S, Punt AE, Deng R, Dichmont CM, Ye Y, Bishop J (2009)Modified hierarchical Bayesian biomassdynamics models for assessment of short-lived invertebrates: a comparison for tropical tigerprawns.MarFreshwatRes60:1298-1308
ZimmermanRJ,MinelloTJ,RozasLP(2002)SaltmarshlinkagestoproductivityofpenaeidshrimpsandbluecrabsinthenorthernGulfofMexico.ConceptsandControversiesinTidalMarshEcology.Springer

RepairingAustralia’sseascapes–TropWATERReportno.17/122017
Page62
CHAPTER 4 - UTILISATION OF A RESTORED WETLAND BY ACOMMERCIALLYIMPORTANTSPECIESOFPENAEIDSHRIMPCraigHart1,TroyF.Gaston2,MatthewD.Taylor1,2,*
1SchoolofEnvironmentalandLifeSciences,UniversityofNewcastle,NewSouthWales,Australia
2PortStephensFisheriesInstitute,NewSouthWalesDepartmentofPrimaryIndustries,TaylorsBeachRd,TaylorsBeach,NewSouthWales,Australia*Correspondingauthor:[email protected];Ph+61249163937
4.1Abstract
Penaeid shrimp represent an important group of valuable exploited species that are known to eitherdirectly utilise saltmarsh habitats, or utilise saltmarsh-derived productivity. Consequently, both arealcoverage and primary productivity of saltmarsh habitat has direct consequences for the productivity oftheseimportantfisheries,andtheyarelikelytobekeybeneficiariesofhabitatrepair.Thisstudyaimedtoestablish quantitative estimates of abundance of School Prawn, Metapenaeus macleayi, across arecoveringwetlandsystem;Hexhamwetland intheHunterRiver.Sixsurveyswereconductedacrossthewetlandusingaspecializedbenthicsled,andabsoluteabundanceofSchoolPrawnwasestimated.SchoolPrawn were consistently more abundant in certain areas of the wetland (the highest abundance sitesupported1,017prawnsper100m2),andtheaveragedensityacrossthewetlandwas244prawnsper100m2.Allareasofthewetland(excepttheareaclosesttothewetlandmouth)supportedthefullrangeofsizeclasses, and multiple cohorts of prawns moved through the system during the sampling program. Theasymmetry observed in the distribution of prawns across thewetland is likely due to a combination ofwaterqualityandinter-specificinteractions.Theseresultsshowthattherecoveringwetlandissupportinga high abundance of School Prawn, and our estimates of recruitment for the species will be useful ingaugingthepotentialfisheriesproductivitybenefitsofhabitatrepair.
Researchvesseltravellingthroughamarshchannelonthehunterriverestuary.PhotoCredit:MattTaylor

RepairingAustralia’sseascapes–TropWATERReportno.17/122017
Page63
4.2Introduction
Estuariescontainamosaicofdifferenthabitats,andareproductiveenvironmentsthatprovidefoodandshelter foradiverseassemblageof fishes (Becketal.2001).Manyspeciesrelyonestuarinehabitats forsomeoralloftheirlifecycle,andthisassociationmaybeeitheropportunisticordependent(Elliottetal.2007). In most estuarine systems, this includes a number of commercially and recreationally exploitedspecies,which are either harvesteddirectly from these habitats as adults or reside in these habitats asjuveniles and are harvested elsewhere (Taylor et al. 2017a). As such, these estuarine habitats provideimportant ecosystem services with tangible economic outcomes obtained through recreational andcommercialfisheriesforbothfishandcrustaceans(LenantonandPotter1987).Saltmarshhabitats includeadiversityorproducersthatsupportconsiderable levelsofestuarineprimaryproduction (e.g. Groenendijk 1984). These habitats can also fulfil a dual role of providing food (e.g.Paterson and Whitfield 1997) and refuge (e.g. Paterson and Whitfield 2000) for juvenile fishes, directforaginghabitatsforpredators(RozasandOdum1988),andsupportingadiverserangeofconsumersthatcanlinkprimaryproducerswithhighertrophiclevels(e.g.BeckerandTaylor2017;Mazumderetal.2011).Penaeidshrimprepresentanimportantgroupofexploitedspeciesthatareknowntoeitherdirectlyutilisesaltmarsh habitats (e.g. Fry 2008), or utilise saltmarsh-derived productivity (Taylor et al. in review). Insomesystems,fisheryproductivityofthesespeciesisinextricablylinkedtosaltmarshhabitats(e.g.GulfofMexico,Zimmermanetal.2000).Consequently,botharealcoverageandprimaryproductivityofsaltmarshhabitathasdirectconsequencesfortheproductivityoftheseimportantfisheries.Cumulative anthropogenic impacts have adversely affected the diversity and productivity of estuarinesystems (Lotze et al. 2006). Much of this damage has occurred through the loss of saltmarsh, or thealteration of wetland ecosystem function. Saltmarsh loss can be attributed to various factors whichincludes the disruption of natural depositional processes through activities such as dredging and floodmitigation (Turner 1997). Loss of saltmarsh ecosystem function can occur through disruption of tidalconnectivityandassociateddrainageofwetlandstosupportotherlanduses(suchasgrazing,Rogersetal.2015). Not surprisingly, recent case studies have implicated the historic loss of these habitats in thedeclining productivity of inshore fisheries, including penaeid fisheries (e.g. Barbier and Strand 1998;Creighton et al. 2015). It follows that efforts to repair these habitats are likely to produce concomitantpositiveimpactsontheproductivityofpenaeidspecies(Rozasetal.2005).School Prawn Metapenaeus macleayi are a penaeid prawn (=shrimp) species that supports a largeestuarineand inshore fisheryoff easternAustralia.Productivityof the specieshasbeenassociatedwithbothhighfreshwaterflows(Glaister1978),andestuarinewetlandextent(Creightonetal.2015;SaintilanandWen 2012). Across the species range, fishing effort for the species is generally greatestwithin theClarenceRiverestuary,theHawkesburyRiverestuaryandtheHunterRiverestuary(Figure1).TheHunterRiverestuaryissignificantinthatithasbeenthesubjectofconcertedeffortstorepairdegradedestuarinewetlandsoverthe last20years.The impactofthesehabitatrepaireffortsforSchoolPrawnareunclear,with recent studies in this systempresenting conflicting findingswith respect to theutilisationof thesewetlandsbySchoolPrawn(BoysandWilliams2012;Tayloretal.2017b).Thus, there isaneedtobetterunderstandusageoftheserepairedwetlandsintheHunterRiver,andusethisinformationtobothassesstheimpactsofrepaireffortsandrefinefuturework.Thisstudypresentstheresultsofasamplingprogramaimed at establishing quantitative estimates of School Prawn abundance across the recently restoredHexhamwetland,andevaluatingpotentialdriversofthesepatterns.

RepairingAustralia’sseascapes–TropWATERReportno.17/122017
Page64
Figure1MapoftheHunterRiverestuaryandtheHexhamwetlandsystem.Inseta.showsthelocationoftheHunterRiverestuaryontheAustralianeastcoast,andinsetb.showstheHunterRiverestuary,includingmangrove(greenpolygons)andsaltmarsh(brownpolygons)habitats.Insetc.showstheHexhamwetland,withredcirclesindicatingsamplesundertakeninthisstudy.4.3MaterialsandMethods
StudyareaTheHunterRiverestuaryisalarge,wave-dominatedbarrierestuarylocatedinNewSouthWales,Australia(32°54'S151°46'E).Thelowerestuaryisheavilyurbanised,butcontainsextensivemangroveandsaltmarshhabitats concentratedwithin threemajorwetland systems: 1) Tomagowetland; 2) Kooragangwetland;and 3)Hexhamwetland (Figure 1). There is no longer seagrass presentwithin the estuary. The estuarysupports a significant population of School Prawn and Eastern King Prawn (Penaeus plebejus),with theformer supporting a 50-70 tonne per annum estuarine fishery (Taylor et al. 2017b). There is alsoconsiderableharvestofvariousfinfishandcrabspecies(TaylorandJohnson2016).Duringtheearly-mid20thcenturythewetlandsystemsintheestuaryweresignificantlydegraded,primarilythrough floodmitigation barrages severing connectivitywith the estuary, and the installation of dykes,drainsanddryingof thewetlands.Rehabilitationprojectshavenowbeencarriedouton these systems,initiallytargetingtheKooragangwetland(undertakenfrom1990-1996,Williamsetal.2000),followedbytheTomago(undertakenfrom2007-2011,RaynerandGlamore2010)andHexhamwetlands(from2008-2013,Boys2016).ThemostrecentstudiesonSchoolPrawninthisestuary(Tayloretal.2017b;Tayloretal.2016)have shown that all threewetlands representeffective juvenilehabitat (Dahlgrenet al. 2006) forSchool Prawn, and also that the downstream areas of Hexham wetland are an important habitat forjuvenileEasternKingPrawn.

RepairingAustralia’sseascapes–TropWATERReportno.17/122017
Page65
SamplingdesignandapproachSampling involved a quantitative assessment of juvenile School Prawn abundance across the Hexhamwetland (Figure 1). Six sampling sites were selected to cover the wetland system, and were surveyedmonthlyoverthesamplingperiod(Spring2016toAutumn2017).Eachsitewassampledduringeachtimepoint using 4 replicate tows of a 26B-6C sled net,which yielded a total of 144 samples over the studyperiod.Samplingcommencedafterdawn,andaGPSwaypointwasmarkedatthestartandfinishofeachtow(tocalculatetow-length).Depthandwaterquality(salinity,pH,turbidity[NTU],dissolvedoxygen[mgL-1]andtemperature[°C])wererecordedateachsiteduringeachsamplingperiod.SampleprocessinganddataanalysisFollowinglanding,sledsampleswereimmediatelyplacedoniceandthenfrozenforlaterprocessinginthelaboratory. Following thawing of samples, all organismswithin the sampleswere sorted, identified andcounted.Allpenaeidprawnsweremeasuredforcarapacelength(CL,mm)andweight(g).Thetowlength(m) was calculated using a Euclidean formula, and this was usedwith the gear dimensions and a gearefficiencyestimate tostandardiseabundanceestimates toSchool-Prawn-per-hundred-square-metres (SP100 m-2). Patterns in School Prawn abundance were analysed using a two-factor ANOVA, comparingstandardised abundance by Site (fixed, 6 levels) and Month (fixed, 6 levels). Carapace lengthmeasurements (mm) were also expressed as length-frequency distributions to examine evidence fordifferencesinsizestructureamongsitesandmonths.4.4Results
School Prawn abundance estimates were highly variable among sites and months (Figure 2). Site 1consistentlyhad thegreatestabundance,whichaveraged1017SP100m-2,whereas sites2-5hadmuchsmalleraveragedensities(~50SP100m-2),andSite6hadnegligibledensitiesofSchoolPrawnthroughoutthestudyperiod(Figure2).ANOVAindicatedthatmostvariationwasduetofactorSite(F5,108=135.01;P<<0.01),butdifferencesbetweenmonthswerealsosignificant(F5,108=5.59;P<<0.01).TherelationshipamongsiteswasnotconsistentasevidencedinasignificantSitebyMonthinteraction(F25,108=3.19;P<<0.01).WhileSite1hadconsistentlyhigherabundanceestimates(usuallybyoneorderofmagnitude)overothersites,thesourceoftheinteractionwaslikelyduetodifferencesintherelationshipsbetweensites2-6amongmonths(Figure2).Therewerefewobviousdifferencesinwaterqualityamongsitesthroughoutthestudyperiod(Figure3).Sites1and2usuallyhad lowersalinity,andsalinity levelsatthesetwositestracked relatively closely throughout the season. Site 1 and 2 also had lower pH and lower dissolvedoxygen fromOctober–December,however thesevalues increasedandweresimilar toothersites fromDecemberthroughtotheendofthestudyperiod.
SchoolPrawnscapturedduringthesamplingintheHunterRiverEstuary.PhotoCredit:MattTaylor

RepairingAustralia’sseascapes–TropWATERReportno.17/122017
Page66
Figure2Groupedbarplot(mean±SE)showingtheabsoluteabundanceofSchoolPrawnpresentinsitesandmonthssampledduringthestudy.SitenumberscorrespondwiththoseshowninFigure1,anderrorsbarsarestandard.

RepairingAustralia’sseascapes–TropWATERReportno.17/122017
Page67
Figure3Temporaltrendsinwaterqualitymeasuredthroughoutthestudyperiod,including(fromthetop)salinity,pH,turbidity,dissolvedoxygenandtemperature.ColouredlinescorrespondtositesshowninFigure1,asindicatedinthelegend.

RepairingAustralia’sseascapes–TropWATERReportno.17/122017
Page68
Duetothelownumbersofprawnscaptured,monthlylengthfrequenciescouldonlybecalculatedforSchoolPrawnatSite1.Whenallmonthswereconsideredtogether,therewerenoobviousdifferencesinthedistributionoflengthsamongsize-categoriesatdifferencesites(Figure4).Prawngenerallyrangedfrom3mmtoabout20mmcarapacelength(CL;mm)atallsites,withthedistributionsdominatedbyprawnsinthe5-10mmsizeclasses(Figure4).AtSite1,therewassomeevidenceformultiplecohortspresentthroughoutthemonthssampled(Figure5).InOctober,soonafterrecruitmentcommenced,thepopulationwasdominatedbysmallerprawns.Inthefollowingmonths,proportionalabundanceoflargersizesclassesincreased,likelyreflectinggrowthoftheseprawnsastheseasonprogressed(Figure5).Distributionsappearedbi-modalduringDecember,JanuaryandFebruary,indicatingthatmultiplecohortsmovedthrough(recruitedandemigrated)thissitethroughoutthesewarmermonths(Figure5).
Figure4Length-frequencydistributionsforSchoolPrawnamongsites,forallsamplespooledacrossthestudyperiod.Thenumberofprawnsrepresentedinthedistributionisindicatedinthetop-leftofeachpanel.SitenamescorrespondtoFigure1.Allx-axesandy-axesareonthesamescale.

RepairingAustralia’sseascapes–TropWATERReportno.17/122017
Page69
Figure5Length-frequencydistributionsforSchoolPrawncapturedatSite1,foreachmonthofsampling.Thenumberofprawnsrepresentedinthedistributionisindicatedinthetop-leftofeachpanel.SitenamescorrespondtoFigure1.Allx-axesandy-axesareonthesamescale.

RepairingAustralia’sseascapes–TropWATERReportno.17/122017
Page70
4.5Discussion
Thisstudypresentsthefirstquantitative(i.e.targetedsamplingstandardisedforgearefficiency)estimatesof juvenileSchoolPrawnabundance inestuarinehabitats.Whilepreviousstudieshavereportedrelativedensities, these have principally used commercial gear targeted at larger sizes, and/or not correctedestimatesforefficiencyofthegear(e.g.ColesandGreenwood1983;Rotherhametal.2008;Ruello1973a;Ruello1973b).Consequently,therearefewstudiesthatreportabsoluteabundancesofSchoolPrawnwithwhichtocompareourresults.SchoolPrawnhasmanyaspectsofitsbehaviour,physiologyandlifehistoryin common with Brown Shrimp (Farfantepenaeus aztecus), which has been extensively studied in thecontext of wetland repair. One of themost significant papers published on the species in this contextshowedabundanceofBrownShrimpbetween22,246–37,748ha-1,whichequates to222–378BrownShrimp100m-2 (Rozasetal.2005).This is similar to theaveragedensityacrossmonthsandsites in theHexhamwetland,whichequatedto244SP100m-2.PatternsinabundanceSchoolPrawnabundanceestimateswerehighlyasymmetricacrosstheHexhamwetlandsystem.AverageabundanceofSchoolPrawnatSite1was1016SP100m-2,whichisthegreatestabundanceyetreportedintheliteratureforthespecies.Incontrast,abundanceatsites2-5werelower,andabundanceatSite6wasnegligible,andthesepatternswererelativelyconsistentacross thesamplingperiod.Furthermore,Site1contained a broad cross section of size classes, and multiple cohorts, so did not simply reflect a highnumberofnewlyrecruitedpostlarvae.ThespecificfactorsdrivinghighabundanceofSchoolPrawnatthissite are not clear. Water quality data shows that while the salinity was marginally lower at this site(juvenileSchoolPrawnreadilyrecruittobrackishwater,Ruello1971),otherwaterqualityvariableswerewithin reasonable limitsacrossall sites. Thatbeing said,waterqualitywasmeasuredata relatively lowtemporalresolution,andalwaysatthesamepointinthetidalcycle,anddidnotcaptureanyofthetidalvariabilityorotherirregularvariationcausedbyinflowfromthecatchment.Salinityaloneisunlikelytobedrivingthepatterns,asSite1and2hadsimilarsalinity,butSite2supportedamuchlowerabundanceofSchoolPrawn.Pinto and Maheshwari (2012) show responses in School Prawn populations to various water qualityvariables, including temperature and dissolved oxygen. Variation in response to temperature largelydescribesseasonalvariation(withabundancegreatestinspring/summer).Dissolvedoxygenalsovariesinrelation to temperature, but the lowdissolvedoxygen affectingpatterns in School Prawnabundance inPintoandMaheshwari (2012)washypothesised tobedrivenbyanaerobic fermentation.Prawnscanbehighly sensitive lowhypoxicwater (e.g.BrownShrimp,Renaud1986),and thismayhavecontributed tothepatternsweobserved inHexhamwetland.Followingreinstatementof full tidalconnectivity in2013,Hexhamwetlandhasbeeninastateoffluxasthefreshwateraquaticvegetation(e.g.Phragmites)diesandisgraduallyreplacedwithsaltwaterspecies(e.g.Avicenniamarina.,Sporoboloussp.,andSuedasp.).Thisdie off could be contributing excessive amounts of organicmatter to different regions of the wetland,whichcouldcontributetolowdissolvedoxygenandpH(PintoandMaheshwari2011).ThisissupportedbytheobservationthatSites2-5 liewithinchannelswhichdrainamuch largerportionofthewetlandthanSite1.If thesewaterqualitydynamics arepresent, theywouldbemostobviousduring the low tidewhen theinfluence of oceanicwater is at its lowest. The patternswere certainly not evident in our data, as ourmeasurements were always taken during the daytime, and never on the ebb tide.While Site 1 and 2showedmarginally lowerpHanddissolvedoxygenatcertain timesduring thestudyperiod, this is likelyreflecting the lesser influenceof fresh inflowing seawater at these sites as theywere furthest from thewetland entrance. At any rate, resolution of the above patterns and their role in driving School Prawnabundancewillrequirefurtherresearch,andwaterqualitymonitoringatamuchfinerresolution.As Site 6was themost downstream it wasmost exposed to clean inflowing seawater, so the patternsoutlinedaboveare least likely toaffect this site.Apotential explanationof thenegligible School Prawn

RepairingAustralia’sseascapes–TropWATERReportno.17/122017
Page71
abundance at this locationmay be found in recentwork in the lowerHunter River estuary. Patterns inSchool Prawn abundance in this system appear to be inversely related to abundance of Eastern KingPrawn; and lower Ironbark Creek (the main tributary draining Hexhamwetland) supports some of thehighestdensitiesofEasternKingPrawnreportedintheliterature(Tayloretal.2017b).Whiletheproximalmechanismaffecting this relationship is not known, it is possibly beingdrivenby avoidanceof areasbySchoolPrawnwhereEasternKingPrawnareabundant.Partitioningofspacebetweensimilarspecieshasbeen shown previously in other crustaceans (e.g. mysid shrimp, Taylor 2008), but detailed reports forprawnspeciesarerare.WildjuvenileEasternKingPrawnhavebeenshowntooutcompeteotheranimalsfor space (e.g. Ochwada-Doyle et al. 2012), co-occurring Brown Shrimp and White Shrimp(Farfantepenaeussetiferus)havebeenshowntoselectdifferenthabitats(MinelloandZimmerman1985).If interspecific interactions between School Prawn and Eastern King Prawn are occurring, this couldpotentiallyexplaintheabsenceofSchoolPrawnfromthissite.DetectionofthesepatternswouldrequireadjacentsamplingofEasternKingPrawnandSchoolPrawnduringboththenightanddayrespectively,asthesespecieshaveopposingdielactivity.ImplicationsforfisheriesproductivityandfuturehabitatrehabilitationHunterRiverSchoolPrawnpopulationsaresupportedbyarangeofdifferentnurseriesacrosstheestuary(includingmultiplewetlandhabitats,Tayloretal.2017b),howeverharvestofthespeciesisconcentratedwithinthenortharm.Recentworkhasshownthatwhenfishingpressureishigh,themajorityofprawnsemigratingtospawnoriginatefromthesoutharm,andlikelyfedfromtheHexhamwetland(Tayloretal.2017b).Consequently,inyearswhereharvestfromthenortharmishigh,prawnsoriginatingfromHexhamwetland likely underpin a significant proportion of the next generation of recruits. Therefore, a strongpopulationofprawnsinthiswetlandisimportantforongoingrecruitmenttothestockSchool Prawn are not the only species utilising thewetland system,with other commercially exploitedspeciessuchasYellowfinBreamAcanthopagrusaustralis,SeaMulletMugilcephalusandDuskyFlatheadPlatycephalus fuscus also using the recovering wetland (Boys 2016). Recent work has shown thatoutwelledsaltmarshproductivitysupportsaconsiderableproportionoffisheriesproductivityintheHunterRiver (Raoult et al. in prep.). As the wetland continues to recover and is increasingly recolonised bysaltmarsh plants, the benefits of repair to species across the wetland and the south arm is likely tocontinue to increase.Asa final comment,quantitativeestimatesof abundance suchas thosepresentedherewillultimatelybeusefulfordeterminingpotentialbenefitsofhabitatrepairelsewhere.ConclusionsandfutureworkThis studypresents the first targeted investigationof juvenile SchoolPrawnabundancewithina coastalwetland.Byapplyingsamplinggearspecificallydesignedforthespecies,whichhasaknownefficiencyforcaptureofprawns,wewereabletoderiveabsoluteestimatesofSchoolPrawnabundancewithminimalreplicate error. We show that even a relatively recently restored wetland can support considerablenumbers of prawns. The factors driving variation among different areas of thewetland require furtherinvestigation. While our study reflects the recruitment subsidy that might be derived from repairedwetlands, we did not account for further trophic subsidies that may benefit animals elsewhere in thesystem (Taylor et al. in review). This would be a good area to target for future studies, which shouldexaminepatternsinthefoodwebacrossthewetland,aswellasmonitoringwaterqualityatahigherlevelofresolution.Acknowledgements. This project formed part of an Honours thesis by Craig Hart at School ofEnvironmental and Life Sciences, University of Newcastle.We thank C. Creighton, T. Smith, T. Ryan, V.Raoult,K.Russell,D.HewittandC.Copelandforinputatvariousstagesofthisproject.

RepairingAustralia’sseascapes–TropWATERReportno.17/122017
Page72
4.6References
Barbier,E.B.,andI.Strand.1998.Valuingmangrove-fisherylinkages:AcasestudyofCampeche,Mexico.EnvironmentalandResourceEconomics12:151-166.
Beck,M.W.,K.L.Heck,Jr.,K.W.Able,D.L.Childers,D.B.Eggleston,B.M.Gillanders,B.Halpern,C.G.Hays,K.Hoshino,T.J.Minello,R.J.Orth,P.F.Sheridan,andM.P.Weinstein.2001.Theidentification,conservation,andmanagementofestuarineandmarinenurseriesforfishandinvertebrates.Bioscience51:633-641.
Becker,A.,andM.D.Taylor.2017.Nocturnalsamplingrevealsusagepatternsofintertidalmarshandsub-tidalcreeksbypenaeidshrimpandothernektoninsouth-easternAustralia.MarineandFreshwaterResearch68:780-787.
Boys,C.A.2016.ChangesinfishandcrustaceanassemblagesintidalcreeksofHexhamSwampfollowingthestagedopeningofIronbarkCreekfloodgates,39.NelsonBay,FisheriesFinalReportSeriesNo.145:NSWDepartmentofPrimaryIndustries.
Boys,C.A.,andR.J.Williams.2012.Successionoffishandcrustaceanassemblagesfollowingreinstatementoftidalflowinatemperatecoastalwetland.EcologicalEngineering49:221-232.
Coles,R.G.,andJ.G.Greenwood.1983.Seasonalmovementandsizedistributionof3commerciallyimportantAustralianprawnspecies(Crustacea,Penaeidae)withinanestuarinesystem.AustralianJournalofMarineandFreshwaterResearch34:727-743.
Creighton,C.,P.I.Boon,J.D.Brookes,andM.Sheaves.2015.RepairingAustralia'sestuariesforimprovedfisheriesproduction–whatbenefits,atwhatcost?MarineandFreshwaterResearch66:493-507.
Dahlgren,C.P.,G.T.Kellison,A.J.Adams,B.M.Gillanders,M.S.Kendall,C.A.Layman,J.A.Ley,I.Nagelkerken,andJ.E.Serafy.2006.Marinenurseriesandeffectivejuvenilehabitats:Conceptsandapplications.MarineEcology-ProgressSeries312:291-295.
Elliott,M.,A.K.Whitfield,I.C.Potter,S.J.M.Blaber,D.P.Cyrus,F.G.Nordlie,andT.D.Harrison.2007.Theguildapproachtocategorizingestuarinefishassemblages:Aglobalreview.FishandFisheries8:241-268.
Fry,B.2008.OpenbaysasnurseriesforLouisianabrownshrimp.EstuariesandCoasts31:776-789.
Glaister,J.P.1978.ImpactofriverdischargeondistributionandproductionofSchoolPrawnMetapenaeusmacleayi(Haswell)(Crustacea-Penaeidae)inClarenceRiverregion,northernNewSouthWales.AustralianJournalofMarineandFreshwaterResearch29:311-323.
Groenendijk,A.M.1984.Primaryproductionoffourdominantsalt-marshangiospermsintheSWNetherlands.Vegetatio57:143-152.
Lenanton,R.C.J.,andI.C.Potter.1987.ContributionofestuariestocommercialfisheriesintemperateWesternAustraliaandtheconceptofestuarinedependence.Estuaries10:28-35.
Lotze,H.K.,H.S.Lenihan,B.J.Bourque,R.H.Bradbury,R.G.Cooke,M.C.Kay,S.M.Kidwell,M.X.Kirby,C.H.Peterson,andJ.B.C.Jackson.2006.Depletion,degradation,andrecoverypotentialofestuariesandcoastalseas.Science312:1806-1809.
Mazumder,D.,N.Saintilan,R.J.Williams,andR.Szymczak.2011.Trophicimportanceofatemperateintertidalwetlandtoresidentanditineranttaxa:evidencefrommultiplestableisotopeanalyses.MarineandFreshwaterResearch62:11-19.
Minello,T.J.,andR.J.Zimmerman.1985.Differentialselectionforvegetativestructurebetweenjuvenilebrownshrimp(Penaeusaztecus)andwhiteshrimp(P.setiferus),andimplicationsinpredator-preyrelationships.EstuarineCoastalandShelfScience20:707-716.
RepairingAustralia’sseascapes–TropWATERReportno.17/122017
Page73
Ochwada-Doyle,F.,N.R.Loneragan,C.A.Gray,I.M.Suthers,andM.D.Taylor.2012.Competitionbetweenwildandcaptive-bredPenaeusplebejusandimplicationsforstockenhancement.MarineEcology-ProgressSeries450:115-129.
Paterson,A.W.,andA.K.Whitfield.1997.Astablecarbonisotopestudyofthefood-webinafreshwater-deprivedSouthAfricanestuary,withparticularemphasisontheichthyofauna.Estuarine,CoastalandShelfScience45:705-715.
Paterson,A.W.,andA.K.Whitfield.2000.Doshallow-waterhabitatsfunctionasrefugiaforjuvenilefishes?Estuarine,CoastalandShelfScience51:359-364.
Pinto,U.,andB.Maheshwari.2012.Impactsofwaterqualityontheharvestofschoolprawn(Metapenaeusmacleayi)inaperi-urbanriversystem.JournalofShellfishResearch31:847-853.
Pinto,U.,andB.L.Maheshwari.2011.Riverhealthassessmentinperi-urbanlandscapes:anapplicationofmultivariateanalysistoidentifythekeyvariables.WaterResearch45:3915-3924.
Raoult,V.,T.F.Gaston,andM.D.Taylor.inprep.Habitat-fisherylinkagesfortwolargeestuarinefisheries.ScienceofTheTotalEnvironment.
Rayner,D.,andW.Glamore.2010.TidalinnundationandwetlandrestorationofTomagowetland:Hydrodynamicmodelling.UniversityofNSW:WRLTechnicalReportNo.30.
Renaud,M.L.1986.Detectingandavoidingoxygendeficientseawaterbybrownshrimp,Penaeusaztecus(Ives),andwhiteshrimpPenaeussetiferus(Linnaeus).JournalofExperimentalMarineBiologyandEcology98:283-292.
Rogers,K.,E.J.Knoll,C.Copeland,andS.Walsh.2015.QuantifyingchangestohistoricfishhabitatextentonnorthcoastNSWfloodplains,Australia.RegionalEnvironmentalChange16:1469-1479.
Rotherham,D.,C.A.Gray,D.D.Johnson,andP.Lokys.2008.Effectsofdielperiodandtowdurationonestuarinefaunasampledwithabeamtrawloverbaresediment:Consequencesfordesigningmorereliableandefficientsurveys.EstuarineCoastalandShelfScience78:179-189.
Rozas,L.P.,P.Caldwell,andT.J.Minello.2005.Thefisheryvalueofsaltmarshrestorationprojects.JournalofCoastalResearchSI40:37-50.
Rozas,L.P.,andW.E.Odum.1988.Occupationofsubmergedaquaticvegetationbyfishes:testingtherolesoffoodandrefuge.Oecologia77:101-106.
Ruello,N.V.1971.SomeaspectsoftheecologyoftheschoolprawnMetapenaeusmacleayiintheHunterregionofNewSouthWales,145.MScThesis:UniversityofSydney.
Ruello,N.V.1973a.Burrowing,feeding,andspatialdistributionoftheschoolprawnMetapenaeusmacleayi(Haswell)intheHunterRiverregion,Australia.JournalofExperimentalMarineBiologyandEcology13:189-206.
Ruello,N.V.1973b.InfluenceofrainfallondistributionandabundanceofschoolprawnMetapenaeusmacleayiinHunterRiverRegion(Australia).MarineBiology23:221-228.
Saintilan,N.,andL.Wen.2012.Environmentalpredictorsofestuarinefishlandingsalongatemperatecoastline.EstuarineCoastalandShelfScience113:221-230.
Taylor,M.D.2008.Spatialandtemporalpatternsofhabitatusebythreeestuarinespeciesofmysidshrimp.MarineandFreshwaterResearch59:792-798.
Taylor,M.D.,A.Becker,N.A.Moltschaniwskyj,andT.F.Gaston.inreview.Directandindirectinteractionsbetweenlowerestuarinemangroveandsaltmarshhabitatsandacommerciallyimportantpenaeidshrimp.EstuariesandCoasts.
Taylor,M.D.,B.Fry,A.Becker,andN.A.Moltschaniwskyj.2017a.Recruitmentandconnectivityinfluencetheroleofseagrassasapenaeidnurseryhabitatinawavedominatedestuary.ScienceoftheTotalEnvironment584–585:622–630.

RepairingAustralia’sseascapes–TropWATERReportno.17/122017
Page74
Taylor,M.D.,B.Fry,A.Becker,andN.A.Moltschaniwskyj.2017b.Theroleofconnectivityandphysicochemicalconditionsineffectivehabitatoftwoexploitedpenaeidspecies.EcologicalIndicators:http://dx.doi.org/10.1016/j.ecolind.2017.1004.1050.
Taylor,M.D.,andD.D.Johnson.2016.Preliminaryinvestigationofperfluoroalkylsubstancesinexploitedfishesoftwocontaminatedestuaries.MarinePollutionBulletin111:509-513.
Taylor,M.D.,J.A.Smith,C.A.Boys,andH.Whitney.2016.Arapidapproachtoevaluateputativenurserysitesforpenaeidprawns.JournalofSeaResearch114:26-31.
Turner,R.E.1997.WetlandlossintheNorthernGulfofMexico:Multipleworkinghypotheses.Estuaries20:1-13.
Williams,R.J.,F.A.Watford,andV.Balashov.2000.KooragangWetlandRehabilitationProject:HistoryofChangestoEstuarineWetlandsoftheLowerHunterRiver,82.Cronulla:NSWFisheries.
Zimmerman,R.J.,T.J.Minello,andL.P.Rozas.2000.SaltmarshlinkagestoproductivityofpenaeidshrimpsandbluecrabsinthenorthernGulfofMexico.InConceptsandControversiesinTidalMarshEcology,ed.M.P.WeinsteinandD.A.Kreeger,293-314.Dordrecht:SpringerNetherlands.

RepairingAustralia’sseascapes–TropWATERReportno.17/122017
Page75
CHAPTER 5 - THE POTENTIAL BENEFITS FOR SCHOOL PRAWN(METAPENAEUS MACLEAYI) FROM TARGETED HABITAT REPAIR IN THELOWERCLARENCERIVERESTUARYMatthewD.Taylor1,2,*,ColinCreighton3
1PortStephensFisheriesInstitute,NewSouthWalesDepartmentofPrimaryIndustries,TaylorsBeachRd,TaylorsBeach,NewSouthWales,Australia2SchoolofEnvironmentalandLifeSciences,UniversityofNewcastle,NewSouthWales,Australia3TropWATER,JamesCookUniversity,Townsville,Queensland,Australia5.1Abstract
DevelopmentalongAustralia’ssubtropicalestuarieshasledtodegradationoftidalwetlandsandalterationof tidal flows, which has had concomitant impacts on fishery productivity and seafood production.Contemporary management seeks to lessen land use impacts on aquatic environments and restoreestuarine ecosystem services, and knowledge of potential benefits of repairwill inform investment andassist in galvanizing community action. School PrawnMetapenaeus macleayi, being an annual, highlyfecundstockwithhighcommercialandcommunityvalue,provideausefulindexofthepotentialbenefitsof seascape repair. A conventional coupled population-fishery model was used to assess the potentialimpact of returning connectivity to degraded areas within Lake Wooloweyah on the Clarence Riverestuary.Simulationsshowedpotentialbenefitsofrestoring27.6haofsubtidalchannelsinthisareacouldyield a recruitment subsidy which contributes up to 2,578 kg y-1 of additional School Prawn harvest,generatingadditionalrevenueofaroundAUD24,078y-1(grossvalueofproduct)andassociatedeconomicoutputofAUD142,336y-1.Theseestimatesareconservative,notaccountingfortheeconomicoutcomeslikelyfromotherspeciesdirectlyutilisingtheadditionalhabitat,ortheoutwellingofadditionalsaltmarsh-derived productivity to support productivity of School Prawn other commercial species within otherregionsof theestuary. These values are considered in the contextofhabitat repairwithin theClarenceRiverestuary,andotherestuarinesystems.
Inundatedsaltmarshandmangrovehabitats insubtropicalNewSouthWales.Saltmarshhabitatssupporttheproductivityofmanyexploitedspecies.Photocredit:MattTaylor

RepairingAustralia’sseascapes–TropWATERReportno.17/122017
Page76
5.2Introduction
Suitable habitat is a fundamental requirement for the early life history stages ofmost exploited fishes(Beck et al. 2001). Estuaries are remarkably productive systems, and many species rely on estuarinehabitats to support fastgrowth through these lifehistory stageswhere theyaremostvulnerable.ManyAustralian commercial and recreational target species retain this reliance on estuaries throughout theirentire life (Elliott et al. 2007). Pollard (1984) highlighted the concept of estuary dependence and theimperative toensurehealthyestuariesand inshorewaters.Manyof theecosystemservicesprovidedbyestuariesarederived fromsubtidal, intertidalandsupratidalecosystemsand relatedsubstrates, suchasseagrass meadows, mangrove forests and channels, sandspits and mudflats, saltmarshes, salt flats,sedgelandsandswampforests.Thekeyprimaryproducersthatdominatethesehabitatssupportaquaticfoodwebs,butcanalsoprovideandshelterforfishes,andpositively impactwaterquality inthesystem(Caraco et al. 2006). Consequently, estuarine habitats are key to both healthy estuary function andproductivefisheries.Overtheprevioustwocenturies,thequalityofestuarinehabitatshasdramaticallydecreased(e.g.Albert1988;Rabalaisetal.2007).Muchofthisisattributedtopoorlandusepracticesincatchments,especiallytheclearing,drainingandfillingofthesehabitats,thedisruptionofimportantprocessessuchastidalflowandconnectivity,and the transportofexcessive sedimentsor chemicals into theestuarineenvironment(Creighton2013;Daueretal.2000;Harris2001).However, the lossofaquaticvegetationthatdominatethesehabitats exacerbates theeffectsof these land-based impacts (Lotzeet al. 2006). The reduction inhabitat function alters the conditions that fish and crustacea have evolved to rely on, reduces estuarybiodiversity andmost importantly estuary productivity. This ultimately limits the productivity of stockswith flow-on implications for resource sharing across conservation, recreational and commercial fishingsectors.Productivityofpenaeidprawns shows strongassociationswithestuarinehabitats, and therebyprovidesusefulsignalsforchangesinestuaryhealthandpotentialimprovementsinproductivityifestuaryhabitatsand processes are repaired. At broader-scales, fishery productivity has been clearly linked to the arealcoverageofintertidalvegetation(Turner1977).Atfinerscales,itisevidentthatanumberofattributesofthe habitat mosaic support these broad-scale relationships. Some examples include the location ofhabitats with respect to current flow (e.g. Taylor et al. 2017a), the physicochemical attributes of theaquatic environment surrounding these habitats (e.g. Taylor et al. 2017b), microhabitats created byvegetation (e.g. edge habitats, Browder et al. 1989; Rozas and Reed 1993), and the trophic foodwebssupportedbyprimaryproducers(e.g.MelvilleandConnolly2003;MelvilleandConnolly2005).Whiletheseattributesareimportantontheirown, it is likelytobethecombinationoftheseattributesinaseascapewhichsupportstheproductivityofthesespecies(Nagelkerkenetal.2015).Efforts to repair habitats such as estuarine wetlands are steadily gathering momentum, with progressstimulatedbythepotentialbenefitsthatmaybederivedforexploitedspecies(includingpenaeidprawns),among other ecosystem services (Creighton et al. 2015). This is well recognised at the fisheriesmanagement level, with an increasing number of programs aimed at repairing habitats acrossmultiplejurisdictions, funded by a diverse range of conservation, commercial fishing and recreational fishingfunding sources. In Australia, recent examples have demonstrated substantial recruitment of exploitedspeciestorehabilitatedwetlandhabitats(e.g.BoysandPease2016;BoysandWilliams2012),whichhaveinturnbeenshowntolinkwithexploitedcomponentsofthestock(Tayloretal.2017b;Tayloretal.2016).Valuation of the potential outcomes that can be derived from habitat repairwill assistwithmaking aneconomiccaseinsupportoffuturework(Taylor2016).Enhancementoffisheriesproductivityislikelytobeoneof thefirstbenefits realisedafterrepair isundertaken,especially for fecund,short-livedspecies likepenaeid prawns. Other outcomes over the longer term will include carbon capture and storage,recreational amenity, biodiversity productivity (such as increased bird populations and species) andimprovementsinwaterquality.

RepairingAustralia’sseascapes–TropWATERReportno.17/122017
Page77
Thispaperappliesasimpleframeworktovaluethepotentialbenefitsofhabitatrepair forSchoolPrawn(Metapenaeusmacleayi)inthelowerClarenceRiver,alargeestuaryinNewSouthWales,Australia.SchoolPrawn are a valuable species in eastern Australia primarily harvested within the Estuary Prawn Trawlfishery,andmaturebarrierestuaries suchas theClarenceRiverestuarygenerally support largewetlandhabitats thatpositively correlatewithcommercialharvestof this species (Saintilan2004).Weemployedthe length-basedsimulationmodelwhichWatsonetal. (1993)applied tovaluecommercialproductivityforAustralianpenaeidspeciessupportedbytropicalseagrasshabitats,andparameterisedthemodelusingnovel data on School Prawn densities and length frequencies from a rehabilitated wetland, alongsidehabitatmappingandfisherystockassessmentdata(growthandmortality)derivedfromtheClarenceRiverestuary(Montgomeryetal.2010a;Montgomeryetal.2010b).Themodelwasimplementedinastochasticframework to establish the potential economic values of yields derived from the reinstatement ofconnectivitywithtidalcreeksdrainingformersaltmarshhabitataroundthemouthofLakeWooloweyahinthelowerClarenceRiverestuary(describedbelow).5.3MaterialsandMethods
StudyareaThe Clarence River estuary (29°43’S, 153°37’E) is the largest estuarine system in New South Wales,Australia(Figure1),andalsodrainsthelargestcoastalcatchment.Historically,theClarencefloodplainhadwellinexcessof100islandscontainingextensivewetlandhabitats.Development(primarilyforagriculture)has seen substantial areas of floodplain and wetlands drained and isolated from the estuary. LakeWooloweyahisanimportantfeatureofthelowerestuary,andisanexpansiveshallowlakeconnectedtothemainestuaryby fourkeysubtidalchannels,which interspersedeltaic islands formerlydominatedbysaltmarshandmangrovehabitatsthemajorityofwhichisnowreclaimedordegraded.Modificationtothefourmainentrancechannelsthroughroadconstructionandsedimentationhasledtogreatlyreducedtidalfluxeswithinthe lake(Figure1).PalmersChannelconnectswiththemainriver~10kmfromthemouth,andtheremainingthreekeychannelsareclosertotheocean(within3kmofthemouth)withmuchlargertidal prisms. Further degradation of habitats has followed reduced tidal flows and heights, and hasincluded construction of dyke’s and floodgates that isolated mangroves, low-lying saltmarsh, tidal andsupratidal channels and brackish to fresh back swamps from the estuary. With no tidal inundation orconnectivity, all ecosystem function and productivity from these wetlands is lost to the estuary. LakeWooloweyahrepresentsanimportantnurseryandtrawlingareaforSchoolPrawn.
Figure1MapoftheClarenceRiversystem,showingmajorfeaturesoftheestuaryandaninsetshowingthedetailofthemodelregion,thedeltaicislandsbetweenthemouthofLakeWooloweyahandthemainriverchannel.

RepairingAustralia’sseascapes–TropWATERReportno.17/122017
Page78
HabitatmappingHistoric(1942)aerialphotographyandcurrent(2009)satelliteimagerystoredintheNSWDepartmentofPrimaryIndustriesAquaticHabitatDatabasewasusedtoestablishsomeoftheformerarealextentoftidalcreeksandformersaltmarshandmangrovehabitatsinthemodelregion(Figure2).Historicimagerywasdigitised and orthorectified, and habitat polygons for macrophytes and subtidal creeks manuallyconstructedinArcGISaspreviouslydescribed(seeWilliamsandThiebaud2007).Thedifferencebetweentheareal coverageof subtidal creeksdraining former saltmarshhabitatswithin themodel regionat thetwotimepointswascalculatedtodeterminethegaininsubtidalhabitatsthatcouldbeutilisedbySchoolPrawnfollowingrepairbyreinstatingconnectivitywiththeestuary.DeterminationofrecruitmentsubsidyfromhabitatrepairThemodelofWatsonetal.(1993)usedthestandingstockofprawnsinthehabitatofinterest(seagrassinCairns Harbour) to estimate potential value of that habitat derived through fisheries harvest followingrecruitment to the fishery. In ourmodel,weused a similar concept but since standing stock cannot bemeasured prior to repair (as there is no recruitment), we calculated an expected annual recruitmentsubsidy (Nsub, y-1) to the exploited stock derived from areal estimates of habitat extent and expectedSchoolPrawndensitiesinthishabitat.To estimate expected School Prawn densities, School Prawn were measured in the Hexham wetlandsystemintheHunterRiver,NewSouthWalesbyHartetal.(inreview).TheHexhamwetlandsystemisarecently(2013)restoredsaltmarshsysteminanestuaryofidenticalgeomorphologicalclassificationtotheClarence River, that experiences a similar salinity regime and is a similar distance to sea as themodelregion. Given the summer growth rates of School Prawn and the estimation of modal groups inMontgomery et al. (2010b) for both theHunter andClarenceRivers,we assumed a progression of twocohorts would move through the repaired habitat in a particular year. This was likely a conservativeestimate,butensures that theestimatesof valuederived fromour simulations remain conservative. Toestablish the potential impact of habitat repair, the annual recruitment subsidy was calculated using!!"# = ! ∙ ! ∙ !,whereA(ha)istheareaofnewhabitatavailableforcolonisationbySchoolPrawn,D(#ha-1)istheexpecteddensityofSchoolPrawnintherepairedhabitat,andN(y-1)isthenumberofcohortsmoving through the new habitat in a year. Two scenarios were modelled, one reflecting averagerecruitment(Davg)andonereflectinggoodrecruitment(Dgood).Averagerecruitmentreflectedtheaverageabundancedetectedacrossallsitessampled inthewetlandsystem,whereasgoodrecruitmentreflectedtheaverageofthehighestabundancesiteinthesystem(asestimatedfromfielddataasdescribedabove).SimulationmodelThe approach ofWatson et al. (1993) was reproduced in R v. 3.3.2 (R Development Core Team 2016)within a stochastic model framework reflecting a Monte-Carlo Analysis of Uncertainty (MCAoU). Thisallowed us to assess the value of potential harvest derived from School Prawn using subtidal channelswithin the repaired saltmarsh system in the model region and incorporate uncertainty in modelparameters. This approach employed traditional relationships used to model population dynamics inexploited species, and draws on some established approaches for evaluating the economic impact offisheriesharvest inthe literature.Allrelationshipsusedaweeklytime-step,andmodelparameterswereprovided as distributions where possible (see Table 2; note that a and b were provided as a bivariatenormaldistributionfittedfromempiricaldatafortheestuary),andthesedistributionswererandomlyandindependently sampled ineachof10,000 simulations.All economicvalueswereexpressed inAustraliandollars(AUD).

RepairingAustralia’sseascapes–TropWATERReportno.17/122017
Page79
Figure2DetailmapshowingthedeltaicislandsbetweenthemouthofLakeWooloweyahandthemainriverchannel,andtheextentofmangroveandsaltmarshhabitatin1942(saltmarshshadedbrown,andmangroveshadedgreen)and2009(remaininghabitatfrom1942isoverlaidwithgreyhatching).Thesubtidalcreekareasthatwouldbeavailableforcolonisationfollowingrepairareindicatedasblackpolygons.

RepairingAustralia’sseascapes–TropWATERReportno.17/122017
Page80
GrowthofSchoolPrawn(Lt)acrosstheperiodt0totmax,wasmodelledusingcase5oftheSchnute(1981)modelassuggestedbyMontgomeryetal.(2010a)fortheClarenceRiversystem(equivalenttothevonBertalanffygrowthfunction),andtheparametersdescribedforthissysteminMontgomeryetal.(2010a,Table2).Consequently,!! = !!(1 − !!! !!!! ),whereL∞wastheasymptoticlength(hereafterallreferencestolengthrefertocarapacelength;CL,mm),kwastherateofapproachtoL∞,andt0wasthetheoreticalageatwhichL=0(whichwassettozerogiventhatearlylifestagesweredealtwithinthemodel).Weightwasestimatedfromlengthusing!! = !!!!whereWtreflectedweightattimet,andaandbweretheweightcoefficientandexponentrespectively.Theserelationshipsproducedthreemastervectorsoftime(age),length,andweight,fromtheperiodsincehatchingtotheconclusionofthemodelperiod(tmax).Sub-vectorswerethenextractedfortheperiodbetweentheageofpopulationmeasurement(tm)andtheageattheconclusionofthemodelperiod(tmax).We used a length-based relationshipwhich scales naturalmortalitywith prawn size and has previouslybeen applied to small prawns (Loneragan et al. 2003), whereby!! = !!!!"! and Lt was the carapacelength at time t, andα andβ were constants describing how naturalmortality scaleswith animal size.Fishingmortality(Ft)wasexpressedastheproductofthefishingmortality(F)estimatedfortheClarence
RiverbyMontgomeryetal.(2010a)andalength-basedlogisticselectivitycurve!! = ! ∙ !(!!!∙!!)!!!(!!!∙!!)where
nandparecalculatedbasedonlengthat25%,50%and75%retention(L25,L50andL75respectively)using! = −!!" ∙ ! and! = !.!"#
!!"!!!". The totalweeklymortality rate (Zt,wk-1)wasexpressedas the sumofMt
andFt:Theabundanceoftheenhancedpopulationwasestimatedovertheperiodfromthemeanagefor
Nsub (tm)until theendof themodelperiod (tmax),where!! = − !! ∙ log (1 − !!!"#
!!) and !!!"# (mm) is the
meancarapacelengthofprawnsusedtodetermineNsub.Astandardnegativeexponentialmodelwasusedtocalculateabundanceasafunctionoftimeandmortality(!!!! = !!!!!!)whereNtistheabundanceoftheenhancedstockattimet,andNtattimet=tmistherecruitmentsubsidyderivedfromhabitatrepair(Nsub).Instantaneousbiomassharvested(Ht)wascalculatedasafunctionoftimefortheperiodtm≤t≤tmaxusing !! = !!
!!∙ !!(1 − !!!!) ∙!! which was summed across the model period to estimate the total
biomassharvested(H).Harvestwasconvertedtoeconomicvaluebymultiplyingbytheassociatedmarketprice (PSFM, AUD) for the species, which was estimated from the CPI-corrected (consumer price index)averageSydneyFishMarketvaluesacrosstheperiod2005/06–2014/15.Twoscenarioswereconsidered.The firstwasameasureofGrossValueofProduct (GVP),which is reflectedbythesimplemultiplicationmentioned above (GVP = H · PSFM). The second represented an extrapolation of GVP to account forexpectedflow-oneconomicvaluesfromproductharvestedonthebroadereconomyusingamultiplier(m,derivedfromthedatareportedinVoyeretal.2016,Table2),thusreflectingaTotalEconomicOutputfromthehabitatrepair(TO=H·Mp·m).5.4Results
Overtheperiod1942–2009upto66%ofsaltmarshhabitathasbeenlostfromthemodelregion(Table2,andFigure2),howevertherehasbeenamodestgaininarealcoverageofmangrove.Thishasincludedtheloss of 27.6 ha of shallow subtidal creekswhich drain the saltmarsh andmangrove habitats describedabove,andwhichwouldbeavailableforcolonisationfollowingrepairofthesaltmarshhabitat.Table2Changeinsaltmarshandmangrovehabitatwithinthemodelregionbetweentheperiod
1942 2009 PercentchangeMangrove 405ha 415ha 2%Saltmarsh 666ha 223ha -66%

RepairingAustralia’sseascapes–TropWATERReportno.17/122017
Page81
DistributionsofkeymanagementindicatorsforthemodellingareprovidedinFigure3andFigure4.Thesedistributions give some indication of the variability in their prediction, given the level of uncertainty insomemodelparameters.Whilethetailsofthesedistributionsrepresentrelativelyunlikelyoutcomes,themean values (as indicated in the figures) represent themost likely outcomesunder average conditions.Under a scenario of good recruitment, repair of habitat and subsequent colonisation of subtidal creekhabitatbySchoolPrawnismostlikelytoyieldaround2,578kgofproduct,whichequatestoagrossvalueof around AUD24,078 and total output of around AUD142,336 per year (Figure 3). If we consider theaverage recruitment scenario, however, repair of habitat and subsequent colonisation of subtidal creekhabitatbySchoolPrawnismostlikelytoyieldaround623kgofproductperyear,whichequatestoagrossvalueofaroundAUD5,800andtotaloutputofaroundAUD34,258(Figure4).
SaltmarshesandestuariesprovidedcriticalhabitatforSchoolPrawns.PhotoCreditMattTaylor

RepairingAustralia’sseascapes–TropWATERReportno.17/122017
Page82
Figure3Potentialoutcomesfromre-instatementofconnectivitywithmarshhabitatsinthemodelregiongivengoodrecruitment,showingpotentialharvestimpacts(toppanel),andassociatedannualGrossValueofProduct(GVP,middlepanel)andTotalEconomicOutput(TO,lowerpanel),giventheassumptionandparametersdescribedinthetext.Verticallinesindicatetheaverageofestimatedimpacts.
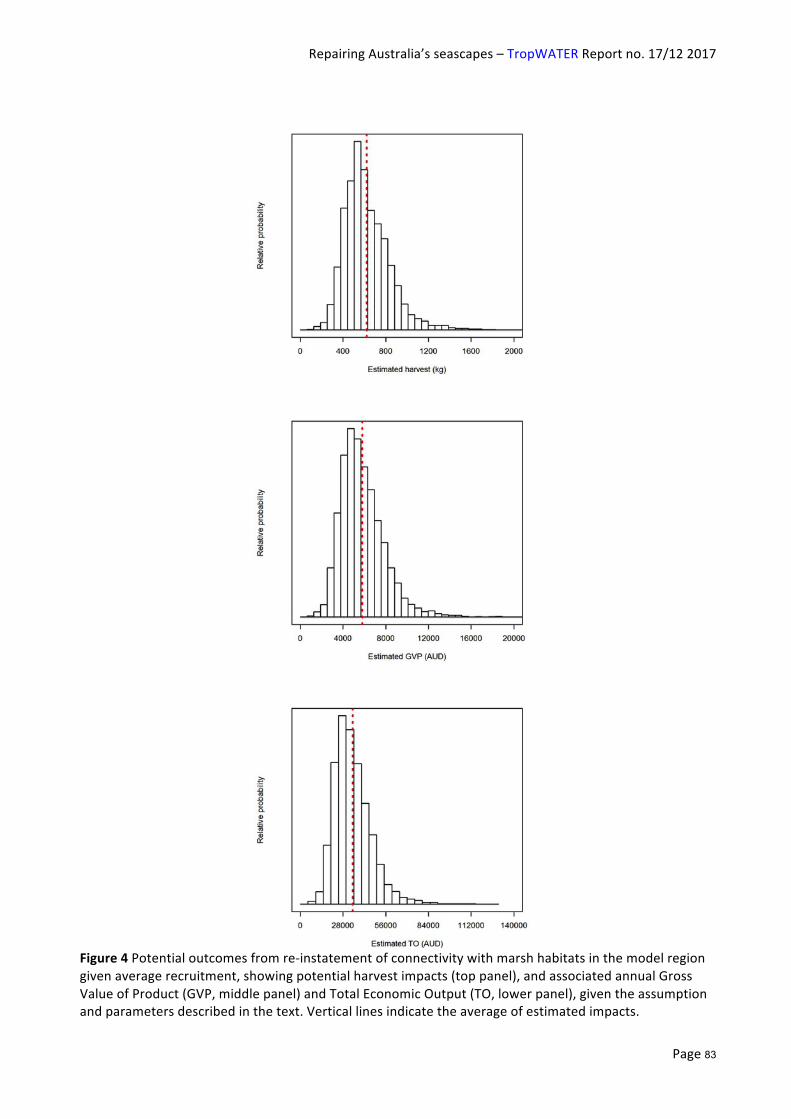
RepairingAustralia’sseascapes–TropWATERReportno.17/122017
Page83
Figure4Potentialoutcomesfromre-instatementofconnectivitywithmarshhabitatsinthemodelregiongivenaveragerecruitment,showingpotentialharvestimpacts(toppanel),andassociatedannualGrossValueofProduct(GVP,middlepanel)andTotalEconomicOutput(TO,lowerpanel),giventheassumptionandparametersdescribedinthetext.Verticallinesindicatetheaverageofestimatedimpacts.

RepairingAustralia’sseascapes–TropWATERReportno.17/122017
Page84
5.4Discussion
Ourestimatesaddtothegrowingbodyofliteraturereportingthepotentialfisheriesharvestbenefitsthatcanbederivedfromhabitatrepair.Populationmodelssuchasthisprovideanoversimplifiedviewofmanycomplexandinter-linkedecologicalbenefits,andbyjustfocusingonasinglespeciesalsomarkedlyunder-estimate potential economic benefits. Nevertheless such models provide a useful approach for thebroadercommunitytounderstandtheimportanceofestuarinehabitat,andtheopportunitiesthathabitatrepairrepresent.Modelsinwhichhabitatislinkedtofisheriesinaquantitativefashionhavetheadvantageofrelyingonasmallnumberofvariablesandasmallsuiteofconservativelyrealisticassumptions.Thereare several examples that apply suchanapproach in the literature. Forexample,Blandonand zuErmgassen(2014)usedasimilarpopulationandfisheriesmodeltoevaluatefisheriesenhancementarisingfromrepairofseagrasshabitats,andderivedacumulativevalue(across12species)of~AUD230,000ha-1y-1, althoughmost species ranged from AUD2 – AUD6,500 ha-1 y-1.Watson et al. (1993), using the samemodelemployedinthecurrentstudy,estimatedvaluesofAUD72–AUD11,084ha-1y-1(convertedto2015dollars)fromprawnharvestderivedfromthestandingstockofjuvenilesinseagrassinnorthernAustralia.For the 27.6 ha restoration scenario considered here, our estimates broadly alignwith these previousstudies, and provide an indication of the potential value that can be obtained from habitat repair.Simulationstudiessuchasthesecontributetotheconsiderationofbenefitsalongsidethecostsofhabitatrepair.BroaderbenefitsderivedfromrepairAsmentionedabove,thebenefitsofhabitatrepairarebynomeanslimitedtothevaluespresentedhere.Saltmarshhabitatscanmakesubstantialcontributionstotheexploitedbiomassharvestedfromestuarinesystems(Tayloretal.inreview).Firstly,there-connectedsubtidalchannelsarisingfromtherepairscenarioaddressed here will provide habitat to directly support species other than School Prawn. For example,subtidal channels draining saltmarsh habitats have been shown to contain exploited species suchMudCrab (Scylla serrata), Dusky Flathead (Platycephalus fuscus), Yellowfin Bream (Acanthpagrus australis),Luderick (Girella tricuspidata) and Sea Mullet (Mugil cephalus) (Mazumder 2009; Morton et al. 1987;Webley et al. 2009). Direct support of adults and/or juveniles of these exploited species will producefisherybenefitsthatcontributeadditionalvaluefromhabitatrepair.Secondly, andprobablymost importantly, are thepotential gains in primaryproductivity to theestuarythatarisefromre-instatementofconnectivitywiththesehabitats.SaltmarshisoneofthemostproductivehabitatsinAustralianestuarinesystems,andisthemajorcontributortothebiomassofacross-sectionofexploited species in seagrass limited systems (Raoult et al. in prep.). When connected to the broaderestuary,primaryproductioninsaltmarshhabitatsisoutwelledtootherareasacrosstheestuarinesystem.This can occur through a number of mechanisms including the transport of particulate organic carbon(POC), transportofdissolvedorganiccarbon (DOC),or consumptionofmarshplantsby smallnektononthemarshsurface(wheninundated),andsubsequentmovementthroughouttheestuary.Theseadditionalbenefits for School Prawn (or other species) are not captured in the analysis presented here, but thefisheryvalueofsaltmarshproductivitythroughthetrophicsubsidydescribedabovehasbeenshowntobeashighasAUD18,352ha-1y-1intheClarenceRiversystem(Tayloretal.inreview).ImplicationsforrepairOursimulationsreflectedthetotalgainsfromacrossthemodelregiononly,buttheseaveragevaluescanbe converted back to per-hectare estimates. For the average recruitment scenario, estimated harvestwould be approximately 23 kg ha-1 y-1, and the associated GVP and TO would be AUD210 ha-1 y-1 andAUD1,241ha-1 y-1 respectively.Mostof the former saltmarshhabitatwithin themodel area is notusedproductively foranyothereconomicoutput,as theyaregleyedclayandpoorlydrainedsoils thatmightoccasionally be used for rough cattle grazing. Essentially these seascapes have been lost to the estuarysimplyasaresultofthedesignoftheflood/tidalleveesconstructedinthe1960’sand1970’s.

RepairingAustralia’sseascapes–TropWATERReportno.17/122017
Page85
Indevelopingthemodelanditsapplicationithasbeenassumedthattidalprismsremainconstant;thisisimportantforsupplyofrecruits(Tayloretal.2017b)andoutwellingofsaltmarsh-derivednutrition.YetforLakeWooloweyah(asindeedformostAustraliansubtropicalestuaries),tidalflowvelocity,fluxesandtotaltidal prism have been constrained by training walls, bridge approaches, causeways and barrages. LakeWooloweyahisconnectedtothemainestuarybyfourtidalchannels(Figure1).PalmersChannelissome10kmby riverupstream fromthemouth,witha subtidal reversedelta intoLakeWooloweyah thathasreducedtidalfluxesthroughoutthesystem.Theremainingthreekeychannelsarewithinthreekilometresofthemouth,andhenceexperiencelargertidalprisms,butroadconstructionacrossRomiaka,OysterandShallowChannel (Figure1)andsubsequent sedimentationhas likely contributed to reduced tidal fluxes.Noestimateofchangedtidalfluxes,thereducedheightofthetidalprismwithinLakeWooloweyahorthesubsequent reduction in the area ofwetland inundated during high tides is available, but thesewill allultimatelyaffecttherealisedbenefitfromrepair.AnystrategicassessmentofopportunitiesforenhancingLake Wooloweyah and overall Clarence River fishery should include an analysis of opportunities toenhancetidalflows.Outsideof themodelarea,similar leveedsitessuitable for repairexist forLakeWooloweyahforeshoresincluding one contiguous prior wetland in the southwest sector of the lake. This complex of subtidalchannels,mangrovesandsaltmarshiswellinexcessof500hectares,whichcouldcontributeconsiderablevalue to the fishery if connectivitywith theestuary is reinstated (certainlywell inexcessof itsvalue foralternatelanduses).Inaddition,therearemanyothersitessuitableforrepairinthelowerClarenceRiverestuary, and our estimates of School Prawn productivity from themodel area contribute to a strategicassessmentofopportunitiesforenhancingfisheryproductivity.Suchananalysiswouldneedtobemulti-objective,simultaneouslyaccounting forenhancementof fisheryproductivityalongsidebenefits throughimprovedfloodmanagement,enhancedrecreationalaccessandgoodqualityagricultural landandwatermanagement.Ultimately thiswouldprovideausefulguide for repairacrossother largeestuariesontheAustraliancoast.
AcowfeedsonsaltmarshgrassintheWooloweyahwetland.Photocredit:MattTaylor

RepairingAustralia’sseascapes–TropWATERReportno.17/122017
Page86
Table1Parametervalues,distributions,andassociatedsourcesformodelsimulations.
ComparisonofscenariosThe simulations presented here reflect a network of simple relationships between carrying capacity,growth, mortality, harvest andmarket value.While most parameters used in the model were actuallyderivedfromstudiesintheClarenceRiver(Table1),thedensityestimatesemployedwerebasedonpriorwork conducted in a repaired wetland in the Hunter River. Consequently, we modelled two scenariosbasedonthisdata,whichincludedanaveragerecruitmentandagoodrecruitmentscenario.TheClarenceRiverrepresentsthelargestSchoolPrawnfisheryinNewSouthWales,andthisisduetoacombinationoffactors that enhance recruitment and productivity. While the average recruitment scenario probablyrepresents a conservative estimate of benefits from repair in the Clarence River, the good recruitment
Parameter Estimate Units Source
k N(0.035,0.00357) wk-1 Montgomeryetal.(2010a)
L∞ N(36.6,2.3737) mmCL Montgomeryetal.(2010a)
a fitted - Length-weightseries
b fitted - Length-weightseries
t0 0 wks
α N(0.5,0.005) - Loneraganetal.(2003)
β N(0.1,0.001) - Loneraganetal.(2003)
A 27.6 ha Mappingdata
Dgood 100,881 #ha-1 Hartetal.(inreview)
Davg 24,366 #ha-1 Hartetal.(inreview)
N 2 - Estimated
!!!"# 7.697 mmCL Hartetal.(inreview)
F U(0.0014,0.0358) wk-1 Montgomeryetal.(2010b)
L25 10.5 mm Commercialfisherydata
L50 12.0 mm Commercialfisherydata
L75 13.5 mm Commercialfisherydata
tmax 75 wks
PSFM N(9.27,0.89) AUD SydneyFishMarket
m N(5.89,0.14) - Voyeretal.(2016)

RepairingAustralia’sseascapes–TropWATERReportno.17/122017
Page87
scenariomay bemore relevant to this estuary for a number of reasons. Spawning and recruitment ofSchool Prawn is dependent on freshwater inflow to the estuary (Glaister 1978a; Glaister 1978b; Ruello1973),andtheClarenceRiverexperiencesthelargestflowsofanyestuarythatsupportsthespeciesandlikely leads to enhanced reproduction and recruitment. Secondly, Clarence River is over 3 degrees oflatitudetothenorthoftheHunterRiver,andwarmerwatertemperaturesinthisarealikelyhaveapositiveimpactonthefecundityofadults(forexample,seePenn1980),aswellasthegrowthandsurvivaloflarvae(Preston 1985) and juveniles (Montgomery et al. 2010b). Considering these factors, it is likely thatrecruitment is greater in the Clarence River estuary, and this is evidenced in themagnitude of catchesobtained from this estuary (Ives et al. 2009). Thus, the good recruitment scenariomay present amorerealisticindicationofthebenefitsofrepair.ConclusionsThesebenefitsoftherestorationscenariooutlinedinthisstudywilllikelyberelevanttobothcommercialandrecreational fishersalike.Therestorationofconnectivity totheseareaswillopenupthehabitat fordirect usage by a broad cross-section of other recreationally targeted species, and these species willsimilarly benefit from any associated trophic subsidy. Such indicative benefits would be markedlyincreased should amajor repair initiative for the Clarence River estuary be implemented, as there aremany similar tidally isolatedareasofwetlandacross the system that couldbe repaired relativelyeasily.More importantly,benefitsof restorationandahealthierestuary ingeneralwouldbesharedacross thebroader community through increased food production, recreational fishing opportunities, tourism, andcommunity lifestyles. Any multi-objective repair initiative would also deliver improvements to floodmanagement,roadinfrastructureandagriculturallandmanagement.Manysciencechallengesremainasestuaryrepairstrategiesaredeveloped.Keyknowledgegapsworthyoffurther investigation include further understanding the ecological productivity implications of restoringtidalflows,modellingthemulti-speciesproductivitybenefitsofrepairincludingfinfish,othercrustaceansandavifauna,anddeterminingthelikelyinteractionsandecologicalresponsesofoutwellingofadditionalsaltmarsh-derivedproductivityasacontributiontoenhancedestuaryhealth.

RepairingAustralia’sseascapes–TropWATERReportno.17/122017
Page88
5.5References
Albert,R.C.1988.ThehistoricalcontextofwaterqualitymanagementfortheDelawareestuary.Estuaries
11:99-107.
Beck,M.W.,K.L.Heck,Jr.,K.W.Able,D.L.Childers,D.B.Eggleston,B.M.Gillanders,B.Halpern,C.G.Hays,K.Hoshino,T.J.Minello,R.J.Orth,P.F.Sheridan,andM.P.Weinstein.2001.Theidentification,conservation,andmanagementofestuarineandmarinenurseriesforfishandinvertebrates.Bioscience51:633-641.
Blandon,A.,andP.S.zuErmgassen.2014.QuantitativeestimateofcommercialfishenhancementbyseagrasshabitatinsouthernAustralia.EstuarineCoastalandShelfScience141:1-8.
Boys,C.A.,andB.Pease.2016.Openingthefloodgatestotherecoveryofnektonicassemblagesinatemperatecoastalwetland.MarineandFreshwaterResearch:-.
Boys,C.A.,andR.J.Williams.2012.Successionoffishandcrustaceanassemblagesfollowingreinstatementoftidalflowinatemperatecoastalwetland.EcologicalEngineering49:221-232.
Browder,J.A.,L.N.May,A.Rosenthal,J.G.Gosselink,andR.H.Baumann.1989.ModelingfuturetrendsinwetlandlossandbrownshrimpproductioninLouisianausingthematicmapperimagery.RemoteSensingofEnvironment28:45-59.
Caraco,N.,J.Cole,S.Findlay,andC.Wigand.2006.Vascularplantsasengineersofoxygeninaquaticsystems.BioScience56:219-225.
Creighton,C.2013.RevitalisingAustralia’sEstuaries,165:FinalreportonProject2012-036-DLDtotheFisheriesResearchandDevelopmentCorporation,Canberra.
Creighton,C.,P.I.Boon,J.D.Brookes,andM.Sheaves.2015.RepairingAustralia'sestuariesforimprovedfisheriesproduction–whatbenefits,atwhatcost?MarineandFreshwaterResearch66:493-507.
Dauer,D.M.,J.A.Ranasinghe,andS.B.Weisberg.2000.Relationshipsbetweenbenthiccommunitycondition,waterquality,sedimentquality,nutrientloads,andlandusepatternsinChesapeakeBay.Estuaries23:80-96.
Elliott,M.,A.K.Whitfield,I.C.Potter,S.J.M.Blaber,D.P.Cyrus,F.G.Nordlie,andT.D.Harrison.2007.Theguildapproachtocategorizingestuarinefishassemblages:Aglobalreview.FishandFisheries8:241-268.
Glaister,J.P.1978a.ImpactofriverdischargeondistributionandproductionofSchoolPrawnMetapenaeusmacleayi(Haswell)(Crustacea-Penaeidae)inClarenceRiverregion,northernNewSouthWales.AustralianJournalofMarineandFreshwaterResearch29:311-323.
Glaister,J.P.1978b.Movementandgrowthoftaggedschoolprawns,Metapenaeusmacleayi(Haswell)(Crustacea-Penaeidae),inClarenceRiverregionofnorthernNewSouthWales.AustralianJournalofMarineandFreshwaterResearch29:645-657.
Harris,G.P.2001.BiogeochemistryofnitrogenandphosphorusinAustraliancatchments,riversandestuaries:effectsoflanduseandflowregulationandcomparisonswithglobalpatterns.MarineandFreshwaterResearch52:139-149.
Hart,C.,T.F.Gaston,andM.D.Taylor.inreview.Utilisationofarestoredwetlandbyacommerciallyimportantspeciesofpenaeidshrimp.FisheriesManagementandEcology.
Ives,M.C.,J.P.Scandol,S.S.Montgomery,andI.M.Suthers.2009.ModellingthepossibleeffectsofclimatechangeonanAustralianmulti-fleetprawnfishery.MarineandFreshwaterResearch60:1211-1222.
Loneragan,N.R.,R.A.Kenyon,P.J.Crocos,R.D.Ward,S.Lehnert,M.Haywood,S.Arnold,R.Barnard,M.Burford,N.Caputi,M.Kangas,F.Manson,R.McCulloch,J.Penn,M.Sellars,P.Grewe,Y.Ye,B.

RepairingAustralia’sseascapes–TropWATERReportno.17/122017
Page89
Harch,M.Bravington,andP.Toscas.2003.Developingtechniquesforenhancingprawnfisheries,withafocusonbrowntigerprawns(Penaeusesculentus)fisheryinExmouthGulf,287.Cleveland:CSIRO.
Lotze,H.K.,H.S.Lenihan,B.J.Bourque,R.H.Bradbury,R.G.Cooke,M.C.Kay,S.M.Kidwell,M.X.Kirby,C.H.Peterson,andJ.B.C.Jackson.2006.Depletion,degradation,andrecoverypotentialofestuariesandcoastalseas.Science312:1806-1809.
Mazumder,D.2009.Ecologyofburrowingcrabsintemperatesaltmarshofsouth-eastAustralia.InSaltmarshEcology,ed.N.Saintilan,115-131.Melbourne,Australia:CSIROPublishing.
Melville,A.J.,andR.M.Connolly.2003.Spatialanalysisofstableisotopedatatodetermineprimarysourcesofnutritionforfish.Oecologia136:499-507.
Melville,A.J.,andR.M.Connolly.2005.Foodwebssupportingfishoversubtropicalmudflatsarebasedontransportedorganicmatternotinsitumicroalgae.MarineBiology148:363-371.
Montgomery,S.S.,C.T.Walsh,M.Haddon,C.L.Kesby,andD.D.Johnson.2010a.UsinglengthdataintheSchnuteModeltodescribegrowthinametapenaeidfromwatersoffAustralia.MarineandFreshwaterResearch61:1435-1445.
Montgomery,S.S.,C.T.Walsh,C.L.Kesby,andD.D.Johnson.2010b.Studiesonthegrowthandmortalityofschoolprawns,90.FRDCProjectNo.2001/029:IndustryandInvestmentNSW,FisheriesFinalReportSeriesNo.119
Morton,R.M.,B.R.Pollock,andJ.P.Beumer.1987.TheoccurrenceanddietoffishesinatidalinlettoasaltmarshinsouthernMoretonBay,Queensland.AustralianJournalofEcology12:217-237.
Nagelkerken,I.,M.Sheaves,R.Baker,andR.M.Connolly.2015.Theseascapenursery:anovelspatialapproachtoidentifyandmanagenurseriesforcoastalmarinefauna.FishandFisheries16:362-371.
Penn,J.1980.Spawningandfecundityofthewesternkingprawn,PenaeuslatisulcatusKishinouye,inWesternAustralianWaters.MarineandFreshwaterResearch31:21-35.
Pollard,D.A.1984.Areviewofecologicalstudiesonseagrass—fishcommunities,withparticularreferencetorecentstudiesinAustralia.AquaticBotany18:3-42.
Preston,N.1985.TheeffectsoftemperatureandsalinityonsurvivalandgrowthoflarvalPenaeusplebejus,MetapenaeusmacleayiandM.bennettae.InSecondAustralianNationalPrawnSeminar,ed.P.C.Rothlisberg,B.J.HillandD.J.Staples,31-40.Cleveland,Australia.
RDevelopmentCoreTeam.2016.R:Alanguageandenvironmentforstatisticalcomputing.Vienna,Austria:RFoundationforStatisticalComputing.
Rabalais,N.N.,R.E.Turner,B.K.S.Gupta,E.Platon,andM.L.Parsons.2007.SedimentstellthehistoryofeutrophicationandhypoxiainthenorthernGulfofMexico.EcologicalApplications17:S129–S143.
Raoult,V.,T.F.Gaston,andM.D.Taylor.inprep.Habitat-fisherylinkagesfortwolargeestuarinefisheries.ScienceofTheTotalEnvironment.
Rozas,L.P.,andD.J.Reed.1993.Nektonuseofmarsh-surfacehabitatsinLouisiana(USA)deltaicsaltmarshesundergoingsubmergence.MarineEcology-ProgressSeries96:147-157.
Ruello,N.V.1973.InfluenceofrainfallondistributionandabundanceofschoolprawnMetapenaeusmacleayiinHunterRiverRegion(Australia).MarineBiology23:221-228.
Saintilan,N.2004.Relationshipsbetweenestuarinegeomorphology,wetlandextentandfishlandingsinNewSouthWalesestuaries.EstuarineCoastalandShelfScience61:591-601.
Schnute,J.1981.Aversatilegrowthmodelwithstatisticallystableparameters.CanadianJournalofFisheriesandAquaticSciences38:1128-1140.

RepairingAustralia’sseascapes–TropWATERReportno.17/122017
Page90
Taylor,M.D.2016.IdentifyingandunderstandingnurseryhabitatsforexploitedpenaeidshrimpinNSWestuaries.In25thAnnualNSWCoastalConference,9-11thNovember,2016,1-8.CoffsHarbour.
Taylor,M.D.,B.Fry,A.Becker,andN.A.Moltschaniwskyj.2017a.Recruitmentandconnectivityinfluencetheroleofseagrassasapenaeidnurseryhabitatinawavedominatedestuary.ScienceoftheTotalEnvironment584–585:622–630.
Taylor,M.D.,B.Fry,A.Becker,andN.A.Moltschaniwskyj.2017b.Theroleofconnectivityandphysicochemicalconditionsineffectivehabitatoftwoexploitedpenaeidspecies.EcologicalIndicators:http://dx.doi.org/10.1016/j.ecolind.2017.1004.1050.
Taylor,M.D.,T.F.Gaston,andV.Raoult.inreview.TheeconomicvalueoffisheriesharvestsupportedfromsaltmarshandmangroveproductivityintwotemperateAustralianestuaries.EcologicalIndicators.
Taylor,M.D.,J.A.Smith,C.A.Boys,andH.Whitney.2016.Arapidapproachtoevaluateputativenurserysitesforpenaeidprawns.JournalofSeaResearch114:26-31.
Turner,R.E.1977.Intertidalvegetationandcommercialyieldsofpenaeidshrimp.TransactionsoftheAmericanFisheriesSociety106:411-416.
Voyer,M.,K.Barclay,A.McIlgorm,andN.Mazur.2016.SocialandEconomicEvaluationofNSWCoastalProfessionalWild-CatchFisheries:ValuingCoastalFisheries,208.ReporttoAustralianFisheriesResearchandDevelopmentCorporationonProject2014/301:UniversityofTechnology,Sydney.
Watson,R.A.,R.G.Coles,andW.J.L.Long.1993.Simulationestimatesofannualyieldandlandedvalueforcommercialpenaeidprawnsfromatropicalseagrasshabitat,northernQueensland,Australia.AustralianJournalofMarineandFreshwaterResearch44:211-219.
Webley,J.A.,R.M.Connolly,andR.A.Young.2009.Habitatselectivityofmegalopaeandjuvenilemudcrabs(Scyllaserrata):implicationsforrecruitmentmechanism.MarineBiology156:891.
Williams,R.J.,andI.Thiebaud.2007.Ananalysisofchangestoaquatichabitatsandadjacentland-useinthedownstreamportionoftheHawkesburyNepeanRiveroverthepastsixtyyears,97.Cronulla:NSWFisheries.

RepairingAustralia’sseascapes–TropWATERReportno.17/122017
Page91
CHAPTER 6 - FISH USE OF TASMANIAN SALTMARSH WETLANDS:BENEFITS FOR FISH FROM TIDAL RESTORATION AND COASTALREHABILITATIONVishnuPrahalad1*,VioletHarrison-Day1andPeterMcQuillan1
1Geography&SpatialScienceDiscipline,SchoolofLandandFood,UniversityofTasmania,Hobart7001,Australia*Correspondingauthor.E-mail:vishnu.prahalad@utas.edu.auForsubmissiontoMarineandFreshwaterResearchasOriginalResearch6.1Abstract
FishuseofcoastalsaltmarshwetlandshavebeendocumentedformanypartsofAustraliawithanotableexceptionofTasmania.Ourstudyprimarilyaimedtodocumentthediversity,densityandpatternsoffishuseintheCircularHeadcoastsaltmarshes,northwestTasmania.Wealsoexploredanyeffectofsaltmarshhabitatfragmentationonfishspeciesdiversityanddensitybysamplingconcurrentlyatnearbypairedsitesofpredominantlyunalteredandaltered saltmarshes. Three sitepairswere selected2.5-10kmapart foreach other, on the basis of the extent of habitat fragmentation caused by earthworks that wasrepresentativeofthestudylocalities.Fishwerecaughtusingbuoyantfloorlesspopnetsatthesixpairedlocationsoversuccessiveneapandspringtidecycles.Atotalof851fishfrom11specieswerecaughtin37of the 48 net releases at amean density of > 72 fish per 100m-2. Three of these species,Aldrichettaforsteri,ArripistruttaceousandRhombosoleatapirina,aretargetedbyrecreationalandcommercialfishersandcontributedcloseto20%ofthetotalcatchnumbers.Althoughtherewereminordifferences infishassemblages between locations, therewas no significant difference between the unaltered and alteredmarshes, including those areas behind naturally breached levees. This provides an indication that anyrehabilitation of saltmarshes by restoring tidal flows will deliver benefits for fish productivity throughexpandedhabitat.
Buoyantpopnets(5mx5m)inactiononTasmaniansaltmarsh.Photocredit:VishnuPrahalad

RepairingAustralia’sseascapes–TropWATERReportno.17/122017
Page92
6.2Introduction
Coastal saltmarsh wetlands are increasingly recognised as fish nurseries with a growing literaturedocumentingtheimportanceofthesehabitatsforitinerantfishuse(e.g.Connolly2009;RaposaandTalley2012). The general expectation is that saltmarshes and their associated tidal creeks provide secure andproductivehabitatforfishatvaryingspatialandtemporalscalesaspartoftheseascape(e.g.Kneib1997;Deeganetal.2000;Valielaetal.2000).InAustralia,thereisincreasingevidenceoffishutilisationoffoodresourcesfoundinsaltmarshes(CrinallandHindell2004;HollingsworthandConnolly2006;Mazumderetal. 2006a; Mazumder et al. 2011; McPhee et al. 2015; Platell and Freewater 2009). As elsewhere,Australian saltmarshes have been documented to produce organicmaterials (plant and animalmatter)thatareexportedtocoastalwatersthroughtides,thusimprovingseascapefisheriesproductivity(MelvilleandConnolly2003;Svenssonetal.2007).WhilemoreresearchisbeingundertakeninAustralia,themajorityofresearchonsaltmarshfishhasbeenfocused elsewhere in theworld, particularly in North America. A review conducted by Connolly (1999)indicates that, of literature published before 2000, 90% of studies were fromNorth America, 7% fromEuropeand3%fromthesouthernhemisphere includingAustralia (althoughfurtherworkhassincebeenpublished). Differences exist in habitat type between Australian and North American saltmarshes andmangroves,includingdifferencesintypicalelevation,waterdepthandplantassemblages(Connolly2009),makingcomparisonsbetween international studiesproblematic.Within theAustralian literature, studieshaveprimarilybeenreportedfromtemperate,subtropicalandtropicalwatersinSouthAustralia,Victoria,NewSouthWalesandQueensland(Connollyetal.1997;CrinallandHindell2004;Davis1988;Mazumderetal.2006b;ThomasandConnolly2001).AustralianliteraturereportingontheuseoftemperatesaltmarshesbyAustralianfishspeciesrecordupto35specieswithdensitiesofupto56fishper100m-2(Connolly2009;Wegscheidletal.2017).Intermsofpatternsoffishuseofsaltmarshes,Australianliteraturedescribespatialandtemporaldifferencesbetweenregions, including varying effects of seasonality, tide regime, water depth, diel time, temperature andsalinityon fishassemblages (Connollyetal.1997;CrinallandHindell2004;Davis1988;Mazumderetal.2005a;Mortonetal.1987;ThomasandConnolly2001).AlthoughamajorfocusofresearchreportedfromNorthAmericahasbeenondifferencesinfishusebetweenvaryingsaltmarshcondition(e.g.RaposaandTalley2012),fewpublishedstudieshavedealtwiththispartiallyinAustralia(Connolly2005;Mazumderetal.2006b),andnonedirectly(Connolly1999).AconspicuousomissionfromtheAustralianliteraturehasbeenoffishuseofTasmaniansaltmarshes,withno previous record of fish species diversity, density, patterns of use and preference between varyinghabitat conditions. As both saltmarshes and mangroves have been found to host many fish species(Mazumderetal.2005a;Saintilanetal.2007),andgiventhelackofmangrovesinTasmania,measuringthediversity,densityandpatternsoffishuseofsaltmarshes(wherenoadjoiningmangrovehabitatispresent)is important. As well as lackingmangroves, Tasmania’s saltmarshes differ in context to those found inmainlandAustralia.Incomparison,theyaresituatedslightlyloweronthetidalframe(thusbeingsubjecttodifferentfloodingregimes)andcontaindifferentsaltmarshplantassemblagescomparedtomanyoftheirmainlandcounterparts(Mountetal.2010).Saltmarshes of temperate and subtropical Australia are listed as an endangered ecological communityunder theAustralianFederalEnvironmentProtectionandBiodiversityConservationAct1999 tohighlighttheir historic and ongoing loss and degradation (Threatened Species Scientific Committee 2013). In thecontextofTasmania,lossanddegradationofsaltmarsheshasoccurredmostextensivelyinthenorth-westpart of the State, in the Circular Head region (Prahalad 2014). Previous management interventionsfocussedheavilyonconservingshorebirdsandhadstruggledtoraisetheprofileofsaltmarshesamongthelocalcommunityanddecisionmakers(PrahaladandKriwoken2010).Fishuseofsaltmarsheshasnotbeenamajorfocusofeffortstoconserveandrepairsaltmarshes,dueinparttothelackofdocumentedstudies.OuraimistodocumentfishuseofthesaltmarshesintheCircularHeadareabyaddressingthefollowing

RepairingAustralia’sseascapes–TropWATERReportno.17/122017
Page93
questions: (1)what is the diversity and density of fish in the saltmarshes of our study area during oursampling season? (2) are there any observable patterns of fish use relative to sampling location, tideregime, water depth, diel time, temperature and salinity? (3) is there difference in fish use betweensaltmarshesofvaryingcondition?and,(4)whatareimplicationsformanagementandfurtherresearch? 6.3Materialsandmethods
StudyareaTheCircularHead coastal area is located in the farnorth-westof Tasmania,between the small townofStanleyandWoolnorthPoint(Figure1).Theareaisalmostentirelyshelteredfromthehigh-energywaveclimateofBassStraitandformsanexpansiveseascapematrixoftidalflats,seagrassbeds,saltmarshesandMelaleuca ericifolia swamp forests on the landwardmargin (Figure 2,Mount et al. 2010). The CircularHeadareaishometoalmostaquarterofallsaltmarshmappedacrossTasmania,occupying1326hain23distinctclusters,eachassociatedwithariver/creekmouth,embayment,shelteredpassageortidal island(Prahalad2016).Thestudyareahasamesotidalrangeofupto3.1m,thelargestontheTasmaniancoast(Donaldson et al. 2012), with a semi-diurnal tidal cycle. Within the tidal frame, saltmarshes occupy anarrowniche of about 0.5m elevation range (Mount et al. 2010). The lowmarsh is characterised by asucculentmat ofSarcocornia quinqueflora often co-occurringwithSamolus repens, ranging in elevationbetween10-20cm(whenflooded).ThehighmarshandbackmarshareasaredominatedbythesucculentshrubTecticorniaarbusculaoftenmixedwithgrassesandsedges.Saltmarshesarefloodedpartiallyduringneaptidesandalmostfullyduringspringtides.
Figure 1 Study area and three saltmarsh locations used in the CircularHead coastal area of north-westTasmania.BaseimageryfromSPOT5satellite,dated2009.

RepairingAustralia’sseascapes–TropWATERReportno.17/122017
Page94
Figure 2 Circular Head coastal seascapematrix of tidal flats, seagrass beds, saltmarshes andMelaleucaericifoliaswampforests.IllustrationusedwithpermissionfromMountetal.(2010).Thelandwardboundaryofthesaltmarshcoincidesroughlywiththestormtideextent(Mountetal.2010).M.ericifoliadominatesthelandwardmarginsofthetidalframecompetingwithsaltmarshandextendingontonearbylowlyingcoastalfloodplainareas.AlargepartofM.ericifoliaandtheadjoiningsaltmarshhas,however,beenclearedforagriculturaluse,withover25km’sofleveesbuiltalongtheshorelinetorestricttidal flooding (Prahalad 2014). Earliest evidence of levee building in saltmarsh was observed from oldaerial imagery fromthe late1960s,while themostextensiveperiodofclearinganddrainingwasduringthe1980s.Theestimatedabsolutelossofsaltmarshbetween1952and2006is219ha(16%),with752ha(65%)oftheremainingsaltmarshessubjecttoimpactsincludingclearing,ditching,grazingandbufferzoneremoval(Prahalad2014).Leveebuildingcontinues,witha2haareaofsaltmarshlostbetween2013and2016 (unpublisheddata). TheCircularHead coastal areahasbeen selected for this study forhaving thegreatest potential for saltmarsh rehabilitation in the state. The area is also of significant importance torecreational and commercial fisheries, with the local saying that: ‘if you are not catching a flathead inSmithton,youarenottrying’.Therearealsoactiveoysterfarmsintheareawhichdependongoodwaterquality.SamplingdesignMethodsusedtosamplefishinsaltmarshesincludeblocknets,flumenets,flumeweir,fykenets,liftnets,popnets, drop samplers, traps, dip nets andhand trawls, and also poisoning (Connolly 1999, 2009).Ofthese,popnetsareusedinAustralianowmorethanothertechniques(Connolly2009),duetotheireasyportabilityallowingforsamplingreplicationsandtheirabilitytoprovideadensitymeasure(fishperm-2)thatiscomparabletootherstudies(Wegscheidletal.2017).Variousauthorshaveuseddifferentpopnettypesandsamplingregimes,withthegeneraltendencytousealargersamplearea(~25m-2)toavoidsmallscalepatchiness,afinemeshsize(~2mm)tocatchjuvenilefishandaremotelycontrolledrelease.Inthisstudy,weemployedfourcustommadebuoyantfloorlesspopnets,eachcoveringanareaof25m-2(with5mlongx1mhighwalls)andwithafinemeshsizeof2mm.Thebottomofthenetwallshadalead-coreropethatwastuckedunderthesaltmarshsubstrateformingashallowdepressionandpeggeddownby10-12weedmatpinsoneachside.Thishelpedavoid trenchingandexcessivesoildisturbance (cf.Connolly2005).Thetopofthenetwallshadasleevesuitablefora20mmPVCpipethatwasinsertedin-situandsealedforfloatation.ThenetwasfoldedunderthetopsleevecontainingthePVCpipesothatthenetsatflatonthemarshsurfaceasmuchaspossible.WeightswereplacedonthePVCpipetokeepitdepressedwiththeincomingtideuntilthenetswerereadytobepopped.Theinstallationwasdoneduringlowtideandtook60minspernetwithtwopeopleworkingintandem.Thefournetswereusedconcurrentlyatnearbypairedsitesofunalteredandalteredsaltmarshes,locatedinRobbinsPassage,BigBayandPerkinsPassage(seeFigure1).Thethreelocationswas2.5-10kmapartforeach other and selected on the basis of being representative of the saltmarshes of the Circular Headregion. Unaltered saltmarshes had no hydrological alterations due to nearby levees or other notablehumanimpacts(suchasditches,clearing,grazing),weresurroundedbyacontiguousbufferzoneofnativevegetation,andwererelativelyunfragmentedbeingpartofalargerclusterormatrixofsaltmarsh.Altered

RepairingAustralia’sseascapes–TropWATERReportno.17/122017
Page95
marsheshadsignificanthydrologicalalterationsduetonearby leveesandotherhuman impacts (suchasditches,clearing,grazing),hadalittletononativebuffervegetationbeingjuxtaposedtoagriculturallandusedmainlyforcattlegrazing,andbelongedtohighlyfragmentedclustersofvariablesize(Table1.).Table1.Conditionofsaltmarshesusedinthestudy. Site Conditionclassandvariables
Location Class Levees1 Bufferzone2Saltmarshfragmentation3
Saltmarsharea4
RobbinsPassage Unaltered Absent Present Absent 12.1ha
Altered Brokenlevees Presentbutlimited Medium 35.5ha
PerkinsPassage Unaltered Absent Present Medium 13.5ha
Altered Brokenlevees Absent High 18.9ha
BigBay Unaltered Absent Presentbutlimited Medium 15ha Altered Intactlevees Absent High 1.7ha1Brokenleveesareregularlybreachedbyincomingtide.
2Bufferzone,e.g.Melaleucaericifoliaswampforest. 3Degreeoffragmentationofmarshandassociatedtidalcreeksbyleveessince1960's.
4Area of saltmarsh, contiguous but spread along the coastwith a highmarsh area toedgeratio.
SamplingprocedureAtslackhightide,thefullyinstallednetswerereleasedremotely(10-15m)bytwofieldpersonnelpullingthestringsconnectedtotheweightsatthesametime.Thenetspoppedinstantaneously(~1second)andwerethensurveyedforentrappedfish,mostlyatthedownstreamside(s)intowhichtheywerechannelledasthetidereceded.Fishwerecollectedatregularintervalsusinghand-helddipnetstomitigatelossduetopredationbybirdsandcrabsinsidethenet.Dependingonthetideheight,ittookbetween1-2hrsfortheflood tide to recede fully from themarsh surface.Ona coupleofoccasionsduring spring tide, the crabholesinthemarshwerestillholdingwaterwellafterthemarshsurfacehaddrainedandhidingfishofthefamilyGobiidae.Athoroughfinalinspectionwasmadebeforeconcludingeachsamplingeffortbycheckingallfourwallsofthenetandtinydepressionsforcamouflagedspecies.Collectedfishwereidentifiedinthefield, recorded and released. Representative samples of each species were taken to confirm fieldidentificationbyfishexperts(followingGomonetal.2008).FishwereterminallyanesthetisedinthefieldusingalethaldoseofAQUI-S®,acommerciallyavailablederivativeofcloveoil.Specimenswerepreservedimmediatelyintoasolutionof95%ethanol.FishweresampledconcurrentlyinbothunalteredandalteredsitesduringsuccessiveneapandspringtidecyclesinthemonthsofAprilandMay2017.Samplingwasdoneduringbothhightides(nightandday)ofsemi-diurnaltidalcycle.Eachsamplingeffortinvolvedtworeplicatesplacedinthesaltmarshatthepairedlocations, located randomlyon themarsh flats and spacedno further than25mapart (cf. ThomasandConnolly2001).Theneaptidalcyclesampleswere locatedontheseawardedgeof themarshexpectinglowerwater levelsandthespringtidalcyclesampleswere locatedslightlyhigheronthemarshplatformexpecting higherwater levels (with distance to seaward edge proportional to the paired unaltered andalteredmarshes).Water temperature,salinityandtimeofnet release (diel time)wererecordedateachsamplinglocation.Waterdepthwasrecordedateachnetasthemeanofmaximumandminimumdepth,asthemarshsurfacewasoftensloped. DataanalysisSummary statistics were used to gain an overall impression of the fish community. To gauge thecompleteness of the sampling, a species accumulation curve (collector's curve) was produced usingspecaccumintheveganlibrary(Oksanenetal.2011).Samplestakenwhenthemaximumwaterdepthwas

RepairingAustralia’sseascapes–TropWATERReportno.17/122017
Page96
less than 5 cm (meanwater depth <3 cm) yielded no fish andwere excluded from further analysis. Toexplore the relationship between the environmental variables and fish species abundance within theoverallassemblage,weusedapermutationalMANOVA(theadonisfunctionfromtheveganlibrary)whichfits linearmodels to distancematrices and uses a permutation test (n = 999)with pseudo F-ratios.Werelatedfourvariables-fishspeciesrichnesspersample,fishcatchpersampleandtheabundanceofthemore twomost common species - to a suite of predictor environmental variables - location, conditionstatus, tide cycle, diel phase (night vs. day), water salinity andmean water depth. Since the responsevariableswerebasedoncountdata,Poissonorquasi-Poissonmodelswithaloglinkfunctionwereappliedasappropriate.The multiple response permutation procedure (MRPP) in vegan was used to test for any significantdifference between the unaltered and altered sites based upon their fish assemblages. The Bray–Curtisdissimilarity measure and 999 permutations were employed. The MRPP statistic delta is the overallweightedmean of within-groupmeans of the pairwise dissimilarities among the sampling units.A is achance-corrected estimate of the proportion of the distances explained by group identity, a valueanalogoustoacoefficientofdeterminationinalinearmodel(Oksanenetal.2011).Thedegreetowhichthe fish assemblages varied between unaltered and altered sites was assessed using nMDS ordinationbased on the Bray Curtis dissimilarity measure (Clarke and Warwick 2001). Fish counts were nottransformed since the rangeof valueswasnotextreme.The stress levelof 0.1909 in2dimensionswasacceptable (Quinn and Keogh 2002). Analyses were carried out in the R statistical environment (RFoundationforStatisticalComputing,Vienna,Austria).6.4Results
Atotalof851 fishof11species from8 familieswerecaught (Table2.).Thespeciesaccumulationcurve(Figure3)suggeststhatthetotalnumberofspeciespresentatthesamplingsitesisabout12andthatthenumber of samples was satisfactory to reveal most of the fish taxa present at the sites. The familyAtherinidaecontributed3speciesand74%ofthetotalcatchnumbers,ofwhichAtherinosomamicrostomaandLeptatherinapresbyteroidesweremostabundant(57%and16%respectively,Figure4).TwomembersofthefamilyGobiidae,Pseudogobiussp.andNesogobiusmaccullochi,contributed3%and2%tonumbersrespectively. Three species, Aldrichetta forsteri (Mugilidae), Arripis truttaceous (Arripidae) andRhombosolea tapirina (Pleuronectidae) are targeted by recreational and commercial fishers (Lyle et al.2014),andthesetaxacontributedalmost20%ofthetotalcatchnumbers.Ofthese,A.forsteriwasbothcommonandnumericallydominant,presentin24(65%)ofthe37netsthatcaughtfishandmadeup19%ofthetotalcatch.Allthespecimenscaughtwereidentifiedaseitherjuvenilesorsub-adults.Palaemonsp.(palaemonid shrimp) was observed in most of the nets, sometimes in large numbers (~200) but notcensusedasthestudywasrestrictedtofinfish.Crabswerealsoobservedinallofthenetsandhavebeenpreviously documented for this area by Richardson et al. (1997). Some of the larger and more activeindividualswereevictedfromthenetstoavoidpredationoffishwhenthewaterlevelswerelow.

RepairingAustralia’sseascapes–TropWATERReportno.17/122017
Page97
Table2.FishcaughtusingbuoyantfloorlesspopnetsonsaltmarshflatsontheCircularHeadcoast,north-westTasmania,duringApril-May2017.
Family Genus/species Commonname Contributiontocatch
RobbinsPassage PerkinsPassage
BigBay
Total
Unaltered Altered
Unaltered Altered
Unaltered Altered
Total % Total % Total % Total % Total % Total % Total %Atherinidae Atherinosoma
microstoma(Günther,1861)
SmallmouthHardyhead
37 55.2 129 64.2 21 34.4 47 34.8 146 63.5 102 65.0 482 56.6
Kestratherina esox(Klunzinger,1872)
PikeheadHardyhead
0 0 3 1.5 3 4.9 0 0 0 0 6 3.8 12 1.4
Leptatherinapresbyteroides(Richardson,1843)
SilverFish 7 10.4 50 24.9 6 9.8 15 11.1 39 17.0 18 11.5 135 15.9
Gobiidae Nesogobiusmaccullochi (HoeseandLarson,2006)
GirdledGoby 2 3.0 2 1.0 2 3.3 7 5.2 5 2.2 0 0 18 2.1
Pseudogobiussp.
EasternBluespotGoby
10 14.9 7 3.5 1 1.6 4 3.0 0 0 6 3.8 28 3.3
Mugilidae Aldrichetta forsteri(Valenciennes,1836)
Yellow-eyeMullet*
10 14.9 10 5.0 27 44.3 50 37.0 40 17.4 23 14.6 160 18.8
Pleuronectidae
Rhombosoleatapirina (Günther,1862)
GreenbackFlounder*
0 0 0 0 0 0 1 0.7 0 0 0 0 1 0.1
Pseudaphritidae
Pseudaphritisurvillii
Congolli 0 0 0 0 0 0 5 3.7 0 0 1 0.6 6 0.7

RepairingAustralia’sseascapes–TropWATERReportno.17/122017
Page98
(Valenciennes,1832)
Tetrarogidae
Gymnapistesmarmoratus(Cuvier,1829)
Soldier 0 0 0 0 0 0 0 0 0 0 1 0.6 1 0.1
Arripidae Arripis truttaceus(Cuvier,1829)
AustralianSalmon*
1 1.5 0 0 0 0 0 0 0 0 0 0 1 0.1
Galaxiidae Galaxiasmaculatus(Jenyns,1842)
CommonGalaxias
0 0 0 0 1 1.6 6 4.4 0 0 0 0 7 0.8
Totalcatchpersampletype
67 201 61 135 230 157 851
Fishdensityper100m-2
38.3 100.5
30.5 67.5 115 78.5 72.4
Fishdensityper100m-2(excludingnetswithlessthan5cmwaterdepth)
44.7 100.5
40.7 67.5 115 104.7
83.0
Theasterisk(*)indicatesspeciesofrecreationalandcommercialinterest(Lyleetal.2014).

RepairingAustralia’sseascapes–TropWATERReportno.17/122017
Page99
Figure 3. Species accumulation curve (with SD) for fish species sampled at three saltmarshes on theCircularHeadcoast,north-westTasmania,duringApril-May2017.
Figure4.Boxplotof the fish taxaat threesaltmarsheson theCircularHeadcoast,north-westTasmania.CommonnamecodesusedareYEM:Yellow-eyeMullet,SMH:SmallmouthHardydhead,SLF:SilverFish,SF:Soldierfish,PHH:PikeheadHardyhead,GG:GirdledGoby,GBF:GreenbackFlounder,EBG:EasternBluespotGoby,CON:Congolli,CGA:CommonGalaxias,AS:AustralianSalmon.Thepopnetswereveryeffectiveatcatching fishwith37of the48netreleasesreturningbetween3-69fishpernet.OneofthenetsfailedintheRobbinsPassageunalteredsaltmarshduringtheneaptidenight-timesample.Themeandensityoffishcaughtintheremaining47netswas72.4fishper100m-2(Table2.).This figure is a lowerendestimategiven themaximumwaterdepthwas less than5 cm (averagewaterdepth<3cm)on5occasionswherethehightidemarkdidnotfullyextendtotheareacoveredbythenets.Whencorrected for these5 samples, thismeandensitygoesup to83 fishper100m-2. Inaddition, it is
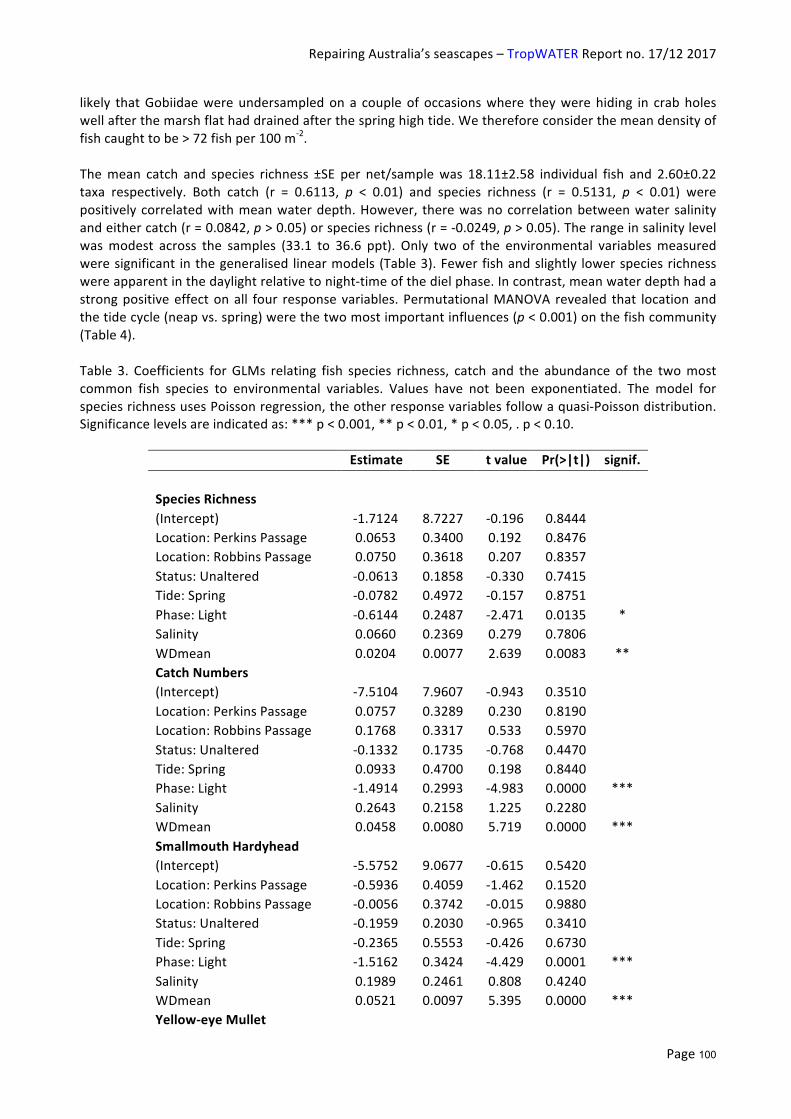
RepairingAustralia’sseascapes–TropWATERReportno.17/122017
Page100
likely thatGobiidaewereundersampledona couple of occasionswhere theywerehiding in crabholeswellafterthemarshflathaddrainedafterthespringhightide.Wethereforeconsiderthemeandensityoffishcaughttobe>72fishper100m-2.Themean catch and species richness ±SE per net/samplewas 18.11±2.58 individual fish and 2.60±0.22taxa respectively. Both catch (r = 0.6113, p < 0.01) and species richness (r = 0.5131, p < 0.01) werepositivelycorrelatedwithmeanwaterdepth.However, therewasnocorrelationbetweenwatersalinityandeithercatch(r=0.0842,p>0.05)orspeciesrichness(r=-0.0249,p>0.05).Therangeinsalinitylevelwasmodest across the samples (33.1 to 36.6 ppt). Only two of the environmental variablesmeasuredweresignificant inthegeneralised linearmodels (Table3).Fewerfishandslightly lowerspeciesrichnesswereapparentinthedaylightrelativetonight-timeofthedielphase.Incontrast,meanwaterdepthhadastrongpositiveeffectonall four responsevariables.PermutationalMANOVA revealed that locationandthetidecycle(neapvs.spring)werethetwomostimportantinfluences(p<0.001)onthefishcommunity(Table4).Table 3. Coefficients forGLMs relating fish species richness, catch and the abundance of the twomostcommon fish species to environmental variables. Values have not been exponentiated. The model forspeciesrichnessusesPoissonregression,theotherresponsevariablesfollowaquasi-Poissondistribution.Significancelevelsareindicatedas:***p<0.001,**p<0.01,*p<0.05,.p<0.10.
Estimate SE tvalue Pr(>|t|) signif. SpeciesRichness (Intercept) -1.7124 8.7227 -0.196 0.8444 Location:PerkinsPassage 0.0653 0.3400 0.192 0.8476 Location:RobbinsPassage 0.0750 0.3618 0.207 0.8357 Status:Unaltered -0.0613 0.1858 -0.330 0.7415 Tide:Spring -0.0782 0.4972 -0.157 0.8751 Phase:Light -0.6144 0.2487 -2.471 0.0135 *Salinity 0.0660 0.2369 0.279 0.7806 WDmean 0.0204 0.0077 2.639 0.0083 **CatchNumbers (Intercept) -7.5104 7.9607 -0.943 0.3510 Location:PerkinsPassage 0.0757 0.3289 0.230 0.8190 Location:RobbinsPassage 0.1768 0.3317 0.533 0.5970 Status:Unaltered -0.1332 0.1735 -0.768 0.4470 Tide:Spring 0.0933 0.4700 0.198 0.8440 Phase:Light -1.4914 0.2993 -4.983 0.0000 ***Salinity 0.2643 0.2158 1.225 0.2280 WDmean 0.0458 0.0080 5.719 0.0000 ***SmallmouthHardyhead (Intercept) -5.5752 9.0677 -0.615 0.5420 Location:PerkinsPassage -0.5936 0.4059 -1.462 0.1520 Location:RobbinsPassage -0.0056 0.3742 -0.015 0.9880 Status:Unaltered -0.1959 0.2030 -0.965 0.3410 Tide:Spring -0.2365 0.5553 -0.426 0.6730 Phase:Light -1.5162 0.3424 -4.429 0.0001 ***Salinity 0.1989 0.2461 0.808 0.4240 WDmean 0.0521 0.0097 5.395 0.0000 ***Yellow-eyeMullet
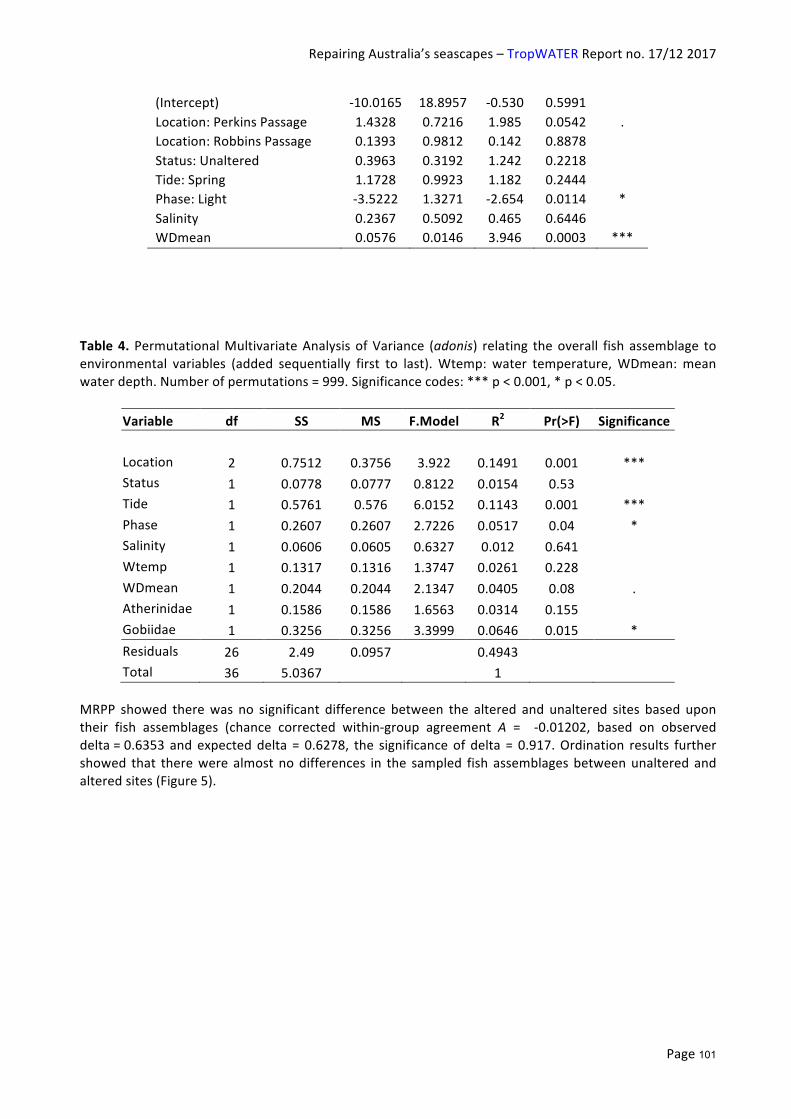
RepairingAustralia’sseascapes–TropWATERReportno.17/122017
Page101
(Intercept) -10.0165 18.8957 -0.530 0.5991 Location:PerkinsPassage 1.4328 0.7216 1.985 0.0542 .Location:RobbinsPassage 0.1393 0.9812 0.142 0.8878 Status:Unaltered 0.3963 0.3192 1.242 0.2218 Tide:Spring 1.1728 0.9923 1.182 0.2444 Phase:Light -3.5222 1.3271 -2.654 0.0114 *Salinity 0.2367 0.5092 0.465 0.6446 WDmean 0.0576 0.0146 3.946 0.0003 ***
Table4. PermutationalMultivariateAnalysisofVariance (adonis) relating theoverall fishassemblage toenvironmental variables (added sequentially first to last).Wtemp: water temperature,WDmean:meanwaterdepth.Numberofpermutations=999.Significancecodes:***p<0.001,*p<0.05.
Variable df SS MS F.Model R2 Pr(>F) Significance Location 2 0.7512 0.3756 3.922 0.1491 0.001 ***Status 1 0.0778 0.0777 0.8122 0.0154 0.53
Tide 1 0.5761 0.576 6.0152 0.1143 0.001 ***Phase 1 0.2607 0.2607 2.7226 0.0517 0.04 *Salinity 1 0.0606 0.0605 0.6327 0.012 0.641
Wtemp 1 0.1317 0.1316 1.3747 0.0261 0.228WDmean 1 0.2044 0.2044 2.1347 0.0405 0.08 .
Atherinidae 1 0.1586 0.1586 1.6563 0.0314 0.155Gobiidae 1 0.3256 0.3256 3.3999 0.0646 0.015 *
Residuals 26 2.49 0.0957 0.4943 Total 36 5.0367 1
MRPP showed therewas no significant difference between the altered and unaltered sites based upontheir fish assemblages (chance corrected within-group agreement A = -0.01202, based on observeddelta=0.6353 andexpecteddelta = 0.6278, the significanceof delta = 0.917.Ordination results furthershowed that therewerealmostnodifferences in the sampled fish assemblagesbetweenunalteredandalteredsites(Figure5).

RepairingAustralia’sseascapes–TropWATERReportno.17/122017
Page102
Figure 5. nMDS ordination of the pop net samples based upon their fish communities. Stress in2D=0.1909.Samplesfromunalteredsitesbyclosedcircles,alteredsitesarerepresentedbyopencircles.Statuslabelsareplottedattheirrespectivecentroids.
A smallmouthhardyhead (Atherinosomamicrostoma) caught in the sampling of Tasmanias saltmarshes.Photocredit:VishnuPrahalad

RepairingAustralia’sseascapes–TropWATERReportno.17/122017
Page103
6.5Discussion
FishspeciescompositionanddensityThis isthefirststudytodocumentfishuseofTasmaniansaltmarshwetlandsandlaysthefoundationforfuturework.ThefishspeciesencounteredinthisstudyoverlapwiththosereportedfromothertemperateAustralian saltmarshes (Connolly 2009), dominated by species from the three families of Atherinidae,GobiidaeandMugilidae.Of theothercommonfish families reported in temperateVictorian (CrinallandHindell2004)andNewSouthWalessaltmarshes(Mazumderetal.2005a,Mazumderetal.2006b),speciesfromAmbassidae,GerridaeandSparidaewereabsentlikelyduetotheirgeographicrangenotextendingtoTasmania.EndemicspeciesofthefamiliesSillaginidaeandTetraodontidaewerealsonotcapturedinournets,thoughthepresenceofTetractenosglaber(SmoothToadfish)wasobservedadjacenttothenetsinBig Bay and Robbins Passage. Notably, this study provided a rare record in Australian saltmarshes of amember of the recreationally and commercially valuable family Arripidae. The two other species ofrecreationalandcommercial interestrecorded,A.forsteriandR.tapirinahavebeenfrequentlyreportedfromothertemperateAustraliansaltmarshes.TherelativeabundanceofA.forsteriinourtotalcatch(19%)is,however,comparativelymuchhigher foramemberof the familyMugilidae (cf.<4%of totalcatchbyCrinall andHindell 2004 in Victoria and byMazumder et al. 2005a andMazumder et al. 2006b inNewSouthWales).ThiscouldnotbefullyattributedtotheseasonofthesamplingcoincidingwiththebreedingperiodofA.forsterigiventhevariablesizes(~4-20cmtotallength)ofsamplescaught(Chubbetal.1981).Intermsofspeciesrichness,the11speciesrecordedinoursingleseasonofsamplingcompareswellwithother temperateAustralian studieswhere reports range from10 species in Victoria (Crinall andHindell2004)to14speciesinNewSouthWales(Mazumderetal.2005a).Ourobserveddensityof>72 fishper100m-2 ishigher than fromotherAustraliansaltmarshes, includingfrom subtropical studies (Table 5.). The high density recorded in this studymay be a seasonal artefactwheresamplinginautumnreturnedhighfishcatches.AstudybyJinetal.(2007)offishinYangtzeRiversaltmarsh in China found strong seasonal variation in mean abundance, although suggested thatabundancewassignificantlyhigherduringnortherntemperatespringandsummerseasons.ThereislittleevidencesofarinAustraliaforsignificantseasonalvariationsinfishontemperatesaltmarshes.Mazumderetal. (2005a)showedseasonalvariation in fishabundance inmangroves,peaking insummer,butnot inthe case of saltmarshes near Sydney. Bloomfield and Gillanders (2005) also reported no significantdifferences in fish abundance and richness in saltmarshes from South Australia between months. Aplausible explanation for the high fish density reported in this study could be the unique position ofTasmanian saltmarshes as part of seascapes where mangroves are absent. Consequently, Tasmaniansaltmarshesaresituatedloweronthetidalframeand,inthecaseofourstudyareawithahightidalrange,are partially flooded even during neap tides unlike most mainland Australian saltmarshes which getflooded only in spring tides (Bloomfield and Gillanders 2005, Connolly 2009). It is therefore valid tohypothesise that saltmarshes in our studied seascape are likely to provide higher habitat value for fishcomparedtoAustralianmainlandmarshes,duebothtolongeravailabilityoffloodedhabitatandalackofcomplementaryhabitatofferedbyadjoiningmangroves.PatternsoffishuseandimplicationsforcoastalrehabilitationItisexpectedthatsaltmarshrehabilitationthroughrestoringtidalflowsbestowspotentialbenefitsforfishthroughexpandedhabitat(Romanetal.2002;RaposaandTalley2012).Twomainfindingsinourstudyofpatternsoffishusesupportthisexpectation.Thefirstonerelatestothestrongeffectofwaterdepthonfishdensityandrichnessfoundinthisandsomeotherstudies(ThomasandConnolly2001;Connolly2005).Whencurrently tide-restrictedareasareopen to flooding, theywillbeaccessedbyspring tidesandcanaccommodatethespreadofagivenvolumeofwater(enteringtheembaymentorshelteredpassage)overa greater surface area. This opens up more shallow, sheltered environments, rich in food sources,preferredbyjuvenileandsub-adultfishspecies(e.g.A.forsteriandMugilcephalus,SeaMullet:Chubbetal.1981).Thesecond related finding fromour study indicates that therewasonlyaminoreffectof thesamplinglocationonbothfishdensityandrichness.Giventhatthestudyareahasover25kmsof levees
RepairingAustralia’sseascapes–TropWATERReportno.17/122017
Page104
spanningmultipleprivateproperties,coastalrehabilitationworkscanbeinitiatedwhereveropportunitiesarisewithlikelybenefitsforlocalfishuse.Whilethesaltmarshareaalreadylosttoclearingwas221ha,afurther629ha(55%ofcurrentextent)isaffectedbyimpairedtidalflows(Prahalad2014)andcanbenefitfromsimplerongroundworks(e.g.leveebreaching)aimedattidalrestoration. DifferenceinfishusebetweenunalteredandalteredsaltmarshesThisstudyisalsothefirstinAustraliatodocumentthedifferenceinfishusebetweenpairedunalteredandaltered saltmarshes (Connolly 1999, 2009).Our findings indicate that alteredmarshes can support highdensitiesoffishandofcomparablespeciesrichnesstounalteredmarshes.Oneofthereasonsforhighfishnumbers in our alteredmarshes could be due to the greatermarsh to edge ratio, a product of habitatfragmentation,allowinggreateraccesstofish(Minelloetal.1994).Amoresubstantivereason,however,couldbejustthatalteredmarshescanprovidesimilarhabitatfunctionforfishuseiftheyaresubjecttothenatural tidal regime comparable to its unaltered counterparts. There is considerable evidence fromelsewhere,suchastheAtlanticcoastoftemperateNorthAmerica,ofrestoringsaltmarsheshavingsimilarfish habitat value to reference sites (Raposa and Talley 2012). Further, restoration of tide-restrictedmarshes(i.e.intorestoringones)hasbeenshowntoreturnfishdensityandrichnesstolevelscomparableto unaltered ones within one year (Roman et al. 2002). Indeed, our spring tide samples from RobbinsPassageandPerkinsPassagealteredsiteswerebothlocatedimmediatelybehindthebreachedlevees,andreturned high fish density and species richness. It must be noted though that these altered sites hadcomparabletidalregime,plantcompositionandcrabactivitytotheirpairedunalteredsites(anindicationofsomefunctionalequivalence).AcomparativestudybyMazumderetal.(2006b)ofthreesaltmarshesoftheSydneyregionindicatedthatoneofthemarshesreclaimedfromdredgespoilhadsignificantly lowerabundance and diversity of fish, possibly due to lack of functional equivalence. The contrasting resultsfrom these two studies indicate an unexplored threshold effect in saltmarsh condition, likely contextspecific (e.g. with and without mangroves), which can help explain fish habitat value and guide tidalrestorationefforts.

RepairingAustralia’sseascapes–TropWATERReportno.17/122017
Page105
Table5.CompilationoffishdatafromexistingliteraturethatreportusingpopnetsonsaltmarshflatsinAustralia(cf.Connolly2009;Wegscheidletal.2017).
Region State Reference
Noofpopnetreleases
Totalfishcaught
Diversity(numberofspecies)
Meandensity(fishper100-2)
Temporalcontext(samplingmonth)
Spatialcontext(withmangrovesetc.)
Waterdepth(proxyforvolume)
Subtropical QLD ThomasandConnolly2001
134 577 23 17.2 August,January Flats 4-72cm
Connolly2005 88 1073 19 48.8 May,December Flats,adjacentrunnelsandmangrove-linedcreeks
6-48cm
Temperate NSW Mazumderetal.2005b
48 766 15 52.8 Yearround(monthly)
Flats,adjacentmangroves Notreported
Saintilanetal.2007 36 ~568 14 52.2 Yearround(monthly)
Flats,adjacentmangrovesandseagrass
Notreported
SA Connollyetal.1997 48 19 2 4.4* April-July Flatswithcreeks,adjacentmangrovesandseagrass
10-30cm
BloomfieldandGillanders2005
30 1 1 0.4* July,August,December-February
Flats,adjacentmangrovesandseagrass
>70cm
TAS Presentstudy 48 851 11 72.4** April,May Flats 0-70cm*Popnetswereof3x3msize,coveringanareaof9m-2;allotherstudieslistedcoveredanareaof25m-2ormore.
**Meandensitycalculatedfor47releasesasoneofthenetsfailed.

RepairingAustralia’sseascapes–TropWATERReportno.17/122017
Page106
ValueofsaltmarshforfishandseascapefoodwebThehighdensityoffishrecordedinourstudyhasimplicationsforbetterunderstandingthecontributionofsaltmarshtofishandthebroaderseascapefoodweb.Saltmarshesareprimarilyregardedfortheirshallowandshelteredenvironmentsuitableforjuvenileandsub-adultfishtoshelterandfeed,andalsofortrophicrelay to the greater seascape food web (Kneib 1997; McPhee et al. 2015). Gut content analysis of A.microstomafromNewSouthWalesfoundthattheyfedexclusivelyoncrabzoeaefoundabundantlyinthesaltmarsh.ThestudyalsoreportedGobiidaeandMugilidaefeedingonpolychaetes, insects, insect larvaeandfinedetritus,allresourceswhichcanbefoundinabundanceonthesaltmarsh(PlatellandFreewater2009, also seeMazumder et al. 2006a). Further, with respect to trophic relay,Mazumder et al. (2009)reported the highest density of zooplankton from saltmarsh, compared to adjacentmangrove, seagrassandopenwaterduringahightideeventataNewSouthWalesestuary.Inaddition,Svenssonetal.(2007)demonstrateddetritalpathwayswhereestuarinefishwerefoundtobefeedingondetritusderivedfromtemperate saltmarshes in Western Australia. These studies underscore an important role played byAustraliansaltmarshesinprovidingorganicmatterintomarinefoodwebs(arolenowwellrecognised,e.g.Deeganetal.2000;Mazumderetal.2011).Inabroadercontext,anongoingdebateonseascapefisheriescorrespondstotherelativeimportanceofdifferenthabitattypes,includingsaltmarshes(seeFigure2),totheseascapefoodweb.WhilefewstudiesfromAustraliahavesimultaneouslycomparedsaltmarshwithothernearbyhabitats(mangroves,seagrassandunvegetated/openwater), theydiffer in their valuationof saltmarsh relative to other habitatswithrespecttofishuse.BloomfieldandGillanders(2005)notedthatsaltmarshhadtheleastnumberoffish(asolitary A. microstoma for a saltmarsh area of 270 m-2), compared to mangroves, seagrass andunvegetated habitats of a South Australian estuary. Similarly, Saintilan et al. (2007) reported lowernumbersoffishinaNewSouthWalessaltmarshcomparedtonearbymangroveandseagrass.Thelatterstudy however showed that fish moved between these habitats and that saltmarsh plays both acomplementaryroleintermsofaddedfoodresourceandalsoarefugeroleforsmallerfishduringspringtides (when the seagrass habitat is ‘exposed’ to larger predatory fish). Mazumder et al. (2005a) alsoreported more fish in the mangrove relative to saltmarsh in the same New South Wales saltmarsh.However, they noted that fish density was higher in saltmarsh when corrected for water volume. Acommonemphasisoftheseandotheroverseasliteraturesources(e.g.Valielaetal.2000)hasbeenontherole of a functioning seascapematrix of habitats for fish to access at varying timescales. The value ofsaltmarshforfishandseascapefoodwebisverylikelyhigherinTasmaniawiththeabsenceofmangrovesathighlatitudes.ManagementimplicationsThe priority formanagement in the context of our study area and other similar locales is primarily theprotectionof existing saltmarshes and their tidal connectivity, both forunalteredandaltered siteswithbreached levees.Ofparticular importanceare theBoullangerBay andRobbinsPassageareaswhichareleastaffectedby leveesandotherassociatedclearinganddrainageactivities (seeFigure1andPrahalad2014).Further,targetedtidalrestorationcanbeundertakeninareasofBigBay,PerkinsPassage,andothernearbyareasofDuckBayandWestInlet.Inaddition,activitiesaimedattherehabilitationofthebufferingM. ericifolia swamp forests could benefit the broader functioning of the seascape, through enhanceddetritalpathways(e.g.Svenssonetal.2007)orreducednutrientstressontheseascapefromthenearbycattlefarms(Holz2009).Afurtheraspectformanagementwouldbetofocusonsciencecommunicationoftheresultsfromthisstudy,inrelationtothehighfishdensityandspeciesrichnessinthesaltmarshandofthelinkstorecreationalandcommercialfisheries,includingoysterfarming.North-westTasmania,aswithmanyotherareasofTasmaniaandelsewhere,isrenownedforitsfishingculture,andfishmaywellbeanimportantandlocallyunexploitedavenueforcommunityengagementtowardsseascaperehabilitationandmanagement(Wegscheidletal.2017).
Conclusion

RepairingAustralia’sseascapes–TropWATERReportno.17/122017
Page107
This study provides the first documentation of the fish species present in Tasmanian saltmarshes, theirdensitiesandpatternsofuse.Thetemporalscaleofthisstudyisaknownlimitation,andsamplingduringdifferent seasonal periods is an important area for future research. A central aim of this study was toevaluate the difference in fish use between unaltered and altered saltmarshes spread across the largerCircularHeadcoastalarea.Therewasnosignificanteffectofalteredsaltmarshhabitatonfishassemblagesaslongastheyaretidallyconnected.Therewasalsonostrongeffectofsamplinglocationoffishdensityandrichness.This indicatesthatrestoringtidalflowstomarshescutoffduetotheleveeswouldprovidehabitat suitable for fish use despite its historically ‘altered’ condition owing to leveeworks and relatedimpacts such as ditching, clearing and grazing. The findings reveal a hitherto unrecognised aspect ofTasmaniansaltmarshesandprovideafoundationforfurtherresearchcoupledwithrehabilitationefforts.Whilethe importanceofsaltmarshes isbeingrecognisedforarangeoffactors, fishremainacompellingsubjectwithbroad resonance. Improvingourunderstandingof fishuseof saltmarshescould raisemuchneededpublicawarenessandmaterialsupportforsaltmarshrehabilitation.AcknowledgementsWethankAlistairDeane,LarissaGiddings,LauraVanGalenandZhiLohfortheirinvaluableassistancewithfieldwork. Thanks also to Jeremy Ward, the Circular Head Landcare Group and Debashish Mazumder(ANSTO)forsupportwithfieldwork.ManythankstoJohnPogonoski(CSIRO),ChrisBurridgeandGrahamEdgarfromtheUniversityofTasmania(UTAS)forguidancewithfishidentification.Samplingwascarriedoutunderapproval(ref:A16284)fromUTASAnimalEthicsCommitteeandpermit(no:17012)fromWildFisheriesManagementBranchof TasmanianGovernment. The researchwas supportedby funding fromAustralian Government’s National Environmental Science Programme: Marine Biodiversity Hub andAustralian Postgraduate Award. Colin Creighton (James Cook University) provided valuable commentswhichimprovedthemanuscript.

RepairingAustralia’sseascapes–TropWATERReportno.17/122017
Page108
6.6References
Bloomfield,A.L.andGillanders,B.M.(2005).Fishandinvertebrateassemblagesinseagrass,mangrove,
saltmarsh,andnonvegetatedhabitats.Estuaries28,63-77.
Clarke,K.R.andWarwick,R.M.(2001).‘Changeinmarinecommunities:anapproachtostatisticalanalysisandinterpretation.’2nded.Plymouth,U.K.:PRIMER-ELtd.
Chubb,C.F.,Potter,I.C.,Grant,C.J.,Lenanton,L.C.J.andWallace,J.(1981).Agestructure,growthratesandmovementsofseamullet,MugilcephalusL.,andyellow-eyemullet,Aldrichettaforsteri(Valenciennes),intheSwan-AvonRiversystem,WesternAustralia.AustralianJournalofMarineandFreshwaterResearch32,605-628.
Connolly,R.M.(1999).Saltmarshashabitatforfishandnektoniccrustaceans:challengesinsamplingdesignsandmethods.AustralianJournalofEcology24,422-430.
Connolly,R.M.(2005).ModificationofsaltmarshformosquitocontrolinAustraliaaltershabitatusebynekton.WetlandsEcologyandManagement13,149-161.
Connolly,R.M.(2009).FishonAustraliansaltmarshes.Pp.131-148in‘AustralianSaltmarshEcology’edbyN.Saintilan.CSIROPublishing.
Connolly,R.M.,Dalton,A.,andBass,D.A.(1997).FishuseinofaninundatedsaltmarshflatinatemperateAustralianestuary.AustralianJournalofEcology22,222-226.
Crinall,S.M.,andHindell,J.S.(2004).AssessingtheuseofsaltmarshflatsbyfishinatemperateAustralianembayment.Estuaries27,728-739.
Davis,T.L.O.(1988).TemporalchangesinthefishfaunaenteringatidalswampsystemintropicalAustralia.EnvironmentalBiologyofFishes21,161-172.
Deegan,L.A.,Hughes,J.E.,andRountree,R.A.(2000).Saltmarshecosystemsupportofmarinetransientspecies.Pp.333-365inConceptsandControversiesinTidalMarshEcologyedbyM.P.Weinsteinetal.SpringerScience&BusinessMedia.
Donaldson,P.,Sharples,C.,andAnders,R.J.(2012).Thetidalcharacteristicsandshallow-marineseagrasssedimentologyofRobbinsPassageandBoullangerBay,farnorthwestTasmania.ReporttoCradleCoastNaturalResourceManagementRegionbytheBlueWrenGroup,SchoolofGeographyandEnvironmentalStudies,UniversityofTasmania,88pp.Availablefordownloadat:www.cradlecoastnrm.com/projects_coasts.html
Gomon,D.M.F.,Bray,D.J.,andKuiter,R.H.(2008).‘FishesofAustralia’ssoutherncoast.’CSIROPublishing.
Hollingsworth,A.,andConnolly,R.M.(2006).Feedingbyfishvisitinginundatedsubtropicalsaltmarsh.JournalofExperimentalMarineBiologyandEcology336,88-89.
Holz,G.K.(2009).SeasonalvariationingroundwaterlevelsandqualityunderintensivelydrainedandgrazedpasturesintheMontagucatchment,N.W.Tasmania.AgriculturalWaterManagement96,255–266.
Jin,B.S.,Fu,C.Z.,Zhong,J.S.,Li,B.Chen,J.K.,andWu.J.H.(2007).FishutilizationofasaltmarshintertidalcreekintheYangtzeRiverestuary,China.Estuarine,CoastalandShelfScience73,844-852.
Kneib,R.T.(1997).Theroleoftidalmarshesintheecologyofestuarinenekton.OceanographyandMarineBiologyAnnualReview35,163-220.

RepairingAustralia’sseascapes–TropWATERReportno.17/122017
Page109
Lyle,J.M.,Stark,K.E.,andTracey,S.R.(2014).2012–13SurveyofRecreationalFishinginTasmania.InstituteforMarineandAntarcticStudies,UniversityofTasmania.
Mazumder,D.,Saintilan,N.,andWilliams,R.J.(2005a).TemporalvariationsinfishcatchusingpopnetsinmangroveandsaltmarshflatsatTowraPoint,NSW,Australia.WetlandsEcologyandManagement13,457-467.
Mazumder,D.,Saintilan,N.,andWilliams,R.J.(2005b).ComparisonsoffishcatchesusingfykenetsandbuoyantpopnetsinavegetatedshallowwatersaltmarshflatatTowraPoint,NSW.Wetlands(Australia)23,37-46.
Mazumder,D.,Saintilan,N.,andWilliams,R.J.(2006a).TrophicrelationshipsbetweenitinerantfishandcrablarvaeinatemperateAustraliansaltmarsh.MarineandFreshwaterResearch57,193-199.
Mazumder,D.,Saintilan,N.,andWilliams,R.J.(2006b).FishassemblagesinthreetidalsaltmarshandmangroveflatsintemperateNSW,Australia:acomparisonbasedonspeciesdiversityandabundance.WetlandsEcologyandManagement14,201-209.
Mazumder,D.,Saintilan,N.,andWilliams,R.(2009).ZooplanktoninputsandoutputsinthesaltmarshatTowraPoint,Australia.WetlandsEcologicalManagement17,225–230.
Mazumder,D.,Saintilan,N.,Williams,R.J.,andSzymczak,R.(2011).Trophicimportanceofatemperateintertidalwetlandtoresidentanditineranttaxa:evidencefrommultiplestableisotopeanalyses.MarineandFreshwaterResearch62,11-19.
Melville,A.J.,andConnolly,R.M.(2003).Spatialanalysisofstableisotopedatatodetermineprimarysourcesofnutritionforfish.Oecologia136,499.
McPhee,J.J.,Platell,M.E.,andSchreider,M.J.(2015).Trophicrelayandpreyswitching–Astomachcontentsandcalorimetricinvestigationofanambassidfishandtheirsaltmarshprey.Estuarine,CoastalandShelfScience167,67-74.
Minello,T.J.,Zimmerman,R.J.,andMedina,R.(1994).Theimportanceofedgefornatantmacrofaunainacreatedsaltmarsh.Wetlands14,184-198.
Morton,R.M.,Pollock,B.R.,andBeumer,J.P.(1987).TheoccurrenceanddietoffishesinatidalinlettoasaltmarshinsouthernMoretonBay,Queensland.AustralianJournalofEcology12,217-237.
Mount,R.E.,Prahalad,V.,Sharples,C.,Tilden,J.,Morrison,B.,Lacey,M.,Ellison,J.,Helman,M.,andNewton,J.(2010).CircularHeadCoastalForeshore
Habitats:SeaLevelRiseVulnerabilityAssessment:FinalProjectReporttoCradleCoastNRM.SchoolofGeographyandEnvironmentalStudies,UniversityofTasmania,Hobart,Tasmania.
Oksanen,J.,Blanchet,G.,Kindt,R.,Minchin,P.R.,Legendre,P.,O’Hara,B.,Simpson,G.L.,Solymos,P.,Stevens,M.H.H.,andWagner,H.(2011).vegan:CommunityEcologyPackage.RpackageVersion2.0-2.Availableat:http://cran.r-project.org/
Platell,M.E.,andFreewater,P.(2009).Importanceofsaltmarshtofishspeciesofalargesouth-easternAustralianestuaryduringaspringtidecycle.MarineandFreshwaterResearch60,936-941.
Prahalad,V.(2014).HumanimpactsandsaltmarshlossintheCircularHeadcoast,north-westTasmania,1952–2006:implicationsformanagement.PacificConservationBiology20,272–285.
Prahalad,V.(2016).CoastalSaltmarshWetlandAssetMapping:TechnicalReport,CradleCoastNRM,Burnie,Tasmania.
Prahalad,V.N.,andKriwoken,L.K.,(2010).ImplementationoftheRamsarConventiononWetlandsinTasmania,Australia.JournalofInternationalWildlifeLaw&Policy13,205–239.

RepairingAustralia’sseascapes–TropWATERReportno.17/122017
Page110
Quinn,G.P.,andKeough,M.J.(2002).Experimentaldesignanddataanalysisforbiologists.Cambridge,UK:CambridgeUniversityPress.
Raposa,K.B.,andTalley,D.M.(2012).Ameta-analysisofnektonresponsestorestorationoftide-restrictedNewEnglandsaltmarshes.In‘TidalMarshRestoration’(pp.97-118).IslandPress/CenterforResourceEconomics.
Richardson,A.M.M.,Swain,R.,andWong,V.(1997).ThecrustaceanandmolluscanfaunaofTasmaniansaltmarshes.PapersandProceedingsoftheRoyalSocietyofTasmania131,21.30.
Roman,C.T.,Raposa,K.B.,Adamowicz,S.C.,James-Pirri,M.J.,andCatena,J.G.(2002).QuantifyingvegetationandnektonresponsetotidalrestorationofaNewEnglandsaltmarsh.RestorationEcology10,450-460.
Saintilan,N.,Hossain,K.,andMazumder,D.(2007).Linkagesbetweenseagrass,mangroveandsaltmarshasfishhabitatintheBotanyBayestuary,NewSouthWales.WetlandsEcologyandManagement15,277-286.
Svensson,C.J.,Hyndes,G.A.,andLavery,P.S.(2007).Foodwebanalysisintwopermanentlyopentemperateestuaries:Consequencesofsaltmarshloss?MarineEnvironmentalResearch64,286–304.
ThreatenedSpeciesScientificCommittee(2013).SubtropicalandTemperateCoastalSaltmarshConservationAdvice.ReporttotheDepartmentofSustainability,Environment,Water,PopulationandCommunities,Canberra.
Thomas,B.E.,andConnolly,R.M.(2001).FishuseofsubtropicalsaltmarshesinQueensland,Australia:relationshipswithvegetation,waterdepthanddistanceontothemarsh.MarineEcologyProgressSeries209,275-288.
Valiela,I.,Cole,M.I.,McClelland,J.,Hauxwell,J.,Cebrian,J.,andJoye,S.B.(2000).Roleofsaltmarshesaspartofcoastallandscapes.Pp.23-38in‘ConceptsandControversiesinTidalMarshEcology’edbyM.P.WeinsteinandD.A.Kreeger.KluwerAcademicPublishers,Dordrecht.
Wegscheidl,C.J.,Sheaves,M.,McLeod,I.M.,Hedge,P.T.,Gillies,C.L.,andCreighton,C.(2017).SustainablemanagementofAustralia’scoastalseascapes:acaseforcollectingandcommunicatingquantitativeevidencetoinformdecision-making.WetlandsEcologyandManagement25,3-22.

RepairingAustralia’sseascapes–TropWATERReportno.17/122017
Page111
CHAPTER 7 - BUILDING A BUSINESS CASE FOR SEASCAPE REPAIR ANDPROTECTION7.1-Seascapes–achecklistoftheirecosystemservices
Keycomponentsofanyecosystemservicesinventoryforseascapesinclude:
ü CommercialandrecreationalfoodvalueAdiversecommunityoffinfish,crustaceansandshellfishuseseascapesforfood,shelter,spawning,nursery areas and refuge from predators. These ecological functions have substantial economicvalue. A large proportion of Australia’s commercial or recreationally caught fish and shellfishspeciesdependonestuariesandcoastalwetlandhabitatatsomepointintheirlifecycles,includingmostprawnspecies,manycrabspecies,andmanyoftherecreationalandcommercialtargetfishspeciessuchasthemullets,flatheads,bream,whiting,barramundiandmangrovejack.
ü Erosioncontrolandstormsurgeprotection Vegetationhelpsshieldtheuplandfromerosionbywavesandcurrents.Inaddition,seascapescanabsorbandmoderatemuchoftheimpactofcoastalstormsurgeandfloods.
ü WaterqualityandquantitymaintenanceAs seascapes slow and retain water, these ecosystems also filter pollutants, sediments andnutrients.Bothnitrogenandphosphorouscanbeabsorbedbyplantsandformpartofthecoastalfood web. Nutrients e.g. phosphorous can also be bound in sediments, and then deposited.Nitrogencanbelostasgas,leachedasnitrateorexportedintheformofanimalorbirdtissue.
ü Carbonsequestrationü Seascapes along with mangroves and seagrasses are collectively known as “blue carbon” and
sequestermorecarbonperhectarethananyterrestrialecosystems.
ü CoastalbiodiversitySeascapesaspartofthecoastalwetlandcontinuumprovidethehabitatforourcoastalbiodiversity.
ü SupportofcoastalfoodwebsCoastal wetlands perform a critical role in uploading terrestrial nutrients to underpin theproductivityofcoastalmarinefoodwebs.
ü Australia’scoastallifestyleSeascapesprovideexceptional sites for access to recreational fishing sites, crabbing in their tidalchannels,andenrichesthevisuallandscapeforpainting,photographyandbirdwatching.
Thesehavebeenlistedinorderfromfullyquantifiableasreadilyaccessibleevenflowmarket-basedvalues[e.g. food value] to event dominated characterised by uneven flows [e.g. erosion and water quality]throughtointangiblenon-marketvalues[e.g.biodiversityandlifestyle].Carbonsequestrationintimemaybecomereadilyquantifiable.ThiswilloccuronceAustraliahasdevelopedandadoptedapolicyframeworkand measurement protocols for assessing and accounting for “blue carbon”. For the more intangiblebenefits economic valuation tools such as stated preference techniques (Hanley et al. 2001) need to beappliedtoprovidesomeestimateof$value.Thisprojecthasasitscentralobjectivetoprovidevaluationinformationforrepairingseascapesthatiswellacceptedindecision-makingframeworksfromseniorpolicymakerthroughtolocalcommunityadvocate.Ifecosystem repair is to overcome social impediments to broadscale adoption, simple, readily understoodmessagesmustdominate.Itfollowsthatonlysimpleeconomicvaluationtoolscanbeapplied.

RepairingAustralia’sseascapes–TropWATERReportno.17/122017
Page112
Asuiteofcriteria tomeet theobjectiveof thevaluationsbeingreadilyacceptedandapplied indecision-makingprocessesinclude:
§ Clear,simpleandreadilyunderstoodcalculationswiththesecalculationsexplicitandwelldocumentedintheanalysistodeterminedollar-value
§ ValuationsthatarewellfoundedandpreferablybasedonAustralia’sexistingmarketeconomy§ Conservativeandgenerallyunder-estimatesofvalue,withonlyselected,usuallysinglebenefit
streamsusedinthevaluationprocess§ Benefitstreamsareaccompaniedbylistsofassumptionsthatclearlydemonstratethatthevalues
areconservative§ Manyotherbenefitsarelistedratherthanvaluedtherebyalsodemonstratingtheconservative
natureoftheresults.Theonlymetric fromthechecklistofecosystemservicesprovidedbyseascapesthatcurrentlymeets thecriteriais“Commercialandrecreationalfoodvalue’,basedontheeconomicworthinthemarketplaceofseafood.Choosingprawnsandpotentialchanges inprawnbiomassasthebasis forvaluationcalculationshasaddedadvantages.Prawnsareannualhighlyfecundstocksthatwillrapidlyexpandinpopulationsizebyexploiting repairedhabitat. Prawnsarealsohighlyvisibleseafoodproducts,generally indemandandwellunderstoodasapotentialbenefitstreamfrompolicymakertocommunityadvocate.
Mangrovesandsaltmarshescanprovideimportantnurseryhabitatforamultitudeofspecies.Photocredit:PaulBoon.7.2 Valuingthebenefitsofrepairtoseascapes
EastCoastTropicalBanana prawns, Fenneropenaeusmerguiensis, use tropical estuaries as nursery grounds. Banana prawnswerechosenasastudyspeciesbecauseBananaprawnsare:
(a)highlyfecundandanannualstockthatwillrecruitrapidlytorepairedenvironments,(b)acommerciallyimportantfoodspecies,(c)importanttargetsofrecreationalfishersthroughoutnorthQueenslandestuaries,

RepairingAustralia’sseascapes–TropWATERReportno.17/122017
Page113
(d)vitalpreyofotherhighprofilecommercial/recreationalspeciessuchasbarramundi,and(e) known toexhibit a randomescape responsewhichmeans that anassumptionofminimalunder-samplingisvalid.
Fisharehighlyvariable inescape-patterns to samplingbymost typesof samplinggears that canprovideaccurateestimatesofdensity.Comparedtofish,bananaprawnsareidealtargets,particularlyforcastnetsampling, a gear type that is particularly suitable for smallmangrove lined estuaries and this gear typeprovides for accuracy in sampling through generally high replication (Johnston& Sheaves 2007). Bananaprawns as a highly valued stock for both commercial and recreational catch also makes them an idealspeciestouseinanybroadestimatesofthebenefitsofseascaperepair.The tropical study and prior work found that estimates of productivity of individual components of theestuarywerehighlyvariableanddependedonanumberofdifficulttovalidateassumptions(Minelloetal.2008, Rönnbäck et al. 1999, Rozas & Minello 2007). Estimates at the whole-of-estuary level at the“seascape” approach in comparison required a relatively low number of assumptions and producedestimates with relatively low variability. The study Sheaves et al. (in review) found as a conservativeestimate amaximum juvenile prawnbiomass of 6.5 g/m2 for the 2mwide band along the estuary edgewhereprawnsarefound.Fortheestuarystudied,withanedgeareaof5.6haand11.5kmtotallength,theconservativetotalbiomassofjuvenilepawnswas0.37tonnes.
Theactualestuaryproductivitywouldbemuchhigherbecausethisestimateonlyrelatestothemaximumjuvenile stock for a sampling occasion and doesn’t take account continual movements of prawns tooffshoreadulthabitatoncetheyreachasufficientsize.TomorepreciselycalculateestuaryproductivityforBanana Prawns information would be needed on patterns of recruitment, growth rates, mortality,predation and emigration. Furthermore, estuaries are notmono-specific and similar informationwouldalsoberequiredforallothercrustaceanandfinfishaswellasthenetprimaryproductivitythatisexportedfromtheestuary.SufficeittosayanestimateofBananaPrawnproductivityof0.37tonnesforanestuaryof11.5kmtotal length isprobablyordersofmagnitudebelowtotalestuaryproductivity. Nevertheless itprovidesabaselineestimatethatcanbeusedtodemonstratethepotentialbenefitsofseascaperepair.
ManystudiesfortheGreatBarrierReefcoasthavecataloguedthedeclineinareasofwetland/seascapes,thelossofconnectivity,thedeteriorationofwaterquality,lossofkeysub-tidalhabitatsuchasseagrasses,the more rapid flow of runoff, the reduced stream flow persistence following rain events and theconstriction of tidal flows (Wegscheidl et a. 2017). All of these changes adversely impact on estuaryproductivity.Thenextphaseofresearchinvestmentmostlikelytoyieldvaluablemanagementorientatedinformationisto couple the multiple GIS-based data sets on Reef coastal wetlands with a suite of best availablepredictions forproductivityopportunities,key fishandcrustaceanspecies. Thiswouldyieldestimatesoftotal likely productivity benefits should investment be available to repair seascapes, especially such asconnectivity. Workedcase studiesofparticularhighprofileopportunities couldbeused to illustrate thecompletesuiteoflikelybenefits.EastCoastSubtropicalSchool Prawns [Metapenaeusmacleayi]was chosen for the east-coast subtropical case study for severalreasons. First, School Prawns are highly reliant on estuarine nursery habitat, and primary productivityderivedfromestuarinehabitatsforrapidgrowththroughtheirearlylifehistorystages.Second,thespeciesis important toboth commercial and recreational fisheries. Third the species is highly fecund, and givenreasonable freshwater inflow to estuaries it is unlikely to experiment stock-related limitations torecruitment. Finally, SchoolPrawn isboth fast growingandanannual species.Notwithstanding the timetakenforanyrepairedhabitattorecover,anyassociatedbenefitsofrepairarelikelytobeevidentinthisspeciesoveraveryshorttimeframe.
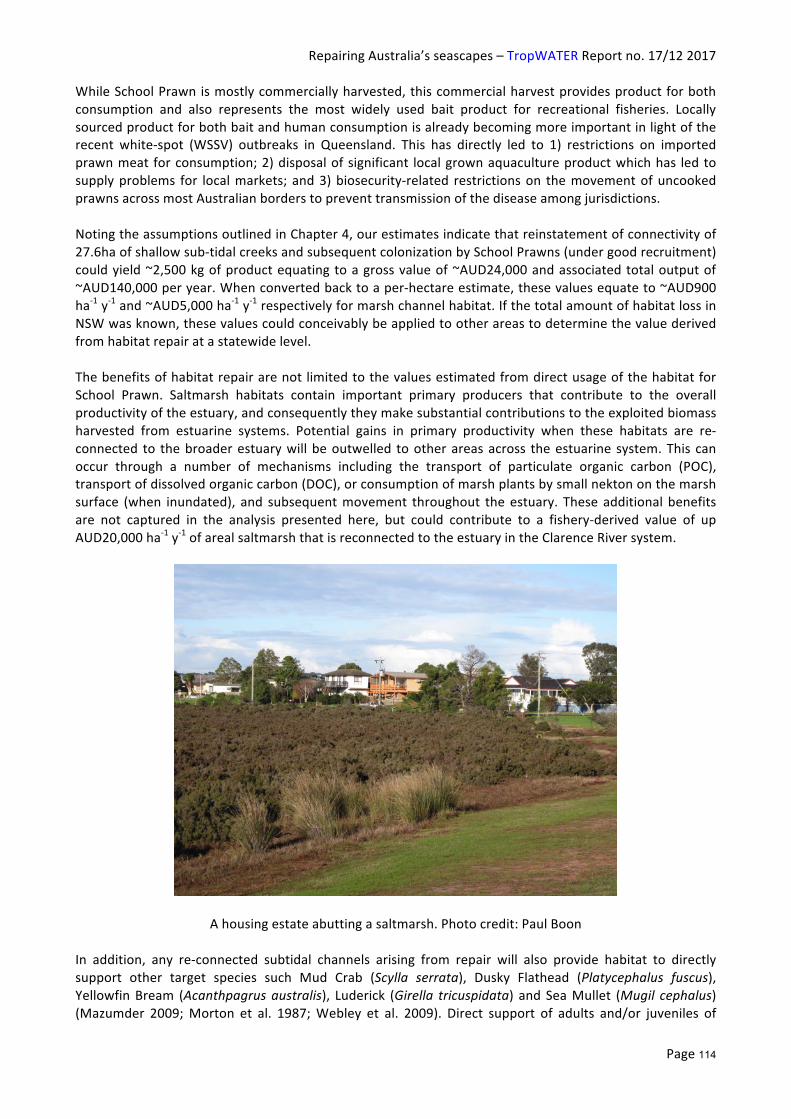
RepairingAustralia’sseascapes–TropWATERReportno.17/122017
Page114
WhileSchoolPrawnismostlycommerciallyharvested,thiscommercialharvestprovidesproductforbothconsumption and also represents the most widely used bait product for recreational fisheries. Locallysourcedproductforbothbaitandhumanconsumptionisalreadybecomingmoreimportantinlightoftherecent white-spot (WSSV) outbreaks in Queensland. This has directly led to 1) restrictions on importedprawnmeat forconsumption;2)disposalofsignificant localgrownaquacultureproductwhichhas ledtosupplyproblems for localmarkets; and3)biosecurity-related restrictionson themovementofuncookedprawnsacrossmostAustralianborderstopreventtransmissionofthediseaseamongjurisdictions.NotingtheassumptionsoutlinedinChapter4,ourestimatesindicatethatreinstatementofconnectivityof27.6haofshallowsub-tidalcreeksandsubsequentcolonizationbySchoolPrawns(undergoodrecruitment)couldyield~2,500kgofproductequatingtoagrossvalueof~AUD24,000andassociatedtotaloutputof~AUD140,000peryear.Whenconvertedbacktoaper-hectareestimate,thesevaluesequateto~AUD900ha-1y-1and~AUD5,000ha-1y-1respectivelyformarshchannelhabitat.IfthetotalamountofhabitatlossinNSWwasknown,thesevaluescouldconceivablybeappliedtootherareastodeterminethevaluederivedfromhabitatrepairatastatewidelevel.ThebenefitsofhabitatrepairarenotlimitedtothevaluesestimatedfromdirectusageofthehabitatforSchool Prawn. Saltmarsh habitats contain important primary producers that contribute to the overallproductivityoftheestuary,andconsequentlytheymakesubstantialcontributionstotheexploitedbiomassharvested from estuarine systems. Potential gains in primary productivity when these habitats are re-connected to thebroaderestuarywillbeoutwelled tootherareasacross theestuarine system.This canoccur through a number of mechanisms including the transport of particulate organic carbon (POC),transportofdissolvedorganiccarbon(DOC),orconsumptionofmarshplantsbysmallnektononthemarshsurface (when inundated), and subsequentmovement throughout theestuary. Theseadditional benefitsare not captured in the analysis presented here, but could contribute to a fishery-derived value of upAUD20,000ha-1y-1ofarealsaltmarshthatisreconnectedtotheestuaryintheClarenceRiversystem.
Ahousingestateabuttingasaltmarsh.Photocredit:PaulBoonIn addition, any re-connected subtidal channels arising from repair will also provide habitat to directlysupport other target species such Mud Crab (Scylla serrata), Dusky Flathead (Platycephalus fuscus),YellowfinBream (Acanthpagrusaustralis), Luderick (Girella tricuspidata) andSeaMullet (Mugil cephalus)(Mazumder 2009;Morton et al. 1987;Webley et al. 2009). Direct support of adults and/or juveniles of
RepairingAustralia’sseascapes–TropWATERReportno.17/122017
Page115
theseexploitedspecieswillproduce fisherybenefits thatcontributeadditionalvalue fromhabitat repair.Boththesefactorswillseeflowonbenefitsforrecreationalandcommercialfisheriesalike.Thenextphaseinscienceenquirytosupportmarinebiodiversityrepairwillbetotaketheseestimatesoflikely productivity benefit and apply it to the entire Clarence estuary. Building a visionary scenario forestuaryrepairthatcouldmaximizecommunitybenefitrequiresthebiological informationfromthisstudytobecoupledwithcompanioninvestigationsoffloodmanagement,catchmenthydrology,afullassessmentof economic costs and benefits, engineering works and an understanding of social feasibility. Anopportunityexiststodevelopafullmulti-disciplinaryprogramofscienceenquirycloselylinkedtoandwiththesupportofkeymanagementagenciesandbeneficiaries.
EastCoastTemperateSaltmarshesoftheCircularHeadregionofnorth-westTasmaniawerefoundtosupport11fishspecieswithahighmeandensityof>72 fishper100m-2 (sampledata fromApril-May2017).The familyAtherinidaecontributed 3 species and 74% of the total catch numbers, of which Atherinosoma microstoma andLeptatherinapresbyteroidesweremostabundant(57%and16%respectively).TwomembersofthefamilyGobiidae,Pseudogobiussp.andNesogobiusmaccullochi,contributed3%and2%tonumbersrespectively.Commercial and recreational species that utilize these saltmarshes in north-west Tasmanian seascapesinclude:Aldrichetta forsteri (yellow-eyemullet),Arripis truttaceuos (Australiansalmon)andRhombosoleatapirina(greenbackflounder).Thesethreespeciescontributedcloseto20%ofthetotalcatchnumbers.OftheseA.forsteriwasmostabundantandcommon,presentin24(65%)ofthe37netsthatcaughtfishandmadeup19%ofthetotalcatch.Extendedsamplingthroughouttheyearmayrevealfurtherspeciesusingsaltmarshes.A.forsteri,A.truttaceuosandR.tapirinaareamongthesevenkeyspeciestargetedbyrecreationalfishersinTasmania(Lyleetal.2014).Notably,A.forsteriandA.truttaceuoshelpunderpinrecreationalfisheriesinthenorth-west regionof Tasmania,withby far the greatestproportionofmullets and salmon (74%and23%of recreational catch in2012-13)being caught from this region (Lyleet al. 2014). In thenorth-westregion, recreational fishing effort is almost entirely (93%) by local residents, withA. truttaceuos andA.forsteribeingthesecondandthirdmostcaughtafterflathead(Platycephalidae)species(Lyleetal.2014).Fishes of the family Atherinidae and Gobiidae are not targeted directly by commercial and recreationalfishersinTasmania.Theyprovideanabundantfoodsourceforotherpiscivorousfishthataretargetedbycommercial and recreational fishers (cf.Mazumder et al. 2011).Most importantly, these are part of thesuiteofspeciesthatcontributetooverallmarinebiodiversityandproductivity.Theseseascapescontributemore broadly to the marine food web via export of plant and animal matter to coastal waters, thusimprovingseascapefisheriesproductivity(MelvilleandConnolly2003;Svenssonetal.2007).Constructionoffoodwebsencompassingallaspectsofseascapeproductivity–e.g.carbon,diatoms,phytoplankton,fish,crustaceans, insects,birdsandmammalswouldproveausefulway todemonstrate themultiplebenefitsthecommunityenjoysfromhealthyseascapes.Thepriorityformanagementinnorth-westTasmaniaandothersimilarlocalesisprimarilytheprotectionofexistingsaltmarshesandtheirtidalconnectivity,bothforunalteredandalteredsiteswithbreachedlevees.About629ha(55%ofcurrentextent)ofsaltmarshintheCircularHeadcoastisaffectedbyimpairedtidalflows (Prahalad 2014) and can benefit from on ground works (e.g. levee breaching) aimed at tidalrestoration.Samplestakenfromsaltmarshesheavilyalteredduetoleveesindicatesimilarfishassemblagestonearbyunalteredmarshes,indicatingthattidalrestorationislikelytoreturnimmediatebenefitsforfishusethroughexpandedhabitatandfoodresource(cf.Romanetal.2002;RaposaandTalley2012).Table1illustratesthepotentialbenefitsfor justonespecies,A.forsteriof improvedprotectionandmanagementjustinthiscasestudyarea:

RepairingAustralia’sseascapes–TropWATERReportno.17/122017
Page116
Table1:BenefitsofseascaperestorationtoA.forsteri
EstimateoftotalCircularHeadcoastsaltmarshareathatcanbenefit fromtidalrestorationandsaltmarshrehabilitation
629ha
EstimateoffishdensityofA.forsteriper100m-2averagedacrossthestudysites
13.6fish
EstimatedgaininA.forsteriwithtidalrestorationof100hasaltmarsharea 136,000fish
ThenextphaseofscienceenquiryforthesetemperatesystemsissimilartothatforsubtropicalAustralia–to undertake management orientated investigations that clearly identify both protection and repairopportunities.FoodwebsthatillustratetheoveralllikelycommunitybenefitwillplayakeyroleinfosteringimprovedcommunityandagencyunderstandingandhopefullyinvestmentinsecuringanenhancedfutureforTasmania’scoastalmarinebiodiversity.7.3Aframeworkforinformingfutureinvestmentinseascaperepairandlearning
While acknowledging a suite of ecosystem services associated with repair, this report has emphasizedbenefitsstemmingfromincreasedharvestforhumanconsumptionofasubsetofspecies.Ifthesebenefitsare estimated to be greater than the costs of implementation, then a prospective repair project has abenefit-costratioofatleast1.Ourbiologicalunderstandingofthemagnitudeofstockincreaseassociatedwithanyspecifiedrepairactionremainsrudimentary.Predictingthepayoffofinvestmentinrepairprojectsisclearlydifficult(seechapter2).Butriskanduncertaintyareubiquitousfeaturesofmanykindsofinvestment.Delayingadecisionuntiluncertainty is more or less entirely resolved carries the cost of foregone benefits. It also ignores thebenefitsof learningviaimplementationthroughadaptivemanagement(Walters1986).Hereweoutlineadecisionsupportframeworkforconsideringinvestmentinrepairunderuncertainty.Aprimarysourceofuncertaintyisthesizeoftheincreaseinyieldorquotaarepairprojectmightbring.Forexample,inchapter4thekeyuncertainvariablewasrecruitmentsubsidyassociatedwithrestorationofadiscreteareaofhabitatwithin theClarenceRiverestuary,and its implications forSchoolPrawnbiomassandharvest.Assumethatweareconsideringrepairforthreehypotheticalcandidatesites,A,BandC,allofwhicharemotivatedprimarilybyan increase inprawnabundanceandavailability. Althoughwemaynotknowthetruemagnitudeof the recruitment subsidy,wecanuseexpert judgment toestimate theprobabilityofadiscretesetofpossibilitiesandestimateassociatedimprovementsinquotas(Table2).ConsideringasinglecandidateprojectConsideringSiteAfirst,therisk-neutralapproachistocalculatetheexpectedbenefitusingtheprobabilityweighteddifferencebetweenestimateswithandwithoutrepair:0.25×(250–100)+0.50×(700-300)+0.25×(950–400)=375kg/yr.Thatis,ourrisk-neutralestimateofthepay-offforrepairatSiteAisanadditionalharvestof375kg/yr,onaverage.
RepairingAustralia’sseascapes–TropWATERReportno.17/122017
Page117
Table2.Estimatedannualharvestquotas(kgperyear)forthreehypotheticalcandidaterepairsites.
withrepair
withoutrepair
pessimistic bestestimate optimistic
pessimistic bestestimate optimistic
p=0.25 p=0.50 p=0.25
p=0.25 p=0.50 p=0.25siteA 250 700 950
100 300 400
siteB 400 900 1200
200 550 700siteC 200 600 800 150 400 500
Nowifthemarketpriceforprawnsis$10perkg,wecanestimatethepresentvalue,PV,ofthebenefit,!" = !
! . 1 − !!!! ! ,
whereA is theannualbenefit, r is thediscount rate andh is the timehorizon (in years) overwhich therepairproject is tobeassessed. ForA =$3,750, r =4%or0.04, andh =30years,PV =$64,845. If the(discounted)costsofimplementingtheprojectarelessthan$64,845thentherisk-neutraldecision-makerwillproceedwithimplementation,knowingthattheexpectedratioofbenefittocostexceeds1.Ofcourse,notalldecision-makersarerisk-neutral.Shouldthepessimisticscenarioplayout,alowerboundonthepresentvalueofthe(250–100)=150kg/yrbenefitisjust$25,938.Fortheoptimisticestimates,theupperboundonpresentvalueis$95,106.Sodependingonriskattitude,adecision-makermaybepreparedtoincurprojectcostsuptoAUD$25,938fortherisk-averse,$64,845forthosethatarerisk-neutral,and$95,106forthosethatarerisk-seeking.Iftheactualcostsareestimatedtobebelowthebreak-evenpointfortherisk-averse,theprojectisclearlyworthundertaking.Ifcostsareabovethebreak-evenpointfortherisk-seeking,theprojectisclearlynon-viable.Ifcostsareintheinterval[$25938,$95106]thedecision-makerneedstoconsidertheirattitudetorisk. In addition, the prospects for transferring learning outcomes to other speculative projects andinvestmentsmaybeverymuchworthconsidering,asweoutlinebelow.Consideringmultiplecandidateprojects.PrioritizationwhenwehavenointerestinlearningReturning now to the full set of three candidate sites, A- C, forwhich (uncertain) benefits are shown inTable 2. After applying the calculations shown above to Sites B and C we report best estimates andplausibleboundsforthepresentvalueofthebenefitofrepairateachofthethreesitesinTable3.Table3.Bestestimatesandplausibleboundsforthepresentvalueofbenefitsforeachofthreecandidaterepairprojects.
Presentvalueofbenefit siteA siteB siteClowerbound $25938 $34584 $8646bestestimate $64845 $60522 $32423upperbound $95106 $86460 $51876

RepairingAustralia’sseascapes–TropWATERReportno.17/122017
Page118
The estimated costs of repair are shown in Table 4 below. Up-front costs include capital works andcompensatorypaymentstolandholdersforinundationofotherwiseproductiveland,amongotherpossibleimpacts.Ongoingcostsaretobeincurredformaintenance.Usingthesameformulaaboveforcalculatingthepresent valueofmaintenance costs (againwith a 30 year timehorizon and a 4%discount rate),weobtaintotalcostsforeachcandidateproject.
Table4.Costsforeachofthreecandidaterepairprojects.
siteA siteB siteCcostsofcapitalworks $8,000 $7,000 $10,000costsoflandholdercompensation $10,000 $25,000 $20,000annualcostofongoingmaintenance $1,500 $500 $1,000Presentvalueoftotalcosts $43,938 $40,646 $47,292
There are now two ways to summarise the merit of the candidate projects. In Table 5 we report netmonetary value (the present value of benefits – the present value of costs). In Figure 1 we graph thebenefittocostratio.Table5.Netmonetaryvalue(presentvalueofbenefits–presentvalueofcosts)forthreecandidaterepairprojects.
netmonetaryvalue siteA siteB siteClowerbound -$18,000 -$6,062 -$38,646bestestimate $20,907 $19,876 -$14,869upperbound $51,168 $45,814 $4,584
Figure1.Benefit-costratiosofthethreecandidaterepairprojects,withplausiblebounds.

RepairingAustralia’sseascapes–TropWATERReportno.17/122017
Page119
The risk-neutral decisionmaker focussesonbest estimates. Risk-aversedecision-makers focuson lowerbounds,andriskseekersonupperbounds.ThepriorityorderofthethreeprojectsdependsonriskattitudewhereBis(weakly)preferredtoA,andCisnon-viableifyouarerisk-neutral;Ais(weakly)preferredtoB,andBispreferredtoCifyouareriskseeking;andnoneoftheprojectsmayappealifyouarerisk-averse,withBbeingthebestofabadlot!PrioritizationwhenweareabletolearnFigure1 shows the lowerbounds forall three sitesarebelow1 (orequivalentlyall lowerboundsofnetmonetaryvalue shown inTable5arenegative), so themost risk-averseofdecision-makers isunlikely toprogress implementationof anyof the three candidateprojects. But this outlook ignores thepotentialgainstobemadethroughlearningaboutthetruepay-offofrepairviaimplementationandmonitoringofoutcomes.Theinformationmightleadtomoreastuteinvestmentsinfuture.Whatistheexpectedvalueofinformation?InTable6weshowforSiteAthenetmonetaryvalue(presentvalueofbenefits–presentvalueofcosts) forthechoicebetweendonothingand implementationundereachuncertainstateforrecruitmentsubsidy.Table6Pay-offofdonothingversusimplementationforcandidateprojectAundereachuncertainstate. Recruitmentsubsidy
decision pessimisticp=0.25
bestestimatep=0.50
optimisticP=0.25
donothing $0 $0 $0implement -$18,000 $25,230 $51,168
Ifweknewforcertaintherecruitmentsubsidywaslow,consistentwiththepessimisticestimate,wewoulddonothingratherthanincuran$18,000loss. Ifweknewtherecruitmentsubsidywasnot low,wewouldproceedwith implementation. Ifwe had perfect information the pay-offwould be zero, or $25,230, or$51,168.NowtheexpectedvaluewithperfectinformationisEV|PI=0.25×$0+0.50×$25,230+0.25×$51,168=$25,407.Theexpectedvalueofthetwooptionsunderuncertaintyis:EV|U=0.25×$0+0.50×$0+0.25×$0=$0,fordonothing,andEV|U=0.25×-$18,000+0.50×$25,230+0.25×$51,168=$20,907,forimplementation.Ifwehavetomakeadecisionunderuncertainty(andarerisk-neutral)wewouldoptforimplementation.Nowtheexpectedvalueofperfectinformationisthedifferencebetweenthesetwoquantities(Prattetal.1995).Thatis,EVPI=EV|PI-maxEV|UEVPI=$25,407-$20,907=$4,500.So ifwewereabletopaysomeonetotelluswhatthetruerecruitmentsubsidywastogoingtobe ifwewere to implement repair at SiteA thena fair price for that servicewouldbe$4,500.Of course, suchaservice in (credible!) clairvoyance is unavailable. Wewouldhave to implement theproject andmonitoroutcomes.Buthaving implementedtheproject, theoutcomesofmonitoringareuninformativeatSiteA.ThebenefitsoflearningarerealizedifthoseinsightsaretransportabletoSitesBandC.

RepairingAustralia’sseascapes–TropWATERReportno.17/122017
Page120
ResultsoftheequivalentcalculationofEVPIforsitesBandCareshowninFigure2,togetherwithSiteA.Assuming monitoring outcomes are transportable, an upper bound on the learning benefit ofimplementationatSiteAisthesumofEVPIforsitesBandC.Thatisifweimplementat,SiteA,thereisa$1,515+$1,146=$2,661learningbenefitforSitesBandC,andatSiteB,thereisa$4,500+$1,146=$5,646learningbenefitforSitesAandC,andatSiteC,thereisa$4,500+$1,515=$6,015learningbenefitforSitesBandC.Ofcoursewewouldalsoneedtoconsiderthecostsoflearningviamonitoring.Nevertheless,lookingattheoutcomes inFigures1and2wearenowinamuchbetterpositiontochooseaprojectthat (a)hasgoodprospects for outcomes at the site of implementation, and (b) enables an improved basis for futuredecisionsatothercandidatesites.SiteAlookslikeagoodbetforimmediateimplementationifweareonlyinterested in outcomes at Site A, but it has only modest learning benefits, with a combined value ofinformationof$2,661forimprovedpost-learningdecision-makingatSitesBandC.TheoppositeistrueforSiteC.ImplementationatSiteBbestsatisfiesourtwoobjectives–therearestrongprospectsforpositiveoutcomesatSiteBandsolidlearninginsightstobegainedforsubsequentdecision-makingatSitesAandC.
Figure2.Expectedvalueofperfectinformationforeachofthethreecandidateprojects.The frameworkoutlinedhere showshow tomakeeffective restorationdecisionsdespiteuncertainty. Itcan be readily extended to include continuous probabilistic judgments and additional sources ofuncertainty, including for example, the rate and intensity of climate change (IPCC 2014). We note thatexpertjudgmentneednotbeacriticalbottleneck.Therearesimpleandaccessibleprotocolsavailableforelicitingthekindsofjudgmentsusedinourhypotheticalexamplehere(Burgmanetal.2011).Theframeworkarguesagainstuseofuncertaintyasanexcuseforprocrastination.Itemphasizesthatevenwhereuncertaintymakes the stand-alonemeritof a candidate repairprojectunclear, thebenefits tobegained from learning through implementation and subsequent monitoring may make implementationworthwhile.Intheearlystagesofarepairandrestorationenterprise,wheretherearemanycandidatesitesforrepair,therewillbemanyhighlyspeculativeinvestmentsbutmanyopportunitiesforderivingbenefitsthrough learning.As implementationprogresses anduncertainty is reduced, the list of viable candidates
$-
$1,000
$2,000
$3,000
$4,000
$5,000
siteA siteB siteC
expe
cted
value
ofp
erfectinform
ation

RepairingAustralia’sseascapes–TropWATERReportno.17/122017
Page121
should become progressively smaller and their site-specific benefits (and costs) appreciated with muchgreaterclarity.

RepairingAustralia’sseascapes–TropWATERReportno.17/122017
Page122
ConcludingCommentsThe three case studies have demonstrated the substantial benefits to accrue from seascape protection,managementandwherepossible,repair.Whileonlyindicatorspecieswereused,thebenefitsaremultiple.Equally importantly, evenwith just the value of the indicator species such as school prawns is used theeconomicargumentiscompelling–withthevalueofschoolprawnsexceedingcurrentlandvaluesforthecasestudysiteofthelowerClarence.Under the Environmental Protection and Biodiversity Conservation Act (EPBC Act) subtropical andtemperatecoastalsaltmarsheswerelistedasvulnerablein2013andthataRecoveryPlanisrequired.ThefollowingsuggestionsbuildonthisneedandmayassistindefiningthescopeandcontentoftheproposedRecoveryPlan.Firstly, this project has demonstrated the likely dual biodiversity and economic benefits of repair.Mostimportantly this brings into play another key user group additional to conservation groups and agenciesthatwillsupportandinsomeinstances,maybeabletoprovideresourcesforrepair.Moststateshaveinplaceoraremovingtoputinplacepoliciesandprocedurestoallocatefundstorepairhabitat.Forexample,WA,NSWandVicalreadyprovideviatheirrecreationalfishinglicenseprogramsguaranteedfundsavailableoff consolidated revenue. These opportunities for multi-beneficiary outcomes would strength anyimplementationactivitiesfortheRecoveryPlan.Recognising that saltmarsh systems are also listed under NSW legislation as endangered and thatrecreationalfisheriesgroupsinNSWareveryactiveinadvocatinghabitatrepair,intheformulationoftheRecoveryPlanNSWmaybethehighestpriorityforrepair.ProbablythebestestuarytoinitiatesuchworkwouldbetheClarence.TheClarenceisthelargestestuaryinNSW,wasthesubjectofthisresearchsothefactsandfiguresareavailable,andhasveryactivecommercialfishingandrecreationalfishinggroups.TheClarence is also bounded by large areas of National Park, Bundulung and Yuragir, both of which wouldbenefit by extension into repaired estuary environments. As a signature species that will benefit fromrepair, the school prawn is alsowell recognised as synonymouswith theClarenceEstuary. TheClarenceEstuary is the biggest and most productive estuary in NSW and worthy of detailed multi-disciplinaryresearch across ecology, hydrology, flood management, economics and social issues to develop a draftblueprint for repair at the whole-of-estuary scale. Such a proactive multi-disciplinary research projectwouldboth inform theRecoveryPlanandextend theoutputsof researchunder theMarineBiodiversityHubintotheoutcomesofsecuringlong-termenhancedestuarybiodiversity.TheEPBClistingandproposedRecoveryPlandoesnotextendtotropicalenvironmentssuchastheGreatBarrier Reef catchments. Parallel processes for coastal tropical landscapes of the Great Barrier Reef areunderwayviatheReefPlan2050.ReefPlan2050alreadycallsfortherepairwherepossibleofthesecoastalmarineseascapes.ThenexttaskforGreatBarrierReefseascapesistobringtogetherthemultiplelayersofGIS-basedmappingoncoastalseascapesanddeterminewhichsubsetofthesearethemostprospectiveforrepair.ThethirdcasestudyareaforthisprojectwastemperatesystemsinTasmania.ThefirsttaskforrestoringTasmaniantemperateseascapesismostprobablylegislative-togainformalrecognitionandprotectionofexisting remnants. In parallel, especially for areas such as the case study, repair works could startimmediately, benefitting coastal marine biodiversity at no cost to other land uses. Building into theRecoveryPlansupportforcompanionlegislationinbothTasmaniaandVictoriaisrecommended.Much of the repair activities are simple from a works perspective – generally removing small bunds toreinstatetidalconnectivity.Theserepairactivitiesarealsoinexpensive.Futureworkneedstobuildontheprioritizationframeworkoutlinedheretoidentifythebestsitesforimmediateinvestment,andthosethatofferthebestprospectsforlearning.

RepairingAustralia’sseascapes–TropWATERReportno.17/122017
Page123
Togetherwithgreaterclarityandrigorinidentificationofsuitablerepairsites,akeychallengeinfosteringenhanced coastal marine biodiversity will be to address the social issues, to build communityunderstanding of the opportunities to optimize benefits from their coastal landscapes and to overcomeresistancetochange.

RepairingAustralia’sseascapes–TropWATERReportno.17/122017
Page124
7.4References
Burgman.M.,Carr,A.,Godden.L.,Gregory,R.,McBride,M.,Flander,L.andMaguire,L.(2011).Redefining
expertiseandimprovingecologicaljudgment.ConservationLetters4:81–87.
Hanley,N.,Mourato,S.andWright,R.E.(2001).Choicemodellingapproaches:asuperioralternativeforenvironmentalvaluation?,JournalofEconomicSurveys15,435-462.
IPCC(2014).ClimateChange2014SynthesisReportSummaryChapterforPolicymakers.Ipcc:31
JohnstonR,SheavesM(2007)Smallfishandcrustaceansdemonstrateapreferenceforparticularsmall-scalehabitatswhenmangroveforestsarenotaccessible.JournalofExperimentalMarineBiologyandEcology353:164-179
Lyle,J.M.,Stark,K.E.,andTracey,S.R.(2014).2012–13SurveyofRecreationalFishinginTasmania.InstituteforMarineandAntarcticStudies,UniversityofTasmania.
Mazumder,D.2009.Ecologyofburrowingcrabsintemperatesaltmarshofsouth-eastAustralia.InSaltmarshEcology,ed.N.Saintilan,115-131.Melbourne,Australia:CSIROPublishing.
Mazumder,D.,N.Saintilan,R.J.Williams,andR.Szymczak.2011.Trophicimportanceofatemperateintertidalwetlandtoresidentanditineranttaxa:evidencefrommultiplestableisotopeanalyses.MarineandFreshwaterResearch62:11-19.
Melville,A.J.,andR.M.Connolly.2003.Spatialanalysisofstableisotopedatatodetermineprimarysourcesofnutritionforfish.Oecologia136:499-507.
Morton,R.M.,B.R.Pollock,andJ.P.Beumer.1987.TheoccurrenceanddietoffishesinatidalinlettoasaltmarshinsouthernMoretonBay,Queensland.AustralianJournalofEcology12:217-237.
MinelloTJ,MatthewsGA,CaldwellPA,RozasLP(2008)PopulationandproductionestimatesfordecapodcrustaceansinwetlandsofGalvestonBay,Texas.TransactionsoftheAmericanFisheriesSociety137:129-146
Prahalad,V.(2014).HumanimpactsandsaltmarshlossintheCircularHeadcoast,north-westTasmania,1952–2006:implicationsformanagement.PacificConservationBiology20,272–285.
Pratt,J.W.,Raiffa,H.andSchlaifer,R.(1995).Introductiontostatisticaldecisiontheory.TheMITPress,Cambridge.
Raposa,K.B.,andTalley,D.M.(2012).Ameta-analysisofnektonresponsestorestorationoftide-restrictedNewEnglandsaltmarshes.In‘TidalMarshRestoration’(pp.97-118).IslandPress/CenterforResourceEconomics.
Roman,C.T.,Raposa,K.B.,Adamowicz,S.C.,James-Pirri,M.J.,andCatena,J.G.(2002).QuantifyingvegetationandnektonresponsetotidalrestorationofaNewEnglandsaltmarsh.RestorationEcology10,450-460.
RönnbäckP,TroellM,KautskyN,PrimaveraJH(1999)DistributionpatternofshrimpandfishamongAvicenniaandRhizophoramicrohabitatsinthePagbilaomangroves,Philippines.Estuarine,CoastalandShelfScience48:223-234
RozasLP,MinelloTJ(2011)Variationinpenaeidshrimpgrowthratesalonganestuarinesalinitygradient:implicationsformanagingriverdiversions.JournalofExperimentalMarineBiologyandEcology397:196-207
Svensson,C.J.,Hyndes,G.A.,andLavery,P.S.(2007).Foodwebanalysisintwopermanentlyopentemperateestuaries:Consequencesofsaltmarshloss?MarineEnvironmentalResearch64,286–304.
Walters,C.(1986).Adaptivemanagementofrenewableresources.MacMillanPublishingCompany,NewYork.

RepairingAustralia’sseascapes–TropWATERReportno.17/122017
Page125
Walters,C.(1986).Adaptivemanagementofrenewableresources.MacMillanPublishingCompany,NewYork.
Webley,J.A.,R.M.Connolly,andR.A.Young.2009.Habitatselectivityofmegalopaeandjuvenilemudcrabs(Scyllaserrata):implicationsforrecruitmentmechanism.MarineBiology156:891.
WegscheidlC,SheavesM,McLeodI,HedgeP,GilliesC,CreightonC(2017)SustainablemanagementofAustralia’scoastalseascapes:acaseforcollectingandcommunicatingquantitativeevidencetofostersustainablecoastaldevelopment.WetlandsEcologyandManagement25:3.22

www.nespmarine.edu.au
Contact: Ian McLeod
Centre for Tropical Water & Aquatic Ecosystem Research (TropWATER)
James Cook University
Address | TropWATER
ATSIP Building 145 James Cook University Townsville QLD 4811
email | [email protected]