rental assistance and project development: a cost benefit...
TRANSCRIPT

Discussion Paper
Rental Assistance and Project Development:
A Cost Benefit Analysis
Jacqueline Taylor
Graduate Student
University of Minnesota,
Humphrey School of Public Affairs
October 2011

Table of Contents
Executive Summary ....................................................................................................................... 1
Introduction .................................................................................................................................... 2
Federal Policy & Programs ................................................................................................ 3
State Policy & Programs .................................................................................................... 4
Minnesota Policy & Programs ........................................................................................... 5
Figure 1: Comparative Tenant-Based Program Statistics ................................... 5
Figure 2: Family Type by Tenant-Based Program................................................. 6
Economic Sustainability ................................................................................................................ 7
Figure 3: Length of Tenant-Based Voucher by Program ...................................... 8
Costs and Benefits ......................................................................................................................... 9
Market Forces .................................................................................................................... 9
Social Factors ................................................................................................................... 10
Subsidy Case Studies .................................................................................................................. 13
Illustrative Analysis ...................................................................................................................... 15
Methodology ..................................................................................................................... 15
Data Collection ................................................................................................................. 16
Graph Navigation ............................................................................................................. 17
Limitations ........................................................................................................................ 18
Conclusions ...................................................................................................................... 20
Projection Graphs ............................................................................................................ 21

1
Executive Summary
This discussion paper analyzes long-run costs and benefits of tenant-based rental
assistance vouchers and project-based subsidies for developers of affordable and
supportive housing. Over the past half-century federal funding has shifted between these
two forms of assistance; both methods provide advantages and disadvantages for providers,
recipients, and neighborhoods. As the number of cost-burdened renters continues to
increase nationwide, states are increasingly creating and reconfiguring programs to assist
as many extremely low-income tenants as possible. Beyond federal funding, states too must
analyze the allocation of funds between tenant-based and project-based assistance,
keeping long term economic sustainability and social concerns in mind.
This paper (1) provides an overview of federal, state, and Minnesota specific housing
policies and programs, (2) compares the differences between short-run and long-run
assistance, (3) analyzes the advantages and disadvantages for each form of assistance
paying careful attention to market forces and social factors, (4) provides methodologies of
comparative case studies, and (5) presents an illustrative analysis of Minnesota Housing’s
tenant-based voucher programs and project-based developments.
The illustrative analysis projects over 30 years rental assistance will remain less
expensive than project development (using operating subsidies), with the exception of
rehabilitation units for singles’ units. However, developments relying solely on capital costs
and using no operating subsidies will be more cost effective than rental assistance in the
long-run, especially if amortizing debt is used. An analysis of Minnesota Housing’s costs
finds that funding spent on project development assistance is less expensive than rental
assistance programs after 10 to 20 years.
The illustrative analysis focuses solely on long-run economics, but it is important to
consider social influences throughout the cost-benefit approach. Beyond initial cost
effectiveness, the advantages of rental assistance include tenant choice, household
mobility, and the potential for economic integration. The advantages of project development
focus on community revitalization and the need for unique products, such as mixed-income
apartment buildings. The creation of new housing units in order to stabilize vacancy rates
and fair market rent is also an important advantage of project development.

2
Introduction
Approximately 64 percent of Minnesota’s low-income renter households are cost-
burdened, spending more than 30 percent of their income on housing.1 As the number of
cost-burdened households increase and federal resources are tightened, state and local
jurisdictions must help provide assistance for these families.
The State of Minnesota has developed eight rental assistance programs to help close
the affordability gap between market rents and what low-income renters can afford. This
report will focus on Minnesota Housing Finance Agency’s Bridges and Housing Trust Fund
rental assistance programs, which assisted a total of 2,770 households in 2010. Like most
state programs, rental assistance is meant to support tenants until they receive federal
assistance. However, federal waiting lists range from one to eight years long, few new
vouchers have been produced, and the affordability gap continues to increase. As a result,
state rental assistance programs have increasingly filled this gap by creating program
extensions for households that remain on federal waiting lists. With the sustainability of
rental assistance programs in question, many states have begun to discuss advantages and
disadvantages of project-based assistance and tenant-based assistance.
Project-based assistance supports private and non-profit affordable and mixed-
income housing developments. Developers receive capital financing to build new projects or
rehabilitate existing buildings. Additionally, developments may receive operating subsidies
in addition to up-front capital in order to maintain a positive cash flow. Projects that qualify
for operating subsidies are supportive housing developments, which may include units
reserved for the long-term homeless.2 On a per unit basis, projects can include deep
subsidies, in which the rent is set to 30 percent of the tenant’s income, and shallow
assistance, in which rent is set so that it is affordable to a low-income household.3
On the other hand, tenant-based subsidies, oftentimes called demand subsidies or
vouchers, are attached to a household instead of a physical unit. Vouchers utilize the
existing supply of private market stock by allowing tenants to choose housing within a
jurisdiction. The vouchers are typically funded through federal or state agencies and
dispersed by local Public Housing Authorities, Housing and Redevelopment Authorities, or
non-profit agencies. Tenant-based rental assistance is often set so that paid rent is 30
percent of the tenant’s income.
An ongoing affordable housing debate weighs the advantages and disadvantages of
project-based assistance and tenant-based subsidies. In the short run, tenant-based
subsidies are less expensive and serve a greater number of households. However, a
thorough assessment examines the economic and social costs and benefits of each method
1 MN Housing, Environmental Scan, July 2011, 16. 2 Rents of these units would otherwise not be able to support operations of the building. Other sources of funding have been explored, but
are insufficient to meet operational costs for the developer. 3 Massachusetts Legal Dictionary, Types of Housing Programs, August 28, 2011. http://www.masslegalhelp.org/housing/multi-family-
subsidized-housing, accessed August 24, 2011.
3
in the long run. This report will provide a long-run analysis of Minnesota Housing’s Bridges
and Housing Trust Fund rental assistance programs versus project funded development.
Federal Policy & Programs
The Department of Housing and Urban Development (HUD) has revised its rental
housing policy, shifting funds from supply-side programs to demand-side programs.
Throughout the mid-20th century, cities focused on producing public housing. By the 1970s,
federal policy focused on subsidizing affordable private housing developments through
Section 8 New Construction and Substantial Rehabilitation program. In 1983, under the
Reagan administration, new construction was halted, with the exception of replacement
units. Supply-side subsidies then focused solely on Section 202 housing production for the
elderly, Section 811 housing production for the disabled, Section 521 for rural residents,
and HOPE VI. Funding also shifted to demand-side subsidies and money was reserved for
tenant-based vouchers. The Tax Reform Act of 1986 reintroduced production subsidies into
the marketplace by creating the Low Income Housing Tax Credit program.4
Demand-side subsidies take the form of tenant-based vouchers which were first
established in 1983 as Section 8 housing vouchers and Section 8 housing certificates. In
1991, these two programs were combined into the Housing Choice Voucher (HCV) program.5
The HCV program is distinct from other federal housing programs because it makes use of
the existing private rental market to assist low-income families in need of affordable rental
housing. Local public housing authorities administer vouchers and have some authority
over rates, but most regulations are set by HUD. Program guidelines allow up to twenty
percent of vouchers to be project-based. As a result, those vouchers would be considered
supply subsidies because they do not allow for tenant mobility, but most literature groups all
HCV vouchers, Section 8 vouchers, and Section 8 certificates together.6 Statistical data
used within this report refers only to Housing Choice Vouchers.
In the 1990s and 2000s, new supply and demand subsidies for low-income
individuals were once again available, but the majority of funds were decentralized. In
addition, the HOME program, established in 1991, is a housing block grant that localizes
federal dollars. Each participating jurisdiction can choose to use funds for the production of
rental housing or other types of housing subsidies. Additionally, many jurisdictions have
access to additional Community Development Block Grant funds, which can be used for a
wider range of investments.
4 Langley C. Keyes et al., Networks and Nonprofits: Opportunities and Challenges in an Era of Federal Devolution, Housing Policy Debate,
1996, 203. 5Kimberly Burnett et al., Targeting Housing Production Subsidies: A Literature Review, Department of Housing and Urban Development
Office of Policy Development and Research, December 2003, 3. 6 Ibid.

4
State Policy & Programs
Most housing reports that examine the advantages and disadvantages of project-
based and tenant-based assistance analyze federal programs, but the decentralization of
affordable housing funds makes it necessary to assess state programs. In 2008, 42 states
provided a total of 112 state rental assistance programs. This is an increase from 101
programs that existed throughout 40 states in 2001. Most state programs target income
eligible and at-risk homeless populations. Very few programs are targeted for mentally ill or
youth populations.7
State rental assistance includes short-term assistance, transitional assistance,
ongoing assistance, and annual tax relief programs. Short-term programs provide one-time
emergency payments, transitional assistance is limited from a few months to three years,
and ongoing assistance provides eligible households regular assistance for more than three
years. Since 2001, three short-term assistance programs have been eliminated, while two
transitional assistance programs and eleven ongoing assistance programs have nationally
been added. Annual tax relief programs are similar to homeowner’s tax relief programs, with
the assumption that renters indirectly pay higher rent as the landlord’s property taxes rise.
These programs are typically targeted for senior populations and used to mitigate
gentrification.8
As of 2008, the state of Minnesota leads the nation with eight rental assistance
programs. Short-term assistance programs include the Emergency Services Program
administered by the Department of Human Services, Family Homeless Prevention and
Assistance Program administered by Minnesota Housing, and the Crisis Housing Fund
administered by Minnesota Housing Partnership. Transitional assistance includes Runaway
and Homeless Youth Act Funding and the Transitional Housing Program, both administered
by the Department of Human Services. The Property Tax Refund (PTR) program, managed
through the Department of Revenue, follows the tax relief model. The analysis in this report
focuses on Minnesota’s ongoing assistance, which includes the Bridges and the Housing
Trust Fund Programs; both administered by Minnesota Housing.
7 National Low Income Housing Coalition, Housing Assistance for Low Income Families: States Do Not Fill the Gap, 2008, 3. 8 Ibid, 6.

5
Minnesota Policy & Programs
Minnesota Housing Finance Agency uses bonds, housing tax credits, appropriated
federal resources, state appropriation, and agency resources to finance and preserve new
and existing affordable rental opportunities. The agency uses discretionary funds to provide
supply and demand side assistance for the state’s low-income rental households. Project-
based programs which focus on the construction of new affordable housing and the
preservation of existing housing include the Affordable Rental Investment Fund for
Preservation, the Economic Development and Housing Challenge Program, Housing Trust
Fund Capital and Operating Subsidies, and the Low and Moderate Income Rental Program.
Minnesota Housing provides operating subsidies through the Housing Trust Fund.
Other funding sources include the Department of Human Services (DHS), the Ending Long-
Term Homelessness Initiative Fund, and internal discretionary funds. Each funding source
has specific uses for the operating subsidies, but overlap does occur. Currently, the
Department of Human Services has limited funds, so in addition to revenue short fall,
Minnesota Housing’s operating subsidy program can pay for front desk costs, tenant
services coordinator, security or other unique costs associated with operating supportive
housing. As of recently, no new developments are receiving operating subsidies; instead all
funds have been reserved for extensions on existing contracts.
Figure 1: Comparative Tenant-Based Program Statistics9
MN Housing Choice
Vouchers (federal)
Bridges Rental
Assistance
Housing Trust Fund
Tenant Vouchers
Total People 73,847 1,169 5,401
Total Households 29,248 667 2,007
Average Length of Stay ≈ 4.5 yrs 2.75 yrs 2.25 yrs
Average Household Size 2.5 1.8 2.7
Average Market Rent not available $696 $802
Average Tenant Paid
Portion$294 $234 $212
Median Income of
Voucher Households$12,870 $9,300 $7,276
Minnesota Housing Finance Agency operates two programs focused on tenant-based
rental assistance. Both programs are included under the agency’s strategic priority to
prevent and end homelessness. The Bridges program operates in selected counties to
provide grants, paid directly to landlords, for temporary rental assistance payment and
security deposits. Assistance is provided on behalf of participants with serious mental
illness who are on a waiting list for a permanent rent subsidy, typically a Housing Choice
9 HUD Resident Characteristics Reports 4/2010 - 8/2011; MN Housing Data 1/2010 - 4/2011

6
Voucher.10 The Housing Trust Fund Rental Assistance program is provided in the form of a
tenant-based or sponsor-based rental contract with an administrator. It is intended to be
temporary assistance to individual households11, although under certain circumstances the
five year limit can be waived; this extension is being used more often. Notably, the sponsor-
based rental assistance contracts are similar to project subsidies because they are attached
to a building, however they are generally awarded to the building sponsor such as the
supportive service provider instead of the owner. Sponsor-based contracts consist of five
percent of the total Housing Trust Fund contracts.12 Housing Trust Fund data within this
report only includes tenant-based vouchers, although income data is the accumulation of all
three programs (see figures 1 & 2).
Figure 2: Family Type by Tenant-Based Program13
0%
10%
20%
30%
40%
50%
60%
70%
80%
Adult Households Families with
Children
MN Housing Choice
Vouchers
Bridges Rental
Assistance
Housing Trust Fund
Tenant Vouchers
10 Minnesota Housing Finance Agency, Annual Report and Program Assessment, 2010, 16. 11 Ibid, 19. 12 104 of 2,106 Housing Trust Fund rental assistance units in 2010 were designated sponsor-based or project-based. 13 HUD Resident Characteristics Reports 4/2010 - 8/2011 & MN Housing Data 1/2010 - 4/2011

7
Economic Sustainability
In the short-run, rental assistance is less expensive than project-based assistance.
For instance, 100 new tenant-based housing vouchers, with an average $500 monthly
assistance, will cost the government $600,000 over one year. If 100 new, heavily
subsidized units were constructed, with development costs averaging $200,000 per unit,
the cost would be $20 million. Of course, multiple caveats exist, but the general idea
demonstrates that tenant subsidies will always be less expensive up front.
However, in the long-run, the cost advantages of capital projects become apparent.
They require no additional funding (assuming no operating subsides), while rent assistance
has ongoing costs. After about 20 years, capital funding becomes the less expensive option.
Later in this report, analysis and graph showing various scenarios are provided.
In the long run, capital funding is less sustainable than rent assistance when
significant operating subsidies are used. Building new construction projects and funding
extensive rehabilitation projects requires initial capital costs. With supportive housing for
the long-term homeless, operating subsidies are often needed to fund net operating losses,
the gap between incoming revenue and outgoing expenses. If the government pays the
same amount for monthly operating subsidies and monthly rental assistance per unit, rental
assistance will always remain less expensive because capital costs were also included with
the operating subsidies. However, the need for operating costs is dependent on the project
financing (level of debt service, which adds cost), availability of rent assistance for tenants
(which provides another revenue source), and share of units designated for long-term
homeless (which generally provide less rent revenue). If operating subsidies are significantly
less than rental assistance, or not included at all, rental assistance will eventually become
the more expensive approach in the long run. The projection graphs shown later in this
report provide examples of those scenarios.
Long-run costs for tenant-based subsidies over many years are more than less;
therefore few new households are receiving assistance. At the national level, the Housing
Choice Voucher program has sustained most of its current supply of vouchers, but new
vouchers are added less frequently. In 2011, voucher funding was raised nationally to
$19.6 billion from $18.2 billion in the previous year. The majority of funds were used to
renew existing vouchers; only a total of 20,000 new vouchers, specifically for veterans and
the homeless, were issued.14 It is feared that future budget cuts will permanently prevent
the addition of new vouchers and possibly eliminate existing vouchers.
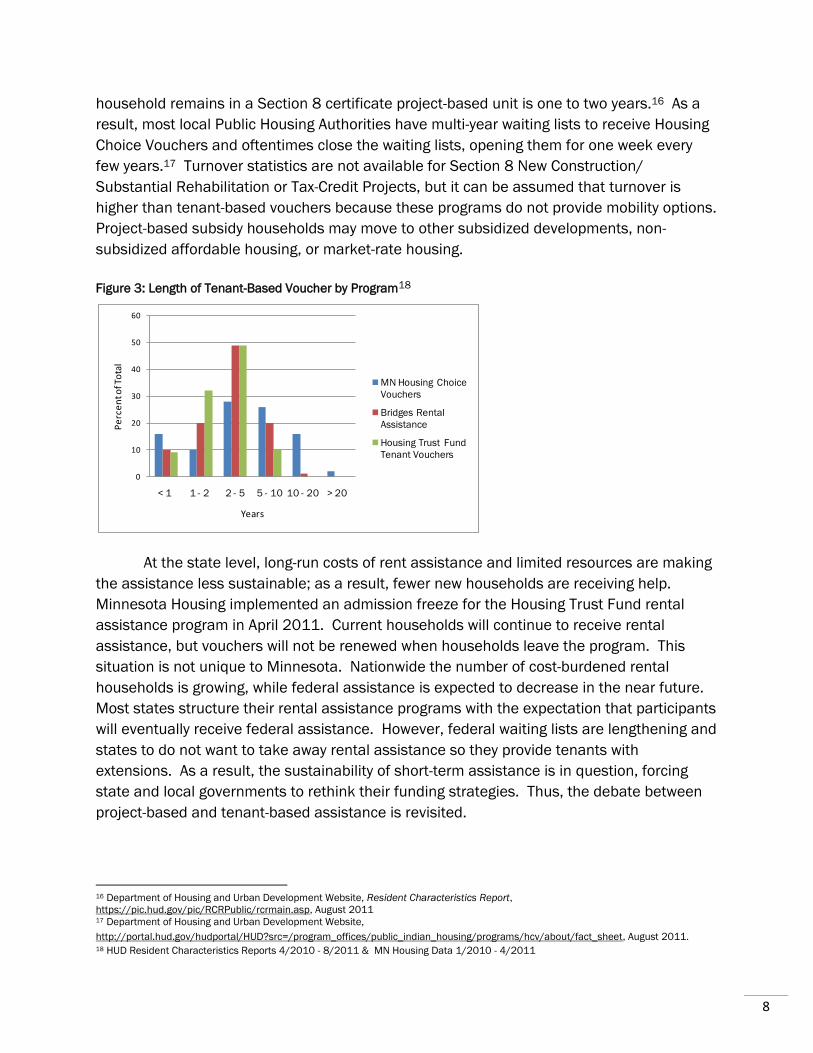
Furthermore, federal tenant-based voucher turnover is much slower than project-
based vouchers. The average length a household uses a tenant-based voucher is four to six
years, but some households keep their voucher for over 20 years.15 The average length a
14 National Council of State Housing Agencies Website, Newsroom: HUD passed funding bill, http://www.ncsha.org/blog, August 2010. 15 Department of Housing and Urban Development Website, Resident Characteristics Report,
https://pic.hud.gov/pic/RCRPublic/rcrmain.asp, August 2011.
8
household remains in a Section 8 certificate project-based unit is one to two years.16 As a
result, most local Public Housing Authorities have multi-year waiting lists to receive Housing
Choice Vouchers and oftentimes close the waiting lists, opening them for one week every
few years.17 Turnover statistics are not available for Section 8 New Construction/
Substantial Rehabilitation or Tax-Credit Projects, but it can be assumed that turnover is
higher than tenant-based vouchers because these programs do not provide mobility options.
Project-based subsidy households may move to other subsidized developments, non-
subsidized affordable housing, or market-rate housing.
Figure 3: Length of Tenant-Based Voucher by Program18
At the state level, long-run costs of rent assistance and limited resources are making
the assistance less sustainable; as a result, fewer new households are receiving help.
Minnesota Housing implemented an admission freeze for the Housing Trust Fund rental
assistance program in April 2011. Current households will continue to receive rental
assistance, but vouchers will not be renewed when households leave the program. This
situation is not unique to Minnesota. Nationwide the number of cost-burdened rental
households is growing, while federal assistance is expected to decrease in the near future.
Most states structure their rental assistance programs with the expectation that participants
will eventually receive federal assistance. However, federal waiting lists are lengthening and
states to do not want to take away rental assistance so they provide tenants with
extensions. As a result, the sustainability of short-term assistance is in question, forcing
state and local governments to rethink their funding strategies. Thus, the debate between
project-based and tenant-based assistance is revisited.
16 Department of Housing and Urban Development Website, Resident Characteristics Report,
https://pic.hud.gov/pic/RCRPublic/rcrmain.asp, August 2011 17 Department of Housing and Urban Development Website,
http://portal.hud.gov/hudportal/HUD?src=/program_offices/public_indian_housing/programs/hcv/about/fact_sheet, August 2011. 18 HUD Resident Characteristics Reports 4/2010 - 8/2011 & MN Housing Data 1/2010 - 4/2011
0
10
20
30
40
50
60
< 1 1 - 2 2 - 5 5 - 10 10 - 20 > 20
Pe
rce
nt o
f To
tal
Years
MN Housing Choice
Vouchers
Bridges Rental
Assistance
Housing Trust Fund
Tenant Vouchers

9
Costs and Benefits
Market Forces
Both project-based and tenant-based funding continue to be utilized at all levels of
government because policy makers understand that location and market conditions play
intricate roles in the cost of rental housing. At the national level, a HUD policy report found
that renter’s worst case housing needs were more severe in the West and Northeast regions
than the Midwest and South regions. This same report also stated that “very low-income
renters in the suburbs and in central cities are more likely to have worst-case needs than
those in non-metropolitan areas. At the same time, very low-income renters in non-
metropolitan areas are most likely to receive some type of housing assistance.”19
Minnesota Housing’s Community Profiles, based on 2009 American Community Survey
Data, show similar trends. With the exception of a couple rural counties, Minnesota’s cost-
burdened renters are concentrated in Duluth, Moorhead, Mankato, the Twin Cities, and
northern collar counties. A literature review of Minnesota’s local housing reports also found
this statement to be true.
Production subsidies are more beneficial in Minnesota’s metropolitan and
micropolitan areas. While Minneapolis and Saint Paul greatly emphasize the need to
preserve existing housing structures for every income level, the Twin Cities’ vacancy rates
have dropped four percentage points over the last two years, leaving Minneapolis with a
vacancy rate of 1.2 percent and Saint Paul with a vacancy rate of 0.8 percent.20 It can be
assumed rents will rise until new volume is added and vacancy rates rise to a balanced
market rate of five percent. Currently, new affordable rental developments would be
preferred over vouchers because it would increase the overall supply of affordable housing.
In addition, government costs for tenant-based rental assistance increase in this market
because fair market rents may increase, without tenant’s income (and therefore tenant-paid
rent) increasing.
Production subsidies are sometimes disfavored because they are too dependent on
capital market conditions. Raw material prices greatly affect the costs of new construction
and rehabilitation. Project debt service is greatly influenced by interest rates, loan terms,
and market value.21 The siting of new developments in urban areas can be time-consuming
and costly because of acquisition costs, community opposition, and time delays. As a result,
land acquisition and project soft costs may increase. Operating costs and potential
subsidies are dependent on maintenance expenses, utilities, property taxes, and other
management costs. Furthermore, proximity to other developments is important to keep in
19 Kimberly Burnett et al., Targeting Housing Production Subsidies: A Literature Review, Department of Housing and Urban Development
Office of Policy Development and Research, December 2003, 21. 20 GVA Marquette Advisors, Apartment Trends: Twin Cities Metro Area, Q2 2011. 21 Kirk McClure, Housing Vouchers versus Housing Production: Assessing Long-Term Costs, 1998, 360.

10
mind. Oftentimes, government assisted projects are placed so near one another that newer
developments attract tenants from the older developments, cannibalizing on one
development’s success. Therefore, the older development has higher turnover, creating
higher vacancy rates, and increased operating costs.
Tenant-based subsidies are dependent on rent inflation, which can be an advantage
and disadvantage. Rental prices are affected by supply and demand in the market.
Theoretically, markets with balanced or higher vacancy rates (keeping rent inflation low) are
much more suitable for rental assistance programs. Good examples of these colder
markets include Casper, WY, with a 2.86 percent cumulative 16-year rent inflation, and
Oklahoma City, OK, with 3.87 percent cumulative 16-year rent inflation. Meanwhile, tight
rental markets, such as San Jose, CA with a 132 percent cumulative 16-year inflation rate
and Stamford, CT with a 116 percent cumulative 16-year rent inflation, have escalating
rental assistance costs.22 Theoretically, these markets are better suited for production
subsidies.
Analysis later in this report uses a 3 percent inflation rate for both rental assistance
and operating subsidy costs because it spans over 30 years. If the report focused on a
shorter time frame, inflation would be relatively adjusted.
Social Factors
Social issues are equally important in the debate between project-based and tenant-
based assistance. Among a variety of complex issues and ideas, two framing arguments
arise: project development drives community revitalization, while housing vouchers allow
tenant mobility.
Project-based subsidies, traditionally favored by local governments and community
development corporations, offer a number of advantages in relation to community
development. Redevelopment projects in distressed areas have a number of positive
spillover effects: fill vacant sites, provide local construction jobs, attract small businesses,
draw private developer interest, create additional development opportunities, spark
economic development, and provide stable, affordable housing. New York City’s “Ten Year
Plan” (Introduced in 1986) invested $5.1 billion into the city’s poorest neighborhoods by
producing thousands of affordable housing units. Supply-side subsidies proved to be
extremely effective, creating a number of positive spillover effects.23
Another advantage of project-based subsidies is the promotion of economic
integration. In the past, households living in affordable housing developments typically did
not live with residents of different income levels, but recently mixed-income developments
have become more popular among policy makers. Furthermore, when affordable housing
developments are placed in middle to high income neighborhoods, economic integration is
22 Mark Shroder and Arthur Reiger, Voucher versus Production Revisited, Journal of Housing Research, 2000, 99-103. 23 Ingrid Gould Ellen et al., Production Subsidies and Community Revitalization: New York City’s Ten-Year Capital Plan for Housing, Federal
Reverse Bank of New York Economic Policy Review, June 2007, 1.

11
attainable at the neighborhood level. From the new resident perspective, public education
and crime rates are often better in suburbs and higher income neighborhoods, but
transportation systems and medical services are not.24 Receiving communities are typically
worried about the impact affordable developments will have on their housing values.
Results are varied and highly dependent on local context; generally larger developments
have slightly negative affects but projects under 50 units have no effect. Notably, “a study
of subsidized multi-family housing in Minneapolis showed that units operated by nonprofit
community development corporations had slight positive impacts on property values and led
to reductions in crime, while large public housing projects and older privately owned publicly
subsidized units had slightly negative effects on nearby property values.”25
Today’s changing demographics provide advantages for production subsidies. Many
public housing units and Section 8 subsidized projects developed in the 1970s and 1980s
have one and two bedrooms. Furthermore, a large amount of market rate apartments
developed in the 1960s and 1970s have one and two bedrooms, and as a result of filtering,
many of these units have been transferred into today’s affordable housing stock. These
units help supply housing for the mentally disabled, the homeless, and low-income single
adults and small families. However, proponents of project-based subsidies believe existing
units do not meet the needs of physically disabled households, frail senior citizens, or
extremely low-income large families. Studies have proven the cost difference for three and
four bedroom units provided through project-based subsidies and vouchers is very small. 26
Comparatively, the cost difference is much higher to produce one and two bedroom units,
instead of providing rental assistance vouchers.
Tenant-based assistance, generally favored by economists and academics, offers a
number of advantages which focus on tenant mobility. A recent Urban Institute housing
policy seminar asked a group of experts how they would allocate additional federal funds for
housing assistance. Each of the experts recommended using all or the greatest percentage
of the funds for tenant-based assistance.27 Tenant-based assistance targets economic
integration at the micro-level, allowing each family to choose their city, neighborhood, and
block by allowing mobility. Large-scale, supply-side developments have been criticized for
creating pockets of poverty, which become associated with increased crime, drug usage,
high school dropout rates, and teenage pregnancies.28
Many tenant-based housing initiatives, including the Housing Choice Voucher, seek to
deconcentrate poverty. At the federal level, 90 percent of Housing Choice Voucher
households live in neighborhoods with less than five percent of the total households using
tenant-based vouchers. Only ten percent of Housing Choice Voucher households live in
areas of concentrated poverty; concentrated poverty is defined as neighborhoods with 40
24 Edward Goetz, Effects of Subsidized Housing on Communities, Center for Urban Regional Affairs, 1997, 4. 25 Ibid. 26 Kimberly Burnett et al., Targeting Housing Production Subsidies: A Literature Review, Department of Housing and Urban Development
Office of Policy Development and Research, December 2003, 21. 27Kirk McClure, Housing Vouchers versus Housing Production: Assessing Long-Term Costs, 1998, 357. 28 Edward Goetz, Effects of Subsidized Housing on Communities, Center for Urban Regional Affairs, 1997, 4.
12
percent or more of residents living above the poverty level.29 Many opponents of tenant-
based subsidies argue that voucher holders do not leave low-moderate income
neighborhoods and actually reside in buildings that have already been subsidized through
programs like the Housing Tax Credit. This is partially true, but compared with project-based
subsidies, residents are far more dispersed. Voucher users reside in 83 percent of Twin
Cities’ census tracts containing any affordable housing, while subsidized projects are
located in only 22 percent of Twin Cities’ census tracts containing affordable housing.30
Tenant choice is an important advantage to the voucher program. Just like any other
households, extremely low-income households are able to choose housing based on their
preferences. Therefore, families may choose locations based on school district, or single
adults may choose locations based on proximity to available jobs. In addition, “some groups
representing or advocating for people with disabilities prefer voucher assistance to
subsidized housing projects, because vouchers avoid the institutional character that may be
associated with housing that groups those with disabilities together.”31
Tenant-based subsidies also have disadvantages associated with mobility.
Discrimination is a major barrier to the voucher program because some landlords refuse to
rent to tenants receiving rental assistance. As a result, 16 percent of metropolitan tracts
throughout the nation contain affordable housing, but no voucher holders.32 Other
landlords, oftentimes in low-income neighborhoods, prefer subsidized tenants because it
ensures a portion of the payment will always be received on time. As a result, vouchers are
17 to 21 times denser in low-income census tracts than other tracts.33
29 Deborah J. Devine et al., Housing Choice Voucher Location Patterns: Implications for Participant and Neighborhood Welfare,
Department of Housing and Urban Development Office of Policy Development and Research, 2002, 12. 30 Ibid. 31 Ibid, 66. 32 Ibid. 33 Edward Goetz, Effects of Subsidized Housing on Communities, Center for Urban Regional Affairs, 1997, 2.

13
Subsidy Case Studies
The decentralization of affordable housing funding has shifted the debate between
rental assistance and project development to state and local levels of government. Many
reports and studies have been conducted which analyze the social costs and benefits of
housing vouchers and mobility programs; however, few reports have conducted long-run
economic cost-benefit analyses of rental assistance and project development. Two
academic reports, Housing Vouchers versus Housing Production and Vouchers versus
Production Revisited, create a basic framework for the debate. Assumptions and
methodologies used in each study lead to different conclusions, although both are valid.
These reports use federal data, focusing on Housing Choice Vouchers and Section 8 New
Construction/Substantial Rehabilitation projects, as opposed to this study which uses state-
funded rental assistance and project development programs.
Kirk McClure published Housing Vouchers versus Housing Production: Assessing
Long-Term Costs in 1998. His report argues against previously held wisdom that project-
based assistance costs anywhere from 50 to 100 percent more than tenant-based
assistance. His study tracks housing data in St. Louis, and Kansas City, Missouri,
concluding that the present value (1994) of new construction would cost the government
about 139 percent of the cost of the certificate program – a cost premium of 40 percent.
His analysis primarily focuses on inflation rates, finding that housing certificates increased
about 137 percent over 14 years, while new construction only rose by 23 percent. He
believes that if quality of housing were controlled, the premium would be much lower than
40 percent.34
Countering against McClure’s theories, Mark Shroder and Arthur Reiger published
Vouchers versus Production Revisited in 2000. They argue that Section 8 New
Construction/Substantial Rehabilitation will remain “substantially” more expensive than
housing vouchers after 15 to 20 years. Their study notes empirical errors in McClure’s
research. McClure chose the wrong measure of cost by using Fair Market Rent (FMR)
instead of net rent, which subtracts the tenant paid portion. Additionally, McClure’s study
does not control for unit size of the, differentiating one bedroom units from units with two or
more bedrooms. Re-conducting the analysis, Shroder and Reiger control for unit size and
location (zip code). They find that the cost premium of new construction ranges from 3 to
73 percent depending on the zip code. They make important methodological points and
present specific results, but the range of their conclusions does not disprove any of
McClure’s findings.35
34 Kirk McClure, Housing Vouchers versus Housing Production: Assessing Long-Term Costs, 1998, 355-370. 35 Mark Shroder and Arthur Reiger, Voucher versus Production Revisited, Journal of Housing Research, 2000, 91-106.
14
Illustrative Analysis: Minnesota Rental Assistance and Project Development
This report assesses the long-run cumulative costs of Minnesota Housing’s rental
assistance programs and project developments. The following graphs (at the end of the
report) project these costs on a per unit basis over thirty years. The basic framework for this
model is based on the 2007 recalibration models created for The Business Plan to End
Long-Term Homelessness.36 However, the model was slightly revised. Current projections
include the separation of Bridges and Housing Trust Fund rental assistance costs, the
addition of a zero operating subsidy option, and the disaggregation of Minnesota Housing
development costs by project type. Furthermore, the recalibration model used benchmark
figures for inputs, while this model uses inflation-adjusted average costs from actual
administrative data. Methodologies presented in Kirk McClure, Mark Shroder, and Arthur
Reiger’s long-run cost-benefit studies were also taken into account. It is important to view
this model as a macro level policy analysis. Each development receiving capital funding and
operating subsidies is unique; therefore, a specific project and even a specific housing
voucher may not align with these models.
Methodology
Methodology primarily follows the recalibration model; however, it is important for
comparison purposes that data used for production subsidy costs cater to households who
may otherwise receive state-funded rental assistance. The Bridges Program caters to
mentally ill patients and their families; Housing Trust Fund rental assistance has broader
requirements but focuses on extremely low-income households, which includes many
mentally ill and long-term homeless residents. As a result, all Bridges units and a portion of
Housing Trust Fund units would be considered supportive. To create a reasonable
comparison, all developments used in the pool to calculate capital costs and operating
subsidies include supportive units, ranging from projects with four supportive units to
developments with 100 percent supportive units.
The projections also control for unit size (i.e. number of bedrooms) by differentiating
between single adult units and family units. Production assistance is disaggregated by
number of bedrooms - studios and one-bedroom units for adults and two to four bedrooms
units for families. Vouchers are disaggregated by family size, using one to two adults for
single units and adults plus children for family units.
36 This Business Plan to End Long Term Homelessness was a collaborative project headed Minnesota Housing, Department of Human
Services, and Minnesota Department of Corrections.
15
Data Collection
Rental Assistance: Bridges and Housing Trust Fund programs were separately
monthly rent paid between July 1, 2010 and June 31, 2011, and an average monthly
cost was calculated for each program. Total monthly costs consist of rental
assistance (market rent minus tenant contributed portion) and security deposits paid
within the time period. Rental assistance was projected into future years using a
three percent inflation rate.
Capital Costs: Data was collected from new construction and rehabilitation projects
funded between January 1, 2003 and April 30, 2011. The original pool included 264
projects. Twenty three developments were eliminated because they involved a
combination of new construction, rehabilitation, and/or conversion, 141
developments without any supportive units were eliminated, and 12 larger-scale
projects were eliminated because the developments had a mixture of unit sizes.
Projects were included if more than 85 percent of the total units in the development
were catered solely to singles or families. From the final pool of 88 developments,
projects were aggregated by unit size (single or family) and project type
(rehabilitation, new construction, mixed income new construction). Developments
are considered mixed-income if less than 50 percent of the units are supportive.
Typically, the other units in these developments are not market rate, but tenants
have incomes at 30 to 80 percent of the area median income. Averages were
weighted by the total number of units within each cohort (unit size and project type).
Minnesota Housing funded Capital Costs: Agency costs per development were taken
from a spreadsheet used for the predictive cost model. Internal costs include first
mortgages, second mortgages, deferred loans, and grants provided by Minnesota
Housing. Internal costs also include the syndication proceeds of projects receiving
Minnesota Housing administered tax credits; which applies to 27 of the 88
developments. Agency costs, like total development costs, do not differentiate
between amortizing debt and non-amortizing debt. Commercial banks, counties,
cities, and non-profit partners provide projects with the difference between total
development costs and agency costs.
Total Operating Subsidies: This report uses data that Minnesota Housing uses to
calculate annual operating subsidy benchmarks. The benchmarks average 26
development’s total operating costs plus reserve contributions. This figure is then
divided by the total number of units in the development to determine the per unit
operating subsidy benchmark. For underwriting purposes a development typically
receives operating subsidies within 5 to 50 percent of the benchmark. They receive
operating subsidies that cover 5 to 50 percent of their operating costs and reserve

16
contributions. Only a handful of developments receive over 50 percent of the
benchmark; these developments need extra subsidy to maintain a positive cash flow.
Operating subsidies were projected into the future using a three percent inflation
rate.
MN Housing Operating Subsidies: Minnesota Housing provides a small percentage of
its projects with operating subsidies through a Request for Proposal process.37
Twenty three of the 88 projects, in the pool of capital-funded projects, received
operating subsidy awards.38 Minnesota Housing operating subsidy per development
was taken by dividing each development’s total award by the number of months in
the award contract39 and then dividing by the total number of units in the
development. The average operating subsidy was weighted by total number of units
in the 23 developments. Other sources (HUD, DHS, etc) pay operating subsidies for
supportive housing developments, but these subsidies typically focus on the service
side. Minnesota Housing primarily focuses on each development’s physical and
financial well-being, although some of their operating subsidies pay for service-
related features. Agency operating subsidies were projected with a three percent
inflation rate.
Graph Navigation
The projection graphs trace per unit costs over a thirty year period. The graphs
provide data by type of unit, cost, and work (rehabilitation, versus, new construction). For
unit type, (1) graphs one through five focus on units for single adults and adult couples and
(2) graphs six through ten focus on units for families.
For comparative costs, (1) graphs one and six compare per unit costs of the two
rental assistance programs - Bridges and Housing Trust Fund, (2) graphs two and seven
compare the rental assistance programs to total development costs for acquisition and
rehabilitation on a per unit basis (3) graphs three and eight compare the rental assistance
programs to total development costs for new construction (projects with over 50 percent
supportive units40) on a per unit basis, (4) graphs four and nine compare the rental
assistance programs to total development costs for mixed-income new construction(projects
with under 50 percent supportive units41 on a per unit basis, (5) graphs five and ten
compare the rental assistance programs to Minnesota Housing’s per unit costs of
acquisition/rehabilitation, new construction, and mixed-income new construction on a per
units basis.
37 The operating subsidies include HTF operating subsidies and DHS HTF operating subsidies. 38 No projects can receive both Minnesota operating subsidies and rental assistance. 39Due to extensions, multiple awards total for several years 40 For single adults, 19 developments had 100% supportive units and 3 developments had 51%–96% supportive units; For families, 9
developments had 100% supportive units and 3 developments had 92%-97% supportive units 41 For single adults, 4 developments had 4%-41% supportive units; For families, 16 developments had 6%-25% supportive units and 1
development had 44% supportive units

17
Operating subsidies vary by graph: (1) graphs one and six include no operating
subsidy because project developments are not included on these graphs, (2) graphs two
through four and graphs seven through nine include development scenarios with no
operating subsidy, an operating subsidy set to 50 percent of operating benchmark (total
operating costs), and an operating subsidy set to 100 percent of the operating benchmark
(total operating costs)42, and (3) graphs five and ten include the average operating subsidy
awarded through Minnesota Housing’s RFP process.43 If a project were to receive a 100
percent operating subsidy, the subsidy would cover all the project’s operating costs and the
project wouldn’t need any rent revenue, which is an extreme case, but shown for illustrative
purposes.
Graph 1: Cumulative Rental Assistance Program Comparison for singles
Graph 2: Cumulative Rental Assistance and Acquisition/Rehab Comparison for singles
Graph 3: Cumulative Rental Assistance and New Construction Comparison for singles
Graph 4: Cumulative Rental Assistance and Mixed-Income New Construction
Comparison for singles
Graph 5: Cumulative Minnesota Housing Costs for Rental Assistance,
Acquisition/Rehab, New Construction, and Mixed-Income New Construction for singles
Graph 6: Cumulative Rental Assistance Programs Comparison for families
Graph 7: Cumulative Rental Assistance and Acquisition/Rehab Comparison for families
Graph 8: Cumulative Rental Assistance and New Construction Comparison for families
Graph 9: Cumulative Rental Assistance and Mixed-Income New Construction
Comparison for families
Graph 10: Cumulative Minnesota Housing Costs for Rental Assistance,
Acquisition/Rehab, New Construction, and Mixed-Income New Construction for families
Limitations
Data collection and methods were designed to keep the end projection models as
comprehensive as possible; as a result there are many limitations.
Total development costs and Minnesota Housing internal costs do not take
amortizing debt into account; all funding is treated the same. First mortgages, whether
provided by commercial banks or Minnesota Housing, are paid back with principal and
interest. With amortizing debt, development costs would not be considered a cash loss, but
a potential profit to the agency. However, supportive housing uses little to no amortizing
debt; instead it relies on deferred loans, tax credits, and grants for its development costs.
Over time supportive housing must rely on one of the following (1)larger deferred loans up
front, (2) tenants receiving rental assistance, (3) non-supportive units in the development to
42 Of the 88 developments used for capital costs, 65 received no operating subsidy from Minnesota Housing, 18 projects received
operating subsidies between 5% and 50% of their total operating costs, and 5 projects received operating subsidies between 50% and
100% of their total operating costs; some developments may have received operating subsidies from other sources but this money would
most likely be used for “tenant services”, not development costs 43 Average was taken from 23 developments used in the original pool of 88 projects receiving capital costs; many other developments
have received MN Housing operating subsidies that were developed before 2003

18
generate real revenue, or (4) operating subsidies over time to maintain cash flow. This
occurs because supportive housing has less revenue and greater expenses than traditional
affordable housing.
The use of a constant inflation rate may be a limitation. The long term cost
differences between a five percent inflation rate, used in the calibration models from 2007,
and a three percent inflation rate, used the current projections, greatly affected the
cumulative costs. Rental assistance will likely inflate at different rates than operating
subsidies. McClure, Shroder and Reiger disagree about the use of inflation rates, but both
studies use different inflation rates for rental assistance and operating subsidies. However,
they analyze both subsidies over a period of ten to fifteen years into the past, before they
project into the future. This model takes current 2011 data figures and projects forward.
The decision to a use standard three percent inflation rates was determined by data
presented in the Federal Office of Management and Budget.
The length of operating subsidies is another limitation. Minnesota Housing offers
operating subsidies through a Request for Proposal process; shortages in funding have
temporarily eliminated the disbursement of new operating funds, but extensions continue to
be granted. It is understood that supportive units use operating subsidies (if not receiving
rental assistance) to maintain net operating income, however the amount, source, and
contract length of each subsidy is complex.
One economic benefit limitation will continue to exist; tenant-based rental assistance
will always relieve housing cost burdens, while project-based assistance may or may not
relieve housing cost burdens. Households receiving tenant-based assistance pay 30
percent of their income towards rent.44 The two cited case studies compared tenant-based
vouchers and the Section 8 New Construction/Substantial Rehabilitation program. Both
forms of assistance subsidized housing for the tenant to 30 percent of their income; the
comparison provided similar economic benefits to the tenants. New production-based
programs, specifically the Housing Tax Credit program, provide assistance for the developer
to produce affordable units;45 however rents are not subsidized to the tenant’s income.
With the exception of supportive units and long-term homeless units46, other “affordable”
units may contribute to household’s housing cost burden. Unfortunately no studies were
cited, or found, which compare the federal Housing Choice Voucher program to Low Income
Housing Tax Credit projects (LIHTC). This analysis would be helpful because the majority of
developments used for the projection models are LIHTC projects.
A few minor limitations also exist. The Minnesota Housing Request for Proposal
process was not analyzed; this process helps the agency to determine the market
preferences of developers and sponsors. Furthermore, administration costs were not taken
into account and quality of housing was not controlled for.
44 The Housing Choice Voucher Program, Bridges, and HTF allow a household to pay up to 40% of income if they choose a unit above fair
market rent. 45 Rents are determined by Metropolitan Area Median Incomes and set to 80%, 50%, and 30% AMI 46 These units are subsidized to tenant income.

19
Conclusions
In the long-run, project development is more expensive than rental assistance when
50 to 100 percent of the operating subsidy benchmarks are used. However, conclusions
differ from those in the 2007 recalibration models. The recalibration models used
benchmarks that overestimated rental assistance47 and underestimated operating
expenses48. The discrepancy in operating expenses is most likely due to sample size; the
2010 operating subsidy benchmarks were determined from a greater number of projects
than in 2007. The discrepancy in rental assistance is unclear.
Recalibration graphs from 2007 found that after 30 years, rental assistance would
be more expensive than project development, with the exception of new construction and
mixed income new construction for singles using 100 percent of the operating subsidy
benchmark. Conversely, current projections find that after 30 years rental assistance will
remain less expensive than project development, with the exception of rehabilitation units
for singles using 50 percent of the operating subsidy benchmark. Projections did find that
developments relying solely on capital costs and using no operating subsidies will always be
more cost effective than rental assistance in the long-run, especially if amortizing debt is
used. An analysis of Minnesota Housing’s costs (instead of total development costs) finds
that funding spent on project development assistance become less expensive than rental
assistance after 10 to 20 years.
47 Recalibration models used $565 for singles and $780 for families as benchmark figures, 2010 data found the averages to be $404 -
$470 for singles and $568 - $586 for families 48 Recalibration models used $450 for singles and $475 for families as benchmark figures, 2010 data found the averages to be $480
singles and $606 for families
20
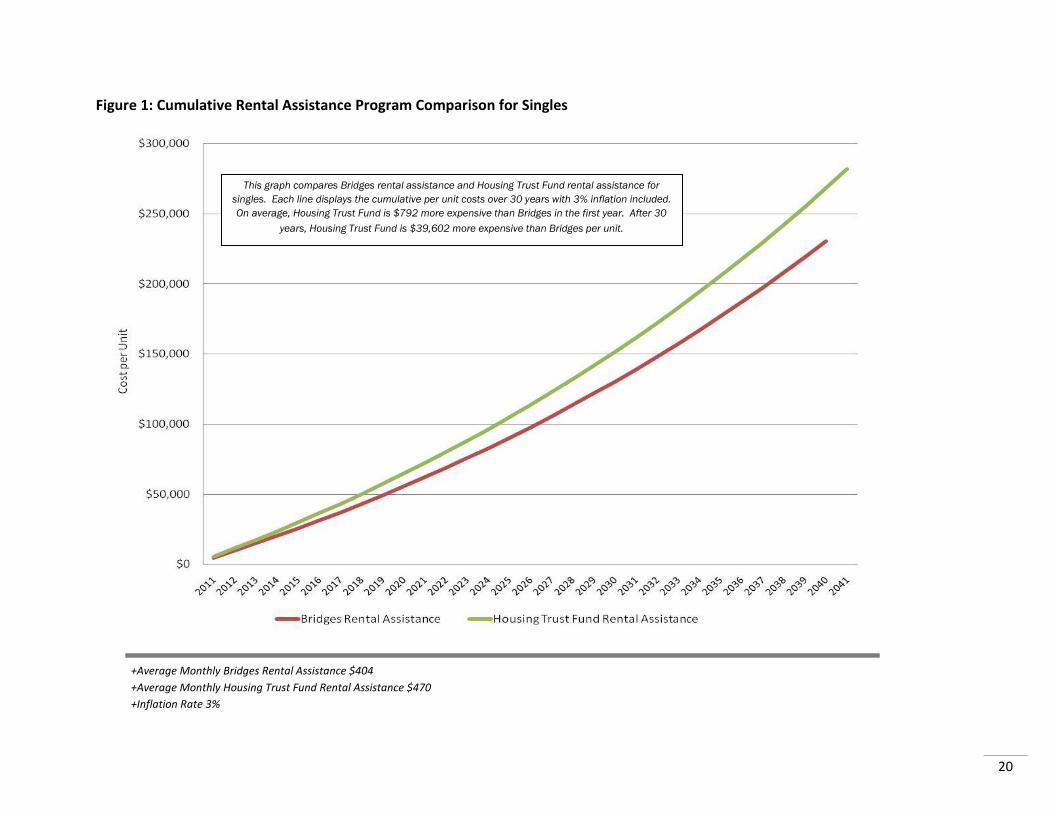
Figure 1: Cumulative Rental Assistance Program Comparison for Singles
+Average Monthly Bridges Rental Assistance $404
+Average Monthly Housing Trust Fund Rental Assistance $470
+Inflation Rate 3%
This graph compares Bridges rental assistance and Housing Trust Fund rental assistance for
singles. Each line displays the cumulative per unit costs over 30 years with 3% inflation included.
On average, Housing Trust Fund is $792 more expensive than Bridges in the first year. After 30
years, Housing Trust Fund is $39,602 more expensive than Bridges per unit.

Figure 2: Cumulative Rental Assistance and Acquisition/Rehab Comparison for Singles
+Average Monthly Bridges Rental Assistance per unit $404
+Average Monthly Housing Trust Fund Rental Assistance per unit $470
+Average Total Development Cost for Single Unit Acquisition/Rehab per unit $90,919
+Operating Subsidy Benchmark for Single Unit $480
+ Inflation Rate 3%
After 12 -15 years, both rental
assistance programs will be more
expensive than TDC for
Rehabilitation Projects without
operating subsidies
After 22 -29 years, both rental
assistance programs will be more
expensive than TDC for
Rehabilitation Projects with 50%
operating subsidies
This graph compares rental assistance to acquisition/rehab developments.
Each line displays the cumulative per unit costs over 30 years with 3%
inflation included for rental assistance and operating costs. Average total
development costs were taken from 20 developments receiving Minnesota
Housing capital funds; 8 of the 20 developments received operating
subsidies from Minnesota Housing.

Figure 3: Cumulative Rental Assistance and New Construction Comparison for Singles
After 30 years, TDC for New
Construction developments
will remain more expensive
than rental assistance if at
least 50% operating
subsidies are required
+Average Monthly Bridges Rental Assistance per unit $404
+Average Monthly Housing Trust Fund Rental Assistance per unit $470
+Average Total Development Cost for Single Unit New Construction per unit $157,615
+Operating Subsidy Benchmark for Single Unit $480
+Inflation Rate 3%
After 19 - 22 years, both rental
assistance programs will be more
expensive than TDC for New
Construction projects without
operating subsidies
This graph compares rental assistance to new construction developments.
Each line displays the cumulative per unit costs over 30 years with 3%
inflation included for rental assistance and operating costs. Average total
development costs were taken from 22 developments receiving Minnesota
Housing capital funds; 7 of the 22 developments received operating
subsidies from Minnesota Housing.

Figure 4: Cumulative Rental Assistance and Mixed Income New Construction Comparison for Singles
+Average Monthly Bridges Rental Assistance per unit $404
+Average Monthly Housing Trust Fund Rental Assistance per unit
$470
+Average Total Development Cost for Single Unit Mixed Income
New Construction per unit $157,615
+Operating Subsidy Benchmark for Single Unit $480
+Inflation Rate 3%
After 22 - 24 years, both rental
assistance programs will be more
expensive than TDC for Mixed
Income New Construction projects
without operating subsidies
After 30 years, TDC for
Mixed Income New
Construction developments
will remain more expensive
than rental assistance if at
least 50% operating
subsidies are required
This graph compares rental assistance to mixed-income new construction
developments. Each line displays the cumulative per unit costs over 30 years
with 3% inflation included for rental assistance and operating costs. Average
total development costs were taken from 4 developments receiving
Minnesota Housing capital funding; 3 of the 4 developments received
operating subsidies from Minnesota Housing. Mixed-income projects typically
do not receive operating subsidies; however 33% to 44% of the units in these
3 developments were supportive.
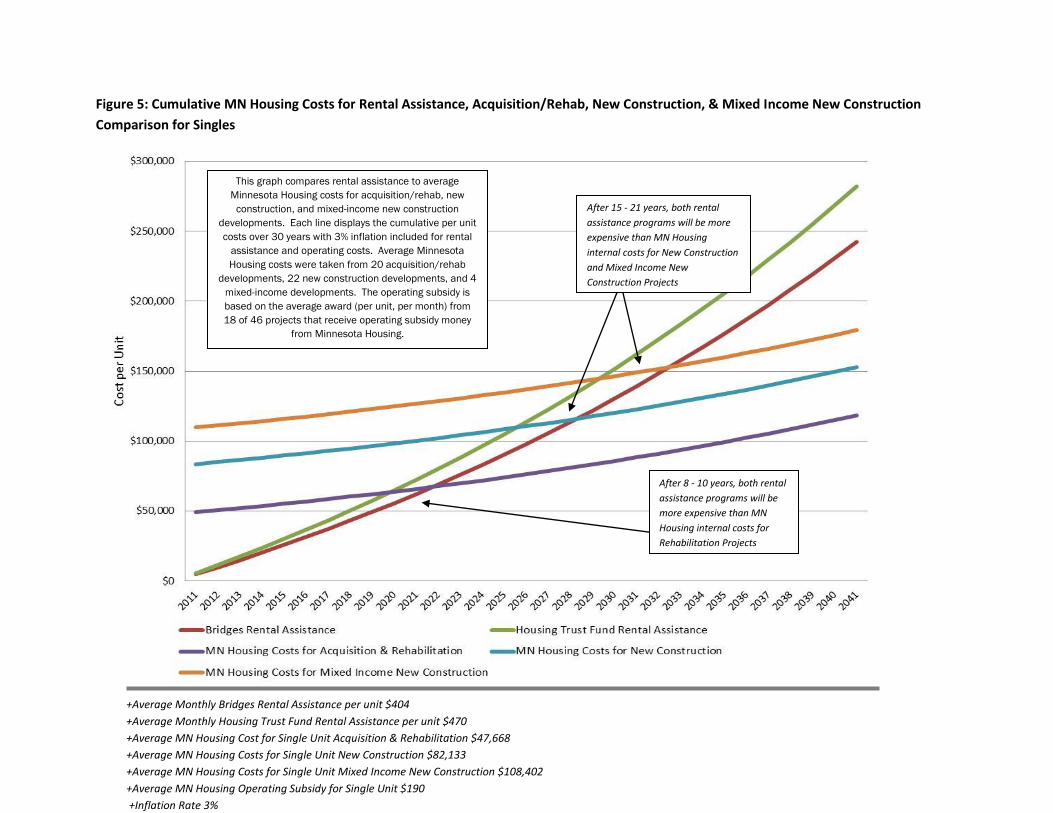
Figure 5: Cumulative MN Housing Costs for Rental Assistance, Acquisition/Rehab, New Construction, & Mixed Income New Construction
Comparison for Singles
+Average Monthly Bridges Rental Assistance per unit $404
+Average Monthly Housing Trust Fund Rental Assistance per unit $470
+Average MN Housing Cost for Single Unit Acquisition & Rehabilitation $47,668
+Average MN Housing Costs for Single Unit New Construction $82,133
+Average MN Housing Costs for Single Unit Mixed Income New Construction $108,402
+Average MN Housing Operating Subsidy for Single Unit $190
+Inflation Rate 3%
After 8 - 10 years, both rental
assistance programs will be
more expensive than MN
Housing internal costs for
Rehabilitation Projects
After 15 - 21 years, both rental
assistance programs will be more
expensive than MN Housing
internal costs for New Construction
and Mixed Income New
Construction Projects
This graph compares rental assistance to average
Minnesota Housing costs for acquisition/rehab, new
construction, and mixed-income new construction
developments. Each line displays the cumulative per unit
costs over 30 years with 3% inflation included for rental
assistance and operating costs. Average Minnesota
Housing costs were taken from 20 acquisition/rehab
developments, 22 new construction developments, and 4
mixed-income developments. The operating subsidy is
based on the average award (per unit, per month) from
18 of 46 projects that receive operating subsidy money
from Minnesota Housing.

Figure 6: Cumulative Family Unit Rental Assistance Program Comparison for Families
+Average Monthly Bridges Rental Assistance per unit $568
+Average Monthly Housing Trust Fund Rental Assistance per unit $588
+Inflation Rate 3%
This graph compares Bridges rental assistance and Housing Trust Fund rental
assistance for families. Each line displays the cumulative per unit costs over
30 years with 3% inflation included. On average, Housing Trust Fund is $240
more expensive than Bridges in the first year. After 30 years, Housing Trust
Fund is $12,001 more expensive than Bridges per unit.
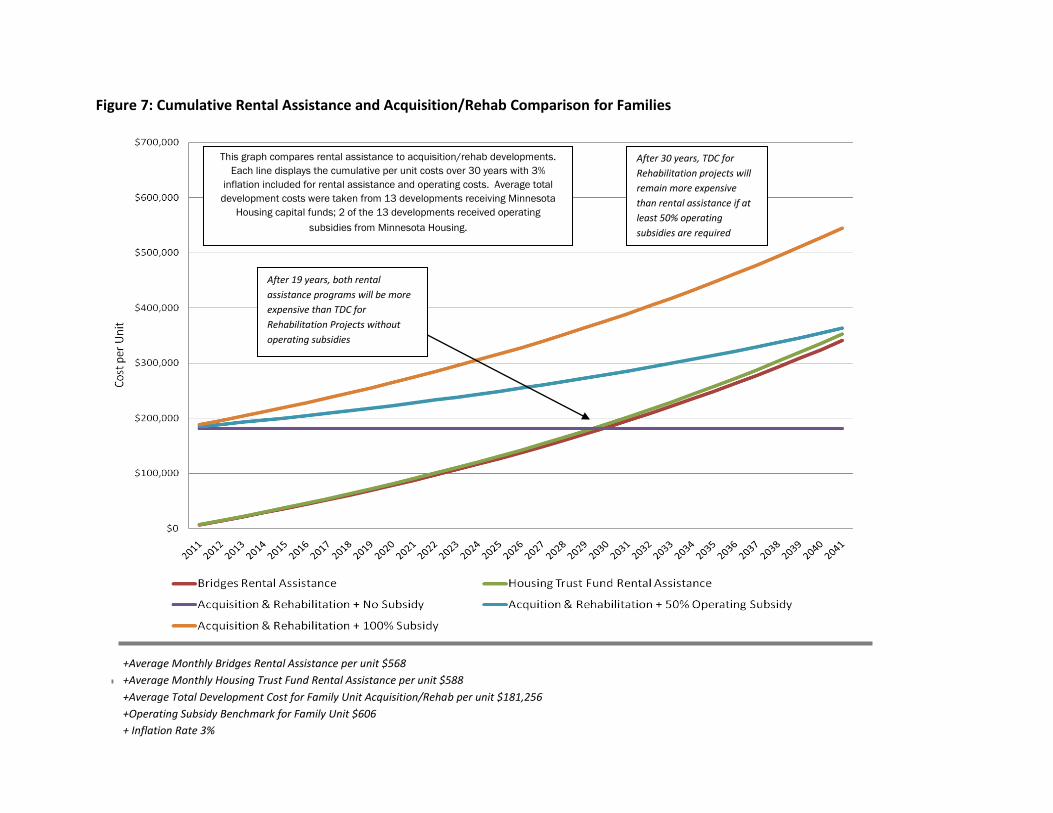
Figure 7: Cumulative Rental Assistance and Acquisition/Rehab Comparison for Families
+Average Monthly Bridges Rental Assistance per unit $568
+Average Monthly Housing Trust Fund Rental Assistance per unit $588
+Average Total Development Cost for Family Unit Acquisition/Rehab per unit $181,256
+Operating Subsidy Benchmark for Family Unit $606
+ Inflation Rate 3%
After 30 years, TDC for
Rehabilitation projects will
remain more expensive
than rental assistance if at
least 50% operating
subsidies are required
After 19 years, both rental
assistance programs will be more
expensive than TDC for
Rehabilitation Projects without
operating subsidies
This graph compares rental assistance to acquisition/rehab developments.
Each line displays the cumulative per unit costs over 30 years with 3%
inflation included for rental assistance and operating costs. Average total
development costs were taken from 13 developments receiving Minnesota
Housing capital funds; 2 of the 13 developments received operating
subsidies from Minnesota Housing.
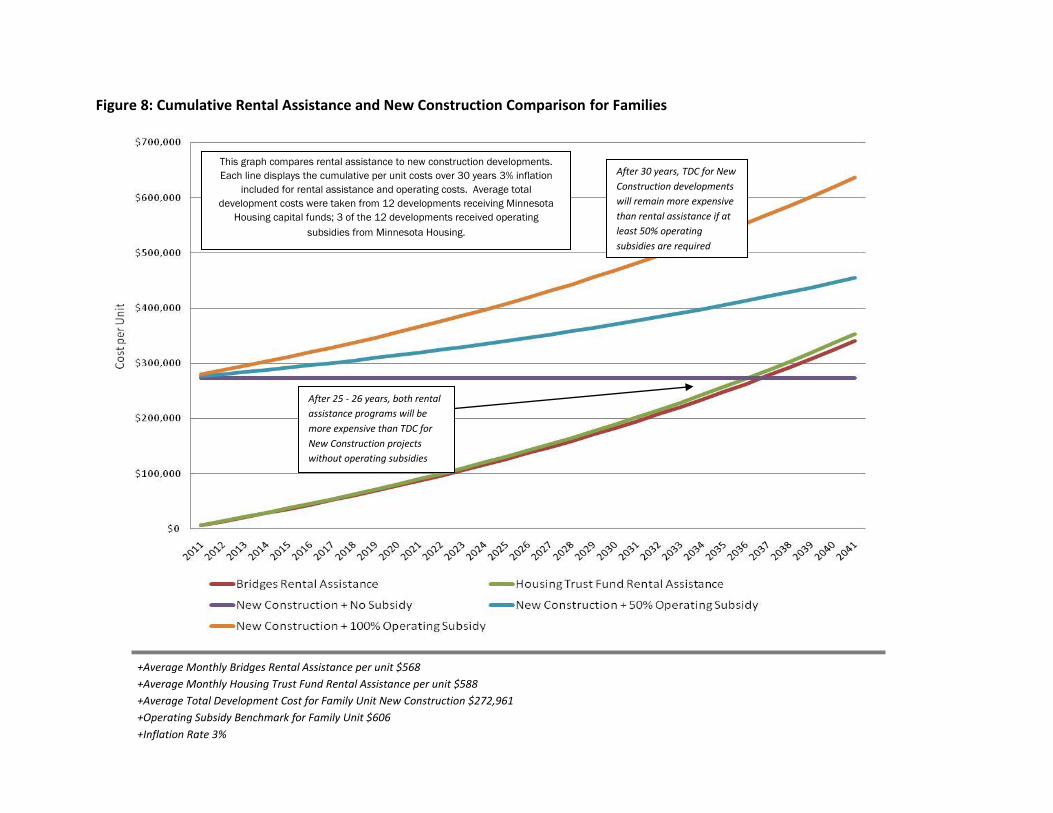
Figure 8: Cumulative Rental Assistance and New Construction Comparison for Families
+Average Monthly Bridges Rental Assistance per unit $568
+Average Monthly Housing Trust Fund Rental Assistance per unit $588
+Average Total Development Cost for Family Unit New Construction $272,961
+Operating Subsidy Benchmark for Family Unit $606
+Inflation Rate 3%
After 25 - 26 years, both rental
assistance programs will be
more expensive than TDC for
New Construction projects
without operating subsidies
After 30 years, TDC for New
Construction developments
will remain more expensive
than rental assistance if at
least 50% operating
subsidies are required
This graph compares rental assistance to new construction developments.
Each line displays the cumulative per unit costs over 30 years 3% inflation
included for rental assistance and operating costs. Average total
development costs were taken from 12 developments receiving Minnesota
Housing capital funds; 3 of the 12 developments received operating
subsidies from Minnesota Housing.

Figure 9: Cumulative Rental Assistance and Mixed Income New Construction Comparison for Families
+Average Monthly Bridges Rental Assistance per unit $568
+Average Monthly Housing Trust Fund Rental Assistance per unit
$588
+Average Total Development Cost for Family Unit Mixed Income
New Construction per unit $220,191
+ Operating Subsidy Benchmark for Family Unit $606
+Inflation Rate 3%
After 22 years, both rental
assistance programs will be more
expensive than TDC for Mixed
Income New Construction projects
without operating subsidies
After 30 years, TDC for Mixed
Income New Construction
developments will remain more
expensive than rental assistance
if at least 50% operating
subsidies are required
This graph compares rental assistance to mixed-income new construction
developments. Each line displays the cumulative per unit costs over 30 years with 3%
inflation included for rental assistance and operating costs. Average total
development costs were taken from 17 developments receiving Minnesota Housing
capital funding; none of these developments received operating subsidies from
Minnesota Housing, therefore the top two lines are unlikely scenarios.

Figure 10: Cumulative MN Housing Costs for Rental Assistance, Acquisition/Rehab, New Construction, & Mixed Income New Construction
Comparison for Families
+Average Monthly Bridges Rental Assistance per unit $566
+Average Monthly Housing Trust Fund Rental Assistance per unit $586
+Average MN Housing Costs for Family Unit Acquisition & Rehabilitation $96,557
+Average MN Housing Costs for Family Unit New Construction $135,200
+Average MN Housing Costs for Family Unit Mixed Income New Construction $141,217
+Average MN Housing Operating Subsidy for Family Unit $189
+Inflation Rate 3%
After 15 years, both rental
assistance programs will be more
expensive than MN Housing
internal costs for Rehabilitation
This graph compares rental assistance to average Minnesota Housing costs for acquisition/rehab, new
construction, and mixed-income new construction developments. Each line displays the cumulative per unit costs
over 30 years with 3% inflation included for rental assistance and operating costs. Average Minnesota Housing
costs were taken from 13 acquisition/rehab developments, 12 new construction developments, and 17 mixed-
income developments. The operating subsidy is based on the average award (per unit, per month) from 5 of 42
projects that receive operating subsidy money from Minnesota Housing.
After 20 years, both rental
assistance programs will be more
expensive than MN Housing
internal costs for New
Construction and Mixed Income
New Construction Projects