rent controls and rental housing quality: a note on the ...jkbrueck/course readings/gyourko and...
TRANSCRIPT
JOURNAL OF URBAN ECONOMICS 27, 398-409 (1990)
Rent Controls and Rental Housing Quality: A Note on the Effects of New York City’s
Old Controls*
JOSEPH GYOURKO~ AND PETER LINNEMAN*
The Whurton School, University of Pennsylvania, Philadelphia, Pennsylvania I91 04
Received June 10.1987; revised April 1988
1. INTRODUCTION
Rent controls are used in many cities throughout the United States and many other countries. ’ There is a lengthy literature on the conceptual effects of rent controls. This is not surprising given the size of housing in the U.S. asset base and the political importance attached to homeownership and quality housing. It is surprising how little evidence there is on many of the supposed effects of rent controls.
The evidence on these impacts is relatively slim for a variety of reasons. First, the data needed to document some of the predicted impacts are not good. For example, it is difficult to measure effective maintenance inputs, and it is costly to obtain any such data on a wide variety of buildings. Convincing ceteris paribus experiments are difficult to perform because there typically are many other factors for which it is hard to control. Additionally, the negative theoretical implications appear to be so clear that many economists may not have felt much need to quantify the extent of the damage.
Nevertheless, there is some evidence on the influences of rent controls. From studies estimating the price elasticity of the supply of structures, economists have estimated the likely effect of rent controls on the supply of new structures in a city.’ Rydell et al. [lo] and Fallis and Smith [3] have
*We thank Edgar Olsen for providing us with his data tape. We also thank Peter Fronczek of the Bureau of the Census for explaining details of the sampling techniques used to collect the data analyzed in this study.
‘Associate Professor of Finance. *Director of the Real Estate Center and Professor of Finance and Public Policy and
Management. ‘See Bloch and Olsen [l] for a good overview of the U.S. and European cases. ‘See, for example, Kalymon [S], who provides evidence on the effects of Toronto’s introduc-
tion of controls in 1975. He finds that 78% of the variability in an apartment starts index (which is a share of apartment starts to total housing units starts) is explained by variation in
398 0094-1190/90 $3.00 Copytigbt 0 1990 by Academic FYes‘i. Inc. All rigbts of reproduction in my form reserved.
RENT CONTROLS AND RENTAL HOUSING QUALITY 399
analyzed and simulated the likely effects on housing price and supply of the more recently imposed controls in Los Angeles. Marks [7] has examined the effects of Vancouver’s controls on the price of structure traits. Gyourko and Linneman [4] provide evidence on rent controls’ intIuence on renter mobil- ity and the propensity to own. Other research has begun to focus more on the equity effects of rent controls. Included here are studies of the New York City case by DeSalvo [2], Olsen [8], Roistacher [9], Linneman [16], and Gyourko and Linneman [4]. The recent evidence shows that the distributional effects of controls are negligible.
This note provides evidence on the influence of rent controls in New York City on apartment quality. With its long history of controls, New York City is an excellent city to study. The data analyzed are from the “1968 Housing and Vacancy Survey.” By 1968, rent controls had been in existence for over twenty years. That year is also just prior to a major alteration in New York City’s control scheme and the switch to rent stabilization guidelines.
A logit specification is used to estimate the impact of rent control status on rental housing quality while controlling for borough location, building age, and whether the building is a high-rise structure. The results document that New York City’s rent controls had a large deleterious impact on rental structure quality, particularly in smaller buildings. Not surprisingly, the effect is largest for units in older buildings, constructed prior to 1947, but an important impact is also found for ten- to twenty-year-old buildings, constructed between 1947 and 1959. If an apartment building is in Manhat- tan, but is not a high rise of more than seven stories, and was built prior to 1947, there is an almost 9% higher probability that the building is in deteriorating or dilapidated condition (versus sound condition) if the units in the structure were rent controlled versus uncontrolled. The analogous percentage is just over 4% if the Manhattan structure was built between 1947 and 1959. Across boroughs, the deleterious effect of controls on rental structure quality is lowest in Queens and largest in Manhattan. The high-rise type of structure appears to be a very strong quality proxy. These buildings generally are in good physical condition whether populated by controlled or uncontrolled apartments. Also, buildings under ten years old are consistently in good condition, regardless of their units’ control status.
the ratio of a Toronto rent level index to a construction cost index. A 1% fall in that ratio is associated with a 0.2% fall in the apartment starts index. Controls affect starts indirectly by affecting this ratio of rents to construction costs. Kalymon [5] also found that a dummy variable for the presence of controls had an independent effect, implying that controls dropped the start rate by 1.5%. Vitaliano [ll] examined the effect of controls on the short-run supply of rental housing in various New York state cities just after World War II. His estimation of a model of landlord supply of rental housing found a 27% shrinkage in the flow of housing services.

GYOURKO AND LINNEMAN
2. RENT CONTROLS IN NEW YORK CITY
Rent controls began in New York City in November 1943 when rents for all units in the city were frozen at their March 1943 levels as part of the U.S. Emergency Price Act of 1942. The controls were intended to prevent any “speculative, unwarranted, and abnormal” rent increases during the ~ar.~ The federal enabling legislation for these controls was altered by the Federal Housing and Rent Act of 1947 which exempted units built after February 1947 from all future rent controls. However, New York City continued to control rents on virtually all apartments constructed prior to 1947.4 In 1950 the federal enabling legislation expired and was replaced by a similar statute through the New York Emergency Housing Act of 1950. By the late 1950s New York was the only state which still had rent controls. In response to growing political differences between the State and New York City, the Emergency Housing Act of 1962 provided New York City with the power to administer its rent control legislation through the Rent Control Division of the New York City Department of Housing Preservation and Development. These controls were in effect at the time that the survey we use was conducted. In 1968 controlled units were in structures built prior to February 1947, although some units had been decontrolled. Decontrol occurred for some units in very small buildings as well as for some units with very high rents. Just under 60% of the rental units in our sample were regulated. Rents for these controlled units were established by the Rent Control Board. Prior to 1970, rents for controlled units were seldom raised and generally reflected a philosophy that uncon- trolled rents rose primarily as the result of the greed of landlords.
3. DATA BASE AND ESTIMATION
While we cannot directly observe effective maintenance inputs for apart- ment buildings, the 1968 New York City Housing and Vacancy Survey provides information on the quality of buildings in which the sampled rental units are located. The Bureau of the Census’ surveyor rated the overall condition of the structure as in one of three categories-sound, deteriorating, or dilapidated. In the estimation below, the deteriorating and dilapidated observations are combined into a single category referred to as “not sound.“5
‘Emergency Housing Rent Control Law, N.Y. Session Laws 1950, Chapter 250, Section 3. 4The 1947 legislation allowed decontrol of “ voluntarily” vacated units in buildings for one
or two families. ‘Only 4.3% of the apartments were classified as being in dilapidated condition. A mdtino-
mial version of the binomial logit estimation described below proved unable to discriminate between units in deteriorating versus dilapidated condition. Hence, all units in less than sound condition are grouped together for estimation purposes.

RENT CONTROLS AND RENTAL HOUSING QUALITY 401
TABLE 1
Rent Control Status and Building Condition Contingency Table
unit Rent control status
condition Controlled Uncontrolled
Sound 4021 4224 (68.7%)” (95.4%) (48.8%)b (51.2%)
Not sound 1831 205 (31.3%) (4.6%) (89.9%) (10.1%)
Column sums 5852 4429
OFirst number in parentheses is the column percentage. ‘Second number in parentheses is the row percentage.
Row sums
8245
2036
10281
The Housing and Vacancy Survey contained 5852 usable observations on rental units in the controlled sector and 4429 usable observations for rental units in the uncontrolled sector.6 There is also information on the rent control status of each rental unit. Because building age was the key factor in determining control status in 1968, apartments in the same building have the same control status in the vast majority of cases. Thus, even one observation on an apartment’s control status is likely to capture correctly the control status of all units in the building.
Table 1 provides cross-tabulations of rent control status with building condition for the 10,281 observations. Fifty-seven percent of the observa- tions are from rent controlled units. Just under 20% of the apartments are reported as being in buildings in not sound condition. Note that 31.3% of controlled sector units are in structures reported as not sound, while all but
The surveyor generally was not able to observe the interiors of most apartments but did see the hallways and common areas of the building as well as its exterior. The Bureau of the Census provided guidelines and some training in classifying building condition to help standardize responses across surveyors.
6The Bureau of the Census employed a “cluster sampling” procedure in gathering the data. Given that the individual apartment is the unit of observation, more than one rental unit from the same building can be included in the sample. The sampling procedure was such that it is highly unlikely that more than four units from even the largest buildings show up in tbe sample. Thus, there are still thousands of apartment buildings covered in our sample but the number of independent observations on building condition is somewhat less than 10,281 (5852 + 4429). For all test statistics reported below, we assume 10,281 independent observa- tions because we cannot be sure just how many independent observations there are. While the reader should keep this in mind when interpreting the results in Tables 3 and 4, the findings are strong and clear enough that we do not believe our assumption is very important empirically.

402 GYOURKO AND LINNEMAN
4.6% of rental units in the uncontrolled sample are in buildings in sound condition.
While this contingency table demonstrates a higher propensity of inferior quality when the building’s units are subject to rent controls, other forces such as location and building age as well as certain structural traits could also influence building condition. Furthermore, the effects and incentives of rent controls may not be the same across all units and buildings within the controlled sector. There are different implied subsidies to different controlled sector renters which could influence the renter’s incentive to self-maintain and thereby could influence overall building condition. To understand this better, it is important to realize that the imposition of rent controls is at least a partial transfer of property rights in the unit and building from the landlord to the tenant. While the landlord’s incentive to maintain the unit falls, that of the tenant to self-maintain increases. Since landlords are responsible for maintaining the entire building including common areas and support services, free-rider problems probably prevent tenants from maintaining those areas as effectively as landlords. Still, those receiving relatively large implicit subsidies have a greater incentive to see that the building does not become unsound, thereby reducing the value of their implicit subsidy.
We attempt to control for this influence by estimating the implied rent control subsidy. The subsidy to renters is the difference between the uncontrolled rent predicted for the unit and the controlled unit’s actual rent. For example, if the monthly rent for a controlled apartment was $500 and a unit of this quality rented for $700 in the uncontrolled sector, the monthly rent control subsidy would be $200. The subsidy to uncontrolled units is definitionally zero.7
In order to calculate the implied subsidy to rent controlled apartments, we estimated a hedonic rent function for the uncontrolled sector as a function of various apartment and building traits as well as tenancy duration. These data are also included in the Housing and Vacancy Survey. The magnitude of the subsidy to a controlled apartment is (minus) the difference between the unit’s actual rent and the unit’s predicted rent which is based on the value of the controlled apartment’s trait vector (and
7This assumes that our subsidy measure accurately captures the loss of potential rent to landlords. Landlords are thought to recoup some of the loss through key money-type payments. These transfers were not legal in 1968 and we have no data on them.
From the renter’s perspective, a utility-based measure (such as the compensating variation) of the value of the implied subsidy is needed. It is possible that a large implied subsidy is not highly valued by a renter because the renter is (say) severely income-constrained and would much rather consume something besides housing services. Thus, it is possible that such renters with big implied subsidies have very little incentive to perform self-maintenance.

RENT CONTROLS AND RENTAL HOUSING QUALITY 403
tenancy) evaluated at uncontrolled sector trait prices. See Gyourko and Linneman [4] for further details of the estimation of this equation. The mean annual subsidy (in 1984 dollars) to controlled units is $2125 with the standard deviation of the distribution equal to $3147. Stated differently, some controlled units are renting at vastly larger amounts below “free market” rents than other controlled units. Note that by using this variable, we implicitly assume that the sampled unit (or units) is representative of the average unit in the building. If this is not true, the signal-to-noise ratio of the variable may be relatively low.
Of course, other factors besides rent control status and implied subsidy affect the condition of rental units. The boroughs of New York are not all alike. For boroughs in which space is extremely valuable on the free market, the opportunity cost of controls is particularly high (from the landlord’s perspective). Although tenants have an incentive to self-maintain, we expect relatively lower quality-controlled housing in such locations. Apartment building location can be identified only at the borough level, although finer jurisdictional detail is desirable. The rental units in our sample are located in all boroughs of New York City. However, the sample contains few observations from Richmond. Consequently, Queens and Richmond obser- vations were combined and treated as a single borough in the estimation.
The age of the building in which the rental unit is located affects quality. We expect newer buildings to be in better condition, all else constant. The survey reports the year the structure in which the observed apartment is located was built, in one of four categories: (a) built in 1967 or 1968, (b) built during 1960-1966, (c) built during 1947-1959, or (d) built prior to 1947. There were few units in structures built in 1967 or 1968. Conse- quently, categories (a) and (b) were combined.
Various structural traits of the rental units and of the buildings they are in are also reported in the survey. The structural trait we focus on is whether the unit is in a high-rise structure or not. This variable serves as a quality proxy with high-rise status connoting relatively high quality. The number of stories in the building is reported as one of seven values. Buildings with six or fewer stories are identified directly by the number of stories. Buildings with seven or more stories are classed together. We define a high-rise as a structure with seven or more stories.
Due to the dichotomous nature of the dependent variable, we estimate building condition incidence via the logistic function
P(Sound = 1) = I + eX,r,
where P(Sound = 1) is the probability that the unit is in Sound condition,

404 GYOURKO AND LINNEMAN
TABLE 2 Variable Key
(I) Borough dummies (a) Manhattan (b) Brooklyn (c) Bronx (d) Queens/Richmond is the omitted category
(2) Building age dummies (a) Built 1947-1959 (b) Built 1960-1968 (c) Built pre-1947 is the omitted category
(3) Rent control status dummy-Control (a) Control = 1 if rent controlled; Control = 0 if uncontrolled
(4) High-rise Status-High rise (a) High rise = 1 if seven or more stories; High rise = 0 if less than
seven stories (5) Subsidy
(a) Implicit subsidy to rent controlled units; Subsidy = 0 for uncontrolled units
X is the vector of explanatory variables, and fi is the vector of logit coefficients. Table 2 provides a variable key describing all the independent variables in the X vector. Table 3 provides summary statistics for these variables. Note that the implied rent control subsidy variable is best thought of as an interaction term with the rent control status dummy because the subsidy value is zero for all uncontrolled units.
The marginal effect of the change in the probability of a unit’s being classified as in sound condiiton from a small change in a continuous explanatory variable is
JP(Sound = 1) ax,
= P(1 - PM,, (2)
where X, is the k th explanatory variable, pk is that variable’s estimated logit coefficient, and P is at its maximum at 0.5 (i.e., when X’j3 = 0). Except for the subsidy variable, our explanatory variables are dummy variables. Hence, it is necessary to calculate the differential implied proba- bility associated with discrete shifts in dummy variables. Consequently, we calculate the ceteris paribus effect of (say) a change in rent control status (Control) as
P( Sound = 1) 1control-0 - P( Sound = 1) /control-r
RENT CONTROLS AND RENTAL HOUSING QUALITY 405
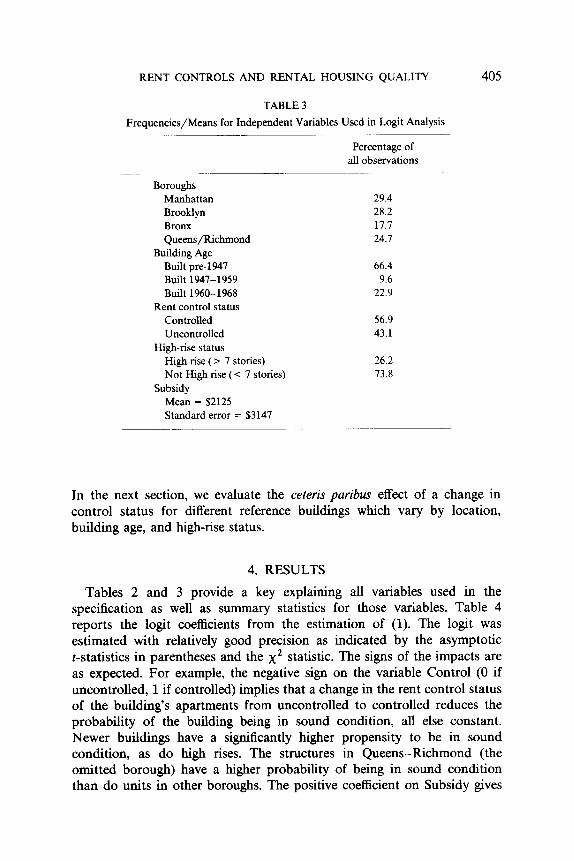
TABLE 3
Frequencies/Means for Independent Variables Used in Logit Analysis -
Percentage of all observations
Boroughs Manhattan Brooklyn Bronx Queens/Richmond
Building Age Built pre-1947 Built 1947-1959 Built 1960-1968
Rent control status Controlled Uncontrolled
High-rise status High rise (> 7 stories) Not High rise (< 7 stories)
Subsidy Mean = $2125 Standard error = $3147
29.4 28.2 17.7 24.7
66.4 9.6
22.9
56.9 43.1
26.2 73.8
In the next section, we evaluate the ceteris paribus effect of a change in control status for different reference buildings which vary by location, building age, and high-rise status.
4. RESULTS
Tables 2 and 3 provide a key explaining all variables used in the specification as well as summary statistics for those variables. Table 4 reports the logit coefficients from the estimation of (1). The logit was estimated with relatively good precision as indicated by the asymptotic t-statistics in parentheses and the x2 statistic. The signs of the impacts are as expected. For example, the negative sign on the variable Control (0 if uncontrolled, 1 if controlled) implies that a change in the rent control status of the building’s apartments from uncontrolled to controlled reduces the probability of the building being in sound condition, all else constant. Newer buildings have a significantly higher propensity to be in sound condition, as do high rises. The structures in Queens-Richmond (the omitted borough) have a higher probability of being in sound condition than do units in other boroughs. The positive coefficient on Subsidy gives

406 GYOURKO AND LINNEMAN
TABLE 4 Logit Coefficients
Intercept
Manhattan
Brooklyn
Bronx
Built 1947-1959
Built 1960-1968
Control
Subsidy
High rise
- 2 log L (model) = 7817.59 - 2 log L (intercept only) = 10,233.02 Model x2 with 8 df = 2415.43
2.35” (20.25)b - 1.82 (16.93) - 1.25 (12.05) - 1.24 (11.09)
1.58 (7.17) 3.49
(7.60) - 0.43 (4.56) 0.00003
(3.31) 3.44
(12.11)
“Coefficients for “not good” status are set to zero. bNumbers in parentheses are asymptotic t-statistics.
some indication of the strength of the self-maintenance effect and highlights that controls do not influence all controlled units and buildings equally. The marginal effect as calculated via (2) of the implicit rent control subsidy evaluated at the sample average frequency of being in sound condition is +0.000005. This is not a very strong effect as it implies that a $1000 increase in the annual implicit subsidy (whose mean is $2125) increases the probability of the building being in sound condition by 0.5% (0.005).
Table 5 presents calculations of the effects of changes in rent control status on unit quality for various reference apartment units which differ by location, building age, and high-rise status when all else is held constant. For example, the first quadrant of numbers reports the probabilities of being in sound condition for controlled buildings in Manhattan constructed prior to 1947. The first column in the quadrant is for high-rise buildings and the second column is for all other buildings. The first row of this quadrant reports the expected probability of being in sound condition if in the uncontrolled sector. The second row reports the same probability for

TABL
E 5
Mar
gina
l Ef
fect
s of
Con
trol
Stat
us o
n Pr
obab
ility
of B
eing
in
Soun
d C
ondi
tion
by B
orou
gh,
Build
ing
Age,
and
Hig
h-R
ise
Stat
us
-
Con
trol
stat
us
and
Build
ing
diffe
rent
ial
age
effe
ct
..--
Built
U
ncon
trolle
d pr
e-19
47
Con
trolle
d D
iffer
entia
l ef
fect
Built
U
ncon
trolle
d 19
47-1
959
Con
trolle
d D
iffer
entia
l ef
fect
Built
U
ncon
trolle
d 19
60-1
968
Con
trolle
d D
iffer
entia
l ef
fect
Man
hatta
n Not
H
igh
rise
high
ris
e
0.98
14
0.62
95
0.97
34
0.53
99
- -
0.00
80
0.08
96
0.99
61
0.89
19
0.99
44
0.85
07
__
- 0.
0017
0.
0412
0.99
94
0.98
24
0.99
92
0.97
47
- -
0.00
02
0.00
77
Boro
ugh
Broo
klyn
Br
onx
Que
ens
Hig
h ris
e N
ot
Not
N
ot
high
ris
e H
igh
rise
high
ris
e H
igh
rise
high
ris
e
0.98
94
0.98
48
0.00
46
0.99
78
0.98
68
0.00
10
0.99
97
0.99
95
0.00
02
0.75
03
0.98
95
0.67
48
0.98
49
-__
0.07
55
0.00
46
0.93
58
0.99
78
0.90
97
0.99
69
- -
0.02
61
0.00
09
0.98
99
0.99
97
0.98
55
0.99
95
-- 0.00
44
o.oo
o2
0.75
21
0.99
70
0.66
70
0.99
56
-- 0.07
51
0.00
14
0.93
64
0.99
94
0.91
05
0.99
91
-- 0.02
59
0.00
03
0.99
00
0.99
99
0.98
57
0.99
99
-- 0.00
43
0.00
00
--~~
~___
0.91
29
0.87
87
0.03
42
0.98
07
0.97
23
0.00
84
0.99
71
0.99
58
0.00
13

408 GYOURKO AND LINNEMAN
controlled sector structures. The third row is the differential impact of control status on a building being in sound condition as described in (3).*
Table 5 shows that rent controls have had a substantial impact on the quality of the rental housing stock in New York City. However, the impact is basically confined to non-high-rise structures. The differential effect of rent controls on the condition of high rises is negligible. High rises are consistently high quality and well-maintained structures regardless of age, borough, or control status. Among the pre-1947 buildings in particular, the high rises almost certainly are newer and of intrinsically higher quality than are the buildings under six stories. This is indicated by the substantially lower probabilities of smaller pre-1947 buildings being in sound condition. The difference is largest in Manhattan (63% versus 98%) and smallest in Queens (91% versus 99%).
Rent controls have had their biggest adverse quality effect on the already relatively deteriorated rental housing stock in smaller buildings. The im- pacts are largest in Manhattan. For smaller pre-1947 buildings in Manhat- tan, there is an 8.96% higher probability of being in unsound condition if the building’s units are rent controlled versus uncontrolled. The analogous effects for Brooklyn and Bronx are around 7.5%. The adverse impact on quality is smallest in Queens at 3.42%.
The impacts are much less in newer smaller buildings and are nonexistent for units in buildings under ten years old. Still, there is an identifiable impact on buildings only ten to twenty years old. The differential effect is just over 4% in Manhattan and 2.5% in Brooklyn and Bronx. There is a negligible effect in Queens. While the newer buildings were not yet affected, these findings give some indication of what we might expect today for structures built in 1960-1968.9
5. CONCLUSION
The negative influence on the quality of apartment buildings from New York City’s rent control law has taken some time to have a visible impact. However, the long-term influence has been quite substantial. In Manhattan, we found that there was almost a 9% higher probability of an older and
sin these calculations, we assume the sample controlled sector mean subsidy of $2125 for buildings containing controlled units. If the building is in the uncontrolled sector, the subsidy is assumed to be zero. Remember that the marginal impact of the implied subsidy is quite small. Even if the true subsidy was two standard deviations above the mean, the positive effect on building quality still does not come close to countering the substantial negative quality im
B act of being in the controlled sector in the first place.
These marginal effects are highly statistically significant. We calculated the standard errors of the marginal effects via the standard “delta” method. The resulting r-statistics on the marginal effects are even larger than those on the underlying logit coefficients because the elements of those coefficients’ variance-covariance matrix tend to be quite small.

RENT CONTROLS AND RENTAL HOUSING QUALITY 409
smaller building being in unsound condition if its units were rent controlled versus uncontrolled. Only slightly smaller effects were found in Brooklyn and Bronx. The deleterious effect of controls was always smallest in Queens.
Other factors such as age and intrinsic building quality obviously play more important roles in determining quality. However, it is not possible for cities to ban old buildings or desirable for them to ban smaller structures not of the highest quality to begin with. Rent controls are deliberately imposed. The quality effects documented here and the supply effects docu- mented elsewhere show the costs of controls to be very high. Given the very small distributional impacts we have reported in other work, it is virtually impossible to justify this price control as good public policy.
REFERENCES 1. W. Bloch and E. Olsen @is.), “Rent Control: Myths and Realities.” Simon Fraser
Institute, Vancouver (1981). 2. .I. S. De Salvo, “Reforming Rent Controls in New York City: Analysis of Housing
Expenditures and Market Rents,” Reg. Sci. Asso. Pup. 2, 195-227 (1971). 3. G. FaIlis and L. B. Smith, Uncontrolled prices in a controlled market, Amer. Econom.
Rev. 74(l) 193-200 (1984). 4. J. Gyourko and P. Lirmeman, “Equity and efficiency aspects of rent control: An empirical
study of New York City,” Urban Econom. 26, 54-74 (1989). 5. B. A. Kalymon, Apartment shortages and rent control, in Rent Control: Myths and
Realities, (W. Bloch and E. Olsen, Eds.), Chap. 12, Simon Fraser Institute, Vancouver (1981).
6. P. Linneman, The effects of rent control on the distribution of income among New York City renters, J. Urbun Econom., 22, 14-34 (July 1987).
7. D. Marks, The effects of rent control on the price of rental housing, Land Econom. 60, 81-94 (1984).
8. E. 0. Olsen, An economic analysis of rent controls: An empirical analysis of New York’s experience, J. PO/~. Econom., 1081-1110. (November/December 1972).
9. E. A. Roistacher, “The Distribution of Tenant Benefits under Rent Control.” Ph.D. dissertation, University of Pennsylvania, Philadelphia, PA (1972).
10. P. C. Rydell et al., “The Impact of Rent Control on the Los Angeles Housing Market,” Rand Corp., Santa Monica (1981).
11. D. F. Vitaliano, The short-run supply of housing services under rent control, Urban Stud. 22, 535-542 (1985).