renewables and clean energy for industries japanese...
TRANSCRIPT

Akira YABE (Dr., Director General)
New Energy and Industrial Technology Development Organization (NEDO)
Technology Strategy Center (TSC)
Renewable Energy/Energy System & Hydrogen Unit
Renewables and Clean Energy for Industries –Japanese Case for Variable Renewable Energy Highly Penetrated Energy System and for Replacement of Fossil-fuel Fired Boilers-

TSC Energy system & Hydrogen Unit
NESTI 2050
220502030
To
tal G
lob
al G
HG
em
iss
ion
(C
O2-b
as
e)
Short – Middle Term Middle – Long Term
Innovative Technologies57 Bt-CO2
24 Bt-CO2
(Half of now)
50 Bt-CO2
(Now)
Reduction Potential:
~10 Bt-CO2
← 2℃ Scenario target
(COP21)
Energy System Integration Technologies with Core Technologies(IoT, AI, Big Data, Power Electronics, Sensors, Superconductivity)
Innovative Production Processes (Membrane Separation) Ultralight Materials
Next-Generation Storage Batteries
Use of Hydrogen
Next-Generation Solar Power Generation
Next-Generation Geothermal Power Generation
Capture and Effective Usage of CO2
Creation of New
Technological Seeds
20402020
(National Energy and Environment Strategy for Technological Innovation towards 2050)

Ministry of Economy, Trade and IndustryAgency for Natural Resources and Energy
3
0%
10%
20%
30%
40%
50%
60%
70%
80%
90%
100%
1954
1958
1962
1966
1970
1974
1978
1982
1986
1990
1994
1998
2002
2006
2010
2014
First Oil Shock
76 %Coal
Oil
Natural Gas
NuclearHydro
Coal
Renewables etc.
(FY)
Japan’s Energy Supply Structure
Japan’s Primary Energy Source
Source: Prepared based on “Comprehensive Energy Statistics 2015”
issued by the Agency for Natural Resources and Energy.
* “Renewables etc.” consists of solar power (0.2%), wind power (0.2%), geothermal heat (0.1%), and biomass (1.8%),
effective recovery use of wasted energy(1.9%).
45%
4%*
3%
0%
24%
24%

Ministry of Economy, Trade and IndustryAgency for Natural Resources and Energy
Trends in Final Energy Consumption in Japan
(millions kL of crude oil equivalent)
4
Final energy
consumption
1973→2014
1.2-times
Tra
nsporta
tion
19732014
1.7-time
19732014
2.2-times
Consum
er
Resid
entia
l
19732014
2.0-times
Com
merc
ial
19732014
2.4-times
Industry
19732014
0.8-times
The final energy consumption of Japan has basically consistently increased, except for periods immediately
following the two oil crises and the recent economic downturn.
Until 2014 the GDP continued increasing to about 2.5 times the 1973 level and the consumption of energy for
individual sectors significantly increased with the Consumer sector increasing to about 2.2 times, while the
transportation sector increased to about 1.7 times, whereas the industrial sector decreased to about 0.8 times.
(JPY trillion)
Sources: “Comprehensive Energy Statistics” and “Annual Report on National Accounts.”
0
100
200
300
400
500
600
0
50
100
150
200
250
300
350
400
450
197375 80 85 90 95 2000 05 10 14 (年度)
Industry sector
Residential sector
Transportation sector
Commercial sector
16%
9%
9%
66%
23%
14%
18%
45%
Real GDP1973→2014
2.5 Times

Ministry of Economy, Trade and IndustryAgency for Natural Resources and Energy
1.0
1.1
1.2
1.3
1.4
1.5
1.6
1.7
1.8
1.9
2.0
19
73
19
74
19
75
19
76
19
77
19
78
19
79
19
80
19
81
19
82
19
83
19
84
19
85
19
86
19
87
19
88
19
89
19
90
19
91
19
92
19
93
19
94
19
95
19
96
19
97
19
98
19
99
20
00
20
01
20
02
20
03
20
04
20
05
20
06
20
07
20
08
20
09
20
10
20
11
20
12
20
13
20
14
0.81.0 1.1 1.1 1.2 1.4 1.4 1.6
2.02.3
4.8 4.95.3
6.15.5
6.2
7.8
2.5
0
1
2
3
4
5
6
7
8
9
Japan has improved energy efficiency by approx. 40% after the oil crises in the
1970s as a result of positive actions by both public and private industrial
sectors.
Japan intensively introduced "Energy Management System based on the Act on
the Rational Use of Energy”, then achieved the lowest level of energy
consumption per GDP in the world.
Japan’s Energy Efficiency Efforts after the Oil Crises
Source)Total Energy Statistics by ANRE/METI
Primary energy use per real GDP of Japan(Oil converted Mt /1 trillion yen)
Approx. 40% improvement
Calculated according to IEA statistics
Primary energy supply per GDP unit of each country
(2013)(Index : Japan=1.0)
5
み

1,065 billion kWh
Energy conservation
+ renewable energy
account for 40%.
The Energy Mix (Power demand and power source composition)
Thorough energy efficiency
and conservation
196.1 billion kWh
17% lower than before the
implementation of the energy
conservation measures
Electric
power
980.8 billion
kWh
Power demand Power source composition
(Total generated energy)
1,278 billion kWh
(Total generated energy)
2030 20302013
(Actual result)
Economic growth
1.7%/year
Electric
power
966.6 billion
kWh
Petroleum 2%
Coal
22%
LNG
22%
Nuclear power
17 to 18%
Renewable energy
19 to 20%
Energy conservation
17%
Renewable energy
22 to 24%
Nuclear power
20 to 22%
LNG
27%
Coal
26%
Petroleum 3%
(Power transmission
/distribution loss, etc.)
Hydroelectric
8.8 to 9.2%
Solar power
7.0%
Wind power 1.7%
Biomass
3.7 to 4.6%
Geothermal
1.0 to 1.1%
Base load ratio:
56%
* Values are approximate.
6Japanese Energy Situation Sept.2016, Agency for Natural Resources and Energy
Ministry of Economy, Trade and IndustryAgency for Natural Resources and Energy

Ministry of Economy, Trade and IndustryAgency for Natural Resources and Energy
Energy Efficiency Measures
<Major energy efficiency measures in each sector>
Industrial Sector <approx. -10.42 million kL>
Major 4 industries (steel, chemical, cement, and paper/pulp)
Promotion of commitment to a low-carbon society
Strengthened energy management in factories
Improvement of energy efficiency by making production lines
observable
Development and introduction of innovative technology
Introduction of environment-conscious iron manufacturing process
(COURSE50)
(CO2 reduction by approx. 30% by hydrogen reduction of iron ore and CO2 separation from
blast furnace gas)
Introduction of technologies to use CO2 as raw material etc.
(CO2 and water are used with solar energy to produce major chemicals.)
Introduction of highly efficient facilities across several types of industries
Low-carbon industrial furnace, high-performance boiler, cogeneration,
etc.
Japanese Energy Situation Sept.2016, Agency for Natural Resources and Energy7

TSC Energy system & Hydrogen Unit
Curtailment on Renewable Energy of PV in Japan
PVs have penetrated rapidly after the introduction of Feed in Tariff (FIT) in July 2012. Installed capacity of PVs have surpassed 20GW at the end of FY2014 and is expected over 60GW in 2030.
PVs account for 95% of certified capacity under FIT and are concentrated in specific areas such as Kyushu, Hokkaido and Tohoku. Certified capacity under FIT is greater than off-peak demand in these regions.
8
[GW][GW]Kyushu
17.9
8.80
5
10
15
20
Demand(off-peak)
Certifiedcapacity
[GW] Hokkaido
3.3 2.7
0
1
2
3
4
Demand(off-peak)
Certifiedcapacity
Tohoku
11.5 9.7
0
3
6
9
12
Demand(off-peak)
Certifiedcapacity
Installed Capacity of Renewable Energy

TSC Energy system & Hydrogen Unit
In this figure, supply & demand curve in Kyushu area on May. 4th ,2016 (Japanese holiday week) is shown.
Is was required to follow 2000MW/hour load lumping, pumped hydro generation and restart of stopped thermal units.
9Source: Kyusyu Electric Company
Supply & Demand in Kyushu Electric Area
Duck Curve

TSC Energy system & Hydrogen Unit
Estimated Curtailment Ratio in 2030
The curtailment of PV and wind power generations increased to about 15% at about 2 times penetration of the PV and wind prospect in 2030 based on the Long-term Energy Demand and Supply Prospects published in 2015.
10Fig. Estimated curtailment ratio of PV and wind.
About9%(PV:64GW,Wind:10GW)About18%(PV:103GW
,Wind:32GW)
This amount would be
equivalent to the total
amount of annual
generated power for
the 1GW LNG fired
thermal power plant.

TSC Energy system & Hydrogen Unit
11
VPP(Virtual power Plant) Project started from 2016

TSC Energy system & Hydrogen Unit
12
Virtual Power Plant (VPP) for Air-Conditioning of Factories
One Virtual Power Plant Project has been started at 2016 for air-
conditioning and for the thermal management of factories and
large scale of buildings by use of Demand Response.
This is 5 years’ Japanese National Project under METI and the
technology utilizing thermal storage tank of water would be utilized
for not only the Nega-Watt Demand Response but also the Posi-
Watt Demand Response.
Utilization of Surplus PV power for the thermal management and
air-conditioning of factories and large scale of buildings
⇒Operating the Compressor of Heat Pump for generating and
storing the Cooled Water
Reducing the Power of Compressor for corresponding the
decrease of PV power generation ⇒ Stop the Compressor of Heat
Pump and deliver the cooled and heated water for continuing the
thermal management and air-conditioning of factories

TSC RE / Energy system & H2 Unit
Demand Response for Industrial and Business Sector
• DR for Highly Distributed Energy System
– For Industrial use, For Business use air conditioner ~ ZEB
13
Nega-watt DR for Industrial and Business Sector
Posi-watt DR for Industrial and Business Sector
• In a future electric power system with high penetration PV, the surplus power may occur during the daytime in the middle season of low electricity demand.
• To avoid PV output suppression control, electric storage or Posi-watt DR would be one of the measures for absorbing the surplus power.
• Manufacturing Companies Utilizing Electric Furnaces (Metal Refinery ,Industrial Electric Oven) would able to utilize the renewable energy of PV.– [Now] Electric Furnace is in operation mainly at night while the electricity price
had been low (in Japan).
– [Future] Electric Furnace will be in operation mainly in the daytime and more in the low demand seasons while the electricity price would be low enough because of surplus power from large amount of RE in low electricity demand season.==> Operational Formation Change would be necessary
TSC Energy system & Hydrogen Unit
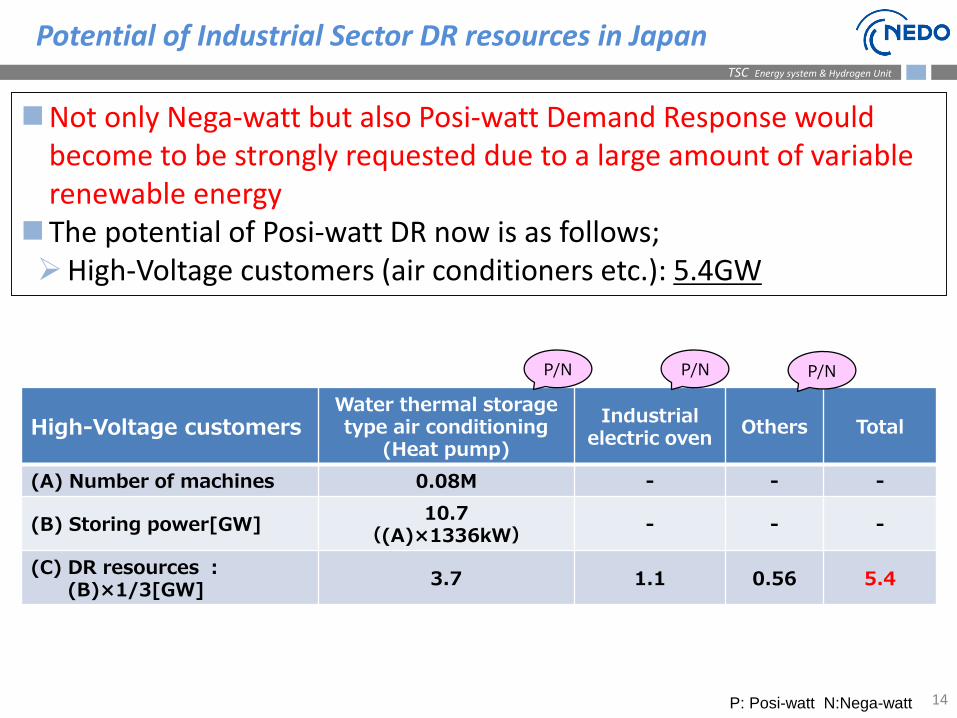
Potential of Industrial Sector DR resources in Japan
Not only Nega-watt but also Posi-watt Demand Response would become to be strongly requested due to a large amount of variable renewable energy
The potential of Posi-watt DR now is as follows;High-Voltage customers (air conditioners etc.): 5.4GW
14
High-Voltage customersWater thermal storage type air conditioning
(Heat pump)
Industrial electric oven
Others Total
(A) Number of machines 0.08M - - -
(B) Storing power[GW]10.7
((A)×1336kW)- - -
(C) DR resources :(B)×1/3[GW]
3.7 1.1 0.56 5.4
P/N P/N
P: Posi-watt N:Nega-watt
P/N

TSC RE / Energy system & H2 Unit
Smart Community with Hydrogen Energy (FS)
• “Hydrogen CGS”, which is composed of hydrogen gas turbine(s) andwaste heat boiler(s), could be one of the promising energy system foreffective energy utilization at a community. Feasibility study of thissystem is now ongoing.
15
Waste Heat Boiler
Gas Turbine
Network
Electricity
Heat
Hydrogen,Natural Gas
Hydrogen CGS
*CGS: Co-generation System
*EMS: Energy Management System
Hydrogen would
be able to be
generated from
the surplus
energy by
electrolysis.
Integrated EMS
TSC Energy system & Hydrogen Unit
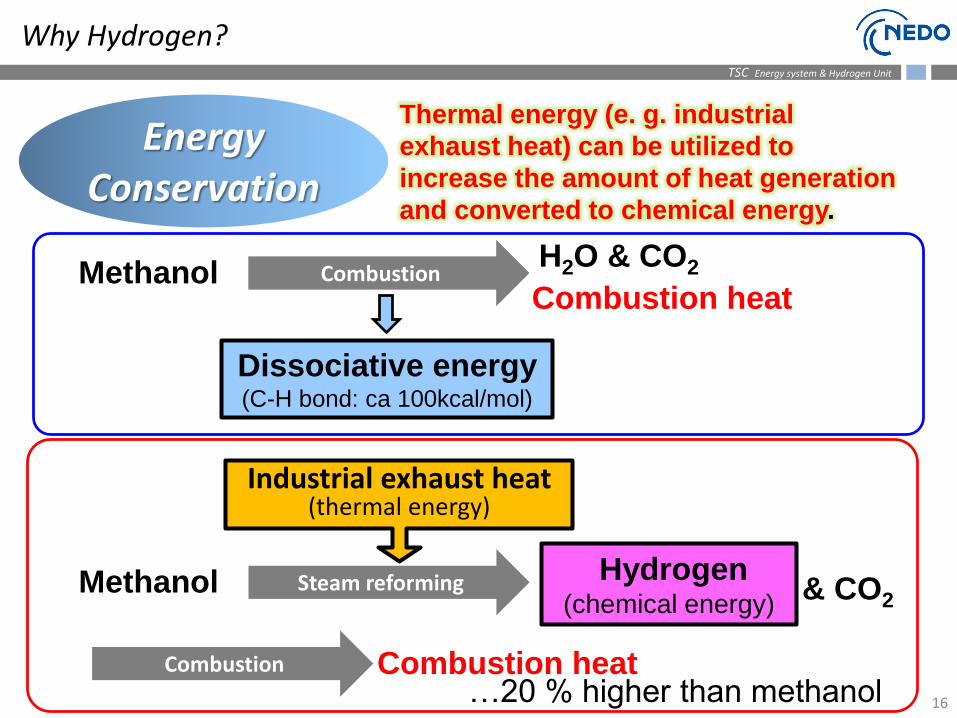
Why Hydrogen?
16
Energy Conservation
Methanol Steam reforming
Industrial exhaust heat(thermal energy)
& CO2
Hydrogen(chemical energy)
…20 % higher than methanol
Thermal energy (e. g. industrial
exhaust heat) can be utilized to
increase the amount of heat generation
and converted to chemical energy.
Methanol Combustion
Dissociative energy(C-H bond: ca 100kcal/mol)
H2O & CO2
Combustion heat
Combustion Combustion heat

TSC Energy system & Hydrogen Unit
Hydrogen Demand and Supply
17
【assumption】2015: 1000 cars
2030: 2 million cars
【assumption】50% mixed combustion with LNG
(for newly established /replace plant)
Domestic supply 12~18
0.2 0.2 0.20.001
2.7
0~22
Overseas supply9
Domestic supply 11~17
Overseas supply1
Self-consumption in Factories About 15
(Only demand)
2012Demand Supply
2015
(estimated)
Demand Supply
2030
Annual
Hydrogen
Demand &
Supply
(Billion Nm3)
• Liquid hydrogen
• Organic hydride (methylcyclohexane)
• Fossil fuel oil and natural gas, etc.
• By-products from the steel mills and chemical plants
Hydrogen power generation
FCV
Outdoor sale hydrogen(Industrial gas)
Self-consumption in industrial sector
Surplus Supply of Variable Renewable Energy would be able to be converted to Hydrogen
by Electrolysis for the large amount of use in Factories(Industrial Sector).

TSC Energy system & Hydrogen Unit
18
Fuel Cell Vehicle
Toyota “MIRAI”
Debut: Dec 15, 2014
Micro-CHP “ENE-FARM”
(FC: PEFC/SOFC)
On Market: 2009
1st Hydrogen Station
July, 2014
Development of H2 & FC’s Technology in Japan
2003
2002FCHV-adv
(TOYOTA)
X-TRAIL FCV
(NISSAN)
2008
2014 TOYOTA
: 1st commercial model
FCX Clarity
(HONDA)
Honda FCEV CONCEPT
2016 HONDA

TSC Energy system & Hydrogen Unit
19
Large Scale Hydrogen Supply-Chain & Utilization
Production
Renewable Energy
・ Hydrogen Carriers- Liquid H2
- Methylcyclohexane
- NH3 etc.
・ Electrolysis
Utilization
・ FCV・ Power generation
- Gas Turbines
- Stationary FCs
Storage &
Transportation
Support the building of
HRS. Partially subsidize
activities for creating new
demand, etc.
Significantly expansion of use of hydrogen energy(Full-scale market introduction of FC)
Phase 1
Full-Scale market introduction of Hydrogen Power Plant / Develop mass-scale hydrogen supply chain
Phase 2
Establish CO2-free Hydrogen Supply Chain
Phase 3
Focus on implementation from the present Realize in the late 2020s Realize in 2040s
Promote of stationary FCs Promote of FC vehicles
Subsidies for supporting
introduction of micro-CHP
(ENE-FARMs) [15 billion yen]
Promote the accelerated
introduction of ENE-
FARMs. Promote lower
cost through mass
production.
Subsidies for building HRS
[11 billion yen]
Support for introducing FCV
[Included in 30 billion yen]
Technology development
and demonstration of FCs
[4.0 billion yen]
Conduct R&D to enhance
performance and lower
costs of FCs, and
demonstrate commercial
applications of FCs.
FCs for
commercial
application
R&D of fuel cells, etc.
Develop technologies to lower
costs of HRS, enhance safety
and security and collect data
so as to review regulations.
Build a hydrogen supply chain
Demonstrate how hydrogen can be
produced from unused overseas
energy resources, e.g., by-product
hydrogen, lignite, etc., transported in
the form of liquid hydrogen or
chemical hydride, and used to
generate power.
Construct a hydrogen energy network
Build a network that effectively
connects multiple hydrogen
applications in the region.
Develop hydrogen production, transport and storage technologies
Developm technologies for producing,
transporting and storing hydrogen derived
from renewable energy sources [1.75 billion
yen]
Develop technologies of high efficiency water
electrolysis units, tanks for storing liquid
hydrogen, etc. with the use of renewable energy
sources .
Technology development
for hydrogen fueling
stations, etc.
[4.5 billion yen]
Demonstrations for building a supply chain of
hydrogen imported from untapped overseas
energy resources [3.8 billion yen]
Construct a hydrogen energy
network
[Included in 3.0 billion yen]
+ CCS
Unutilized Energy
(ex. Brown coal)
Feasibility Study has been conducted by
several Chemical and Engineering
Companies in Japan for utilizing the surplus
renewable energy of the world.
・ Reforming

TSC Energy system & Hydrogen Unit
20
Replacement of Fossil-fuel Fired Boiler for Industries
For reducing the global CO2 emission largely in 2050, the fossil
fuel fired boiler should be replaced by the clean energy or
renewable energy.
Some challenges has been conducted so far and some
candidates for the replacement would be imagined.
1. The thermal output of 200℃ High Performance
Compression Type Heat Pump System has been challenged so
far.(NEDO Project)
2.The Boilers Utilizing Wooden Biomass and methane
fermentation have been promoted to develop for the regional
community systems including industries.
3. The SOFC combined heat and power (CHP) would have the
potential for providing the heat for boiler to generate the steam.
4.The concentrated solar heater would have the potential for
producing the steam for industries.

TSC Energy system & Hydrogen Unit
21

TSC Energy system & Hydrogen Unit
22

TSC Energy system & Hydrogen Unit
23

TSC Energy system & Hydrogen Unit
24
Regional Application of Biomass Energy
Actual Proof
Test
Wooden
Biomass
Biomass Boiler
Pulp Factories
Biomass Power Plant

TSC Energy system & Hydrogen Unit
25
Regional Application of Biomass Energy
Gasification
Waste Food,
Sewege waste
Methane
fermentation
Insert in City
Gas Pipeline
Factories
Mixed Usage of City Gas and Bio Gas

TSC Energy system & Hydrogen Unit
26
Summary and Conclusion
1. The energy conservation for the industrial sector has been
challenged and promoted over 40 years in Japan to develop the
high performance energy conservation equipment.
2. For many countries and the future figures of the world which
have the Variable Renewable Energy Highly Penetrated
Energy System, the surplus of energy supply based on the
variable renewable energy would be occurred and then the
various challenges utilizing the surplus energy for the use of
industrial sector would be generated and promoted.
3. For reducing the global CO2 emission largely in 2050, the
fossil fuel fired boiler should be replaced and various challenges
including the development of 200℃ High Performance
Compression Type Heat Pump and Boilers Utilizing Biomass for
the regional community systems has been conducted.