renewable energy resource management for a sustainable
TRANSCRIPT

RENEWABLE ENERGY RESOURCE MANAGEMENT FOR A
SUSTAINABLE ELECTRICITY SUPPLY FOR PATHUM THANI
PROVINCE IN THAILAND
BY
TOBIAS KULLACK
A THESIS SUBMITTED IN PARTIAL FULFILLMENT OF
THE REQUIREMENTS FOR THE DEGREE OF MASTER OF SCIENCE
(ENGINEERING AND TECHNOLOGY)
SIRINDHORN INTERNATIONAL INSTITUTE OF TECHNOLOGY
THAMMASAT UNIVERSITY
ACADEMIC YEAR 2015

ii
Acknowledgements
Firstly, I would like to express my sincere gratitude to my advisor Dr.
Supachart Chungpaibulpatan for the continuous support of my Master of Science study
and related research, for his patience, motivation, and immense knowledge. His
guidance helped me in all the time of research and writing of this thesis. I could not
have imagined having a better advisor and mentor for my study. Furthermore I would
like to thank Dr. Supachart and SIIT to supporting my research with a full scholarship.
Besides my advisor, I would like to thank the rest of my thesis committee for their
insightful comments and encouragement, but also for the hard question which incented
me to widen my research from various perspectives.
Last but not the least, I would like to thank my family; My mother and my dad for being
a great support in every possible way, to my brothers and sister for supporting me
spiritually throughout study and especially my life in general. You are the greatest part
and support of all. Thank you.

iii
Abstract
RENEWABLE ENERGY RESOURCE MANAGEMENT FOR A SUSTAINABLE
ELECTRICITY SUPPLY FOR PATHUM THANI PROVINCE IN THAILAND
by
Tobias Kullack
Bachelor of Engineering (Energy and Process Engineering)
Hochschule Ravensburg-Weingarten (2011)
Nowadays the renewable energy implementation and development
is being widely discussed in Thailand with its 20-Year Energy Efficiency Development
Plan (2011 - 2030) and additionally the 10-Year Alternative Energy Development Plan
2012 - 2021 (AEDP 2012 – 2021), which is targeting on increasing the share of
renewable energy and alternative energy uses by 25 percent instead of fossil fuels
within the next 10 years. To reach such an ambitious setting target, several measures
must be established with data supports from relevant feasibility studies. In this Thesis,
a province is being considered as a model to evaluate the renewable energy potential
and a 100 % renewable electricity supply is employed in this province. It is proposed
to be a feasibility study and Pathum Thani, a province in the vicinity of Bangkok, is
selected as a case study. Different scenarios are discussed and analyzed for their
possibilities in terms of technical, economic and environmental aspects.
This thesis strongly focus on the renewable energy potential of the Pathum Thani
province in Thailand. A simulation model has been developed to simulate the hourly
electricity potential of several renewable energy sources and their interaction while
taking the actual electricity consumption of the province into account. Different
scenarios to achieve a 100% renewable electricity production from renewable energies
have been evaluated and verified with an hourly simulation, using the electricity
consumption of the year 2012, solar radiation of the year 2012 and Biogas and Biomass
feed stock of the year 2012. The hourly consumption and simulated production have

iv
been found to be mismatched to show possible weak points and bottlenecks of different
scenarios. Furthermore the total costs, including investment costs, operation,
maintenance and reinvestment costs have been considered to calculate the final
electricity costs for each system respectively. To limit the scope, not every site has been
measured and evaluated separately, however with the information given by the Land
Development Department Pathum Thani and the ArcGis software, a good overview can
be made and possible sites can be evaluated. This methodology has been used to
evaluate the rooftop area for the so called Small Solar installation. However as a case
study the rooftop area of the major university bodies in Pathum Thani has been
evaluated using Helioscope software and then been simulated. Furthermore the
discussion about agricultural products used for Biogas or being used for food supply
has not been regarded as this study will focus on the technical possibility and the general
requirements to fulfill the 100% renewable electricity supply. Different available land
areas have been evaluated and categorized according to size, actual use and soil
conditions. For the solar energy simulation, the actual radiation data from the
Meteorological Department of 2012 has been implemented into a ‘PVsyst’ simulation
software, in which a standard plant is used as a reference. Several scenarios inclusive a
Napier grass scenario are displayed to possibly cover 100% electricity supply by
renewable energies. The most optimized system appears to be a system consisting on
PV Solar Large scale installations on 1/25 covering the area of the soil condition
number 11 and the rest of the respective area used as Biogas feedstock by converting
the paddy rice fields to Napier grass fields. The system would require the less storage
capacity and the price is optimized and the costs per produced kWh inclusive of
necessary storage, considering a 25 years lifetime could be 0.126 USD/kWh.
The fact that the study does not consider the capacity of each individual substation but
focus on the overall renewable energy potential would require a detailed and sustainable
study on actual conditions and location of substations to more sustainable plan different
scenarios and moreover allocate the potential and regions based on the transformer and
free transformer capacity of each PEA substation
v
Table of Contents
Chapter Title Page
Signature Page ............................................................................... i
Acknowledgements ....................................................................... ii
Abstract ......................................................................................... iii
Table of Contents .......................................................................... v
List of Figures ............................................................................... vii
List of Tables ................................................................................. viii
1. Introduction ................................................................................... 1
1.1 Statement of Problem .............................................................. 1
1.2 Purpose of Study ..................................................................... 1
1.3 Significance of the Study ........................................................ 3
2. Literature Review ........................................................................... 4
2.1 Similar Studies Conducted ...................................................... 4
2.2 Similar Studies in Thailand ..................................................... 5
2.3 Energy Planning and Energy Forecasting Simulation
Models ........................................................................................... 5
2.4 Technology and Potential Review .......................................... 5
2.5 Thailand Electricity Consumption and General Grid
Situation......................................................................................... 7
3. Methodology .................................................................................. 8
3.1 Information Gathering ............................................................. 8
3.2 Hourly Consumption – EGAT SAI NOI ................................. 13
3.3 Set Up and Simulation of the Potential of Each Technology .. 23
3.4 Storage Technologies and Applications .................................. 28
3.5 Cost Analysis ........................................................................... 28
3.6 Resource Limitation and Simulation Constrains ..................... 30
4. Simulation Software ....................................................................... 31 5. Simulation Results ......................................................................... 32
5.1 100% Large Scale Solar Scenario ........................................... 33
5.2 Solar Rooftop Simulation of Major University Bodies ........... 37
5.3 Small Scale Solar Systems ...................................................... 42
5.4 100% Biogas and Biomass – Scenario .................................... 44
5.5 Mixed Scenarios to Cover 100% ............................................. 47
6. Result and Discussion ................................................................... 51

vi
7. Conclusions and Recommendations .............................................. 52
References ..................................................................................... 54
Appendix A – Simulation File ...................................................... CD
Appendix B – PVsyst Simulation .................................................. CD
Appendix C – Raw Radiation Data ............................................... CD
Appendix D – Biomass and Biogas Resources ............................. CD
Appendix E – Hourly Values 2012 Sai Noi Substation ................ CD
Appendix F – Wind Raw Data ...................................................... CD
vii
List of Tables
Tables Page
Table 1 Pathum Thani - Agricultural Usage - Land Size and
Percentage of Total Area ........................................................................... 11
Table 2 Other Agricultural Products - Pathum Thani .............................. 11
Table 3 Paddy Rice Area According to Soil Conditions and
Land > 10 Rai ........................................................................................... 11
Table 4 Numerical Soil Group Overview Pathum Thani ......................... 12
Table 5 Rice Planted and Harvested - Pathum Thani 2012 ..................... 13
Table 6 Biomass Potential from Rice Straw - Pathum Thani 2012 ......... 18
Table 7 Biomass Potential from Rice Husk - Pathum Thani 2012 .......... 18
Table 8 Livestock Pathum Thani ............................................................. 19
Table 9 Biogas Potential from Agricultural Waste - Pathum Thani ........ 20
Table 10 Oil Palm and Coconut Potential Pathum Thani ........................ 20
Table 11 CO2 Mitigation as Applicable in Thailand - Year 2011............ 24
Table 12 Yearly Balance - 100% Solar Scenario Pathum Thani ............. 34
Table 13 Cost Overview Solar System .................................................... 37
Table 14 Final Costs for 100% Solar Installation .................................... 37
Table 15 Cost Analysis of Solar Systems on University Rooftops
without Storage ......................................................................................... 41
Table 16 Cost Analysis Small Scale Solar Systems ................................ 44
Table 17 Biomass Cost Analysis ............................................................. 44
Table 18 Yearly Balance - 100% Biomass/Biogas System ..................... 45
Table 19 Napier Grass Potential .............................................................. 46
Table 20 Cost Analysis Napier Grass Potential ....................................... 47
Table 21 Simulation Results of Mixed Scenarios .................................... 48
viii
List of Figures
Figures Page
Figure 1 Overview Map -Pathum Thani ................................................... 9
Figure 2 Amphoe in Pathum Thani ........................................................... 9
Figure 3 Graphical Soil Group Overview - Pathum Thani ....................... 12
Figure 4 Yearly Load – Sai Noi and Assumed Base Load ....................... 15
Figure 5a Biogas/Biomass Overview ........................................................ 16
Figure 5 Example of a PVsyst P50/P90 Determination ............................ 28
Figure 6 Typical Installation and Maintenance Cost ................................ 29
Figure 7 Napier Grass Costs and Potential ............................................... 30
Figure 8 Monthly Overview - Consumption, Simulated Production
and Difference .......................................................................................... 34
Figure 9 Yearly Overview of Hourly Production and Consumption –
100% Solar, Pathum Thani 2012 .............................................................. 35
Figure 10 Storage Status - 100% Solar Simulation ................................... 36
Figure 11 Load Shifting ............................................................................ 36
Figure 12 Thammasat Pathum Thani Area Overview in Google Maps .... 38
Figure 13 Solar Rooftop Overall Layout - Thammasat University .......... 39
Figure 14 Design Example - Thammasat University ................................ 39
Figure 15 Daily Simulation Profile Thammasat University ..................... 39
Figure 16 Bangkok University in Helioscope ........................................... 40
Figure 17 Rangsit University in Helioscope ............................................. 40
Figure 18 Overall Solar Production From Major Universities and
Total Load Consumption of Pathum Thani ............................................... 41
Figure 19 Potential of Small Scale Systems ............................................. 42
Figure 20 Monthly Load Profile - Small Scale Systems ........................... 43
Figure 21 Small Scale Load Profile Inclusive Storage ............................. 43
Figure 22 Biomass and Biogas Potential .................................................. 45
Figure 23 Biomass and Biogas Potential – Napier Grass ......................... 46
Figure 24 Scenario 4 - March inclusive Load Shifting and Storage ......... 49
ix
Figure 25 Scenario 4 - Yearly Overview of Production and
Consumption with Stacked Values ........................................................... 49
Figure 26 Yearly Overview of Scenario 4 as Non Stacked Graph ........... 50

1
Chapter 1
Introduction
1.1 Statement of Problem
Due to world wide price rises of electricity and the limitation of coal and oil, and due
to the energy policy in Thailand, generating at least 20% of its electricity by 2020 by
renewable energy technologies and implementing so called micro grids on islands to
guarantee and provide a sufficient and reliable electricity supply to remote areas, the
question of the total amount of renewable energy, which can be implemented by still
guarantee a reliable electricity is raising. Further the limitation of natural resources and
due to the time variance in the electricity generating from renewable energies, to
guarantee a reliable and sufficient electricity supply, the resources needs to be
evaluated, and displayed with the actual consumption. The actual consumption and
possible production, as in several studies carried out, should not be only regarded as a
daily or yearly average it has to be displayed as accurate as possible and the actual
values of a possible renewable electricity supply has to match each other. This on the
one hand needs a fast reacting grid for the future and on the other hand a good planned
and working electricity infrastructure with a communication from weather forecast to
electricity consumption forecast over to actual storage capacity and long term
management.
1.2 Purpose of Study
The purpose of this study is to obtain the renewable energies which generally could be
implemented. It will display the available renewable energy resources, simulate for
possible systems the hourly electricity production from each resource and technology
respectively. During the study a match between the consumption in 2012 and the actual
resource data is being done and then used as a calculation basis for the actual electricity
production. A program to evaluate different set ups with key points has been developed
and is used to simulate and display different possible scenarios.
• 100 % renewable energy scenario
• Minimizing of the costs of different renewable energy scenarios
2
• Impact of solar rooftop systems
• Required storage technology and storage size
The overall outcome of this study are several system and set ups to theoretically supply
a maximum amount, in the best case 100%, of electricity by renewable energies in
Pathum Thani Province. Further as outcome of this study a cooperation between GIZ
(Deutsche Gesellschaft für Internationale Zusammenarbeit - German International
Cooperation), Fraunhofer Institute and KMUTT (King Mongkut’s University of
Technology Thonburi) has been started to conduct a similar study for 4 further
provinces, named as Nan, Rayong, Phuket and Chonburi to display the potential of
renewable energy sources in usage for electricity and further gas/heat supply and
simulate a maximum share of each technology. This has been achieved through
discussions with GIZ and Fraunhofer Institute in Germany while GIZ has realized the
potential in this study and has seen is strong need for further provinces in Thailand.
This study however, for Pathum Thani province will only display the benefits of each
technology respectively, their benefits, advantages and disadvantages and will also
calculate the price of electricity production especially the investment costs of each
technology, feed costs and the reinvestment costs and the operation and maintenance
costs as well.
A simulation will be carried out and a manual optimization calculation will be
conducted with regards, investment costs, and operation and maintenance costs. An
optimization program will be complex as there are several relations influencing each
other’s in a cross section such as, amount of planned photovoltaic, peak consumption
and storage capacity as well as the longest off sun hour for a period. To ensure that the
storage is huge enough and that the capacity to charge the storage is high enough the
model is complex. Hence such an optimization model might be developed in a next
stage.
Currently the study “Simulations of scenarios with 100% renewable electricity in the
Australian National Electricity Market” by Ben Elliston, Mark Diesendorf, Iain
MacGill, is in the process to develop and publish an open source program which is
capable to be modified and be used with the mentioned parameters as input to solve for
an optimum energy mix. As this was not yet ready to be used, cooperation in future
might be achieved to adopt this program for Thailand as well.

3
1.3 Significance of Study
This study will display the renewable energy potential as a case study for Pathum Thani
province. It will indicate the total amount of each resource and its respective electrical
potential and further clearly outlines the renewable energy mix to achieve a 100% share
of electricity by renewable energies. Further, the developed system will have the feature
to easily define limits on maximum share of each technology as they might be given by
the grid operator to ensure a stable and reliable energy supply. Such limits can be
defined and the electricity generated by such a system over 1 year – here in case for
Pathum Thani – can be simulated and compared to the actual consumption – here for
the year 2012. Nowadays the limitation of the implementation is given by the grid
capability to handle the different power sources and or the available resources. A so
called Smart Grid which is the future planning in Thailand will increase the efficiency
and through its smart communication the total amount of implemented renewable
energies.
The beneficiary on the one hand is Sirindhorn International Institute of Technology
which can follow this study and apply it on other provinces, regions or even the whole
country; on the other hand it will be GIZ together with Frauenhofer and Ministry of
Energy in Thailand as a similar study based on this study will be carried out in 4
Provinces in Thailand to display the potential and define further goals and objectives.
And at least, authorities such as PEA (Provincial Electricity Authority in Thailand) who
are currently interested in a smart grid and the deployment of renewable energy
technologies. A great beneficiary could also be the private sector especially IPP’s
(Independent Power Producer), SPP’s (Small Power Producer) and VSPP’s (Very
Small Power Producer)1, as the renewable energies are highly subsidies and hence an
investment with an approximately 4-5 years return is a good investment opportunity.
1 IPPs= Independent Power Producers (Cap. sold to EGAT ≥ 90 MW)
SPPs=Small Power Producers (Cap. sold to EGAT < 90 MW) VSPPs=Very Small Power Producers (Cap. sold to MEA/PEA < 10 MW)

4
Chapter 2
Literature Review
The literature review is in a first case based on different topics, the topics are structured
accordingly to renewable energy technologies and storage technologies, affecting
policies and further grid development in Thailand, land use and cost and reliability
analysis of the electricity sources respectively.
2.1 Similar Studies Conducted
Similar studies have been recently done for Germany. The document “100 %
Erneuerbare Energieen fuer Strom und Waerme in Deutschland” [11] shows the
simulation results for a 100% renewable electricity and heat supply in Germany. This
document will generally be used as a guideline through this study. The study shows
only results and hence the methodology needs to be developed for Thailand again as
this is considered as a unique know-how.
Similar studies have recently been conducted for other countries or states such as
Australia [22], and national scenarios for Australia (Wright and Hearps, 2010), Ireland
[23], New Zealand (Mason et al., 2010), Portugal [24], Japan [25], the United Kingdom
(Kemp and Wexler, 2010), Germany (German Advisory Council on the Environment,
2011) and Denmark [26]. More broadly, a regional study has been produced for
northern Europe (Sorensen, 2008) and several studies of the global situation have been
produced including by Sorensen and Meibom (2000) and Delucchi and Jacobson [27].
Several optimizations have been carried out, but the optimization program is not
available thus the open source programs are limited even to purchase a program was
not possible in this stage. Nevertheless, currently the study “Simulations of scenarios
with 100% renewable electricity in the Australian National Electricity Market” by Ben
Elliston, Mark Diesendorf, Iain MacGill, is in the process to develop and publish an
open source program which is being able to be modified and using the mentioned
parameters as input to solve for an optimum energy mix.

5
2.2 Similar Studies in Thailand
Several Studies about Renewable Energy Potential for Thailand and CO2
Mitigation have been carried out
Mostly focused on total capacity installed and peak consumption no study has
been found focusing on hourly values
Ongoing “Green Islands” Projects by DEDE
4 Islands: Koh Jik, Koh Samui, Koh Paluay and Koh Raya
The green island Project as proposed by DEDE is pointing on the basic objectives: [28]
1) Overall Objective
To improve energy supply management in the targeted islands
To achieve lower costs of delivered electricity with less environmental
impact
To reduce carbon footprint
2) Specific Objective
Increased energy conservation, reduced energy consumption and
greenhouse gas (GHG) emissions through extensive use of green
technologies and sustained tourists demand for eco-friendly hotels and
resorts.
2.3 Energy Planning and Energy Forecasting Simulation Models
Energy planning and forecasting has been considered in several studies, the energy
planning, simulation models and energy forecasting can be conducted as seen in [29]
and the electricity forecast consumption provided by PEA. In this document the
electricity peak consumption of several regions can be forecasted in case of different
scenarios.
2.4 Technology and Potential Review
2.4.1 Solar
For the set-up of a Solar Plant (PV Power Plant) a guideline for typical designs and
specification is given in in several studies for instance “Solar Energy; Fundamentals
and Applications” [30]. This literature describes deeply the plant set up, and gives
details for the calculation of the power output as well as constrains influencing the plant.
The calculations are also applicable for the so called “Solar Home System” but the
adjustments of those will be done according to the description in [31]

6
Prices and reliability for the solar plant can either be found in [11] or in the respectively
sources as given respectively.
As the price in Thailand will be slightly changing due to different import prices but due
to lower labor costs, the price will be considered as equal.
The CO2 mitigation of a solar power plant in Thailand was estimated in [14] Thailand
grid emission 2010 report.
2.4.2 Biogas and Biomass
The process and typical technologies and application as used for Biogas and Biomass
were evaluated and can be found in the German literature “Nachwachsende Rohstoffe”
from the Federal Ministry for Food, Agriculture and Consumer Protection, Germany
[18]. For Thailand the study [7] “Overall Analyses of Using Rice Straw Residues for
Power Generation in Thailand- Project Feasibility and Environmental GHG Impacts
Assessment provides a detailed analysis.
2.4.3 Storage
If the amount of resources is greater than the electricity consumption, different storage
conditions as described in 100 % Erneuerbare Energieen für Strom und Wärme in
Deutschland [11], will be applied, otherwise the amount of external generated
electricity will be displayed.
2.4.5 Cost of Electricity Generation, Maintenance Costs, Reliability and Lifetime
The values for the installation costs, maintenance costs, reliability and lifetime of each
technology have been concluded in the report [11] “100 % Erneuerbare Energieen für
Strom und Wärme in Deutschland” and hence those values are going to be the basics
and may be adjusted if necessary.
2.5 Thailand Electricity Consumption and General Grid Situation
2.5.1 Actual Renewable Energy Situation in Thailand in 2012
According to the statistic published by the DEDE (Department of Alternative Energy
Development and Efficiency, Thailand) [37], the actual share of alternatives renewable
energies were at 9.9 % share of the total energy consumption with a total of 2,786 MW
in electricity, 4,886 ktoe in heat and 3.5 ml./day in Biofuels.

7
“In 2012, the installed capacity of renewable energy was 2,786 MW, accounting for
7.6% of total power capacity in Thailand” [36] while the installed capacity, generating
electricity by the end of 2021 should be 9,201 MW.
2.5.2 Load Factor (Capacity Factor net)
The load factor is defined to be “the ratio of the net electricity generated, for the time
considered, to the energy that could have been generated at continuous full-power
operation during the same period” [34].
And hence it’s the percentage of the actual generation to the installed capacity.
CFN = Actaual Production [GW]
Installed Capacity [GW]
Typical values for Thailand are around 70 – 85 % for the last few years and hence a
strong growth in electricity consumption will use those reserves and new installations
have to be done.
2.5.3 Electric Power Transmission and Distribution Losses in Thailand
The Electric power transmission and distribution losses are an important factor in the
planning of an electricity production, during the last years, the losses (% of output) in
Thailand was 5.91 in 2009, according to a World Bank report, published in 2010.
Electric power transmission and distribution losses include losses in transmission
between sources of supply and points of distribution and in the distribution to
consumers.

8
Chapter 3
Methodology
3.1 Information Gathering
To conduct this study general information on available resources on the one hand as
well as possible technologies on the other hand must be collected and defined. For the
purpose of this study, unless otherwise defined, the “Best Available Technologies”
(BAT) in the year 2012 have been assumed to simulate potentials of different resources.
3.1.1 Land Overview Pathum Thani
The land overview of Pathum Thani province gives a general overview of Pathum Thani
and shows the elevation of the land, the usage of the land and its respective area. The
information in this chapter is provided by the Department of Land Development –
Pathum Thani. The land overview information are required to determine on the one
hand available land for installations such as Solar and Biogas, to further define limits
of resources for each technology and also to define the soil condition of Pathum Thani,
province and its respective water body which plays a major role in the rice growing
capacity.
3.1.1.1 General information
Pathum Thani is a central province of Thailand with a direct border to Ayutthaya,
Saraburi, Nakhon Nayok, Chachoengsao, Bangkok and Nonthaburi.
The province is north of Bangkok and is part of the Bangkok metropolis. Pathum Thani
is located in the low flats of the Chao Phraya River, which also flows through Bangkok.
Many canals (khlongs) cross the province and feed the rice paddies. (Details in chapter
3.1.2)

9
Figure 1: Overview Map - Pathum Thani
The map in Figure 1 shows the shape of Pathum Thani, the location of the villages,
roads and the water body. It clearly gives an overview that only minor areas are covered
with villages and the water body is around 3%. The total area is 1,525.9 km2 with a
population (2011) of 1,010,898 people and hence the density is 660/km2.
Figure 2: Amphoe in Pathum Thani
Pathum Thani is separated in 7 districts, which can be seen in Figure 2. The so called
amphoe which are [1], [12]:
1. Mueang Pathum Thani
2. Khlong Luang
Villages
Roads
Water
Amphoe
Border
Paddy Rice
10
3. Thanyaburi
4. Nong Suea
5. Lat Lum Kaeo
6. Lam Luk Ka
7. Sam Khok
3.1.1.2 ArcGIS Software
The ArcGis software, a “Mapping & Analysis for Understanding Our World - A
platform for designing and managing solutions through the application of geographic
knowledge” [2] is a software used by the land development department in Pathum Thani
to evaluate the land usage and land development in Pathum Thani. The software can be
used for several analyses and the data provided by the Land Development Department
consists of different layers with different information, such as:
Land Usage and its respective size
Soil condition
“Amphoe “ (Major of a Province District)
“Tamphol” (District of a Amphoe)
Boarders of each district (Ampohe and Tamphol)
Size of each field and categorization
3.1.2 Agricultural Usage and its Respective Area
The agricultural usage of the land in Pathum Thani province has been evaluated with
the ArgCIS software. In Table 1 it can be seen that the major agriculture product is
Paddy Rice and is covering more than 38% of the total area in Pathum Thani. The water
body with its 3 % of the total area is important for the paddy rice growth. The water
body enables a biyearly growth of the rice in this area. According to the Office of
Agricultural Economics, Thailand, [4] this are the so called:
Major Rice : Rice were cultivated during 1 May - 31 October
Second Rice : Rice were cultivated during 1 December - 30 April
Thus, the total rice harvested in one year is almost of double the size than in provinces,
with only yearly harvesting rate. The total amount of paddy fields, separated to soil
condition as seen in Table 3, shows that a majority is on soil category 11 and soil

11
category 2. This is due to the fact that soil of the category 2 and 11 have the major
coverage in Pathum Thani as seen in Figure 3.
Table 1: Pathum Thani - Agricultural Usage - Land Size and Percentage of Total Area [3]
Rai m2 %
Total Area: 955,063 1,528,101,052 100
Rice Paddy: 363,924 582,278,400 38
Water Body 28,651 45,843,024 3
Other Agricultural 12,749 20,398,400 1.3
Table 2: Other Agricultural Products - Pathum Thani [5]
Agricultural Product Area Planted
Rai
Area Harvested
Rai
Tones Yield
kg/Rai
Oil Palm 9,602 3,282 9,850 3,001
Coconuts 706 706 606 858
Tangerine 1,138 453 130 287
Guava 1,054 961 1,846 1,921
Orchid 249 249 471 1,892
Table 3: Paddy Rice Area According to Soil Conditions and Land > 10 Rai [3]
Summary Land >10 Rai Unit Summary Land >10 Rai Unit
All 363,924 361,531 Rai 582,278,400 578,449,381 m²
Only Soil 2 114,820 114,040 Rai 183,713,031 182,465,430 m²
Only Soil 3 85,600 84,872 Rai 136,960,964 135,795,776 m²
Only Soil 10 7,131 7,125 Rai 11,410,984 11,400,840 m²
Only Soil 11 150,404 149,551 Rai 240,647,500 239,281,985 m²
3.1.2.1 Soil Condition
The different soil condition classification according to Land Development Department
Pathum Thani can be seen in Figure 3 and Table 4. The soil has been tested by the Land
Development Department, Pathum Thani and the data have been implemented into the
ArgCIS software. The basic information is that the more acid the land the harder to

12
grow any agricultural products and hence the land is not as useful as the less acid land.
The numbering shows already the status of acidity. While category 2 and 3 is only light
acid, category no 10 – 11 becomes more acid.
Figure 3: Graphical Soil Group Overview - Pathum Thani
Table 4: Numerical Soil Group Overview Pathum Thani [3] (Free Translated)
Land
Unit
Quality Drainage Soil
Fertility
Slope
ratio
PH Depth
cm
Clay
Thickness
cm
Up Down
2 Clay Clay bad medium 0-2 6.0-7.0 4.5-5 >150 >150
3 Clay Clay bad medium 0-2 6.0-7.0 7.0-8.0 >153 >100
10 Clay Clay bad medium 0-2 4.5-50 4.0-4.5 >152 >100
11 Clay Clay bad medium 0-2 4.5-50 4.0-4.5 >151 >100
3.1.3 Water Body, Rice Potential and Biyearly Harvesting
The total paddy area of 648,171 [5] Rai has been used to grow paddy rice in 2012 as
Table 5 indicates. However the total area of paddy fields used to grow rice in 2012
according to [5] is maximum 324,359 Rai. The explanation is the biyearly planting and
harvesting capacity of Pathum Thani due to its 3% water body. However the ArcGis
simulation has shown that 363,924 Rai are potential and available rice paddy fields.
In consideration of a biyearly usage of each field, a total potential of 727,848 Rai would
be available to grow and harvest rice.

13
Table 5: Actual Rice Planted and Harvested - Pathum Thani 2012 [5]
Rice Yield and Harvest Rice
Planted
Rai
Planted
m²
Harvested
Rai
Harvested
m²
Harvested
t
Yield
t/sqkm
Major
Rice
319,959 511,934,400 302,149 483,438,400 201,574 416.96
Second
Rice
328,758 526,012,800 325,813. 521,300,800 245,637 471.20
Sum 648,717 1,037,947,200 627,962 1,004,739,200 447,211 888.16
Average 324,359 518,973,600 313,981 502,369,600 223,606 444
Table 5 also indicates the total harvested amount in tons. This amount is only the
average rice yield of rice grains including husk but without the straw. The straw is
usually harvested in a later stage and then burnt. To calculate the total amount of rice
straw, the SGR (Straw – to – Grain – Ratio) ratio will be applied. According to [6], the
SGR ratio varies from region to region and from season to season. “However values
between 0.75 and 0.45 have been reported.” For the central plain in Pathum Thani, and
in this study, an average SGR ratio of 0.6 is used to estimate the straw yield and as a
consequence the Grain to Straw Ratio is supposed to be 0.4 (GSR). The amount given
in the agricultural statistic of 2012, 447,211.00 tons (Major and Second Rice) are only
grain with Husk and hence the available straw can be calculated to:
Straw Amount [t]= Grain Amount [t]*SGR
GSR=
447,211 t*0.6
0.4 = 670815 t.
3.2 Hourly Electricity Consumption – EGAT Sai Noi
The approach to use the hourly electricity distribution in Pathum Thani from its
respective 23 substations cannot be done as the several monitoring failures did not allow
PEA (Provincial Electricity Authority) to carry out an accurate monitoring. While some
substations provide a monthly average load, some substations do have hourly or daily
values while others are hardly recorded. Therefore the hourly values of the EGAT
(Electricity Generating Authority of Thailand) substation Sai Noi, which delivers all of
its capacity to Pathum Thani will be used and seen as a sample of Pathum Thani
province. The hourly consumption is provided by PEA statistical center. Instead of

14
using exact values of substations in Pathum Thani, the values from the EGAT
Substation Sai Noi are being used. The advantages implicates that the values exists and
all electricity passing this substation is only used in Pathum Thani province. According
to PEA the actual consumption of Pathum Thani is around 80 – 100 % from Sai Noi
substation, however, a few more substations may provide electricity to Pathum Thani
province but this cannot be displayed and therefore the load profile of Sai Noi will be
used to reflect the Pathum Thani province in this study. The received load profile has
also shown some errors in monitoring but in discussion with PAE the values missing
were averaged of the hours before and after the missing values which seemed to be
logically matching in the system. The yearly load of 2012 shows the peak and off peak
clearly it also points out that the base load (purple line) is around 110,000 kW to
120,000 kW. This base load in a general system is provided by constant and reliable
source – for instance nuclear or coal power plant. The peaks and maximum is usually
provided by fast running, but yet, expansive equipment or expansive fuel such as gas
turbines. The major goal is to cover the base load with renewable energies to ensure the
base load in a 100% renewable energy system. In a mixed system, renewable energies
are basically used to cover the peak consumptions and base load is still provided
conventional. [21]
Figure 4: Yearly Load – Sai Noi and Assumed Base Load in 2012

15
3.3 Set Up and Simulation of the Potential of Each Technology
3.3.1 Biomass and Biogas Potential
In principle, any material of organic origin counts as biomass. Biomass can be used in
a direct and indirect way to produce energy – it can be directly burnt in a power station
to produce heat (direct way) or fermented in a anaerobic digester to make biogas and
then electricity and heat (indirect way), or converted into a synthetic gas and fuel by
thermochemical gasification (indirect way).
In a first instance the difference between Biogas and Biomass and its respective sources
needs to be clarified. During this study the assumption as see in Figure 5a below will
be followed, meaning all dry residues are for the combustion, hence Biomass
assumption while all wet residues such as animal manure are for the biogas combustion.
The potential of landfills and human waste has not yet been considered as non-valid
data has been found during this study but the potential might be enormous and should
be implemented.
Figure 5a: Biogas and Biomass [36]
16
3.3.2 Biomass Potential
The Overall Analyses of Using Rice Straw Residues for Power Generation in Thailand
has been analyzed in several studies, two major studies are the “Overall Analyses of
Using Rice Straw Residues for Power Generation in Thailand- Project Feasibility and
Environmental GHG Impacts Assessment” [7] and “Logistics cost analysis of rice straw
for biomass power generation in Thailand” [6]
The explanation and usage of the equation can be seen in both references.
Equation 1: Annual Biomass Demand
It is required to add the moisture content (11%) and the organic loss portion (10%) to
the annual demand of the rice. According to [7], the SGR is selected to be 0.6.
Equation 4: Installed Capacity
𝐴𝑛𝑛𝑢𝑎𝑙 𝐵𝑖𝑜𝑚𝑎𝑠𝑠 𝐷𝑒𝑚𝑎𝑛𝑑 = 1.11 ∗ 1.10 ∗𝐸𝑙𝑒𝑐𝑡𝑟𝑖𝑐𝑎𝑙 𝑂𝑢𝑡𝑝𝑢𝑡 ∗ 3.6 ∗ 𝑃𝑙𝑎𝑛𝑡 𝐹𝑎𝑐𝑡𝑜𝑟
𝐸𝑙. 𝐸𝑓𝑓𝑖𝑐𝑒𝑛𝑐𝑦 ∗ 𝐿𝐻𝑉 𝐹𝑢𝑒𝑙 𝑉𝑎𝑙𝑢𝑒
𝐴𝑟𝑒𝑎 (𝑠𝑞𝑘𝑚) =𝐴𝑛𝑛𝑢𝑎𝑙 𝐷𝑒𝑚𝑎𝑛𝑑 𝑂𝑓 𝑅𝑖𝑐𝑒 𝑆𝑡𝑟𝑎𝑤 (𝑡)
𝑆𝑡𝑟𝑎𝑤 𝑌𝑖𝑒𝑙𝑑 (𝑡
𝑠𝑞𝑘𝑚)∗𝐶𝑜𝑙𝑙𝑒𝑐𝑡𝑖𝑜𝑛 𝐸𝑓𝑓𝑖𝑐𝑒𝑛𝑐𝑦 ∗𝐿𝑎𝑛𝑑 𝐸𝑓𝑓𝑖𝑐𝑒𝑛𝑐𝑦 ∗𝐹𝑎𝑟𝑚 𝐿𝑎𝑛𝑑
𝐸𝑙 𝑂𝑢𝑡𝑝𝑢𝑡 (𝑘𝑤ℎ
ℎ)
=𝐶𝑎𝑡𝑐ℎ 𝐴𝑟𝑒𝑎 (𝑠𝑞𝑘𝑚) ∗ 𝐴𝑣 𝑃𝑟𝑜𝑑 𝑌𝑖𝑒𝑙𝑑 (
𝑡𝑠𝑞𝑘𝑚
) ∗ 𝑆𝐺𝑅 ∗ 𝐸𝐿 𝐸𝑓𝑓𝑖𝑐𝑒𝑛𝑐𝑦 ∗ 𝐿𝐻𝑉 𝐹𝑢𝑒𝑙
1.11 ∗ 1.10 ∗ 3.6 ∗ 8760 (ℎ
𝑦𝑟)
I𝑛𝑠𝑡𝑎𝑙𝑙𝑒𝑑 𝐶𝑎𝑝𝑎𝑐𝑖𝑡𝑦 (𝐾𝑊) =𝐸𝑙 𝑂𝑢𝑡𝑝𝑢𝑡 (
𝐾𝑤ℎℎ
) ∗ ℎ𝑜𝑢𝑟𝑠 𝑜𝑓 𝑦𝑒𝑎𝑟
𝐴𝑣𝑒𝑟𝑎𝑔𝑒 𝑃𝐿𝑎𝑛𝑡 𝑂𝑝𝑒𝑟𝑎𝑡𝑖𝑜𝑛 ℎ𝑜𝑢𝑟𝑠 𝑝𝑒𝑟 𝑌𝑒𝑎𝑟
Equation 2: Area Required Providing Annual Biomass Demand
Equation 3: Biomass - Electrical Output in Kwh/h

17
Calculation of the total Biomass Potential:
There are 2 possible Biomass feedstocks.
1. The paddy straw which is leftover in the fields
2. The Husk which is harvest among with the grain and needs to be separated.
Values for Rice Straw: [7]
Assumed parameters for estimating the annual rice straw demand:
Annual operation hours 6,000 h
Foreseen overall efficiency of the plant based on LHV 23%
Low heating value (LHV) of rice straw 12.39 MJ/kg
Moisture content (MC) assumed on dry basis 11%
Loss of rice straw during handling and storage 10%
Values for Rice Husk:
Assumed parameters for estimating the annual rice Husk demand.
Annual operation hours 6,000 h [7]
Foreseen overall efficiency of the plant based on LHV 23% [7]
The HTG ratio is around 0.22 [8]
The LHV of Rice Husk: Rice husk 12.56 MJ/kg [8]
The total potential of Biomass is the calculated with the area of 582,278,400 m² (582.278
km²) to:
Table 6: Biomass Potential from Rice Straw - Pathum Thani 2012
Area Rice
[sqm]
[sqkm]
Av. Prod.
grain
[t/sqkm]
Straw
to
Grain
Ratio
Av.
Prod
Straw
[t/sqkm]
LHV
rice
straw
[MJ/kg]
El
efficiency
[%]
El
Capacity
[MW]
582,278,400.00 582.28 888 0.60 1,332.19 12.39 0.23 57.41
Table 7: Biomass Potential from Rice Husk - Pathum Thani 2012
Area Rice [sqm] [sqkm] Av. Prod.
grain
[t/sqkm]
Husk to
Grain
Ratio
Av. Prod
Husk
[t/sqkm]
LHV
rice
straw
[MJ/kg]
El
efficien
cy [%]
El Capacity
[MW]
582,278,400.00 582.28 888 0.22 195.39 12.56 0.23 9.39

18
Total installed capacity:
The total installed capacity for each technology is calculated respectively, in
assumption of 6000 operational hours/year
Equation 5: Biomass Capacity
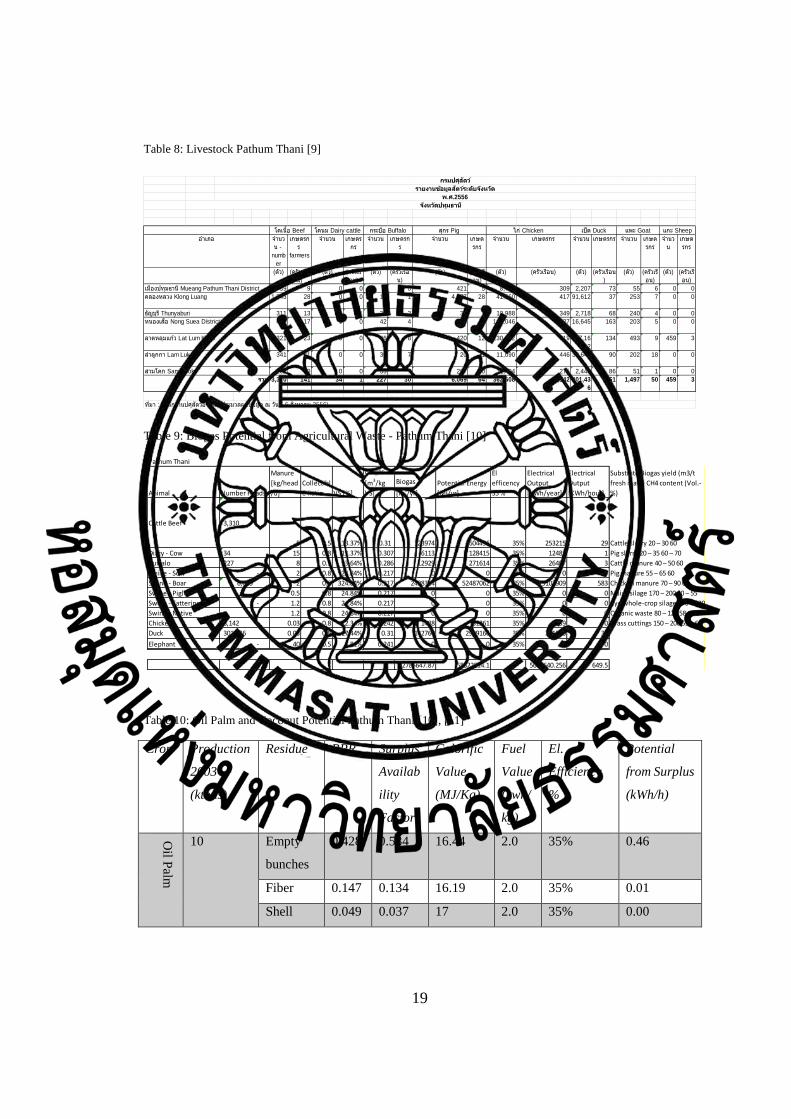
3.3.3 Biogas Potential
3.3.3.1 Farm Residues
A resource for the Biogas plant are the farm wastes, farm wastes are high potential and
reliable. The agricultural livestock in Pathum Thani can be seen in Table 8.
Biogas is the result of the microbial degradation of organic products under humid,
anaerobic conditions. Farm waste such as manure, industrial waste and municipal solid
waste is regarded as Biogas resource and hence it will be stored under anaerobic
conditions, the yield of CH4 is specific for each resource. The amount of CH4 which is
collectable can be calculated and with an electrical efficiency of 35% out of the total
CH4 amount the electrical output will be calculated as seen in Equation 6. [37]
Equation 6: Biogas Potential of Farm Waste
𝑃𝑜𝑡𝑒𝑛𝑡𝑖𝑎𝑙 [𝐾𝑊ℎ
𝑦𝑟] = 𝐴𝑣𝑎𝑖𝑙𝑎𝑏𝑙𝑒 𝐴𝑚𝑜𝑢𝑛𝑡 [
𝑘𝑔
𝑦𝑟] ∗ 𝐶𝑜𝑙𝑙𝑒𝑐𝑡𝑖𝑏𝑒 𝑅𝑎𝑡𝑖𝑜 ∗ 𝑉𝑆 [%] ∗ 𝐵𝑖𝑜𝑔𝑎𝑠 𝐶𝑜𝑛𝑡𝑒𝑛𝑡 [
𝑚3
𝑘𝑔𝑉𝑆]
∗ 𝐴𝑚𝑜𝑢𝑛𝑡 𝑜𝑓 𝐶𝐻4 𝐶𝑜𝑛𝑡𝑒𝑛𝑡 ∗ 𝜂𝑒𝑙
𝑀𝑖𝑛. 𝐼𝑛𝑠𝑡𝑎𝑙𝑙𝑒𝑑 𝐶𝑎𝑝𝑎𝑐𝑖𝑡𝑦𝑅𝑖𝑐𝑒 𝑆𝑡𝑟𝑎𝑤 100% (𝐾𝑊) =𝐸𝑙 𝑂𝑢𝑡𝑝𝑢𝑡 (
𝐾𝑤ℎℎ
) ∗ ℎ𝑜𝑢𝑟𝑠 𝑜𝑓 𝑦𝑒𝑎𝑟
𝐴𝑣𝑒𝑟𝑎𝑔𝑒 𝑃𝐿𝑎𝑛𝑡 𝑂𝑝𝑒𝑟𝑎𝑡𝑖𝑜𝑛 ℎ𝑜𝑢𝑟𝑠 𝑝𝑒𝑟 𝑌𝑒𝑎𝑟
=57410 (
𝐾𝑤ℎℎ
) ∗ 8760ℎ
6000ℎ= 83,819 𝐾𝑊
𝑀𝑖𝑛. 𝐼𝑛𝑠𝑡𝑎𝑙𝑙𝑒𝑑 𝐶𝑎𝑝𝑎𝑐𝑖𝑡𝑦𝑅𝑖𝑐𝑒 𝐻𝑢𝑠𝑘 100% (𝐾𝑊) =𝐸𝑙 𝑂𝑢𝑡𝑝𝑢𝑡 (
𝐾𝑤ℎℎ
) ∗ ℎ𝑜𝑢𝑟𝑠 𝑜𝑓 𝑦𝑒𝑎𝑟
𝐴𝑣𝑒𝑟𝑎𝑔𝑒 𝑃𝐿𝑎𝑛𝑡 𝑂𝑝𝑒𝑟𝑎𝑡𝑖𝑜𝑛 ℎ𝑜𝑢𝑟𝑠 𝑝𝑒𝑟 𝑌𝑒𝑎𝑟
=9390 (
𝐾𝑤ℎℎ
) ∗ 8760ℎ
6000ℎ= 13,710 𝐾𝑊
19
Table 8: Livestock Pathum Thani [9]
Table 9: Biogas Potential from Agricultural Waste - Pathum Thani [10]
Table 10: Oil Palm and Coconut Potential Pathum Thani [10], [11]
Crop Production
2003
(ktons)
Residue RPR Surplus
Availab
ility
Factor
Calorific
Value
(MJ/Kg)
Fuel
Value
(kwh/
kg)
El.
Efficiency
%
Potential
from Surplus
(kWh/h)
Oil P
alm
10 Empty
bunches
0.428 0.584 16.44 2.0 35% 0.46
Fiber 0.147 0.134 16.19 2.0 35% 0.01
Shell 0.049 0.037 17 2.0 35% 0.00
จ ำนว
น -
numb
er
เกษตรก
ร
farmers
จ ำนวน เกษตร
กร
จ ำนวน เกษตรก
ร
จ ำนวน เกษต
รกร
จ ำนวน เกษตรกร จ ำนวน เกษตรกร จ ำนวน เกษต
รกร
จ ำนว
น
เกษต
รกร
(ตัว) (ครัวเรอื
น)
(ตัว) (ครัวเรื
อน)
(ตัว) (ครัวเรอื
น)
(ตัว) (ครัวเรื
อน)
(ตัว) (ครัวเรอืน) (ตัว) (ครัวเรอืน
)
(ตัว) (ครัวเรื
อน)
(ตัว) (ครัวเรื
อน)
39 9 0 0 0 0 421 5 8,738 309 2,207 73 55 6 0 0
1,543 28 0 0 18 1 4,877 28 41,260 417 91,612 37 253 7 0 0
311 13 34 1 32 3 30 1 19,988 349 2,718 68 240 4 0 0
473 17 0 0 42 4 34 7 139,046 427 16,645 163 203 5 0 0
321 23 0 0 46 8 420 12 130,082 919 147,16
2
134 493 9 459 3
341 41 0 0 34 7 20 1 11,090 446 38,649 90 202 18 0 0
282 10 0 0 55 7 267 10 12,404 275 2,443 86 51 1 0 0
3,310 141 34 1 227 30 6,069 64 362,608 3,142 301,43
6
651 1,497 50 459 3รวม
ทีม่ำ : ส ำนักงำนปศสุัตวอ์ ำเภอ (ประมวลผลขอ้มูล ณ วนัที ่6 สงิหำคม 2556)
คลองหลวง Klong Luang
ธญับรุ ีThunyaburi
หนองเสอื Nong Suea District
ลำดหลมุแกว้ Lat Lum Kaeo
ล ำลกูกำ Lam Luk Ka
สำมโคก Sam Khok
เมอืงปทมุธำน ีMueang Pathum Thani District
กรมปศสุตัว ์
รายงานขอ้มลูสตัวร์ะดบัจงัหวดั
พ.ศ.2556
จงัหวดัปทมุธานี
โคเนื้อ Beef โคนม Dairy cattle กระบอื Buffalo สกุร Pig ไก่ Chicken เป็ด Duck แพะ Goat แกะ Sheep
อ ำเภอ
Biogas Potential - Farm Waste 4163995835 1E+09
Pathum Thani
Animal Number Heads
Manure
[kg/head
/d]
Collectibl
e Ratio VS [%]
Biogas
[m3/kg
VS]
Biogas
[m3/yr]
Potential Energy
[MJ/yr]
El
efficency
35 %
Electrical
Output
[KWh/year]
Electrical
Output
[KWh/hour]
Substrate Biogas yield (m3/t
fresh mass) CH4 content (Vol.-
%)
Cattle Beef 3,310
5 0.5 13.37% 0.31 123974 2604496 35% 253215 29 Cattle slurry 20 – 30 60
Diary - Cow 34 15 0.8 13.37% 0.307 6113 128415 35% 12485 1 Pig slurry 20 – 35 60 – 70
Buffalo 227 8 0.5 13.64% 0.286 12929 271614 35% 26407 3 Cattle manure 40 – 50 60
Swine - Sow - 2 0.8 24.84% 0.217 0 0 35% 0 0 Pig manure 55 – 65 60
Swine - Boar 6,069 2 0.8 324.84% 0.217 2498384 52487062 35% 5102909 583 Chicken manure 70 – 90 60
Swine - Piglet - 0.5 0.8 24.84% 0.217 0 0 35% 0 0 Maize silage 170 – 200 50 – 55
Swine - Fattering - 1.2 0.8 24.84% 0.217 0 0 35% 0 0 Rye whole-crop silage 170 – 220 55
Swine - Native - 1.2 0.8 24.84% 0.217 0 0 35% 0 0 Organic waste 80 – 120 58 – 65
Chicken 3,142 0.03 0.8 22.34% 0.242 1488 31261 35% 3039 0 Grass cuttings 150 – 200 55 – 65
Duck 301,436 0.03 0.8 17.44% 0.31 142760 2999166 35% 291586 33
Elephant - 40 0.5 6.81% 0.241 0 0 35% 0 0
2785647.87 58522014.1 5689640.256 649.5

20
Frond 0.260
4
1 7.97 2.0 35% 0.40
Male
bunches
0.233 1 14.86 2.0 35% 0.67
Co
con
ut
1 Husk 0.362 0.595 14.27 4.0 35% 0
Shell 0.16 0.378 10.24 2.8 35% 0
Empty
Bunches
0.049 0.843 14.27 4.0 35% 0
Frond 0.225 0.809 10.24 2.8 35% 0
The potential of Oil Palm and Coconut is too small and will not be considered.
3.3.3.2 Napier Grass
Napier Grass has a yield of 36-60 tons per crop per hectare. And can be furthermore
harvested around 8 times a year with 45 days duration of growing. [19]
Therefore the yield harvested on 1 hectare over 1 year is around 288 to 400 tons.
Due to its high methane yield (190 – 270 m3 per ton) only around 112 – 167 tons of
fresh Napier grass per day are required to operate a 1 MW plant. With an assumed load
factor of 0.9 the output would be 21,600 kWh / day. [19]
For the 112-167 tons of Napier grass per day an area of 85 - 211 hectares are
approximately required. Therefore it is assumed that around 150 hectares
(approximately 1,000 Rai) will be used for the 1 MW plant.
3.3.4 PV Power Plants
A PV Power Plant is a Power plant which is using the energy from the sun to produce
electricity. The usage of the Photovoltaic Cells will transmit the sun energy into
electricity. With a setup of modules in strings, connected as arrays and finally plugged
in to an inverter to generate alternate current (AC).
The setup of such a Power plan can vary by type and location and also will vary due to
factors such as costs (investment and operation costs), environment, and equipment.
3.3.4.1 Site Are and Land Use
The required are for a PV solar installation depends on
21
1. Module Type
2. Module Efficiency
3. Location
(Fixed tilt solar arrays using typical modules of about 15% efficiency on horizontal
sites, need about 1 hectare/MW.)
To prevent shadowing and a frequent crass cutting, Solar Modules are installed around
1 m above the ground on a mounting system.
3.3.4.2 Typical Set UP of a PV Power Plant
3.3.4.2.1 Fixed or Tracking Mounting System
The Solar Modules are mounted on a mounting system and pointed into the direction
with the calculated maximum power output. Which is supposing south on the northern
hemisphere. A fixed or tracking mounting System can be installed. A fixed mounted
inclination is calculated to provide the optimum annual output profile. A variant on this
design is the use of arrays, whose tilt angle can be adjusted seasonally to optimize
output in summer and winter or during day times. This design therefore requires the
angle to be mechanically adjusted. In this study on fixed mounting systems are
regarded.
3.3.4.2.2 String Connection
The solar panels are connected in a string of typical 15 – 25 modules this is done to
increase the Voltage. In this study 20 modules have been selected.
3.3.4.2.3 Array Connection
Several Strings are connected together as one array to increase the current; this value
strongly depends on the Inverters and is influenced by the PID1 effect and the Maximum
Power Point tracking capability of an inverter.
1 PID = potential induced degradation [http://www.en.csp.fraunhofer.de/aktuelles/details/id/51]
22
3.3.4.2.4 Power conversion
Solar panels produce direct current (DC) electricity; hence an Inverter to convert from
DC to alternating current (AC) is required.
There are two alternatives to do so, on the one hand centralized inverters and on the
other hand and string inverters.
3.3.4.2.5 Centralized Inverters
Centralized inverters are central installed inverters with a high capacity as usually
several arrays are connected into one centralized inverter.
3.3.4.2.6 String Inverters
String inverters are substantially lower in capacity String inverters can enhance the
efficiency of solar parks, where different parts of the array are experiencing different
levels of insolation, for example where arranged at different orientations, or closely
packed to minimize site area and also provide higher reliability in terms of failures as
if one inverter fails only a lower percentage of the plant is offline for the duration.
3.3.4.2.7 Transformers
The system inverters typically provide power output at voltages of the order of 1000 V
AC. Electricity grids operate at much higher voltages of the order of tens or hundreds
of thousands of volts, so transformers are incorporated to deliver the required output to
the grid.
3.3.4.3 System Performance
The performance of a solar park strongly depends on the climatic conditions, the
equipment used and the system configuration. The primary energy input is the global
light irradiance. A key determinant of the output of the system is the conversion
efficiency of the solar modules, which will depend in particular on the type of solar cell
used.
There will be losses between the DC output of the solar modules and the AC power
delivered to the grid, due to a wide range of factors such as light absorption losses,
mismatch, cable voltage drop, conversion efficiencies, and other parasitic losses.

23
The performance ratio has been developed to evaluate the total value of these losses.
The performance ratio gives a measure of the output AC power delivered as a
proportion of the total DC power which the solar modules should be able to deliver
under the ambient climatic conditions. Typical and good developed PV Power Plants
are showing values for a Performance Ratio (PR) up to 80-85%.
3.3.4.4 CO2 Mitigation
The CO2 mitigation for a PV Power plant and a PV – Home system is divided into 3
parts. On the one hand the already installed capacity is regarded, as well as the planned
capacity and a mix value of both. As this study will only concentrate and calculate a
value as a scenario as if the sources are installed already, the CO2 mitigation for the
installed capacity will be used.
Table 11: CO2 Mitigation as applicable in Thailand - Year 2011 [14]
Project type Emission Factor (tCO2/MWh)
EFgrid, OM EFgrid, BM EFgrid, CM
General Project 0.5996 0.4231 0.5113
Wind and solar power generation
project
0.5996 0.4231 0.5554
3.3.4.5 PVsyst
PVsyst is a Microsoft Windows software application for developing energy production
estimates for photovoltaic power systems. It was developed by André Mermoud at the
University of Geneva. The company PVsyst SA was created to maintain and sell the
application. [15]
PVsyst is using metrological data of several years in an hourly basis, together with the
latest technology developments to estimate and simulate the efficiency and approximate
power output of the Solar System set up. The software is applicable for Grid Connected
Power Plants, for Off Grid Systems and for Grid Connected Home Systems.
PVsyst includes the meteor database management, it also includes a database of around
330 sites in the world. The component database holds over 1750 PV modules, 650
inverters, nearly 100 solar pumps and dozens of batteries or regulator models.

24
However the meteonorm hourly values are not measured, but synthetic data constructed
in the same way as the synthetic hourly values in PVsyst from monthly values.
Constructing hourly data in Meteonorm instead of PVsyst may give slightly more
realistic results as the models (especially for temperature) have been slightly improved,
and wind velocities are also generated. [16]
Sources of Meteo data in monthly values
Meteonorm monthly irradiance data are available for about 1'200 "stations", as averages
of 1960-1991 (and also 1981- 2000 in version 6.0). All "stations" (i.e. with irradiance
measurements) of the main European countries are referenced in the PVsyst database.
Data for any other site may be obtained by interpolation (usually between the 3 nearest
"stations"). [16]
3.3.4.6 HelioScope
HelioScope is a program developed by Folsom Labs and is “an advanced PV system
design tool that integrates system layout and performance modeling to simplify the
process of engineering and selling solar projects.” [18]. The program enhances a direct
size measuring from a satellite image of a location and further analysis the maximum
potential of the selected area while inputting the solar module and inverter type and
brand. Further a full electrical wiring can be planned a system performance analysis
can be done, however for this study it was enough to measure respective sites,
especially the rooftop areas, and use the values of possible installable capacity to
simulate the output with PVsyst.
3.3.4.7 Home Systems and Small Scale Systems
The so called “Solar Home Systems” or PV Home – Systems” or Small Scale Systems
are Systems installed around a house, on car parks, around highways or in general on
the roof to produce electricity from the sun. The electricity is either directly fed in as
an off grid system, and hence the components are not connected to the grid or it is used
as an On-Grid system, which in general, if more electricity is produced as consumed,
can fed back to the grid. In case of such an ON-Grid system, the required Power from
the Grid can be calculated as seen in Equation 5.
25
Equation 7: Grid Connected Home Systems
𝐏𝐆𝐫𝐢𝐝 = 𝑷𝒄𝒐𝒏𝒔𝒖𝒎𝒑𝒕𝒊𝒐𝒏 − 𝑷𝑯𝒐𝒎𝒆 𝑺𝒚𝒔𝒕𝒆𝒎
For the further discussion and calculation only “On Grid Systems”2 are regarded as the
“Off-Grid Systems”3 don’t contribute directly to the electricity consumption generated
by the grid are in generally used to supply electricity to “Stand-Alone Systems” and
hence don’t influence the total electricity consumption used in this statistics. The Home
– Systems can be build up as Solar Systems, Wind Systems and a combination and even
as Hybrid with Battery Backup. In this study all systems less which are not on a field
and or ground mounted will be considered as small scale (less than 0.5 MWp installed
capacity) or as rooftop large scale systems (larger 0.5 MWp) . A PV Power Plant is
used to generate electricity in a typical range of 0.5 to several Mega Watts and is only
applicable for ground mounted systems.
3.3.4.8 PVsyst Calculation for the Year 2012
The PVsyst simulation for Thammasat University with the coordinates of, 14°4′16.7″N
100°36′33.2″E, and the following set up of the plant:
Fixed Mounting Structure, 15 degree tilt angle
REC 250PE Modules (Efficiency 15.5 %)
23 Modules / String
174 Strings of 23 Modules
SMA Sunny Tripower 15000 TL inverter
Will provide an overall efficiency of 77.7%.
The assumption of a 1.0 MWp (6700 m2 Module Area) plant set up will be done. With
the actual radiation data from the Thai Metrological Department, with the coordinates
2 As “On Grid System” Photovoltaic systems which fed into the grid are regarded and not being used
for the own consumption.
3 As “Off Grid System” photovoltaic systems, which are not connected to the grid and powering a single
system, are regarded.
26
Lat: 13 40' N, Long: 100 37' E, the following calculations, to calculate the possible
power output for the year 2012 can be done.
Equation 8: Performance Ratio [PR] [20]
𝑃𝑅
= 𝑂𝑢𝑡𝑝𝑢𝑡 𝑜𝑓 𝑡ℎ𝑒 𝑃𝑙𝑎𝑛𝑡 [𝑘𝑊ℎ]
𝑇ℎ𝑒𝑜𝑟𝑒𝑡𝑖𝑐𝑎𝑙 𝑀𝑎𝑥𝑖𝑚𝑢𝑚 𝑂𝑢𝑡𝑝𝑢𝑡 𝑜𝑓 𝑡ℎ𝑒 𝑃𝑙𝑎𝑛𝑡 𝑎𝑓𝑡𝑒𝑟 𝑀𝑜𝑑𝑢𝑙𝑎𝑟 𝐸𝑓𝑓𝑖𝑐𝑒𝑛𝑐𝑦 [𝑘𝑊ℎ]
3.3.3.9 Radiation implemented into PVsyst
The solar radiation of 2012 has been implemented into PVsyst. As PVsyst requires an
ASCII format, all values have been transferred into an ASCII format and then
implemented into PVsyst. The hourly values for the year 2012 have been exported from
PVsyst. As those values are for 1 MWp, it is set for this study that 1 MWp requires
20,000 sqm. Hence it’s a simple relation area and total installed capacities.
3.3.4.9 Probability Analysis - P50/75/90/95
The probability analysis as integrated into the software PVsyst is a tool to evaluate and
interpret simulation results over years. As several values are variable and further the
meteorically data from Meteonom are average data over a specific period, a probability
to achieve a certain value and vice versa a value for achieved within a specific
probability can be calculated. Generally, using a Gauss distribution curve. The software
itself requires as an input the variability of each parameter as: [16]
The annual variability (sigma value) will be dominated by the meteor year-to-
year variability.
PV modules model and parameters (the main uncertainty after Meteo)
Inverter efficiency (negligible)
Soiling and module quality loss (highly depending on the site conditions)
Long term degradation
Custom other contributions,
and is then calculating the respective “PXX” values, while P50 is assumed as a
standard.

27
Extract from the software’s description:
“Probability law- This approach supposes that over several years of operation, the
distribution of the annual yields will follow a statistical law, which is assumed to be the
Gaussian (or "normal") distribution. P50-P90 represents different yield levels, for
which the probability that the production of a particular year is over this value is 50%,
resp. 90%. The problem is now to establish the 2 parameters of this Gaussian
distribution, i.e. the Mean value and the Variance (named sigma or RMS).
The main contribution to those parameters will be the uncertainty and variability of the
meteor data. But other uncertainties in the simulation process and parameters should be
taken into account.”
Figure 5: Example of a PVsyst P50/P90 determination [16]
3.3.5 Wind and Wind Potential
The data from a wind met mast installed at Thammasat University have displayed an
average wind speed of 3.8 m/s for the period of March – November 2012. Generally to
implement a wind power generation facility it is confirmed that wind speeds starting
with 4-5 m/s are considered. Therefore the wind potential in Pathum Thani Province is
not considered further in this study. However the simulation software is in a stage to be
updated for possible wind sources.
3.4 Storage Technologies and Applications
28
Several Storage technologies has been described in [11] while there are storage
technologies to cover the daily hourly and short time fluctuations caused on the one
hand by increased load over a day and or by unavailability of resources caused by
factors such as clouds or no existing wind, batteries and pump storage can be used here.
On the other hand there are storage technologies to store electricity offer a certain
period of time to ensure to equalize the yearly differences on both sides, load
consumption and also on generation. However as solar and wind is almost evenly over
a year in Thailand this does not need to be considered, unless the load profile shows
great discrepancies over a year and thus only short time storage solutions will be
considered.
3.5 Cost Analysis
The costs for each system should be included to determine the economics of a potential
system. Therefore the costs as described in the [11] will be applied here as well. The
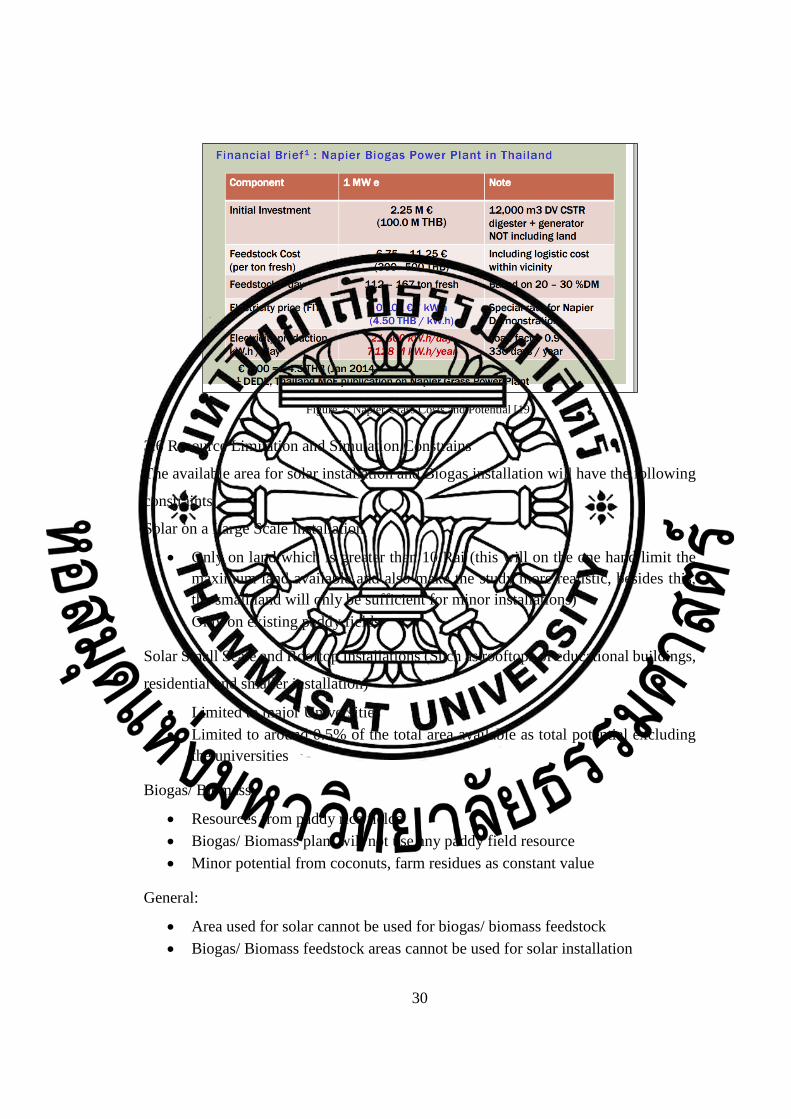
costs for Biogas systems for Napier Grass have been analyzed by Department of
Alternative Energy Development and Efficiency (DEDE) Thailand and can be seen in
Figure 6 and 7.

29
Figure 6: Typical Installation and Maintenance Cost
Land Unit Installation Costs Lifetime Maintenance
Costs Fuel Costs
Napier
Grass 3,125,000 USD/MWe 30 Years 25% 12 USD/ton
Biomass 2,000,000 USD/MWe 30 Years 25% 20 USD/ton
Solar 1,300 USD/kWe 25 Years 10%
Storage 500 USD / kW 25 Years 1%
30
Figure 7: Napier Grass Costs and Potential [19]
3.6 Resource Limitation and Simulation Constrains
The available area for solar installation and Biogas installation will have the following
constraints.
Solar on a Large Scale Installation
Only on land which is greater than 10 Rai (this will on the one hand limit the
maximum land available and also make the study more realistic, besides this,
the small land will only be sufficient for minor installations)
Only on existing paddy fields
Solar Small Scale and Rooftop Installations (Such as rooftops of educational buildings,
residential and smaller installation)
Limited to major Universities
Limited to around 0.5% of the total area available as total potential excluding
the universities
Biogas/ Biomass:
Resources from paddy rice fields
Biogas/ Biomass plant will not use any paddy field resource
Minor potential from coconuts, farm residues as constant value
General:
Area used for solar cannot be used for biogas/ biomass feedstock
Biogas/ Biomass feedstock areas cannot be used for solar installation
31
Chapter 4
Simulation Software
To combine and simulate various technologies in regards to usage of size, required
storage capacity for load shifting and cost analysis a Microsoft excel based simulation
software has been developed during this study. The inputs for the system are as
following:
1. Area for large scale solar system
2. Area for Biogas / Biomass system and type of resource
3. Storage size
4. Wind speeds and potential
The software has as a background already the load profile of Sai Noi substation
however those values can be adjusted if needed. The outcome of the simulation as
following:
Hourly comparison between total consumption and production
Evaluation of storage size and hourly storage status
Hourly, Monthly and Yearly comparison between production and consumption
Cost simulation
Flow direction of electricity such as amount into grid or storage technologies or
exported amount
Load shifting
Storage capacity
The software, a excel based simulation, is available and attached to this dissertation in
form of a CD.

32
Chapter 5
Simulation and Results
With all the parameters and given values, different scenarios have been simulated. TO
conduct the simulation, a excel based template has been created which can be modified
in future studies and can be used to enhance the system and would allow it to be
expanded by an optimization model. The current model however requires only the area
of solar installation and respective area used for Biomass and Biogas and further
requires some basic information such as:
Agricultural resources usage for Biogas/Biomass or not.
Small System Solar used or not and area available for it.
The first scenario is a 100% large scale solar simulation. When talking about 100%
large scale solar installation 2 aspects have to be taken into consideration for a better
understanding:
1. 100% large scale solar can be understood as 100% of the available paddy field
area will be used to install solar facilities and generate electricity from it and
compare the total generation to the total consumption over 1 year
2. 100% large scale solar can be understood as the amount of solar energy to be
installed as a minimum to cover 100% of the consumption and is the subject to
determine the required minimum storage capacities over 1 year.
In this research only the first case has been regarded to show the potential of solar in
Pathum Thani as the scenario 2 is unrealistic and not reasonable to happen. Before
going into further details, some explanation to understand the simulation results:
Explanation:
1. Consumption total: Actual sum of hourly consumption of Pathum Thani
Province – Values from Sai Noi EGAT substation
2. Consumption max: maximum peak in the specific period
3. Solar Production – sum of hourly values of electricity produced by solar in
specific period
4. Solar maximum – peak production of solar systems in specific period

33
5. Total Biogas / Biomass – sum of hourly values of Biogas (or respective
Biomass) in specific period
6. Total: Sum of hourly difference between productions and consumption
7. Mean: Mean in hourly values of the difference production – consumption
8. If not further explained or explicitly mentioned, the electricity generated with
solar is equal to the P50 value.
5.1 100 % Large Scale Solar Scenario
The 1st scenario assumed that 100% of paddy rice fields, greater than 10 Rai have been
used for a solar installation.
With the total area of 578,449,381 sqm, a total capacity of 28,922 MWp could be
installed. The simulation has been done with this value.
5.1.1 Simulation Results
It can be seen that the yearly production from this scenario is around 40,900,836 MWh
which is approximately 2,615% higher than the yearly total consumption. However, a
look in the hourly production and consumption shows clearly the problems, while at
daytime a production up to 27,009 MWh while at night time the production is 0 MWh.
Such a system requires a great storage of a minimum of 3,626,220 MWp to ensure
enough electricity could be supplied. This assumption does not take into consideration
the fact of the enormous electricity supplied and generated at day time. This chapter is
a demonstration of the solar potential and not a simulation of grid impact and
evacuation studies. However only this minor and short simulation displays the
enormous potential and also problems solar power does have.
Furthermore this system would struggle in case of several rain days. Nevertheless the
production summed over the year 2012 is around 2,615 % higher than the consumption
and hence the enormous potential of the solar is clear.
34
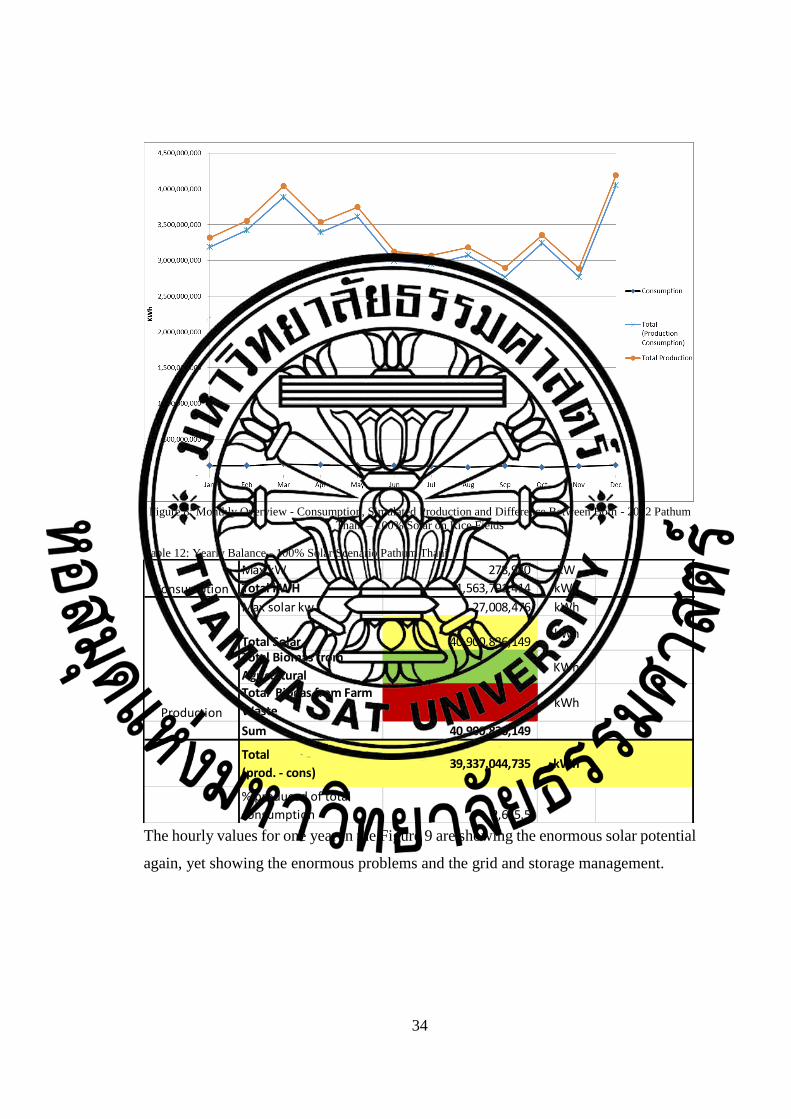
Figure 8: Monthly Overview - Consumption, Simulated Production and Difference Between Both - 2012 Pathum
Thani – 100% Solar on Rice Fields
Table 12: Yearly Balance - 100% Solar Scenario Pathum Thani
The hourly values for one year in the Figure 9 are showing the enormous solar potential
again, yet showing the enormous problems and the grid and storage management.
Max kW 278,940 kW
Total kWH 1,563,791,414 kWh
Max solar kw 27,008,476 kWh
Total Solar 40,900,836,149 kWh
Total Biomas from
Agricultural - KWh
Total Biogas from Farm
Waste - kWh
Sum 40,900,836,149
Total
(prod. - cons)39,337,044,735 kWh
% produced of total
consumption 2,615.5
Consumption
Production

35
Figure 9: Yearly Overview of Hourly Production and Consumption - 100% Solar
5.1.2 Load Shifting and Storage With an assumed storage capacity of 3,626,220 MWp what is equal to 13 hours of the
maximum load in the year 2012, the minimum storage de-loading will be 7%.
Furthermore a 39,337,004 MWh of excessive electricity could be exported every year.

36
Figure 10: Storage Status - 100% Solar Simulation
Figure 11: Load Shifting
37
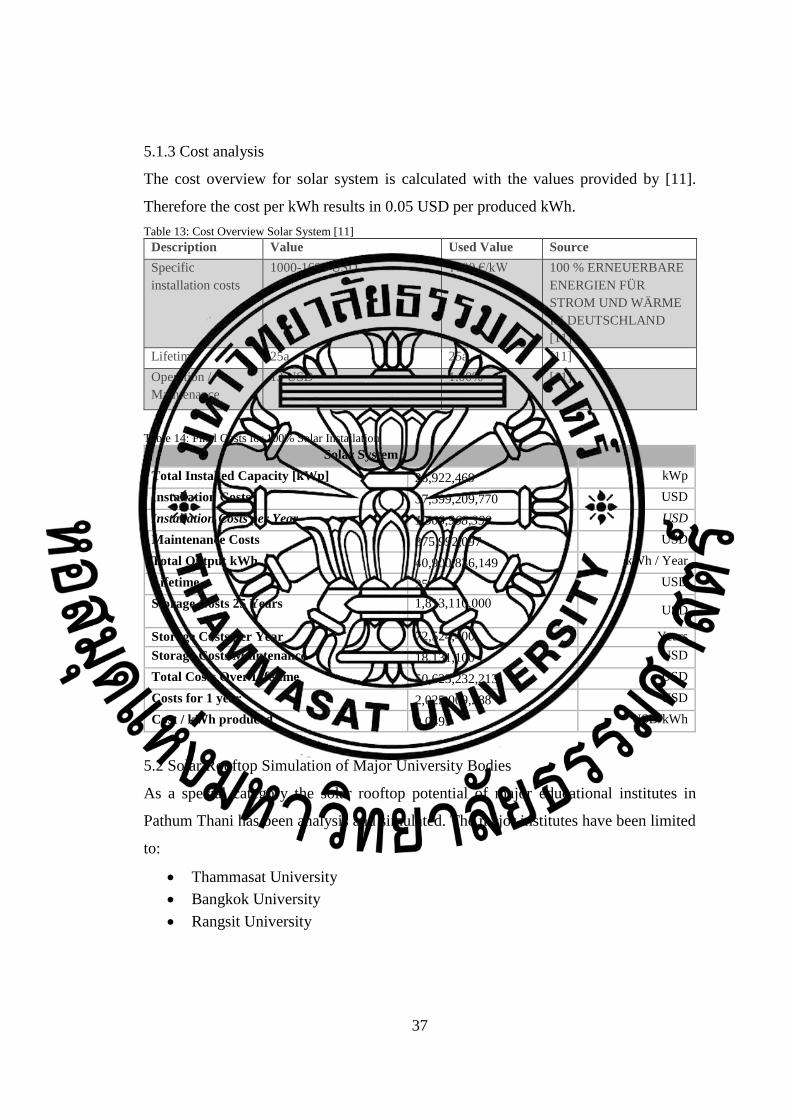
5.1.3 Cost analysis
The cost overview for solar system is calculated with the values provided by [11].
Therefore the cost per kWh results in 0.05 USD per produced kWh.
Table 13: Cost Overview Solar System [11]
Description Value Used Value Source
Specific
installation costs
1000-1600 USD 1000 €/kW 100 % ERNEUERBARE
ENERGIEN FÜR
STROM UND WÄRME
IN DEUTSCHLAND [11]
Lifetime 25a 25a [11]
Operation /
Maintenance
13 USD 1.00% [11]
Table 14: Final Costs for 100% Solar Installation
Solar System
Total Installed Capacity [kWp] 28,922,469 kWp
Installation Costs 37,599,209,770 USD
Installation Costs per Year 1,503,968,390 USD
Maintenance Costs 375,992,097 USD
Total Output kWh 40,900,836,149 kWh / Year
Lifetime 25 USD
Storage Costs 25 Years 1,813,110,000 USD
Storage Costs per Year 72,524,400 Years
Storage Costs Maintenance 18,131,100 USD
Total Costs Over Lifetime 50,625,232,213 USD
Costs for 1 year 2,025,009,288 USD
Cost / kWh produced 0.0495 USD/kWh
5.2 Solar Rooftop Simulation of Major University Bodies As a special category the solar rooftop potential of major educational institutes in
Pathum Thani has been analysis and simulated. The major institutes have been limited
to:
Thammasat University
Bangkok University
Rangsit University

38
Their rooftop area has been measured and the respective potential has been simulated
using the Helioscope software. The results of maximum installation capacity has been
imported to developed simulation tool to run a yearly output simulation and compare it
to the actual consumption of Pathum Thani province. As the size of this universities as
well as some industries will exceed the 0.5 MWp separations as used definition between
small and large scale system, the overall potential will still be summed in the small
scale system category as such rooftop systems consist of several smaller systems and
thus the categorization is justified. The same technologies and set up as for the large
scale system has been selected. Once the respective area has been set in Helioscope the
software will then design and estimate the potential of the respective area.
5.2.1 Solar Potential of Rooftops – Thammasat University Rangsit
With Helisocope each potential building at Thammasat University has been measured
and evaluated weather a solar installation might be possible or not. This does not take
into consideration the actual appearance of the roof and weather an installation is
possible or does require some pre work however possible rooftops with a good shape
can be targeted and further major shading obstacles and other obstacles, too small roof
areas and wrong shaped roofs have been excluded. While Figure shows the location
and overview map of Thammasat University, Figure and Figure displaying the
potential solar rooftop installation.
Figure 12: Thammast University Pathum Thani Area Overview in Google Maps
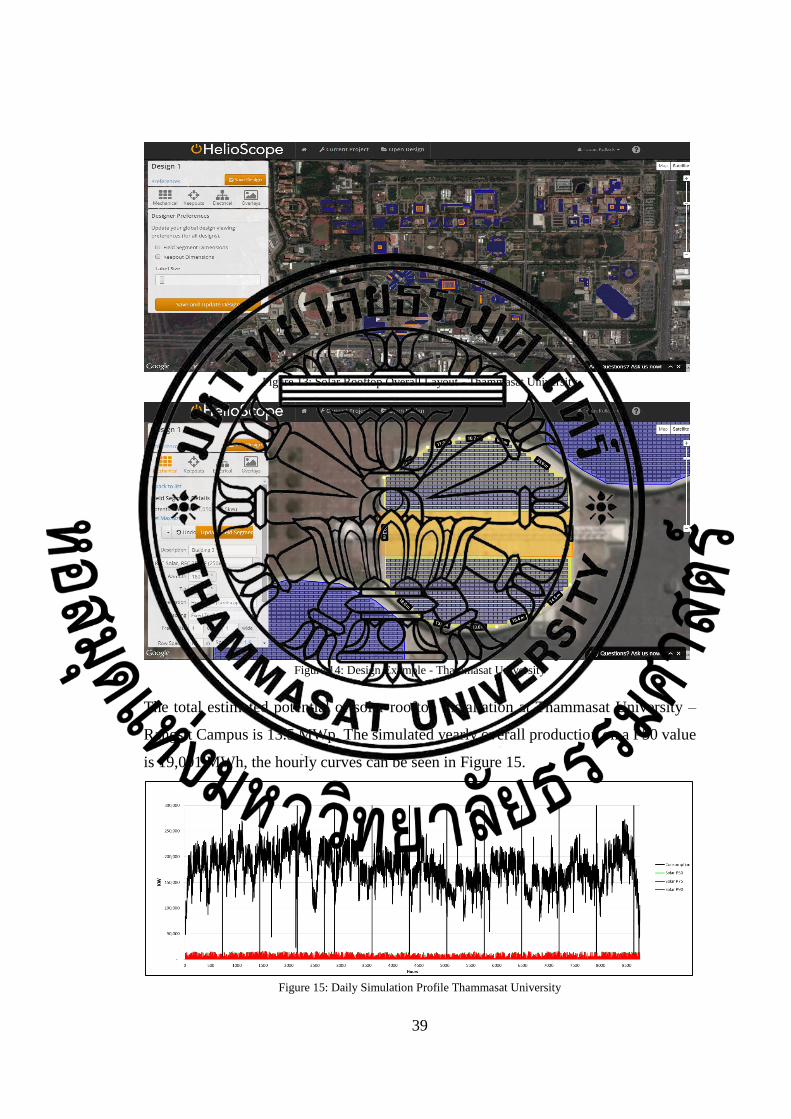
39
Figure 13: Solar Rooftop Overall Layout - Thammasat University
Figure 14: Design Example - Thammasat University
The total estimated potential of solar rooftop installation at Thammasat University –
Rangsit Campus is 13.5 MWp. The simulated yearly overall production on a P50 value
is 19,091 MWh, the hourly curves can be seen in Figure 15.
Figure 15: Daily Simulation Profile Thammasat University
40
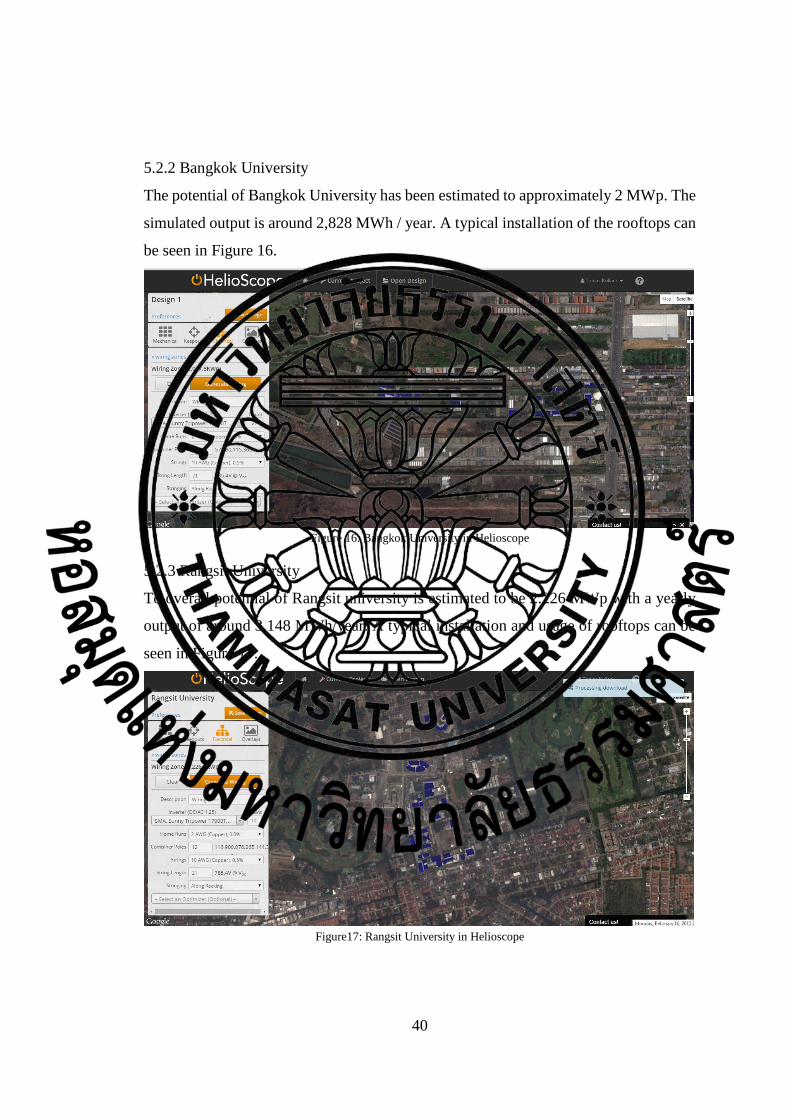
5.2.2 Bangkok University
The potential of Bangkok University has been estimated to approximately 2 MWp. The
simulated output is around 2,828 MWh / year. A typical installation of the rooftops can
be seen in Figure 16.
Figure 16: Bangkok University in Helioscope
5.2.3 Rangsit University
To overall potential of Rangsit university is estimated to be 2.226 MWp with a yearly
output of around 3,148 MWh/year. A typical installation and usage of rooftops can be
seen in Figure 17.
Figure17: Rangsit University in Helioscope

41
5.2.4 Overall Potential from University Institutes
The overall potential of the 3 universities as described in chapter 5.2.1 until chapter
5.2.3 has been summarized. With an overall potential of 17.7 MWp a total of 25,031
MWh/year could be produced which is approximately 1.6% of the overall consumption
of Pathum Thani province. Figure 18 shows the yearly load profile and the simulated
solar production of the university institutes.
Figure 18: Overall Solar Production from major universities and total load consumption of Pathum Thani
5.2.4 Cost Analysis
The cost analysis for such a system has been carried out. As in this case no storage has
been simulated the overall costs can be seen in Table 15. The cost per kWh for such a
system without storage is approximately 0.046 USD
Table 15: Cost Analysis of Solar Systems on University Rooftops Without Storage
Solar System
Total Installed Capacity [kWp] 17,700 kWp
Installation Costs 23,010,000.00 USD
Installation Costs per Year 920,400.00 USD
Maintenance Costs 230,100.00 USD
Total Output kWh 25,030,532 kWh / Year
Lifetime 25
Total Costs Over Lifetime 28,762,500 USD
Costs for 1 year 1,150,500.00 USD
Cost / kWh produced 0.045964 USD/KWH

42
5.3 Small Scale Solar Systems
Small scale solar systems are systems as defined before with a capacity not exceeding
0.5 MW. As definition a maximum of 0.5% of the area of Pathum Thani might be
available for such systems. Therefore the available area is set to be 7,630,000 square
meter. Most of the so called small scale systems will be used to supply the electricity
directly to the consumers. With a total of 7,630,000 square meter of area and the same
system set up as defined under large scale solar systems, the potential is up to 382
MWp. The yearly output over the consumption can be seen in Figure 19.
Figure 19: Potential of Small Scale Systems
The total maximum producible amount of electricity it approximately 540,206,971
kWh/year what is approximately 36% of the total consumed electricity. While the
yearly overview seems to exceed the load consumption of the province, the monthly
and daily load profiles as seen in Figure displays the real potential.

43
Figure 20: Monthly Load Profile - Small Scale Systems
When storage with a capacity of approximately 6,694 kWp capacities is included a load
profile as seen in Figure can be achieved.
Figure 21: Small Scale Load Profile Inclusive Storage

44
5.3.1 Cost Analysis
Table 16: Cost Analysis Small Scale Solar Systems
Solar System
Total Installed Capacity [kWp] 382,000 kWp
Installation Costs 496,600,000 USD
Installation Costs per Year 19,864,000 USD
Maintenance Costs 4,966,000 USD
Total Output kWh 540,206,971 kWh / Year
Lifetime 25 USD
Storage Costs 25 Years 3,347,280,000.00 USD
Storage Costs per Year 133,891,200.00 Years
Storage Costs Maintenance 33,472,800.00 USD
Total Costs Over Lifetime 7,315,310,000 USD
Costs for 1 year 292,612,400.00 USD
Cost / kWh produced 0.54 USD/kWh
Storage assumed to be 24 hours of autonomous electricity supply with the highest peak
load in 1 year.
5.4 100% Biogas and Biomass – Scenario
The Biogas and Biomass scenario simulates 100% usage of Paddy Rice Fields for
Biomass and the agricultural waste as Biogas. As 100% of all paddy sources can be
used a total capacity as indicated in chapter 3 can be installed. The total production
capacity is then considered to be 66.8 MWp/year with a total installed capacity of
Biomass of 97.5 MWp assuming an average runtime of 6000 hours/year. Additionally
the Biogas from farm waste as estimated in in the previous chapters to be 650 kW/h.
5.4.1 Cost Analysis
Table 17: Biomass Cost Analysis
Biomass Systems
Total Installed Capacity [kWp] 97,798,119 kWh
Installation Costs (30 Years) 195,596,237.01 USD
Installation Costs per Year 6,519,875 USD
Maintenance Costs 48,899,059 USD
Total Output kWh 585,141,530 kWh
Lifetime 30 Years
Fuel Costs 336,138.40 USD
Total Costs Over 25 Years 1,393,876,806 USD
Costs for 1 year 55,755,072.22 USD
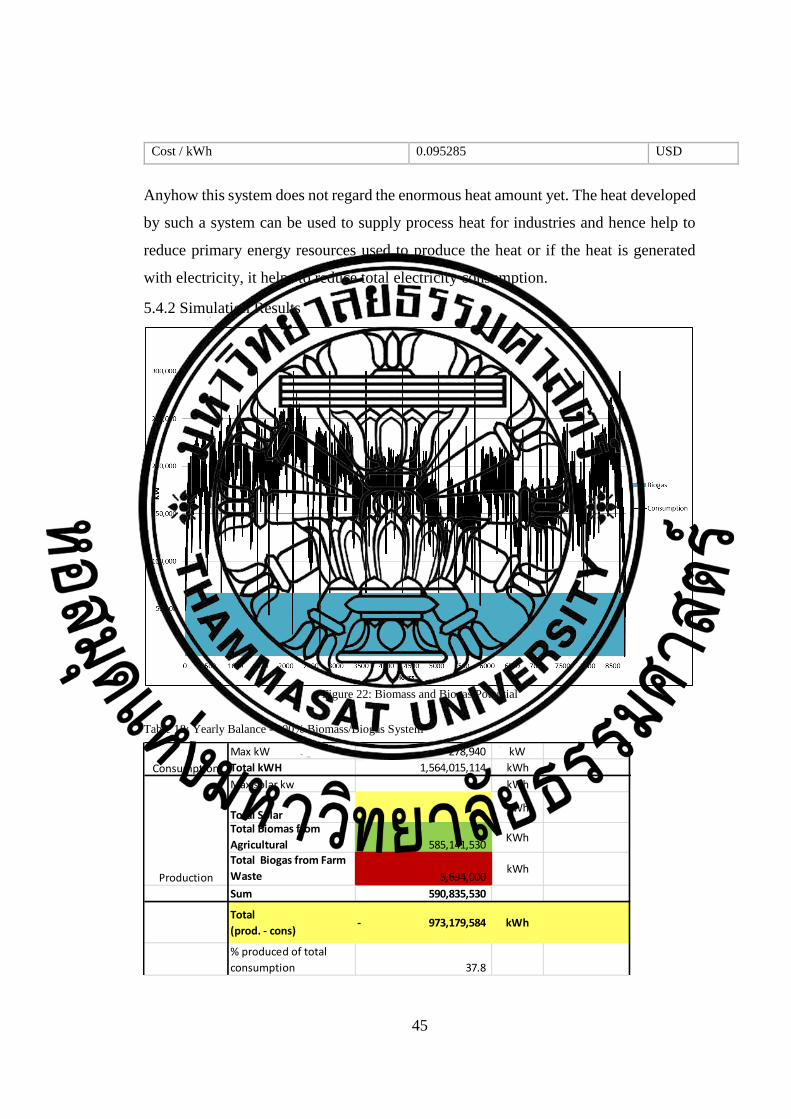
45
Cost / kWh 0.095285 USD
Anyhow this system does not regard the enormous heat amount yet. The heat developed
by such a system can be used to supply process heat for industries and hence help to
reduce primary energy resources used to produce the heat or if the heat is generated
with electricity, it helps to reduce total electricity consumption.
5.4.2 Simulation Results
Figure 22: Biomass and Biogas Potential
Table 18: Yearly Balance - 100% Biomass/Biogas System
Max kW 278,940 kW
Total kWH 1,564,015,114 kWh
Max solar kw - kWh
Total Solar - kWh
Total Biomas from
Agricultural 585,141,530 KWh
Total Biogas from Farm
Waste 5,694,000 kWh
Sum 590,835,530
Total
(prod. - cons)973,179,584- kWh
% produced of total
consumption 37.8
Consumption
Production
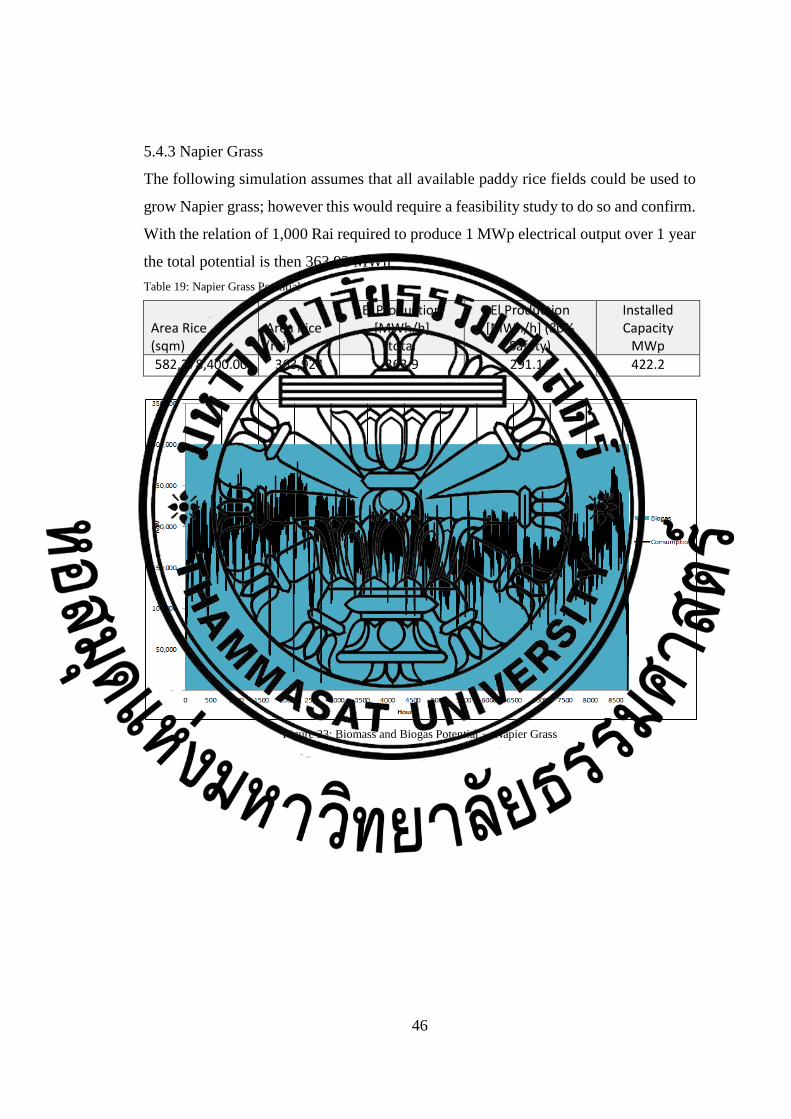
46
5.4.3 Napier Grass
The following simulation assumes that all available paddy rice fields could be used to
grow Napier grass; however this would require a feasibility study to do so and confirm.
With the relation of 1,000 Rai required to produce 1 MWp electrical output over 1 year
the total potential is then 363.92 MWh
Table 19: Napier Grass Potential
Area Rice (sqm)
Area Rice (rai)
El Production [MWh/h]
total
El Production [MWh/h] (80%
Safety)
Installed Capacity
MWp
582,278,400.00 363,924 363.9 291.14 422.2
Figure 23: Biomass and Biogas Potential – Napier Grass

47
5.4.3.1 Cost Analysis
Table 20: Cost Analysis Napier Grass Potential
Napier Grass Biogas System 1 MWp and greater
Total Installed Capacity [kWp] 422,151 kWp
Installation Costs (30 Years) 1,319,224,500 USD
Installation Costs per Year 43,974,150 USD
Maintenance Costs per Year 10,993,538 USD
Total Output kWh 2,550,379 kWh
Lifetime 30
Fuel Costs 771,746 USD
Total Costs Over 30 Years 1,393,485,845 USD
Costs for 1 year 55,739,433 USD
Cost / kWh 0.0219 USD
5.5 Mixed Scenarios to cover 100%
This chapter describes actual scenarios to achieve a possible 100% match with the load
curve. As there are several possible solutions and set up some logical approaches has
been followed:
1. Solar installation will be firstly focused on land with soil conditions which are
not preferable to grow any crops. This is clearly soil type 11, then 10 afterwards
it will be 3 and 2.
2. Biogas can be a mix from Napier Grass and Rice or one of both
3. In reality a maximum share and a maximum peak of each technology should be
defined to ensure a reliable system, however this simulation will not define
limits moreover will ensure that there is always a share of both types of
renewable energies used.
4. It is preferable to not use all available land and resources and therefore have a
good mix between rooftop system, converted rice fields to solar, converted rice
to Napier grass and also some rice fields for Biogas by ensuring not all resources
are used completely.
5. Storage capacity will be minimized for each scenario.
Therefore several scenarios have been carried out however only 4 scenarios have been
displayed below to show the general methodology and possible impacts of the
respective set up. All the scenarios taking into consideration that only soil with type 11
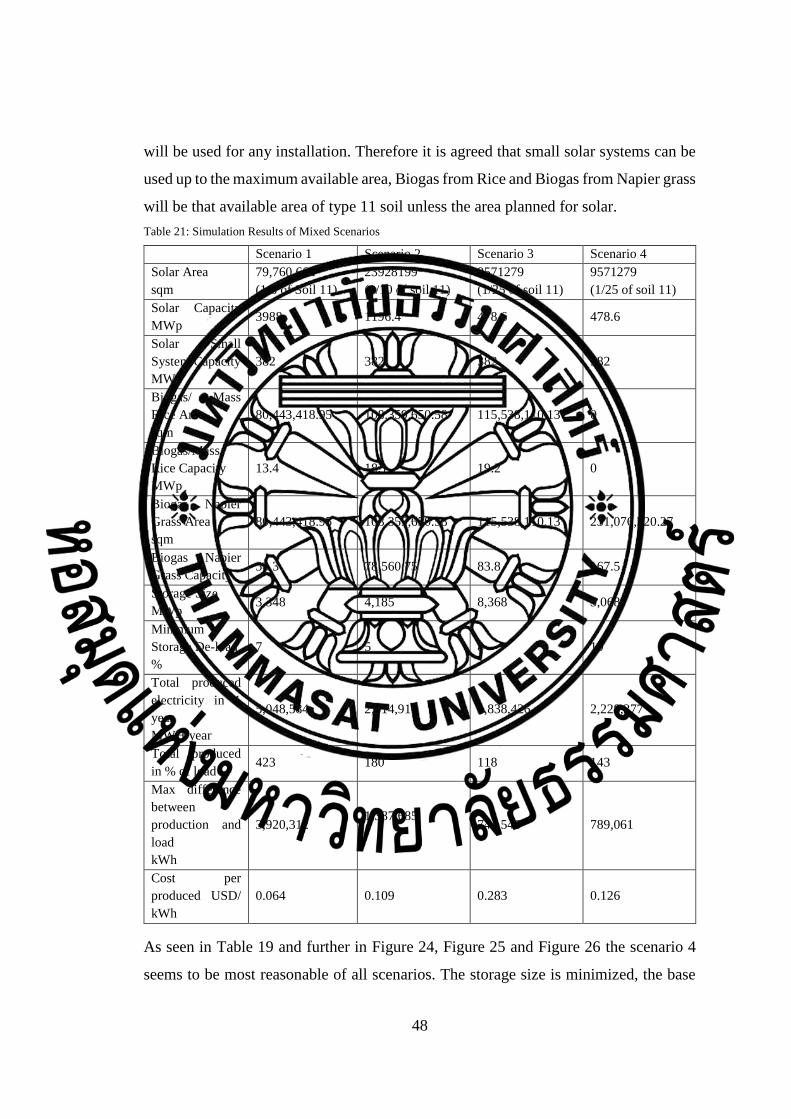
48
will be used for any installation. Therefore it is agreed that small solar systems can be
used up to the maximum available area, Biogas from Rice and Biogas from Napier grass
will be that available area of type 11 soil unless the area planned for solar.
Table 21: Simulation Results of Mixed Scenarios
Scenario 1 Scenario 2 Scenario 3 Scenario 4
Solar Area
sqm
79,760,662
(1/3 of Soil 11)
23928199
(1/10 of soil 11)
9571279
(1/25 of soil 11)
9571279
(1/25 of soil 11)
Solar Capacity
MWp 3988 1196.4 478.6 478.6
Solar Small
System Capacity
MWp
382 382 382 382
Biogas/ Mass
Rice Area
sqm
80,443,418.95 108,359,650.58 115,538,110.13 0
Biogas/Mass
Rice Capacity
MWp
13.4 18.1 19.2 0
Biogas Napier
Grass Area
sqm
80,443,418.95 108,359,650.58 115,538,110.13 231,076,220.27
Biogas Napier
Grass Capacity 58.3 78,560.75 83.8 167.5
Storage Size
MWp 3,348 4,185 8,368 3,068
Minimum
Storage De-load
%
7 5 8 10
Total produced
electricity in 1
year
MWH/year
5,048,584 2,814,915 1,838,426 2,228,377
Total produced
in % of load 423 180 118 143
Max difference
between
production and
load
kWh
3,920,312 1,387,685
744,546 789,061
Cost per
produced USD/
kWh
0.064 0.109 0.283 0.126
As seen in Table 19 and further in Figure 24, Figure 25 and Figure 26 the scenario 4
seems to be most reasonable of all scenarios. The storage size is minimized, the base
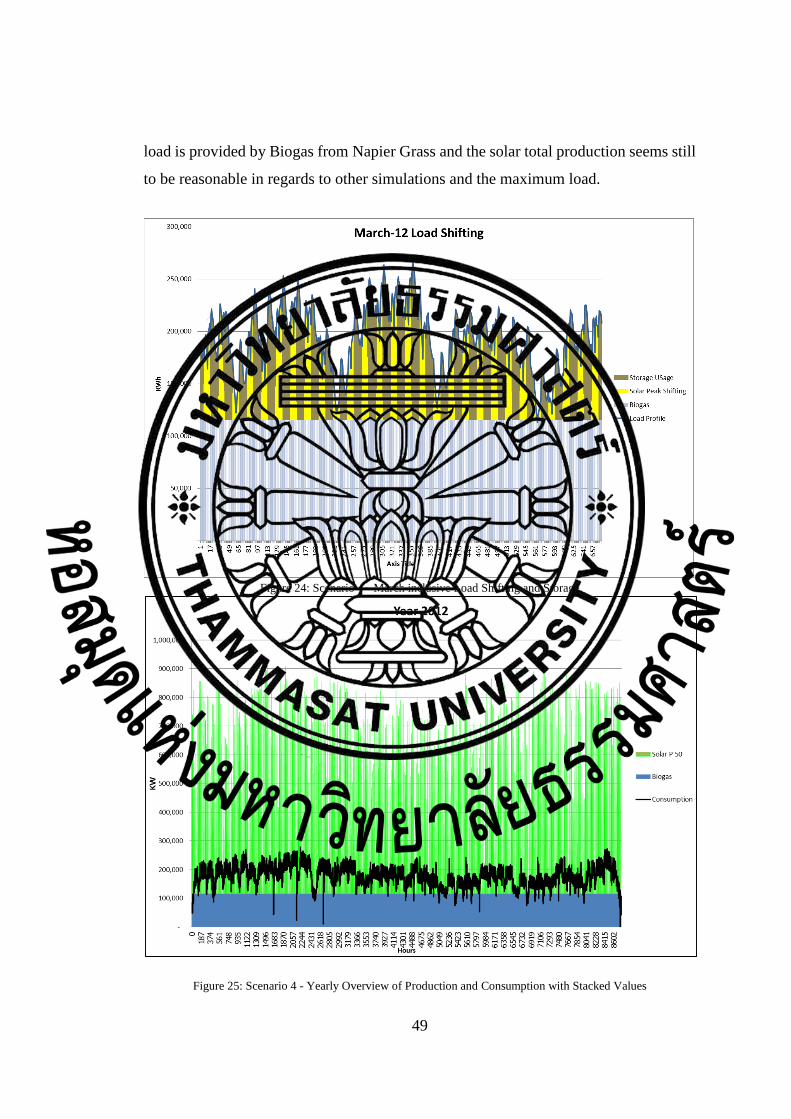
49
load is provided by Biogas from Napier Grass and the solar total production seems still
to be reasonable in regards to other simulations and the maximum load.
Figure 24: Scenario 4 - March inclusive Load Shifting and Storage
Figure 25: Scenario 4 - Yearly Overview of Production and Consumption with Stacked Values

50
Figure 26: Yearly Overview of Scenario 4 as Non Stacked Graph
51
Chapter 6
Result and Discussion
The results in the Thesis are surely simulated results assuming several factors as
described and with a selection of available technologies. It would be advisable to
confirm such numbers with real experiments rather than only relying on simulation
software’s. However the simulation software as used such as “PVsyst” tend to provided
conservative results and with the assumed safety factors in the research, there it is most
likely that the simulated output can be achieved or even exceeded.
Also a discussion on the topic weather natural resources to be used for energy supply
and what the maximum percentage of such a usage should be has not been regarded in
this research but surely should be figured in when planning such systems. The current
simulation model provides a very good overview of actual resources and their hourly
impact on available area and natural resourced and thus further studies to find an
optimized maximum to ensure the natural resources are being used in a balanced way
by achieving a set target of renewable energy sources should be conducted.
The current simulation model is a model based on the past, however with minor
adjustments and with verification of the results with actual projects the simulation
model could be upgraded by an electricity consumption forecast model, weather
forecast model and then being used as forecasting model for a couple of hours, days,
weeks or month to ensure sufficient planning on backup sources are in place.

52
Chapter 7
Conclusions and Recommendations
The optimizations to find the cost efficient system on the one hand and to find a system
with a maximum amount of renewable energies that should be integrated, different
approaches were made with the following results:
1. To find possible solutions such as installation of solar only around villages,
biogas only with rice paddy grown on soil 11. This approach was regarded but
due to its high variation in different solutions only 2- 3 case studies could be
provided, however this is not an optimization yet.
2. Another option is to find for different scenarios the costs, while regarding all
driving forces such as storage size, amount of Solar Biogas and so on. With this
approach, different scenarios could be implemented and reviewed easier than
with the method mentioned above. Furthermore several possible solutions can
be compared and the optimum solution might be found. The Figure assumes
that 100% of the available area will be used for an installation.
Reading from left to write, we will start to use 100% for solar and hence no
Biogas installation is done. While moving to the right, the share of solar
decreases while the share of biogas is increasing until reaching 100%. The blue
line indicates the storage size. For the storage size, the minimum capacity, to
never reach a 20% discharge status, was calculated.
If such an analysis would be carried out for 10-20 different scenarios, costs
included, different “optimized” systems might be found.
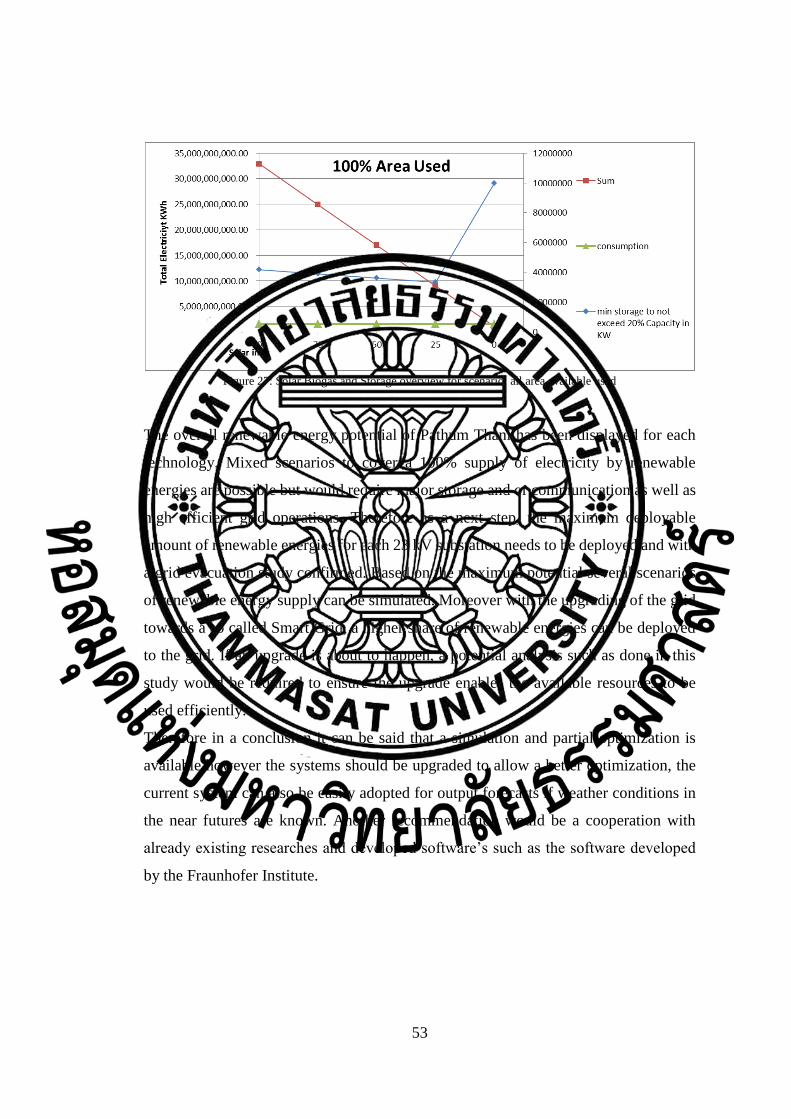
53
Figure 27: Solar Biogas and Storage overview for scenario: all area available used
The overall renewable energy potential of Pathum Thani has been displayed for each
technology. Mixed scenarios to cover a 100% supply of electricity by renewable
energies are possible but would require major storage and or communication as well as
high efficient grid operations. Therefore as a next step, the maximum deployable
amount of renewable energies for each 23 kV substation needs to be deployed and with
a grid evacuation study confirmed. Based on the maximum potential several scenarios
of renewable energy supply can be simulated. Moreover with the upgrading of the grid
towards a so called Smart Grid, a higher share of renewable energies can be deployed
to the grid. If an upgrade is about to happen, a potential analysis such as done in this
study would be required to ensure the upgrade enables the available resources to be
used efficiently.
Therefore in a conclusion it can be said that a simulation and partial optimization is
available however the systems should be upgraded to allow a better optimization, the
current system can also be easily adopted for output forecasts if weather conditions in
the near futures are known. Another recommendation would be a cooperation with
already existing researches and developed software’s such as the software developed
by the Fraunhofer Institute.
54
References
[1] Department of Information and Communication of Pathum Thani. (n.d.).
Pathum Thani. Retrieved January 26, 2007,
http://www.pathumthani.go.th/index%20k.html
[2] http://www.esri.com/software/arcgis
[3] Department of Land Development Pathum Thani
[4] Office of Agricultural Economics, Thailand
[5] AGRICULTURAL STATISTICS OF THAILAND 2012, OFFICE OF
AGRICULTURAL ECONOMICS, MINISTRY FOR AGRICULTURAL
AND COOPERATIVES BANGKOK, THAILAND,
http://www.oae.go.th, ISSN 0857-6610,
[6] Logistics cost analysis of rice straw for biomass power generation in Thailand,
Energy 36 (2011) 1435-1441, Delivand MK, Barz M, Gheewala
http://www.thaiscience.info/Article%20for%20ThaiScience/Article/3/Ts-
3%20logistics%20cost%20analysis%20of%20rice%20straw%20for%20bioma
ss%20power%20generation%20in%20thailand.pdf
[7] Overall Analyses of Using Rice Straw Residues for Power Generation in
Thailand- Project Feasibility and Environmental GHG Impacts
Assessment Mitra Kami Delivand, Mirko Barz, Savitri Garivait,
http://www.jseejournal.com/JSEE%202011/Special%20Issue/12.%20Overall
%20analysed_Mir a_p.%2039-46.pdf
[8] http://www.rcogenasia.com/biomass-power-cogen-2/rice-husk-to-power/
The 6th Biomass Asia Workshop Presented under Theme :
Research and Technological Development for Sustainable Biomass
Utilization in Asian Countries Organized by MAFF, METI, Biomass
Asia Research Consortium, JAPAN at Hotel Granvia Hiroshima, Hiroshima, JAPAN, November 19, 2009 Peesamai Jenvanitpanjakul and Paritud Bhandhubanyongม National Science and Technology Development Agency
(NSTDA), THAILAND
[9] Office of the District Livestock. (Data as of August 6, 2556)
[10] Assessment of sustainable energy potential of non-plantation biomass
resources in Thailand” – Science Direct, Biomass and Bioenergy 29
(2005) 214–224 Boonrod Sajjakulnukita, Rungrawee Yingyuada,
VirachManeekh, Veerawan Pongnarintasuta, S.C. Bhattacharyab, P. Abdul
Salam
[11] 100 % ERNEUERBARE ENERGIEN FÜR STROM UND WÄRME IN
DEUTSCHLAND
[12] Pathum Thani Administration Office
[13] Land Development Department

55
[14] http://www.tgo.or.th/index.php?option=com_content&view=article&id
=349:thailand-%09grid-%09emission-2010-report&catid=62:tgo-
research&Itemid=29
[15] http://pvsyst-wiki.wikispaces.com/About+PVsyst, URL accessed, 28.11.2012
[16] http://www.pvsyst.com/en/, URL accessed, 30.11.2012
[17] http://forum.pvsyst.com/viewtopic.php?f=18&t=1217 , URL accessed, 16.
02.2015
[18] http://www.folsomlabs.com/about URL accessed 04.03.2015
[19] http://www.giz.de/fachexpertise/downloads/2014-en-aggarangsi-pep-
infoveranstaltung-biogas-biomasse-philippinen-thailand.pd f URL accessed
06.04.2015
[20] http://files.sma.de/dl/7680/Perfratio-UEN100810.pdf URL accessed
07.04.2015
[21] Renewable energy sources for peak load demand management in India,
Surekha Dudhani, , A.K. Sinha, S.S. Inamdar, International Journal of
Electrical Power & Energy Systems Volume 28, Issue 6, July 2006, Pages
396–400
[22] Simulations of scenarios with 100% renewable electricity in the Australian
National Electricity, Market, Ben Elliston, Mark Diesendorf, Iain MacGill,
April 16, 2012
[23] Connolly, D., Lund, H., Mathiesen, B., Leahy, M., 2011. The rst step towards
100% renewable energy-system for Ireland.
[24] Krajcic, G., Duic, N., da GracaCarvalho, M., 2011. How to achieve a
100%RES electricity supply for Portugal, Applied Energy
[25] Lehmann, H., 2003. Energy Rich Japan. Technical Report. Institute for
Sustainable Solutions and Innovations. Retrieved December 02, 2012,
from:http://energyrichjapan.info
[26] Lund, H., Mathiesen, B., 2009. Energy system analysis of 100% renewable
energy systems, The case of Denmark in years 2030 and 2050
[27] Delucchi, M.A., Jacobson, M.Z., 2011. Providing all global energy with wind,
water, and solar power, Part II: Reliability, system and transmission costs, and
policies.
[28] Thailand Green Islands Renewable Energy Investment on Remote Islands;
Twarath Sutabutr, Sc.D v Deputy Director-General; Department of Alternative
Energy Development and Efficiency; Ministry of Energy, Thailand, 5 June
2012
[29] Energy Planning and Policy, Maxime Kleinpeter, 1995
[30] Solar energy; fundamentals and applications / H.P. Garg, J. Prakash. Imprint
New Delhi : Tata McGraw-Hill
[31] Solar electricity: a practical guide to designing and installing small
photovoltaic systems / Simon Roberts.
[32] YIELD FACTORS OF A PHOTOVOLTAIC PLANT, CRISTIAN P.
CHIONCEL, DIETER KOHAKE, LADISLAU AUGUSTINOV, PETRU
CHIONCEL, GELU OVIDIU TIRIAN,UNIVERSITY OF HUNEDOARA,
ROMANIA
56
[33] SMA Performance ratio, Quality factor for the PV plant,
http://files.sma.de/dl/7680/Perfratio-UEN100810.pdf
[34] http://www.nrc.gov/reading-rm/basic-ref/glossary/capacity-factor-net.html,
2012.12.03
[35] Nachwachsende Rohstoffe” Federal Ministry for Food, Agriculture and
Consumer Protection, Germany
[36] Community Based Bioenergy Systems - Technologies for Energy from
Agricultural Biomass Sources Conference on Community Based Renewables:
Thai-German Cooperation on Sustainable Energy Development Sept. 2nd, 2013,
Ministry of Foreign Affairs, Narathip Room, Sri Ayudhya Road, Bangkok
(Thailand) (Mirko Barz)
[37] http://weben.dede.go.th/webmax/sites/default/files/factsfigures_2012.pdf