renewable energy regulation in spain - … · renewable energy regulation in spain fernando marti...
TRANSCRIPT

RENEWABLE ENERGY REGULATION
IN SPAIN
Fernando Marti Scharfhausen
Vice ChairmanFebruary 2010
1
Vice Chairman
NATIONAL ENERGY COMMISSION

Solar Heat Map
2
Ref.: Plan de Energías Renovables en España 2005-2010. Solar Heat for Industrial Applications, AEE INTEC - Institute for Sustainable Technologies. Junio 2006

Regulation is the key factor
3

Spanish capacit installed
CAPACITY INSTALLED DIC 2008: 95.648 MW =
Spanish capacity installed
CAPACITY INSTALLED DIC 2008: 95.648 MW = 66. 448 MW OS + 29.200 MWSS
Potencia Instalada en España (MW) Diciembre 200824.000
16.658
23.054
15.946
Potencia Instalada en España (MW). Diciembre 2008
7.716
11.869
7.1516.123
0
6.123
1.970
5.161
4Fuente: REE SPECIAL SYSTEMORDINARY SYSTEM

Capacit installed Special S stemCapacity installed: Special System
29.200
35.000
Evolución de la potencia instalada en el régimen especial en España. (Diciembre_2008)
17.48019.248
21.529
24.738
29.200
20.000
25.000
30.000
W
Mini Hydro
PV -CSP
1 407 1 582 2 151 2.606 3.098 3.923 4.5446.271
7.8059.266
11.26613.381
14.980
5 000
10.000
15.000MW
Wind
1.042 1.407 1.582 2.151 606
0
5.000
1990 1991 1992 1993 1994 1995 1996 1997 1998 1999 2000 2001 2002 2003 2004 2005 2006 2007 2008
Cogeneración Eólica Hidráulica Residuos
CHP
Cogeneración Eólica Hidráulica Residuos
Biomasa Trat.Residuos Solar Total

Capacit installed Special S stemCapacity installed: Special System
29 36735.000
Evolución de la potencia instalada en el régimen especial en España. (Junio_2009)
17.48019.248
21.529
24.738
29.200 29.367
20.000
25.000
30.000
W
Mini Hydro
PV -CSP
1 407 1 582 2 151 2.606 3.098 3.923 4.5446.271
7.8059.266
11.26613.381
14.980
5 000
10.000
15.000MW
Wind
1.042 1.407 1.582 2.151
0
5.000
1990 1991 1992 1993 1994 1995 1996 1997 1998 1999 2000 2001 2002 2003 2004 2005 2006 2007 2008 2009
Cogeneración Eólica Hidráulica Residuos
CHP
Cogeneración Eólica Hidráulica Residuos
Biomasa Trat.Residuos "Solar" Total

N mber of installations Special S stemNumber of installations; Special System
53.59360.000
Evolución del numero de instalaciones en régimen especial en España. (Diciembre_2008)
22.69730.000
40.000
50.000
MW
1.342 1.553 1.777 2.079 2.805 3.692 5.492 7.72012.263
22.697
0
10.000
20.000
M
PV
01998 1999 2000 2001 2002 2003 2004 2005 2006 2007 2008
SOLAR EÓLICA HIDRÁULICA COGENERACIÓN
RESIDUOS TRAT RESIDUOS Total general
7
RESIDUOS TRAT.RESIDUOS Total general

N mber of PV installationsNumber of PV installations
INSTALACIONES FOTOVOLTAICAS
40 000
45.000
50.000
55.000
25.000
30.000
35.000
40.000
5.000
10.000
15.000
20.000
01998 1999 2000 2001 2002 2003 2004 2005 2006 2007 2008 2009

Capacit PV installed
E l ió i t l d l t i i t l d E i
Capacity PV installed
3.4374.000
Evolución e incremento anual de la potencia instalada en Energia Solar. Diciembre_2008
2.500
3.000
3.500
6981.000
1.500
2.000
MW
1 1 1 1 1 2 2 4 8 12 23 48 147
0
500
9SOLAR Incremento sobre el año anterior Total

Share of prod ction of Special S stemShare of production of Special System
28%30%300000
Evolución anual de la demanda bruta y la energía vendida por el régimen especial nacional.
13% 14%16%
18% 19%20% 19%
21%
25%
28%
20%
25%
30%
200000
250000
300000
h
1% 2% 3%4%
6% 6%9%
10%11%
13% 13% %
5%
10%
15%
50000
100000
150000
GW
h
0%0
Demanda b.c. R.Especial % R.Especial/Demanda
10

E d ti f S i l S tEnergy production of Special System
Generated Energy in Spain ( Renewables and CHP)
51.686 51.97257.808
61.441
60.000
70.000
25.131 27.50731.244
36.20042.146
46.909
30.000
40.000
50.000
MW
GW
h
1.630 3.138 4.014 5.697 8.519 10.00614.108 16.499
20.437
0
10.000
20.000
G
01990 1991 1992 1993 1994 1995 1996 1997 1998 1999 2000 2001 2002 2003 2004 2005 2006 2007 2008
CHP Wind Hydro Waste Biomass waste Treat. Solar PV Total
11
y

Share of green electricity in gross electricity consumption 30% in 2010
Evolución de la participación que representan las energías renovables sobre la demanda en España
Share of green electricity in gross electricity consumption 30% in 2010 Directive
2001/77/CE
26% 26%30%300.000
Evolución de la participación que representan las energías renovables sobre la demanda en España
19%20%
15%
18% 19%
15%
26%
22% 22%
16%
18%
22%23%
20%
16%
19%21% 22%
15%
20%
25%
150 000
200.000
250.000
Wh
16%14%
5%
10%
15%
50.000
100.000
150.000
GW
0%01990 1991 1992 1993 1994 1995 1996 1997 1998 1999 2000 2001 2002 2003 2004 2005 2006 2007 2008 2009
Demanda bruta Hidráulica RO Renovables RE Total Renovables / Demanda bruta
12

CONTENTS
1. Economic regulation:
Ley 54/97, RD 661/2007, RD 1578/2008 and RD-Ley 6/2009
2. Access regulation: 2. Access regulation: RD 1955/2000 and CNE RD Proposal 22April 2009
3. Guarantee of origin:
O d ITC 1522/2007
13
Order ITC 1522/2007

1. Economic regulation: Ley 54/97,RD 661/2007, RD 1578/2008 and RD-Ley 6/2009
14

1. Economic regulation Power Act 1997: Basic purposePower Act 1997: Basic purpose
To establish the Spanish Electricity Regulationith th f ll i th lwith the following three goals:
1 Guaranteeing the supply of electricity power1. Guaranteeing the supply of electricity power
2. Guaranteeing its quality3. Guaranteeing the supply of electricity power
at the lowest possible cost
Environmental protection must be taken into account
15
With a transitional period: warranty by law

1. Economic regulation Power Act 1997: Basic purpose
To establish the Spanish Electricity Regulation with
Power Act 1997: Basic purpose
the following three goals:
Environmental protection must be taken into account onEnvironmental protection must be taken into account onEnvironmental Impact Assessment
I t t d P ll t t P ti d C t lIntegrated Pollutant Prevention and Control
Emission Trading
Special System of Generation (economic incentives)
Demand Side Management Programs (economic incentives)
16

1. Economic regulation
According to Law 54/1997SPECIAL SYSTEM ORDINARY SYSTEM
According to Law 54/1997
Generators ≤ 50MW that use: Conventional generators
The energy produced can be Is obliged to participate in the market
incorporated into grid (priority of dispatching)Payments:
market
Payments: market price
a fixed tariff (guaranteed purchase) a premium in addition to the
17
market price

1. Economic regulation
According to Law 54/1997SPECIAL SYSTEM
According to Law 54/1997
18

1. Economic regulation
According to Law 54/1997SPECIAL SYSTEM
According to Law 54/1997
Bi
19

1. Economic regulation
Methodology CNE
Criteria:
Methodology CNE
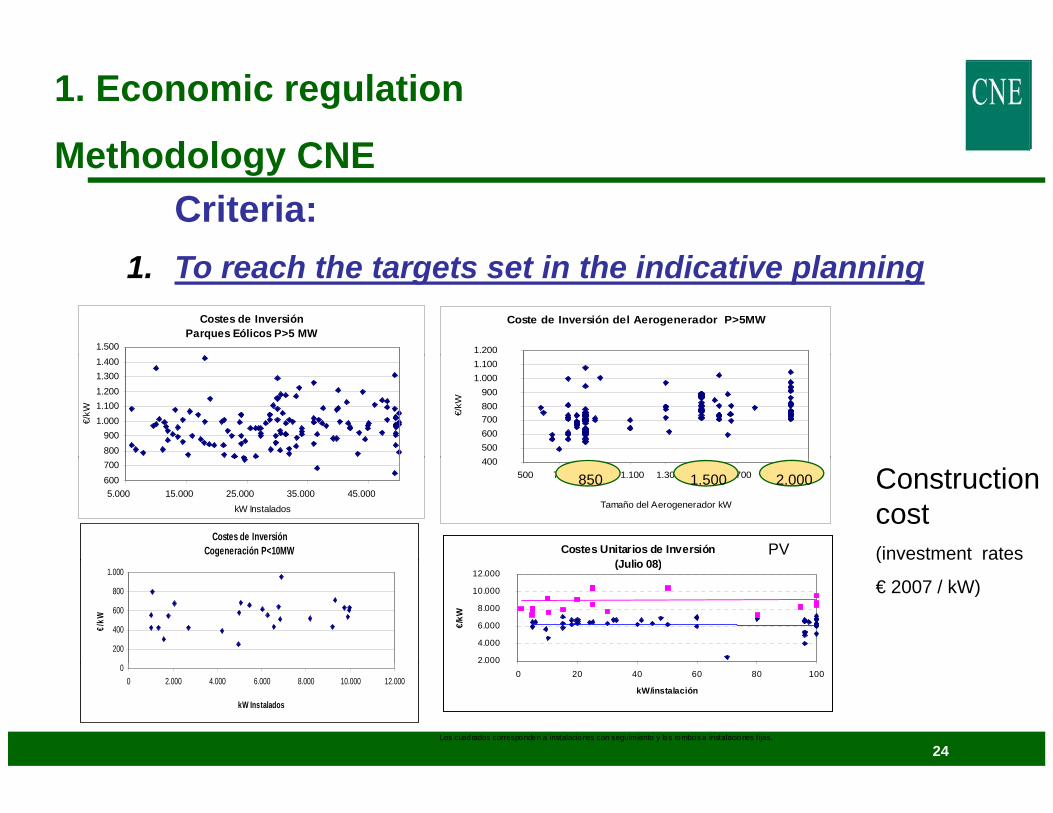
1. To reach the targets set in the indicative planning
2 Security and predictability of the economic supports2. Security and predictability of the economic supports
3. Improve the quality of this kind of energy in order to integrate it to the system
4. RES+CHP compatible with Electricity Marketp y
20

1. Economic regulation
Methodology CNECriteria:
Methodology CNE
1. To reach the targets set in the indicative planningEconomic incentives -> Energy and Environmental Policy tool (enough to obtain a reasonable profitability)tool (enough to obtain a reasonable profitability)
21

1. Economic regulation
Methodology CNECriteria:
Methodology CNE
1. To reach the targets set in the indicative planningShare of 12% of primary energy from renewable energyShare of 12% of primary energy from renewable energy
Planning 1998 - 2010Bi d Bi 58 MW i 1998 > 2 300 MW i 2010
Planning 1998 - 2010Bi d Bi 58 MW i 1998 > 2 300 MW i 2010
Share of 30% of electricity from renewable energyShare of 30% of electricity from renewable energy
- Biomass and Biogas: 58 MW in 1998 -> 2.300 MW in 2010- Wind: 837 MW in 1998 -> 20.200 MW in 2010- Solar: photovoltaic 1 MW in 1998 -> 400 MW in 2010
- Biomass and Biogas: 58 MW in 1998 -> 2.300 MW in 2010- Wind: 837 MW in 1998 -> 20.200 MW in 2010- Solar: photovoltaic 1 MW in 1998 -> 400 MW in 2010
CSP 0 MW in 1998 -> 500 MW in 2010- Hydro < 50 MW: 1.190 MW in 1998 -> 2.200 MW en 2010
Urban Waste: 103 en 1998 > 260 MW en 2010
CSP 0 MW in 1998 -> 500 MW in 2010- Hydro < 50 MW: 1.190 MW in 1998 -> 2.200 MW en 2010
Urban Waste: 103 en 1998 > 260 MW en 2010
22
- Urban Waste: 103 en 1998 -> 260 MW en 2010- Cogeneration: 5.000 MW in 1998 -> 8.400 MW in 2012- Urban Waste: 103 en 1998 -> 260 MW en 2010- Cogeneration: 5.000 MW in 1998 -> 8.400 MW in 2012

1. Economic regulation
Methodology CNE cProjection of Capacity forRenewable Energy Sources
Methodology CNE c
Year 2030
Share %
FORESEEN CAPACITY OF RENEWABLES ENERGY SOURCES - 2030
Energy sources Capacity, Mw Share, % Share, % RES / Total Capacity
Share, % RES / Total production
Wind 40.000 48,00 26,5
Solar 15 500 18 60 10 3Solar 15.500 18,60 10,3
Photovoltaic 6.500 7,80 4,3
Thermo - solar 9.000 10,80 6,0
Biomass 4.400 5,28 2,9
Geothermic&Sea waves 800 0,96 0,5
Hydro 22.630 27,16 15,0y , ,
Total RES 83.330 100,00 55,2 40
1. Economic regulation
Methodology CNECriteria:
Methodology CNE
1. To reach the targets set in the indicative planningCostes de Inversión
Parques Eólicos P>5 MW1.500
Coste de Inversión del Aerogenerador P>5MW
1.200
800900
1.0001.1001.2001.3001.400
€/kW
500 600 700 800 900
1.000 1.100
€/kW
Costes de Inversión Cogeneración P<10MW
600700
5.000 15.000 25.000 35.000 45.000 kW Instalados
400 500 700 900 1.100 1.300 1.500 1.700 1.900 2.100
Tamaño del Aerogenerador kW
2.0001.500850 Construction cost (investment ratesCostes Unitarios de Inversión
(J li 08)PV
200
400
600
800
1.000
€/kW
(
€ 2007 / kW)(Julio 08)
2.000
4.000
6.000
8.000
10.000
12.000
€/kW
24
00 2.000 4.000 6.000 8.000 10.000 12.000
kW Instalados
0000 20 40 60 80 100
kW/instalación
Los cuadrados corresponden a instalaciones con seguimiento y los rombos a instalaciones fijas.

1. Economic regulation
Methodology CNECriteria:
Methodology CNE
1. To reach the targets set in the indicative planning
25IEA
1. Economic regulation
Methodology CNE
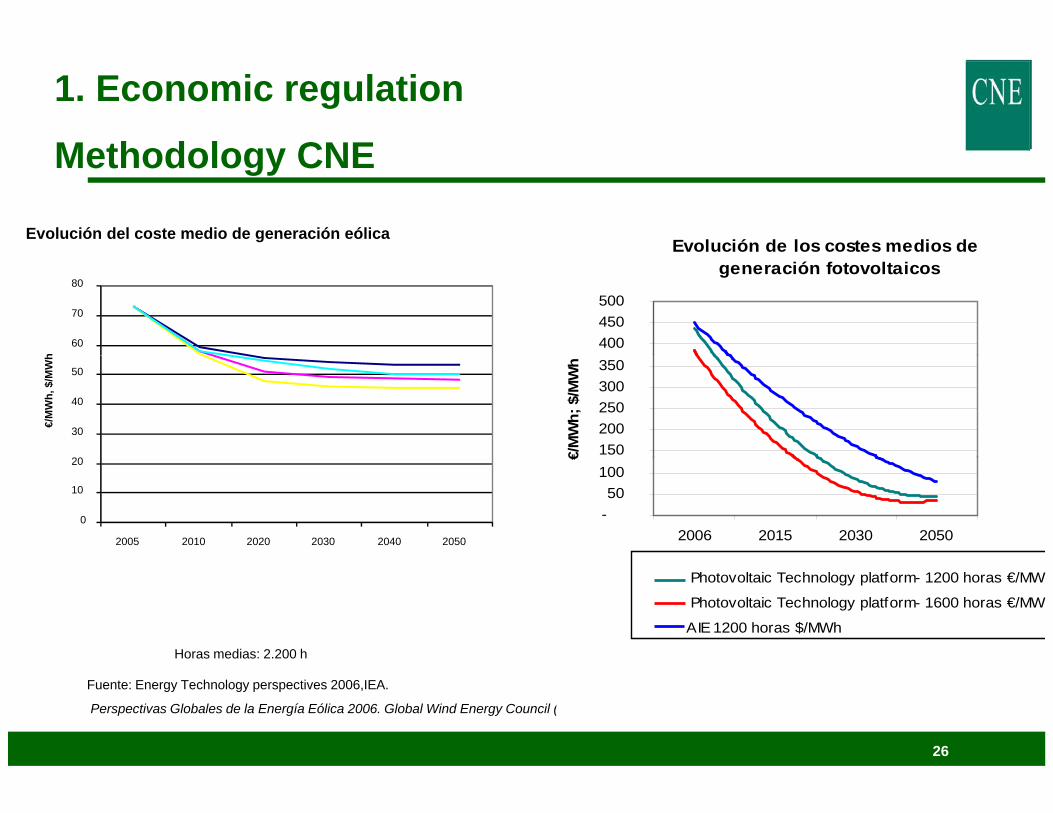
Evolución del coste medio de generación eólicaEvolución de los costes medios de
Methodology CNE
60
70
80
h
generación fotovoltaicos
400 450 500
20
30
40
50
€/M
Wh,
$/M
Wh
150 200 250 300 350
€/M
Wh;
$/M
Wh
0
10
20
2005 2010 2020 2030 2040 2050
- 50
100
2006 2015 2030 2050
€
Horas medias: 2.200 h
Photovoltaic Technology platform- 1200 horas €/MW
Photovoltaic Technology platform- 1600 horas €/MW
AIE 1200 horas $/MWh
Polinómica ( Photovoltaic Technology platform- 1600 h
26
Fuente: Energy Technology perspectives 2006,IEA.
Perspectivas Globales de la Energía Eólica 2006. Global Wind Energy Council (GWEC).
Polinómica ( Photovoltaic Technology platform- 1200 h
Polinómica (AIE 1200 horas $/MWh)

1. Economic regulation
Methodology CNE1. To reach the targets set in the indicative planning
Methodology CNE
14,00
15,00
Comparación precios ventas a Tarifa RD 661/07 vs. RD 436/04
RD 436/2004RD 611/2007
10,00
11,00
12,00
13,00
6,00
7,00
8,00
9,00
c€/k
Wh
2 00
3,00
4,00
5,00
6,00
27
1,00
2,00
Cog. g.nat.(10 MW)
Cog. g.nat.(30 MW)
Cog. fuel(10 MW)
Eólica (30MW)
Minih. (5MW)
Minih. (20MW)
Biom. b6.1(3MW)
Biom.b7.1(3 MW)
Biom.b7.2(3 MW)
Biom.b8.3(3 MW)
RSU (40MW)

1. Economic regulation
Methodology CNE1. To reach the targets set in the indicative planning
Methodology CNE
Concentrating Solar Power
45,00
Solar PV
30,00
Fix tariff incentive 2004 vs Incentive 2007 (cent_euro/kWh)
RD 436/2004RD 611/2007
3000
35,00
40,00
10,00
15,00
20,00
25,00
20,00
25,00
30,00
CSP 2009Tariff: 28,7603 c€/kWh
SO 2009 (1S C )
0,00
5,00
10,00
Solar (Thermal) up to 25years
Solar (Thermal) > 25 years
5,00
10,00
15,00SOLAR PV 2009 (1ST. CALL) Roof P <= 20 KW 34,00 c€/kWh
P > 20 kW 32,00 c€/kWhGround 32,00 c€/kWh
28
0,00Fotov. (100 kW)

1. Economic regulation
Methodology CNECriteria:
Methodology CNE
1. To reach the targets set in the indicative planning
2. Security and predictability of the economic supports-> To y yeliminate the regulatory risk (warranty by law ). Non retroactive -> Less uncertainties to investors (and Banks) and less cost to the consumers
- Economic incentives are assured during the life of the installation (existing capacity)
- Every 4 years or when planning is fulfilled, economic incentives are
29
updated (only for new capacity)

1. Economic regulation
Methodology CNECriteria:
Methodology CNE
1. To reach the targets set in the indicative planning
2. Security and predictability of the economic supportsy y
3. Improve the quality of this kind of energy in order to integrate it into the systemintegrate it into the system
30

1. Economic regulation
Methodology CNESpanish power system is practically an isolated system
Methodology CNE
It is necessary to improve the quality of this kind of energy in order to integrate it into the system
..Forecast obligation, and fulfill it (cost of deviations):
RES + CHP with capacity greater than 15 kVAp y g
Supplement for voltage controlWind energy must withstand faulty situations (to improve dynamic stability)
B l t di t hi tBelong to a dispatching center (if their capacity are greater than 10 MW )
If the plant joins the market, ancillary services could be provided
31
..

1. Economic regulation
Methodology CNE3. Improve the quality of this kind of energy in order to
integrate it to the system
Methodology CNE
g yTSO (Tec. System Operator )Control Center for Special System Energy: -Maximum Special System Energy on the gridp y gy g-Maximum Security System
1. Economic regulation
Methodology CNECriteria:
1 To reach the targets set in the indicative planning
Methodology CNE
1. To reach the targets set in the indicative planning.
2. Security and predictability of the economic supports->
3. Improve the quality of this kind of energy in order to integrate it to the system
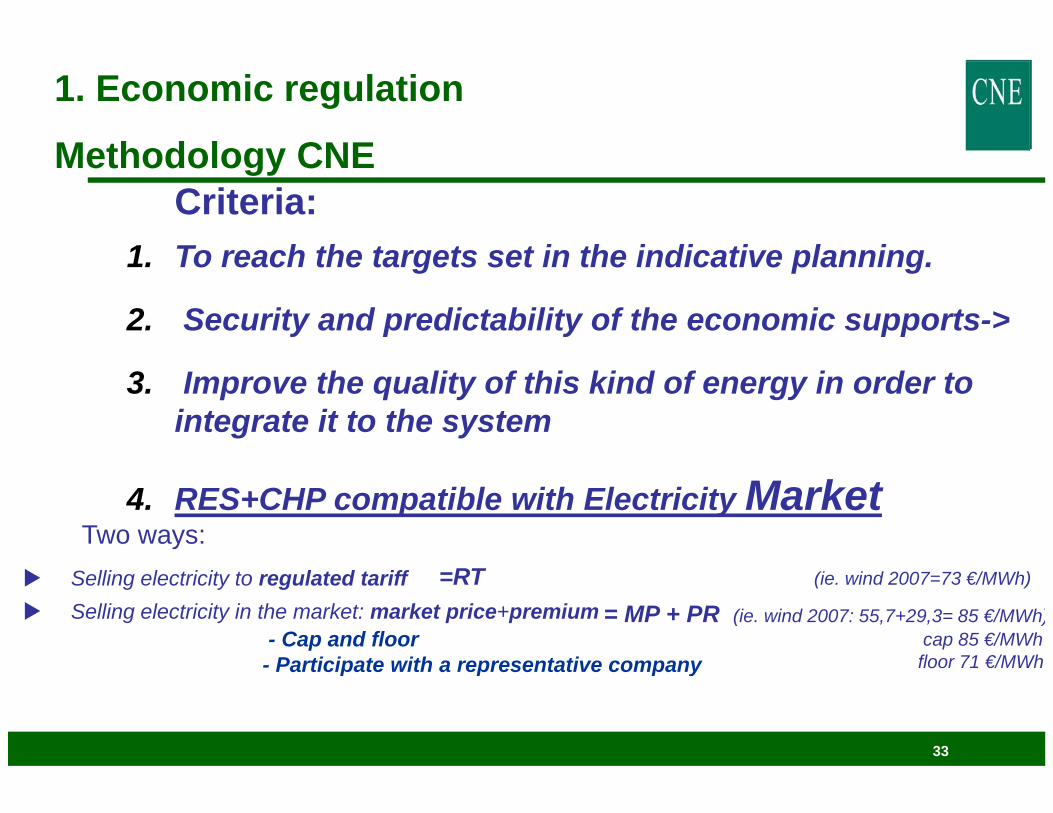
4. RES+CHP compatible with Electricity MarketTwo ways:
Selling electricity to regulated tariffSelling electricity in the market: market price+premium
- Cap and floor Participate with a representative company
=RT (ie. wind 2007=73 €/MWh)
= MP + PR (ie. wind 2007: 55,7+29,3= 85 €/MWh)cap 85 €/MWhfloor 71 €/MWh
33
- Participate with a representative company floor 71 €/MWh

1. Economic regulation
Methodology CNEMethodology CNE
14,0015,00
Comparación precios ventas a mercado RD 661/07 vs. RD 436/04
RD 436/2004RD 611/2007
9,0010,0011,0012,0013,00
Wh
5,006,007,008,009,00
c€/k
W
1,002,003,004,00
Cog. g.nat.(10 MW)
Cog. g.nat.(30 MW)
Cog. fuel (10MW)
Eólica (30MW)
Minih. (5MW)
Minih. (20MW)
Biom. b6.1(3MW)
Biom.b7.1(3 MW)
Biom.b7.2(3 MW)
Biom.b8.3(3 MW)
RSU (40MW)
34
(10 MW) (30 MW) MW) MW) MW) MW) (3MW) (3 MW) (3 MW) (3 MW) MW)
Reference Market Price=55,7 €/MWh

1. Economic regulation
Methodology CNEMethodology CNEMarket incentive 2004 vs Incentive 2007 (cent_euro/kWh)
35,00
RD 436/2004RD 611/2007
25,00
30,00 Concentrate Solar Power
15,00
20,00 SOLAR THERMAL 2009
Premium : 27,1188 c€/kWhCap: 36,7252 c€/kWhFloor : 27,1228 c€/kWh
5,00
10,00
35
0,00Solar (Thermal)

1. Economic regulation
Market participation
6 000
Market participation
5.000
6.000Ventas a tarifa Ventas a Mercado de ofertas
3.000
4.000
Wh
2.000
GW
0
1.000
2002 2003 2004 2005 2006 2007

H th h i k ?
1. Economic regulation: RD 661/2007
How the mechanism works?
The regional Governments have the competence togauthorize the special system plantsThe plants choose an alternative to sell the electricityTh S i h l t th iThe Spanish regulator pays the premiumTotal yearly amount of regulated tariffs and premiumsare included in the access tariffs paid for byare included in the access tariffs paid for byconsumersThe Spanish regulator makes proposals of regulated
ff ftariffs and premiums for new generators every 4 years

1. Economic regulationCost of Special System 2007 and 2008 for the power consumer
AÑO TECNOLOGIA
Potencia Instalada (MW)
Energía Vendida (GWh) Nº Instalaciones Retribución Total
(Miles €)
Precio Medio Retribución
Total (cent€/kWh)
Prima equivalente *
(miles €)
Prima equivalente * (cent€/kWh)
Sobrecoste (%)
COGENERACIÓN 6 059 17 616 872 1 335 326 7 580 596 712 3 387 2 7%COGENERACIÓN 6.059 17.616 872 1.335.326 7,580 596.712 3,387 2,7%SOLAR 693 495 19.988 214.811 43,384 194.051 39,191 0,9%EÓLICA 14.417 27.474 632 2.146.716 7,814 994.760 3,621 4,4%
HIDRÁULICA 1.909 4.120 928 318.940 7,741 146.190 3,548 0,7%BIOMASA 558 2.173 92 192.155 8,843 101.043 4,650 0,5%
RESIDUOS 569 2.722 33 167.806 6,165 53.674 1,972 0,2%TRAT RESIDUOS 527 3 397 43 316 889 9 328 174 453 5 135 0 8%
2007
TRAT.RESIDUOS 527 3.397 43 316.889 9,328 174.453 5,135 0,8%24.732 57.997 22.586 4.692.644 8,091 2.260.882 3,898 10,1%
COGENERACIÓN 6.157 21.090 884 2.070.197 9,816 716.528 3,398 2,4%SOLAR 3.354 2.492 49.971 1.127.994 45,268 968.055 38,850 3,2%EÓLICA 15.578 31.355 694 3.157.146 10,069 1.144.597 3,650 3,8%
HIDRÁULICA 1.961 4.497 941 432.393 9,615 143.755 3,197 0,5%BIOMASA 580 2 466 98 281 613 11 420 123 326 5 001 0 4%
Total 2007
2008BIOMASA 580 2.466 98 281.613 11,420 123.326 5,001 0,4%
RESIDUOS 579 2.734 34 239.450 8,759 63.970 2,340 0,2%TRAT.RESIDUOS 554 3.088 44 342.385 11,089 144.203 4,670 0,5%
28.763 67.720 52.664 7.651.179 11,298 3.304.434 4,880 10,9%Total 2008
En la tecnología Solar se contemplan 11 MW termosolares
38

1. Economic Regulation: New RD 1578/2008, Concerning solar photovoltaic
PV installations after 30th September 2008
Concerning solar photovoltaic
A pre-assign remuneration register
Four calls per year, to allow a maximum capacity of:Roof : 2/3 * 400 MW/añoGround: 1/3 * 400 MW/año + (extra 100 MW in 2009 y 60 MW in 2010)Ground: 1/3 400 MW/año (extra 100 MW in 2009 y 60 MW in 2010)
Flexible mechanism to transfer capacity between roof and ground installations if the call capacity is not reachedinstallations, if the call capacity is not reached
When the call capacity is reached the tariff for the next call is reduced 2,5% (10% / year )
39
(10% / year )

1. Economic Regulation: New RD 1578/2008, Concerning solar photovoltaic
TARIFF for the first call 2009 :
Concerning solar photovoltaic
Type I: roof P <= 20 KW 34 00 cent€/kWhP <= 20 KW 34,00 cent€/kWhP > 20 kW 32,00 cent€/kWh
T II dType II: groundEvery capacity: 32,00 cent€/kWh
Remark: the updated tariff for existing plants is 45,00 cent€/kWh
40

1. Economic Regulation: New RD-Ley 6-2009, A new pre-assigned remuneration register
A i ti i t
A new pre assigned remuneration register
A pre-assign remuneration register
1. Access and connection point to the power network2. Administrative authorization3. Municipal permit for works4. Guarantee deposit's (20 €/kW)4. Guarantee deposit s (20 €/kW)5. Economic resources or financing > 50%6. Agreement about equipment purchasing > 50%7 Access point to the gas net ork if an7. Access point to the gas network, if any 8. Favorable report using water resources, if any9. Additional guarantee deposit's (20 €/kW, except 100 €/kW for CSP)
41
1. Economic regulation: RD 661/2007
SummarySummary
AdvantagesEffectivenessEfficiencyEfficiencyImprove the quality of the RES energyRES+CHP compatible with Electricity MarketRES CHP compatible with Electricity Market
DisadvantagesSome windfall profits in the market in a transitional period (from RD 434/2004 to RD 661/2007)Follow-up of real costs are necessary
42

2 Access regulation: 2. Access regulation: RD 1955/2000 and CNE Proposal 22April
43

2. Access regulation: RD 1955/2000
Try to Eliminate Grid Barriers- Discriminatory access conditions, and non-objective and non-transparent
procedures for grid access
- Insufficient grid capacity available
- Lack of available network capacity
- Lack of transparency on network data
- Low investment levels on expand networksLow investment levels on expand networks
- Long period to obtain authorisation for grid connections
Hi h id ti t
44
- High grid connection costs

2. Access regulation: RD 1955/2000
Resolution of Economy Minister 4th Dec 2000Resolution of Economy Minister 4th Dec 20001. ACCESS (TPA):
Right to transmit energy through the network of another agentg gy g g
There is a relationship with the power market
Controversies are resolved by CNE
2. CONNECTION:
Physical connection
Safety and technical quality
45
Controversies are resolved by Regional Governments

2. Access regulation: RD 1955/2000
Right to the network accessgIt is possible to restrain it only by lack of capacity: to avoid risks inthe safety, regularity and quality of the supplyLimits to access must by solved with the non-existingreserve of capacity principle -> It doesn´t have influence ontemporal preference in the connectiontemporal preference in the connection
Constraints are solved:• Transmission: Belong to a dispatching center and applying grid codes
M d t l i id t t i ( 4 )Mandatory planning avoid permanent constrains (every 4 years)• Distribution: Automatic disconnection equipments and grid codes.
Connection installations and reinforcement of the
46
Connection installations and reinforcement of theexisting grid must be paid for by new plants

2. Access regulation: RD 1955/2000
Access controversial procedure
GENERATORS R tGENERATORS DISTRIBUTORS REGIONS
Report
47

CNE Proposal 22April 2009
2. Access regulation: RD 1955/2000
From 1998 to end 2008 the capacity installed of Special System has increased from 24 200
p p
4.544 MW to 28.763 MW (+24.200 MW)
Energy Planning 2008-2016, included 47.670 MW in 2016 (+ 19.000 MW add)
Economic incentives are the main tool of energy policy to reach planning targetsOther tool is the right of third part access to the network which would be compatible with the security of the power system:y p y
To add a new SO tool: setting area constrains Study of access to the grid of new generator -> to considerate the production of existing generators (to avoid constrains)Mandatory fulfill of the planning develop of the network (transmission and distribution) Publicity of the nodal capacity
Simplified procedure to register small plants
48
Simplified procedure to register small plants
Priority of dispatch for renewables and cogeneration

3. Guarantee of origin: Order ITC 1522/2007
49
3. Guarantee of origin regulation: O ITC 1522/07
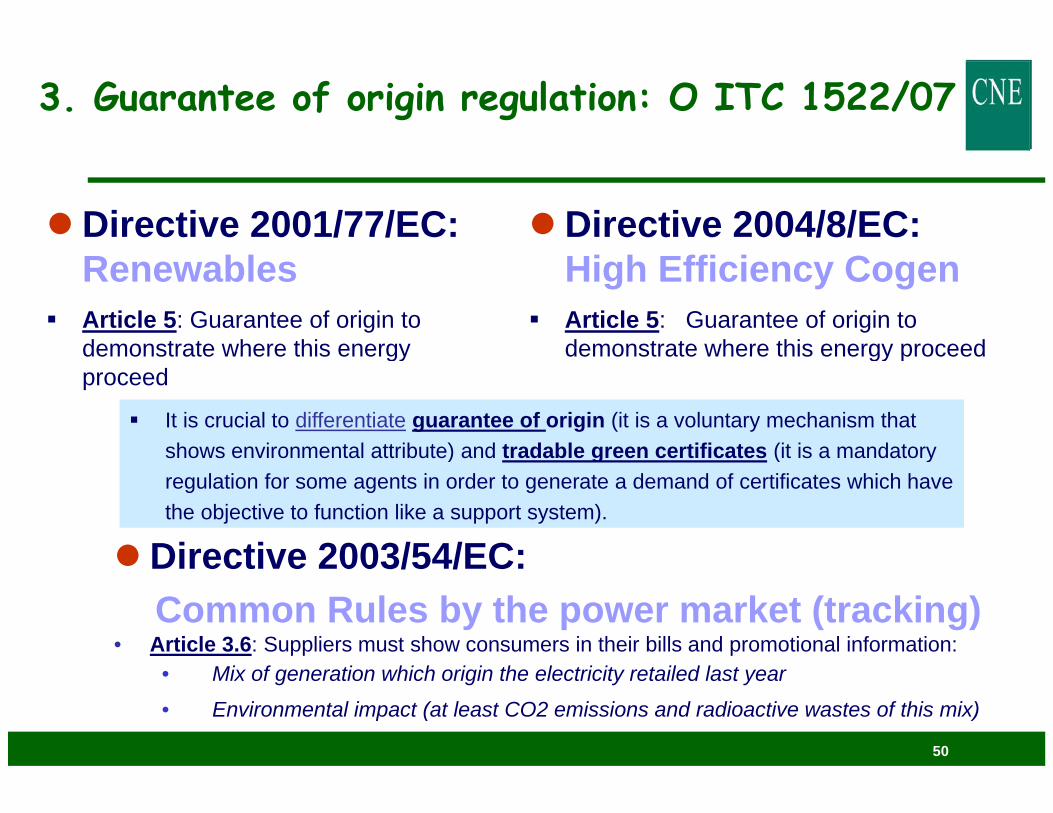
Directive 2001/77/EC: Directive 2004/8/EC: RenewablesArticle 5: Guarantee of origin to demonstrate where this energy
High Efficiency CogenArticle 5: Guarantee of origin to demonstrate where this energy proceeddemonstrate where this energy
proceed demonstrate where this energy proceed
It is crucial to differentiate guarantee of origin (it is a voluntary mechanism that shows environmental attribute) and tradable green certificates (it is a mandatory s o s e o e ta att bute) a d t adab e g ee ce t cates ( t s a a dato yregulation for some agents in order to generate a demand of certificates which have the objective to function like a support system).
Directive 2003/54/EC:Directive 2003/54/EC: Common Rules by the power market (tracking)
• Article 3.6: Suppliers must show consumers in their bills and promotional information:
50
• Mix of generation which origin the electricity retailed last year
• Environmental impact (at least CO2 emissions and radioactive wastes of this mix)

3. Guarantee of origin regulation: O ITC 1522/07Aspects
System Annotations in Count: Web Page CNE
Aspects
GENERATORS SUPPLIERSGoO GoO
CONSUMERS
Sol.CancellationSol. TransferSolicit Expedition
CNE CNECNE
Expedition Transfer Cancellation
51
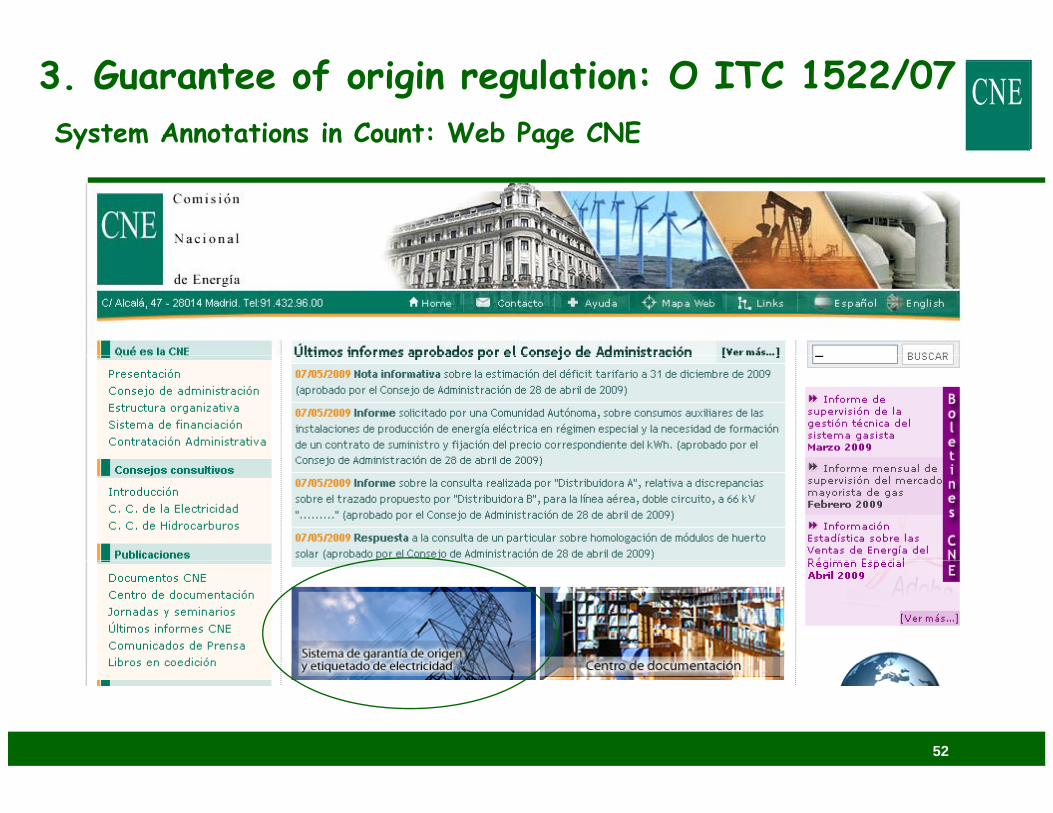
3. Guarantee of origin regulation: O ITC 1522/07System Annotations in Count: Web Page CNE
52
3. Guarantee of origin regulation: O ITC 1522/07System Annotations in Count: Web Page CNE
53

3. Guarantee of origin regulation: O ITC 1522/07System Annotations in Count: Web Page CNE
54

3. Guarantee of origin regulation: O ITC 1522/07System Annotations in Count: Expeditions 2008
Las garantías expedidas mediante el Sistema de Garantías de Origen representan el 16 % de la producción nacional del 2008 y el 53 %respecto de la producción nacional procedente de fuentes de energía renovables y de cogeneraciónrespecto de la producción nacional procedente de fuentes de energía renovables y de cogeneración
Tipo de Energía Régimen Categoría Nº instalaciones Potencia (MW) Producción Declarada (GWh)
Garantías Solicitadas (GWh)
Garantías Expedidas (GWh)
A Exportar(GWh) (1)
Año 2008Resúmen Garantías de Origen Expedidas
( ) ( ) p ( ) ( ) ( )
Renovables Especial Eólicas 358 10.443 22.438 22.438 21.738 0
Renovables Especial Minihidráulica <10MW 99 314 876 876 840 0
Renovables Especial Fotovoltaicas 79 11 14 14 14 0
Renovables Especial Minihidráulica >10MW 19 414 854 854 853 0
Renovables Especial Biomasa 17 74 394 394 376 0p572 11.256 24.576 24.576 23.821 0
Renovables Ordinario Gran Hidráulica 663 15.884 19.425 20.624 18.488 353663 15.884 19.425 20.624 18.488 353
Total renovables 1.235 27.140 44.001 45.200 42.309 353
Cogeneración AE Especial Gas Natural 9 417 2.741 2.190 2.146 0
Cogeneración AE Especial Fueloil BIA 1 3 85 372 315 275 0
Cogeneración AE Especial Otros 3 216 1.243 1.236 1.235 0
15 718 4.356 3.741 3.656 0
Cogeneración AE Ordinario G. Natural / Ciclo Comb. 3 1.198 5.057 4.199 1.372 03 1.198 5.057 4.199 1.372 0
55
Total Cogeneración AE 18 1.916 9.413 7.940 5.028 0
1.253 29.056 53.414 53.140 47.337 353(1) Las Garantías solicitadas para exportar no están descontadas de las garantías expedidas
TOTAL
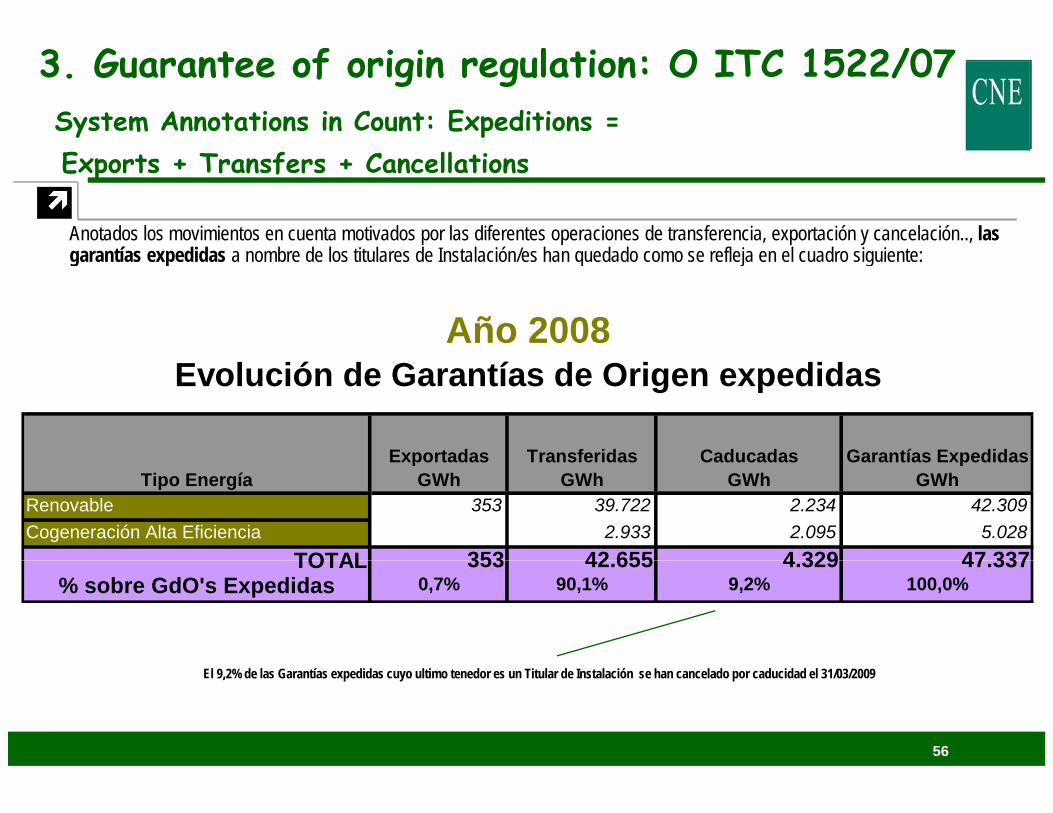
3. Guarantee of origin regulation: O ITC 1522/07System Annotations in Count: Expeditions =
Anotados los movimientos en cuenta motivados por las diferentes operaciones de transferencia, exportación y cancelación.., las garantías expedidas a nombre de los titulares de Instalación/es han quedado como se refleja en el cuadro siguiente:
Exports + Transfers + Cancellations
garantías expedidas a nombre de los titulares de Instalación/es han quedado como se refleja en el cuadro siguiente:
Año 2008Evolución de Garantías de Origen expedidas
Exportadas Transferidas Caducadas Garantías Expedidas
353 39.722 2.234 42.3092.933 2.095 5.028
353 42 655 4 329 47 337
RenovableTipo Energía
Exportadas GWh
TransferidasGWh
Caducadas GWh
TOTALCogeneración Alta Eficiencia
Garantías Expedidas GWh
353 42.655 4.329 47.3370,7% 90,1% 9,2% 100,0%
TOTAL% sobre GdO's Expedidas
56
El 9,2% de las Garantías expedidas cuyo ultimo tenedor es un Titular de Instalación se han cancelado por caducidad el 31/03/2009

3. Guarantee of origin regulation: O ITC 1522/07System Annotations in Count: TRACKING:
MIX PRODUCCIÓN COMERCIALIZADOR
MIX GENERATION AND SUPPLY
Nuclear; 19,3%Renovables; 20,7%
C ió d Alt
Otras; 0,9%
CC Gas Natural;
Carbón; 15,9%
Fuel/Gas; 3,3% Cogeneración de Alta Eficiencia; 1,7%
Cogeneración; 8,1%
30,1%
57

End of presentation
www.cne.eswww.cne.esInformación Estadística sobre las Ventas de Energía del Régimen g g
Especial
58