renewable energy - pollution prevention regional …infohouse.p2ric.org/ref/37/36125.pdf · ·...
TRANSCRIPT

RenewableEnergy
GASIFICATION FOR ELIMINATION OF SWINE WASTE SOLIDS WITH RECOVERY OF VALUE-ADDED PRODUCTS
PRINCIPAL INVESTIGATORS:
Jeanne B. Koger, NCSU, Department of Animal Science Leonard Bull, NCSU, Department of Animal Science GASIFICATION ENGINEER: R. Preston Burnette, NCSU, Department of Animal Science COMMERCIAL COLLABORATORS: Thomas Gnosa, Big Dutchman International, GmbH Brookes Gasification Process, Division of Infectrol, Inc.

“Recycle” Koger, et al. Final Gasification Report April, 2005 Table of Contents Title page i
Table of Contents ii
List of Figures iii
List of Tables iii
Abbreviations used iv
1.0 Introduction 1
1.1 Gasification Chemistry 1
2.0 Gasifier Description 3
3.0 Evaluation Procedures 5
4.0 Gasifier Start-Up and Operation 6
4.1 Gasifier Start-up 6
4.2 Operation 7
5.0 Gasifier Performance Results 9
5.1 Feedstock Properties 9
5.2 Gasifier Efficiency 10
5.2.1 Feedstock throughput, residence time, and burner optimization 11 5.2.2 Gas Composition 12 5.2.3 Potential for Energy Recovery 13 5.2.4 Ash Removal 14
5.3 Ash Properties and Potential Value 15
5.4 Gasifier Emissions 16
5.5 Nutrient Mass Balance 17
5.6 Future Directions 18
6.0 Operation and Maintenance 19
Acknowledgements 20
References 21
i

“Recycle” Koger, et al. Final Gasification Report April, 2005 List of Figures Page Figure 1. Schematic of the BGP gasifier …………………………………….. 3 Figure 2. View of the primary chamber interior……………….……………… 4 Figure 3. Gas composition with reaction time……………………………….. 12 Figure 4. Propane use during feedstock processing………………………… 13 Figure 5. Bioavailability of gasifier ash minerals fed to pigs………………… 15 Figure 6. Emissions of NOx and SO2 during gasification of pig waste…….. 17 Figure 7. Schematic of the BGP continuous feed gasifier………………….. 18 List of Tables Page TABLE 1. Comparison of three thermochemical processes………………. 2 TABLE 2. Energy and ash content of selected gasifier feedstocks…………... 9 TABLE 3. Composition of belt harvested hog waste on a dry matter basis… 9 TABLE 4. Ash fusion temperature for belt harvested swine waste………… ...10 TABLE 5. Gasifier processing efficiency………………………………………… ......... 11 TABLE 6. Theoretical energy recovery under different start-up conditions…. 13 TABLE 7. Dioxin levels as a function of ash processing environment ……… 14 TABLE 8. Mineral content of ash from gasification of various feedstocks…… 14
ii

“Recycle” Koger, et al. Final Gasification Report April, 2005
Abbreviations Used
BGP Brookes Gasification Process gasifier
DM Dry Matter
G/F Grower/Finisher
PC Primary or reaction chamber of the BGP gasifier
PCDD Polychlorodibenzo-dioxins
PCDF Polychlorodibenzo-furans
SC Secondary Chamber or burner chamber of the BGP gasifier
TCDD Tetrachlorodibenzo-dioxin
iii

“Recycle” Koger, et al. Final Gasification Report April, 2005
1.0 INTRODUCTION The hog industry suffers from the negative public perception that it constitutes an environmental threat, a nuisance, and a health hazard. Concern centers on the potential for contamination of water sources, odors, NH3 emissions, pathogens, and release of excessive nutrients and heavy metals to the environment. The Smithfield Agreement was developed to address these concerns through research and development of economically feasible, environmentally superior technologies. The RE-Cycle system, conceived of by Dr. Theo van Kempen, is a system of technologies designed for sustainable waste management with recovery of nutrients and energy from swine manure. The first component, belt-based housing, assured collection of swine waste solids at 50% dry matter, while separated liquids were rapidly removed and sequestered to reduce emissions of ammonia and odor. The solids are suitable for treatment by a variety of methods ranging from composting to digestion technologies. This technology reduces ammonia and methane emissions from the barn while removing the necessity of lagoons and spray fields. However, the waste streams remain to be processed. For solids management, the RE-Cycle system relies on a process known as gasification. Gasification is an oxygen-deprived, thermal decomposition technology that has been used to process materials such as biomass and coal to capture their energy and retain minerals in a sterile ash. The resulting product gas varies in composition according to the gasification technology selected, but generally consists of H2, CO, and CO2 along with minor amounts of other hydrocarbons such as methane, ethane, and ethylene. These gases can be used to sustain the gasification process, avoiding use of external fuel sources, and waste heat can be captured to generate electricity or hot water that can heat buildings or be used in cleaning.
1.1 Gasification Chemistry Gasification is a thermochemical process intermediate between pyrolysis and combustion (TABLE 1). The limited oxygen input, relative to combustion, combined with the elevated temperature, relative to pyrolysis, allow the formation of an energy rich product gas rather than pyrolysis oils or fully oxidized products such as CO2 and H2O.
TABLE 1. Comparison of three thermochemical processes. PYROLYSIS GASIFICATION COMBUSTION
TEMPERATURE RANGE, ºF (ºC)
390 - 1100 (200 - 600)
1100 – 1800 (600 - 1000)
3600 (2000)
O2 SUPPLIED none limited, sub-stoichiometric
ample, > stoichiometric
PRODUCTS oils and tars combustible gases, ash CO2, H2O, ash
1

“Recycle” Koger, et al. Final Gasification Report April, 2005 Various gasifier designs have been developed to handle feedstocks of widely different physical and chemical properties. They differ according to the method of feedstock introduction, the type of bed material, if used, the operating pressure and temperature, the presence or absence of steam inputs, and whether the reaction heat is supplied internally or externally. Regardless of design, however, they all break down, or crack, the feedstock into carbon monoxide and hydrogen gases, as well as other low molecular weight gases. The idealized general equation (Reed and Gaur, 1999) is:
(1) CH1.4O0.6 + 0.35 O2 0.4 CO + 0.6 H2 + 0.4 CO2 + 0.1 H2O + 0.2 C Air blown gasifiers yield a lower energy “producer gas” which is diluted by the 80% N2 of air. By replacing the air with pure oxygen, a higher energy “syngas” is formed since the dilution is avoided. Direct heating involves combustion of a portion of the feedstock and requires that air or oxygen be blown through the reaction chamber. Indirect heating relies on an external combustion reaction whose heat is transferred to the gasification compartment. Heating the reaction chamber indirectly makes an air or oxygen supply to the reaction chamber unnecessary. This reduces the product gas carbon dioxide levels, formed in part by combustion, and yields a pyrolysis gas with a higher energy content than that obtained from directly heated units (Reed and Gaur, 1999). The gasifier design influences the extent to which various competing reactions occur within the gasifier (Ciferno and Marano, 2002). Predominant among these are the following:
(2) C + CO2 2 CO Boudouard reaction i
(3) C + H2O CO + H2 Steam-Carbon reaction
(4) CO + H2O CO2 + H2 Water-Gas shift reaction
(5) CO + 3 H2 CH4 + H2O CO Methanation
Conditions favoring the Boudouard reaction can reduce char formaincrease carbon monoxide output. The steam-carbon reaction and the wshift reaction help explain why a higher energy product gas is generatsteam reforming is coupled to gasification. A thorough discussion of thgasifier designs is beyond the scope of this report (for reviews see: RGaur, 1999, Ciferno and Marano, 2002), but the source and location of nheat inputs, the mechanism of feedstock introduction, and the flexibilisteam and elevated pressure were design issues that drove the selectiogasifier systems. The overall goals were to keep costs low, to maxirecoverable energy, and to obtain value-added by-products from feces.
2
Endotherm
Exothermic
tion and ater-gas
ed when e various eed and ecessary ty to use n of test mize the

“Recycle” Koger, et al. Final Gasification Report April, 2005
2.0 GASIFIER DESCRIPTION The Brookes Gasification Process (BGP) gasifier, a product of Infectrol (Scarborough, Ontario, Canada), was originally developed for disposal of hazardous hospital waste. Thus, in its development, completeness of disposal and absence of polluting emissions drove the design. It has subsequently been used for mortality disposal in cases such as mad cow disease and foot and mouth disease where the distruction of bioactive compounds such as antibiotic residues, prions, viruses, and other microorganisms must be absolutely complete. Application of this technology, in the event of bioterrorism, is an obvious choice for elimination of diseased animals. The simple, “fool-proof” design made it attractive for disposal of animal waste where low cost, ease of operation, disposal of waste, and recovery of a safe nutrient-ash product are the principal considerations. The BGP gasifier is a fixed bed, indirectly heated, batch-fed gasifier suitable for processing a wide range of feedstock materials (Figure 1). The unit has two chambers: a lower burner chamber, referred to as the secondary chamber (SC), and an upper gasification or primary chamber (PC). Hot gases from the burner heat the refractory bricks lining the secondary and primary chambers. Feedstock sits undisturbed on the hearth of the PC where it is indirectly heated to 600 – 1000 ºC (1100 – 1800 ºF) by heat transfer through the refractory bricks. As the
Flue
Burner
Primary Chamber
Feedstock
Secondary Chamber
Figure 1. Schematic of the BGP gasifier (not to scale). Hot gases from the burner aredrafted into the secondary chamber where they are drawn to the front of the machine,around a baffle wall, and to the back of the secondary chamber before exiting throughthe flue stack. Heat transferred to the primary chamber gasifies the feedstock sittingon the hearth. The output gases from the feedstock are drafted into the burner andprovide fuel to sustain the process.
3

“Recycle” Koger, et al. Final Gasification Report April, 2005 feedstock is broken down, or cracked, into low molecular weight gases and volatile hydrocarbons, these products are drawn into the burner chamber through a small opening at the top of the back wall (Figure 2). Energy from the out-gases provides fuel to sustain the process. At startup, the SC is heated using a fuel such as propane or product gas from another unit (commercially, multiple units would be operated on one site). Both temperature and oxygen availability can be controlled during the reaction. This control and the static nature of the system result in a very clean process that meets the emission standards both in Europe and California without requiring gas cleanup. The ash consists almost exclusively of mineral compounds with virtually no carbon char remaining. Since product gas is combusted, the energy potential of the system is limited to capturing waste heat for heat-requiring applications (rendering plants, cement manufacture, etc) or steam generation of electricity. The BGP gasifier used for these studies has overall dimensions of 6 feet in length, 5 feet in width, and 5 feet in height. The gasifier has a mild steel outer shell, which serves as structural support as well as protection from the environment. The next layer is a high-grade ceramic insulation, which can handle temperatures up to 3000 F. The inner layer is the refractory firebrick. The hearth of the primary chamber (PC) is a high temperature ceramic tile floor. The dimensions of the PC are 42 inches deep, 47 inches wide, and 22 inches in height. In the back left top
Figure 2. View of the primary chamber interior. The opening in theback drafts product gases into the secondary chamber and burnerflame.
4
“Recycle” Koger, et al. Final Gasification Report April, 2005 corner of the PC, there is an opening through which the gases are drafted into the SC (Figure 2). The opening is approximately one square foot, but can be reduced in size by the addition of refractory brick. The door to the PC is approximately 4 inches larger in both width and height than the PC. The door is a mild steel shell which is packed with ceramic insulation. There are three air doors (AD), or ports, evenly spaced along the width of the door and located approximately one-third of the way up the door from the bottom, each is 2.5 inches in diameter. These AD’s allow less than stoichiometric air, or the air required to fully oxidize all the carbon, to enter the PC during the “carbon cycle” in order to “bleach” the carbon from the ash. These holes have plates that can be adjusted to allow different rates of air entry. The first burner used was a Midco Incinomite J83-D3 with a firing rate of 100,000 – 800,000 MBH. This burner proved to be too big, so a new smaller burner was installed. It is a Midco Economite EC200 with a firing rate of 70,000 to 200,000 MBH. There was another blower that was located inches from the burner, this blower (secondary air) was for auxiliary air and was always on. It had an adjustable plate on the inlet to control the airflow. The secondary air blower was to provide extra air for the added fuel created by the feedstock during gasification. This blower had a maximum of 100 scfm of air delivery at zero inches of draft. The flue stack was a 14 inches in diameter, and 12 feet in height measured from the top of the gasifier from which is was attached. Located at the base of the stack was a Field Controls M+MG2 14 inch diameter barometric damper. This was used to control the amount of draft in the gasifier. There were several things that could be changed during a run: the burner output, the burner airflow, the secondary air output, the air doors, the amount of draft, the amount of feedstock, and the dry mater of the feedstock. All these parameters were manually adjusted to provide a realistic, efficient, and clean run.
3.0 EVALUATION PROCEDURES Dry matter determinations were by passive drying in a 60°C oven until the weight loss in 24 h was less than 1% of the previous day’s weight. Alternatively, samples were dried in a Heto Power Dry LL3000 freeze dryer to preserve sample energy content. Samples were then processed in a Retsch ZM 100 (Newtown, PA) grinder equipped with a 0.5 mm screen. The energy content of feedstocks and residuals was determined by bomb calorimetry in an IKA Werke C5003 (Wilmington, NC) instrument. Each sub-sample was analyzed twice if the results were within 50 calories per gram of each other. If not, additional sub-samples were analyzed until replicates meeting this criterion were obtained. Sample ash content was determined by ashing in a Thermolyne F-A1730 muffle furnace (Barnstead International, Dubuque, IA). Gas samples from the BGP gasification chamber were analyzed by gas chromatography using thermal conductivity detection (GC-TCD) in a Hewlett Packard 5890 Series II instrument equipped with an Alltech 30 ft X 1/8” Hayesep D 100/120 column. Ash fusion temperature, a
5

“Recycle” Koger, et al. Final Gasification Report April, 2005 predictor of ash behavior in combustion systems, was determined by Hazen Research, Inc. (Golden, CO) using the ASTM-D1857 method. Dioxin levels in ash were evaluated by Xenobiotic Detection Systems, Inc. (Durham, NC) using their dioxin/ furan/ polychlorinated biphenyls specific chemical-activated luciferase expression (DIPS-CALUX®) bioassay. Mineral analysis of feedstocks and ash was by a Vista MPX Inductively Coupled Plasma-Optical Emission Spectroscopy (ICP-OES) manufactured by Varian (Palo Alto, CA). Samples were prepared based on AOAC digestion method 975.03. Briefly, approximately 1 g of sample was weighed into a quartz crucible and ashed over night in a muffle furnace at 500ºC. Then 15 mL of HNO3 was added and evaporated to dryness on a hot block. Samples were returned to the muffle furnace over night at 500ºC. Then 7.5 mL of HCl and 7.5 mL of HNO3 were added and samples were heated to 95ºC for about 2 hours. Samples were then brought up to 50 mL with deionized water and filtered before analysis. Carbon and nitrogen determinations were made on a Thermo Finnigan soil analyzer, Flash EA 112 Series (Thermo Electron Corp., Boston, MA). During trials, operating parameters were monitored at 15-minute intervals. Dwyer pitot tubes, 5/16 inch outer diameter, provided differential pressure information for calculation of flue flow rates. The pitot tube was placed in the center of the duct and pressure information was provided by Dywer gauges, model 2000-00. The equation used to determine flow through the flue was:
VA X AD = F where VA is the air velocity within the flue, AD is the cross-sectional area of the duct, and F is the flow rate expressed in ft3/min. Air velocity is calculated as 1096.2 times the square root of PV/D where PV is the velocity pressure in inches of water and D is the air density in lb/ft3. Air density is calculated as 1.325 times the barometric pressure (inches of mercury) divided by R, the absolute temperature, which is equal to the temperature in ºF plus 460. Type K thermocouples were placed within the primary, secondary, and flue chambers in order to log temperature data at 60 second intervals throughout the gasification process. In addition, the control panel provided constant read-out on temperatures in the primary and secondary chambers. Finally, a Kane-May analyzer (Kane International Limited, Hertfordshire, GB), model number 9106 or 900, was used to monitor NOx, SO2, CO, CO2, O2, and temperature at 15 minute intervals. When possible, hydrocarbons were also measured with the Kane-May 9106 instrument. Propane consumption was recorded from an in-line meter with sensitivity to the 0.1ft3 level.
4.0 GASIFIER START-UP AND OPERATION
4.1 Gasifier Start-up. The BGP gasifier was chosen because of its simple design. Having researched and experimented first hand with an indirectly heated, entrained flow gasifier, the BGP gasifier was far simpler and easier to operate. The start up and operation of
6
“Recycle” Koger, et al. Final Gasification Report April, 2005 the BGP gasifier has very few steps. The first step in preparing a new gasifier is the curing of the firebrick. Once the gasifier is in place, the firebrick has to be cured at progressively higher temperatures starting from 200°C and continuing to 800°C or better. This is done by simply firing the burner and keeping the temperature at a constant temperature of 200°C for 4-6 hours and than ramping up the temperature 100°C and running it at that temperature for another 4-6 hours until the unit has reached 800°C. After it has reached 800°C, or the operating temperature needed, it must be operated at this temperature for 12-24 hours so that the firebrick can thoroughly soak in the heat. Once cured, this step does not have to be repeated even after long periods of inactivity. The BGP gasifier is intended for continuous use and will have better efficiency and longevity with when used in this way rather than when operated intermittently.
4.2 Operation. Depending on the size of the BGP gasifier, the amount of time and fuel it takes to heat the gasifier up will vary. When gasifying belt harvested swine waste, the gasifier was tested under three different start-up conditions: cold, warm, and hot. For the cold start, the gasifier was at ambient temperature and had not been operated within the five preceding days. The warm start was when the gasifier had been operated within two days current experiment, and the hot start applied to trials where feedstock was loaded into the unit immediately following a previous operation and with no time for the unit to cool off. The gasifier is designed to retain heat for 2-3 days since the firebrick and its surrounding ceramic insulation have high heat capacities. Cold starts, and warm starts to a lesser extent, incur a fuel consumption penalty since energy must be used to heat the brick to operating temperatures. The start up and running procedure is as follows for the different conditions: Cold start:
1. Turn the propane valve on 2. Turn the power to the gasifier on 3. Turn the secondary air on and close the secondary air shutter
completely 4. Turn the burner on 5. Close the damper completely 6. Raise the PC door 7. Load the feedstock into the PC and spread evenly 8. Close the PC door and close all air doors 9. Open the damper, so it is free to move 10. Set the timer to the correct time or set the timer on hold if the
gasifier will be used continuously 11. Set the damper so the draft in the PC is between 0.02-0.05
inches of H20. 12. If the gasifier is not automated, such as the gasifier used for
this research, than the air doors will need to be opened once the PC temperature had reached 600C. Open all three doors
7
“Recycle” Koger, et al. Final Gasification Report April, 2005
evenly so that there is small amount of flame on the bed of feedstock. If the flame is more than a few inches in height, than slightly close the air doors until they reach that height.
13. If the unit’s secondary air is not automated, as with the research unit, than the secondary air shutter might need to be opened if the Oxygen level falls below 5%. If an Oxygen meter is not available, than check for smoke from the flue stack. The smoke will indicate a rich condition and the secondary chamber needs more Oxygen to completely oxidize the fuel
Warm start: 1. This condition assumes the gasifier was shut off after the
previous run but has been out of operation for no more than 2 days
2. Follow steps 1-13 in the cold start procedure
Hot start: 1. This assumes that you have either just finished a cold, warm,
or hot start and the unit is still running 2. Close the damper completely 3. Slowly open the PC door until it is fully open 4. Rake the ash into a suitable container, something that can
withstand ash that is at operating temperature of the gasifier 5. Load the gasifier with the new batch of feedstock 6. Close the PC door and close the air doors 7. Open the damper, so it is free to move 8. Repeat step 11-13 from the cold start procedure
Shut down:
1. The ash can remain in the PC, or it can removed for the shutdown
2. Shut off the propane to the burner 3. If the unit needs repair then follow steps 4-7, if the unit will be
used again without repair than skip to step 8 4. Open the shutter to both the secondary air and the burner air 5. Close the damper completely 6. Open the PC door all the way 7. Leave the burner and secondary air fans on until unit has
cooled so the PC chamber brick is cool enough to touch with your hand
8. If you want to remove the ash, than do so now 9. Close the air doors 10. Turn off the power to the secondary fan and burner 11. Adjust the damper so the draft in the PC is 0.1 inches H20
8
“Recycle” Koger, et al. Final Gasification Report April, 2005 For a commercial BGP gasifier, all the parameters could be automated so the operator sets the parameters for each type of run or feedstock and the operator does not have to monitor the process. Since this system is a batch process, an operator will need to be on hand to load and unload the feedstock and ash respectively. However, a BGP continuous feed gasifier has been purchased and it arrived at North Carolina State University’s Waste Processing Facility on 4/04/2005. It is currently being tested and the data from this gasifier will be included in the final report. The new gasifier is continuous feed and is designed to accommodate wetter materials such as sludge.
5.0 GASIFIER PERFORMANCE RESULTS
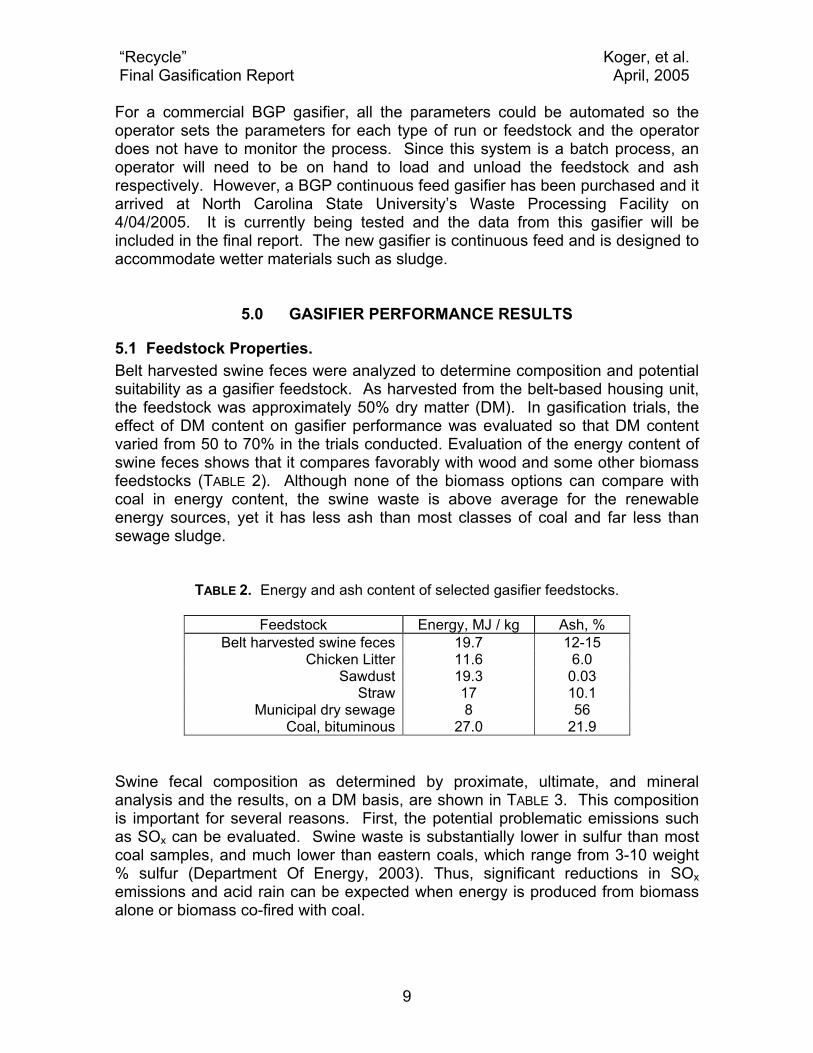
5.1 Feedstock Properties. Belt harvested swine feces were analyzed to determine composition and potential suitability as a gasifier feedstock. As harvested from the belt-based housing unit, the feedstock was approximately 50% dry matter (DM). In gasification trials, the effect of DM content on gasifier performance was evaluated so that DM content varied from 50 to 70% in the trials conducted. Evaluation of the energy content of swine feces shows that it compares favorably with wood and some other biomass feedstocks (TABLE 2). Although none of the biomass options can compare with coal in energy content, the swine waste is above average for the renewable energy sources, yet it has less ash than most classes of coal and far less than sewage sludge.
TABLE 2. Energy and ash content of selected gasifier feedstocks.
Feedstock Energy, MJ / kg Ash, % Belt harvested swine feces 19.7 12-15
Chicken Litter 11.6 6.0 Sawdust 19.3 0.03
Straw 17 10.1 Municipal dry sewage 8 56
Coal, bituminous 27.0 21.9 Swine fecal composition as determined by proximate, ultimate, and mineral analysis and the results, on a DM basis, are shown in TABLE 3. This composition is important for several reasons. First, the potential problematic emissions such as SOx can be evaluated. Swine waste is substantially lower in sulfur than most coal samples, and much lower than eastern coals, which range from 3-10 weight % sulfur (Department Of Energy, 2003). Thus, significant reductions in SOx emissions and acid rain can be expected when energy is produced from biomass alone or biomass co-fired with coal.
9

“Recycle” Koger, et al. Final Gasification Report April, 2005
TABLE 3. Composition of belt harvested hog waste on a dry matter basis.
PROXIMATE ULTIMATE MINERAL Fixed C, % 13.0 C, % 43.4 P, % 1.88
Volatile Matter, % 74.8 H, % 6.9 K, % 1.88 Ash, % 12.2 O, % 31.2 Ca, % 1.82
HHV, MJ/kg 19.7 N, % 3.9 Mg, % 0.75 S, % 0.38 Zn, % 0.20 Cl-, % 0.4 Cu, % 0.01
Some other potential problems with gasification, including slag formation, ash vitrification, and dioxin production, are also influenced by feedstock composition. The temperature at which ash vitrifies, or forms a glass like material on cooling, is a function of the alkaline mineral content and particularly of the potassium concentration (Bakker and Jenkins, 1996). Although the potassium levels in swine waste appear not to be problematic the ash fusion temperature was determined in order to clarify the temperature boundaries for processing this material (TABLE 4). The shape of the ash cone only begins to change, or deform, at >1100°C, even under oxidizing conditions, and does not become fluid until the temperature exceeds 1200°C. Thus, operation at temperatures up to 1100°C should pose no problem under the reducing conditions that exist during gasification. Such elevated temperatures are advantageous for mitigating tar and dioxin formation. Dioxins are formed at 250 - 600°C (Brown, 2001), so gasifying at more elevated temperatures, 800 - 1100°C for example, is not only possible but may also be advantageous. Finally, the mineral composition of feces suggests that ash resulting from gasification of this material could be a good mineral supplement for animal diets if recoveries are sufficient, the minerals are bioavailable, and there are no harmful bioactive contaminants formed within it.
TABLE 4. Ash fusion temperature for belt harvested swine waste.
Oxidizing Reducing Description °C °F °C °F
Initial deformation 1110 2030 1204 2199 Softening 1130 2066 1219 2226
Hemispherical 1167 2123 1248 2279 Fluid 1218 2225 1304 2380
5.2 Gasifier Efficiency. Trials were run at a range of set temperatures from 700°C to 950°C. The optimal set temperature is 800°C. This is the lowest temperature that permits energy efficiency and avoids dioxinformation. The residence time for the ash was varied to determine the optimal residence time according to dioxin levels, carbon removal, and efficiency. An exact residence time has not been determined due to
10

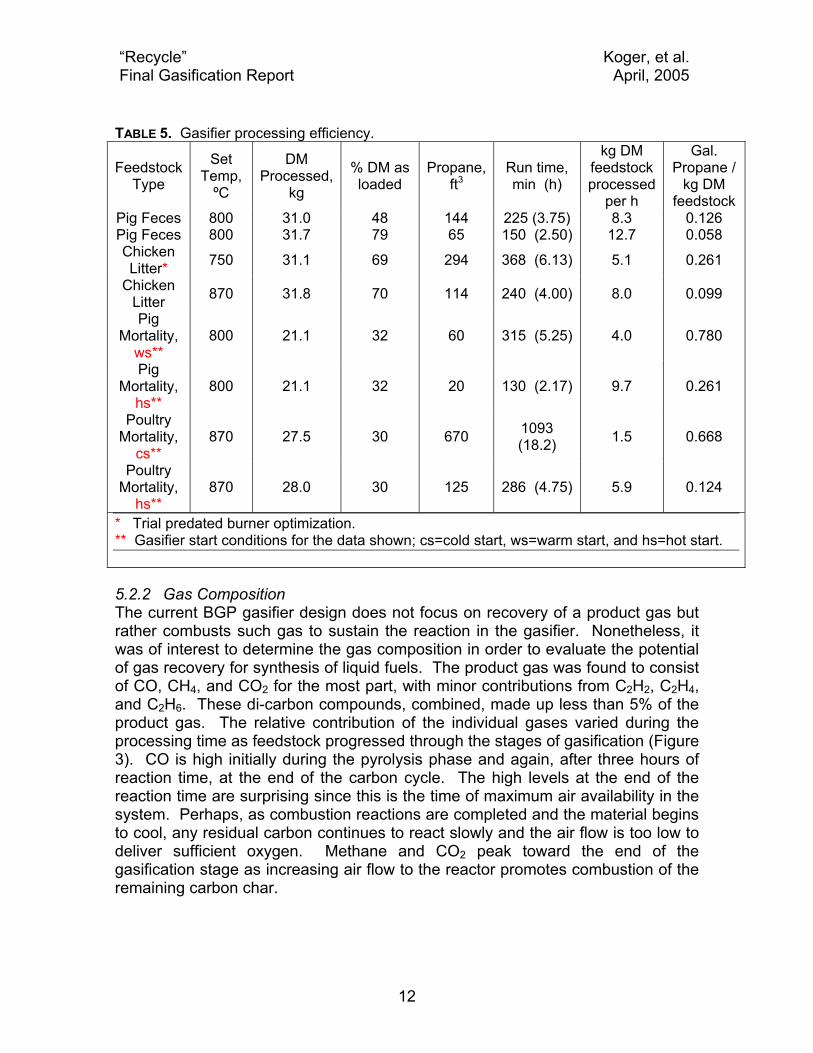
“Recycle” Koger, et al. Final Gasification Report April, 2005 changing conditions during the runs. The ash has to be heated enough to destory any dioxins, and the ash needs time to process, but both at the penalty of effeciency. More trials are needed to determine the correct amount of residence time, but this time changes with differing feedstock conditions, such as feedstock type, feedstock DM, and the load of feedstock. Since the BGP gasifier is designed to consume its product gases, the only availble energy output is heat from the flue stack. We do not currently have the ability to use this energy, but this heat could be used for steam generation, hot water, heating animal barns, or any other process that needs a high heat source. In order to determine economic viability, these factors received extensive attention: 1) feedstock through-put, processing time, and burner optimization, 2), capture of “waste” heat for production of hot water, steam, or power generation, and 3) removal of hot ash with rapid reloading of the PC to minimize heat loss. 5.2.1. Feedstock throughput, residence time, and burner optimization Initial trials were confounded by an oversized burner and the inability to limit gas flow rate to the desired level. As a result, gasifier efficiency has been dramatically improved over the course of these studies by the resolution of such problems. By improving burner size, propane flow rate, and feedstock properties, the trial duration and external energy input could be greatly improved (Table 5). A comparison of two experiments with pig feces demonstrates the energy penalty for processing the lower DM feedstock. Although similar amounts of DM were processed in each trial, there was a 50% increase in throughput and a 50% decrease in propane consumption with the higher DM material. Burner sizing effects can be seen in the comparison of two chicken litter trials. The oversized burner consumes 2.5 times as much propane per processed load as does the properly sized one. The pig mortality studies demonstrate the energy cost of a warm start (gasifier idle for <2 days) versus a hot start (trial 2 or greater in a series of consecutive trials). The hot start requires only 33% of the propane needed for the warm start. The start condition impact is further emphasized when a hot start is compared to a cold start (gasifier idle for ≥5 days) as in the comparison with poultry mortality trials. With the hot start, propane consumption is only 20% of that with the cold start.
11
“Recycle” Koger, et al. Final Gasification Report April, 2005
5.2.2 Gas Composition
TABLE 5. Gasifier processing efficiency.
Feedstock Type
Set Temp,
ºC
DM Processed,
kg
% DM as loaded
Propane, ft3
Run time, min (h)
kg DM feedstock processed
per h
Gal. Propane /
kg DM feedstock
Pig Feces 800 31.0 48 144 225 (3.75) 8.3 0.126 Pig Feces 800 31.7 79 65 150 (2.50) 12.7 0.058 Chicken Litter* 750 31.1 69 294 368 (6.13) 5.1 0.261
Chicken Litter 870 31.8 70 114 240 (4.00) 8.0 0.099
Pig Mortality,
ws** 800 21.1 32 60 315 (5.25) 4.0 0.780
Pig Mortality,
hs** 800 21.1 32 20 130 (2.17) 9.7 0.261
Poultry Mortality,
cs** 870 27.5 30 670 1093
(18.2) 1.5 0.668
Poultry Mortality,
hs** 870 28.0 30 125 286 (4.75) 5.9 0.124
* Trial predated burner optimization. ** Gasifier start conditions for the data shown; cs=cold start, ws=warm start, and hs=hot start.
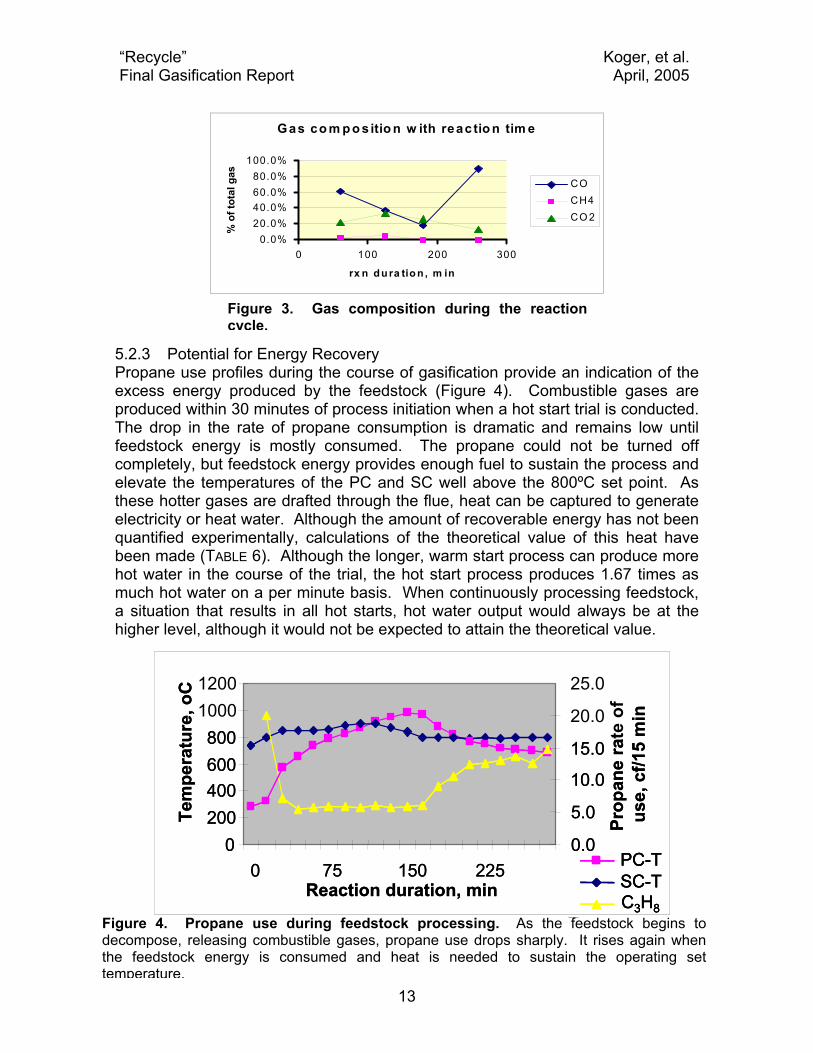
The current BGP gasifier design does not focus on recovery of a product gas but rather combusts such gas to sustain the reaction in the gasifier. Nonetheless, it was of interest to determine the gas composition in order to evaluate the potential of gas recovery for synthesis of liquid fuels. The product gas was found to consist of CO, CH4, and CO2 for the most part, with minor contributions from C2H2, C2H4, and C2H6. These di-carbon compounds, combined, made up less than 5% of the product gas. The relative contribution of the individual gases varied during the processing time as feedstock progressed through the stages of gasification (Figure 3). CO is high initially during the pyrolysis phase and again, after three hours of reaction time, at the end of the carbon cycle. The high levels at the end of the reaction time are surprising since this is the time of maximum air availability in the system. Perhaps, as combustion reactions are completed and the material begins to cool, any residual carbon continues to react slowly and the air flow is too low to deliver sufficient oxygen. Methane and CO2 peak toward the end of the gasification stage as increasing air flow to the reactor promotes combustion of the remaining carbon char.
12
“Recycle” Koger, et al. Final Gasification Report April, 2005
Gas co m p o sitio n w ith reac tio n tim e
0.0%20.0%40.0%60.0%80.0%
100.0%
0 100 200 300
rx n du ra tio n , m in
% o
f tot
al g
as
COCH4CO 2
Figure 3. Gas composition during the reactioncycle.
5.2.3 Potential for Energy Recovery Propane use profiles during the course of gasification provide an indication of the excess energy produced by the feedstock (Figure 4). Combustible gases are produced within 30 minutes of process initiation when a hot start trial is conducted. The drop in the rate of propane consumption is dramatic and remains low until feedstock energy is mostly consumed. The propane could not be turned off completely, but feedstock energy provides enough fuel to sustain the process and elevate the temperatures of the PC and SC well above the 800ºC set point. As these hotter gases are drafted through the flue, heat can be captured to generate electricity or heat water. Although the amount of recoverable energy has not been quantified experimentally, calculations of the theoretical value of this heat have been made (TABLE 6). Although the longer, warm start process can produce more hot water in the course of the trial, the hot start process produces 1.67 times as much hot water on a per minute basis. When continuously processing feedstock, a situation that results in all hot starts, hot water output would always be at the higher level, although it would not be expected to attain the theoretical value.
10001200
20.0
25.0
te o
f 10001200
20.0
25.0
te o
f
0200400600800
0 75 150 225Reaction duration, min
Tem
pera
ture
, oC
0.0
5.0
10.0
15.0
Prop
ane
raus
e,cf
/15
min
PC-TSC-TC3H8
0200400600800
0 75 150 225Reaction duration, min
Tem
pera
ture
, oC
0.0
5.0
10.0
15.0
Prop
ane
raus
e,cf
/15
min
PC-TSC-TC3H8
PC-TSC-TC3H8
Figure 4. Propane use during feedstock processing. As the feedstock begins to decompose, releasing combustible gases, propane use drops sharply. It rises again whenthe feedstock energy is consumed and heat is needed to sustain the operating settemperature.
13
“Recycle” Koger, et al. Final Gasification Report April, 2005
TABLE 6. Theoretical energy recovery under different start-up conditions.
Trial date: July 14, 2004 Exp. 1, warm start Exp. 2, hot start Run duration, h 6.5 2.5 Feedstock DM, kg 33 30 Feedstock DM, % 50 75 Propane, gal. 4.2 1.8 Total Energy Input, MM Btu 8.7 5.2 Flue temperature, oF (ºC) 418 (214) 440 (227) Avail. Energy Output, MM Btu 2.8 1.7 *Hot Water (212 oF) output, gal 2230 1351 *Hot Water (212 oF) output, gal/min 5.7 9.0
5.2.4 Ash Removal In the gasification process, the feedstock passes through several stages: drying, gasification, and char reduction, or “carbon cycle”. By removing the ash to a bin attached to the front of the gasifier, it was hoped that the ash would both insulate the heated chambers and provide additional heat to the next feedstock load as the carbon cycle reached completion. Reloading the unit at the peak of its temperature profile, would promote rapid processing of the incoming feedstock and avoid heat losses occurring late in the batch cycle. Attempts to utilize this strategy were unsuccessful. The sequestered ash had too little contact with air to sustain combustion so that the ash cooled to temperatures appropriate for dioxin formation (200-600ºC). Dioxin concentrations are reported in Toxic Equivalents (TEQ) using 2,3,7,8-tetrachlorodibenzo-p-dioxin (TCDD) as the reference. This analysis detects the polychlorodibenzo-dioxins (PCDD) and polychlorodibenzo-furans (PCDF) then reports them in parts per trillion (ppt) relative to TCDD toxicity. When tested, the ash box ash was found to have 94.5 TEQ of dioxins, but when the ash was fully processed in the PC and collected immediately after the experiment, no dioxins could be detected (TABLE 7).
TABLE 7. Dioxin levels as a function of ash processing environment.
Sample TEQ-ppt Ash recovered from the ash box 94.5
Ash recovered immediately after trial termination ND (<0.71)
ND=non-detect (assay sensitivity level)
14
“Recycle” Koger, et al. Final Gasification Report April, 2005 5.3 Ash Properties and Potential Value The mineral composition of the gasifier ash was evaluated to assess its potential for commercial applications (Table 8). P, K and Ca are in ample supply, although the Cu and Zn levels may be problematic. Use as a feed additive or crop fertilizer is appealing since such applications keep these nutrients within the production cycle. If used as a feed mineral supplement, incorporation rates may eliminate concerns about the heavy metals while yet meeting the nutritional demands of the animal. Ash appears to be safe as a feed additive. Studies in Great Britain, where the BGP gasifier is being used to dispose of BSE infected cattle herds, have shown that BGP gasifier eliminates all proteins and amino acids. Since prions are
abnormally folded proteins, they have also been eliminated (David Brookes, personal communication). Pathogens are also completely eliminated since the gasifier temperatures of 800ºC or better completely break down complex organic molecules to low molecular weight gases such as CO, H2, and CO2. To fully verify safety, ash feeding trials are currently underway to determine the health status of pigs fed ash-supplemented diets throughout the G/F period. Tissue samples will be examined to check for disease or abnormal lesions that may be attributable to the ash diet. However, public perceptions about feeding even fully processed animal waste to meat production animals may well preclude this application. Fertilizer applications remain and are now feasible since the mass containing the waste nutrients has been reduced so that shipping is cost-effective. Now, for every kg of belt-harvested swine feces (50% DM), there is only 75 g of mineral ash; for lagoon contents (2% DM) this mass reduction is even greater: 1 kg of lagoon material yields 3 g of gasifier ash. As it is 100% DM, there is no water-hauling penalty. The theoretical agricultural liming equivalent of this material (ALE) is calculated to be 1.36, that is, it would take 1.36 tons of ash to have the same liming value as 1 ton of agricultural lime.
Type Source P K Ca Mg Zn Cu
Hog waste Ash, gasifier, BGP 13.07 10.25 13.41 9.80 0.31 0.16
Chicken litter Ash, gasifier, BGP 4.98 2.83 25.54 1.20 0.09 0.02G/F Swine mortalities
Ash, incinerator, Prestage 17.45 5.49 27.40 1.22 0.16 0.04
Turkey litter Ash, gasifier, EPI 6.15 3.38 9.76 1.98 0.06 0.14
% Nutrient content, corrected to 100% mineral ash
TABLE 8. Mineral content of ash from gasification of various feedstocks.
15

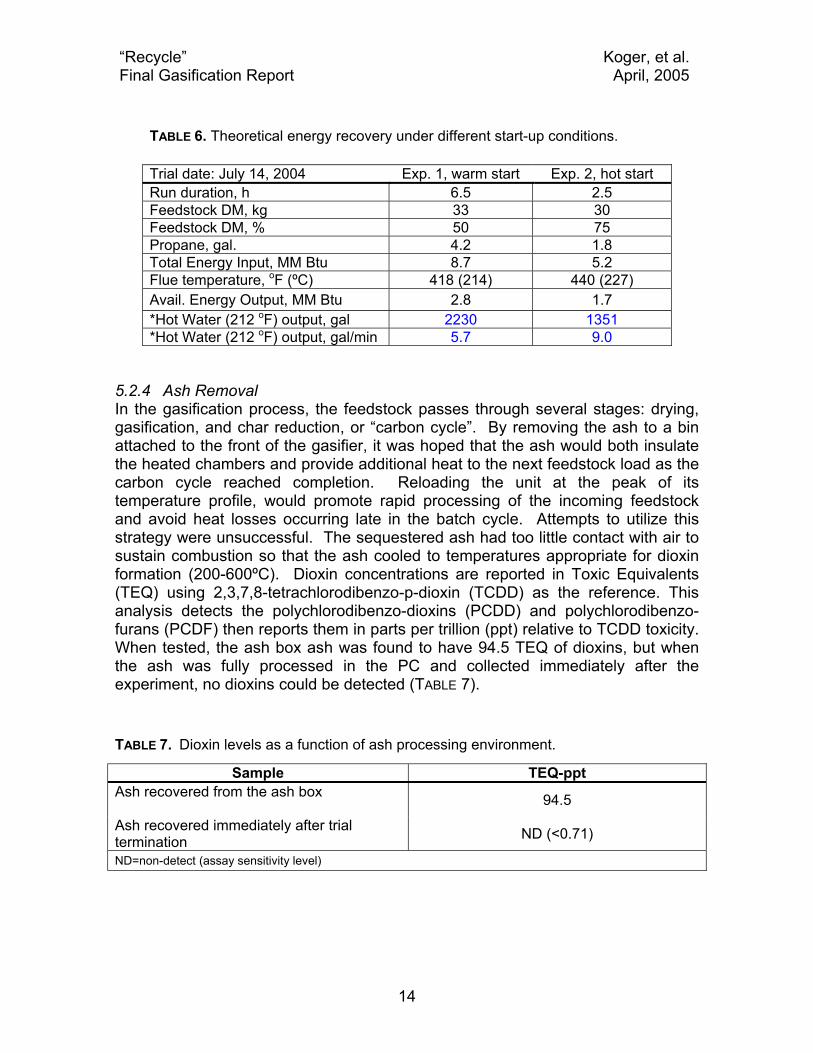
“Recycle” Koger, et al. Final Gasification Report April, 2005 Preliminary ash feeding trials have already been completed to determine bioavailability of the mineral nutrients prior to the G/F. Initially, the solubility of minerals in HCl at pH 2.0, to mimic stomach conditions, was determined (Figure 5). In vitro solubilities for ash P, K, Ca, and Mg were 80-95%. The in vivo results indicated lower bioavailability than suggested by the in vitro study. This may be due to the extent of acid exposure time in the in vitro studies. Ash and acid were combined in an aqueous solution, but equilibration to pH 2, without pH drift,
required 2 days of monitoring. In vivo, exposure to stomach conditions and absorption trhough the intestinal wall occur in no more that half that amount of time. At >90%, K was the most digestible of the minerals studied and compared well with commercial mineral sources. P and Ca were 65% and 55% available, respectively, reductions of 10% and 15% compared to commercial sources. Mg was only 40% digestible but comparison to a Mg standard was not possible. Magnesium acetate, used in the control diet, was not digestible by pigs.
0
10
20
30
40
50
60
70
80
90
100
P K Ca Mg
Dig
estib
ility
,%
Control Test In vitro
Figure 5. Bioavailability of gasifier ash minerals fed to pigs.
5.4 Gasifier Emissions. Levels of NOx, and SOx were monitored in the SC and the flue stack to determine the extent of these emissions to the environment. Flue stack gases are most relevant to environmental impact, but vary with damper opening. NOx levels in the flue ranged from 2 to 20 ppm. Generally, SC levels were 8-10 times greater than flue levels. This is due to the effect of damper air diluting the flue gases. Normally, emissions are standardized to a 7% oxygen concentration as was the case with the OPEN team evaluation conducted by a third party (URS). This is to
16
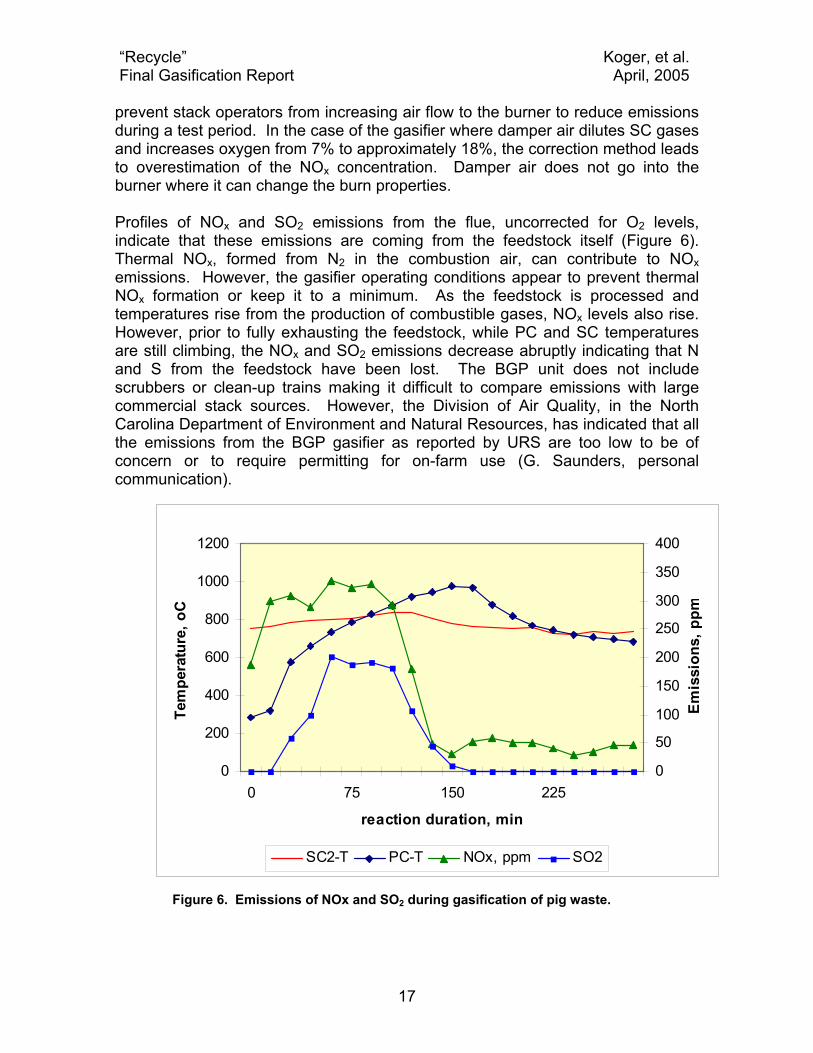
“Recycle” Koger, et al. Final Gasification Report April, 2005 prevent stack operators from increasing air flow to the burner to reduce emissions during a test period. In the case of the gasifier where damper air dilutes SC gases and increases oxygen from 7% to approximately 18%, the correction method leads to overestimation of the NOx concentration. Damper air does not go into the burner where it can change the burn properties. Profiles of NOx and SO2 emissions from the flue, uncorrected for O2 levels, indicate that these emissions are coming from the feedstock itself (Figure 6). Thermal NOx, formed from N2 in the combustion air, can contribute to NOx emissions. However, the gasifier operating conditions appear to prevent thermal NOx formation or keep it to a minimum. As the feedstock is processed and temperatures rise from the production of combustible gases, NOx levels also rise. However, prior to fully exhausting the feedstock, while PC and SC temperatures are still climbing, the NOx and SO2 emissions decrease abruptly indicating that N and S from the feedstock have been lost. The BGP unit does not include scrubbers or clean-up trains making it difficult to compare emissions with large commercial stack sources. However, the Division of Air Quality, in the North Carolina Department of Environment and Natural Resources, has indicated that all the emissions from the BGP gasifier as reported by URS are too low to be of concern or to require permitting for on-farm use (G. Saunders, personal communication).
0
200
400
600
800
1000
1200
0 75 150 225
reaction duration, min
Tem
pera
ture
, oC
0
50
100
150
200
250
300
350
400
Emis
sion
s, p
pm
SC2-T PC-T NOx, ppm SO2
Figure 6. Emissions of NOx and SO2 during gasification of pig waste.
17

“Recycle” Koger, et al. Final Gasification Report April, 2005 5.5 Nutrient Mass Balance. Nutrient inputs, determined from feed values only, were calculated for pigs housed in the Grinnells belt-based housing system. When outputs to waste, air emissions, and accretion are summed, the majority of nutrient inputs can be accounted for (TABLE 8). Closure for N, P, K, and Ca range from 85-100%. Although Mg closure is only 75%, Cu and Zn values indicate greater than 100% recovery. This may be due to the failure to test animal water as a source of nutrients in the diet. Aging plumbing could have contributed a measurable amount. Zinc contributions may have also come from wear on the tribar flooring used over the belt area. When gasifier ash minerals from processing feces is compared to the amounts in the fecal feedstock itself, nutrient closure is again very satisfactory. With the exception of Cu and Zn, all minerals are within the 80-100% closure range. At this point, however, the Cu and Zn closures are surprisingly low. If fecal contamination did not occur, and the Cu and Zn levels in the recovered feces are elevated due to analytical error in evaluating such low concentration minerals, then the closure may be better than it appears. Further analytical work is needed to clarify this issue including the evaluation of mineral contributions from water and tribar sources.
5.6 Future Directions. The gasification technology is a “second tier” technology in that it is still in the developmental stages and not yet fully commercial. Further studies are important to optimize this process. A second generation BGP gasifier (Figure 7) is on site and results from this continuous feed unit are forth coming. The ability to sustain the gasification process without stopping to load feedstock and unload ash offer the potential of substantial energy savings. Furthermore, the new design separates the various stages of the gasification process in separate levels. Augers carry the feedstock from the hopper, through each level and into a collection bin for transport through the next level. Thus feedstock from the hopper (#1 in the schematic) first enters the drying chamber (#3), heated with radiant waste heat from the next lower chamber, to optimize the DM content and reduce the energy penalty of driving off water. This chamber is maintained below 200ºC to avoid tar formation and loss of volatile, energy-rich gases. The dry feedstock is next augered into the gasification chamber (#5) operating at 600-900ºC. This is where the decomposition of the feedstock to combustible gases occurs. By introducing steam from the drying chamber into this gasification section, steam reforming of the product gases can occur to improve the CO and H2 content of the gas product. Capture of the product gases for catalytic conversion to liquid fuels or other value added chemicals then becomes feasible. Sufficient product gas could still be directed to the burner to sustain the gasification process. From the gasification chamber, the residual ash and char are directed to the carbon cycle chamber where the remaining char is combusted from the ash leaving a gray mineral material. This combustion provides heat for the gasification compartment
18

“Recycle” Koger, et al. Final Gasification Report April, 2005
1
3
6
10
5
4
13
11
2
12
7
9
8
14
15
1
3
6
10
5
4
13
11
2
12
7
9
8
14
15
Figure 7. Schematic of the BGP continuous feed gasifier.
above while deriving the last of the energy from the feedstock. Fully processed ash is then directed to the collection bin for removal. Having exhausted the carbon, the elements necessary for forming dioxins should no longer be available. Heat from the flue gases can also be utilized by wrapping a heat-exchanger around the flue and using the hot water for power generation or heating purposes. Advantages of this design are: 1) better use of waste heat throughout the system, 2) potential of forming a higher value product gas suitable for catalytic conversion to liquid fuels or the chemical building blocks of plastics (replacing fossil sources), and 3) waste heat recovery from the flue. These should improve the overall economics of the gasification technology as a waste treatment methodology.
6.0 OPERATION AND MAINTENANCE Operation and maintenance of the BGP gasifier depends on the size of the unit in question. The BGP-MP gasifier used in this research can handle the feces from a swine farm with approximately 1200 G/F pigs assuming that the waste was harvested at (belt based housing) or processed to 50% DM. Capacity for other feedstocks varies according to properties of the feedstock such as percent ash and percent DM. Thus, approximately 400 lbs of chicken mortalities or 160 lbs of pig mortalities can be accommodated per load. BGP units can also be grouped
19

“Recycle” Koger, et al. Final Gasification Report April, 2005 together or scaled up to meet the demands of the application. There are currently units in Scotland that can handle 6-7 tons of bovine carcasses per day. The amount of man-hours spent in operation and maintenance of the BGP gasifier depends on the level of automation built into the machine. For research purposes, full manual control was desired in order to have maximum flexibility in operating conditions. However, the burner, secondary air, air doors, damper, and temperature control can all be automated without much added expense. The addition of an automated loading/unloading system for a batch-fed unit would increase the price substantially, but it would reduce the operator time to nearly zero. As demonstrated with current gasifier, the manual operation of the unit requires few man-hours when feedstock loads are consistent in amount, DM% (within 15%), and type. Under these assumptions and with the unit operating 24 h/d, the man-hours for a 24 hour period, including loading and unloading, would be a total of <4 hours. The machine would need maintenance about twice a year if it were operated within normal operating parameters. Simple spot inspections of the firebrick and the PC door’s insulation would be needed on a weekly basis. This could be done without turning off the unit. The firebrick is very brittle once it has been cured so that when loading and unloading the feedstock and ash care must be used not to damage these components. If undisturbed the firebrick can last 10 years. The firebrick and the hearth can be patched if either is damaged. The PC door’s insulation will see the most abuse from opening and closing of the door, and therefore will require the replacement of part or all of the insulation once a year. The machine will have to be cooled down to ambient temperatures before the insulation or firebrick can be replaced or patched. The burners will need to be inspected 2-3 times a year for wear of the ignition electrodes and the flame sensor. This can be done with the unit still hot, but the power and propane must be turned off. Both electrodes can be replaced within 1-2 hours if they have failed. No other maintenance issues have arisen beyond the burner electrodes, the occasional cracks in the firebrick, or the partial replacement of the PC door insulation. ACKNOWLEDGEMENTS Principal funding for this work was from the Smithfield Agreement as administered by Dr. Mike Williams. Some portions of the work were also supported by the Animal and Poultry Waste Management Center, under the direction of Dr. Mike Williams, the State Energy Office in the North Carolina Department of Administration, and the North Carolina Pork Council. Support for this work is ratefully acknowledged.
20

“Recycle” Koger, et al. Final Gasification Report April, 2005 REFERENCES Ciferno, J.P. and J.J. Marano. 2002. Benchmarking Biomass Gasification
Technologies for Fuels, Chemicals, and Hydrogen Production. Prepared for the United Stated Department of Energy, National Energy Technologies Laboratory, Golden, CO. Available at : www.netl.doe.gov/coalpower/gasification/pubs/pdf/ Accessed January 12, 2004.
Bakker, R.R. and B.M. Jenkins. 1996. Feasibility of fuel leaching to reduce ash
fouling in biomass combustion systems. In: Chartier,P., Ferrero, G.L., Henius, U.M., Hultberg, S., Sachau, J., and Wiinblad, M. (Eds.), Biomass for Energy and the Environment. Proceedings of the 9th European Bioenergy Conference. Elsevier, New York, Vol. 2, pp 980-985.
Reed, T.B., and S. Gaur. 1999. A Survey of Biomass Gasification 2000, Gasifier
Projects and Manufacturers Around the World. National Renewable Energy Laboratory and The Biomass Energy Foundation, Inc., Golden, CO.
U.S. Department of Energy. 2003. “Cleaning up Coal: the Clean Coal Technology
Program.” Updated December 5, 2003. Available at: http://www.fe.doe.gov/education/energylessons/coal/ coal_oct2.html Accessed April 8, 2004.
21