renewable energy : it is empowering the youth
TRANSCRIPT
2014 Rajendra Shende Chairman TERRE Policy Centre. Former Director ,UNEP
RENEWABLE ENERGY
POWER TO THE YOUTH
Sahakar Maharshi Shankarrao Mohite-Patil Institute of Technology & Research,
Shankarnagar-‐Akluj, 13 Jan 2015

Where are we headed ?
If we do not change our direction
We are likely to end up Where we are headed
-A Chinese proverb

Atmospheric CO2 concentration from 650,000 years ago to
near present,

Ever Increase in Global warming

Energy demand is rising
Interna(onal Energy Agency’ Energy Technology Perspec(ves 2012 , pg 183, figure 5.6 © OECD/IEA 2012

RENEWABLE ENERGY IN THE WORLD
Renewable energy provided an es(mated 19% of global final energy consumpGon. The share of modern renewable energy increased to 10%. The share of tradiGonal biomass was of 9%.
Es(mated Renewable Energy Share of Global Final Energy Consump(on, 2012

Renewable energy comprise 26.4% of global power generaGon capacity 22.1% of global electricity was produced from renewable energy Renewables accounted for 56% of new installed power capacity in 2013. Total RE power capacity: 1,560 GW EU holds 42 % of global power capacity of non-‐hydro renewables.
POWER SECTOR
Es(mated Renewable Energy Share of Global Electricity Produc(on, End-‐2013
Based on renewable genera(ng capacity in opera(on end-‐2013

TRANSPORT
Liquid biofuels met about 2.3% of total transport fuel demand. Growing interested in gaseous biofuels and hybrid op(ons (e.g. biodiesel-‐natural gas buses, or electric-‐diesel transport) Limited, but increasing ini(a(ves to link electric transport systems with RE, par(cular at city/regional level

Global new investment es(mated USD 214.4 billion in 2013, down 14% from 2012. incl. hydropower > 50MW, it reached USD 249.4 billion. Reasons for the decline: policy uncertainty, retroac(ve support reduc(ons, sharp reduc(ons in technology costs Net investment in new renewables power capacity outpaced fossil fuels for the fourth year running.
GLOBAL INVESTMENT IN RENEWABLE ENERGY
Global New Investment in Renewable Power and Fuels, Developed and Developing Countries, 2004–2013
Data source: UNEP FS/ BNEF Global Trends in Renewable Energy Investment 2014 Does not include investment in hydropower >50MW
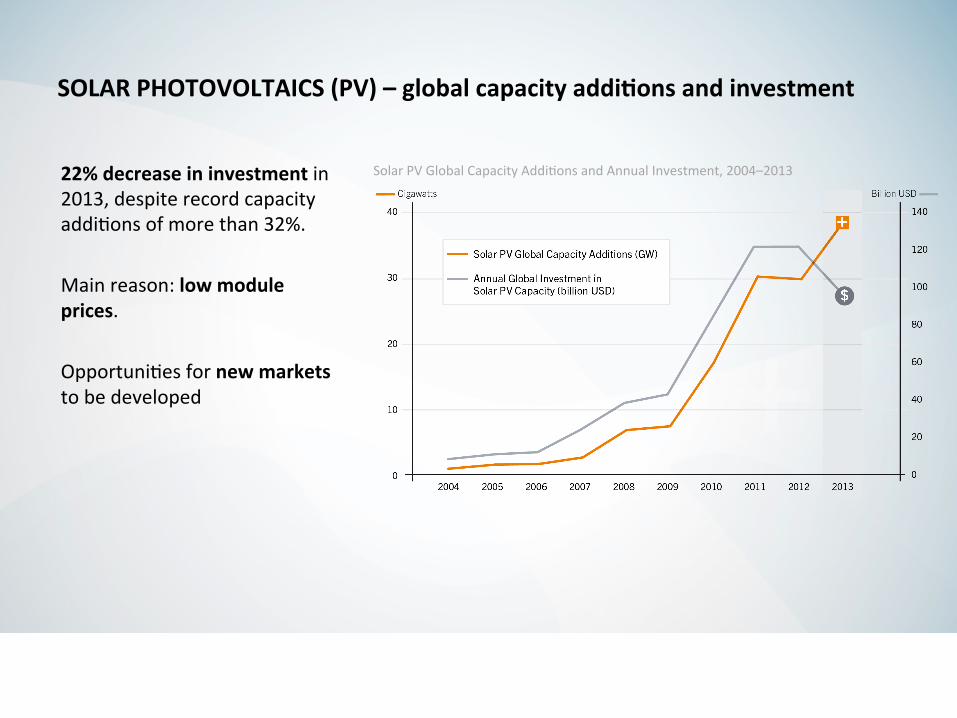
22% decrease in investment in 2013, despite record capacity addi(ons of more than 32%. Main reason: low module prices. Opportuni(es for new markets to be developed
SOLAR PHOTOVOLTAICS (PV) – global capacity addiGons and investment
Solar PV Global Capacity Addi(ons and Annual Investment, 2004–2013

Solar PV had a record year in 2013: § About +39 GW added § Total capacity: 139 GW For the first (me, more PV capacity was added than wind capacity, accoun(ng for about one-‐third of renewable power capacity added during the year. China accounted for a third of global capacity addi(ons, followed by Japan & the U.S.
SOLAR PHOTOVOLTAICS (PV)
Solar PV Total Global Capacity, 2004–2013

JOBS IN RENEWABLE ENERGY
Global employment con(nued to increase. An es(mated 6.5 million direct or indirect jobs in the renewable energy industry Noteworthy shics along the value chain segments and from manufacturing to installa(on and maintenance
Jobs in Renewable Energy
* Employment informa(on for large-‐scale hydropower is incomplete and not included Data source: IRENA

Renewable Energy Policy Landscape
With prices of renewable energy technologies coming down, there is a steep policy uptake in developing countries.
Developing and Emerging Countries with Renewable Energy Policies, 2004, 2009 and Early 2014


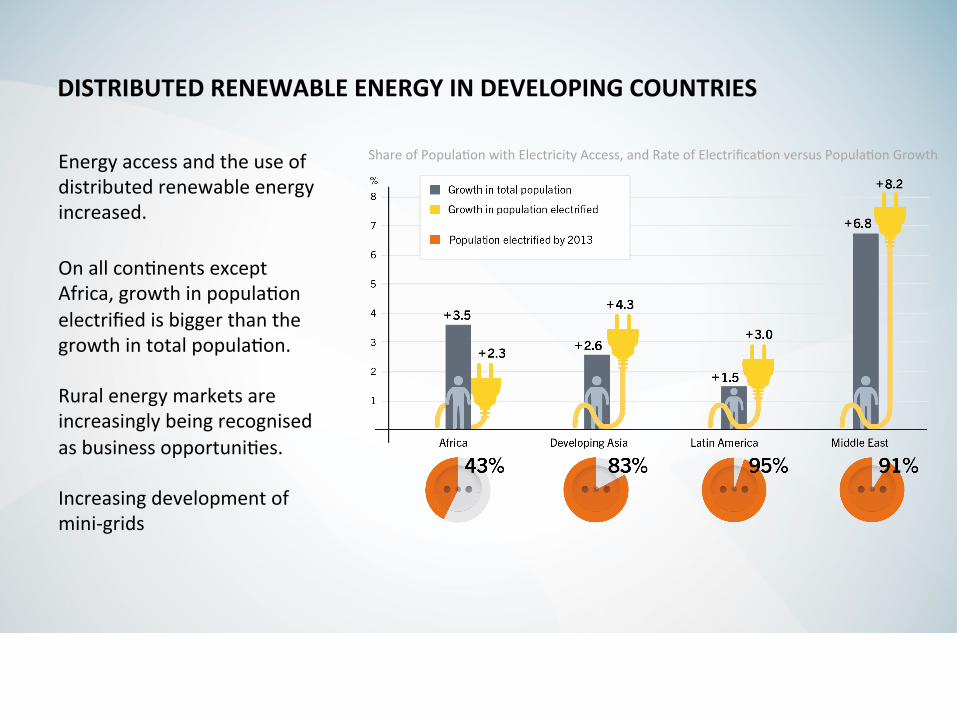
DISTRIBUTED RENEWABLE ENERGY IN DEVELOPING COUNTRIES
Energy access and the use of distributed renewable energy increased. On all con(nents except Africa, growth in popula(on electrified is bigger than the growth in total popula(on. Rural energy markets are increasingly being recognised as business opportuni(es. Increasing development of mini-‐grids
Share of Popula(on with Electricity Access, and Rate of Electrifica(on versus Popula(on Growth

There are still tasks that lie ahead Keep Walking….
-Mongolian Nomad