renewable energy data, analysis, and decisions: a guide ... · • decisions: target setting,...
TRANSCRIPT

NREL is a national laboratory of the U.S. Department of Energy Office of Energy Efficiency & Renewable Energy Operated by the Alliance for Sustainable Energy, LLC
This report is available at no cost from the National Renewable Energy Laboratory (NREL) at www.nrel.gov/publications.
Contract No. DE-AC36-08GO28308
Renewable Energy Data, Analysis, and Decisions: A Guide for Practitioners Sadie Cox, Anthony Lopez, Andrea Watson, and Nick Grue National Renewable Energy Laboratory
Jennifer E. Leisch United States Agency for International Development
Technical Report NREL/TP-6A20-68913 March 2018

NREL is a national laboratory of the U.S. Department of Energy Office of Energy Efficiency & Renewable Energy Operated by the Alliance for Sustainable Energy, LLC
This report is available at no cost from the National Renewable Energy Laboratory (NREL) at www.nrel.gov/publications.
Contract No. DE-AC36-08GO28308
National Renewable Energy Laboratory 15013 Denver West Parkway Golden, CO 80401 303-275-3000 • www.nrel.gov
Renewable Energy Data, Analysis, and Decisions: A Guide for Practitioners Sadie Cox, Anthony Lopez, Andrea Watson, and Nick Grue National Renewable Energy Laboratory
Jennifer E. Leisch United States Agency for International Development
Prepared under Task No. WFED.10355.08.01.11
Technical Report NREL/TP-6A20-68913 March 2018

NOTICE
This report was prepared as an account of work sponsored by an agency of the United States government. Neither the United States government nor any agency thereof, nor any of their employees, makes any warranty, express or implied, or assumes any legal liability or responsibility for the accuracy, completeness, or usefulness of any information, apparatus, product, or process disclosed, or represents that its use would not infringe privately owned rights. Reference herein to any specific commercial product, process, or service by trade name, trademark, manufacturer, or otherwise does not necessarily constitute or imply its endorsement, recommendation, or favoring by the United States government or any agency thereof. The views and opinions of authors expressed herein do not necessarily state or reflect those of the United States government or any agency thereof, including the United States Agency for International Development.
This report is available at no cost from the National Renewable Energy Laboratory (NREL) at www.nrel.gov/publications.
Available electronically at SciTech Connect http:/www.osti.gov/scitech
Available for a processing fee to U.S. Department of Energy and its contractors, in paper, from:
U.S. Department of Energy Office of Scientific and Technical Information P.O. Box 62 Oak Ridge, TN 37831-0062 OSTI http://www.osti.gov Phone: 865.576.8401 Fax: 865.576.5728 Email: [email protected]
Available for sale to the public, in paper, from:
U.S. Department of Commerce National Technical Information Service 5301 Shawnee Road Alexandria, VA 22312 NTIS http://www.ntis.gov Phone: 800.553.6847 or 703.605.6000 Fax: 703.605.6900 Email: [email protected]
NREL prints on paper that contains recycled content.

iii This report is available at no cost from the National Renewable Energy Laboratory at www.nrel.gov/publications.
Acknowledgments The authors would like to thank Dave Mooney, Jaquelin Cochran, and Donna Heimiller of the National Renewable Energy Laboratory, and Ranjit Deshmukh of Lawrence Berkeley National Laboratory for their thoughtful comments and review. Any remaining errors or omissions are those of the authors.
This work was prepared under Task No. WFED.10355.08.01.11 with funding from the United States Agency for International Development.

iv This report is available at no cost from the National Renewable Energy Laboratory at www.nrel.gov/publications.
List of Acronyms GIS Geographic information system LCOE Levelized cost of energy NSRDB National Solar Resource Database PV Photovoltaic REZ Renewable Energy Zone SAM System Advisor Model TMY Typical meteorological year

v This report is available at no cost from the National Renewable Energy Laboratory at www.nrel.gov/publications.
Table of Contents 1 Introduction ........................................................................................................................................... 1
1.1 About This Guide .......................................................................................................................... 1 1.1.1 Decisions, Data and Analysis ........................................................................................... 1 1.1.2 Decisions .......................................................................................................................... 2 1.1.3 Data .................................................................................................................................. 2 1.1.4 Analysis ............................................................................................................................ 2
2 Decisions ............................................................................................................................................... 4 2.1 Target Setting ................................................................................................................................ 4 2.2 Policymaking ................................................................................................................................. 5 2.3 Investment ..................................................................................................................................... 6 2.4 Power Sector Planning .................................................................................................................. 7
3 Data ...................................................................................................................................................... 10 3.1 Geospatial and Temporal Data Sets ............................................................................................ 10
3.1.1 Renewable Energy Resource Data ................................................................................. 11 3.1.2 Geospatial Data that Complements Renewable Energy Resource Data......................... 19 3.1.3 Obtaining Data and Data Sources .................................................................................. 20
4 Analysis ............................................................................................................................................... 22 4.1 Connecting Analysis and Data with Decisions ........................................................................... 26
4.1.1 Mapping and Visualization ............................................................................................ 26 4.1.2 Generator Performance Modeling .................................................................................. 29 4.1.3 Technical Potential Analysis .......................................................................................... 31 4.1.4 Supply Curve Modeling ................................................................................................. 33 4.1.5 Economic Potential Analysis ......................................................................................... 35 4.1.6 Capacity Expansion Modeling ....................................................................................... 37 4.1.7 Production Cost Modeling ............................................................................................. 39
5 Summary ............................................................................................................................................. 40 6 References .......................................................................................................................................... 41 Appendix: Key Geospatial Data Sets to Inform Renewable Energy Decisions .................................. 44

vi This report is available at no cost from the National Renewable Energy Laboratory at www.nrel.gov/publications.
List of Figures Figure 1. Decisions-data-analysis nexus ....................................................................................................... 2 Figure 2. Connections across geospatial data, analyses, and decisions ........................................................ 3 Figure 3. Images showing differences in the available wind resource in the Philippines when comparing
30-m hub height data to 100-m hub-height data .................................................................... 12 Figure 4. Types of solar radiation ............................................................................................................... 13 Figure 5. Low-resolution wind resource data (left) and high-resolution wind resource data (right) for
Cambodia ............................................................................................................................... 16 Figure 6. Low-resolution solar resource data (left) and high-resolution solar resource data (right) for
Cambodia – Global Horizontal Irradiance (GHI) .................................................................. 17 Figure 7. Analysis building blocks to support renewable energy decisions ............................................... 23 Figure 8. Static map of India solar resource distribution ............................................................................ 27 Figure 9. Example of simple data visualization for Cambodia to support initial high-level analysis ......... 29 Figure 10. The supply curve graph shows cumulative capacity and associated cost of energy at specific
locations. ................................................................................................................................ 34 Figure 11. Key assumptions of resource, technical, economic and market potential for renewable energy
................................................................................................................................................ 36
List of Tables Table 1. Examples of Renewable Energy Decisions Supported by Analytical Approaches ...................... 24

1 This report is available at no cost from the National Renewable Energy Laboratory at www.nrel.gov/publications.
1 Introduction High-quality renewable energy resource data and other geographic information system (GIS) data are essential for the transition to a clean energy economy that prioritizes local resources, improves resiliency, creates jobs, and promotes energy independence. These data are crucial for making informed decisions—ranging from policy and investment decisions to reliable power sector planning. Decisions that are data-driven reflect appropriate ambition, maximize cost-effectiveness, and enable successful implementation of renewable energy investments.
Various considerations are important in planning for data-driven decision-making. For instance, data can vary in type and quality, be expensive to obtain, and require specific skills and resources to process and interpret. This guide describes data requirements for making various renewable energy decisions and discusses the tools and analyses necessary to transform these data into recommendations for decision-makers.
This guide is intended to support policymakers and planners, as well as technical experts, consultants, and academics in incorporating improved data and analysis into renewable energy decision-making. The guide is divided into three main sections:
• Decisions: target setting, policymaking, investment, and power sector planning
• Data: renewable energy resource data and related GIS data
• Analysis: analytical methods and models. Although the topics are interrelated, the guide is generally organized by the type of renewable energy decisions the reader might be trying to make or support. For example, for renewable energy target setting, questions such as the following might arise: Which data are needed to support target setting? What are the limitations and benefits of various types of data? What types of analyses are needed to inform target setting?
This guide also answers practical questions related to sources, limitations, and costs associated with data and analytical tools. In addition, the guide highlights common errors and misunderstandings that might help prevent costly or time-consuming mistakes. In the end, the reader will have a better understanding of data, analytical approaches, and the integration of these two key areas to support informed renewable energy decision-making.
1.1 About This Guide 1.1.1 Decisions, Data and Analysis Data and analysis are core elements of informed renewable energy decision-making, as presented in Figure 1. This guide includes three key sections focused on use of high quality data and analyses to inform renewable energy decisions. The guide begins with a section that introduces renewable energy decisions; namely, target setting, policymaking, investment, and power sector planning. Building on this high-level framing around decisions, Sections 3 and 4 present key data and analytical approaches to support these decision areas. Section 4 also describes links across data, analysis and decisions - providing information on data that are required for specific analyses as well as the types of decisions that data-driven analyses can inform.

2 This report is available at no cost from the National Renewable Energy Laboratory at www.nrel.gov/publications.
Figure 1. Decisions-data-analysis nexus
1.1.2 Decisions Section 2, on decisions, discusses common decisions that can be informed by robust renewable energy data and analysis: namely, target setting, policymaking, investment, and power sector planning. These decision areas are highlighted in Figure 1.
1.1.3 Data Section 3, on data, informs readers about different types of resource and GIS data, including characteristics and costs that can feed into various renewable energy analyses and inform the types of decisions highlighted in Figure 1.
1.1.4 Analysis Section 4, on analysis, discusses select analyses and their data requirements and how data can be used to produce information that helps stakeholders make informed decisions. These analyses are mapped to the decisions highlighted in Figure 1.
Figure 2 provides an overview of the connections across geospatial data, analyses, and decisions to support renewable energy development and described in this guide.

3 This report is available at no cost from the National Renewable Energy Laboratory at www.nrel.gov/publications.
Figure 2. Connections across geospatial data, analyses, and decisions

4 This report is available at no cost from the National Renewable Energy Laboratory at www.nrel.gov/publications.
2 Decisions Decision-makers can improve the impact and outcome of their decisions by using high quality renewable energy resource and other geospatial data as inputs into their decision-making processes. Decision-makers who rely on renewable energy data to make good decisions include policymakers, investors, and system operators, as well as the universities, nongovernmental organizations, and other institutions that support them.
Four broad types of decision-making are discussed in Section 2.1.
2.1 Target Setting Renewable energy targets are quantitative goals for the installed capacity or generation of renewable energy. As of 2016, 176 countries had developed renewable energy targets at the national or subnational level (REN21 2017). Examples of renewable energy targets are presented in Text Box 1.
Text Box 1. Example Renewable Energy Targets
• Aruba: 100% renewable electricity by 2020
• China: 110 GW of solar PV and 210 GW of wind by 2020
• Ethiopia: 7 GW wind power by 2030
• Japan: 1.5 GW ocean power by 2030
• Mexico: 20 GW installed renewable energy capacity by 2020
• Morocco: 2 GW solar and 2 GW wind power by 2020.
Source: Renewable Energy Policy Network for the 21st Century 2017
Text Box 2. Renewable Energy Target Setting in the Context of Climate and Development Goals In 2015, countries from around the world came together under the Paris Agreement to support key climate goals. Specifically, 197 countries prepared Nationally Determined Contributions that outlined plans to reduce greenhouse gas emissions and support climate change adaptation. Many countries either included previously established renewable energy targets in their Nationally Determined Contributions or stated an intention to develop or improve renewable energy targets.
Geospatial data and analysis can inform the development of robust renewable energy targets and a broader portfolio of climate actions to achieve key mitigation and resilience goals. Geospatial data and analysis can provide insights into other important factors as well, such as the identification of potential zones for cost-effective renewable energy development and/or areas where climate impacts might be anticipated and will require resilience measures that could be supported by renewable energy and other technologies. Nationally Determined Contributions commitments and related renewable energy targets that are formulated using data and analysis can build confidence and form a basis for related policy that may be needed to achieve targets.
National development plans and goals bring together actions across sectors to support economic, social, and environmental development goals. Ensuring a strong understanding of renewable energy technical and economic potential, based on geospatial data and analysis, is important for estimating potential development impacts of renewable energy deployment related economic growth, innovation, job creation, and energy access, among others. Assessing and understanding these impacts allows renewable energy actions to be integrated into and aligned with key development goals articulated in national development plans. Renewable energy targets can be designed to align with key development goals by analyzing development impacts of various renewable energy technologies at different levels of deployment. For more information on the development impact assessment of renewable energy technologies, see www.ec-leds.org/tools-page/development-impact-assessment-tools.
5 This report is available at no cost from the National Renewable Energy Laboratory at www.nrel.gov/publications.
Renewable energy targets can send market signals to investors and developers and inform the scope of related policymaking. Decision-makers engaged in developing renewable energy targets include government agencies, utilities, regulators, system operators, technical institutions that support government decisions, and other public and private sector stakeholders.
Renewable energy targets are set in relation to several considerations, including the availability and quality of renewable energy resources, the financing and policy environment that affects the likelihood of development, and alignment with broader development goals. As presented in this paper, geospatial data and analysis are crucial to support the integrated assessment that brings together renewable energy resource, geographic, economic, and other considerations for data-driven renewable energy target setting. Text Box 2 explores the relationship between renewable energy targets and national development, climate goals, and strategies.
Decision-makers are faced with numerous considerations when developing renewable energy targets. Key questions that should be asked to inform renewable energy targets are highlighted in Text Box 3, Section 2, and Section 4 present analyses and data that can support decision-making within the context of these questions and considerations.
2.2 Policymaking Many countries and local governments around the world have developed policies to support renewable energy development and deployment. Historically, renewable energy policies and incentives were designed to help deploy targeted levels of renewable energy capacity, either by regulatory requirements or by ensuring profitable investment opportunities. Examples include tax credits, renewable energy purchase obligations, and feed-in tariffs, many of which are still used. Today, however, renewable energy policies no longer focus solely on the
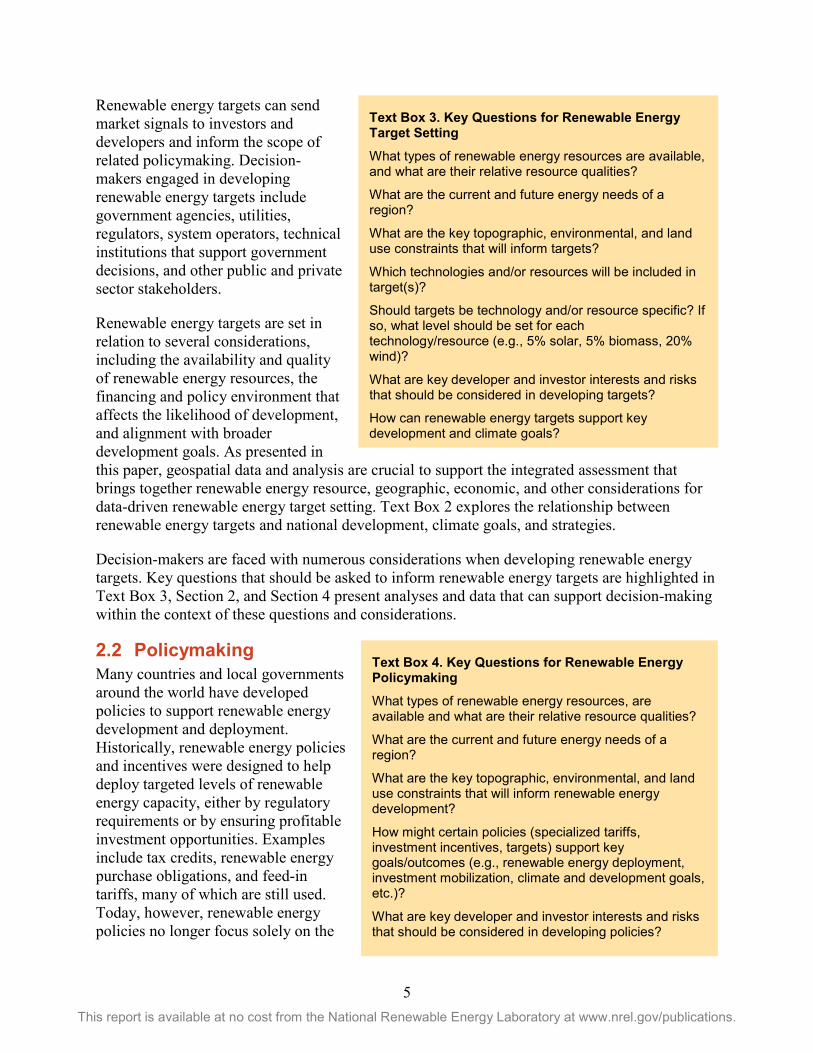
Text Box 3. Key Questions for Renewable Energy Target Setting What types of renewable energy resources are available, and what are their relative resource qualities?
What are the current and future energy needs of a region?
What are the key topographic, environmental, and land use constraints that will inform targets? Which technologies and/or resources will be included in target(s)?
Should targets be technology and/or resource specific? If so, what level should be set for each technology/resource (e.g., 5% solar, 5% biomass, 20% wind)?
What are key developer and investor interests and risks that should be considered in developing targets?
How can renewable energy targets support key development and climate goals?
Text Box 4. Key Questions for Renewable Energy Policymaking What types of renewable energy resources, are available and what are their relative resource qualities?
What are the current and future energy needs of a region?
What are the key topographic, environmental, and land use constraints that will inform renewable energy development?
How might certain policies (specialized tariffs, investment incentives, targets) support key goals/outcomes (e.g., renewable energy deployment, investment mobilization, climate and development goals, etc.)?
What are key developer and investor interests and risks that should be considered in developing policies?
6 This report is available at no cost from the National Renewable Energy Laboratory at www.nrel.gov/publications.
deployment of new renewable energy capacity; instead, they take a more holistic view of expanding and operating the electric grid with significant levels of renewable energy penetration. Examples of newer policies and incentives include measures to minimize policy cost (e.g., auctions), provide grid-support and ancillary services, and incentivize flexible generation sources (Miller et al. 2013; Couture et al. 2015).
Robust data and analysis help ensure accurate, economical policy design. Geospatial data, along with renewable energy economic and cost data, serve as the foundation for analyzing pathways to reaching renewable energy deployment goals. Similarly, data can be used to conduct analysis to better understand how implementing certain policies might impact the economic potential of renewable energy development. These analyses inform the development of policies and incentives appropriate for specific local and national contexts. Although specific policies chosen will depend on unique country circumstances, the data and analyses presented can be used to inform a broad range of renewable energy policymaking.
Text Box 4 highlights some of the key questions to consider in developing renewable energy policies. Data and analysis that can inform these questions are highlighted in Section 2.3 and Section 2.4.
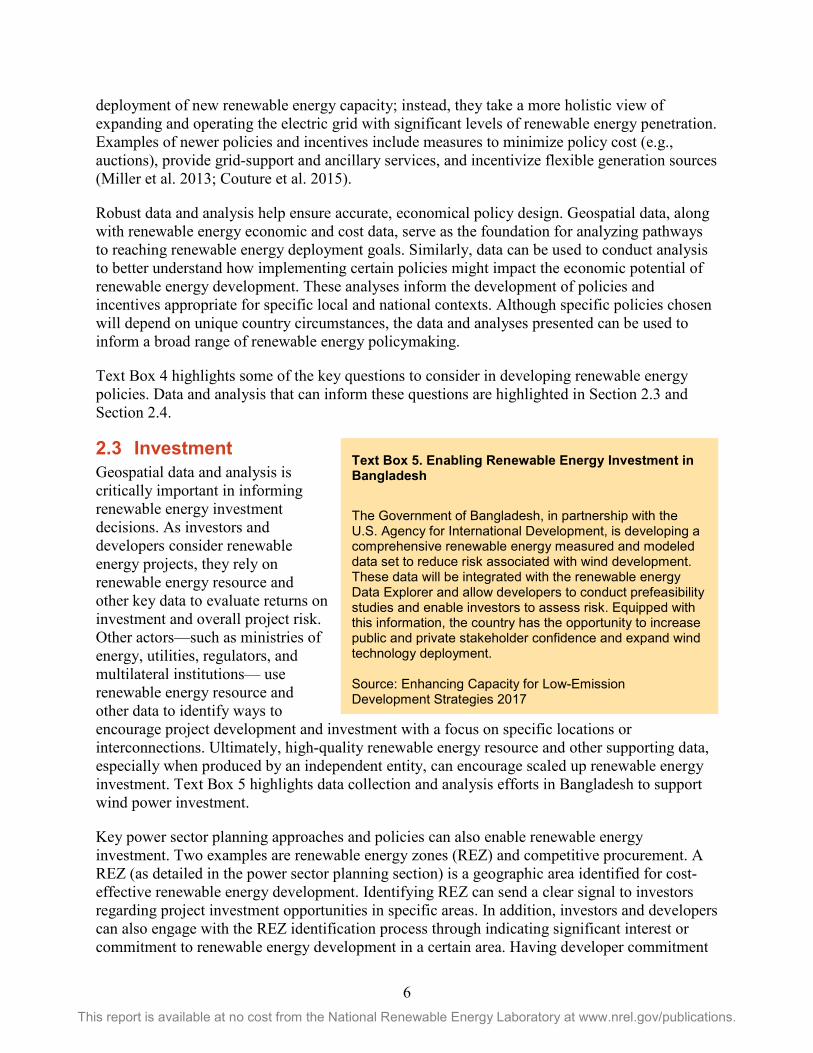
2.3 Investment Geospatial data and analysis is critically important in informing renewable energy investment decisions. As investors and developers consider renewable energy projects, they rely on renewable energy resource and other key data to evaluate returns on investment and overall project risk. Other actors—such as ministries of energy, utilities, regulators, and multilateral institutions— use renewable energy resource and other data to identify ways to encourage project development and investment with a focus on specific locations or interconnections. Ultimately, high-quality renewable energy resource and other supporting data, especially when produced by an independent entity, can encourage scaled up renewable energy investment. Text Box 5 highlights data collection and analysis efforts in Bangladesh to support wind power investment.
Key power sector planning approaches and policies can also enable renewable energy investment. Two examples are renewable energy zones (REZ) and competitive procurement. A REZ (as detailed in the power sector planning section) is a geographic area identified for cost-effective renewable energy development. Identifying REZ can send a clear signal to investors regarding project investment opportunities in specific areas. In addition, investors and developers can also engage with the REZ identification process through indicating significant interest or commitment to renewable energy development in a certain area. Having developer commitment
Text Box 5. Enabling Renewable Energy Investment in Bangladesh
The Government of Bangladesh, in partnership with the U.S. Agency for International Development, is developing a comprehensive renewable energy measured and modeled data set to reduce risk associated with wind development. These data will be integrated with the renewable energy Data Explorer and allow developers to conduct prefeasibility studies and enable investors to assess risk. Equipped with this information, the country has the opportunity to increase public and private stakeholder confidence and expand wind technology deployment. Source: Enhancing Capacity for Low-Emission Development Strategies 2017

7 This report is available at no cost from the National Renewable Energy Laboratory at www.nrel.gov/publications.
helps justify early investment in new transmission lines, ensuring that they will be fully used. Identifying REZs requires high-quality resource and other geospatial data and analysis, as presented in other sections. Competitive procurement represents another way in which utilities and other electricity sector players can influence renewable energy investment. Like REZs, auctions depend on high-quality data to allow investors and project developers to make informed, cost-effective decisions.
Text Box 6 highlights some of the key questions to consider in supporting the mobilization of renewable energy investment. Data and analysis that can inform these questions are highlighted in Sections 3 and 4.
2.4 Power Sector Planning As highlighted in Section 2.3, to foster sustainable low-emission development, many countries are establishing ambitious renewable energy targets for their electricity supply. Because solar and wind generation are more variable than conventional sources, meeting these targets will involve changes to electricity system planning and operations. Development of robust Power Sector Master Plans, Power Development Plans, or Integrated Resource Plans that articulate actions to support capacity expansion, transmission development, and integration of variable renewables into the grid can enable countries in meeting ambitious renewable energy targets. These power sector plans include future assumptions about demand, and the types and amount of generation needed to meet that future demand, often informed by capacity expansion analysis. Power sector plans also include spatial considerations for transmission siting and build out, which can be informed by the Renewable Energy Zone processes (highlighted below) and transmission planning analysis. In addition, power sector plans are critical in ensuring power systems operate economically and reliably as higher penetrations of variable renewables are integrated with the grid. Production cost analysis is one common approach used to support power sector plans. Together, capacity expansion, transmission, and grid integration analysis can support holistic power sector planning processes and enable clean energy development. As renewable energy technology prices are rapidly changing, it is important that these plans and analyses are frequently updated to represent lower costs.
Text Box 6. Key Questions for Renewable Energy Investment What types of renewable energy resources are available and what are their relative resource qualities?
What are the current and future energy needs of a region?
What are the key topographic, environmental, and land use constraints that will inform renewable energy development?
What is the expected return on investment of renewable energy or transmission projects?
What types of policy tools, such as renewable energy zones or competitive auctions, may be most effective in encouraging investment in certain locations?
What are key developer and investor interests and risks that should be considered to enable renewable energy investment?

8 This report is available at no cost from the National Renewable Energy Laboratory at www.nrel.gov/publications.
Capacity expansion analysis enables planners to “identify where, when, how much, and what types of infrastructure (generation and/or transmission) would achieve variable renewable energy targets at least cost, taking into consideration factors such as new policies, technological advancement, fuel prices, and demand projections.” (et al. 2018). As noted above, this type of analysis is a critical element of power sector planning and is used to assess and optimize generation and/or transmission portfolios at the least cost and in relation to physical constraints.
Transmission planning supports integration of renewable resources, which may not be located in close proximity to transmission infrastructure, with the grid. Transmission analysis allows planners to evaluate expansion options that can balance supply and demand and increase access to renewable energy resources. Planning approaches, such as the development of Renewable Energy Zones (REZ), can enable access to renewable energy in the most cost-effective locations through transmission upgrade or expansion.1 A REZ is a geographic area characterized by several features that support cost-effective renewable energy development, including high-quality renewable energy resources, suitable topography, proximity to infrastructure, energy demand, and strong developer interest or commitment. Identification of REZ enables planners to understand transmission extension needs and can be a highly valuable element of power sector plans.
Building on capacity expansion analysis and transmission planning, grid integration analysis is primarily informed by production cost modeling. Grid integration is the practice of developing efficient ways to deliver variable renewable energy to the grid (Greening the Grid 2017). For a detailed view of key actions that support grid integration, see www.greeningthegrid.org. To support grid integration, a “production cost study assesses the impacts of one or more variable renewable energy penetration scenarios on bulk power scheduling and economic dispatch.” (Katz et al. 2018) Minimizing the operational costs of various renewable energy penetration scenarios is the aim of these studies. Assessment of capital costs of new generation and transmission requires 1 http://greeningthegrid.org/integration-in-depth/planning-for-grid-integration
Text Box 7. Modeling Power System Implications of High Renewable Energy Scenarios in the Philippines To support electricity sector planners in the Philippines in evaluating the impacts and opportunities associated with achieving high levels of variable renewable energy penetration, the Department of Energy of the Philippines and the U.S. Agency for International Development spearheaded a study of the operational impacts of reaching high solar and wind targets in the country’s power system. In Greening the Grid: Solar and Wind Integration Study for the Luzon-Visayas System of the Philippines, the authors use a production cost model and high-resolution renewable energy resource data to determine the time- and location-specific operational impacts of several scenarios, ranging from 15%–50% renewable energy, for the power system in 2030. For each scenario, the production cost model simulated the hourly scheduling of least-cost electricity for 1 year under representative weather, load, and outage conditions while adhering to the physical constraints of the generation fleet and transmission network. Crucial inputs to this study included Philippines-wide hourly modeled solar and wind resource data, which allowed the modeling team to identify locations for new wind installations. These inputs were sourced in part from the 2014 Wind Atlas for the Philippines, the result of a previous collaboration between the Department of Energy of the Philippines and the U.S. Agency for International Development. The wind atlas data are available in the RE Data Explorer (Barrows et al. 2018).

9 This report is available at no cost from the National Renewable Energy Laboratory at www.nrel.gov/publications.
additional complementary analysis (highlighted above and in the analysis section). Text Box 7 highlights the use of renewable energy and geospatial data to support an in-depth grid integration study and related actions in the Philippines.
Typical decision-makers involved in power sector planning include ministries of energy, utilities, system operators, and regulators. Text Box 8 outlines key questions and considerations to inform power sector planning decisions. The analyses and data to support decision-making in the context of these questions and considerations are presented in Section 3 and Section 4.
Text Box 8. Key Questions for Power Sector Planning What types of renewable energy resources are available and what are their relative resource qualities?
What are the current and future energy needs of a region?
What are the key topographic, environmental, and land-use constraints that will inform renewable energy development?
What proportion and location of renewable energy generation is most cost-effective and contribute to meeting future demand and other energy sector goals (e.g., reliability, climate and development goals)?
Where, when, and how much transmission infrastructure is needed to achieve renewable energy targets at least cost?
What operational changes or investments will enable cost-effective operation at various renewable energy penetration levels?
To what extent can renewable energy technologies be integrated into existing power system without major operational changes or infrastructure investments?

10 This report is available at no cost from the National Renewable Energy Laboratory at www.nrel.gov/publications.
3 Data Geospatial data sets provide an essential foundation for informed and robust renewable energy decision-making. Geospatial data sets include renewable energy resource data and related data sets, such as roads and infrastructure, political boundaries, terrain, and land use. Individual data sets vary in spatial and temporal resolution, quality, and overall usefulness. This section reviews types of renewable energy resource data and supporting spatial data and outlines general considerations related to data and data visualization. Section 4 then organizes these data in relation to different analyses that can feed into the key renewable energy decision areas presented in Section 2.
3.1 Geospatial and Temporal Data Sets
Geospatial data sets represent geographic features such as atmospheric phenomena (i.e., solar radiation), transportation and infrastructure, and political boundaries. These data sets can be combined in infinite ways to synthesize new information about renewable energy potential and inform renewable energy decisions. In this section, the discussion of geospatial data sets is organized by renewable resource data and other supporting geospatial data. All the data considered in this paper are geospatial data,2 and some of the data also have temporal characteristics. Temporal characteristics become very important when considering variable renewable energy resources because the amount of resource available varies throughout time. Variable renewable energy resources include solar, wind, ocean, and some hydropower generation technologies (Greening the Grid 2015). Text Box 9 defines geospatial and temporal data.
2 Geospatial data do not refer to a specific file format, simply that the data can be pinpointed on or near the surface of our planet.
Text Box 10. Continuous Grid and Discrete Point Location Data Defined Continuous grid data, commonly referred to as raster data, are distributed evenly across the area of interest. For example, the area might be divided into 2-km2 by 2-km2, and a data point at the center of each square represents an average or total value for the entire square’s area. Continuous data are generally modeled or interpolated.
Discrete point location data, commonly referred to as vector data, are typically not uniform and represent the location of ground measurement stations. Sometimes these stations have additional meteorological information that can be very useful; however, the stations are likely to be widely dispersed.
Text Box 9. Geospatial and Temporal Data Defined Geospatial data describe the relative position of something on the Earth’s surface. Examples include the location of roads or cities or the amount of renewable energy resource at a specific location.
Temporal data have specified dates or times. Temporal data can be discrete in time; however, within this paper, temporal data are assumed to contain repeated observations—for example, wind speed measurements at 5-minute intervals.

11 This report is available at no cost from the National Renewable Energy Laboratory at www.nrel.gov/publications.
3.1.1 Renewable Energy Resource Data Renewable energy resource data sets provide information on the availability and intensity of sun, wind, geothermal, hydro, wave, tidal, and biomass energy at a given geographic location. Renewable energy resource availability differs in relation to location and, for variable resources (e.g., solar and wind), in relation to time. A spatial sampling of a renewable energy data set (e.g., 2 km by 2 km on a continuous grid or discrete point locations; see Text Box 10) is used to represent the location of resources over a given area. For the temporal component of renewable energy resource availability, data can be drawn from specific time intervals (e.g., 15 min hourly, or monthly). The following sections provide further information on temporal and spatial considerations for various renewable energy data sets.
Renewable energy resource data are obtained through measurements, by modeling the data, or both. Descriptions of modeled and measured data, as well as methods to validate measured data, are provided in Text Box 11.
Wind Wind data may be measured, modeled, or compiled from both measured and modeled data, and they have spatial and temporal components. Wind resource data can have a high degree of spatial variability,3 which emphasizes the need for high spatial resolution data. The data can represent wind speeds and wind direction at different heights off the ground, called the hub height. Hub height refers to the height of the hub of a wind turbine. Typical hub heights are 30 m, 60 m, 80 m, 100 m, and increasingly 120 m. Text Box 12 highlights one of several reasons for considering wind data at different hub heights. Temporal data may range from 1-min data to annual averages.
3 Spatial variability refers to the degree to which a value changes with increasing distance from the source value.
Text Box 11. Modeled, Measured, and Validated Data Modeled data are renewable energy resource data developed with modeling methodologies. For example, atmospheric scientists use a variety of methods to estimate solar irradiance, including empirical, semiempirical, and, more recently, physics-based methods. For wind resource data, atmospheric scientists use numeric weather models (e.g., Weather Research and Forecasting Model) and downscaled reanalysis data sets.
Measured data are point-specific renewable energy data gathered by trained personnel or meteorological measuring equipment. If many points are available across a region, then these data can provide a reasonable understanding of the solar resource for a region. These data can also be used for site-specific project assessments.
Validations of data are typically performed at the time renewable energy resource data are created. Validation refers to comparing modeled data to “ground truth” data to quantify how closely the model matches reality. Validation can take many forms—for example, from a meteorological standpoint, comparing diurnal and annual cycles of wind speed; or from a power standpoint, comparing power output ramps and frequency distributions. Validation can play an important role in analysis application, sometimes warranting the use or purchase of another data set if the validation metrics prove systematic biases.

12 This report is available at no cost from the National Renewable Energy Laboratory at www.nrel.gov/publications.
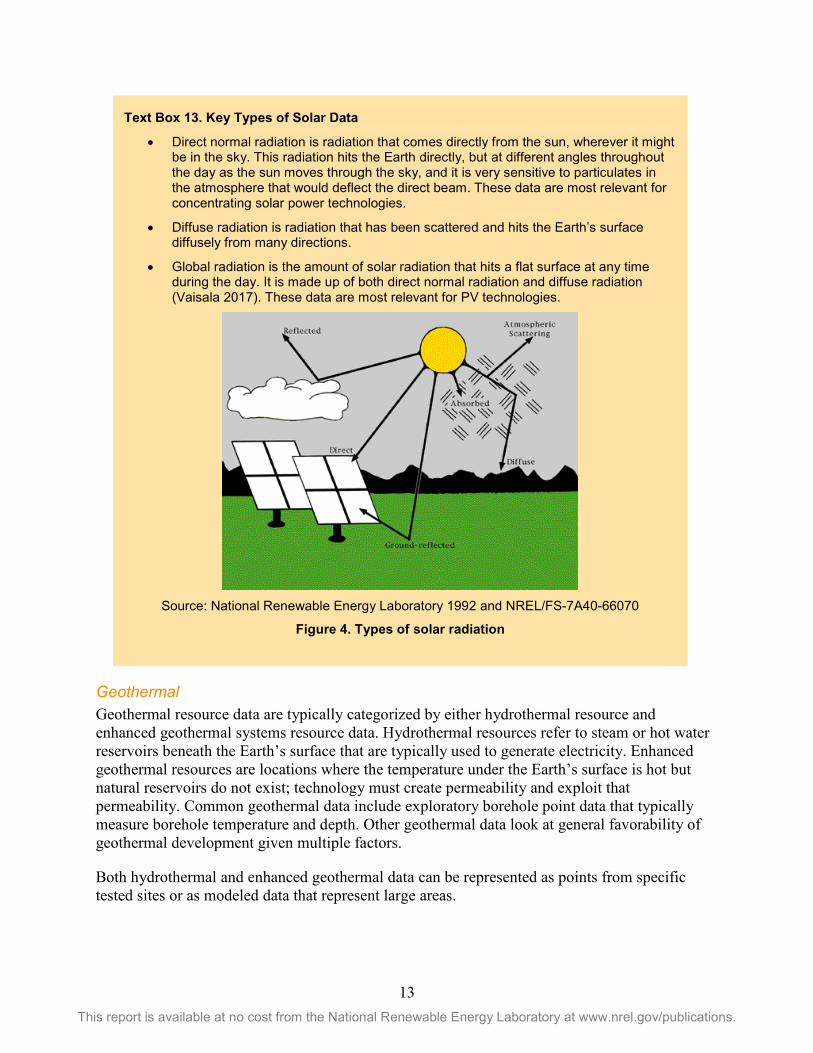
Solar Solar data can be measured, modeled, or a compilation of both. Spatially, solar data are often presented on a continuous surface depicting different degrees of spatial variability depending on local climate and or topographic conditions. Temporally, solar data may range from 1-min data to annual averages. Solar data are typically presented as direct normal irradiance, diffuse horizontal irradiance, and global horizontal irradiance, or a subset of these three types of solar data. Descriptions of each of these key data types are provided in Text Box 13. Figure 4 also presents types of solar radiation.
Text Box 12. Wind Hub Height Data to Inform Decisions Approximately 15 to 20 years ago, utility-scale wind turbines typically had hub heights between 30 m and 60 m. Today, wind turbine hub heights are typically between 80 m and 100 m and can even be as high as 120 m. As illustrated in Figure 3, wind data for 30 m and 100 m over the same region can vary significantly. In this map of the Philippines, decision-makers considering utility-scale applications would be misled if they were pursuing exercises to set wind goals or discussing opportunities with developers using 30-m wind data. The 100-m data illustrate a much more robust wind resource for utility-scale development highlighted by increased land opportunities with higher wind speeds that are suitable for development.
Figure 3. Images showing differences in the available wind resource in the Philippines
when comparing 30-m hub height data to 100-m hub-height data In the map on the right, the warmer color tones (yellows, oranges, and reds) depict areas with wind speeds more than 6.5 m/s. This information gives decision-makers many more options for siting projects on available land where commercial developer interest is likely.
13 This report is available at no cost from the National Renewable Energy Laboratory at www.nrel.gov/publications.
Geothermal Geothermal resource data are typically categorized by either hydrothermal resource and enhanced geothermal systems resource data. Hydrothermal resources refer to steam or hot water reservoirs beneath the Earth’s surface that are typically used to generate electricity. Enhanced geothermal resources are locations where the temperature under the Earth’s surface is hot but natural reservoirs do not exist; technology must create permeability and exploit that permeability. Common geothermal data include exploratory borehole point data that typically measure borehole temperature and depth. Other geothermal data look at general favorability of geothermal development given multiple factors.
Both hydrothermal and enhanced geothermal data can be represented as points from specific tested sites or as modeled data that represent large areas.
Text Box 13. Key Types of Solar Data
• Direct normal radiation is radiation that comes directly from the sun, wherever it mightbe in the sky. This radiation hits the Earth directly, but at different angles throughoutthe day as the sun moves through the sky, and it is very sensitive to particulates inthe atmosphere that would deflect the direct beam. These data are most relevant forconcentrating solar power technologies.
• Diffuse radiation is radiation that has been scattered and hits the Earth’s surfacediffusely from many directions.
• Global radiation is the amount of solar radiation that hits a flat surface at any timeduring the day. It is made up of both direct normal radiation and diffuse radiation(Vaisala 2017). These data are most relevant for PV technologies.
Source: National Renewable Energy Laboratory 1992 and NREL/FS-7A40-66070
Figure 4. Types of solar radiation

14 This report is available at no cost from the National Renewable Energy Laboratory at www.nrel.gov/publications.
Hydropower Hydropower data might include the location of rivers, average or seasonal flow, hydraulic head, and the location of dams.
Biomass Biomass data represent the amount of biomass resource available within a certain geographical area. Biomass data may be composed of numerous types of biomass feedstocks. The amount of energy contained within these feedstocks and the density of the feedstocks represents the biomass resource.
Marine Hydrokinetic Marine hydrokinetic resources include tidal stream, ocean current, ocean thermal gradients, and wave energy. Tidal stream data may include tidal current velocity and flow rate (in annual averages or temporally more resolute) and power density (watts/square meter) for various coastal locations. These data may be modeled or site specific. Ocean current data may include ocean current velocity and power density (watts/square meter) at daily to annual average temporal resolutions. Ocean thermal gradients use the temperature differential between warmer surface water and colder water at depth to generate electricity, and data include the temperature differential (in daily or seasonal temporal resolution) and depth of occurrence. Wave resources may include data on wave height, energy period, direction, and power density (watts/meter of wave crest at any given depth).
Temporal Resolution Considerations Most renewable energy resource data vary temporally. In other words, the amount of resource changes throughout the day, month, and year as well as from one year to another, which is called interannual variability. Understanding the temporal aspects of a data set and differing time characteristics is critical for analysts as they consider how the data can be used and decisions that can be informed. Key temporal characteristics of data sets include:
• Sample interval: the rate of a sample—e.g., 1 min, 15 min, hourly, daily, or annual
• Instantaneous or integrated: o Instantaneous can be thought of as a snapshot of the resource value at a specified
time. o Integrated data generally represent the entire range of a specified time interval
(e.g., an hour), which is similar to an instantaneous midpoint value of a specified time interval.
• Intervals: the sample clock time representation—e.g., whether an integrated sample taken at 3 p.m. represents 2 p.m.–3 p.m. or 3 p.m.–4 p.m.
• Various combinations of the above
• Temporal range: typically defined as years of coverage or period of record. For example, hourly data for the years 2005–2010 is 5 years of hourly data. Having multiple years of data is important to understanding the interannual variability of a given resource.

15 This report is available at no cost from the National Renewable Energy Laboratory at www.nrel.gov/publications.
These temporal characteristics of data sets become very important for certain types of modeling. For example, if an analyst is looking at ramp rates for energy reserves in a reserves analysis, results might vary between instantaneous or integrated data sets. In this case, and in others, awareness of the temporal components of a data set becomes very important to the modelers and decision-makers who depend on the results.
Spatial Resolution Considerations Renewable energy resource data vary spatially, meaning that the amount of resource might change from one location to the next. The degree of change across a specified distance depends on many factors. Therefore, the spatial resolution, or the number of data points within a given area, can have a significant effect on the application and validity of a data set in an analysis. Understanding the spatial aspects of a data set is critical for analysts as they consider how the data can be used and decisions that can be informed. For example, for regional or national modeling activities and studies, a moderately high spatial resolution might be sufficient to capture the regional spatial variability of a resource, but project development at a specific location could require point-specific data. Figure 5 and Figure 6 show low-resolution and high-resolution data used for wind and solar mapping, respectively, in Cambodia.

16 This report is available at no cost from the National Renewable Energy Laboratory at www.nrel.gov/publications.
Source: National Aeronautics and Space Administration 2008 and Danish Technical University 2016
Figure 5. Low-resolution wind resource data (left) and high-resolution wind resource data (right) for Cambodia

17 This report is available at no cost from the National Renewable Energy Laboratory at www.nrel.gov/publications.
Source: National Aeronautics and Space Administration 2008 and World Bank 2016
Figure 6. Low-resolution solar resource data (left) and high-resolution solar resource data (right) for Cambodia – Global Horizontal Irradiance (GHI)

18 This report is available at no cost from the National Renewable Energy Laboratory at www.nrel.gov/publications.
Typical Meteorological Year It is common to encounter data sets that represent a typical meteorological year (TMY). A TMY provides users with a reasonably sized data set for 1 year that captures the hourly resource and meteorological variability using values that typify conditions at a specific location throughout a longer period of time, such as 30 years (Wilcox and Marion 2008). In effect, this reduces the uncertainty related to interannual variability while maintaining a representation of the intra-annual variability, albeit only at monthly timescales. However, TMY data also introduce a lack of temporal coincidence—in other words, the data represent something typical during the 30-year period, but the exact conditions are not likely to occur in any single real year. Production cost modeling requires temporal coincidence because the data correlate the ability of potential generation to meet energy demand at the same time. Therefore, production cost modeling cannot be fully conducted with TMY data.4 In addition, TMY data are not generally used to predict weather for a particular period of time, nor are TMY data an appropriate basis for evaluating real-time energy production. Section 4 considers when TMY data or other data sets are appropriate for analysis.
Data Size and Format Considerations The size of renewable energy resource data sets can vary dramatically. For example, the National Solar Resource Database (NSRDB) Physical Solar Model solar data (Western Hemisphere extent, 2 km x 2 km, 30-min interval, 17-year temporal range) is approximately 30 terabytes of highly compressed hierarchical data format 5. For comparison, the NSRDB at the State University of New York at Albany India solar data (South Asia extent, 10 km x 10 km, 1-hour interval, 16-year temporal range) with approximately the same number of variables, is approximately 1 terabyte of highly compressed hierarchical data format 5 . The India data set is smaller because the data have a lower spatial and temporal resolution covering a smaller spatial area; however, note that higher resolution data do not necessarily provide better results for a given analysis, and the type of data required is highly dependent on the analysis. Increasing the resolution of continuous modeled data by a factor of 2 (e.g., moving from 2 km x 2 km to 1 km x 1 km) increases the data volume by four times. Large volumes of data can be difficult to process and manage, sometimes requiring specialized skills and computational resources.
The format of renewable resource data also differs. Typically, resource data are stored in formats historically used for atmospheric modeling (e.g., HDF and netCDF5), but they are also stored in formats that are conducive to energy modeling (e.g., SAM CSV6 or EPW7). Using these data successfully requires expertise to handle varied data formats with large sizes and typically requires professional programmers.
4 TMY annual averages are often used to characterize parcels of land that represent the available supply in capacity expansion models. 5 Even within netCDF and HDF, there can be variation in how the data are logically stored. For example, they can be stored as image tiles one for each time interval or with all time intervals stored in a single file representing a single pixel or location. 6 SAM CSV is a format developed and used by the System Advisor Model developed by the National Renewable Energy Laboratory. 7 EPW is a file format originally developed by the U.S. Department of Energy EnergyPlus building simulation modeling team.

19 This report is available at no cost from the National Renewable Energy Laboratory at www.nrel.gov/publications.
3.1.2 Geospatial Data that Complements Renewable Energy Resource Data In addition to renewable energy resource data, many data sets vary spatially and are important in conducting analysis and informing renewable energy decisions. Key data set examples are as follows. The appendix presents a more complete list.
Meteorological data: Meteorological data, or weather data, are often modeled or measured along with wind or solar data, and they are contained within or subsequently coupled with those data sets. Examples include temperature, precipitation, humidity, and atmospheric pressure. These data can inform renewable energy analysis. For example, air temperature has an impact on solar photovoltaic (PV) efficiency, either increasing or decreasing the energy output, fundamentally influencing downstream analysis.
Land use and land ownership: Data depicting land use and ownership are useful for understanding useable areas for renewable energy development. These types of data can show how land is being used (grazing, agriculture, urban, conservation area, etc.) and who owns the land (privately held, federally held, etc.). Land use considerations help determine where renewable energy can be sited or exclusion zone locations.
Population: Census data, including population density, can provide important information for renewable energy analysis. This type of information can be useful for understanding if renewable energy resources are situated within, near, or far from population centers. In California, dense population centers and excellent solar resources have presented good conditions for distributed rooftop PV development. Expansive, sparsely populated land and excellent wind resources have made Wyoming an important region for developing utility-scale wind projects.
Transmission infrastructure data: A consideration for developing renewable energy is how the generation will be transported from the areas that have excellent resources to the population centers that need them. Data sets that depict transmission infrastructure can help decision-makers understand the relationship between resources and the infrastructure that will transport those resources.
Digital elevation model data: Digital elevation models, such as the National Aeronautics and Space Administration’s Shuttle Radar Topography Mission digital elevation model, provide surface elevation information that can be used to account for hill shading, terrain slope, or identification of other topographical features needed in an analysis (National Aeronautics and Space Administration Jet Propulsion Laboratory 2014).

20 This report is available at no cost from the National Renewable Energy Laboratory at www.nrel.gov/publications.
3.1.3 Obtaining Data and Data Sources Data can be obtained through various free or commercial sources. As previously mentioned, data can be either measured or modeled. The types of decisions and related analyses that data will feed into will determine data requirements and inform sources of data than can be used. Brief descriptions of key methods and other considerations in obtaining geospatial data are highlighted below.
Publicly Available Data An increasing number of organizations, governments, and research institutions provide free access to renewable energy resource data. These data vary in quality and geographic reach, but they can be very useful for analysts and decision-makers pursuing renewable energy analysis. Free data sets often include annual averages or TMY data; however, higher resolution free data sets are available for some regions. Key publicly available renewable energy databases include the IRENA Global Energy Atlas, the Renewable Energy Explorer website (highlighted in Text Box 15), the National Solar Resource Database (highlighted in Text Box 14), Lawrence Berkeley National Laboratory Map RE, Danish Technical University Global Wind Atlas, and the World Bank Group Global Solar Atlas. For other geospatial layers highlighted in the previous section, universities and government institutes that manage data and statistics can often provide census and land use data that are important for renewable energy planning and development.
Text Box 14. National Solar Resource Database The National Solar Resource Database (NSRDB) started as a collection of hourly solar measurements from 237 national weather station sites across the United States and in Guam and Puerto Rico. The database originally represented 30 years of solar and related meteorological data from these sites that were used to produce a full data set using the Meteorological-Statistical model. The NSRDB has been updated twice since its original publication, and today, fewer than 1% of the data points contain measured data values. Most of the data are modeled using a physics-based solar model. The NSRDB represents solar irradiance with meteorological data at 30-minute intervals with a temporal range spanning 1998–2015, including a typical meteorological year. The data are available at every 4 km x 4 km across most of the Western Hemisphere, totaling approximately 2 million pixels. The NSRDB is a public resource allowing anyone to visualize and download the data set to conduct their own detailed analysis. The NSRDB Data Viewer is available at https://maps.nrel.gov/nsrdb-viewer.
Sources: Wilcox 2012 and NREL 2017
Text Box 15. The Renewable Energy (RE) Explorer and the RE Data Explorer RE Explorer provides renewable energy data, analytical tools, and technical assistance to developers, policymakers, and decision-makers in developing countries. RE Explorer enables users to make meaningful decisions that support low-emission development and ultimately reduce greenhouse gas emissions. The RE Data Explorer is the RE Explorer’s flagship geospatial analysis tool for renewable energy development. The RE Data Explorer can inform prospecting, integrated planning, and policymaking to accelerate renewable energy deployment.
To access the RE Data Explorer tool and other resources on the RE Explorer website, visit www.re-explorer.org.

21 This report is available at no cost from the National Renewable Energy Laboratory at www.nrel.gov/publications.
Purchased Data When data are not publicly available or are inadequate, data can be purchased from various companies that create modeled resource data sets for some technologies. Prices vary based on size and geographic characteristics of the region, spatial and temporal resolution, and the need to make data publicly available. In addition, some institutions might have the ability to process solar and wind data sets from meteorological data sets. Universities, national laboratories, or statistical agencies are the most likely to have this capability; costs vary widely.
Proprietary Data For certain renewable energy analyses, especially grid integration studies that might include production cost and other grid modeling, power system data are necessary. These data might include information about the location and capacity of transmission lines, generators, demand, and tariffs. Often, utilities house these data, and sharing these data can violate security protocols. Nondisclosure agreements or joint modeling efforts might be needed to navigate security issues.
Metadata and Metadata Repositories Metadata is information about the quality of a data set, its source, restrictions on its use, and other necessary information relevant to the data (e.g., field units, description, and data vintage). A metadata repository is a database or catalogue of information about data sets and can assist users in finding data needed for analysis. For renewable energy analysis and decision-making, this information can be extremely useful because the work relies on many discrete data sets—including land use, census data, and power system data, all of which might be maintained by different entities.
Text Box 16 presents a recent publication from the World Bank that ties together some of the key data concepts presented in this section under a broader planning framework for resource assessment projects.
The next section, Section 4, links the data presented in this section to specific analyses that can inform key renewable energy decisions highlighted in Section 2. The analysis section provides a holistic view of how data, analysis, and decisions are connected to support renewable energy development.
Text Box 16. Undertaking a Renewable Energy Resource Assessment Project The World Bank describes several phases of resource mapping in their publication on Assessing and Mapping Renewable Energy Resources. The phases correspond to preliminary, validated, and observed data. A major message of the report is that a successful energy resource assessment project must be country-driven, relevant to the stakeholders involved, and iterative to produce robust resource assessments integrating all phases highlighted above.
Source: Energy Sector Management and Assistance Program 2016

22 This report is available at no cost from the National Renewable Energy Laboratory at www.nrel.gov/publications.
4 Analysis Renewable energy decisions can be informed by seven key analytical approaches using the geospatial data presented in the previous section. These analytical approaches are outlined below and described in detail in this section.
1. Early-stage mapping and visualization2. Generator performance modeling3. Technical potential analysis4. Supply curve modeling5. Economic potential analysis6. Capacity expansion modeling7. Production cost modeling.
In many cases, analyses build on one another to support decisions. Figure 7 illustrates how analysis building blocks can support various stages of renewable energy decision-making with implications related to both analytical complexity and data requirements. In the simplest case, only one type of analysis may be required to support decisions; whereas in the most complex cases several analysis building blocks may be required (e.g., production cost modeling includes several analysis building blocks, as presented in the graphic). Thus, analytical approaches used to support decisions can be very simple and have fewer data requirements or can be very complex and data-intensive. Countries or jurisdictions at a very early stage of renewable energy development might begin with a simple, high-level mapping of renewable energy resource availability or a technical potential analysis; whereas those at an advanced stage of renewable energy development will likely pursue more complex analyses, such as capacity expansion and production cost modeling, to support grid integration of higher penetrations of renewables. Progressing along the x-axis in Figure 7 shows a greater number of analytical building block requirements for more advanced RE decision-making. These examples and the figure show that decision-makers have many analytical options to support renewable energy development based on their level of data availability and renewable energy market development, among many other factors.

23 This report is available at no cost from the National Renewable Energy Laboratory at www.nrel.gov/publications.
Figure 7. Analysis building blocks to support renewable energy decisions
Building on Figure 7, Table 1 presents examples of decisions that can be supported by each of the analytical approaches covered in this section.

24 This report is available at no cost from the National Renewable Energy Laboratory at www.nrel.gov/publications.
Table 1. Examples of Renewable Energy Decisions Supported by Analytical Approaches
Target Setting Policymaking Power Sector Planning Investment Early-Stage Mapping and Visualization
• High-level view of resource availability in relation to geospatial constraints, such as protected areas and specific land use features
• High-level view of potential investment opportunities
Generator Performance Modeling
• Key input to analyses listed below
• Key input to analyses listed below
• Key input to analyses listed below
• Key input to analyses listed below
• Specific renewable energy project feasibility studies
Technical Potential Analysis
• Upper bound estimate renewable energy targets based on renewable energy resource availability as well as land use and environmental exclusions (and not including economic considerations)
• High-level renewable portfolio standards based on upper bound estimate renewable energy targetsa
• Land use policies that support renewable energy co-siting (e.g., wind development on agricultural lands)
• Early-stage analysis for various types of policies (e.g., to build early support among stakeholders for policy development), which can then feed into economic potential analysis and various other policies highlighted under economic potential
• Early-stage transmission planning based on technical feasibility
• Early-stage siting for REZ development based on technical potential
• Early-stage renewable energy investment prospecting for a region or utility-scale projects (not based on economic factors) that can feed into REZ development
• Early tools/approaches to attract investment interest to a region or country using technical potential visualizations and high-level analysis outputs
Supply Curve Modeling
• Key input to analyses listed below
• Key input to analyses listed below
• Key input to analyses listed below
• Key input to analyses listed below

25 This report is available at no cost from the National Renewable Energy Laboratory at www.nrel.gov/publications.
Target Setting Policymaking Power Sector Planning Investment Economic Potential Analysis
• Renewable energy targets based on technical potential and economic potential—including cost of energy, electricity price, and capacity value—to enable realistic target setting and cost-effectiveness of related policies
• Renewable portfolio standards • Competitive auctions and
economically feasible procurement targets
• Feed-in tariffs • Local or national renewable
energy tax incentives • Transmission planning (based on
levelized cost of energy [LCOE] and comparison to future wholesale power costs)
• Workforce development policies to support reduced operation and maintenance costs
• REZ based on resource potential, land use, cost of energy, electricity price, and capacity value
• REZ based on resource potential, land use, cost of energy, electricity price, and capacity value
Capacity Expansion and Production Cost Modeling8
• Detailed renewable energy targets taking into technical and economic potential as well as other complex considerations, such as opportunities for grid support and dispatch optimization
• Incentives for grid support capabilities, addressing congestion and vulnerability, aligning generation with demand, integration with dispatch optimization, and dispatchable resources9
• Analyses inform cost-effective renewable energy and nonrenewable energy siting for REZ, capital costs across the system, curtailment levels, generator ramps and plant load factors, reserve requirements, emissions and fuel consumption, and transmission system expansion and upgrades10
• Advanced-stage REZ can inform investment based on in-depth analysis
a Technical potential analysis can be combined with economic potential analysis to ensure cost-effectiveness of renewable portfolio standards and achievement of realistic targets.
8 These two types of analysis inform similar decisions. 9 See http://greeningthegrid.org/resources/copy2_of_GridintegrationstudiesFS.pdf. 10 See http://greeningthegrid.org/resources/copy2_of_GridintegrationstudiesFS.pdf.

26 This report is available at no cost from the National Renewable Energy Laboratory at www.nrel.gov/publications.
The following sections provide a high-level overview of the seven key analytical approaches as well as information on data requirements (best-in-class and minimum), processes for undertaking the analysis, decisions that can be supported with the analysis, and examples of tools and support resources for each analytical approach.
4.1 Connecting Analysis and Data with Decisions 4.1.1 Mapping and Visualization At a fundamental level, maps integrating various geospatial data highlighted in the last section are in and of themselves an analytical tool used for understanding complex phenomena and their spatial intersections. Mapping and visualization can play a role in the early stages of analysis through data exploration as well as later stages through the visualization of analytical outcomes.
Data Requirements and Process Maps can be either static or dynamic. Static maps generally try to convey a single topic—for example, providing insights on the complex interplay between manmade grid infrastructure and summarized (e.g., annual average) wind speed, or relative differences of solar irradiance across regions or countries. Figure 8 is a static map of the solar resource distribution across India showing major urban areas. This allows a viewer to gauge relative resource quality near potential energy consumers. Dynamic maps are generally web-based and are increasingly used to enhance understanding of complex spatial relationships. Dynamic maps allow users to interact with the data by turning on and off different data, zooming into regions or cities, access additional data fields, and, in some cases, execute targeted geospatial analysis. The National Renewable Energy Laboratory’s Renewable Energy Data Explorer is an example of a dynamic mapping tool (see Text Box 15). A dynamic map version of Figure 8 could include the ability to view the hourly solar resource pattern for a given area, visualize additional layers such as infrastructure and protected areas, and access or download all or part of the resource data.

27 This report is available at no cost from the National Renewable Energy Laboratory at www.nrel.gov/publications.
Figure 7. Static map of India solar resource distribution
Figure 8. Static map of India solar resource distribution
This static map shows a visual representation of the solar resource distribution near major urban areas in India, and it includes a quantitative summary by resource class.

28 This report is available at no cost from the National Renewable Energy Laboratory at www.nrel.gov/publications.
Best-in-Class Data • Resource data: Hourly temporal resolution with continuous spatial resolution
o Solar: ≤10 km2 nominal spatial resolution o Wind: ≤2 km2 nominal spatial resolution.
• Protected areas
• Urbanized areas/population density
• Natural features
• Monuments and parks
• Terrain and terrain features
• Land use/land cover
• Infrastructure
• Other known exclusions, constraints, and stakeholder concerns. Minimum Data Requirements Although it is always advisable to use the best-in-class data to conduct analysis, best-in-class data are not always available. In such cases, the following minimum data requirements can support renewable energy mapping and visualization:
• Annual average resource data
• Exclusions and constraints as available. Decisions
• Early-stage target setting: Simple mapping and visualization tools can support early-stage target setting for renewable energy through providing a high-level view of resource availability in relation to geospatial constraints, such as protected areas and specific land use features. These early-stage analyses can then be built upon through technical potential and other analyses as more data become available and/or as the renewable energy market matures in specific countries or jurisdictions.
• Various: Mapping can be coupled with many analytical areas to provide a user-friendly approach to present analytical outputs and inform various decisions. Often, the visual output is what makes analysis understandable to decision-makers and stakeholders. As an example, Figure 9 presents a visualization of potential PV electricity production in Cambodia combined with other layers to inform power sector planning, such as protected areas (green), power plant locations (blue dots), and transmission lines (gray lines).
• Figure 9. Example of simple data visualization for Cambodia to support initial high-level analysis

29 This report is available at no cost from the National Renewable Energy Laboratory at www.nrel.gov/publications.
Figure 9. Example of simple data visualization for Cambodia to support initial high-level analysis
Examples of Tools • IRENA Global Energy Atlas
• Lawrence Berkeley National Laboratory MapRE
• Renewable Energy Data Explorer
• World Bank Group Global Solar Atlas
• World Bank Group Global Wind Atlas.
4.1.2 Generator Performance Modeling In this paper, generator modeling refers to performance modeling that estimates the amount of energy that could be produced (generally on an annual basis) by a renewable energy system given the resource potential and system configuration (e.g., wind turbine or solar PV panel). Generator modeling plays a fundamental role in subsequent analysis because it provides the means of converting resource potential—such as wind speed into wind energy at varying time resolutions.

30 This report is available at no cost from the National Renewable Energy Laboratory at www.nrel.gov/publications.
Data Requirements and Process Data requirements vary depending on the type of generator being modeled. For wind technologies, typically wind speed, wind direction, air temperature, and air pressure at hub height (e.g., 80 m) are required. For solar technologies, typically direct normal irradiance, diffuse horizontal irradiance, air temperature, and wind speed are required. Temporal resolution requirements are generally hourly resolution or better; however, some existing models (e.g., RED-E, HOMER) can make use of monthly mean or annual resource to generate approximations. Spatial resolution requirements depend on the analysis application. For example, if conducting site suitability, a single measurement or modeled station would suffice. Most generator models are developed for such use cases and provide single user interfaces to accomplish the analysis; however, if conducting a regional technical potential or executing a capacity expansion model, continuous spatial coverage (gridded) ensures that the spatial variability of the generator potential is captured accurately. In these use cases, generator modeling requires custom programming and, in some cases, access to high-performance or supercomputers. In both cases, the use of as many years of resource data as possible helps account for possible performance bias given the natural occurrence of interannual variability of renewable resource.
Best-in-Class Data • Resource data: Hourly (or subhourly) renewable resource data:
o Solar: direct normal irradiance, diffuse horizontal irradiance, wind speed, and air temperature
o Wind (at hub height): wind speed, wind direction, air temperature, air pressure.
• System specifications: o Solar PV: fixed or tracking, tilt, azimuth, DC/AC ratio, inverter efficiency, system
losses o Wind: rated output, rotor diameter, hub height, shear coefficient, losses, and
power curve (with cut-in and cut-out speeds).
Minimum Data Requirements With recent advancements in renewable resource modeling, it is becoming much easier to find high-resolution data across the globe; however, this might not always be practical. In such cases, certain models (e.g., HOMER) can use monthly mean resource data rather than hourly resource data.
Decisions • Various: Generator modeling outputs can serve as a key analytical input for all
of analyses detailed here; therefore, generator modeling supports all the decision areas included in this document: target setting, policymaking, investment, and power sector planning. The ways in which generator modeling feeds into each of the analytical approaches that inform decisions are described in specific analysis sections below.
• Investment: As a stand-alone analysis, generator modeling can support prefeasibility, system analysis, and financial risk assessment studies to support specific renewable energy project development.

31 This report is available at no cost from the National Renewable Energy Laboratory at www.nrel.gov/publications.
Examples of Tools11 • Systems Advisor Model (SAM)
• PVSyst
• HOMER
• Windographer.
4.1.3 Technical Potential Analysis Renewable energy technical potential represents the achievable energy capacity and generation of a particular technology given the resource potential, system performance, topographic limitations, environmental constraints, and land use constraints. Through technical potential analysis, data covered in the last section can be used to evaluate opportunities for renewable energy deployment as well as potential impacts, trade-offs, synergies, and barriers. Technical potential analysis provides an upper bound of renewable energy deployment within a region or country and serves as a fundamental input into many other analyses, including supply curve modeling, economic potential, capacity expansion, and production cost modeling—all of which are described here.
Data Requirements and Process Technical potential analysis is generally executed in three steps: technical exclusions, generator modeling, and merging the previous two steps. Technical exclusions refer to the activity of identifying constraint layers. These constraint layers represent areas that are deemed undevelopable by domain or land use experts. Constraints might also be developed through stakeholder engagement, whereby the development, or lack thereof, of renewable energy on specific lands is evaluated. For example, habitat of the greater sage grouse has been excluded for future wind development in the Western United States.12 In some countries, agricultural lands are protected from development; yet in the United States, wind development on rural agricultural lands is common. These constraint layers are combined using spatial overlays to produce a single technical exclusion layer. The area of the remaining parcels can then be calculated.
The second step in the technical potential analysis is system modeling. System modeling first requires a specific system or systems to be defined. For example, if modeling a PV system, technical potential analysis requires power density (thus, nameplate capacity), rated inverter size, and tracking and/or tilt angle specifications. These assumptions are then input into a generator model, such as the System Advisor Model, and combined with the temporal resource data to estimate the generator capacity factor. The resulting capacity factor(s) and power density values are mapped to the resulting available lands from the technical exclusions to produce spatially resolved available land area, capacity, and generation estimates for the designed system. Typically, the results are aggregated to regions or states for presentation purposes.
The data requirements for technical potential analysis can be categorized as either resources or exclusions. Resources refer to the theoretical resource potential (e.g., wind speed or solar irradiance). Exclusions refer to technical exclusions (e.g., water bodies), perceived barriers (e.g., 11 Several commercial and free generator modeling software tools are available. The list is not exhaustive. 12 Conservation efforts such as these have helped sage grouse populations recover, and the species are no longer eligible for protection under the endangered species act (U.S. Fish and Wildlife Service 2016).

32 This report is available at no cost from the National Renewable Energy Laboratory at www.nrel.gov/publications.
threatened or endangered wildlife species habitat), or stakeholder constraints (e.g., public acceptance).
Of significant importance to technical potential analysis is the simulation of the renewable energy generator performance and thus a land parcel’s potential for producing energy from a renewable energy technology. To achieve this, high temporal resolution resource data are required (generally hourly). Likewise, high spatial resolution data are considered best-in-class because they capture the natural spatial variability inherent in the renewable resource. To account for the naturally occurring interannual variability of a renewable energy resource, it is important to have many years of data or a representative TMY.
Best-in-Class Data • Hourly temporal resolution with continuous spatial resolution resource for renewable
energy generator modeling: o Solar: ≤10 km2 nominal spatial resolution o Wind: ≤2 km2 nominal spatial resolution.
• Protected areas
• Urbanized areas/population density
• Natural features
• Monuments and parks
• Terrain and terrain features
• Land use/land cover
• Other known exclusions, constraints, and stakeholder concerns. Minimum Data Requirements If best-in-class data are not available, the following minimum data requirements can support technical potential analysis:
• Annual average resource can be used to generate a rough estimate of renewable energy generator performance (some technologies excluded).
• Exclusions and constraints as available.
Decisions • Early-stage target setting: Technical potential analysis can allow policymakers to
develop early-stage targets for renewable energy that can be further refined throughout time through more rigorous analysis (and associated data requirements), which are described in the following sections. Renewable energy targets can be formulated in relation to resource potential, system performance, topographic limitations, environmental constraints, and land use constraints. As renewable energy markets expand and renewable energy penetration levels increase, it is often necessary to perform more rigorous analysis (e.g., economic potential analysis, capacity expansion modeling) to further develop targets in relation to grid integration and other considerations. Analyses

33 This report is available at no cost from the National Renewable Energy Laboratory at www.nrel.gov/publications.
that build on technical potential analysis will allow renewable energy targets to be more realistic in terms of potential deployment level.
• Policymaking: Technical potential analysis can serve as a starting point for developing renewable energy policies, often complemented by economic potential analysis. As noted above, technical potential analysis can be most useful for setting renewable energy targets that can then inform renewable portfolio standards and similar policies. Technical potential analysis can also inform policies related to land use planning, such as co-siting renewable energy on agricultural lands and developing permitting and other approaches to facilitate co-siting.
• Investment: Technical potential analysis can support the development of REZs together with economic potential analysis. (REZs are described in Section 2.3 of this paper.) Technical potential analysis can inform the initial development of REZs based on resource availability and other geospatial considerations, whereas economic potential analysis can allow for more robust REZ development that also accounts for key economic factors such as levelized cost of energy (LCOE) for specific technologies.
• Power sector planning: Technical potential analysis serves as a key analytical input for power sector modeling through capacity expansion models or production cost models. In addition, technical potential analysis can support early stage transmission planning and siting for REZ.
Examples of Tools Various tools provide out-of-the-box capabilities for executing a technical potential analysis. This section describes examples of tools. Many other tools enable knowledgeable practitioners to conduct technical potential analysis, including open-source and proprietary GIS software (e.g., QGIS and ArcGIS):
• Renewable Energy Data Explorer
• Renewable Energy Potential (reV) model
• Lawrence Berkley National Laboratory MapRE (ArcGIS Tools). 4.1.4 Supply Curve Modeling A renewable energy supply curve shows the relationship between renewable energy capacity and cost across a geographic region. Supply curves bring together technical potential, interconnection/delivery cost, energy production cost, and regional competition as inputs to the analysis. A supply curve analysis can be used to examine the cost trade-offs between developing a lower quality resource (lower capacity factor) closer to demand centers compared to higher quality resource (higher capacity factor) that might be farther away. Such trade-offs are an integral element of economic potential, capacity expansion, and production cost modeling.
Data Requirements and Process Supply curve modeling builds on the outputs of a technical potential analysis, specifically the available parcels of land, capacity, and system performance on the parcel of land. These outputs are combined with several financial inputs that can be divided into two parts: site-based LCOE and transmission interconnection cost. Site-based LCOE accounts for the quality of the renewable energy resource and applies a financial model or method to determine the LCOE. The

34 This report is available at no cost from the National Renewable Energy Laboratory at www.nrel.gov/publications.
following sections present data required for a fixed-charge-rate financial model; however, many other financial models have varying input requirements. The site-based LCOE and the grid connection cost are then combined to produce a total site LCOE for each parcel of land, each also having a developable capacity. The grid connection cost can be calculated to reach the nearest grid infrastructure, or they can compete for access to a capacity-limited transmission infrastructure. Competition based on total cost allows the cost trade-off between resource quality and distance to infrastructure to be assessed—parcels with the lowest total cost will use the available transmission infrastructure capacity first. As the infrastructure capacity is allocated to the lowest cost parcels, the remaining parcels must build longer lines to reach grid infrastructure with some remaining capacity, which increases the total cost for the parcel. This results in the identification of the lowest total cost resource within proximity to existing infrastructure. These results can be represented graphically as a supply curve using the assigned cost and capacity for each parcel, as shown in Figure 10. The supply curve can be further subdivided to separate different geographical areas or resource classes. Figure 10 also shows the supply curve linked to a geographic location.
Figure 10. The supply curve graph shows cumulative capacity and associated cost of energy at specific locations.
Best-in-Class Data • Technical potential analysis results:
o Land parcelo Capacity
• Generator performance (capacity factor): electric transmission infrastructure
• Distance to electric transmission infrastructure

35 This report is available at no cost from the National Renewable Energy Laboratory at www.nrel.gov/publications.
• Capacity of individual infrastructure features
• Economic inputs
• Transmission interconnection cost
• Substation tie-in cost
• Transmission capital cost
• Fixed charge rate
• Site-based LCOE
• Capital cost
• Fixed operating cost.
Minimum Data Requirements Access to high-resolution resource data can be a challenge. In addition, electric transmission infrastructure data are not always available or can be expensive; however, there are approaches that enable the analysis and lead to a better understanding of renewable energy potential. If high-temporal resolution resource data are lacking, annual average data can be used to get a general sense of generator performance. In addition, open-source data sets can be used to fill gaps when needed—for example, OpenStreetMap has electric transmission infrastructure spatial data that are free and open to the public, for example.
Decisions Because supply curves represent the regional supply of renewable energy at a certain energy cost, they can feed into all decision areas to support renewable energy development as highlighted in this paper. In particular, supply curves can support the development of more robust renewable energy targets, building on technical potential analysis and feeding into target setting, policymaking, investment, and grid integration decisions as key inputs to the types of analyses described here.
Example of Tools Supply curve modeling is generally performed by custom onetime analysis; however, the following two tools enable a robust assessment of supply curves through complex modeling frameworks:
• Renewable Energy Potential Model (reV)
• Lawrence Berkeley National Lab MapRE..
4.1.5 Economic Potential Analysis Economic potential is one measure of renewable capacity and generation potential. It is defined as the subset of the available resource technical potential in which the cost required to generate electricity (which determines the minimum revenue requirements for development of the resource) is less than the revenue available in terms of displaced energy and displaced capacity. Economic potential analysis builds on technical potential analysis, presented in Section 4.1.3. Figure 11 shows key assumptions used for economic potential analysis, building on resource and technical potential.

36 This report is available at no cost from the National Renewable Energy Laboratory at www.nrel.gov/publications.
Source: Lopez 2012
Figure 11. Key assumptions of resource, technical, economic and market potential for renewable energy
Data Requirements and Process Economic potential as described in this paper is a subset of available technical potential: Economic potential considers further the economic viability of a renewable energy technology by comparing its development cost to current or future energy options. Economic potential builds on the assumptions and outputs of generator modeling, technical potential, and supply curve modeling. Specifically, supply curve modeling results in spatially resolved LCOE. The LCOE might include additional factors applied to account for the declining value of renewable energy as well as any existing tax incentives to produce an adjusted LCOE. That adjusted LCOE is then spatially combined with the levelized avoided cost of energy. The levelized avoided cost of energy represents the marginal generation price as well as a capacity value estimate and the value of avoided emissions. LCOE is subtracted from the levelized avoided cost of energy to provide a net value for each parcel. If a parcel has a positive net value, it meets the economic potential threshold. The values for the economic parcels are then summed by their technical potential to produce an economic potential estimate.
Best-in-Class Data • Technical potential analysis results
• Supply curve modeling resultso Declining value of renewable energyo Existing tax incentives.
• Marginal generation price
• Capacity value
• Value of avoided emissions.

37 This report is available at no cost from the National Renewable Energy Laboratory at www.nrel.gov/publications.
Minimum Data Requirements Technical potential and supply curve modeling results are generally required to perform an economic potential analysis. Spatially resolved marginal generator prices and value of avoided emissions are usually required, but these might exist only at the national level. In such cases, it is still reasonable to conduct an economic potential analysis.
Decisions That Can Be Supported with Economic Potential Analysis • Target setting: Economic potential analysis can build on technical potential analysis to
support the development of more robust renewable energy targets through integrating outputs from technical potential analysis and supply curve modeling. In particular, economic potential analysis allows for the declining value of renewable energy and existing tax incentives to produce an adjusted LCOE that can inform the development of renewable energy targets and account for these key economic factors.
• Policymaking: Economic potential analysis can inform the development of renewable energy policies, such as renewable portfolio standards (building on renewable energy targets). Analysis of the quantity of resource that is less than the economic threshold can help inform incentive development that would push resource areas to become economic.
• Investment: Together with technical potential analysis, economic potential analysis can support the development of REZs that accounts for key economic factors (e.g., adjusted LCOE). REZs are described in Section 2.4.
Examples of Tools Economic potential analysis capability is being developed within the RED-E platform for ASEAN countries, India and Mexico. Research analysts generally perform economic potential analysis on a case-by-case basis. For more information on performing an economic potential analysis, see www.nrel.gov/gis/re_econ_potential.html.
4.1.6 Capacity Expansion Modeling Capacity expansion modeling is used to analyze and plan for long-term electricity system expansion that includes power generation technologies and transmission infrastructure. Capacity expansion modeling moves beyond economic potential modeling to analyze market potential, choosing among competing economic energy options within the operational constraints of the grid system. Capacity expansion modeling integrates hourly profiles developed through generator modeling and supply curves to produce scenarios for electricity expansion. These scenarios can inform operational and infrastructure decisions for the power sector. Capacity expansion modeling can also feed into production cost modeling to further resolve generation and transmission requirements and verify and provide additional details on operational decisions.
Data Requirements and Process Capacity expansion models rely heavily on detailed generator modeling, technical potential, and, ultimately, supply curve modeling. Detailed generator models provide time-series power profiles; whereas technical potential analysis, together with detailed supply curves, provides the available supply of renewable energy at different costs. These outputs are then included in the capacity expansion model at the highest spatial resolution the model can handle. Often, the regional structure can limit the spatial detail, so care is taken to summarize and preserve the

38 This report is available at no cost from the National Renewable Energy Laboratory at www.nrel.gov/publications.
spatial and temporal characteristics. Although it is beyond the scope of this paper, Eurek et al. (2016) provide further details on the process and data requirements for capacity expansion models. Capacity expansion models require a significant amount of data that is not covered in this document because the document focuses on geospatial aspects of this and other types of analysis. Data requirements for capacity expansion models included in this paper focus primarily on data and analyses previously highlighted (i.e., generator modeling, technical potential analysis, and supply curve modeling) that feed into capacity expansion modeling.
Best-in-Class Data • Hourly generator profiles
• Technical potential analysis results
• Supply curve modeling results. Decisions
• Advanced renewable energy targets: Capacity expansion models can enable the development of advanced renewable energy targets that account for generator modeling outputs, technical potential, and supply curves to provide a robust view of renewable energy potential. In particular, capacity expansion modeling can allow policymakers and planners to “identify where, when, how much, and what types of infrastructure (generation and/or transmission) would achieve [variable renewable energy] targets at least cost, taking into consideration factors such as new policies, technological advancement, fuel prices, and demand projections” (Katz and Chernyakhovskiy 2016).
• Policymaking: In addition to the previous policies noted, capacity expansion models can support the development of specific grid integration policies and actions that can inform operational and infrastructure decisions for the power sector. Many of these actions are included in the power sector planning description.
• Investment: Rigorous power sector planning, as described below, can provide a strong signal to investors in relation to renewable energy development and feed into more specific investment planning approaches, such as REZs.
• Power sector planning: Building on the previously described analysis, capacity expansion models are crucial for power sector planning. Capacity expansion models are used to assess and optimize generation and/or transmission portfolios at the least cost and in relation to physical constraints. This modeling can allow for improvements to system planning and forecasting, enable system flexibility while reducing reserve requirements and inform transmission investments and options for variability reduction through expanding system integration. More broadly, the modeling outputs can allow planners and policymakers to develop market rules that allow for a flexible power system that efficiently integrates renewable energy (Milligan and Katz 2016).
Examples of Tools • Resource Planning Model (RPM)
• Regional Energy Deployment System (ReEDS)
• PLEXOS-LT.

39 This report is available at no cost from the National Renewable Energy Laboratory at www.nrel.gov/publications.
4.1.7 Production Cost Modeling Energy supply and demand resources are optimized in relation to demand during a specified period of time using production cost models. These analyses also consider costs and constraints related to power generation systems, operations, and physical environment. Production cost modeling provides a robust analytical tool to consider the impacts of variable renewable energy on the operational costs of a power system. Production cost modeling can be coupled with capacity expansion modeling to further resolve transmission and generation needs and inform more detailed grid planning and operational decisions based on outputs (Katz and Chernyakhovskiy 2016).13
Data Requirements and Process As with capacity expansion modeling, details of the process and exhaustive data requirements for production cost modeling are beyond the scope of this document. Outlined here are data requirements as they relate to the previous analysis topics. For a detailed description of production cost modeling, see Lew et al. (2013).
Best-in-Class Data • Capacity expansion scenario results: Generally, they inform the supply of renewable
energy on a nodal basis, but they are not always necessary. In such cases, independent geospatial analysis is used to determine nodal supply.
• Hourly to subhourly (5-min) generator power profiles
• Load data matching generator profile temporal interval. Decisions That Can Be Supported with Production Cost Modeling Decisions that can be supported with production cost modeling are very similar to those for capacity expansion modeling. Importantly, production cost modeling can build on capacity expansion modeling to support more detailed analysis and decisions related to operation of the grid.
Examples of Tools • PLEXOS
• GridView.
13 Power flow modeling is another type of analysis that requires renewable energy resource data. Power flow simulations analyze the electricity grid during normal, steady-state operation and assess the system’s capability to recover after a disturbance. Specific data requirements for power flow modeling are beyond the scope of this document. See Frank and Rebennack (2016) for a comprehensive introduction to power flow analysis.

40 This report is available at no cost from the National Renewable Energy Laboratory at www.nrel.gov/publications.
5 Summary Geospatial data and analysis are critical to enabling renewable energy decisions and overcoming barriers to clean energy deployment. Diverse stakeholders use data and analysis to inform decisions related to setting targets, policies, investment, and grid integration. Further, data- and evidence-driven decisions help make markets transparent and fair for all actors.
This guide provides an overview of geospatial data and analysis to support renewable energy decisions in four areas: target setting, policymaking, investment, and power sector planning. In addition, links among data, analysis, and decisions are highlighted to provide perspective on decision-making at various stages of renewable energy development. These links also shed light on the complexity of and data needs for different types of analysis and decisions. Equipped with this information, decision-makers can support increased renewable energy deployment within the context of specific country and jurisdictional circumstances.

41 This report is available at no cost from the National Renewable Energy Laboratory at www.nrel.gov/publications.
6 References Barrows, C., J. Katz, J. Cochran, G. Mclaurin, M. Marollano, M. Gabis, N. Reyes, K. Muñoz, C. De Jesus, N. Asedillo, J. Binayug, H. Cubangbang, R. Reyes, J. de la Viña, E. Olmedo, and J. Leisch. 2018. Greening the Grid: Solar and Wind Grid Integration Study for the Luzon-Visayas System of the Philippines (Technical Report NREL/TP-6A20-68594). Golden, CO: National Renewable Energy Laboratory. https://www.nrel.gov/docs/fy18osti/68594.pdf
Couture, Toby D., David Jacobs, Wilson Rickerson, and Victoria Healey. 2015. The Next Generation of Renewable Electricity Policy: How Rapid Change Is Breaking Down Conventional Policy Categories (Technical Report NREL/TP-7A40-63149). Golden, CO: National Renewable Energy Laboratory. https://www.nrel.gov/docs/fy15osti/63149.pdf.
Deshmukh, Ranjit, and Grace Wu. 2016. MapRE GIS Tools & Data (MapRE). United States. http://www.osti.gov/scitech/servlets/purl/1312792.
Energy Sector Management and Assistance Program. 2016. Assessing and Mapping Renewable Energy Resources (Technical Report Knowledge Series 025/16). Washington, D.C.: The World Bank. http://documents.worldbank.org/curated/en/317661469501375609/pdf/107219-ESM-P131926-PUBLIC.pdf.
Enhancing Capacity for Low-Emission Development Strategies. 2017. “Bangladesh.” https://www.ec-leds.org/countries/bangladesh.
Environmental System Research Institute. 2008. “Discrete and Continuous Data.” Last modified September 22. http://webhelp.esri.com/arcgisdesktop/9.2/index.cfm?TopicName=Discrete_and_continuous_data.
Environmental System Research Institute. 2016. “What Is Raster Data?” http://desktop.arcgis.com/en/arcmap/10.3/manage-data/raster-and-images/what-is-raster-data.htm.
Eurek, Kelly, Wesley Cole, David Bielen, Nate Blair, Stuart Cohen, Bethany Frew, Jonathan Ho, Venkat Krishnan, Trieu Mai, Benjamin Sigrin, and Daniel Steinberg. 2016. Regional Energy Deployment System (ReEDS) Model Documentation: Version 2016 (Technical Report NREL/TP-6A20-67067). Golden, CO: National Renewable Energy Laboratory. http://www.nrel.gov/docs/fy17osti/67067.pdf.
Frank, Stephen, and Steffen Rebennack. 2016. “An Introduction to Optimal Power Flow: Theory, Formulation, and Examples.” IIE Transactions 48 (12): 1,172–1,197.
Global Solar Atlas, a free, web-based application developed by SolarGIS with the World Bank Group, with funding provided by the Energy Sector Management Assistance Program (ESMAP). For future information: http://globalsolaratlas.info/.
Global Wind Atlas 2.0, a free, web-based application developed, owned and operated by the Technical University of Denmark (DTU) in partnership with the World Bank Group, utilizing

42 This report is available at no cost from the National Renewable Energy Laboratory at www.nrel.gov/publications.
data provided by Vortex, with funding provided by the Energy Sector Management Assistance Program (ESMAP). For future information: https://globalwindatlas.info.
Greening the Grid. 2015. “Glossary.” http://greeningthegrid.org/resources/glossary/glossary/greening-the-grid-glossary-pdf/at_download/file.
Greening the Grid. 2017. “Integration in Depth.” Accessed June 13, 2017. http://greeningthegrid.org/integration-in-depth.
Katz, Jessica, and Ilya Chernyakhovskiy. 2016. Grid Integration Studies: Advancing Clean Energy Planning and Deployment (Technical Report NREL/TP-6A20-66504). Golden, CO: National Renewable Energy Laboratory. http://www.nrel.gov/docs/fy16osti/66504.pdf.
Katz, Jessica. 2015. “Grid Integration Studies: Data Requirements (NREL/FS-6A20-63043).” Golden, CO: National Renewable Energy Laboratory. http://www.nrel.gov/docs/fy15osti/63043.pdf.
Lew, Debra, Greg Brinkman, Eduardo Ibanez, Anthony Florita, Michael Heaney, Bri-Mathias Hodge, Marissa Hummon, Greg Stark, Jack King, Steven A. Lefton, Nikhil Kumar, Dwight Agan, Gary Jordan, and Sundar Venkataraman. 2013. Western Wind and Solar Integration Study Phase 2 (NREL/TP-5500-55588). Golden, CO: National Renewable Energy Laboratory. http://www.nrel.gov/docs/fy13osti/55588.pdf.
A. Lopez, B. Roberts, D. Heimiller, N. Blair, G. Porro. 2012. U.S. Renewable Energy Technical Potentials: A GIS-Based Analysis. (NREL/TP-6A20-51946). https://www.nrel.gov/docs/fy12osti/51946.pdf.
Miller, M., L. Bird, J. Cochran, M. Milligan, M. Bazilian, E. Denny, J. Dillon, J. Bialek, M. O’Malley, and K. Neuhoff. 2013. RES-E-NEXT: Next Generation of RES-E Policy Instruments (Technical Report NREL/TP-6A20-58882). International Energy Agency Renewable Energy Technology Deployment. http://iea-retd.org/wp-content/uploads/2013/07/RES-E-NEXT_IEA-RETD_2013.pdf.
Milligan, Michael, and Jessica Katz. 2016. The Evolution of Power System Planning with High Levels of Variable Renewable Generation (Technical Report NREL/TP-6A20-63035). Golden, CO: National Renewable Energy Laboratory. http://www.nrel.gov/docs/fy16osti/63035.pdf.
National Aeronautics and Space Administration Jet Propulsion Laboratory. 2014. “U.S. Releases Enhanced Shuttle Land Elevation Data.” September 23, 2014. https://www.jpl.nasa.gov/news/news.php?release=2014-321.
National Aeronautics and Space Administration Surface meteorology and Solar Energy (SSE). 2008. Release 6.0 Data Set. http://eosweb.larc.nasa.gov/sse/.
National Renewable Energy Laboratory. 1992. Shining On: A Primer on Solar Radiation (Technical Report NREL/TP-463-4856.). Golden, CO: National Renewable Energy Laboratory. http://www.nrel.gov/docs/legosti/old/4856.pdf.
43 This report is available at no cost from the National Renewable Energy Laboratory at www.nrel.gov/publications.
National Renewable Energy Laboratory. 2016. India Solar Resource Data. (Fact Sheet NREL/FS-7A40-66070.) Golden, CO: National Renewable Energy Laboratory. https://www.nrel.gov/docs/fy16osti/66070.pdf
National Renewable Energy Laboratory. 2017. “National Solar Radiation Data Base.” Accessed June 13, 2017. http://rredc.nrel.gov/solar/old_data/nsrdb/.
Renewable Energy Policy Network for the 21st Century. 2017. Renewables 2017 Global Status Report. Paris: REN21 Secretariat. http://www.ren21.net/wp-content/uploads/2017/06/17-8399_GSR_2017_Full_Report_0621_Opt.pdf.
U.S. Fish and Wildlife Service. 2016. “Great Sage-Grouse.” Last modified June 17. https://www.fws.gov/greatersagegrouse.
Vaisala. 2017. “What is Global Horizontal Irradiance?” Accessed June 13, 2017. http://www.3tier.com/en/support/solar-prospecting-tools/what-global-horizontal-irradiance-solar-prospecting/.
Wilcox, Stephen, and W. Marion. 2008. Users Manual for TMY3 Data Sets (Technical Report NREL/TP-581-43156). Golden, CO: National Renewable Energy Laboratory. http://www.nrel.gov/docs/fy08osti/43156.pdf.
Wilcox, Stephen. 2012. National Solar Radiation Database 1991–2010 Update: User’s Manual (Technical Report NREL/TP-5500-54824). Golden, CO: National Renewable Energy Laboratory. http://www.nrel.gov/docs/fy12osti/54824.pdf.

44 This report is available at no cost from the National Renewable Energy Laboratory at www.nrel.gov/publications.
Appendix: Key Geospatial Data Sets to Inform Renewable Energy Decisions Geospatial data that are useful for running the analyses detailed in this report can be collected from numerous sources. In recent years, many organizations have published as much data as possible; therefore, finding geospatial data to assist in renewable energy analyses has become less challenging. Innovations have also been made recently in extremely large data sets (sometimes referred to as “big data”) that allow researchers to download and use the information even if they have limited data storage and analysis resources.
Governmental and nongovernmental organizations, academia and universities, and other organizations often house global data sets on their websites. Some of the most useful data, however, need to be collected from local organizations for a specific area or focus. If possible, working with local groups to collect geospatial data can yield some of the most detailed and accurate data.
When considering geospatial data, generally two types of data are most often encountered: discrete and continuous data. Text Box 17 describes these.
Spatiotemporal data sets overlap with discrete and continuous data, but the data contain an additional dimension of time. The term spatiotemporal reflects the spatial and time aspect of the data. Many of the data examples listed here do not have a time dimension, meaning that the data are current only for a single moment in time. Spatiotemporal data give researchers the option to analyze changes in data over a surface as well as changes in data throughout time. For every time slice, the size of the spatial component of the data effectively doubles, meaning that spatiotemporal data can be extremely large, requiring sizable storage and innovative ways to transfer data through web interfaces.

45 This report is available at no cost from the National Renewable Energy Laboratory at www.nrel.gov/publications.
Following are explanations and examples of discrete and continuous data that are useful for geospatial renewable energy analysis.
Meteorological • Description: Features that describe weather and climate states. Depending on the source,
these data can be either discrete or continuous. If the data are specifically developed formeasuring renewable energy, researchers tend to combine the numerous useful metricsinto one data set.
• Examples of data sets:o Air and water temperatureo Precipitationo Wind speedo Solar insolation.
• Examples of sources:o National Renewable Energy Laboratory National Solar Resource Databaseo Global Historical Climatology Networko National Weather Service.
Text Box 17. Discrete and Continuous Geospatial Data Geospatial data can generally be categorized as either discrete (vector) or continuous. Discrete data include information on precise places and definable boundaries that mark the beginning and end of a feature. Roads, rivers, parks, and transmission lines can be categorized as discrete data. Continuous data, on the other hand, show varying degrees of a certain attribute over a surface. Elevation, slope, distance to nearest roads, and renewable energy-related data—such as direct normal irradiance, global horizontal irradiance, and wind speed—are examples of continuous data. Spatiotemporal data sets can be either discrete or continuous, but the data also include a time dimension.
Discrete Continuous
Source: Environmental System Research Institute (2008)

46 This report is available at no cost from the National Renewable Energy Laboratory at www.nrel.gov/publications.
Electric Grid • Description: Objects that identify locations and attributes of electric power systems and
grid features. Data in this area help identify where transmission or distribution lines exist, along with other features that would be required to integrate new renewable energy projects onto the grid.
• Examples of data sets: o Transmission lines o Transmission towers o Substations o Pipelines o Utility balancing authority areas.
• Examples of sources: o Homeland Infrastructure Foundation-Level Data o OpenStreetMap o Local electric utilities generally have the most accurate data, but the data are
typically restricted from public access.
Infrastructure • Description: Manmade features related to the development of the natural environment.
Like electric grid data, data in this area help inform the existence of roadways or other manmade features that would make renewable energy development less costly, depending on the proximity of the infrastructure to new renewable energy developments.
• Examples of data sets: o Roads o Bridges o Railways o Airports.
• Examples of sources: o OpenStreetMap o Homeland Infrastructure Foundation-Level Data infrastructure o Local developer and urban planning groups likely have data in this area.
Hazards • Description: Objects that identify environmental and other threats to the electric grid,
people, urban areas, etc. Threats to the grid, new renewable energy projects, and load centers can impact the cost and risk of new developments.

47 This report is available at no cost from the National Renewable Energy Laboratory at www.nrel.gov/publications.
• Examples of data sets: o Landslide occurrence and likelihood o Floodplain o Volcanoes o Fires o Earthquakes.
• Examples of sources: o United Nations Environment Program Global Risk Data Platform o Local organizations also likely track these kinds of threats.
Land Use • Description: The numerous ways a single area of land is used by animals, humans, or
even nature in general can help determine the feasibility of developing a parcel of land. Land use data sets tend to be continuous, but they can be discrete depending on the source.
• Examples of data sets: o Croplands o Livestock grazing fields o Breeding grounds o State-protected parks.
• Examples of sources: o National Aeronautics and Space Administration MODIS o European Space Agency GlobCover o Land use can often be determined by working with local organizations because
remotely sensed data (or data recorded by a satellite) cannot determine the multitude of ways a parcel of land is used by varying entities.
• Additional notes: Higher resolution data help inform significant differentiation between land use types in an area.
Land Cover • Description: Land cover data sets are generally derived from remote-sensing sources,
and they are similar to land use data. Land cover data are unique from land use data because the data show the type of environment for a given parcel of land, not necessarily how that land is used. Different land environments can impact renewable energy developments in different ways.
• Examples of data sets: o Urban areas o Forests

48 This report is available at no cost from the National Renewable Energy Laboratory at www.nrel.gov/publications.
o Wetlands o Water bodies o Roadways.
• Examples of sources: o National Aeronautics and Space Administration MODIS o European Space Agency GlobCover.
• Additional notes: The resolution of this data set impacts its accuracy and usefulness, similar to land use resolution data.
Environmentally Sensitive/Protected Areas • Description: Locations that are fully or partially restrictive for development because of
environmental factors.
• Examples of data sets: o Wildlife habitats o General protected areas o Endangered species o State or federally protected lands.
• Examples of sources: o Protected Planet/World Database on Protected Areas o International Union for Conservation of Nature Red List of Threatened Species o U.S. Bureau of Land Management Areas of Critical Environmental Concern.
Land Ownership • Description: When considering areas of land for development, understanding which
entities own the land can inform cost (for land development) and other developmental considerations. Land that has favorable conditions for renewable energy development might be owned by individual homeowners, state, or federal agencies. This needs to be considered when developing analysis models.
• Examples of data sets: o Federally owned lands o State-owned lands o Homeowner parcels.
• Examples of sources: o ArcGIS USA Federal Lands o Homeland Infrastructure Foundation-Level Data federal lands o State government websites.

49 This report is available at no cost from the National Renewable Energy Laboratory at www.nrel.gov/publications.
Digital Elevation Models • Description: A digital elevation model is a continuous data set showing land elevation
change over a surface. These data sets are almost always in raster14 formats, and they can be used to derive useful products through simple analysis and processing.
• Examples of data sets: o Elevation o Slope o Hill shade o Aspect o Roughness.
• Examples of sources: o National Aeronautics and Space Administration Aster o Shuttle Radar Topography Mission o Lidar.
• Additional notes: The resolution of data sets is important when considering elevation because the higher the resolution, the more accurate the measurement will be to the actual location on the surface of the Earth. Higher resolution data sets require more storage space and could require more advanced processing techniques if the entire data set cannot be read into memory all at once.
Population Density and Urban Extents • Description: When preparing analyses for renewable energy, it is important to consider
proximity to areas that have a high population density (load centers) as well as areas that have a sparse population.
• Examples of data sets: o Population density o Population count o Urban area extent.
• Examples of sources: o Socioeconomic Data and Applications Center o LandScan Global Ambient Population o ArcGIS Global Urban Extents.
14 “In its simplest form, a raster consists of a matrix of cells (or pixels) organized into rows and columns (or a grid) where each cell contains a value representing information, such as temperature. Rasters are digital aerial photographs, imagery from satellites, digital pictures, or even scanned maps” (Environmental System Research Institute 2016).

50 This report is available at no cost from the National Renewable Energy Laboratory at www.nrel.gov/publications.
Census • Description: Similar to population density data sets, census data can help inform
population and demographic questions related to renewable energy development. Census data also allow for the mapping of urban areas, military installations, or other administrative boundaries.
• Examples of data sets: o Metropolitan division o Population o Primary roads o Military installations.
• Examples of sources: o U.S. Census Bureau o National Historical Geographic Information System.
Geologic and Soils • Description: Geologic and soils data can help inform the cost for development as well as
find valuable areas of land for geothermal energy exploration. Soils data can also help determine the possibility of soiling issues of photovoltaic panels in a given area of land.
• Examples of data sets: o Global or regional soils o Global or regional geology.
• Examples of sources: o International Soil Reference and Information Centre World Soils Information o U.S. Geological Survey.
Administrative Areas • Description: Administrative boundaries can cover a large group of geospatial data useful
for renewable energy analysis. Boundaries can include national boundaries, province, state, country, or subcounty boundaries. Boundaries can also include census areas or urban areas in addition to utility, interconnection, and balancing authority areas.
• Examples of data sets: o Global state, province, and county administrative areas o Interconnection and balancing authority areas o Congressional districts o Census.

51 This report is available at no cost from the National Renewable Energy Laboratory at www.nrel.gov/publications.
• Examples of sources: o Global Administrative Areas o S&P Global Platts.
National Development Goals and Concerns • Description: Individual countries have issues related to electrification, poverty, areas
being used for farming or other croplands, etc. Upon occasion, the development of renewable energy resources will impact other development goals, which requires considering the costs and benefits of developing new renewable energy resources.
• Examples of data sets: o Electrification rates o Poverty rates o Vulnerable communities o Croplands o Areas of conflict.
• Examples of sources: o Local organizations are likely the best source for collecting these data.

United States Agency for International Development
1300 Pennsylvania Avenue NW Washington, DC 20523
+1-202-712-0000 • www.usaid.gov
National Renewable Energy Laboratory
15013 Denver West Parkway
Golden, CO 80401
+1-303-275-3000 • www.nrel.gov
NREL is a national laboratory of the U.S. Department of Energy, Office of Energy Efficiency & Renewable Energy, operated by the Alliance for Sustainable Energy, LLC.
NREL/TP-6A20-68913 • March 2018
CONTACTS
Jennifer E. Leisch, Ph.D. USAID-NREL Partnership Manager U.S. Agency for International Development Tel: +1-303-913-0103 Email: [email protected]
Sadie Cox National Renewable Energy Laboratory Tel: +1-303-384-7391 Email: [email protected]
www.re-explorer.org | www.nrel.gov/usaid-partnership