renewable energy assessment new york state energy plan …renewable energy, particularly solar...
TRANSCRIPT

Renewable Energy Assessment
New York State Energy Plan 2009
December 2009


1
1 Overview
This Assessment evaluates the existing, planned, and potential use of New York’s renewable energy resources. As defined by the State Energy Law, renewable energy resources are "sources which are capable of being continuously restored by natural or other means or are so large as to be useable for centuries without significant depletion and include but are not limited to solar, wind, plant and forest products, wastes, tidal, hydro…[and]…geothermal.”1
New York is a leader in developing renewable energy resources, as demonstrated by its commitment to the Renewable Portfolio Standard (RPS) and subsequently to the ‘45 by 15’ clean energy goal. The RPS, adopted in 2004, has been the State’s primary policy initiative to promote the development of renewable resources. The 2004 RPS goal aims to increase the amount of electricity delivered to New York consumers that is generated by renewable resources to 25 percent by 2013.
The scope of this Assessment includes large-scale renewable electricity, customer-sited renewable energy, and renewable fuels, as well as policies and programs designed to stimulate implementation of renewable resources.
2 In his 2009 State of the State address, Governor Paterson proposed to increase this goal by announcing New York’s ‘45 by 15’ clean energy goal. 3
New York’s clean energy leadership is underscored by its growing renewable energy industry. New York ranks seventh in the nation in terms of existing wind capacity and fifteenth in potential wind capacity. As of the end of 2008, 791 wind turbines had been installed in the State with a total capacity of 1,260.8 megawatts (MW); an additional 14 turbines were under construction with 21.0 MW of expected capacity.
This goal challenges the State to meet 45 percent of its electricity needs by 2015 through increased energy efficiency and renewable energy. The goal calls for a reduction in electricity end-use by 15 percent, primarily through the expansion of energy efficiency activities, while simultaneously meeting 30 percent of the State’s electricity supply needs through renewable resources.
4 New York is home to more than 50 companies that manufacture renewable energy technologies or related products and over 90 companies that are certified to install solar-photovoltaic (solar-PV) systems.5
In addition, New York has two corn-based ethanol facilities with annual production capacity of 174 million gallons of ethanol, two advanced cellulosic ethanol pilot facilities that are expected to annually produce more than 500,000 gallons of ethanol from locally sourced feedstocks, and 79 ethanol and
1 New York Energy Law § 1-103 (12). The Energy Law also includes deuterium and hydrogen in the definition of renewable resources. However, these technologies, which are still in early stages of research and development, are not discussed in this Assessment as the focus is on technologies with more near-term potential. 2 Public Service Commission (PSC). Case 03-E-0188, Proceeding on Motion of the Commission Regarding a Retail Renewable Portfolio Standard, Order Regarding Retail Renewable Portfolio Standard. Issued September 24, 2004. http://www.dps.state.ny.us/03e0188.htm 3 Governor David A. Paterson. Our Time to Lead: State of the State Address. 2009. http://www.state.ny.us/governor/keydocs/speech_0107091.html 4 American Wind Energy Association. U.S. Wind Energy Projects-New York. 2009. http://www.awea.org/projects/Projects.aspx?s=New+York 5 This number reflects installers that are eligible to participate in NYSERDA’s PV Incentive Program. http://www.powernaturally.org/Programs/Solar/Installerspv.asp?i=1

Renewable Energy Assessment
2
biodiesel distributors and retailers. To gain a better understanding of the biomass potential in the State and follow through on a recommendation of the State’s Renewable Energy Task Force report, New York has commissioned a Renewable Fuels Roadmap and Sustainable Biomass Feedstock Study (Biofuels Roadmap) to guide the process of developing an environmentally sustainable biofuels program.6 Due to be released by spring 2010, the Biofuels Roadmap will be used to more accurately estimate the State’s indigenous biomass potential, to understand the economic and environmental impacts of biofuels, and to develop comprehensive bioenergy7
1.1 Benefits of Renewable Energy Resources
policies.
• Reduce the net retail price of electricity. Renewable electricity resources reduce the net retail
price of electricity paid by all ratepayers. In 2018, the average statewide retail price of electricity is projected to be 0.06 to 0.16 cents per kilowatt hour (kWh) lower than it would otherwise be without the implementation of RPS-supported renewable resources, representing an annual bill savings to ratepayers of $93 to $262 million.8
The estimated net retail price impact includes a reduction in the wholesale commodity price of electricity of 0.26 cents per kWh, netted against the estimated retail price increase of 0.1 to 0.2 cents per kWh, due to the collection of ratepayer funds to pay the price premium for the purchase of renewable energy under the RPS and “backing out” of the more expensive, less efficient fossil fuel-fired units.
• Help achieve environmental goals. Renewable resources reduce the need for electricity generated by fossil fuel-fired sources. In 2018, it is projected that the electricity generation displaced due to the availability of new renewable resources will be 65 percent natural gas and oil, 7 percent coal, and 28 percent imports from other states. Less generation from fossil fuel-fired units results in lower emissions of air pollutants, which means that fewer emission reduction measures will be needed to achieve statewide and regional emission caps and that the cost of compliance with emission caps will be reduced. The renewable resources needed to meet the 30 percent RPS goal in 2015 are projected to reduce expenditures for carbon dioxide (CO2
) allowances by about $82 million per year.
• Create jobs, income, and economic development opportunities. The direct macroeconomic benefits of renewable energy include the creation of jobs in construction and operation of new facilities, payments to the State and localities, payments for fuel and land leases, and in-state purchase of materials and services. Meeting the fully expanded 30 percent RPS goal is projected to provide more than $6.0 billion in direct macroeconomic benefits over the average 20-year life of the new facilities. The indirect “ripple” effects of injecting the incremental expenditures and income into the State’s economy increase the total projected macroeconomic benefits to approximately $12.5 billion.9
6 Renewable Energy Task Force. Clean, Secure Energy and Economic Growth: A Commitment to Renewable Energy and Enhanced Energy Independence. 2008. 7 Bioenergy is useful work generated from the conversion of organic, non-fossilized material originally produced through photosynthesis. Bioenergy includes energy produced from biomass, biogas, and biofuels. 8 The model inputs were designed to reflect the ‘45 by 15’ clean energy goal, which calls for 30 percent of electricity generation from renewable, and a post-Energy Efficiency Portfolio Standard (post-EEPS) load forecast RPS Program target (10,123,157 MWh).
9 KEMA Inc. (prepared for NYSERDA). New York Main Tier RPS: Impact and Process Evaluation. 2009. http://www.nyserda.org/Energy_Information/KEMA_RPSEvaluation%20MAR%2030_Final.pdf

Renewable Energy Assessment
3
• Reduce energy imports. Renewable energy helps to reduce the reliance on fossil fuels
imported from outside the State and/or the nation, thereby increasing the security of energy supplies.
• Reduce price volatility of fossil fuels. Renewable energy contributes to the reduction of energy price volatility in the long-term. Because the production cost for renewable energy remains stable throughout unpredictable fossil fuel price fluctuations, renewable resources can provide cost-effective options for managing the risks associated with fossil fuel use.10
• Reduce negative health impacts. As detailed in the Health Issue Brief, increasing the amount of energy generated by renewable resources such as solar, wind, and hydropower will, in general, decrease the health risks associated with energy use. Many renewable resources emit no air pollutants at the site of electricity generation, or produce relatively low emissions when compared to fossil fuels, especially with respect to pollutants like particulate matter, nitrogen oxides, sulfur dioxide, and mercury, which can have negative health impacts.
11
• Lower peak demand. Renewable energy, particularly solar power, may increase the reliability of the local power supply system during peak demand periods. For example, since cooling load peaks during summer days when the solar resource is plentiful, distributed solar power generation can reduce the risk of localized power disruptions.
12, 13
• Relieve transmission and distribution bottlenecks. Since certain renewables, such as solar, can be distributed throughout the grid, these technologies can reduce existing bottlenecks caused by load pocket demand.
1.2 Challenges and Potential Barriers to Development of Renewable Energy Resources
• Upfront capital costs: As renewable projects require significant upfront investment, the cost of capital and financing are major determinants of the viability of new ventures. Access to affordable financing is highly competitive and can be difficult to procure.
• Variable energy production: Sources such as wind, solar, and run-of-river hydropower provide power to the electric grid only when the wind, sun and river flow are available. Adequate reserve
10 It is estimated that fossil fuel electric generators pay approximately 0.5 cents per kWh to manage risk against the potential price increase of natural gas. Bolinger, M., R. Wiser and W. Golove. Quantifying the Value that Wind Power Provides as a Hedge Against Volatile Natural Gas Prices, Proceedings of WINDPOWER 2002. 2002. http://eetd.lbl.gov/EA/EMP/reports/50484.pdf 11 Grover, S. (prepared for the National Renewable Energy Laboratory). NREL:SR-640-41998: Energy, Economic, and Environmental Benefits of the Solar America Initiative. 2007. http://www.nrel.gov/docs/fy07osti/41998.pdf 12 Perez, R. Satellite-Based Solar Resource Assessment: Social, Economic and Cultural Challenges and Barriers, Technological Gaps. 2004. http://www.asrc.cestm.albany.edu/perez/publications/Solar%20Resource%20Assessment%20and%20Modeling/Papers%20on%20Resource%20Assessment%20and%20Satellites/satellite-based%20solar%20resource%20assessment-04.pdf 13 Perez, R. and B. Collins. Solar Energy Security: Could Dispersed PV Generation Have Made a Difference in the Massive North American Blackout? Refocus 5(4): 2004. http://www.sciencedirect.com

Renewable Energy Assessment
4
and balance of power capability, which could be provided by fossil-fueled or bioenergy electric system resources, are needed to reliably integrate variable generation resources into the bulk power system.
• Access to skilled workforce: To successfully implement and promote renewable technologies in New York, there is a need for accelerated development of a highly trained workforce that can design, install and maintain renewable energy and fuel systems. This can be accomplished through expansion of existing training programs at public and private colleges and universities throughout the State, coupled with strategic development of new training programs.
• Lengthy and costly siting process: The process for securing siting permits and community approvals for renewable projects can be both costly and time-consuming, given the absence of a comprehensive siting law. Like fossil fuel-fired projects, large renewable projects are required to undergo a comprehensive State Environmental Quality Review Act (SEQRA) review. As detailed in the Regional Collaboration Issue Brief, the jurisdictional authority to which renewable projects are subject may be somewhat unclear and/or diffuse. Depending on a project’s specific location and size, it may fall under the regulation of the Public Service Commission (PSC) and/or other State, local, or federal agencies.
• Limited transmission, distribution, and transportation infrastructure: As discussed in the Siting and Infrastructure Issue Briefs, the extent to which renewable resources are able to adequately serve load may be limited by the physical constraints of the transmission and distribution systems, which can cause program results to fall short of intended policy goals. Similarly, limited transportation and distribution systems for bioenergy may slow the expanded use of these types of resources.
• Competing uses of land: Land use competition between different economic sectors and within the energy sector can occur. For example, the same plot of land may be a prime site for real estate development, food production, energy crop production, or open space. Fortunately, for some renewable energy sources, complementary land uses can meet multiple needs, such as cattle grazing on wind farms.
• Limits on net metering: New York’s current net metering laws apply size limits of 25 kW to residential systems, 500 kW for farm-based wind and anaerobic digestion systems, and the lesser of 2 MW or the customer’s peak demand for other non-residential systems. There are two barriers to wider deployment of net metered systems in the non-residential sector. First, not all non-residential customers have a demand meter, making it difficult to determine the customer’s peak demand. Second, a system limited by peak demand could result in a system that is insufficient to meet the customer’s full energy requirements.
Many of these barriers are being addressed with policies and market transformation programs at the State and federal levels, which are designed to ensure that the challenges do not prevent the realization of the many benefits of renewable energy. For example, the New York State Energy Research and Development Authority (NYSERDA) has fostered a clean energy workforce development initiative for solar-photovoltaic, wind, solar-thermal and geothermal systems at institutions across the State. To better integrate increased levels of wind power into the transmission system, the New York Independent System Operator (NYISO) implemented a centralized wind forecasting system in June 2008 that forecasts the amount of energy expected to be produced by each wind plant for the Day-Ahead and Real-Time

Renewable Energy Assessment
5
markets. 14
1.3 Renewable Energy Use and Generation in New York
To increase development of small-scale projects, the RPS Program assists in lowering the high capital cost of equipment through a combination of capacity and/or production incentives.
1.3.1 Renewable Energy Use
As shown in Table 1, in 2007, approximately 11 percent of the primary energy used by all sectors in New York came from renewable resources. 15 This represented a 35 percent increase in renewable energy use since 2001. 16
Approximately 60 percent of New York’s 2007 renewable resource use was in the electric generation sector, of which 90 percent was conventional hydroelectric generation. The remaining 40 percent of the
In contrast, at the national level, only about 7 percent of total primary energy use in 2007 came from renewable resources, representing a 28 percent increase in renewable energy use since 2001.
Table 1. 2001 – 2007 New York Primary Energy Use from Renewable Resources
14 NYISO. Integration of Wind into System Dispatch: White Paper. 2008. http://www.ferc.gov/EventCalendar/Files/20090303120334-NYISO%20Wind%20White%20Paper%20October%202008.pdf 15 Primary energy is typically defined as energy that has not undergone a conversion process and thus represents the energy content of the raw fuels that are input into the energy system. 16 From 1993 to 2007, 2001 had the lowest annual hydropower output. The peak for annual hydropower output within that timeframe occurred in 1997, when 311.5 TBtu were produced.
Residential, Commercial, &
Industrial Transportation
Biomass Biofuel 2 Hydro WindBiomass &
Biogas2001 85.0 0.4 230 0.2 17.7 333 4,069 8.2%2002 82.4 0.3 249 0.8 17.2 350 4,026 8.7%2003 85.5 1.9 242 0.4 16.9 346 4,187 8.3%2004 90.2 24.4 239 1.2 17.9 373 4,260 8.8%2005 95.8 27.1 256 1.0 18.8 399 4,212 9.5%2006 89.4 60.2 269 5.1 19.1 443 4,005 11.1%2007 97.2 80.3 244 8.4 18.8 449 4,129 10.9%
22007 data was estimated based on U.S. growth rate from 2006 to 2007.
Note: Residential, Commercial, and Industrial biomass includes wood and biogenic waste; Transportation biofuel includes ethanol; and Electricity biomass and biogass includes wood, biogenic waste, and landfill methane.
Source: EIA. State Energy Data System: New York, 2001 - 2007 . 2009. http://www.eia.doe.gov/emeu/states/state.html?q_state_a=ny&q_state=NEW%20YORK
1Net-metered, customer-sited renewable electricity primary energy use increased from less than 0.1 TBtu in 2001 to approximately 0.3 TBtu in 2007. In 2007 solar-PV accounted for approximately 0.2 TBtu. Estimated based on NYSERDA analysis of DPS and LIPA customer-sited, grid-tied renewable energy system data.
Source: NYSERDA. Patterns & Trends – New York State Energy Profiles: 1993 - 2007. 2009. http://www.nyserda.org/energy_information/patterns%20&%20trends%201993-2007.pdf
New York State Renewable Energy Resources: Primary Energy (TBtu)
Total Renewables
Total Primary Energy
% from Renewables
Note: Assumes a rolling 3-year average NYS fossil fuel conversion factor for renewable electricity resources.
Electricity1
Year

Renewable Energy Assessment
6
State’s renewable energy came from ethanol (18 percent of total renewable energy use) and biomass (22 percent of total renewable energy use), which consisted largely of wood used by the residential sector.
1.3.2 Renewable Energy Generation
As shown in Figure 1, New York produced 28,067 gigawatt hours (GWh) from renewable resources in 2007, representing 16.8 percent of the State’s total electricity generation. Of that, conventional hydropower provided 90.0 percent of the State’s renewable electricity, followed by biomass (5.6 percent), wind (3.1 percent) and biogas (1.3 percent).
Figure 1. 2007 New York Electric Generation from Renewable Resources
Table 2 illustrates how the percentage of New York’s electricity requirement met by renewable resources can fluctuate year to year due to factors such as weather, economic conditions, and energy prices. 17
17 Electricity requirement is the in-state electricity generation and net imports necessary to meet total end-use electricity demand, including system loss at the transmission and distribution levels.
For example, the output of hydroelectric plants is highly dependent on rainfall. Since conventional hydropower comprises the majority of New York’s renewable electric generation, a significant decrease in total rainfall from one year to the next could result in a decrease in total renewable generation even if the State’s renewable generating capacity has increased during that time.
Hydro, 90.0%
Biogas, 1.3%
Wind, 3.1%
Wood, 1.8%
Biogenic Waste, 3.8%
NYS 2007 Renewable Generation = 28,067 GWhor 16.8 percent of total NYS electricity requirements
Source: U.S. DOE's Energy Information Administration and NYISO Goldbook

Renewable Energy Assessment
7
Table 2. 2001 - 2007 New York Electric Generation from Renewable Resources
1.4 Technical/Practical Potential for New York’s Renewable Resources
The “pure” technical potential of a renewable resource can be estimated based on the available primary renewable resource without regard for cost, social, or engineering constraints. However, “pure” technical potential offers little guidance to policy makers since it does not present a practical assessment of resource use. In contrast, the technical/practical potential of a renewable resource applies technical constraints, such as energy generation capacity factors and manufacturing base, developable land resource, and limited social constraints, to the “pure” technical potential value to produce a more achievable estimate. 18 The technical/practical potential of a resource is expected to increase over time as technical advances are made. 19 Table 3 shows estimates of the total technical/practical potential for in-state renewable resource use by 2018. If fully developed, these renewable resources could meet nearly of 40 percent of New York’s projected primary energy needs in 2018, which are estimated to be approximately 3,900 trillion British thermal units (TBtu). If the full technical/practical potential for solar and wind resources were installed at current prices, the cost to New York would be approximately $300 billion dollars.
18 Social constraints can include policy decisions that prohibit the development of renewable energy projects in State parks. 19 This Assessment does not define economic potential, which is based on decisions from policy makers and available fiscal resources. 20 The $300 billion dollar estimate is based on the following approximate installation cost assumptions: solar-PV costs $8,000 per kW; onshore wind costs $2,000 kW, and offshore costs $3,300 per kW. The State incentive level required to drive the adoption of this technology would not need to equal the entire $300 billion, but would be a significant percentage (as much as 1/3 depending on federal incentives). DOE has aggressive goals for solar-PV cost reductions. If solar-PV costs were to see rapid reductions to $3,000 per kW, during the planning period, the total cost would amount to approximately $150 billion dollars.
20
Year Hydro WindBiomass (Wood)
Biomass (Biogenic
Waste)Biogas
(Methane)
Total Statewide Electricity
Requirement
Total Generation
from Renewable Resources
% of Total Statewide Electricity
Requirement (In-State only)2
2001 23,084 21 503 1,073 205 155,240 24,885 16.0%2002 25,048 82 412 1,038 276 158,507 26,856 16.9%2003 24,269 41 412 1,026 256 158,013 26,004 16.5%2004 23,990 116 497 1,037 261 160,211 25,901 16.2%2005 25,783 103 528 1,094 264 167,208 27,771 16.6%2006 27,345 518 522 1,083 337 162,237 29,804 18.4%2007 25,253 873 492 1,074 375 167,341 28,067 16.8%
New York State Renewable Resources: Electricity Generation1 (GWh)
1Customer-sited renewable electricity generation increased from less than 10 GWh in 2001 to approximately 30 GWh in 2007. Estimated based on NYSERDA analysis of DPS and LIPA customer-sited, grid-tied renewable energy system data.2Does not include imported renewable energy, out-of-state renewable energy attributes (acquired by New York citizens through green purchasing in the voluntary market), or customer-sited generation, which are included in assessments of compliance for the RPS.Source: EIA. State Energy Data System: New York. 2009. http://www.eia.doe.gov/emeu/states/state.html?q_state_a=ny&q_state=NEW%20YORKSource: NYISO. 2009 Load & Capacity Data. 2009. http://www.nyiso.com/public/webdocs/services/planning/planning_data_reference_documents/2009_LoadCapacityData_PUBLIC_Final.pdf

Renewable Energy Assessment
8
Table 3. New York Renewable Energy Technical/Practical Potential Use
As noted in the large difference between the in-state use and in-state technical/practical potential, wind and solar resources have significant room for further development in New York, as does anaerobic digester gas (ADG), though ADG does not have as high a technical/practical potential. In contrast to wind and solar, hydropower has seen a high degree of utilization and has little untapped technical/ practical potential. While landfill methane use is extensive throughout New York, only a third of the potential has been realized. It is expected that the RPS will lead to the further repowering of existing hydropower and the promotion of onshore wind energy, but additional wind potential exists beyond the expected growth, as shown in Table 4.
Projected In-State TBtu In-State TBtu % of Projected Total Technical/Practical Resource Use Primary Energy Use
Potential (2007) (2018)4(2018)
Hydro1 244 260 7%Forestry and Agricultural Products 99 350 9%Biogenic Waste1 13 14 0.4%
Biomass2Landfill Methane 3.6 12 0.3%
BiogasAnaerobic Digester Gas3 0.50 10 0.3%
Wind 8.4 410 11%
Solar-PV1 0.17 440 11%Total 369 1,496 38%Notes: Assumes a rolling 3-year average NYS fossil fuel conversion factor for renewable electricity resources.1Hydro, wind, biogas (landfill methane), solar-PV and biogenic waste technical potential was estimated without consideration of cost or market acceptability. The biogenic waste potential only includes solid waste-to-electricity estimates, which dominate the current biogenic waste use (80%). Waste-to-electricity potential estimates (which account for 6% of the total biomass potential) are included based on the Optimal Energy study (2003), and 50% of the municipal solid waste was considered biogenic based on Energy Information Administration historical data. The solar-PV 2007 data was estimated based on historical growth rate, and only includes customer-sited, grid-tied electricity generation. All solar-PV data are reported as alternating current (AC) with the exception of LIPA, which is reported as direct current (DC).2Biomass in-state potential estimate is based on draft preliminary analysis from the NYS Renewable Fuel Roadmap, which examined wood, logging residual, corn stover, and new energy crops and estimated current and near term feedstock potential in New York using current practices and technology. Note: The biomass estimate does not include 80.3 TBtu of biofuel (ethanol) consumption in 2007, as ethanol is assumed to be created using out-of-state biomass.32007 anaerobic digester gas data (ADG) represents estimates from the municipal wastewater and on-farm facilities in New York. The estimated total ADG from customer-sited, grid-tied electricity generation (0.1 TBtu) is an underestimate of the total use.4Includes electricity sector primary energy use from the SEP Policy Reference Case presented in the Energy Demand and Price Forecast document.Sources: Optimal Energy Inc. (prepared for NYSERDA). Energy Efficiency and Renewable Energy Resource Development Potential in New York State. 2003; EIA. State Energy Data System: New York. 2009; NYSERDA. Patterns & Trends – New York State Energy Profiles: 1993 - 2007 . 2009; NYS Renewable Fuels Roadmap preliminary estimates; 2004 Order Supplemental worksheets; DPS, NYSERDA, Sustainable Energy Advantage, LLC, and LaCapra Associates. New York Renewable Portfolio Standard Cost Study Report II. 2004; NYSERDA. Market Characterization Report: Anaerobic Digester Gas-to-Electricity for the Municipal Wastewater Sector in New York . 2007; DPS and LIPA customer-sited renewable energy data. 2007.

Renewable Energy Assessment
9
Table 4. New York Renewable Energy Technical/Practical Potential Electricity Generation
In-State GWh Projected In-State GWh Generation based Projected In-State GWh % of Projected GWh Resource Generation on the Achievement of the 25% RPS Goal Technical/Practical Potential Generation
(2007) (2013)3 (2018) (2018)4
Hydro1 25,253 25,385 31,000 19%
Biomass2 1,942 3,616 9,400 5.8%Wind 873 8,476 48,000 29%
Solar-PV1 17 27 53,000 32%Total 28,085 37,504 141,400 87%Notes: Assumes a rolling 3-year average NYS fossil fuel conversion factor for renewable electricity resources.1Hydro, wind, biomass and solar-PV technical potential was estimated without consideration of cost or market acceptability. The solar-PV 2007 data was estimated based on historical growth rate, and only includes customer-sited, grid-tied electricity generation. All solar-PV data are reported as alternating current (AC) with the exception of LIPA, which is reported as direct current (DC).2Biomass data do not account for customer-sited applications such as ADG. Biomass in-state potential estimate is based on data from the Optimal Energy study, which allocates only some of the total available biomass to electric generation. Waste-to-electricity potential estimates (which account for 6% of the total biomass potential) are included based on the Optimal Energy study, where 50% of the municipal solid waste was considered biogenic based on EIA historical data.3Energy generation in 2013 was estimated to show the expected impact of the 25% RPS, based on the 2004 Cost Study. The 2004 RPS Order anticipated that New York would import 8,269 GWh of hydropower, which is not included as projected in-state GWh generation.4Based on the SEP Policy Reference Case of 163,326 GWh presented in the Energy Demand and Price Forecast document.Sources: Optimal Energy Inc. (prepared for NYSERDA). Energy Efficiency and Renewable Energy Resource Development Potential in New York State. 2003; EIA. State Energy Data System: New York. 2009; NYSERDA. Patterns & Trends – New York State Energy Profiles: 1993 - 2007 . 2009; NYS Renewable Fuels Roadmap preliminary estimates; 2004 Order Supplemental worksheets; DPS, NYSERDA, Sustainable Energy Advantage, LLC, and LaCapra Associates. New York Renewable Portfolio Standard Cost Study Report II. 2004; NYSERDA. Market Characterization Report: Anaerobic Digester Gas-to-Electricity for the Municipal Wastewater Sector in New York . 2007; DPS and LIPA customer-sited renewable energy data, 2007.
The largest biomass potential can be found in the forest and agriculture products sector, with an estimated 350 TBtu of primary energy. In 2007, New York used approximately 28 percent of the in-state technical/practical potential for agriculture and forest products. In addition, approximately 40 percent of New York’s total biomass consumption was in the form of the biofuel ethanol, which was made from out-of-state biomass and therefore not reported in Table 3. If all of the available solid biomass could be converted into ethanol, New York would be able to meet approximately 100 percent of the current in-state ethanol demand using in-state biomass resources, assuming a conversion efficiency of about 40 percent. 21 The U.S. Department of Energy (DOE) estimates New York’s potential for ethanol production from in-state available biomass feedstocks at nearly 475 million gallons annually today, increasing to 585 million gallons in 2012. 22
Waste-to-energy pathways provide meaningful contributions to New York’s renewable energy system through combustion of landfill methane and the biogenic 23 component of municipal solid waste. 24 An estimate of technical/practical potential of these sources is included in Table 3 and Table 4; however, the definition of “waste” could change over time depending on the economic value placed on the material
21 The available biomass represents the technical/practical potential minus the current use (362 - 112 = 250 TBtu). 22 DOE. Alternative Fuels and Advanced Vehicles Data Center. State Assessment for Biomass Resources: New York Potential Biofuel Production. 2008. http://www.afdc.energy.gov/afdc/sabre/sabre.php?mode=prod 23 The U.S. Energy Information Administration (EIA) has classified the biomass portion of solid waste as “biogenic” and the remainder, e.g., plastics derived from petroleum products, as “non-biogenic.” 24 According to the 2004 Order, “[e]lectricity generated from waste-to-energy facilities shall only be considered eligible if derived from fuels identified as eligible biomass, which must be source-separated and separately converted to energy (a practice referred to as "refuse-derived fuel") and only that associated portion of the waste-to-energy facility's generation will be eligible.”

Renewable Energy Assessment
10
stream and the evolution of waste management practices, i.e., the highest value use for biogenic waste may evolve in the direction of composting rather than combustion.
1.5 Costs and Potential Revenues Associated with Renewable Generation Technologies
While the costs of building and operating various renewable energy resources are not a factor in estimating their technical/practical potential, such costs play a key role in the determination of which technologies are likely to be implemented toward achieving policy goals. Equally important are the potential revenues that renewable resources could provide through the sale of the generated electricity at the prevailing hourly market clearing prices in the New York electricity market.
Figure 2 shows estimated levelized capital and operating costs for various renewable generation technologies, as well as projected revenues in the form of wholesale energy and capacity payments based on projected hours and patterns of operation. 25 Figure 2 indicates that biomass co-firing, hydropower upgrades, and landfill gas (biogas) appear to be the most cost-effective resources, as projected revenue estimates exceed projected cost estimates for these technologies and price premiums may not be required.
Figure 2. 2015 Levelized Cost vs. Levelized Wholesale Revenue for Renewable Resources in New York
Large wind energy projects require the smallest price premium among the renewable energy technologies for which levelized costs exceed levelized wholesale revenues. Therefore, it is expected that wind energy will continue to see significant development under the RPS.
25 In Figure 2, the difference between cost and revenue represents the price premium required for the resource to be deemed economic. The technologies are presented in order from smallest to largest difference between cost and revenue. As these estimates are generic, individual project costs and revenues may vary significantly based on site-specific characteristics.
-
50
100
150
200
250
300
$ pe
r M
Wh
(200
7$)
2015 Levelized Cost vs. Levelized Wholesale Revenue for Renewable Resources in New York
20-Year Levelized Cost per MWh in 2015
20-Year Levelized Wholesale Revenue per MWh in 2015
Source: Derived from analysis conducted for the report “New York Renewable Portfolio Standard Cost Study Update: Main Tier Target and Resources”, by La Capra Associates and Sustainable Energy Advantage, 2008.

11
2 New York’s Leadership through Renewable Energy
Policy
2.1 Renewable Portfolio Standard (RPS)
2.1.1 RPS Goal
The 2002 State Energy Plan recognized that the addition of renewable electricity generation could be beneficial to the State and recommended the development of the RPS. 26 The RPS was adopted in 2004 by the Order Regarding Retail Renewable Portfolio Standard Policy (2004 Order). The 2004 Order’s called for an increase in the proportion of retail renewable energy used by New York electricity consumers from the 2013 forecasted electricity baseline of 17.3 percent to at least 25 percent (45.7 million MWh) by 2013. 27 Based on the 2004 Order, New York’s RPS would add approximately 14.2 million MWh per year of new renewable electricity generation and 4,545 MW of new renewable capacity by 2013.
Table 5 shows the expected contributions of various components of the RPS goal, as anticipated by the 2004 Order, which are detailed below.
• Existing baseline renewable resources will provide approximately 69 percent of the RPS goal, or 31.5 million MWh. The existing baseline consists mostly of hydroelectric generation, including large hydropower plants at Niagara Falls and on the St. Lawrence River and 300 smaller hydropower plants, as well as a few biomass facilities.
• The RPS Program, administered by NYSERDA, is responsible for procuring 71 percent of the renewable energy needed to meet the RPS goal, or approximately 10 million MWh. The RPS Program is a two-tier central procurement program that is funded through a volume-based RPS surcharge paid by all retail electric customers who are subject to the System Benefits Charge (SBC). As detailed later, the RPS Program targets will be revised after the adoption of the 2004 Order to take into account Governor Paterson’s ‘45 by 15’ policy goal, which promotes substantial decreases in electricity use through the implementation of various energy efficiency measures by 2015. The expanded RPS Program targets assume that sustained and aggressive renewable energy expansion targets in New York will be achieved in parallel with the pursuit of lower electricity load growth consistent with the ‘15 by 15’ policy goal.
26 New York State Energy Planning Board. New York State Energy Plan and Final Environmental Impact Statement, Section 3.1. 2002. http://www.nyserda.org/sep/sepsection3-1.pdf 27 The renewable electricity resources baseline of 17.3 percent for year 2013 is from Table 1 of Appendix D of the 2004 Order (Renewable Portfolio Standard Order Cost Analysis), and is based on long-term forecasts available at that time. Historical baseline percentages reported in Table 2 of this document for years 1999-2007 are of a similar order of magnitude, but differ from the forecasts because they are dependent on river conditions and system load characteristics in those specific years.

Renewable Energy Assessment
12
• Pursuant to Executive Order 111 (EO 111), commitments made by other State agencies and authorities will contribute approximately 1 percent of the renewable energy needed to meet the RPS goal, which is equal to 0.2 percent of the forecasted 2004 Order baseline, or approximately 0.3 million MWh. 28
• The Long Island Power Authority (LIPA) programs will contribute approximately 4 percent of the renewable energy needed to meet the RPS goal, which is equivalent to 1 percent of the forecasted 2004 Order baseline, or approximately 2 million MWh by 2013. While not required by the 2004 Order to meet RPS targets, LIPA is committed to expanding its own renewable energy profile.
EO 111 is an ongoing effort by State entities to satisfy up to 20 percent of their energy needs with renewable energy by 2010.
• Consumers in the voluntary market are estimated to provide approximately 4 percent of the renewable energy needed to meet the RPS goal, which is equal to 1 percent of the forecasted 2004 Order baseline, or approximately 2 million MWh by 2013. The voluntary market provides opportunities for customers to voluntarily pay a “green” premium to purchase renewably generated electricity through their utilities or marketers and brokers.
Table 5. RPS Goal and Targets based on the 2004 Order
28 Executive Order (EO) 111. Directing State Agencies to be More Energy Efficient and Environmentally Aware, Green and Clean State Buildings and Vehicles. 2001. http://www.ogs.state.ny.us/purchase/spg/pdfdocs/EO111.pdf. EO 111 specifies that State agencies shall increase their purchase of energy generated from wind, solar thermal and solar-PV, sustainably managed biomass, tidal, geothermal, methane waste and fuel cells. Unlike the State Energy Law, EO 111 does not include hydropower as a renewable resource.
MWhPercent of 2013
Forecasted LoadPercent of 2013 RPS Policy Goal
182,866,999 100.0% N/A
45,716,750 25.0% 100.0%
31,543,624 17.2% 69.0%10,055,168 5.5% 22.0%9,854,038 5.4% 21.6%201,130 0.1% 0.4%355,568 0.2% 0.8%
1,933,720 1.1% 4.2%1,828,670 1.0% 4.0%
2013 Forecasted Total NYS Electric Load (Based on 2004 Order)2013 RPS Policy Goal (25% of Forecast in 2004 Order)
Baseline Resources
Source: PSC. Case 03-E-0188, Proceeding on Motion of the Commission Regarding a Retail Renewable Portfolio Standard, Order Approving Renewable Portfolio Standard Policy. September 24, 2004. http://www.dps.state.ny.us/03e0188.htm
Anticipated Component Contribution to the 2013 RPS Policy Goal
Note: Contributions made by the New York Power Authority’s operations and programs are reflected within several categories: the baseline, the voluntary market, and purchases on behalf of State entities for Executive Order 111.1Consists primarily of medium to large scale electric generation facilities that are connected to the grid and are expected to compete against each other on a kWh price premium basis for RPS funding.2Consists of “behind-the-meter” facilities that generate electricity used on-site and are not generally economically competitive with Main Tier technologies.
RPS Program (Administered by NYSERDA)
Executive Order 111Long Island Power AuthorityVoluntary Market
● Main Tier 1
● Customer-Sited Tier 2

Renewable Energy Assessment
13
Achieving the RPS Goal
RPS Program
The RPS Program, which is administered by NYSERDA, establishes two tiers of resource types. The “Main Tier” consists primarily of medium- to large-scale electric generation facilities that deliver electrical output into the wholesale power market. The “Customer-Sited Tier” consists of smaller, “behind-the-meter” end-use technologies that generate power used primarily at the site where the technology is installed. Main Tier facilities are expected to provide approximately 98 percent of the resources needed to meet the RPS Program’s target, while Customer-Sited Tier technologies are expected to provide the remaining 2 percent.
In establishing the 25 percent RPS goal, the PSC recognized that 19.3 percent of the energy sold at retail in New York was being generated by renewable resources that existed prior to the adoption of the RPS in 2004 (baseline resources). For the purpose of ensuring the continuing operation of these valuable existing resources, the PSC established an additional “Maintenance Resource” category as a subset of the Main Tier. 29 To be eligible to receive RPS Program funding as a maintenance resource, a baseline resource is required to demonstrate financial hardship through a formal request to the PSC.
Main Tier The Main Tier currently supports a variety of resources, including large wind farms, the biomass portion of co-fired coal plants, and repowered hydropower plants. 30 Figure 3 shows the cumulative installed nameplate capacity, by technology, for the Main Tier projects that have been funded by the RPS. 31 As shown in Figure 3, wind comprises the majority of the anticipated capacity. As of March 2009, 30 Main Tier projects had been funded by the RPS, including two out-of-state projects and two maintenance resources. 32 The maintenance resources are not included in Figure 3 as they represent retained, not new, capacity.
In 2009, Main Tier facilities are expected to produce a total of 3,479 GWh, which represents approximately 60 percent of the Main Tier RPS Program target under the 2004 Order. 33 This comprises approximately 3,157 GWh of wind energy, 104 GWh of hydropower, and 218 GWh of biomass energy.
29 NYSERDA. New York State Renewable Portfolio Standard Performance Report: Program Period ending June 2008. 2008. http://www.nyserda.org/rps/RPSPerformanceReportWEB.pdf 30 Eligible resources in the Main Tier include biogas, biomass, liquid biofuel, fuel cells, hydroelectric, solar-PV, ocean or tidal power, and wind. Out-of-state resources are also included to support interstate commerce, promote energy supply security and diversity, and allow the State to acquire resources sufficient to meet its renewable energy goals at the lowest cost. 31 Nameplate capacity is the maximum output rating of a generator. 32 The two out-of-state resources include a 22 MW wind project in Pennsylvania and a 15 MW hydro project in Quebec. As of November 2009, four Main Tier solicitations had been offered since program inception. Results from the latest solicitation had not been released at that time, but the first three solicitations had resulted in signed contracts with 26 new in-state generation facilities (representing approximately 1,100 MW of nameplate capacity). This renewable capacity is expected to produce approximately 2.8 million MWh of electricity per year, enough clean energy to supply over 440,000 average homes. The RPS Program is intended to promote environmental improvement, energy supply security, resource diversity, and economic benefits at a reasonable cost to ratepayers and be administered in a competitively neutral manner. To ensure that costs are reasonable and wholesale electric competition is encouraged, the program is designed to be inclusive when qualifying renewable resources to compete for RPS contracts. The inclusion of out-of-state resources increases competition and diversity. 33 NYSERDA. New York State Renewable Portfolio Standard Performance Report: Program Period ending June 2008. 2008.

Renewable Energy Assessment
14
Figure 3. 2006-2009 Contracted Cumulative RPS Program Main Tier Installation Capacity
Customer-Sited Tier Four Customer-Sited Tier solicitations have been issued, offering funding support on a first-come, first-served basis through a combination of capacity “buy-down” and energy production incentives. Customer-Sited Tier solicitations were released between April 2007 and January 2008 for each of the eligible technologies, which include solar-PV systems, anaerobic digesters, small wind turbines, and fuel cells.
Figure 4 shows New York’s cumulative distributed renewable energy installation capacity for 2000 through 2008. While not all of these projects were funded under the Customer-Sited Tier, the installed capacity of these projects is applicable toward the RPS goal. Through 2008, approximately 93 percent of the customer-sited installed capacity consisted of solar-PV systems and approximately 5 percent consisted of ADG projects.
As of March 2009, customer-sited facilities had an estimated total annual production from installed capacity of 4,490 MWh, which represents approximately 2 percent of the Customer-Sited RPS Program cumulative target for 2013 under the 2004 Order. 34 This capacity comprises 3,755 MWh of electricity from solar-PV technology, 35 701 MWh from anaerobic digester biogas, 36
34 NYSERDA. New York State Renewable Portfolio Standard Performance Report: Program Period ending June 2008. 2008. 35 Expected average annual solar-PV capacity factor of 14.8 percent. NYSERDA does not individually monitor installation production. 36 The anaerobic digester gas generation value does not include existing generation from maintenance systems.
and 34 MWh from small-scale wind projects.
0
200
400
600
800
1000
1200
1400
2006 2007 2008 2009Cum
ulat
ive
Mai
n T
ier
Ren
ewab
le
Ene
rgy
Inst
alla
tions
(M
W)
Contracted Cumulative RPS Program Main Tier Installation Capacity
Wind Biomass Hydro Out-of-StateSource: NYSERDA
Note: Hydropower data refer to "new renewable capacity," or the increase in facility capacity attributable to the upgrade that makes them eligible for the RPS.Note: Biomass data represent the portion of the facility expected to burn or co-fire biomass.Note: Out-of-state facilities include 22 MW of wind energy and 14.7 MW of hydropower.Note: Does not include maintenance resources.

Renewable Energy Assessment
15
Figure 4. 2000–2008 Cumulative Distributed Renewable Energy Installation Capacity Applicable Toward the RPS Goal
RPS Program Expansion As part of the ‘45 by 15’ goal announced in his 2009 State of the State Address, Governor Paterson recommended increasing the amount of renewable electricity delivered to New York consumers from 25 percent by 2013 to 30 percent by 2015. 37 As detailed in the Modeling section and shown in Table 6, the projected 15 percent post-Energy Efficiency Portfolio Standard (EEPS) load reductions would require less renewable energy to meet the 25 percent RPS goal and, if achieved, would allow the RPS Program to meet the 25 percent goal by 2011. The post-EEPS load reductions were taken into account during the development of the ‘45 by 15’ policy goal.
The ‘45 by 15’ goal is consistent with a recommendation by the Renewable Energy Task Force and is expected to realize substantial economic benefits. This expanded goal raises the incremental RPS target, excluding existing major hydroelectric resources, to 9.3 percent of the forecasted demand in 2015, nearly doubling the incremental RPS target. The PSC is currently reviewing the RPS funding level in light of achieving the new 30 percent goal. 38 A decision from the PSC may come as early as December 2009.
37 The expanded 30 percent RPS goal takes into consideration load reductions due to implementation of the Energy Efficiency Portfolio Standard (EEPS). 38 PSC. Case 03-E-0188, supra, Staff Mid Course Report. Issued October 26, 2009. http://documents.dps.state.ny.us/public/Common/ViewDoc.aspx?DocRefId={230CE88F-60A5-475B-A24A-6FC9B2780DEF}. At the time of publication, the PSC had not rendered a decision on revising the program.
0
5
10
15
20
25
30
35
2000 2002 2004 2006 2008
Cum
ulat
ive
Dis
trib
uted
Ren
ewab
le E
nerg
y In
stal
latio
ns (
MW
)Cumulative Distributed Renewable Energy Installation Capacity
Applicable Toward the RPS Goal
Solar-PV Wind ADG Hydro Contracted Capacity
Source: DPS & LIPANote: Contracted capacity for 2008 is indicated in orange. Contracted capacity consists of 38% solar-PV, 60% ADG, and 1% wind.

Renewable Energy Assessment
16
The State’s ‘45 by 15’ policy goal aims to achieve a 15 percent reduction in load by 2015 as a result of various energy efficiency measures implemented through initiatives such as the Energy Efficiency Portfolio Standard (EEPS). 39
Table 6. 2004 Order and Post-EEPS Expanded RPS Program Targets
RPS Program Economic Development Benefits The total direct and induced economic benefits of the RPS Program were estimated in the RPS Main Tier Cost Study. 40
The study concluded that the RPS Main Tier Program and maintenance resources would yield significant direct economic benefits in excess of the direct funds committed over the assumed 20-year life of the projects. For example, it is estimated that achievement of the 30 percent RPS goal by 2015
The study drew upon short-term economic impacts, including planning and construction jobs, as well as one-time payments to municipalities. The study also examined long-term economic impacts such as operation and maintenance jobs, property and other tax benefits to local governments and schools, energy revenue royalty payments to landowners for access to resources, e.g., wind farm revenues to farmers/landowners, and the purchase of in-state materials, goods, and services. The forestry and agriculture sectors will derive additional economic benefits as a result of supplying biomass feedstocks to renewable energy projects.
41 may require total estimated premium payments of $1.8 billion to be paid over approximately 10 years, 42 thereby subsidizing new generation from wind, biomass, and repowered hydropower facilities. The direct economic benefits resulting from these expenditures are expected to exceed $6.0 billion over the next 20 years. Direct economic benefits are measured in employment income, taxes, local payments, in-state purchases, and land leases. The total effects on the statewide economy, which include the macroeconomic “ripple” effects of injecting the additional dollars into the local economy, are projected to be more than $12.5 billion. 43
39 PSC. Case 07-M-0548: Proceeding on Motion of the Commission Regarding an Energy Efficiency Portfolio Standard, Order Establishing Energy Efficiency Portfolio Standard and Approving Programs. Issued June 23, 2008. http://www3.dps.state.ny.us/pscweb/WebFileRoom.nsf/Web/544F8DE178C8A15285257471005D41F6/$File/201_07m0548_final.pdf?OpenElement 40 KEMA Inc. (prepared for NYSERDA). New York Main Tier RPS: Impact and Process Evaluation. 2009. 41 Consistent with Table 6, this assumes full implementation of the ‘45 by 15’ clean energy goal, including the expanded 30 percent RPS goal and the EEPS-related load reductions. 42 This assumes premium payments of $17.75 per MWh, paid over 10 years, and a Main Tier load forecast of 10,123,157 MWh. 43 KEMA Inc. (prepared for NYSERDA). New York Main Tier RPS: Impact and Process Evaluation. 2009.
RPS Program Component
Target Based on the 2004 Order and 25% RPS Goal by 2013
(MWh)
Target Based on Post-EEPS Load Forecast and 30% by 2015 Goal
(MWh)Main Tier 9,854,038 10,123,157Customer-Sited Tier 201,130 206,595Total 10,055,168 10,329,752Source: NYSERDA. New York Renewable Portfolio Standard Program Evaluation Report . 2009. http://www.nyserda.org/Energy_Information/NY%20Renewable%20Portfolio%20Standard%20Program%20Evaluation%20Report%20(2009%20Review)-FINAL.pdf

Renewable Energy Assessment
17
Net Electricity Price Impact of Achieving the 30 Percent RPS Goal by 2015
Figure 5
As shown in and Figure 6, building renewable resources to achieve the goals of the RPS is expected to reduce the net retail price of electricity paid by all ratepayers. Figure 5 indicates that, in 2018, the average statewide retail price of electricity is projected to be 0.06 to 0.16 cents per kWh lower than it would otherwise be if the RPS did not exist. Based on this projected reduction in electricity prices, benefit-cost ratios for meeting the 30 percent RPS goal are estimated to range from 3.6 to 4.0 if only environmental and price reduction benefits are included, and to range from 4.9 to 5.3 if macroeconomic benefits are added to environmental and price reduction benefits.
Figure 5. Estimated Statewide Average Retail Price Impact of Achieving the 30% RPS
44
Figure 6 indicates that this estimated reduction in net price per kWh is equivalent to aggregate annual bill savings to ratepayers of $93 to $262 million. The estimated net retail price impact includes a reduction in the wholesale commodity price of electricity of 0.25 cents per kWh, netted against the estimated retail price increase of 0.10 to 0.20 cents per kWh due to the collection of ratepayer funds to pay the price premium for the purchase of renewable energy under the RPS.
44 PSC. Case 03-E-1088, Proceeding on Motion of the Commission Regarding a Retail Renewable Portfolio Standard Policy, Comments of the New York State Energy Research and Development Authority: SAPA No. 03-E-0188SP22. November 23, 2009.

Renewable Energy Assessment
18
Figure 6. Estimated Aggregate Statewide Retail Bill Impact of Achieving the 30% RPS
The reduction in statewide wholesale electricity prices due to implementation of renewable resources is extracted directly from electricity sector modeling runs performed as part of the Electricity Assessment using the Integrated Planning Model (IPM), a proprietary linear programming model developed by ICF Resources International. The reduction in wholesale prices assumes the achievement of the ‘45 by 15’ policy initiative, which would require the addition of 10,123,157 MWh of Main Tier renewable resource generation by 2015. 45
As shown in
Implementation of renewable resources reduces the average wholesale price of electricity by reducing the need for electricity generated by the most inefficient and expensive fossil fuel-fired units, and reducing imports of electricity.
Figure 7, it is estimated that approximately 65 percent of the electricity that will be displaced by the renewable resources implemented to meet the RPS is expected to be produced from natural gas- and oil-fired units (including both steam and combined cycle units). In addition, approximately 28 percent of this electricity is expected to be imported from out-of-state, while approximately 7 percent is expected to be produced from coal combustion.
45 See Electricity Assessment: Modeling for detailed discussion of modeling structure, assumptions, and results.

Renewable Energy Assessment
19
Figure 7. Generation Displaced by Incremental Renewable Resources
Executive Order 111 (EO 111)
Issued in 2001, EO 111 sets forth an energy purchasing goal that aims to meet 10 percent of the annual electricity requirement of buildings occupied by State agencies and entities through renewable technologies by 2005, and 20 percent by 2010. Many State entities began procuring renewable power well ahead of 2005 with the help of the New York Power Authority (NYPA). EO 111 also sets an energy efficiency goal for 2010 of reducing the energy use of State agencies, authorities, and entities by 35 percent from 1990 levels.
Long Island Power Authority (LIPA)
LIPA has undertaken several efforts that promote both the use and generation of electricity from renewable resources.
Clean Energy Initiative LIPA’s ten-year, $355 million Clean Energy Initiative (CEI) provided rebates for end-use and wholesale generation projects to promote clean energy generation technologies and energy efficiency programs. From its inception in 1999 through 2008, the CEI energy efficiency and renewable energy initiatives reduced peak demand by 170 MW, saved 701 GWh of energy, and decreased carbon emissions by more than 1,900,000 tons. 46 Through 2008, CEI’s Solar Pioneer Program had provided more than 1,650 LIPA customers with end-use rebates for solar-PV systems, which resulted in a cumulative energy savings of 12,351 MWh.
Under the Solar Pioneer Program, funding for LIPA’s renewable programs was increased 75 percent from $8 million in incentives in 2008 to $14.4 million in 2009. In addition, LIPA expanded its solar initiatives through the creation of a new Solar Entrepreneur Program for business, municipal, and educational solar
46 LIPA. Draft Electric Resource Plan 2009 – 2018. 2009. http://www.lipower.org/pdfs/company/projects/energyplan09/energyplan09.pdf

Renewable Energy Assessment
20
installations with capacities of up to 100 kW. LIPA also provides technical assistance to commercial and industrial customers for small wind generation projects, including wind resource information, siting requirements, and energy estimates. LIPA provides net metering for both solar and wind projects and has different system size limitations for different customer classes. Residential net-metered systems are limited to 27.5 kW, while farm-based solar-PV systems are limited to 27.5 kW and wind systems are limited to 500 kW. Non-residential systems with a demand less than 27.5 kW are limited to the lesser of 27.5 kW or 110 percent of peak demand, while non-residential systems with a demand greater than 27.5 kW are limited to the lesser of 2 MW or peak demand. 47
Electric Generation Since 2006, LIPA has issued several Requests for Proposals (RFPs) dealing with the large-scale purchase of renewable energy generation and generation credits. In October 2007, LIPA issued an RFP for the acquisition of a ten-year supply of renewable energy and Renewable Energy Credits (RECs). 48 In addition, LIPA is collaborating with Con Edison, NYPA, NYSERDA, the New York City Economic Development Corporation, the Metropolitan Transportation Authority, and the Port Authority of New York and New Jersey in evaluating a proposed 350 MW project called the New York City Offshore Wind Collaborative, which will be located approximately 13 miles off the Rockaway Peninsula in the Atlantic Ocean. 49 The project’s feasibility assessment includes identification of suitable locations, available wind resources, costs and financing options, market benefits, and improvements to transmission bottlenecks.
As discussed in the Complimentary Policies section, LIPA is in the process of entering into a power purchase agreement (PPA) to procure the full output (energy and RECs) of up to 50 MW from solar-PV generating systems.
Voluntary Green Power Market
The voluntary green power market relies on retail customers opting to purchase premium-priced renewable energy. 50 Although green power is an undifferentiated commodity that cannot be specifically delivered to the customer site, load-serving entities must guarantee to contractually identify the source of the purchased amount of green power from renewable energy providers. These purchases are verified by the Department of Public Service (DPS) and are reflected in the Environmental Disclosure label produced for each retail supplier. The RPS anticipates that green power retail customers in New York will help to meet 4 percent of the RPS goal by 2013, and the RPS Program supports this expectation through measures such as capping bids at 95 percent of a facility’s available RECs so that the remaining 5 percent will be available for voluntary sales. 51
47 LIPA. Tariff for Electric Service. http://www.lipower.org/pdfs/lipatariff.pdf 48 RECs are premium payments paid above energy commodity costs that are typically packaged in certificates representing one MWh of electricity generated by renewable sources, and they are sold bundled with or unbundled from the actual electricity generated. 49 The Long Island-New York City Offshore Wind Collaborative issued a Request for Information (RFI) on June 30, 2009 and plans to issue an RFP toward the end of 2009. NYPA. The Long Island – New York City Offshore Wind Collaborative Releases Request for Information. 2009. http://www.nypa.gov/press/2009/090701b.htm 50 DPS estimates that, since deregulation, more than 60,000 customers have purchased green power. 51 The capping of bids at 95 percent was instituted for the second and third Main Tier solicitations.

Renewable Energy Assessment
21
Transactions in voluntary markets deal primarily in RECs, which are premium payments paid above energy commodity costs. RECs are typically packaged in certificates representing 1 MWh of electricity generated by renewable sources.
NYPA’s renewable energy programs support wholesale electric generation and customer-sited technologies, so the contributions made by NYPA are reflected within several categories of the RPS, including the baseline, purchases on behalf of State entities for EO 111, and the voluntary market.
New York Power Authority (NYPA)
Table 7 shows the capacity and generation of fuel cells that operated using ADG, as well as solar-PV systems that were supported by NYPA from 2002 through 2008.
Table 7. 2002 – 2008 NYPA Customer-Sited Capacity and Generation
NYPA has also supported renewable energy efforts by purchasing RECs. As shown in
52
Table 8, RECs were purchased on behalf of NYPA customers prior to 2008 when NYPA began purchasing wind generation.
52 This table only includes nine ADG fuel cell projects that are owned by NYPA and five solar-PV installations that are monitored by NYPA. Data for other NYPA-funded ADG fuel cell and solar-PV projects are not available.
Anaerobic DigesterGas Fuel Cells
(kW)
PVSystems
(kW)
TotalCapacity
(kW)
Anaerobic DigesterGas Fuel Cells1
(MWh)
PVSystems(MWh)
TotalGeneration
(MWh)2002 200 570 770 1,107 418 1,5252003 800 570 1,370 1,331 255 1,5862004 1,800 570 2,370 5,332 238 5,5712005 1,800 639 2,439 8,839 292 9,1312006 1,800 639 2,439 8,305 234 8,5392007 1,800 656 2,456 8,052 361 8,4132008 1,800 719 2,519 7,086 361 7,447
Note: Energy generation includes utilization of natural gas when digester gas is not available.
Source: NYPA Renewable Distributed Generation Program, 2009.
Year
Capacity Generation

Renewable Energy Assessment
22
Table 8. 2005 – 2015 Annual NYPA Renewable Purchases of Wind Generation and RECs
On December 1, 2009, NYPA released an RFP for the development of a utility-scale offshore wind power project in the range of 120 MW to 500 MW in the New York State waters of Lake Erie and/or Lake Ontario. 53 Known as the Great Lakes Offshore Wind Project (GLOW), this is the first fresh water wind power project in the nation. NYPA’s efforts support a key recommendation of the Renewable Energy Task Force, which called for a commitment to address local wind project siting and permitting issues as well as an evaluation of transmission and infrastructure limitations. As discussed in the Complementary Policies and Activities section, NYPA issued a Request for Expressions of Interest in April 2009 that would include the installation of up to 100 MW of solar-PV systems to produce electricity, which NYPA would purchase through a PPA.
2.2 Complementary Public Policies and Activities
54, 55
In addition to the RPS goal, there are several complementary policies and activities that promote renewable energy in New York State, including:
• Clean energy sector investments • Regional Greenhouse Gas Initiative • Power Purchase Agreements • Low Carbon Fuel Standard • PlaNYC • Renewable Energy Credits • Private investments and public incentives • Federal policies that promote renewable energy
53 NYPA. NYPA President Kessel Calls for Proposals to Develop the First Fresh Water Wind Energy Initiative in the Nation. 2009. http://www.nypa.gov/press/2009/091201.htm 54 NYPA. Request for Expressions of Interest to Support the Preparation of a Request for Proposals for a 100 MW Solar Power Initiative in New York State. 2009 55 Governor David A. Paterson. Governor Paterson Announces Plans for Largest Solar Project in State History. 2009. http://www.state.ny.us/governor/press/press_0515091.html
YearWind Purchases
(MWh)Renewable Energy Credit Purchases
(MWh)Total
(MWh)2005 N/A 30,175 30,1752006 N/A 64,025 64,0252007 N/A 65,221 65,2212008 74,345 39,098 113,4432009 118,000 46,468 164,4682010 118,800 95,759 214,559
2011– 2015 747,270 46,210 793,480Notes: Data for 2010 - 2015 represent estimates for wind. N/A indicates "not applicable".
Source: NYPA. 2009.

Renewable Energy Assessment
23
2.2.1 Clean Energy Sector Investments
New York is taking steps to ensure that the State’s workforce can meet the needs of clean energy economic activity. The growth of the State’s clean energy sector can provide significant opportunities for skilled workers and for training new workers for these areas of job growth.
Skilled workers in the renewable energy and energy efficiency sectors are crucial for the success of the State’s clean energy initiatives and the leveraging of private sector investments. Companies establishing or expanding operations in the State require access to qualified labor pools and training programs for workers with technology-specific knowledge and skills at all stages of the product value chain. These stages include labor pools for highly-trained scientists and engineers, as well as those who design, manufacture, sell, distribute, analyze, install, operate, and maintain the new, innovative technologies that are the clean energy economy. Collectively, this labor pool is essential to support innovative, large-scale manufacturing facilities that will produce current and subsequent generations of clean energy products.
Workforce Training
NYSERDA, in partnership with the State University of New York (SUNY), City University of New York (CUNY), Boards of Cooperative Education Services (BOCES), Association for Energy Affordability, unions, and trade associations, has established a network of renewable energy and energy efficiency training programs. This workforce development initiative, established in 2003, has two main components. The first is a Center for Energy Efficiency and Building Sciences training program which provides building science instruction to technicians, architects, engineers and other building professionals. The second component, SUNYGREENSNY, is focused on the development of clean energy workforce training programs in the technology areas of wholesale and customer-sited wind, solar-PV, solar-thermal, and geothermal systems at institutions across the State. NYSERDA’s network of 32 clean energy training centers have trained 9,600 people in energy efficiency and 2,500 individuals in solar and small wind installation, and the centers have the capacity to train an additional 7,000 in energy efficiency and 5,000 in renewable energy over the next two years. 56 Funding for workforce development efforts including green building design has been awarded under EEPS.
Workforce training programs at the New York State Department of Labor (NYSDOL) and the Division of Housing and Community Renewal are integral components of the above activities. The NYSDOL has taken an inventory of existing workforce training programs to help identify how the existing resources can be used in the most optimal manner.
57
58
56 Governor David A. Paterson. Bold Steps to the New Economy: A Jobs Plan for the People of New York. 2009.
Further, Empire State Development collaborates with the NYSDOL in providing new or expanding businesses with incentives and assistance for workforce development.
http://www.state.ny.us/governor//press/pdf/press_0608091.pdf 57 PSC. Case 07-M-0548: Proceeding on Motion of the Commission Regarding an Energy Efficiency Portfolio Standard, Order Authorizing Workforce Development Initiatives. Issued June 22, 2009. http://www.dps.state.ny.us/07M0548/ORDER_AUTHORIZING_WORKFORCE_DEVELOPMENT_INITIATIVE_June-22-2009.pdf 58 NYSDOL. New York State’s Clean Energy Industry: Labor Market and Workforce Intelligence. 2009. http://www.labor.state.ny.us/workforcenypartners/PDFs/NYS%20Clean%20Energy%20Jobs%20Report%20FINAL%2006-09-09.pdf.

Renewable Energy Assessment
24
As detailed in the Economic Development Issue Brief, New York will continue its commitment to renewable R&D, which is a critical component to achieving a clean energy economy. NYSERDA's R&D Program has supported the development and commercialization of innovative energy and environmental products, technologies, and processes since 1975. The New York State Foundation for Science, Technology and Innovation (NYSTAR) also supports technology development and commercialization with particular focus on the assistance that New York’s colleges and universities can provide to private sector companies in the clean energy sector. For example, the Center for Advanced Technology (CAT) in Future Energy Systems at Rensselaer Polytechnic Institute conducts R&D on new energy systems and energy efficiency, including solar-PV systems, fuel cells, cellulosic ethanol, smart lighting, and advanced materials. Another example is the Advanced Energy Center at the State University of New York at Stony Brook, which is working with other universities around the State to provide a comprehensive set of services to various business sectors active in Smart Grid technology development and deployment. These services include assistance with research and development needs as well as providing a center for validation and verification of product functions and capabilities.
Research and Development (R&D)
RGGI funding may enable the State to expand its support of advanced research centers and clean energy industrial development, including investments in advanced renewable technologies. 59 New York will also leverage federal American Recovery and Reinvestment Act (ARRA) funding, which provides $2.5 billion in nationwide funding for applied research, development, demonstration and deployment activities, including $800 million for biomass projects and $400 million for geothermal projects; New York’s share of this funding will be based on competitive grants. 60 In April 2009, the White House announced that the DOE will utilize ARRA funding to help support 46 new Energy Frontier Research Centers (EFRCs). 61 Five of New York’s research institutions received EFRC funding: Brookhaven Laboratory, Columbia University, Cornell University, General Electric Global Research, and State University of New York at Stony Brook. EFRC projects will include research on the use of electrodes in solar-PV, fuel cells, and batteries.
NYSERDA’s R&D program has designed initiatives to create an entrepreneurial climate for renewable and clean business “start-ups” that will help them grow quickly from technology clusters to full-fledged companies that relocate to or remain in New York. The goals of the initiative include reducing the barriers to entry for renewable and clean energy technology business start-ups, and investing in a technically-talented workforce and technologies that would enable start-ups to build entrepreneurial growth companies. This support provides access to nearly all of the resources – capital, technology, mentoring, and customers – needed to build a successful new business. In 2009, NYSERDA has partnered with four successful business incubators to expand their portfolio of services to include a clean energy technology focus: the University at Buffalo, Rochester Institute of Technology, Polytechnic Institute of New York University in Brooklyn, and the Tech Garden sponsored by the Syracuse Regional Chamber of Commerce. These activities, when coupled with a portfolio of programs in product
Business Incubators
59 NYSERDA. Operating Plan for Investments in New York under the CO2 Budget Trading Program and the CO2 Allowance Auction Program. 2009. http://www.nyserda.org/RGGI/Files/Final%202009-2011%20RGGI%20Operating%20Plan.pdf 60 NYSERDA. Federal Economic Recovery Funding for Energy Efficiency and Renewable Energy Projects. 2009. http://www.nyserda.org/pdfs/EconomicStimulusFunding.pdf 61 DOE. Energy Frontier Research Center (EFRC) Awards. 2009. http://www.er.doe.gov/bes/efrc.html

Renewable Energy Assessment
25
development and business innovation, are expected to establish a long-lasting capacity in New York to nurture the success and expansion of early-stage clean energy companies.
To support New York’s clean energy economy, the State’s existing manufacturing sector should be expanded to include the production of advanced energy technologies and their component parts. Developing a strategy to build capacity in advanced energy technology manufacturing should be a priority for economic development programs offered by the State, its authorities, and utilities.
Manufacturing Sector
New York could strengthen the supply chain for renewable energy technologies and leverage in-state companies’ knowledge and experience by encouraging its existing manufacturing and distribution bases to expand their existing product lines 62 to include renewable energy-related equipment, such as the smaller components of wind turbines. 63 A recent study by the Blue-Green Alliance and the Renewable Energy Policy Project estimated that 457 existing companies in New York are active in industrial sectors that could also supply the components needed to achieve a 15 percent reduction in greenhouse gas emissions. 64
2.2.2 Regional Greenhouse Gas Initiative (RGGI)
A potential expansion challenge is the additional capital investment needed to find new facilities suitable for manufacturing renewable energy-related technologies or to upgrade current facilities to produce the new product lines.
In addition, NYSERDA’s Renewable, Clean Energy and Energy Efficiency Product Manufacturing Incentive program provides up to $1.5 million of financial assistance per project for the development of facilities that manufacture renewable, clean-energy, and energy-efficient products in New York. This program not only seeks to promote the growth of renewable and clean energy companies, but also to provide New York’s electricity consumers with greater access to these products.
RGGI is the nation’s first mandatory, market-based effort to reduce emissions of greenhouse gases over time. Under RGGI, New York, along with nine Northeastern and Mid-Atlantic States, has placed a cap on CO2 emissions from electricity generators. CO2 emission allowances are sold to fossil fuel generators in quarterly auctions. To the degree that the requirement to purchase CO2 allowances increases the market clearing price for wholesale electricity, RGGI is expected to make renewable electric generation more competitive with fossil-fueled generation. Most of New York’s annual emissions budget of approximately 64 million allowances will be auctioned periodically and auction proceeds will be used to further energy efficiency, renewable energy and carbon abatement programs.
62 Summit Blue Consulting, LLC (prepared for NYSERDA). New York Renewable Portfolio Standard Market Conditions Assessment Final Report. 2009.
65
http://www.nyserda.org/Energy_Information/Market%20Conditions%20Final%20Report.pdf 63 Each wind turbine is made up of roughly 20 major components. While the larger parts of the turbines are typically assembled close to the end market, the components are often manufactured farther away. The components are often manufactured as an add-on to an existing manufacturer’s product line, rather than as a new stand-alone product for a new company. Sterzinger, G. and M. Svrcek. Wind Turbine Development: Location of Manufacturing Activity, Technical Report for the Renewable Energy Policy Project. 2004. http://www.repp.org/articles/static/1/binaries/WindLocator.pdf 64 Blue Green Alliance (Technical Report for the Renewable Energy Policy Project). New York’s Road to Energy Independence, Summary of Findings: New York. 2007. 65 NYSERDA. Operating Plan for Investments in New York under the CO2 Budget Trading Program and the CO2 Allowance Auction Program. 2009.

Renewable Energy Assessment
26
Under the RGGI program rule, fossil-fueled generators that are subject to the carbon dioxide emission cap can purchase carbon offset credits from agricultural anaerobic digester and landfill projects that flare methane gas or combust methane to produce electricity or thermal energy.
RGGI provides an additional benefit to renewable electricity generators that are not participating in the RPS Program. These facilities have the ability to claim credit for reducing CO2 emissions through the retirement of CO2 allowances. The New York State Department of Environmental Conservation (DEC) has created a voluntary renewable energy market set-aside account from which allowances will be retired upon request from a “sponsor for a voluntary renewable energy purchase.” 66
2.2.3 Power Purchase Agreements (PPAs)
In this way, a renewable electricity generator can become a sponsor and take credit for the retirement of allowances.
PPAs are contracts between energy providers and utilities that specify the terms and conditions under which electricity will be generated and purchased and requires the energy provider to supply electricity at a specified price for the life of the agreement. In April 2009, LIPA issued an RFP calling for 50 MW of solar energy to be generated on Long Island by one or more developers and purchased by LIPA through a PPA. 67 LIPA anticipates that the solar-PV arrays will be installed at school buildings, on commercial and municipal rooftops, along parking lots, atop landfills, and at brownfield sites. The same month that LIPA issued its RFP, NYPA issued a Request for Expressions of Interest that would include the installation of up to100 MW of solar-PV systems to produce electricity which NYPA would purchase through a PPA. 68
Both of these PPAs will foster the development of solar-PV technologies, create clean energy jobs, and diversify the State’s energy portfolio while simultaneously stimulating New York’s economy. Once completed, the 150 MW of solar-PV installations could position New York as the state with the second-highest installed solar-PV capacity. These PPAs are consistent with a recommendation by Renewable Energy Task Force recommendation to increase the State’s solar-PV capacity.
Similar to LIPA’s 50 MW solar-PV initiative, NYPA’s solar arrays would be sited at schools, municipal and commercial buildings, and other State-owned locations throughout New York. These installations will include both roof-mounted and ground-mounted solar-PV arrays.
2.2.4 Low Carbon Fuel Standard (LCFS)
69
In December 2008, New York and ten other Northeast and Mid-Atlantic States committed to cooperatively analyze low-carbon fuel supply options and develop a framework for a regional LCFS; a Memorandum of Understanding is expected by the end of 2009.
66 Ed Holt & Associates, Inc.. RGGI State Set-Aside Provisions for Voluntary Renewable Energy (Draft). 2008.
70
http://www.epa.gov/grnpower/documents/events/rggi_status_table.pdf 67 LIPA. Governor Paterson Announces Plans for State’s Largest Solar Energy Project. 2008. http://www.lipower.org/newscenter/pr/2008/042208_gov.html 68 NYPA. Request for Expressions of Interest to Support the Preparation of a Request for Proposals for a 100 MW Solar Power Initiative in New York State. 2009. 69 Renewable Energy Task Force. Clean, Secure Energy and Economic Growth: A Commitment to Renewable Energy and Enhanced Energy Independence. 2008. 70 Multi-State Low Carbon Fuel Standard. Northeast/Mid-Atlantic States Low Carbon Fuel Standard Program. Signed December 31, 2008.

Renewable Energy Assessment
27
It is anticipated that this “greenhouse gas standard for transportation fuels” could spark research in alternatives to oil and reduce greenhouse gas emissions. The LCFS would encourage low carbon fuels and could work in concert with renewable fuel standards and programs, as many renewable fuels have lower total fuel cycle carbon intensities than conventional gasoline and diesel fuels. Likewise, a carbon-based standard would complement a renewable fuel initiative as some renewable fuel pathways are greenhouse gas intensive, which is not reflected in the market price.
2.2.5 PlaNYC
71
The City of New York undertook several initiatives to promote the use of solar energy in 2008 as part of PlaNYC. 72
2.2.6 Renewable Energy Credits (RECs)
Measures included working with the State Legislature and the PSC to reduce barriers to implementation of solar-PV improvements by increasing the amount of excess power that can be sold to the grid to 2 MW per system, and extending net-metering to include systems installed on commercial buildings. New York City also released an RFP for a solar developer to purchase, install, own, and operate 2 MW of solar capacity at multiple locations in exchange for a long-term power purchase agreement with the City. In addition, the New York City Property Tax Abatement law was enacted in 2008 to allow property tax abatements for solar-PV systems on all but utility-owned real property. In the coming years, PlaNYC calls for an expansion of methane recovery from wastewater treatment plant anaerobic digesters and landfills.
RECs represent the non-electricity attributes associated with the generation of 1 MWh of energy from renewable resources, including the avoided SO2, NOx, and CO2
It can be difficult to distinguish RECs from other green power offerings, especially when they are supplied by renewable resources located within the same region in which they are marketed.
emissions that are produced through the use of fossil fuels. Since each MWh supplied by renewable resources reduces the need for an additional MWh produced from conventional fossil-fueled generators, a REC represents the environmental benefits of this displacement.
RECs can be “bundled” with commodity electricity and sold in the wholesale market, or they can be “unbundled” from the underlying electricity and sold separately in a REC marketplace. If the physical electricity and RECs are unbundled and sold to separate buyers, the REC conveys the attributes of the renewable energy, not the commodity electricity itself. Unbundling commodity energy from the energy attributes to create tradable instruments provides flexibility and market opportunities to renewable generators and marketers.
73
71 For example, for corn-derived ethanol production plants that are dependent on coal as an input energy source, the lifecycle greenhouse gas intensity (grams CO2 per MMBtu) of the ethanol that is produced can exceed that of gasoline. Wang, M., M. Wu, et al. Life Cycle Energy and Greenhouse Gas Emission Impacts of Different Corn Ethanol Plant Types. Environmental Research Letters 2, no. 2: 024001. 2007.
The development of a system to create and track REC transactions would allow renewable generators to sell the environmental attributes of their energy to those who value it, would preclude the “double counting” of benefits, and would bring certainty to the market, as buyers would gain confidence as to the legitimacy
http://www.iop.org/EJ/article/1748-9326/2/2/024001/erl7_2_024001.html 72 PlaNYC was instituted by New York City Mayor Michael Bloomberg in 2007. New York City. A Greener, Greater New York (PlaNYC). 2007. http://www.nyc.gov/html/planyc2030/html/home/home.shtml 73 Bird, Lori et al. NREL/TP-670-42502: Green Power Marketing in the United States: A Status Report (Tenth Edition). 2007.

Renewable Energy Assessment
28
of the product. 74
2.2.7 Private Investments and Public Incentives
Staff at NYSERDA, DPS and the NYISO are working to expedite development of an electric generation tracking system contract. An electronic REC trading bulletin board will be developed and administered by the vendor winning the tracking system contract, allowing for credits to be sold within New York and as a fungible product in the emerging REC marketplace.
As discussed in the Energy Costs and Economic Development Issue Brief, New York policy makers have long recognized that public incentives are needed to advance, improve, and mainstream innovative renewable energy technologies. In addition to exempting residential solar thermal and solar-PV systems from sales tax, 75 New York provides incentives for these systems, as well as fuel cell membrane systems, with personal income tax credits. The tax credit for solar systems is equivalent to 25 percent of system costs and is capped at $5,000, while the tax credit for fuel cell systems is equivalent to 20 percent of system costs and is capped at $1,500. The State also has a personal income tax credit for the residential use of Bioheat®, i.e., heating oil that contains biofuel. 76
For example, the SBC funded the initial investments in large-scale commercial wind projects by providing funding for wind prospecting studies and making contributions toward the construction of pilot facilities. As the renewable energy market has matured and the cost of wind projects has decreased, public investments through the RPS Program have shifted from wind projects to the purchase of renewable attributes associated with the production of wholesale energy delivered into the New York grid. Incentives such as the federal production tax credit affect the financial viability of new investments in large wind farms. Sales and income tax incentives, subsidized loans, and rebates vastly improve the affordability of end-use products for a larger customer base. The Commission on State Asset Maximization released its final report in June 2009 recommending sustainable energy asset maximization.
The tax credit is equivalent to $0.01/gallon for each percent of biodiesel and is provided up to the first 20 percent of biodiesel that is blended with conventional fuel and thus the tax credit is capped at $0.20/gallon. This tax credit encourages the use of biodiesel which has no sulfur, and burns cleaner and more efficiently than petroleum-based oil. Biodiesel can also be an important in-state resource as New York is the largest consumer of oil for heating in the country and most bio-diesel is soybean-based, which is a plentiful crop in New York; growers produce over 5 million bushels of soybeans per year on about 144,000 acres.
New York also incentivizes renewable energy technologies by investing public funds in renewable energy projects. Public investments can leverage significant private investment and reduce the risk associated with making substantial new private investments. The Renewable Energy Task Force recommended the continuation of public investment strategies that reward performance and innovation in order to provide a long-term stable environment for commercial investment in renewable energy and, ultimately, promote the replacement of public investments with private ones.
77
74 Renewable Energy Task Force. Clean, Secure Energy and Economic Growth: A Commitment to Renewable Energy and Enhanced Energy Independence. 2008. 75 The exemption applies to both purchase and installation costs. It does not apply to solar thermal pool systems or other like applications. NY CLS Tax, Article 28 § 1115 (ee). 76 NY CLS Tax, Article 22 § 606 (mm).
This Commission recommended that the State should assess potential for siting renewable energy projects, including onshore and offshore wind, solar, geothermal, and hydropower on those State-owned lands and waterways where such development would not require a constitutional
77 Commission on State Asset Maximization. New York State Commission on State Asset Maximization Final Report. 2009. http://nysamcommission.org/pdf/SAM_FINAL_REPORT.pdf

Renewable Energy Assessment
29
amendment. In addition, the State should develop a process for installing renewable energy technologies on State facilities, particularly those that are energy intensive, and have open space and/or compatible roofing.
2.2.8 Federal Policies that Promote Renewable Energy
According to the U.S. Energy Information Administration (EIA), in 2007 the federal government provided $3.97 billion in tax expenditures to support renewable energy, which made up approximately 81 percent of all federal support for renewables. 78
The Energy Independence and Security Act of 2007 (EISA)
In total, the federal government provided $4.875 billion in support for all renewable energy projects, which constituted 29 percent of all federal energy funding for that year and included tax expenditures, R&D, and federal electricity support.
The two major types of federal financial support for wind energy that come from the federal government include the Production Tax Credit (PTC) and accelerated depreciation through the Modified Accelerated Cost Recovery System (MACRS). The PTC provides for a $19 per MWh tax credit which, when monetized, for example, at a 35 percent marginal tax bracket, is worth $6.65 per MWh. Under MACRS for wind, the qualified cost basis of the equipment is depreciated over a five year period, with approximately 50 percent of cost expensed out two years after installation.
79
78 EIA. Federal Financial Interventions and Subsidies in Energy Markets, Table ES-1. 2007.
created a number of new programs to fund and increase the use of renewable fuels. EISA accelerated the schedule for effectuating the Renewable Fuel Standard (RFS) first enacted in the Energy Policy Act of 2005. The RFS now mandates the sale of nine billion gallons of renewable fuels in 2008 and 36 billion gallons of renewable fuels in 2022— 21 billion gallons of which must be cellulosic ethanol or other advanced biofuels.
The American Recovery and Reinvestment Act of 2009, like EISA, also provides funding for energy efficiency and renewable energy projects, including on‐site renewable energy technology that generates electricity for government buildings and renewable energy capital projects. For example, ARRA provides $2.5 billion in nationwide competitive grants for applied research, development, demonstration, and deployment activities, including $800 million for biomass projects and $400 million for geothermal projects. As of November 2009, New York-based entities and projects had been selected for over $1.36 billion in ARRA clean energy awards.
Potential national renewable energy portfolio standard, carbon cap-and-trade, and climate change legislation could provide further support for renewable energy development in New York in addition to the policies mentioned above.
http://www.eia.doe.gov/oiaf/servicerpt/subsidy2/pdf/execsum.pdf 79 Public Law 110 - 140.

Renewable Energy Assessment
30

31
3 Renewable Energy Resources
3.1 Hydropower
3.1.1 Hydropower Use and Electricity Generation
Conventional hydropower generation may use a dam to store river water in a reservoir which, when released, activates a generator to produce electricity, or it may use run-of-river facilities where an elevation drop produces electricity without a reservoir, e.g., Niagara Falls. Output from run-of-river facilities is less predictable than output from facilities using dams.
Conventional Hydropower and Pumped Storage
80 As of March 2009, New York had 338 conventional hydropower facilities.
Pumped storage plants are used to store energy to help meet peak electrical load. These facilities use electricity generated from traditional base load sources to pump water upward to a reservoir during off-peak hours, and they release the stored water to produce electricity during times of peak demand.
81
82 Because energy from pumped storage plants is available during the peak hours, these plants offer considerable value as reserve capacity. While these plants are net users of electricity, they contribute to reducing the State’s total cost of producing electricity. As of March 2009, the State had two pumped storage facilities. 83
New York produces more hydroelectric power than any other state east of the Rocky Mountains.
Table 9 shows that New York’s conventional hydropower and pumped storage plants had a combined hydroelectric generation capacity of 5,756 MW in 2007. 84
Table 2
Licensed to NYPA, the top three facilities represent 80 percent of the total capacity: Moses Niagara at 2,687 MW, Blenheim - Gilboa at 1,077 MW, and the St. Lawrence - FDR at 848 MW. As detailed in , conventional hydropower produced 25,253 GWh of electricity in 2007, representing 15 percent of New York’s total annual electricity requirement.
80 Optimal Energy Inc. (prepared for NYSERDA). Energy Efficiency and Renewable Energy Resource Development Potential in New York State. 2003. http://www.nyserda.org/sep/EE&ERpotentialVolume1.pdf 81 NYISO. 2009 Load & Capacity Data. 2009. http://www.nyiso.com/public/webdocs/services/planning/planning_data_reference_documents/2009_LoadCapacityData_PUBLIC_Final.pdf 82 Optimal Energy Inc. (prepared for NYSERDA). Energy Efficiency and Renewable Energy Resource Development Potential in New York State, 2003. 83 NYISO. 2009 Load & Capacity Data. 2009. 84 Capacity values in this section represent the average of the summer and winter capacities.

Renewable Energy Assessment
32
Table 9. Hydroelectric Units Operating in New York as of 2007
Hydrokinetic systems generate electric power from freely flowing water. Unlike conventional hydropower facilities, which require either a dam or an elevation drop to produce energy, hydrokinetic systems produce power when turbines are placed below the water’s surface in tidal flows, rivers, canal systems, and wastewater treatment plants. While hydrokinetic energy is years away from full optimization,
Hydrokinetic Energy
85 the technology is actively supported by research, development, and demonstration efforts.
3.1.2 Hydropower Technical/Practical Potential
86
Hydroelectric Energy
Table 10 shows that New York has the technical/practical potential to add 2,527 MW of hydropower by 2022, an increase of approximately 50 percent over the 2002 baseline level of 4,660 MW. However, the combination of environmental, siting, financial, and regulatory barriers suggest that relatively little new development is likely to occur aside from relicensing, repowering, and modernization of existing facilities.
As of May 2009, the NYISO interconnection queue included three conventional hydropower projects totaling 13.3 MW of capacity. In addition, 28.6 MW of hydroelectric capacity, representing 115 MWh of annual generation, has been approved for funding through the Main Tier of the RPS. These projects represent repowering and upgrades at existing facilities.
85 E3, Inc. Energy and Environmental Services (prepared for NYSERDA). Sustainable Hydroelectric Energy Network (SHEN): Developing An Integrated Regional In-Stream Hydropower System Final Report. 2004. 86 Verdant Power is currently in the third and final phase of its Roosevelt Island Tidal Energy (RITE) Project, which aims to install one MW of commercially-deliverable hydrokinetic power in the East River. Verdant anticipates that the RITE Project will be completed by 2012.
Unit In-service YearCapacity1
(MW)2007 Capacity
Factor (%)Moses Niagara (includes Lewiston Pump Storage) 1961 2,687 56.4%Blenheim – Gilboa (Pump Storage) 1973 1,077 8.1%St Lawrence – FDR 1958 848 81.3%Others2 (more than 330 units) 1902 to 2005 1,143 54.6%Total 1902 to 2005 5,756 50.7%1Capacities are average of summer and winter ratings. 2“Other” hydroelectric units range from 0.1 to 45.7 MW.Source: NYISO. 2008 Load & Capacity Data. 2008. http://www.nyiso.com/public/webdocs/services/planning/planning_data_reference_documents/2008_goldbook.pdf

Renewable Energy Assessment
33
Table 10. New York Hydroelectric Technical/Practical Potential in 2022
Hydrokinetic Energy
The hydrokinetic energy technical/practical potential in New York is estimated to be approximately 1,000 MW by 2025. 87 In order to complete a hydrokinetic project, a developer must first obtain a preliminary permit from the Federal Energy Regulatory Commission (FERC), which allows the developer to study the feasibility of a hydrokinetic project at an identified site. Once the feasibility of the project has been assessed, the developer then applies for a license to construct and operate a hydrokinetic facility.
As of April 2009, there were nine proposed hydrokinetic projects in New York waterways that had been issued preliminary permits by FERC, 88 including two in the East River. 89 The proposed installed capacity of these projects totaled more than 650 MW. There are currently no hydrokinetic projects in the State that have been granted a FERC license.
3.2 Wind Energy
3.2.1 Wind Use and Electric Generation
Central Electric Generation
The State ranks seventh in the nation in terms of existing wind capacity and fifteenth in potential wind capacity. 90 Large-scale wind capacity in New York is projected to reach nearly 1,300 MW by the end of 2009, up from just 48 MW in 2001. As of June 2009, New York had 791 installed wind turbines with a total capacity of 1260.8 MW and another 14 turbines under construction, which are expected to add another 21.0 MW of capacity. 91
87 E3, Inc. Energy and Environmental Services (prepared for NYSERDA). Sustainable Hydroelectric Energy Network (SHEN): Developing An Integrated Regional In-Stream Hydropower System Final Report. 2004. 88 Projects are required to obtain preliminary FERC permits to do feasibility studies and demonstrations and FERC licenses prior to the construction of commercial facilities. 89 Verdant Power’s demonstration project was installed in the East River in 2006. Verdant Power. The RITE Project. 2009. http://www.verdantpower.com/what-initiative 90 The American Wind Energy Association estimates that New York has a potential capacity of 7,080 MW. 91 American Wind Energy Association. U.S. Wind Energy Projects – New York. 2009.
Application Potential (MW) Potential (GWh)New production at new dams 1,079 5,501New production at existing dams 754 2,477Repowering, modernization, and upgrading 408 538Expansion of production at existing hydropower stations 286 651Total 2,527 9,167Source: Optimal Energy Inc. (prepared for NYSERDA). Energy Efficiency and Renewable Energy Resource Development Potential in New York State . 2003. Study excludes pumped storage as a renewable resource. http://www.nyserda.org/sep/EE&ERpotentialVolume1.pdf
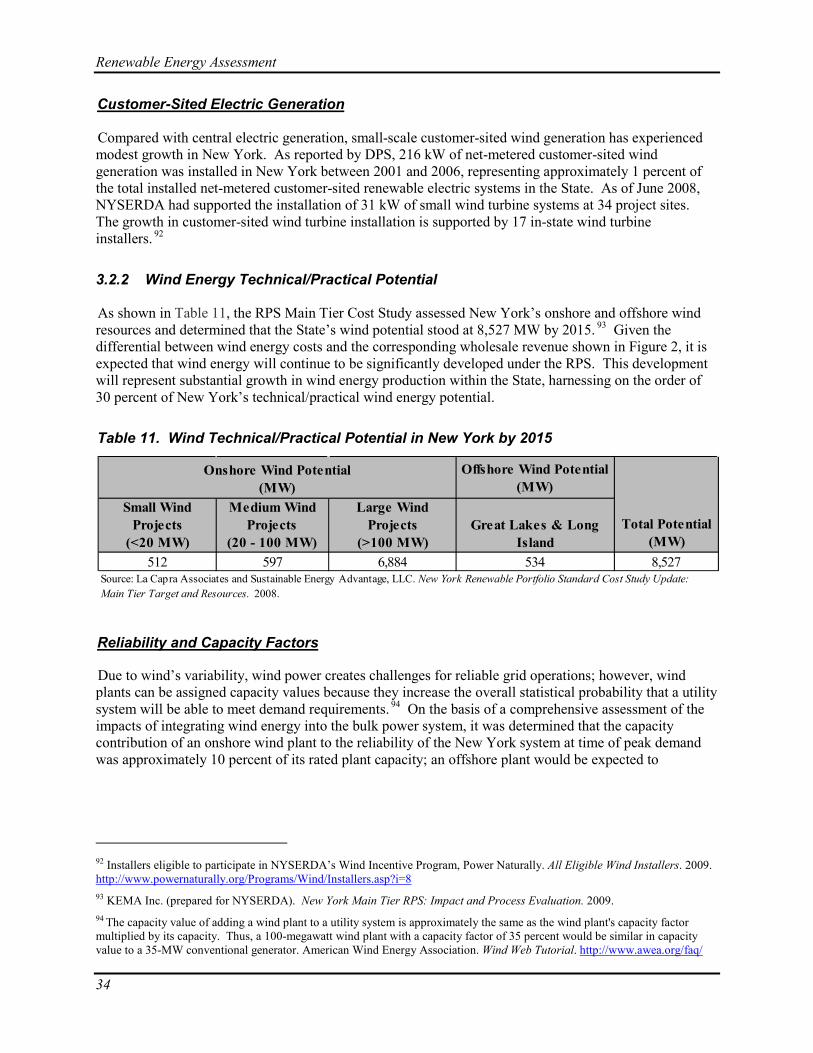
Renewable Energy Assessment
34
Offshore Wind Potential (MW)
Small Wind Projects
(<20 MW)
Medium Wind Projects
(20 - 100 MW)
Large Wind Projects
(>100 MW)Great Lakes & Long
Island512 597 6,884 534 8,527
Source: La Capra Associates and Sustainable Energy Advantage, LLC. New York Renewable Portfolio Standard Cost Study Update: Main Tier Target and Resources. 2008.
Onshore Wind Potential (MW)
Total Potential (MW)
Customer-Sited Electric Generation
Compared with central electric generation, small-scale customer-sited wind generation has experienced modest growth in New York. As reported by DPS, 216 kW of net-metered customer-sited wind generation was installed in New York between 2001 and 2006, representing approximately 1 percent of the total installed net-metered customer-sited renewable electric systems in the State. As of June 2008, NYSERDA had supported the installation of 31 kW of small wind turbine systems at 34 project sites. The growth in customer-sited wind turbine installation is supported by 17 in-state wind turbine installers. 92
3.2.2 Wind Energy Technical/Practical Potential As shown in Table 11, the RPS Main Tier Cost Study assessed New York’s onshore and offshore wind resources and determined that the State’s wind potential stood at 8,527 MW by 2015. 93
Figure 2 Given the
differential between wind energy costs and the corresponding wholesale revenue shown in , it is expected that wind energy will continue to be significantly developed under the RPS. This development will represent substantial growth in wind energy production within the State, harnessing on the order of 30 percent of New York’s technical/practical wind energy potential.
Table 11. Wind Technical/Practical Potential in New York by 2015
Due to wind’s variability, wind power creates challenges for reliable grid operations; however, wind plants can be assigned capacity values because they increase the overall statistical probability that a utility system will be able to meet demand requirements.
Reliability and Capacity Factors
94
92 Installers eligible to participate in NYSERDA’s Wind Incentive Program, Power Naturally. All Eligible Wind Installers. 2009.
On the basis of a comprehensive assessment of the impacts of integrating wind energy into the bulk power system, it was determined that the capacity contribution of an onshore wind plant to the reliability of the New York system at time of peak demand was approximately 10 percent of its rated plant capacity; an offshore plant would be expected to
http://www.powernaturally.org/Programs/Wind/Installers.asp?i=8 93 KEMA Inc. (prepared for NYSERDA). New York Main Tier RPS: Impact and Process Evaluation. 2009. 94 The capacity value of adding a wind plant to a utility system is approximately the same as the wind plant's capacity factor multiplied by its capacity. Thus, a 100-megawatt wind plant with a capacity factor of 35 percent would be similar in capacity value to a 35-MW conventional generator. American Wind Energy Association. Wind Web Tutorial. http://www.awea.org/faq/

Renewable Energy Assessment
35
contribute approximately 35 to 40 percent of its rated capacity because offshore wind production is better correlated with in-region peak demand. 95
To integrate increasing levels of wind power into the transmission system without compromising reliability, the NYISO instituted one of the first state-of-the-art wind forecasting systems in the United States in 2008. Considered a best practice in the industry, the centralized system enables the NYISO to better utilize and accommodate wind energy by forecasting the availability and timing of wind-powered generation. Operators can instantly adjust generation supplies to meet the demand for electricity in real time as data are fed directly into NYISO’s operational systems that balance load and generation.
Wind generating stations are sometimes concentrated in a relatively small area to benefit from the wind potential. However, the electric transmission capacity within this area may be insufficient to transfer all the energy that could potentially be generated from these units. This phenomenon is often referred to as “bottled energy.” The NYISO is currently concluding a study to assess the impacts of higher penetration of wind plants within the State. A draft of this study is expected to be available by 2010 and will identify issues that may be related to bottled wind energy.
Siting
New York does not have a permitting process that is tailored for different size wind projects. Securing siting permits and community approvals can prove costly and time-consuming because most towns do not have knowledge of the economic and technical/practical implications of siting wind turbines. The 2008 Renewable Energy Task Force Report identified the need to address local siting and permitting barriers for small wind projects. 96 In the absence of specific local ordinances, the local approval process for small scale wind projects often defaults to the large scale wind reviews, which is a scale of review that far exceeds the requirements necessary for small wind turbines. 97
The PSC regulates the siting of electric generating facilities with capacities of 80 MW and greater. 98 In the absence of specific regulations, new wind construction, like new fossil-fuel powered generation, is required to undergo a comprehensive SEQRA review that addresses environmental impacts. To address special environmental concerns associated with wind projects, guidelines for pre- and post-construction bird and bat surveys have been issued by DEC. 99 The guidelines provide direction in assessing ongoing and expected environmental impacts and also provide recommendations to the lead agency under SEQRA regarding the construction and operation of wind facilities. Depending on a project’s specific location and size, other permits may also apply, such as Tidal Wetlands Permits, Freshwater Wetland Permits, Construction Storm Water Permits, and Coastal Erosion Control Permits.
95 GE Energy Consulting (prepared for NYSERDA). The Effects of Integrating Wind Power on Transmission System Planning, Reliability and Operations. 2005. http://www.nyserda.org/publications/wind_integration_report.pdf 96 Renewable Energy Task Force. Clean, Secure Energy and Economic Growth: A Commitment to Renewable Energy and Enhanced Energy Independence. 2008. 97 Network for New Energy Choices. Taking the Red Tape out of Green Power. 2008. http://www.newenergychoices.com/uploads/redTape-rep.pdf 98 A Certificate of Public Convenience and Necessity from the PSC is required for electric generating facilities larger than 80 MW. 99 DEC, Division of Fish, Wildlife and Marine Resources. Guidelines for Conducting Bird and Bat Studies at Commercial Wind Energy Projects. 2009. http://www.dec.ny.gov/docs/wildlife_pdf/windguidelines.pdf

Renewable Energy Assessment
36
Siting offshore wind projects in New York presents additional challenges. Underwater lands near shore are under the jurisdiction of the Office of General Services (OGS), and the State has the authority to grant leases for the use of underwater lands targeted for offshore wind development. In addition to the State permits and SEQRA review that are required for land-based wind projects, offshore projects also require approvals from federal regulatory and permitting agencies.
3.3 Bioenergy
Biomass and its derivative products, such as biogas 100 and liquid biofuels, 101
Since the publication of the 2002 State Energy Plan, interest in developing New York’s bioenergy resources has moved from research and development efforts to mainstream government attention. For many years prior to the 2002 State Energy Plan, NYSERDA conducted research to explore and develop various biomass feedstocks and related technologies. Growing interest in bioenergy became apparent in 2004 with the introduction of the RPS, which supported wholesale Main Tier biomass generation and small-scale Customer-Sited Tier generation, chiefly with ADG. In 2008, the Renewable Energy Task Force Report called for the development of a Biofuels Roadmap, the development of which will be completed by late 2009.
are organic, non-fossil plant materials initially produced through photosynthesis that are collectively known as bioenergy. The sources of bioenergy are diverse and can include wood and scrap forest materials, waste material from the forestry and pulp and paper industries, specialized energy crops, decomposed organic waste and the resulting methane stream, and liquid fuels derived from corn, sugar cane, or soybeans. The uses of bioenergy are similarly broad and include direct combustion to provide heat or generate electricity, the conversion of biomass into ethanol or biodiesel to create liquid transportation fuel, and the use of methane gas generated in landfills as a primary fuel or for electricity generation. Table 12 shows New York’s primary energy use attributable to biomass, biogas, and biofuel energy resources for 2001 through 2007.
102
The Biofuels Roadmap will be used to more accurately estimate New York’s indigenous biomass technical/practical potential, to understand the economic and environmental impacts of biofuels, and to develop comprehensive bioenergy policies.
100 Biogas is the gasified product of biomass or the methane produced from the anaerobic decomposition of biomass from sources such as landfills, wastewater treatment plants, manure and other agricultural byproducts, sewage treatment facilities, and food and beverage processing, sales, and distribution facilities. 101 Biofuels are liquids derived from biomass, through chemical, thermal, and biological processes. Ethanol and biodiesel are the dominant biofuels currently available and will be the focus of this Assessment. Biofuels are typically blended with petroleum products, e.g., ethanol with gasoline and biodiesel with diesel, and used as transportation fuels. 102 Renewable Energy Task Force. Clean, Secure Energy and Economic Growth: A Commitment to Renewable Energy and Enhanced Energy Independence. 2008.

Renewable Energy Assessment
37
Table 12. 2001-2007 New York Primary Energy Use from Biomass, Biogas, and Biofuel Energy Resources
3.3.1 Bioenergy Electricity Generation
Forest product resources such as wood can be used to generate electricity at dedicated biomass plants and also in co-firing applications where the biomass is used to supplement fossil fuel use at modified fossil fuel plants.
Central Electric Generation
103 Table 13 lists the three central electric generation facilities in New York that currently use wood-based products as a fuel source (65 MW total capacity), as well as the one that is under development (4 MW total capacity).
Table 13. Existing and Planned Wood-based Generation Plants in New York
103 A variety of combustion technologies are available including biomass stoker, which consists of a mechanical apparatus to continuously feed fuel into a boiler or furnace while optimizing air intake. Fluidized bed repower technology uses biomass fuel in retired or existing steam units. The fluidized bed consists of a vessel containing a bed or solid particles, such as sand, through which air or another fluid is blown such that the fuel is suspended as it is combusted.
Residential Transportation
Biomass 2
(Wood)Biomass 2
(Wood)
Biomass 2
(Biogenic Waste)
Biomass 2
(Wood)
Biomass** (Biogenic
Waste)
Biofuel 2
(Ethanol)Biomass (Wood)
Biomass (Biogenic
Waste)
Biogas (Landfill Methane)
2001 55.1 9.7 2.5 17.2 0.6 0.4 5.0 10.7 2.0 103 4,0692002 55.9 9.9 2.5 13.5 0.5 0.3 4.1 10.3 2.7 100 4,0262003 58.9 10.3 2.4 13.4 0.5 1.9 4.1 10.2 2.6 104 4,1872004 60.3 10.1 2.5 16.7 0.5 24.4 5.0 10.3 2.6 133 4,2602005 66.2 10.1 2.6 16.4 0.5 27.1 5.2 10.9 2.6 142 4,2122006 60.3 9.3 2.6 16.6 0.5 60.2 5.1 10.7 3.3 169 4,0052007 67.7 9.7 2.4 16.9 0.5 80.3 4.8 10.4 3.6 196 4,129
New York State Biomass, Biogas, and Biofuel Energy Resources (TBtu)
22007 data was estimated based on U.S. growth rate from 2006 to 2007.
Note: Assumes a rolling 3 year average NYS fossil fuel conversion factor for renewable electricity resources.1Net-metered, customer-sited renewable electricity primary energy consumption increased from less than 0.1 TBTUs in 2001 to approximately 0.3 TBTUs in 2006. In 2006 solar-PV
Year
Commercial Industrial Electricity1
Total Biomass, Biogas & Biofuel
Total State Primary Energy
Source: NYSERDA. Patterns & Trends – New York State Energy Profiles: 1993 - 2007 . 2009. http://www.nyserda.org/energy_information/patterns%20&%20trends%201993-2007.pdfSource: EIA. State Energy Data System: New York, 2001 - 2007 . 2009. http://www.eia.doe.gov/emeu/states/state.html?q_state_a=ny&q_state=NEW%20YORK
Facility Capacity (MW)
Annual Output (MWh)
Description
Niagara Generation 26 180,500 Cofiring coal and biomassChateaugay Power Station 20 128,000 650 tons of wood-based biomassLyonsdale Biomass LLC 19 131,238 700 tons of wood including mill wastes, urban
waste wood, and palletsTotal 65 439,738
AES Greenidge 41 28,500 Cofiring with coal
Existing Facilities
Planned Facilities (2008)
1Component of existing 500 MW coal fired generation plant.Source: NYSERDA. New York State Renewable Portfolio Standard Performance Report: Program Period ending June 2008 . 2008. http://www.nyserda.org/rps/RPSPerformanceReportWEB.pdf
Note: Chateaugay Power Station and Lyonsdale Biomass LLC are maintenance resources.

Renewable Energy Assessment
38
Municipal solid waste, which includes biogenic and non-biogenic waste, can also be used to generate electricity. New York’s Environmental Conservation Law (ECL) 27-0106 outlines the State’s solid waste management policy, which calls for the recovery of energy from solid waste that cannot be economically and technically reused or recycled. Where technically, environmentally, and economically achievable, the policy states that municipal waste combustors (MWCs) are the preferred alternative to landfills for the management of solid waste. MWCs export both electricity (approximately 650 kWh per ton of solid waste combusted in a modern facility) and steam for consumer use, while also supplying electricity for their own operational needs.
Ten MWCs currently operate in New York. In 2007, these facilities processed almost four million tons of solid waste and produced approximately two million MWh of electric energy. Two MWCs provided approximately three million tons of steam for direct use off-site. The Covanta Hempstead facility in Nassau County will be submitting a permit application for an additional unit that will process up to an additional 0.4 million tons per year and an additional 29 MW of generating capacity. In 2007, approximately 11.3 million tons of municipal solid waste generated in New York was disposed of in landfills or exported out-of-state.
The next generation of municipal waste conversion technologies is currently being developed. These new technologies use advanced thermal, biological, or chemical processes to convert the organic portion of the waste stream into a syngas which can be used to produce electricity, synthetic fuels, or chemical products.
In addition to MWCs, landfills can be a part of the waste-to-energy picture. Depending on the age and ultimate size of a landfill, it may be economically feasible to extract energy from the biogas, which is called landfill gas when used for this application. Landfill gas collection efficiency can range from 55 percent to 99 percent depending on the landfill’s design and operation. 104
104 SCS Engineers (prepared for Solid Waste Industry for Climate Solutions). Current MSW Industry Position and State-of-the-Practice on Landfill Gas Collection Efficiency, Methane Oxidation, and Carbon Sequestration in Landfills, 2007.
According to DEC, the interconnection costs have varied widely for such facilities, and have cost as much as $3 million, or 25 percent, for a $12 million project.
In 2007, twenty landfill gas recovery facilities (LGRF) were in operation in New York, and these facilities produced approximately 0.4 million MWh of electricity. In addition, the Fresh Kills Landfill produced approximately 1.5 million cubic feet (mmcf) of low Btu pipeline-quality gas. Four additional landfills, which flared approximately 2,660 mmcf of landfill gas during 2007, were in advanced planning and/or under construction for a LGRF. LGRF developers have indicated that the interconnection process is a critical, and often costly, path for their projects. The interconnection costs have varied depending on the location of the project and the connecting utility, and have been as high as $3 million for a landfill gas-to-energy project.
DEC is currently developing a new Solid Waste Management Plan (SWMP) which will include an analysis of the environmental and economic benefits of its recommendations to maximize material and energy recovery and to reduce waste. The draft SWMP will place a priority on reducing materials that end up as waste and will recommend a plan that may negate the need for any new disposal capacity. Potential projects on the horizon in New York include the proposed Taylor Gasification Facility in Montgomery County and the proposed Casella research, development, and deployment (RD&D) thermal-chemical dissociation and catalytic reactor in Ontario County.
http://www.scsenergyservices.com/Papers/FINAL_SWICS_GHG_White_Paper_07-11-08.pdf

Renewable Energy Assessment
39
Customer-Sited Generation
Biogas in the form of ADG can also be used for distributed electric generation. In New York, the majority of customer-sited biogas potential resides with farms, municipal wastewater treatment plants, and food and beverage manufacturing facilities. DPS reported that 913 kW of net-metered, customer-sited ADG electric generation was brought online in New York between 1999 and 2006, representing approximately 6 percent of the total installed customer-sited net-metered renewable electric systems in the State during that time period. As of October 2007, NYSERDA had supported approximately 1.3 MW of farm-based ADG systems at nine project sites. NYPA has also installed 15 ADG-fed fuel cell systems, 12 of which it owns. The total generation capacity of the NYPA systems is approximately 1.8 MW. This installed capacity underestimates the total use of ADG in New York as significant amounts of biogas are used at municipal wastewater facilities, most of which are not included in the net-metered data-set.
Of New York’s 590 municipal wastewater treatment plants, 145 (approximately 20 percent) have ADG facilities in place. Seventeen municipal wastewater treatment plants currently report having internal combustion engines with generator sets, microturbines, and/or fuel cells that operate using ADG and have a total estimated electrical generation capacity of 9 MW. The majority of these facilities are not net-metered, and some facilities include units that are not grid-connected. Approximately 45,000 MWh of electricity is generated annually by municipal wastewater treatment plants in New York. 105
3.3.2 Non-Electric Bioenergy
Biomass
New York residents use significant amounts of biomass, particularly wood, as a primary fuel. As shown in Table 12, residential use of wood grew from 55 TBtu in 2001 to 68 TBtu in 2007, an increase of 23 percent. Commercial customers used between 9 TBtu and 10 TBtu of wood per year over the same time period, as well as approximately 2.5 TBtu of biogenic waste, with no discernable change in use of either fuel. Industrial use of wood has ranged between 13 TBtu and 17 TBtu over the 7 year period, with no change in use patterns.
Heating technologies used for biomass combustion include wood stoves, pellet stoves, hydronic heaters, pellet boilers, fireplace inserts and masonry heaters. EPA is in the midst of a New Source Performance Standard review of each of these bioheating technologies within the residential sector. 106 The agency is also developing a New Area Source Rule which will set new emissions standards and control requirements for all commercial-sized boiler types, including wood-fired ones. 107
Conventional wood boiler technology is less efficient and has two orders of magnitude more emissions, especially particulate matter, than the newer two-stage gasification boilers developed in Austria that achieve thermal efficiencies over 80 percent. 108 New York is embracing this next generation of wood boiler systems by partnering with four Upstate manufacturers who are anticipating the expansion of the industry in the State. One of these manufacturers, Advanced Climate Technologies of Schenectady, has the exclusive North American manufacturing rights to an Austrian gasification technology and is
105 Malcolm Pirnie, Inc. (prepared for NYSERDA). Market Characterization Report: Anaerobic Digester Gas-to-Electricity for the Municipal Wastewater Sector in New York. 2007. 106 EPA. Strategies for Reducing Residential Wood Smoke. 2009. http://www.epa.gov/burnwise/pdfs/StrategiesDoc8-11-09.pdf 107 EPA. Area Source Standards. 2009. http://www.epa.gov/ttn/atw/area/arearules.html#current 108 Conventional technology demonstrates roughly 40-70 percent thermal efficiency.

Renewable Energy Assessment
40
manufacturing the first U.S.-produced high-efficiency commercial-sized pellet boiler. NYSERDA is also working with Alternative Fuel Boilers of Dunkirk to develop residential and small commercial boilers and is currently in negotiations for commercialization projects with other manufacturers. There is currently no ENERGY STAR®
New York also has a significant in-state wood pellet manufacturing industry. One of the largest regional manufacturers is New England Wood Pellet, which has a 100,000-ton capacity plant in Schuyler and is planning to build another facility in Deposit.
or third-party rating program for residential wood boilers, and the development of such a consumer program would aid in promoting the widespread use of efficient bioheating technologies.
109 Another large manufacturer is Curran Renewable Energy, which is located in Massena and operates a plant that has a capacity of 100,000 tons of pellets per year. 110 The feedstock for these plants is primarily wood that would have been used in the pulp industry prior to its decline. Sawdust from lumber mills and furniture manufacturing facilities also serves as feedstock. Like the boiler manufacturing industry, expansion within the State’s wood pellet industry is expected, as New York currently has a capacity of 350,000 tons per year of pellets and another 200,000 is planned to become available within the next two years. 111 A total of 550,000 tons of wood pellets is equivalent to 8.5 TBtu, 112
Expansion of the State’s bioheating system manufacturing industry will provide job growth in multiple sectors, as manufacturing spurs peripheral job creation. Potential areas of growth include sales, marketing, research and development, design and drafting, quality control, and engineering. Advanced Climate Technology plans to build a new boiler production facility and anticipates that the company will need to expand from 2 to 50 employees within two years to accommodate the production growth.
which represents 13 percent of the State’s residential wood consumption in 2007.
113 Job creation in areas like silviculture and wood processing will be necessary in order to supply the pellets and wood chips that are burned in the new high-efficiency systems. Job retention in these fields will prevent unemployment that could occur as a result of the recent decline in the traditional pulp and paper industry. Curran Renewable Energy currently employs 26 full-time staff members and plans to increase its operations in the near future by providing a market for over 200,000 tons of green chips from Seaway Timber Harvesting, its sister company that has been providing wood products to the paper industry for the past 20 years. 114 Curran Renewable Energy hopes to retain over 100 full time jobs at Seaway Timber Harvesting. New England Wood Pellet’s facility in Schuyler currently has 20 employees, and has saved approximately 90 logging jobs and created 15 jobs for local delivery companies. 115
The U.S. pellet industry is largely adhering to a voluntary standard that conforms to the European standard for the export market and also results in good performance in U.S. pellet stoves and boilers. However, there is no standardization within the wood chip manufacturing industry. In the U.S., wood chips have a moisture content of approximately 40 percent, significantly higher than that of Europe,
New England Wood Pellet also has a plant in Deposit that is expected to go online in 2010, and the manufacturer anticipates 20 employees at that facility, as well as the retention of 150 logging jobs and the creation of 6 positions at delivery companies.
109 State of New York Office of the Attorney General. Smoke Gets in Your Lungs: Outdoor Wood Boilers in New York State. 2008. http://www.oag.state.ny.us/bureaus/environmental/pdfs/Smoke%20Gets%20in%20Your%20Lungs%20Revised%20March%202008.pdf 110 http://www.curranpellets.com/index.html 111 NYSERDA, personal communication with New York State pellet manufacturers. October 2009. 112 Based on EIA’s conversion factor of 17 MMBtu/ton. http://www.eia.doe.gov/cneaf/solar.renewables/page/wood/wood.pdf 113 NYSERDA. Communication with Advanced Climate Technologies. October 2009. 114 NYSERDA. Communication with Curran Renewable Energy. October 2009. 115 NYSERDA. Communication with New England Wood Pellet. October 2009.

Renewable Energy Assessment
41
which is typically 20 percent. 116 As high-efficiency gasification systems become more popular in the United States, a standard that specifies the ash and moisture content of wood chips may be necessary to optimize performance of the technologies. Advanced wood chip boilers perform best using fuel with a moisture content of no more than 30 percent. 117
NYSERDA has provided support for research addressing both biomass combustion technologies and fuel standards. 118 Specifically, NYSERDA-supported projects have:
• Evaluated the energy efficiency and emissions performance of conventional and advanced technologies
• Evaluated the energy, moisture, and chemical composition of biomass feedstocks
• Developed advanced boiler technologies by supporting R&D and commercialization with New York manufacturers
• Demonstrated advanced technologies in representative applications
• Provided objective scientific information for the development of high-efficiency and low-emissions biomass heating initiatives in New York
NYSERDA is supporting a demonstration project at Clarkson University, where a 0.5 MMBtu wood pellet-fired boiler will be evaluated by the Center for Air Resources and Engineering Science. This unit will be studied extensively in order to evaluate its energy efficiency and emissions profile. Clarkson University will also evaluate a similar system fueled by wood-chips that will be installed at the Cayuga Nature Center.
NYSERDA is also supporting a demonstration project at the Wild Center Natural History Museum, where a 1.7 MMBtu wood pellet-fired boiler will be integrated with a solar-thermal hot water system and a hot water storage system. This demonstration will use two renewable energy systems and optimize their performance. If there is a demand for heat, the solar-hot water system will provide hot water to the heating system, and when there is no demand, the hot water will be kept in the storage tank. When the heating demand cannot be met with the stored water, the pellet boiler will produce hot water that will heat the museum and re-heat the water in the storage tank. This integration of systems will optimize the solar thermal system on chilly mornings in the spring, summer, and fall when the heating system may not be needed. It will also optimize the pellet boiler by using the hot water storage system to reduce boiler cycling.
In order to create a viable and sustainable high-performance bioheating industry and market, the State should undertake a five-tier market transformation effort which may include:
• Addressing the low-efficiency bioheating systems currently in the market place
116 NYSERDA. Biomass Combustion in Europe: Overview on Technologies and Regulations. 2008. http://www.nyserda.org/programs/Environment/EMEP/Report%2008-03%20-%20Biomass%20Combustion%20in%20Europe-complete-after%20corrections.pdf 117 NYSERDA. Biomass Combustion in Europe: Overview on Technologies and Regulations. 2008. 118 A full list of NYSERDA projects can be found at: http://www.nyserda.org/programs/Research_Development/biomasscasestudies.asp

Renewable Energy Assessment
42
• Establishing a regulatory floor for new high-efficiency systems
• Setting a voluntary standard for the best new systems
• Continuing to assist New York manufacturers in developing new high-efficiency technologies
• Ensuring that New York has a skilled workforce to deliver these products and services
The State is preparing a step-by-step guidebook to lower the information cost barriers that developers of small-scale biomass electricity projects may face, including codes, siting and permitting issues, land, water, air, noise/visual concerns, and information on financial assessment and economic incentives. This guidebook is expected to be released in spring 2010.
Biofuels Distribution
Biofuels have begun to penetrate the residential home heating fuel market in a blend of approximately 2 percent biodiesel and 98 percent home heating oil, by volume, that is marketed as Bioheat
Residential Sector
® and sold by at least 24 retailers in New York. Given market conditions and current federal and State financial incentives, biodiesel is sometimes mixed into heating oil without the retailer changing the product name, and the resulting product is sold as generic heating oil. This practice indicates that the use of biodiesel does not demand a price premium.
The distribution infrastructure for transportation biofuels—ethanol and biodiesel—continues to grow in New York as federal and State support increase and the fuels become more widely available. Approximately 28 biodiesel and 7 ethanol distributors and terminals are operating in the State, six of which receive State funding.
Transportation Sector
The number of biofuel retail stations, including stations that dispense E85 and blends of biodiesel up to B20, 119 has grown dramatically in New York due in part to favorable biofuel prices and State funding programs that promote new retail stations. 120
Total annual ethanol use in New York grew to approximately 17,000 barrels (60 TBtu) in 2006, or 8.4 percent of the motor gasoline fuel mix, due in part to the phase-out of methyl tertiary butyl ether (MTBE) in 2004. Most of this fuel was blended with gasoline to produce E10 and was sold as motor gasoline fuel. A small percentage (less than 0.5 percent) was sold as E85 and used in flexible-fueled vehicles. That
Currently, at least 11 retail stations offer biodiesel blends and 33 retail stations offer E85. New York has provided funding to eight of these stations, and 18 more stations are awaiting final funding approval. For a description of the vehicles capable of operating using E85, refer to the Transportation Issue Brief.
119 The format of the definition of a biofuel blend is ‘BXX’ or ‘EXX’, where ‘B’ = biodiesel and ‘E’ = ethanol, and ‘XX’ refers to the blend percentage by volume. For example, ‘E85’ refers to an 85 percent blend of ethanol with gasoline by volume. 120 New York has a number of financial incentives in place to support biofuel production and use, including: Biofuel Station Initiative, Biofuel Distributor Program, Alternative Fuel Vehicle (AFV) and Fueling Infrastructure Funding, and Alternative Fuel Technical Assistance. The objective of the Biofuel Station Initiative is to increase the number of retail E85 and blended biodiesel service stations in New York. The Initiative provides a reimbursement of 50 percent of the costs, up to $50,000 per site, for new installations of biofuel dispensing equipment, storage tanks, and associated piping equipment. NYSERDA. Alternative-Fuel Vehicle Program. 2009. http://www.nyserda.org/programs/transportation/AFV/default.asp

Renewable Energy Assessment
43
percentage could increase in the near-term, however, since sales of E85 have been increasing at an annual average rate of approximately 25 percent in recent years.
Biofuels Production
Ethanol
Corn-derived ethanol production in New York began in November 2007 with the opening of the Western New York Energy ethanol plant in Shelby (Orleans County), which has an annual capacity of 60 million gallons. Less than a year later, Northeast Biofuels began partial plant operation in Volney (Oswego County) at a facility that has an annual capacity of 114 million gallons. The Northeast Biofuels facility was purchased by Sunoco, Inc. in June 2009 and is expected to supply approximately 25 percent of the company’s ethanol sales. 121
The State has supported the development of advanced cellulosic ethanol production facilities. In 2006, New York provided grants totaling $25 million to two pilot facilities that can produce more than 500,000 gallons of ethanol per year, and the expected feedstocks will include locally sourced willow, paper-mill sludge, and switchgrass. Though ethanol is currently being produced within New York, imports from elsewhere in the United States continue to make up the bulk of the ethanol consumed in the State.
Biodiesel
New York imports most of its biodiesel from other states as well. New York’s only biodiesel manufacturing facility, Northern Biodiesel, began operating in Ontario in early 2008 and has a capacity of 7.5 million gallons per year.
3.3.3 Bioenergy Technical/Practical Potential
Biomass has significant potential to contribute to New York’s energy mix, though a detailed analysis of the available potential of sustainably harvested resources has not been conducted. The Biofuels Roadmap will include an assessment of the State’s indigenous technical/practical biomass potential, and preliminary draft estimates of the current and very near-term feedstock technical/practical potential that can be achieved using current practices and technology have been made available for this Assessment. Agricultural land technical/practical potential, which includes feedstocks of corn stover, straw, and dedicated energy crops such as grass or willow, amounts to 8.2 million dry tons of biomass. Forest land technical/practical potential, which includes mill residues, logging residue, and available timber, amounts to 6.4 million dry tons of biomass. In combination, these feedstocks could provide approximately 250 TBtu of primary energy to New York’s energy mix. Combined with the current level of consumption, the total forest and agricultural products primary energy technical/practical potential is 350 TBtu.
Beyond forest and agricultural products, New York’s municipal wastewater treatment plants, food and beverage manufacturing facilities, and farms hold significant potential for biomass energy production in the form of biogas. Currently, municipal wastewater treatment plants are estimated to produce 5.2 billion cubic feet of ADG per year and have the potential to produce 6.7 billion cubic feet per year (approximately 3.7 TBtu annually). New York’s 128 active food and beverage manufacturing facilities have an estimated biogas technical/practical potential of 3.8 billion cubic feet per year, or approximately
121 Sunoco. Sunoco Completes Purchase of Ethanol Manufacturing Facility in Volney, New York. 2009. http://phx.corporate-ir.net/phoenix.zhtml?c=99437&p=irol-newsArticle&ID=1299146&highlight=

Renewable Energy Assessment
44
2.1 TBtu per year. 122 (Note that an unspecified percentage of the food and beverage manufacturing facilities discharge to wastewater treatment plants, so the totals are not additive.) Finally, it has been estimated that New York’s farms have the potential to produce 6 TBtu of ADG annually. 123
The Biofuels Roadmap will develop a comprehensive assessment of potential biofuels use in New York. State, regional, and federal policies will continue to encourage the development and use of biofuels, and they have begun to include sustainability metrics. Scenario 2 of the draft Biofuels Roadmap’s preliminary analysis estimates that approximately 1.2 billion gallons of ethanol could be produced from sustainably harvested biomass (agricultural and forest products). This would replace approximately 20 percent of the gasoline forecasted to be used in the State in 2018.
Therefore, a conservative estimate of New York’s biogas technical/practical potential is approximately 10 TBtu.
3.4 Solar Energy
For the purposes of this Assessment, solar energy is classified into two separate categories: solar power and solar thermal. Solar power refers to the conversion of sunlight into electricity either directly through solar-PV systems or indirectly by heating fluid used to operate electric generators that produce electricity for residential and commercial use. Solar thermal energy is a general term for solar energy that is used to meet non-electrical demands such as the heating of domestic water and space heating and cooling.
3.4.1 Electric Generation Using Solar-PV
Figure 8 shows that 9.7 MW of net-metered, customer-sited solar-PV was brought online in New York between 1999 and 2006, which represented 28 percent of the customer-sited net-metered renewable electric system capacity installed in New York during that time period. Most of the net-metered solar-PV systems in New York (66 percent) were installed in the LIPA service territory. Long Island is an advantageous location for implementation of this technology because of its southernmost location in the State, its relatively high electricity rates, and the availability of customer incentives.
122 Malcolm Pirnie, Inc. (prepared for NYSERDA). Market Characterization Report: Anaerobic Digester Gas-to-Electricity for the Municipal Wastewater Sector in New York. 2007. http://www.nyserda.org/Programs/Environment/MC08-02%20Anaerobic%20Digester%20GTE%20Wastewater.pdf 123 Optimal Energy Inc. (prepared for NYSERDA). Energy Efficiency and Renewable Energy Resource Development Potential in New York State. 2003.

Renewable Energy Assessment
45
Figure 8. 1999-2006 Cumulative Capacity of Customer-Sited, Net-Metered Solar-PV Systems
Figure 9 shows the cumulative capacity of net-metered solar-PV installations in New York by service territory for the period of 1999 through 2006. 124
Figure 9. 1999-2006 Cumulative Capacity of Customer-Sited, Net-Metered Solar-PV Systems by Service Territory
By the end of 2006, NYSERDA had supported the installation of 3.8 MW of solar-PV systems outside of the LIPA service territory. This represents over 39 percent of the total solar-PV installation capacity in New York, or more than 71 percent of the solar-PV installations outside of the LIPA service territory.
124 2006 is the latest available data.
0
2
4
6
8
10
12
1999 2000 2001 2002 2003 2004 2005 2006
Net
-met
ered
Cum
ulat
ive
PV In
stal
latio
ns
(MW
)
Cumulative Capacity of Customer-Sited, Net-Metered PV Systems in New York
Source: DPS & LIPANote: All PV data are reported as alternating current (AC) with the exception of LIPA, which is reported as direct current (DC). DC values are typically on the order of 10 percent larger than AC values.
0
0.5
1
1.5
2
2.5
3
3.5
4
4.5
5
CENY CHGE LIPA NMPC NYSEG ORU RGE
Net
-met
ered
Cum
ulat
ive
PV In
stal
latio
ns
1999
-20
06 (M
W)
Cumulative Capacity of Net-Metered PV Systems in New York by Service Territory (1999 - 2006)
Source: DPS & LIPANote: LIPA data were reported in direct current (DC) rather than alternate current (AC), which the rest of the data were reported in. AC values are typically on the order of 10 percent lower than DC values.

Renewable Energy Assessment
46
NYSERDA manages programs that promote installations of residential solar-PV. In 2005, 2006, 2007, and 2008, residential solar-PV installations totaled 1.0 MW, 1.8 MW, 3.5 MW, and 7.2 MW, respectively. Funding requests for solar-PV outstripped the initial PSC authorization of funding for the Customer-Sited Tier Solar-PV Program under the RPS, resulting in subsequent PSC authorizations of new funding to keep pace with market demand for the technology.
3.4.2 Solar Thermal Use
In 2005 and 2006, New York was among the top five U.S. states receiving the largest number of shipments of solar thermal equipment, receiving 499,000 and 607,000 square feet of solar thermal panels, respectively. In 2007, New York received 425,000 square feet of solar thermal panel shipments and ranked eighth among U.S. states. The State’s fluctuating volumes of shipments paralleled the trend in total U.S. shipments, which decreased by 27 percent between 2006 and 2007. The quantity of New York’s shipments each year was actually quite small relative to total U.S. shipments, representing approximately 3 percent of the total for 2007. The actual use of solar thermal systems throughout New York has not been adequately documented, and the State’s solar energy policy could benefit from surveys of the current state of the solar thermal industry.
125
3.4.3 Solar Energy Technical/Practical Potential
In 2008, DOE used 2005 forecast data to examine how solar-PV electricity will compare to conventionally generated electricity throughout the United States in 2015.
Solar-PV Technical/Practical Potential
126
As of 2006, New York had 9.7 MW of installed net-metered solar-PV. In early 2008, the Renewable Energy Task Force recommended building a sustainable market for solar energy and called for the development of incentives to reduce system cost, programs to attract solar equipment manufacturers, and workforce development of installers and technicians.
The analysis suggested that due to the continuing downward trend of solar-PV system costs, solar-PV could become cost-competitive with the escalating retail electricity prices across most of New York, without incentives, by 2015. Since 2005, there have been large fluctuations in the demand for silicon cells and the global economy has experienced a downturn. Therefore, it is speculated that if DOE were to redo its analysis with more current forecast data, the point at which solar-PV could potentially become cost-effective without the aid of incentives would likely occur after 2015.
127
125 Unless otherwise noted, all solar thermal data comes from EIA.
The Renewable Energy Task Force also recommended that New York adopt a goal of achieving 100 MW of solar-PV installations statewide by 2011. As mentioned earlier, the NYPA and LIPA power purchase agreements will exceed this recommendation.
126 DOE, Solar Technologies Program. Solar Energy Industry Forecast: Perspectives on U.S. Solar Market Trajectory. 2008. http://giffords.house.gov/DOE%20Perspective%20on%20Solar%20Market%20Evolution.pdf 127 Renewable Energy Task Force. Clean, Secure Energy and Economic Growth: A Commitment to Renewable Energy and Enhanced Energy Independence. 2008.

Renewable Energy Assessment
47
In the United States, approximately 60 percent of the typical home’s energy usage is devoted to heating, with space heating requiring more than three times the amount of energy used for water heating.
Solar Thermal Technical/Practical Potential
128 In a typical commercial building, approximately 30 percent of energy use goes toward heating. The industrial sector uses almost twice as much energy for process heating as the residential sector does for hot water heating. 129 On a national level, fossil fuels provide energy for the majority of heating needs at 81 percent, while electricity provides energy for approximately 15 percent of heating needs. 130
Comprehensive assessments of the total solar thermal technical/practical potential to displace conventional heating sources have not been conducted for New York. The results of a recent assessment of SDHW systems in New York State indicated that solar thermal energy could potentially provide over half of the energy required for water heating in a typical home that has adequate access to sunlight.
131 This study examined the use of three common solar domestic hot water technologies and found them to be cost-effective when compared to electric and (in some cases) propane-fueled heating equipment if pre-2008 State and Federal tax credits were used.
The Renewable Energy Task Force recommended that New York install 1,100 solar thermal systems statewide by 2011.
132
133 The 2008 Renewable Energy Task Force Report acknowledged that even for situations where a solar thermal system presents a positive net-present value, the up-front capital cost of a SDHW system may present a barrier to widespread adoption, necessitating financial support to increase deployment. State workforce development programs for solar thermal installers are needed and would ideally meet certification under the North American Board of Certified Energy Practitioners Solar Thermal Installer Certification program. 134 To address this need, NYSERDA is currently supporting the development of solar thermal training in 11 schools and organizations across the State. NYSERDA has also submitted a proposal to a Department of Labor stimulus funding opportunity to secure further support for solar thermal workforce training in New York. As a result of NYSERDA’s efforts to date, SUNY Orange County Community College and SUNY Ulster County Community College began holding solar thermal courses in fall 2009. Solar thermal training programs may have to be expanded in the near future, as solar thermal measures are eligible under the Green Jobs-Green New York Program that is to be launched in spring 2010.
In October 2009, the New York State Solar Thermal Consortium (STC) gathered to begin the process of creating the New York State Solar Thermal Roadmap, a document that will provide guidance on how
Solar Thermal Roadmap
128 DOE, EERE. 2008 Buildings Energy Databook. 2008. http://buildingsdatabook.eere.energy.gov/docs/DataBooks/2008_BEDB_Updated.pdf 129 EIA.2002 Manufacturing Energy Consumption Survey. 2002. http://www.eia.doe.gov/emeu/mecs/mecs2002/data02/shelltables.html 130 EIA. 2002 Manufacturing Energy Consumption Survey, 2003 Commercial Buildings Energy Consumption Survey, 2005 Residential Energy Consumption Survey. 131 NYSERDA. Solar Domestic Hot Water Technologies Assessment: Final Report 08-09. 2008. http://www.nyserda.org/publications/Report%2008-09%20Solar%20Domestic%20Hot%20Water%20-%20web.pdf 132 NYSERDA. Solar Domestic Hot Water Technologies Assessment: Final Report 08-09. 2008. 133 Renewable Energy Task Force. Clean, Secure Energy and Economic Growth: A Commitment to Renewable Energy and Enhanced Energy Independence. 2008. 134 North American Board of Certified Energy Practitioners’ description of the Solar Thermal Installer Certification. http://www.nabcep.org/certification/solar-thermal-installer-certification

Renewable Energy Assessment
48
New York State can establish a strong solar thermal industry and realize this technology’s potential. The STC is a collaborative effort led by Clarkson University, the New York Solar Energy Industry Association and The Solar Energy Consortium that includes representation from industry, labor unions, government, regulatory entities, and public advocates. These organizations have joined this collaboration because they recognize the many benefits of solar thermal technologies, including its high conversion efficiency, cost-effectiveness for water heating applications, and competitive cost advantage for avoiding CO2
3.4.4 Solar Energy Challenges
emissions when displacing fossil-fueled water heating applications.
The primary goal of the STC is to establish New York as a national leader in solar thermal R&D, manufacturing, and deployment. Through the Solar Thermal Roadmap, the STC aims to increase public awareness and acceptance of solar thermal technologies while encouraging private investment in the solar thermal industry throughout the State. The Roadmap will address issues such as public and private sector roles, workforce development needs, university research assets available for industry support, strategic alliances with national and international organizations, and solar thermal technology’s initial capital cost barrier. The STC plans to publish the Solar Thermal Roadmap in March 2010.
There are considerable challenges with respect to widespread deployment of solar energy systems, including technological, regulatory, and cost concerns. State and federal governments can help to address these concerns by supporting market transformation programs and committing to long-term incentives. For example, one program being considered under RGGI targets the residential sector and would provide incentives for the installation of solar thermal water heaters that replace fossil-fuel domestic hot water systems. Roll-out of this program could begin in early 2010.
Solar technologies also received support through the federal government’s 2008 decision to extend the Solar Investment Tax Credit (ITC) for eight years and remove the $2,000 cap, permitting the full use of the 30 percent credit. This decision sent an important signal of support to both the solar-PV and solar thermal marketplaces.
135
Net metering provides a further incentive to end-users to install solar-PV by allowing the customer to, in essence, run their meter backwards when the solar system generates more power than is required by the customer. In 2008, New York’s net metering laws were amended to increase the maximum size of residential systems to 25 kW, and for the first time allowed commercial systems. The amended law limits commercial systems to the lesser of 2 MW or the customer’s peak demand.
136
137
135 More information on the RGGI program can be found at
However, barriers to wider deployment of net metered systems in the commercial sector remain. First, not all commercial customers have a demand meter, making it difficult to determine the customer’s peak demand. This has led to disagreements between customers and utilities over determinations of peak demand and thus the size of eligible systems that can be net metered. Second, depending on a customer’s load profile, a system
http://www.nyserda.org/RGGI/ 136 The federal ITC covers costs including labor costs properly allocable to the onsite preparation, assembly, or original installation of the property and for piping or wiring to interconnect such property to the home. In October 2008, the President signed the Emergency Economic Stabilization Act of 2008 to encourage investments in solar energy, including eight-year extensions of the business and residential ITC. Internal Revenue Service for 5695. Residential Energy Efficiency Property Credit. 2008. http://www.irs.gov/pub/irs-pdf/f5695.pdf Solar Energy Industries Association. Solar Investment Tax Credit Frequently Asked Questions. 2008. http://www.seia.org/galleries/pdf/ITC_Frequently_Asked_Questions_10_9_08.pdf 137 Chapter 355 of the Laws of 2009 expands New York's net metering law by adding residential micro-CHP systems to the list of currently eligible technologies that can be net metered.

Renewable Energy Assessment
49
limited by their peak demand could result in a system that is insufficient to meet the customer’s full energy requirements.
A vibrant solar marketplace will require a skilled workforce and access to capital. To support continued growth, existing training programs at public and private colleges and universities throughout the State should be expanded and new programs developed.
In addition, the State incentives for solar-PV systems should be consistent, and incentive levels should reflect the changing economics of solar over time. The development of loan fund programs and utility and municipal financing programs can also serve to make resources available to interested end-users that lack sufficient initial funding. Other measures recommended by DOE’s Solar Energy Technologies Program 138 include:
• Streamlining solar permitting
• Facilitating interconnection to the grid
• Encouraging homeowner associations to limit restrictions against solar technologies
• Establishing installer and code official training centers
• Creating public outreach and information campaigns
In addition, compared with the rest of the continental United States, New York has one of the lowest average solar energy densities, implying that harnessing solar potential in New York is more expensive compared to other States. However, average solar energy density is not necessarily a good predictor of this resource’s potential. Though its average solar thermal density is approximately 23 percent lower than New York’s, Germany currently leads the world in solar-PV with 5.3 GW of installed capacity, which represents 40 percent of total global capacity. 139 New York’s 2.8 million single family homes represent solar potential that far exceeds the capacity of the current world leader.
3.5 Geothermal Energy
3.5.1 Geothermal Use
In this Assessment, geothermal energy refers to two different uses of the earth’s thermal properties: supporting the generation of electric power and the transfer of heat to or from a building. Geothermal power is the generation of electric power from heat stored below the earth’s surface in the form of hot water, hot rocks, or lava. New York does not currently generate electricity from geothermal resources. A geothermal heat pump, or ground-source heat pump, is an electrically-driven heat pump that uses the nearly constant temperature of the earth, instead of outside air, to heat or cool a building's air or water supply. The use of a geothermal heat pump is often classified as an energy efficiency measure, as it requires less electricity than a traditional air-source heat pump.
138 DOE, Solar Technologies Program. Solar Energy Industry Forecast: Perspectives on U.S. Solar Market Trajectory. 2008. http://giffords.house.gov/DOE%20Perspective%20on%20Solar%20Market%20Evolution.pdf 139 International Energy Agency. Trends In Photovoltaic Applications: Survey Report of Selected IEA Countries between 1993 and 2008, Table 1. 2009. http://www.iea-pvps.org/trends/download/2008/Table__Seite_01.pdf

Renewable Energy Assessment
50
There are several different types of applications for geothermal heat pumps. In New York, installations have ranged from single family homes to hotels and 500,000 square foot office buildings. The NYSERDA-supported installation at Sullivan County Community College (SCCC) provides an example of a school application. Under its New York Energy $martSM program, NYSERDA provided SCCC with a $250,000 incentive that helped pay for the $4.4 million geothermal heat pump installation, which provides heating and cooling to 170,000 square feet of space in ten buildings including offices, classrooms, kitchens, libraries and a faculty lounge. 140 It is expected that the geothermal system will save SCCC over 420,000 kWh a year and reduce annual operating costs by $74,000. The New York Energy $martSM New Construction Program provided funding for a municipal installation at the Tannery Pond Community Center that included a geothermal heat pump system. Along with high-efficiency windows, a super-insulated building shell, and an air-to-air recovery system, the pump will help the Center reduce its energy use by 140,733 kWh per year and save approximately $24,000 in annual energy costs.
In June 2009, NYSERDA was approved to offer over $2 million of EEPS funds on the purchase and installation of geothermal heat pump systems as part of its Geothermal Heat Pump Systems Incentives Program, which focuses on multifamily residential buildings.
141
142 NYSERDA estimated that a proto-typical heat pump system installed in a 100-unit electrically-heated multifamily building could save about 1,020 MWh in heating and cooling load and an additional 166 MWh for domestic hot water heating over the (estimated 20-year) life of the system and would cost approximately $875,000. For this type of system the payback period is estimated at four to five years. In 2007, customers in New York received approximately 5.5 percent of all national shipments of geothermal heat-pump equipment capacity. 143
3.5.2 Geothermal Electric Power Technical/Practical Potential
The technical/practical potential for geothermal heat pump use has not been separately characterized, but the technology was included in the energy efficiency potential study conducted for the State Energy Plan.
In 1996, NYSERDA and the DOE commissioned a study to assess the potential for geothermal electric power generation in New York. 144
Several other studies sponsored by NYSERDA concluded that the hydro-geothermal energy potential in Western and Central New York is largely comparable to that of other regions possessing
The study found that most of the potential for geothermal energy use in the State would be associated with space and water heating, given the generally lower quality heat resource at reasonable depths throughout the State. The study concluded that while there is potential for geothermal electric power in upstate New York, primarily through the use of binary cycle conversion systems, the current high cost of these systems relative to other technologies that generate electric power continues to inhibit development. NYSERDA is currently updating the 1996 study as new technologies may bring the large geothermal resource closer to marketability.
140 NYSERDA. Sullivan County Community College Invests in Geothermal Heat Pump System. 2002. http://www.nyserda.org/Press_Releases/press_archives/2002/09_25_02.asp 141 NYSERDA. North Country Community Center Implements Energy-Efficiency Measures. 2009. http://www.nyserda.org/programs/New_Construction/Case_Studies/tannerypond.pdf 142 PSC. Order Approving Electric Energy Efficiency Programs with Modifications. 2009. http://www.dps.state.ny.us/07M0548/Order_Approving_NYSERDA_Program_June_16_2009.pdf 143 EIA. Geothermal Heat Pump Shipments by Destination: 2006 and 2007. 2009. http://www.eia.doe.gov/cneaf/solar.renewables/page/ghpsurvey/table4_6.pdf 144 Dyncorp Information & Engineering Technology, Inc. (prepared for NYSERDA). Assessing Geothermal Energy Potential in Upstate New York, Final Report, Tasks 1, 3, and 4. 1996.

Renewable Energy Assessment
51
porous/permeable units of sedimentary rock at sufficient depth to contain formation waters of useful temperatures (>140 ºF). The prime reservoir candidates are the Theresa and Potsdam Sandstones in the Lower Ordovician-Cambrian section lying below the Knox Unconformity. These sandstones have porous zones that are estimated to be of reservoir quality at least 100 feet thick. These studies concluded that a hydro-geothermal resource has two primary characteristics: 1) pore fluids in the target formation are heated to a useful temperature, and 2) the permeability of the target formation permits a pumping rate of pore fluids that yields economic quantities of heat energy at the surface. Other characteristics that bear on the ultimate viability of the resource are water chemistry and the hydraulic head of the formation fluids.
These studies primarily focused, however, on the potential for using these relatively low-temperature geothermal settings for use as sources for heating and other low-grade process heat for industrial or agricultural applications, not for use in generating power.

Renewable Energy Assessment
52