renewable energy 101 is a national laboratory of the u.s. department of energy, office of energy...
TRANSCRIPT
NREL is a national laboratory of the U.S. Department of Energy, Office of Energy Efficiency and Renewable Energy, operated by the Alliance for Sustainable Energy, LLC.
Renewable Energy 101
Andy Walker, PhD PE
Principal Engineer, NREL
Renewable Energy Round Table
March 27, 2012
NREL/PR-7A40-54593

2
Outline
• RE Policy o Laws o Executive Orders
• RE Technologies o Operating Principle o Cost and Performance o Incentives o Case Studies o Helpful Resources
• Integration Issues o Net Zero and Beyond o RE Project Planning
Photo by Corey Patrick, NREL/PIX 16580
Photo by Dennis Schroeder, NREL/PIX 19200
Phot
o by
John
De
La R
osa,
NRE
L/PI
X 19
978

Renewable Energy Policy

4
What is the Federal Definition of Renewable Energy?
Electric energy generated from: • Solar • Wind • Biomass • Landfill gas • Ocean (including tidal, wave, current, and thermal) • Geothermal • Municipal solid waste • New hydroelectric generation capacity achieved from
increased efficiency or additions of new capacity at an existing hydroelectric project o EPAct 2005

5
Renewable Energy Technologies Photovoltaics
Daylighting
Biomass Heat/Power
Concentrating Solar Heat/Power
Solar Vent Air Preheat
Solar Water Heating Wind Power
Ground Source Heat Pump
Landfill Gas
Photo from City of San Jose, NREL/PIX 19487
Photo by Warren Gretz, NREL/PIX 00595
Photo by Joe Ryan, NREL/PIX 19424
Photo by David Hicks, NREL/PIX 18455
Photo by Geri Kodey NREL/PIX 14380
Photo by Devin Egan, NREL/PIX 17440
Photo by Joe Ryan, NREL/PIX 19691
Photo by Kim Yost, NREL/PIX 11915
Photo by Warren Gretz, NREL/PIX 03793

6
Legislation
EPAct 2005 • Not less than 5% of electricity
consumed by the Federal government must come from renewable energy in fiscal years 2010-2012
• Not less than 7.5% in fiscal year 2013 and thereafter
• Renewable energy projects provide bonuses if energy is: o produced on Federal lands and
used at a Federal facility; or o produced on Native American land
and used at a Federal facility.

7
Legislation
EISA 2007 • 30% solar hot water in
new buildings • 0% fossil fuels by 2030
in new buildings • 40 year analysis period
for RE • Facilitates ESPC for RE

8
Executive Orders
• Executive Order. 13423 o ½ of RE goal must be
“new” o Thermal counts in ½
new requirement
• Executive Order 13514 • GHG accounting and
sustainability plans

9
Guidance Available from FEMP
• For on-site projects, agency must retain or replace RECs to show use
• Simply hosting a renewable project without RECs does not help meet Federal goals
• Excludes system mix energy and energy used to meet state RPS requirements
• Rules are stricter for GHG accounting than for EPACT 05 accounting www1.eere.energy.gov/femp/pdfs/epact05_fedrenewenerg
yguid.pdf

10
Energy Efficiency Renewable Energy
Any questions?

11 11
EE + RE = 0
Strive for 40-70% energy reduction $1 spent on EE lighting = $6 of PV (an NPS project) $1 spent on EE refrigeration = $2 of PV (an NPS project) $1 spent on EE = $2 spent on RE (EIA Press Release Aug 2011)
Conventional Efficient Integrated efficiency & renewable
Conventional energy use
Renewable energy use Quantity
of Energy
Net Zero

12
EE+RE Example: Camp Smith, HI
0
10000
20000
30000
40000
50000
60000
70000
80000
90000
BaseCase EE Case RE Case EE+RE Case
Annu
al E
nerg
y (m
illio
n BT
U)
Solar Hot Water
Daylight
Wind
Photovoltaics
Fuel
Electric
ARRA/FEMP Assessment PNNL evaluated EE measures NREL evaluated RE measures
Photo by DOE Federal Energy Management Program (FEMP), NREL/PIX 17254

Photovoltaics

14
Photovoltaics (PV)
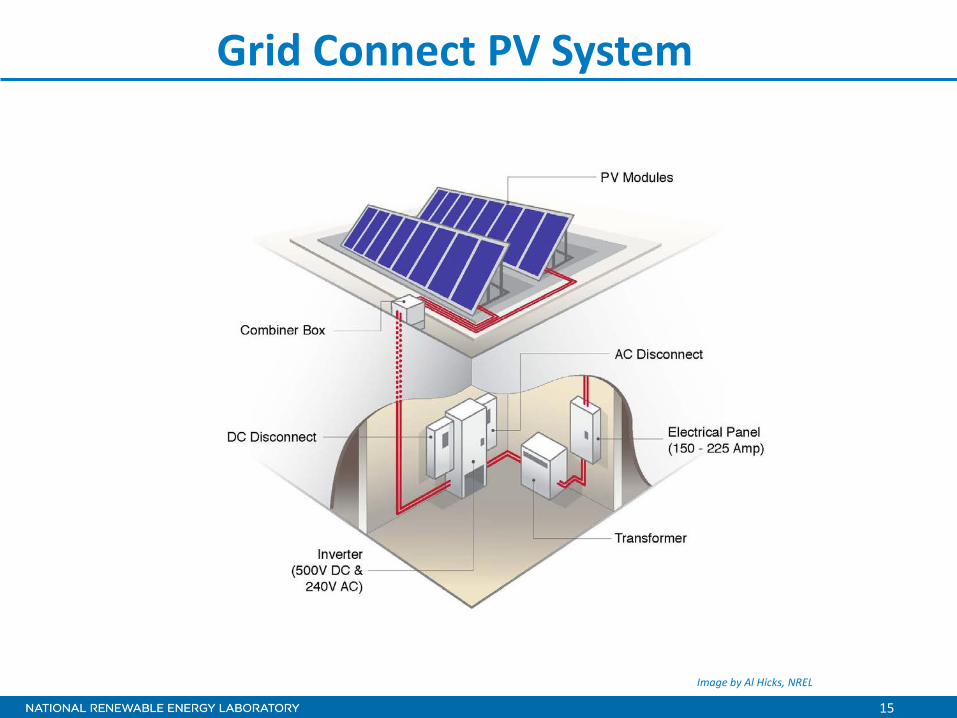
• Photovoltaic cells directly transform solar energy to an electrical energy
• DC converted to AC by inverter
• Solid-state electronics, no-moving parts
Photo from MREA, NREL/PIX 18707
15
Grid Connect PV System
Image by Al Hicks, NREL

16
Flat Plate PV Systems Arizona Public Service, Prescott, AZ
Dangling Rope Marina, Glen Canyon National Recreation Area, UT
Alamosa PV System, Alamosa, CO
• 5 – 10 acres per MW for PV systems
• Land can be left as is or graded
Photo by Warren Gretz, NREL/PIX 07990
Photo from Arizona Public Service, NREL/PIX 13739
Photo by Tom Stoffel, NREL/PIX 15558

17

18
Concentrating PV Systems Reflective
Photo from David Parsons, NREL/PIX 06639

19

20
Price of PV Modules
0
5
10
15
20
25
30
35
1970 1980 1990 2000 2010 2020
Mod
ule
Pric
e ($
/Wat
t)
Year
$0.00
$1.00
$2.00
$3.00
$4.00
$5.00
2005 2006 2007 2008 2009 2010 2011
Global Module Price Index Aug. '11 Reported Chinese c-Si Price

21
PV Cost, O&M, and Efficiency
PV System Type
Annual O&M Cost as a
Percentage of Installed Cost
Ground Mounted - Fixed 0.17%
Ground Mounted - Tracking 0.35%
Module Efficiencies
Single Crystal 14-19%
Multi Crystal 13-17%
Thin Film 6-11%
Balance of System Efficiency 77%
Efficiency vs. Size – 1 kW of 15% eff. crystalline 71ft2
– 1 kW of 9.5 % eff. amorphous 99ft2
– 1 kW of 19.3% eff. hybrid 55ft2
Efficiency = Power Out/Power In

22
PV Operation and Maintenance
Tuscon Electric Power Data PROGRESS IN PHOTOVOLTAICS: RESEARCH AND APPLICATIONS Prog. Photovolt: Res. Appl. 2008; 16:249–259 Published online 3 December 2007 in Wiley InterScience (www.interscience.wiley.com) DOI: 10.1002/pip.800

23
Veterans Administration Jerry L. Pettis Memorial Medical Center in Loma Linda, CA
• 309 kWdc • 1,584 PV modules • SunLink racks minimum roof
penetration • Advanced Energy Solaron
333kW inverter • Feasibility Study by NREL
estimates: 475 MWh/year delivery; $60k/year savings; $2.9million cost without any incentives
• Procured off GSA Schedule for complete PV systems

24
Results
• Veterans Administration Loma Linda, CA

25

26

27
Where to Install Solar
• On the “Built Environment” where unshaded
o On existing building roofs that have an expected life of at least 15 more years and can accept added load. Reduces solar load on building. NEPA categorical exclusion.
o On ALL new buildings – all new building should be “solar ready”
– See http://www.nrel.gov/docs/fy10osti/46078.pdf
o Over parking areas, pedestrian paths, etc. – energy generation and nice amenity.
• On compromised lands such as landfills & brownfields.
o Saves green fields for nature.
o IF installed on green fields minimize site disturbance, plant native low height vegetation as needed.

28
Customs and Border Protection
• Solar-Powered SBInet Towers Secure the U.S. Southwest Border o Solar panels o Battery system o Propane-fueled backup generator
• Federal funding and
appropriations covered the installation costs and continues to cover testing and maintenance costs.

29
Photovoltaics Resources
• Solar Energy Resources o NREL
– http://www.nrel.gov/rredc/ o Firstlook
– http://firstlook.3tiergroup.com/ o TMY or Weather Data
– http://rredc.nrel.gov/solar/old_data/nsrdb/1991-2005/tmy3/
• State and Utility Incentives and Utility Policies o http://www.dsireusa.org
• Solar PV Analytical Tools
o Solar Advisor Model (SAM) – https://www.nrel.gov/analysis/sam/
o HOMER – https://analysis.nrel.gov/homer/
o PVWatts – http://www.nrel.gov/rredc/pvwatts/
o RETScreen – http://www.retscreen.net/
o IMBY – http://www.nrel.gov/eis/imby/

Solar Water Heating

31
Solar Water Heating Applications
• Low Temperature o Swimming pool
heating • Medium Temperature
o Domestic water and space heating
o Commercial cafeterias, laundries, hotels
o Industrial process heating
• High Temperature o Industrial process
heating o Electricity generation
Photo from Gen-Con, Inc., NREL/PIX 09320
Photo from Alan Ford, NREL/PIX 09501
Photo by Amy Glickson, NREL/PIX 14167

32
Solar Thermal Collector Types

33
Solar Water Heating System

34
Solar Water Heating System Cost
Average: Around $150/sf

35
USCG Housing, Honolulu HI • 62 units installed 1998 • Savings of 9,700 kWh/yr
and $822/yr per system • $4000/system cost • Simple payback of 4 years
(with rebate)

36

37
Solar Water Heating Resources
• Design Tools o RETScreen - Solar Hot Water
– http://www.retscreen.net/ang/g_solarw.php
• Fchart – Active and Passive Systems Analysis o http://www.fchart.com/fchart/
• Resources o DOE Energy Efficiency and Renewable Energy Solar Energy Technologies Program
– http://www1.eere.energy.gov/solar/solar_heating.html o FEMP Federal Technology Alerts
– www.eere.energy.gov/femp/pdfs/FTA_solwat_heat.pdf – www.eere.energy.gov/femp/pdfs/FTA_para_trough.pdf
o FEMP Case Studies – www.eere.energy.gov/femp/technologies/renewable_casestudies.html
o Resource maps – http://www.nrel.gov/gis/solar.html
o Solar Radiation Data Manual – http://rredc.nrel.gov/solar/pubs/redbook

Concentrating Solar Power

39
Concentrating Solar Power Technology
Mirrors are used to reflect and concentrate sunlight onto receivers that collect this solar energy and convert it to heat.
Tower
Photo by Warren Gretz, NREL/PIX 00327
Trough
Dish
Photo from Sandia, NREL/PIX 08469
Phot
o by
Hug
h Re
illy,
NRE
L/PI
X 02
186

40
CSP Applications • Typically utility-scale
applications • Heat from CSP
o Generate hot water or steam
• Steam o Generate electricity
Photo by Geri Kodey, NREL/PIX 14383

41
RE in ESPC Example
Concentrating Solar Thermal (Industrial Process Heat) Federal Correctional Institution - Phoenix, AZ
0
100
200
300
400
500
Jan Feb Mar Apr May Jun Jul Aug Sep Oct Nov DecTo
tal D
eliv
ered
Hea
t(m
illio
n Bt
u)Month
Month Energy and Cost Savings
1999
2000
2001
2002
2003
•17,040 square feet of parabolic trough collectors •23,000 gallon storage tank •Installed cost of $650,000 •Delivered 1,161,803 kWh in 1999 (87.1% of the water heating load). •Saved $77,805 in 1999 Utility Costs

Solar Ventilation Air Pre-heat

43
• Panels are aluminum or steel • Roll-punch slots with three porosity options • Corrugated to increase structural rigidity
• High outdoor air ventilation requirement in heating dominated climate • South-facing wall surface is best
o 45° of south gives 80% • Unshaded surface
o Especially during low winter sun angles • Dark collector color
o Black is best, other colors have efficiency loss up to 10%
Project Considerations
Photo by Warren Gretz, NREL/PIX 14383

44
Solar Vent Preheat Principle
• Sun warms the collector surface
• Heat conducts from collector surface to thermal boundary layer of air (1 mm thick)
• Boundary layer is drawn into perforation by fan pressure before heat can escape by convection
4 - 6 in.
South wall Solar wall
Boundary layer

45
System Components
• Transpired solar collector o Perforated sheet of
corrugated metal
• Air distribution o Ductwork, fan and
bypass damper
• Controls o Temperature and
timeclock, or EMCS

46
Solar Vent Preheat Resource

47
48
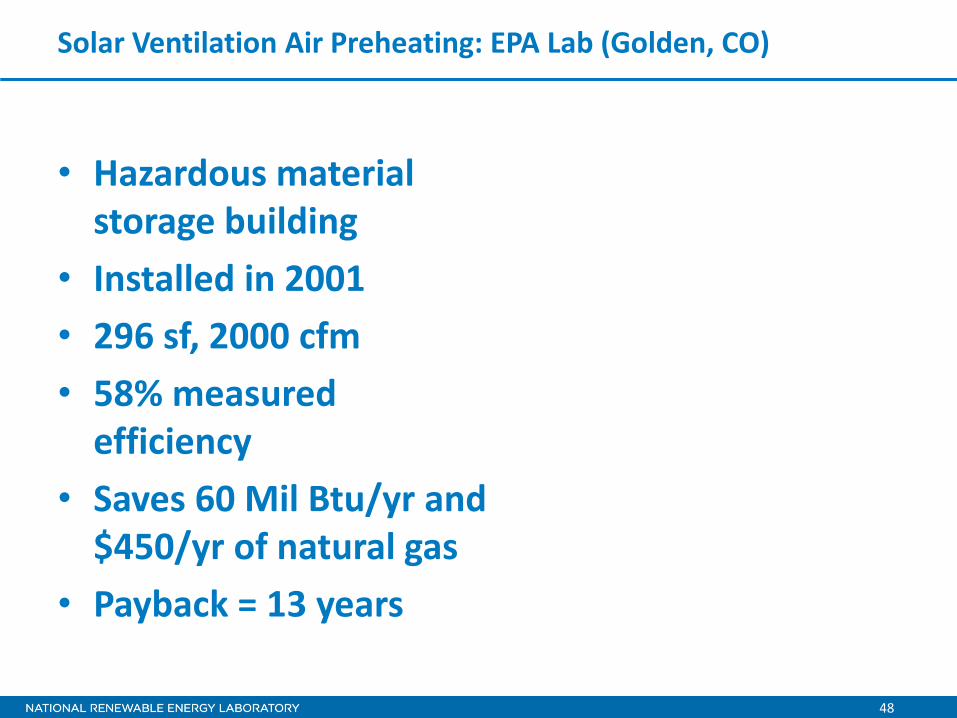
Solar Ventilation Air Preheating: EPA Lab (Golden, CO)
• Hazardous material storage building
• Installed in 2001 • 296 sf, 2000 cfm • 58% measured
efficiency • Saves 60 Mil Btu/yr and
$450/yr of natural gas • Payback = 13 years

49
Advantages
• Relatively low cost for on-site renewable energy utilization • Reliability of equipment and system
– Only moving part is the fan – Operates at ambient temperature
• Very low maintenance • High efficiency • No storage
Photo by Patrick Corkery, NREL/PIX 17424
Photo by Dennis Schroeder, NREL/PIX 17825

50
Solar Vent Preheat Resources
• FEMP Federal Technology Alert o www.eere.energy.gov/femp/pdfs/FTA_trans_coll.pdf o Solar Ventilation Preheating Resources and Technologies
– http://www1.eere.energy.gov/femp/technologies/renewable_svp.html • NREL
o Solar Process Heat – http://www.nrel.gov/learning/re_solar_process.html
o Solar Space Heating Maps – http://www.nrel.gov/gis/femp.html#space
• Conserval Systems, Inc.: SOLARWALL® o www.solarwall.com/sw/solarwall.html
• ATAS International, Inc.: InSpire™ o www.atas.com
• American Solar Inc.: Solar Thermal Tile System o www.americansolar.com
• RETScreen® International Clean Energy Project Analysis Software o www.retscreen.net

Passive Solar in New Construction

52
Passive Solar
• Types: o Direct Gain o Sunspace o Thermal Storage Wall (Trombe Wall)
• For new construction, in areas with low internal heat gain • South-facing Solar Apertures • Added thermal mass to absorb heat and release at night • Controls such as operable shades and windows
Trombe Wall, NREL. Photo by Warren Gretz, NREL/PIX 01693,

53
Daylighting
• Lighting accounts for 25% of total electricity used in Federal sector
• Daylighting uses windows & skylights in conjunction with automatic light controls to minimize the need for electric lighting during daylight hours
• Daylighting combined with lighting controls can reduce lighting energy consumption by 40 -60%
Wind

55
Wind Sizes and Applications
Small (≤10 kW) • Homes • Farms • Remote Applications (e.g. water pumping,
telecom sites, icemaking)
Intermediate (10-250 kW) • Village Power • Schools,
businesses • Hybrid Systems • Distributed Power
Large (660 kW - 2+MW)
• Central Station Wind Farms • Distributed Power • Community Wind

56
Wind Generation in the U.S.

57
Warren Air Force Base, Cheyenne
• 600 kW wind turbines • $2.5 million installed • Generates energy to
power 522 households on base
• Avoids 5,000 tons/year in GHG emissions
• Saves $3 million in energy costs over 20 years
• Additional capacity planned
58
RE in ESPC Example - BOP Federal Correctional Institution - Victorville, CA
• Awarded 09/03 • Initial capital investment
$5.4M, 19 year term with NORESCO
• Scope includes HVAC controls upgrade, 750 kW wind turbine, and 74.5KW PV Carport
• First ESPC financed wind turbine
• SCE provided RE generation financial incentive $4/W
• Escrow account for wind turbine maintenance

59

60
Installed Costs and O&M Costs
Installed Costs
< 500kW $2500 to $3500/kW
>500kW $2000/kW
Operation and Maintenance Costs
< 500kW $0.035/kWh
>500kW $0.025/kWh
These numbers can be used for feasibility calculations. There is huge variability depending on the current market and the site selected.
61
Wind for the Coast Guard
• Generate 2.4 kW at 24 mph wind
• 1 kW for augmenting power at telecom sites

62
Wind Resources
• AWEA Web site o http://www.awea.org
• NWTC Web site o http://www.nrel.gov/wind
• National Wind Coordinating Collaborative o http://www.nationalwind.org
• Utility Wind Interest Group site o http://www.uwig.org
• WPA Web site o http://www.windpoweringamerica.gov
• Homepower Web Site o http://www.homepower.com
• Windustry Project o http://www.windustry.com
• Best Links o www.fresh-energy.org

63
Other Wind Resources
• American Wind Energy Association http://www.awea.org/ o AWEA Small Wind Toolbox
– www.awea.org/smallwind/
• AWS Scientific Inc. “Wind Resource Assessment
Handbook” produced for the National Renewable Energy Laboratory, Subcontract number TAT-5-15283-01, 1997 o http://www.nrel.gov/publications
• Wind Energy Explained;J. F. Manwell, J. G. McGowan, A. L.
Rogers; John Wiley & Sons Ltd. 2002.
• Wind Power; Gipe, Paul; Chelsea Green Publishing, 2004

Biomass

65
• Wood and wood waste • Agricultural waste • Bagasse • Food processing residues • Animal wastes • Municipal solid waste • Energy crops • Landfill gas • Methane from waste and
wastewater treatment
What is Biomass in Terms of Renewable Technologies?
Photo by Warren Gretz NREL/PIX 11597

66
Products Fuels Ethanol Biodiesel “Green” Gasoline & Diesel
Power Electricity Heat
Chemicals Plastics Solvents Chemical Intermediates Phenolics Adhesives Furfural Fatty Acids Acetic Acid Carbon Black Paints Dyes, Pigments, and Ink Detergents Etc.
Food and Feed
• Combustion
• Gasification
• Pyrolysis
• Co-firing
• Enzymatic Fermentation
• Gas/liquid Fermentation
• Acid Hydrolysis/Fermentation
• Trans-esterification
Conversion Processes
Range of Bioenergy
• Trees
• Grasses
• Agricultural Crops
• Residues
• Animal Wastes
• Municipal Solid Waste
• Algae
• Food Oils, Waste Oils
Biomass Feedstock
Photo by Warren Gretz, NREL/PIX 11597

67

68
Commercial Technologies
• Almost all commercial power systems are combustion/steam turbine
• Efficiencies in 15% – 30% range power only, (60%-70% CHP)
• Stokers and fluidized bed • 500+ facilities in U.S • Installed costs $1,700 -
$3,500/kW • Smaller systems (< 5 MW) still
have poor economics • LCOE = $0.06 - $0.20/kWh

69
NREL Renewable Fuels Heating Plant (Golden, CO)
• $3.3 million cost under an ESPC
• Pine beetle waste wood • 75% of the 50,000 million
Btus to heat campus. • Cost savings projected
$400,000/year • The wood chips cost $29 per
ton or $2.42 per million BTUs • During cold weather, plant
burns a truckload of wood chips per day; produces 600 gallons of hot water per minute
• Stores four days of wood chip fuel

70
RE in ESPC Example - DOE Savannah River Site
• New 20 MW wood waste cogeneration plant and two biomass heating plants with local fuel source
• 19 year contract • Includes performance
guarantee and O&M • Annual Savings of $34 M
project cost of $183 M • Task order signed 5/15/09 • Construction completed
December 2011 • Important project to meet
federal renewable goal/DOE Order 230.2b
71
RE in ESPC Example - USCG Baltimore, Maryland Landfill Gas
• Boiler Conversion to LFG o Cogeneration Plant o 4 MW Electricity
• 8,000 lb/hr Steam • 15 year contract length • Project Investment : $15.0
million • Annual Savings: $2.5
million • Offsets 18,000,000 kWh/yr
and 71,000 decatherms/yr of Natural Gas
• Operational: April 2009

72
Biomass in Kodiak, AK
• Wood pellets in Coast Guard boilers in place of expensive fuel oil o Pellets from wood waste and second-growth trees from local Tongass
National Forest • Benefits
o Save taxpayer dollars o Improve operations and resiliency o Support energy independence o Foster environmental stewardship

73
Biomass Resources
• DOE Energy Efficiency and Renewable Energy o http://www1.eere.energy.gov/biomass/
• NREL o http://www.nrel.gov/biomass/

Geothermal

75
Geothermal Energy Technology Overview
• Direct Use - Using hot water from springs or reservoirs near the surface.
• Electricity generation – Using steam, heat or hot water from deep inside the earth to drive turbines.
• Geothermal heat pumps – Using the earth, groundwater, or surface water as a heat source and heat sink
Application opportunities include:

76
Geothermal Application
Heat Production o District Heating o Process Heat o Agriculture o Aquaculture
Electricity Generation o Distributed Power o Central Station
Power

77
Ground Source Heat Pumps Marine Corps Air Station, Beaufort, SC
• Geothermal heat pump technology is the energy-saving centerpiece of this Marine housing facility.
• Energy-efficient geothermal heat pumps replaced 2,500 tons of existing HVAC systems and hot water heaters.
• These heat pups provide space heating, cooling, and domestic hot water for 1,235 family housing units at the Beaufort Marine Corps installation.
Photo by Belton Tisdale, NREL/PIX 12372

78

79
Geothermal Resources
• Western Area Power Administration o http://www.wapa.gov/es/pubs/fctsheet/GHP.pdf
• DOE Geothermal Technologies Program o http://www1.eere.energy.gov/geothermal/faqs.ht
ml
• Resource Maps o http://www.nrel.gov/gis/geothermal.html

Hydro and Ocean Energy

81
What are the Hydropower and Ocean Energy Options?
• Small projects use turbines in place of pressure reducing valves
• Large Hydropower is typically not cost-effective unless the site has access to existing hydroelectric dam
• Hydropower is a common form of Renewable Energy Credits

82
Ocean Energy
• Wave power • Marine current power • Tidal Energy • Ocean Thermal
Energy Conversion o Relatively immature

83
Wave Energy Technology

84
Wave Power for U.S. Coast Guard 1st District Lighthouses

85
Marine Current Technology

86
Wave Power Levels in KW/m Crest Length
Tidal Energy Resource

87
OTEC functions best when there is a 36° F (20°C) difference
Ocean Thermal Technology
The OTEC energy resource constitutes an estimated 1013 W (876,000TWh/yr) for potential base load power generation.

Integration Issues

89
Net Metering
Net Metering
State policy
Voluntary utility program(s) only
www.dsireusa.org / March 2010
* State policy applies to certain utility types only (e.g., investor-owned utilities)
WA: 100
OR: 25/2,000*
CA: 1,000*
MT: 50*
NV: 1,000*
UT: 25/2,000*
AZ: no limit*
ND: 100*
NM: 80,000*
WY: 25*
HI: 100KIUC: 50
CO: no limitco-ops & munis: 10/25
OK: 100*
MN: 40
LA: 25/300
AR: 25/300
MI: 150*WI: 20*
MO: 100
IA: 500*
IN: 10*IL: 40*
FL: 2,000*
KY: 30*
OH: no limit*
GA: 10/100
WV: 25
NC: 1,000*
VT: 250
VA: 20/500*
NH: 100MA: 60/1,000/2,000*RI: 1,650/2,250/3,500*CT: 2,000*NY: 10/ 25/500/2,000*PA: 50/3,000/5,000*NJ: 2,000*
DE: 25/500/2,000*
MD: 2,000
DC: 1,000
Note: Numbers indicate individual system capacity limit in kW. Some limits vary by customer type, technology and/or application. Other limits might also apply.
NE: 25
KS: 25/200*
ME: 660co-ops & munis: 100
PR: 25/1,000
AK: 25*
43 states + DC & PR have adopted a net
metering policy
DC

90
Problems with “Net” Metering
• Pros: o Incentive for RE o Saves Some Fuel (up to a limit)
• Cons: o Limits to Fuel Savings o Doesn’t save any other utility
operating costs o RE may be curtailed; limits on
installations (eg 15% in HI) o Socio-economic problem: foists
utility costs on those least able to afford it.
• Utility Cost Recovery o Spinning Reserve o Retail/buy-back spread (c/kWh) o Stand-by Charges ($/kW/month)

91
Zero = EE+RE+Microgrid
• Strategies for “Zero” rather than “Net Zero” o Tracking Solar o Solar on different orientations (East-South-West) o Spatial Diversity o Diversity of RE Measures (Solar, Wind, Etc) o Dispatchable RE (biomass, hydro, geothermal, landfill gas) o Flexible Grid Layout (circuits) to route power around o Isolate Critical Circuits: exercise Demand Control o Energy Storage (short and long term, electric and thermal) o Micro-grid controls
– Control requirement: maintain required frequency and voltage levels – Grid disconnect and seamless resynchronization – Micro-grid start-up (“black start”) – Load control (interfaces with SCADA and EMCS) – Supply control (optimized operation of DERs)

92
Tracking the Sun

93
Zero = EE+RE+Microgrid
Figure by Ben Kroposki, NREL

RE Project Planning

95
Best Mix of Renewable Energy Technologies Depends on:
• Renewable Energy Resources • Technology Characterization
– Cost ($/kW installed, O&M Cost) – Performance (efficiency)
• Economic Parameters – Discount rates – Fuel Escalation Rates
• State, Utility and Federal Incentives • Mandates (Executive Order, Legislation)

96
Summary Comparison
Technology Level of Commercialization.
R R W
Photovoltaics; Mature 3 k
Solar ventilation air preheating ;
Underutilized
3 k
Solar water heating;
Mature 3 k
Solar thermal and solar thermal electric;
Mature 2 k
Biomass thermal and electric
Mature H
Geothermal Power;
Early L
Ground Source Heat Pump
Mature N
Landfill gas; Mature > C
Fuel Cells; Early N
Wind; Mature 1
LCOE with tax incentives
Capital Cost ($) 2011
Level of Site Impact
$0.128/kWh to $0.154/kWh
$6,870/kW Low, most buildings.
$0.064/kWhthermal
$27.40/sf Medium, limited to low-heat-gain buildings
$0.08 to $0.20/kWhthe
rmal
$75-225/sf Medium, hot water loads only.
$0.090 to $0.145/kWh
$5,132/kW HIgh
$0.050 to $0.094/kWh
$3,995/kW High
$0.042 to $0.069/kWh
$4,000/kW High
$0.027/kWhthermal
$835/ton Medium
$0.0493/kWh $2,100/kW Medium, virtual power from landfill
$0.115 to $0.125/kWh
$3,800/kW Low
$0.044 to $0.091/kWh
$1,966/kW High

97
97
REO: Renewable Energy Optimization
Site Data
Geographical Information System (GIS) Data
Incentive Data from DSIREUSA.ORG
PV SVP Wind Daylighting SWH CSP Biomass
Dispatch Algorithm
Life Cycle Cost
Technology Characteristics.
Optimization

98
Without Tax Incentives
With Tax Incentives
PV (kW) 0 737 Wind Energy (kW) 2,491 3,689 Solar Ventilation Air Preheat (sf) 93,265 119,652 Solar Water Heating (sf) 28,464 90,703 Solar Thermal Parabolic Trough (sf) 0 0 Solar Thermal Electric (kW) 0 0 Biomass Gasification Boiler (MBH) 1.3 1.8 Biomass Gasification Cogen (kW) 134 193 Biomass Anaerobic Digester (ft3) 0 0 Biomass Anaerobic Digester Cogen (kW) 0 0 Skylight Area (sf) 190,951 209,666
REO for Land and Ferry Points of Entry
0
1000
2000
3000
4000
5000
6000
7000
8000
9000
10000
11000
12000
Ann
ual E
nerg
y (M
btu)
Photovoltaics (Mbtu) Wind (Mbtu) Solar Vent Preheat (Mbtu)Solar Water Heating Solar Thermal (Mbtu) Biomass Gasifier (Mbtu)Anaerobic Digester (Mbtu) Daylighting (Mbtu)
