renewable electricity standards: state success stories
TRANSCRIPT

This is a story of how visionary leadership and good policy can lift the nation’s states to a higher level of economic prosperity by diversifying electricity generation and reducing the risk of price spikes for consumers and businesses. It is a story of how successful bipartisan collaboration can result in strong policy initiatives that benefit generations of Americans. It is a story of how states such as Iowa, Texas, and Minnesota —that initially required a small portion of the states’ electricity come from renewable energy sources — are today among the nation’s top renewable energy states. It is the story of renewable electricity standards.
It is my honor to share with you Renewable Electricity Standards: State Success Stories.
John Kitzhaber, ChairmanGovernors’ Wind Energy Coalition and Governor of Oregon
Renewable Electricity Standards:State Success Stories
A Publication of
www.GovernorsWindEnergyCoalition.org
2
Renewable Electricity Standards:State Success Stories
IntroductionRenewable electricity standards (RES)1 in the states are well-established policies for both encouraging renewable energy development and electric generation fuel diversity. More than 30 states have adopted mandatory or voluntary standards over the past 30 years, stimulating significant renewable energy growth, economic development, and pollution reduction.
Because of the substantial turnover of state legislators and governors since the adoption of RES laws, plus new scrutiny of renewable energy policy at the state and federal levels, this is a good time to highlight the impact that RESs have had on the states.
The RES is market-based — firmly rooted in public interest goals, and consistent with both traditional
1 Another common term for the RES is Renewable Portfolio Standard (RPS).
utility regulation and competitive markets. The RES has enjoyed strong bipartisan support both during adoption and repeated revisions. It has been tailored to meet the evolving needs and market conditions of each state, but has never been repealed or reduced.
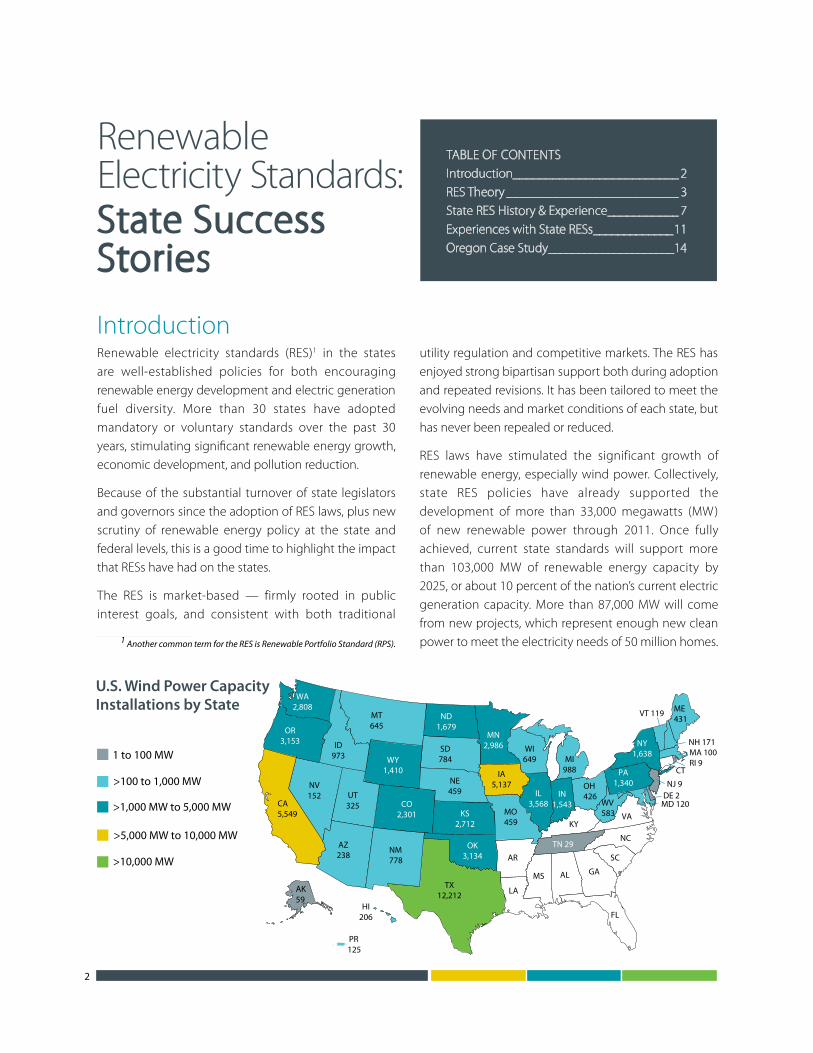
RES laws have stimulated the significant growth of renewable energy, especially wind power. Collectively, state RES policies have already supported the development of more than 33,000 megawatts (MW) of new renewable power through 2011. Once fully achieved, current state standards will support more than 103,000 MW of renewable energy capacity by 2025, or about 10 percent of the nation’s current electric generation capacity. More than 87,000 MW will come from new projects, which represent enough new clean power to meet the electricity needs of 50 million homes.
TaBlE Of COnTEnTSIntroduction_________________________ 2RES Theory __________________________ 3State RES History & Experience ___________ 7Experiences with State RESs _____________11Oregon Case Study_____________________14
U.S. Wind Power Capacity Installations by State
CT
MA 100RI 9
HI206
>100 to 1,000 MW
>5,000 MW to 10,000 MW
>10,000 MW
ALMS
AR
LA
GA
KYVA
NC
SC
FL
NV152
MO459
IL3,568
IN1,543
WI649 MI
988
NY1,638
ME431
IA5,137
MN2,986
KS2,712
ND1,679
AK59
AZ238
CA5,549
CO2,301
DE 2
ID973
MD 120
MT645
NE459
NH 171
NJ 9
NM778
SD784
OH426
OK3,134
PA1,340
TN 29
TX12,212
UT325
VT 119
OR3,153
WA2,808
WV583
WY1,410
PR125
1 to 100 MW
>1,000 MW to 5,000 MW CT
MA 100RI 9
HI206
>100 to 1,000 MW
>5,000 MW to 10,000 MW
>10,000 MW
ALMS
AR
LA
GA
KYVA
NC
SC
FL
NV152
MO459
IL3,568
IN1,543
WI649 MI
988
NY1,638
ME431
IA5,137
MN2,986
KS2,712
ND1,679
AK59
AZ238
CA5,549
CO2,301
DE 2
ID973
MD 120
MT645
NE459
NH 171
NJ 9
NM778
SD784
OH426
OK3,134
PA1,340
TN 29
TX12,212
UT325
VT 119
OR3,153
WA2,808
WV583
WY1,410
PR125
1 to 100 MW
>1,000 MW to 5,000 MW
Renewable Electricity Standards: State SUCCeSS StorIeS 3
RES TheoryPUblIC IntereSt GoalS
The RES advances a set of public interest goals:
❚ renewable energy is diverse energy. It creates a diverse energy portfolio – analagous to a diverse investment portfolio – reducing exposure to increases or volatility in fuel costs, which are passed through to consumers. as a result, it can stabilize prices and support predictable, long-term economic development.
❚ renewable energy is american energy, adding to the nation’s domestic energy supply. It is also primarily a local energy supply. While fossil and uranium fuel production is concentrated in a few states, renewables are everywhere. This can reduce energy imports and keep energy dollars in local economies.
❚ renewable energy creates new industries with new jobs and new wealth. These jobs occur in manufacturing, construction, operations and maintenance. Because wind and solar are mass-produced in factories, they have revitalized manufacturing in many states, often in places far from the energy source. and because renewable energy equipment consists of hundreds of components — both high-tech and conventional — they can spur new high-tech ventures as well as support traditional manufacturing.
❚ renewable energy reduces emissions. Renewable energy reduces air pollution, including smog, acid rain, toxic metals, and other emissions. It reduces water use and water pollution, including the risk of coal waste spills, aquatic impacts from thermal discharges, and mercury deposition.
❚ renewable energy is primarily rural energy. It can stimulate economic activity needed in rural areas. new construction jobs, ongoing operations and maintenance jobs, and steady property tax payments pump substantial revenues into rural communities, supporting vital services and stimulating a revitalization of states’ rural economies.

4
Market baSed
What is the most effective way to achieve these public goals? In the long run, renewable energy will deliver the most benefits when it is competitive with conventional power sources. The fastest way to realize those cost reductions is through the scale and discipline of market forces.
The RES is a market based policy, using competition to drive down technology prices and move technologies to maturity — all at the lowest cost. It motivates action by the private sector, by creating a market opportunity for project developers to pursue. The government’s role is to set the standard that will be met by utilities and project developers.
Because the RES is performance based, and increases over time, the most attractive projects are the ones with the lowest cost, that best fit power company needs, and that are of sufficient scale to meet the standard with minimum transaction costs. Winning bidders are chosen by power marketers in competitive markets, or by utilities with oversight from their regulators, or, in a couple of states, by a centralized government procurement entity.
This approach uses the size of the marketplace to deliver large-scale and long-term investments — projects that are large enough to capture economies of scale, attract low-cost financing, and create sufficient experience by project developers. These projects in turn drive down future costs.
The RES delivers value to consumers while also creating constant innovation, not just in technology but in business models, finance, and execution.
HOW THE RES WORKSRegulators or legislators adopt a requirement or goal that power
providers’ sales to customers must include a specific minimum amount
of renewable energy. The standard is typically set some years in the
future, with clear interim targets. Power companies can meet the
standard by building their own supply, buying power from third party
developers, or simply buying renewable energy credits, or RECs. RECs are
a tracking tool that allows power companies to buy renewable power
remotely. Companies can use RECs for compliance, submitting them to
regulators as proof that they are supplying enough renewable power. In
a few states, RECs are bought and sold by a central agency, rather than
by individual power suppliers. RES compliance is encouraged through
either incentives or penalties. Most standards have safety valves that
limit the cost of compliance, in case it turns out to be more expensive
than anticipated.

Renewable Electricity Standards: State SUCCeSS StorIeS 5
reS FItS Well In dIverSe PoWer Market ContextS
The RES was originally applied in a regulated utility world, but has been adapted to apply to competitive markets as well.
In a regulated market, the RES provides guidance to the utility procurement process, which is typically overseen by a state utility commission. By setting a procurement target, the RES adds the numerous public interest goals to the traditional regulatory goals of low cost, reliability, and equity.
The RES is also compatible with competitive markets, through the flexibility of renewable energy credits (RECs). While deregulation uses market competition to deliver low cost, reliability and equity, an RES can help ensure that public policy goals are met.
While electricity is different from conventional products, setting minimum standards for a product is very common. Vehicle safety standards, energy efficiency standards for appliances, and many more have been applied for over a century. Setting standards is a fundamental role of government in protecting consumers, guiding markets to deliver public benefit, and meeting public policy goals.
What the reS IS not
The RES is often misrepresented by opponents of renewable energy as a popularity contest, as the government “picking winners and losers,” and as a barrier to competition.
These characterizations ignore the fact that the role of government policy is to protect the public interest, setting clear standards to accelerate economic development or addressing market failures that might otherwise harm public health or safety.
Renewable technologies are eligible for the RES because they meet these policy criteria, not because they are “popular.” for example, large hydroelectric power is a renewable energy source, but is often not included because it is a mature and competitive technology, and because there is little opportunity for growth from large new dams.2 The RES is intended to create change in the power supply, not to simply reward power companies for past decisions.
States often tailor their eligibility rules to local circumstances, to achieve unique public policy goals. north Carolina is trying to address livestock waste pollution through energy policy, by creating an incentive for manure-derived energy production. Pennsylvania included “waste coal” in their advanced energy standard as an incentive to clean up piles of coal mining waste that were polluting waterways. Some states use the RES to encourage combined heat and power, solar water heating, and sustainable forestry for biomass fuel production. 2Some states include large hydropower in the baseline of their RES goals. New York, for example, set a 20 percent
target, but already gets 15 percent of their power from hydro, making their RES an effective 5 percent standard.
Many states include small hydro, upratings at existing dams, and run-of-the-river projects as eligible new sources.

6
The RES is sometimes accused of being a quota system that picks winners and losers from politically favored companies and technologies. While policymakers indeed tailor eligibility to meet local public interest goals, the RES also requires competition between technologies and companies, and rewards those that are most ready for large-scale deployment.
The RES is also assumed by some to be a permanent prop for technologies that will never be competitive. But one public interest goal of the RES is to accelerate the maturity of new technologies, so they can compete without special policy support. It is possible that once a technology has reached market competitiveness, it may no longer need a sheltered marketplace.
reS In Context
While states take the lead in regulating electricity markets, the federal government also has good reasons to support renewable energy. The federal government provides policy support for renewable energy because it creates national benefits that go beyond state borders. This includes reducing cross-border pollution, promoting domestic energy production, spurring investment in new industries with future growth potential, and improving our global economic competitiveness.
Because of these national benefits, Congress has maintained federal tax incentives for over twenty years, such as the production tax credit (PTC) and the investment tax credit (ITC). Congress has repeatedly considered adopting a national RES. Both houses have approved RES legislation, though at separate times. Recent legislation has proposed setting a “clean energy standard” based on carbon emissions, which would require more renewables, nuclear, and natural gas power.
The federal government also has a lead role in regulating wholesale power markets and transmission, through the federal Energy Regulatory Commission. The Commission’s rules are critical for integrating renewable energy into regional power markets, removing barriers, and expanding transmission to connect renewables to customers.
a partnership between states and the federal government can deliver the benefits of renewable energy.

Renewable Electricity Standards: State SUCCeSS StorIeS 7
State RES History & ExperienceThe RES has been used to promote renewable energy for 30 years. In 1983, Iowa was the first state to adopt an RES, requiring utilities to produce the equivalent of two percent of the state’s annual electricity sales. Minnesota was next in 1994, requiring the state’s largest utility (Xcel Energy) to increase renewable energy use in exchange for storing nuclear waste at one of its nuclear power plants.
By 2002, the number of states with RESs had grown to 13, and by 2009 had more than doubled to 29 plus the District of Columbia. and in 2007, Oregon adopted a renewable electricity standard that requires the largest utilities to provide 25 percent of their retail electricity sales primarily from newer renewable sources of energy by 2025. The RES is a key reason why Oregon ranks fifth in the nation for installed wind capacity in 2012, which is delivering significant economic benefits to local communities across the state. another eight states have adopted voluntary goals for renewable energy. Encouraged by the results, states have repeatedly revised and expanded their standards over the years.
a number of standards and goals were established as part of laws to restructure the electric utility industry, as well as to promote economic development, increase fuel diversity, and reduce emissions.
enactment of new reS Policies is Waning, but States Continue to hone existing Policies
Environmental Energy Technologies Division • Energy Analysis Department
Enactment of New RPS Policies Is Waning, But States Continue to Hone Existing Policies
CO (2007)
HI(2005)
IL(2008)
MA (2003)
CT(2000)
MD(2006)
DC(2007)
NH(2008)
MI(2012)
ME (2000)
PA (2001)
NJ(2001)
NY (2006)
DE(2007)
NC(2010)
MO(2011)
IAMN
(2002)AZ
(1999)NV
(2001)WI
(2000)TX
(2002)NM
(2002)CA
(2003)RI
(2007)MT
(2008)WA
(2012)OR
(2011)OH
(2009)KS
(2011)
1983 1991 1994 1996 1997 1998 1999 2000 2001 2002 2003 2004 2005 2006 2007 2008 2009 2010 2011 2012
IA MN AZ MN NM CT NJ CT AZ CA DC HI CO CA IL
WI NV MN NM CO CA CO DE IL DE CT MA
NV PA NV CT CT HI ME IL DC MD
TX HI DE MA MN MA DE NJ
NJ MD MD NV MD IL NH
WI ME NJ OR NJ MA OH
MN RI NY MD
NJ NC
NM WI
PA
TX
Enactment (above timeline)
( ) Year of First Requirement
Enactment (above timeline)
Major Revisions (below timeline)
( ) Year of First Requirement
8
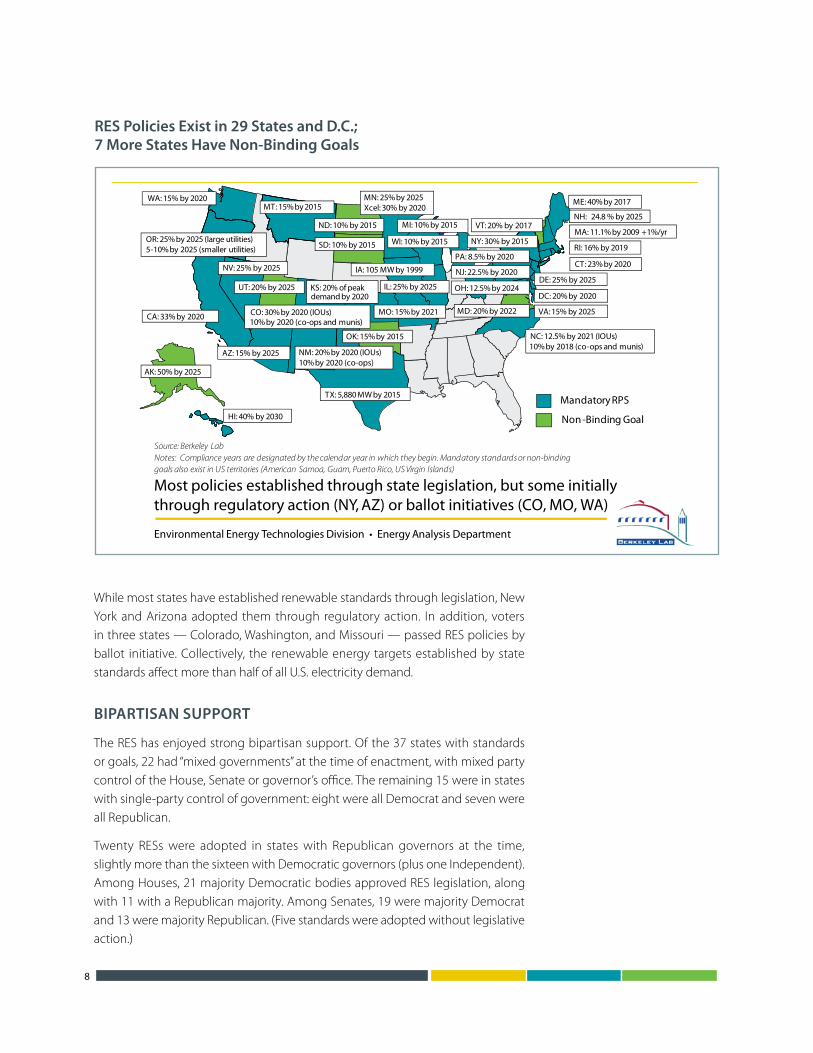
While most states have established renewable standards through legislation, new York and arizona adopted them through regulatory action. In addition, voters in three states — Colorado, Washington, and Missouri — passed RES policies by ballot initiative. Collectively, the renewable energy targets established by state standards affect more than half of all U.S. electricity demand.
bIPartISan SUPPort
The RES has enjoyed strong bipartisan support. Of the 37 states with standards or goals, 22 had “mixed governments” at the time of enactment, with mixed party control of the House, Senate or governor’s office. The remaining 15 were in states with single-party control of government: eight were all Democrat and seven were all Republican.
Twenty RESs were adopted in states with Republican governors at the time, slightly more than the sixteen with Democratic governors (plus one Independent). among Houses, 21 majority Democratic bodies approved RES legislation, along with 11 with a Republican majority. among Senates, 19 were majority Democrat and 13 were majority Republican. (five standards were adopted without legislative action.)
Environmental Energy Technologies Division • Energy Analysis Department
RPS Policies Exist in 29 States and D.C.; 7 More States Have Non-Binding Goals
Most policies established through state legislation, but some initially through regulatory action (NY, AZ) or ballot initiatives (CO, MO, WA)
Non-Binding Goal
Source: Berkeley Lab
WI: 10% by 2015
NV: 25% by 2025
TX: 5,880 MW by 2015
PA: 8.5% by 2020
NJ: 22.5% by 2020CT: 23% by 2020
MA: 11.1% by 2009 +1%/yr
ME: 40% by 2017
NM: 20% by 2020 (IOUs) 10% by 2020 (co-ops)
CA: 33% by 2020
MN: 25% by 2025Xcel: 30% by 2020
IA: 105 MW by 1999
MD: 20% by 2022
RI: 16% by 2019
HI: 40% by 2030
AZ: 15% by 2025
NY: 30% by 2015
CO: 30% by 2020 (IOUs)10% by 2020 (co-ops and munis)
MT: 15% by 2015
DE: 25% by 2025
DC: 20% by 2020
WA: 15% by 2020
NH: 24.8 % by 2025
OR: 25% by 2025 (large utilities)5-10% by 2025 (smaller utilities)
NC: 12.5% by 2021 (IOUs)10% by 2018 (co-ops and munis)
IL: 25% by 2025
Mandatory RPS
VT: 20% by 2017ND: 10% by 2015
VA: 15% by 2025MO: 15% by 2021
OH: 12.5% by 2024
SD: 10% by 2015
UT: 20% by 2025
MI: 10% by 2015
KS: 20% of peak demand by 2020
OK: 15% by 2015
AK: 50% by 2025
Notes: Compliance years are designated by the calendar year in which they begin. Mandatory standards or non-binding goals also exist in US territories (American Samoa, Guam, Puerto Rico, US Virgin Islands)
reS Policies exist in 29 States and d.C.; 7 More States have non-binding Goals

Renewable Electricity Standards: State SUCCeSS StorIeS 9
deSIGn varIeS by State
Each state has a different design for its RES, varying by size, timeline, eligibility and other factors.
Seventeen states and the District of Columbia have requirements of at least 20 percent of electric demand. Hawaii and Maine lead the way with targets of 40 percent. However, California’s 33 percent RES is by far the most aggressive due to the state’s large size and power demand. Illinois, Texas, new Jersey, and Minnesota represent the next four largest markets for new renewable energy development.
Renewable energy policies vary in other ways. In fact, an RES has dozens of design elements, tailored to fit each state’s priorities. for example, states have different criteria for which energy sources are eligible and where they can be located; which types of power companies are covered and which are exempt (such as small utilities, municipal utilities, and rural cooperatives); whether existing renewable projects qualify; how to track and enforce compliance; and what penalties to levy for those utilities that fall short of the target in a given year. a few states even include non-renewable resources in their “alternative” or “advanced” standards, to achieve specific policy goals with nuclear, coal, and natural gas. While no two states have the same approach, they all share the common goal of creating a long-term market that supports the deployment of renewable energy.
Renewable Electricity Standard: A Bipartisan Policy
R
HI: R
R
R*
D R*
R
R* MA: R
CT: R
RI: R
NJ: R MD: R
DC: D
D
DE: D
D*
D D
I
D
R
R
R* D
D
D
D
D
D
H/S Democratic
H/S Republican
H/S Split
State legislature
D/R/I – Governor affiliation
R
R
R
D
R
D
R
D
Compiled by the Union of Concerned Scientists, this map shows the party in control of the state legislature (House/Senate) and governors office at time of initial RES enactment. Italicized and underlined text indicates a state with a renewable energy goal.
*Both AZ and NY adopted RES policies through regulatory proceeding, though in NY it was at the explicit direction of the governor. RES policies in CO, WA and MO were initially adopted via ballot initiative.
State renewable electricity Standards: a bipartisan Policy

10
Of course, these policies are subject to change. Since the first wave of RES laws in the late 1990s, many states have revisited their policies to expand them or make them more effective in achieving specific goals. for example, 18 states have increased or accelerated their renewable energy targets, in some cases more than once. To date, no state has recalled or lowered its standard. Many states have amended their RESs to include provisions specifically designed to support solar and small-scale renewable energy systems, expand the list of eligible resources, or require long-term contracts for purchasing renewable power.
Renewable Electricity Standards: State SUCCeSS StorIeS 11
Experience with State RESsExperience over many years has proven that the RES is a successful policy, driving clean energy growth, innovation, and economic development.
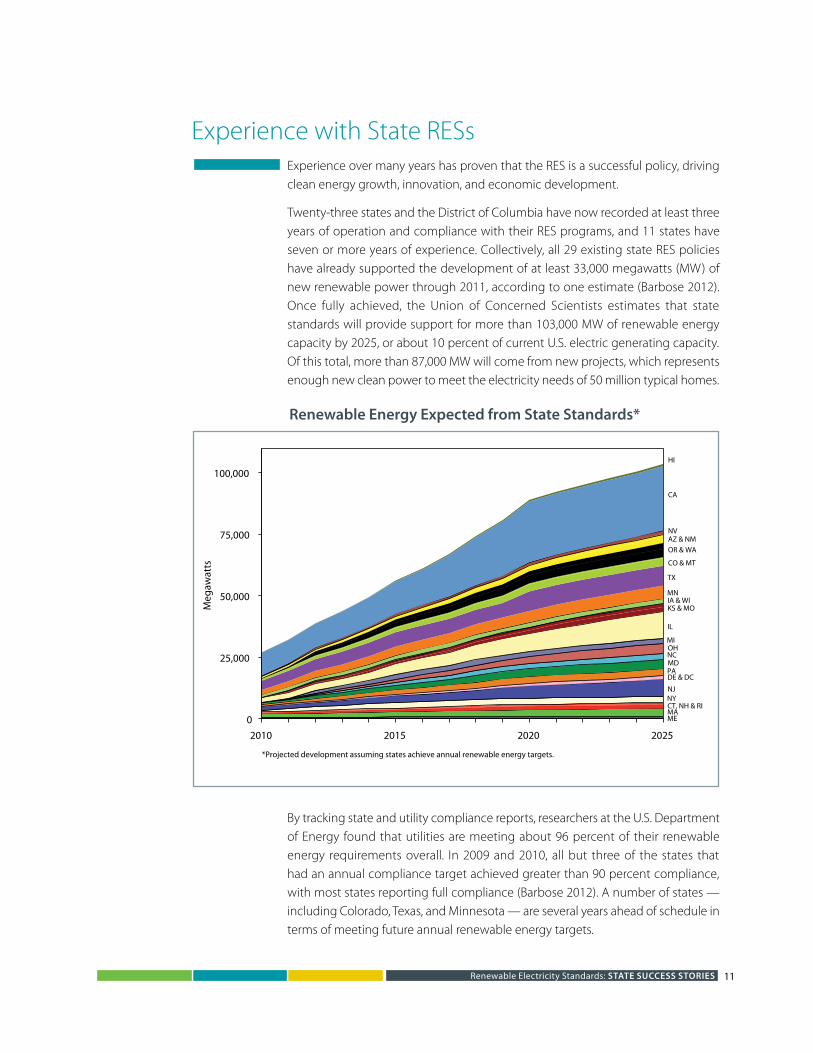
Twenty-three states and the District of Columbia have now recorded at least three years of operation and compliance with their RES programs, and 11 states have seven or more years of experience. Collectively, all 29 existing state RES policies have already supported the development of at least 33,000 megawatts (MW) of new renewable power through 2011, according to one estimate (Barbose 2012). Once fully achieved, the Union of Concerned Scientists estimates that state standards will provide support for more than 103,000 MW of renewable energy capacity by 2025, or about 10 percent of current U.S. electric generating capacity. Of this total, more than 87,000 MW will come from new projects, which represents enough new clean power to meet the electricity needs of 50 million typical homes.
By tracking state and utility compliance reports, researchers at the U.S. Department of Energy found that utilities are meeting about 96 percent of their renewable energy requirements overall. In 2009 and 2010, all but three of the states that had an annual compliance target achieved greater than 90 percent compliance, with most states reporting full compliance (Barbose 2012). a number of states — including Colorado, Texas, and Minnesota — are several years ahead of schedule in terms of meeting future annual renewable energy targets.
ME MA
NY
CA
0
25,000
50,000
75,000
100,000
2010 2015 2020 2025
Meg
awat
ts
HI
NV
TX
IA & WI
NJ
MN
AZ & NM
CT, NH & RI
Renewable Energy Expected from State Standards*
MD
CO & MT
PA DE & DC
OR & WA
*Projected development assuming states achieve annual renewable energy targets.
NC
IL
OH MI
KS & MO
renewable energy expected from State Standards*

12
The renewable energy industry appears to be well-positioned to keep pace with growing demand as state RES targets increase. Renewable energy capacity brought online in each of the past five years has ranged from 6,000 MW to more than 16,000 MW. These levels well exceed the 4,000 MW to 5,000 MW of renewable energy capacity additions projected to be needed annually to meet existing state RES targets on average through 2020 (Barbose 2012).
State RES policies are also proving to be affordable, typically resulting in modest costs or savings for consumers. The Department of Energy also evaluated 2009 and 2010 RES compliance cost data available for 14 states and estimated that all but one state experienced cost impacts of less than 1.5 percent. additional evidence from state and utility compliance reports supports this conclusion. for example:
❚ Rate impacts for customers of Illinois’ two largest utilities, Commonwealth Edison and ameren, were an increase of just 0.04 to 0.08 percent in 2012, down from 0.61 to 0.83 percent in 2010 (Illinois Power agency 2012). another analysis commissioned by the Illinois Power agency found that wind and other renewable energy sources have reduced wholesale electricity prices in Illinois and the entire eastern United States, resulting in $177 million in savings for Illinois in 2011 alone (Illinois Power agency 2012).
❚ In Minnesota, Xcel Energy, the state’s largest utility, reported that renewable energy investments actually lowered prices in 2008-2009 by 0.7 percent. Xcel also reported that customers would pay only 1.4 percent more to meet its standard over the next 15 years. (Midwest Energy news 2011)
❚ The Wisconsin Public Service Commission (PSC) estimated that the state’s RES resulted in a one percent rate impact over three years (2008-2010) for supplying 7.4 percent of total electricity from renewable energy in 2010. (WI PSC 2012)
❚ The two largest utilities in kansas reported rate increases of less than 1.7 percent to cover required renewable energy investments in 2012 and 2013, levels that a Kansas Corporation Commission official characterized as “minimal and reflect the low cost advantage of Kansas electric generation.” (Glass and Ellis 2012)
❚ In Maine, the state’s Public Utilities Commission estimated the RES to have increased rates by just 0.57 percent total through 2010. (ME PUC 2011)
❚ In oregon, RES compliance cost Portland General Electric $630,000 in 2011, which is an estimated 0.04 percent of the utility’s total annual costs of $1.7 billion (PGE 2012). for PacifiCorp — Oregon’s second largest utility — the required investments in renewable energy actually helped lower their total costs by $6.6 million in 2011 (PacifiCorp 2012).
The conclusion that state RES policies are affordable is consistent with the findings of earlier cost projection analyses. In 2007, the Department of Energy conducted an analysis that compared the results from 28 state or utility-level RES cost studies. Seventy percent of the studies reviewed projected retail electricity rate increases of no greater than one percent, and six of the studies resulted in cost savings for electricity consumers. On average, the Department of Energy found that state RESs would result in a monthly electricity bill increase of just 38 cents for a typical residential household (Chen et al. 2007). neither the Department of Energy’s study nor most of the actual compliance reports listed above analyze the effect of increased renewable energy use on natural gas or coal markets, which has been found to lower demand and prices by increasing competition. as a result, the overall energy bill impacts from state RESs could be even lower than reported.
Renewable Electricity Standards: State SUCCeSS StorIeS 13
Because RES policies use market forces to develop the most competitive renewables, wind power has benefitted more than any other renewable energy technology. The Department of Energy estimates that wind power accounted for 89 percent of RES compliance from 1998 to 2011 (Barbose 2012). Wind continued its impressive growth in 2012, installing 13,124 MW of new capacity, resulting in investments totaling $25 billion and comprising 42 percent of total power capacity additions nationwide. nine out of the top 10 states in total installed wind capacity have RES policies in place (aWEa 2013).
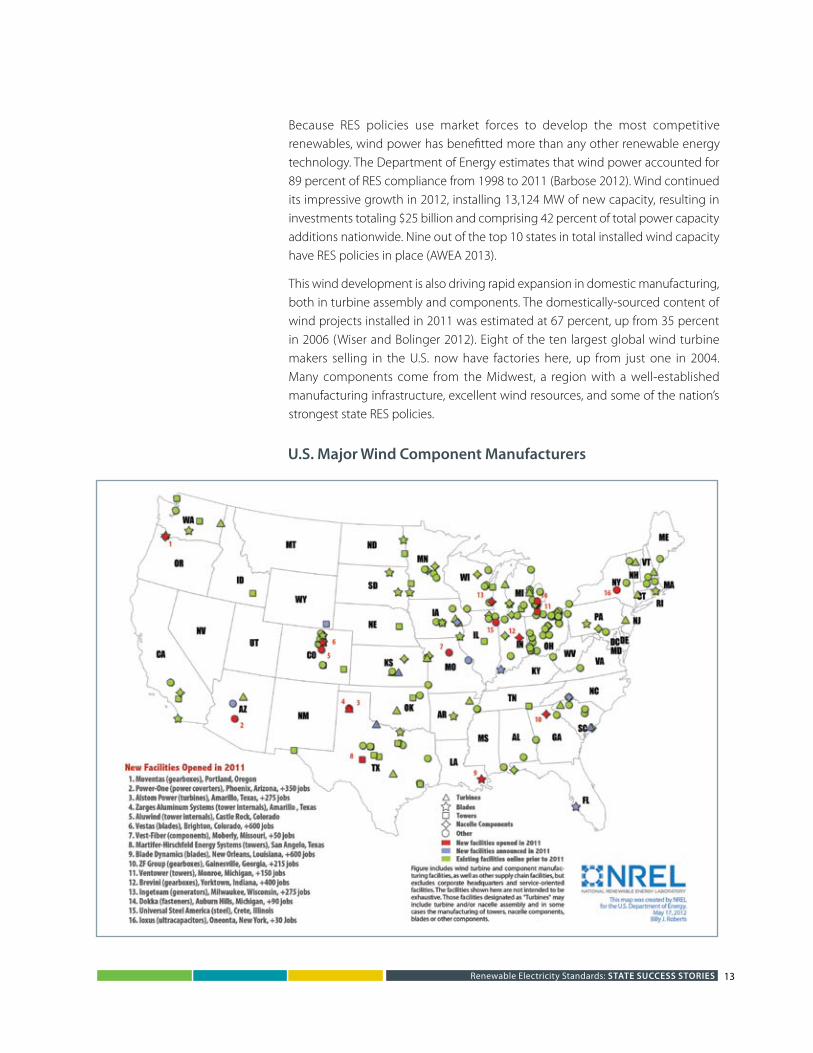
This wind development is also driving rapid expansion in domestic manufacturing, both in turbine assembly and components. The domestically-sourced content of wind projects installed in 2011 was estimated at 67 percent, up from 35 percent in 2006 (Wiser and Bolinger 2012). Eight of the ten largest global wind turbine makers selling in the U.S. now have factories here, up from just one in 2004. Many components come from the Midwest, a region with a well-established manufacturing infrastructure, excellent wind resources, and some of the nation’s strongest state RES policies.
U.S. Major Wind Component Manufacturers

14
RES policies are also driving solar energy, with standards in 18 of the 20 top solar states. (SEIa 2012). Most of this growth is occurring in the northeast and West where many state RESs have solar-specific targets or other incentives. Through 2011, solar requirements in state RESs have supported 1,500 MW of solar PV development (Barbose 2012).
ConClUSIon
Renewable energy standards are bipartisan policies with a strong history of producing remarkable results — modernizing the nation’s power systems while delivering significant benefits. Renewable energy standards deliver jobs and economic benefits to rural areas and cities alike, all while insulating consumers from fuel price risks and building america’s global competitiveness in a growing market for new technology.
OREGOn CASE STudy
Unlike most RES states, Oregon is not heavily dependent on fossil fuels
for electricity generation, getting almost two thirds from hydropower.
Regardless, Oregon passed its RES law in 2007. large utilities must get
to 25 percent by 2025 and smaller utilities have standards of 5 to 10
percent by 2025 depending on their size. Because the purpose of the
RES is to encourage new technologies and to diversify the power system,
all renewables are eligible except conventional large-scale hydro. The
only eligible hydropower is from certified low-impact sources or from
efficiency upgrades to older facilities. a 20 MW solar requirement was
added in 2009.
Development driven by the RES is beginning to bring significant
economic benefits to communities across the state. as of 2011, there
had been an estimated $4.5 billion of capital investment in wind project
development in Oregon.i These projects provide more than $14 million
in annual property tax payments and $7.5 million in annual land lease
payments. In-state renewable power companies attracted more than
$2.6 billion in asset financing and $166 million in venture capital funding
in 2010 and 2011.ii By January 2013 wind capacity had grown to 3,153
MW, adding over 1300 MW in the past three years.iii This is enough power

Renewable Electricity Standards: State SUCCeSS StorIeS 15
to provide more than 7 percent of the state’s electricity needs, and ranks
Oregon fifth in the nation.iv With a potential of more than 27,000 MW,
Oregon’s wind industry is just beginning.
Oregon also has significant potential for electricity from biomass. The
use of residual wood from forest management and the wood products
industry helps maintain forest health, reduces the risk of forest fires,
and provides additional economic opportunities in rural communities.
Oregon currently has 361 MW of biomass power.v By one estimate, forest
thinning alone has the potential to provide enough woody biomass for
an additional 150 MW for the next 20 years.vi
Other renewable industries are growing as a result of the state’s RES
policy. There are currently nine geothermal projects, totaling more
than 234 MW, in various stages of development.vii Wave energy is also
being actively explored, with seven projects along the Oregon coast
undergoing review, possibly providing another 640 MW of renewable
energy. If successful, these would be among the first commercial ocean
energy projects in the world.
The RES is creating manufacturing jobs as well. Iberdrola, Vestas, Horizon
Wind and Element Power, all leading wind energy developers, have a
major corporate presence in the state because of Oregon’s commitment
to the wind industry. Oregon is also the number one manufacturer
of solar components in the U.S., employing over 1,700 people in
2010, and projected to grow to 2,350 by then end of 2012.viii The solar
manufacturing sector in Oregon attracted almost $650 million in plant
investments, creating additional construction and supply jobs. Oregon
is also home to the largest “wafer” solar cell manufacturing facility in the
world, producing more than 500 MW in 2012.
In less than five years, Oregon’s RES policy has proven to be highly
successful at attracting renewable energy industries and the jobs,
investments and revenue streams that they bring with them. With
significant levels of renewable energy resources still untapped across
multiple sectors, Oregon promises to be a leader in renewable energy
development and manufacturing for the foreseeable future.
i. Renewable northwest Project. 2011. Total Renewable Energy Investment in Oregon. Portland, OR. Online at http://www.rnp.org/sites/default/files/pdfs/OR_5_billion_2-page_11Mar23.pdf.
ii. American Council on Renewable Energy. 2012. Renewable Energy in Oregon. Washington D.C. Online at http://www.acore.org/files/pdfs/states/Oregon.pdf.
iii. American Wind Energy Association. 2013. U.S. Wind Industry Fourth Quarter 2012 Market Report.
iv. American Wind Energy Association. 2012. Wind Energy Facts: Oregon. Washington d.C. Online at http://www.awea.org/learnabout/publications/upload/4Q-11-Oregon.pdf.
v. Energy Information Administration, 2010 data.
vi. Oregon Forest Resources Institute.
vii. Renewable northwest Project. 2012. Renewable Energy Projects. Portland, OR. Online at http://www.rnp.org/project_map.
viii. Renewable northwest Project. 2011. Renewable Energy & Economic Development: Real Examples from Oregon. Portland, OR. Online at http://www.rnp.org/sites/default/files/pdfs/OR_Econ_dev_Factsheet_11Mar23.pdf.
ix. Renewable northwest Project. 2011. Total Renewable Energy Investment in Oregon. Portland, OR. Online at http://www.rnp.org/sites/default/files/pdfs/OR_5_billion_2-page_11Mar23.pdf.

16
ReferencesAmerican Wind Energy Association (AWEA). 2013. AWEA U.S. Wind Industry Fourth Quarter 2012 Market Report. Washington, dC: American Wind Energy Association.
Barbose, G. 2012. Renewables Portfolio Standards in the united States: A Status update. Presentation at the 2012 national Summit on RES (december 3). Washington d.C.: Lawrence Berkeley national Laboratory.
Chen, C., R. Wiser, and M. Bolinger. 2007. Weighing the Costs and Benefits of State Renewables Portfolio Standards: A Comparative Analysis of State-Level Policy Impact Projections, LBnL-61850, Berkeley, Calif: Lawrence Berkeley national Laboratory.
Glass, B. and Ellis, L. 2012. Testimony of Bob Glass, Chief of Economics and Rates; Lana Ellis, Senior Economist; Kansas Corporation Commission; Before the Joint Committee on Energy and Environmental Policy Regarding Costs and Effects to Ratepayers of an RES. Topeka, KS: Kansas Corporation Commission.
Illinois Power Agency. 2012. Annual Report: The Costs and Benefits of Renewable Procurement in Illinois under the Illinois Power Agency and Illinois Public utilities Acts. Chicago, IL.
Maine Public utilities Commission (ME PuC). 2011. Maine Public utilities Commission RES Report 2011. Prepared by London Economics International.http://www.maine.gov/tools/whatsnew/attach.php?id=349454&an=1
Midwestern Energy news, “Mixed rate impact from Mn renewable standard”, nov 2011.http://www.midwestenergynews.com/2011/11/02/minnesota-utilities-report-mixed-rate-impact-from-renewable-standard/
Portland General Electric Company (PGE). 2012. Portland General Electric Renewable electricity standard Oregon Compliance Report 2011. Portland, OR.
PacifiCorp. 2012. PacifiCorp Oregon Renewable electricity standard Compliance Report 2011. Portland, OR.
Public Service Commission of Wisconsin (WI PSC). 2012a. Report on the Rate and Revenue Impacts of the Wisconsin Renewable electricity standard http://psc.wi.gov/apps35/ERF_view/viewdoc.aspx?docid=166782.
Solar Energy Industries Association (SEIA). 2012. Solar Energy Facts: Q3 2012. Washington, dC: Solar Energy Industries Association.
Wiser, R. and M. Bolinger. 2012. 2011 Wind Technologies Market Report. Golden, CO: national Renewable Energy Laboratory. www.GovernorsWindEnergyCoalition.org