renewable energylpp.ufes.br/sites/lpp.ufes.br/files/field/anexo/design...generators cummins...
TRANSCRIPT
lable at ScienceDirect
Renewable Energy 88 (2016) 236e246
Contents lists avai
Renewable Energy
journal homepage: www.elsevier .com/locate/renene
Design and analysis of hybrid energy systems: The Brazilian AntarcticStation case
Tiago Malavazi de Christo*, Jussara Farias Fardin, Domingos S�avio Lyrio Simonetti,Lucas Frizera Encarnaç~ao, Cristina Engel de AlvarezFederal University of Espírito Santo, Av. Fernando Ferrari, 514, Goiabeiras, Vit�oria, ES, 29075-910, Brazil
a r t i c l e i n f o
Article history:Received 8 December 2014Received in revised form14 September 2015Accepted 3 November 2015Available online 5 December 2015
Keywords:Renewable integrationEnergy systems designCHPAntarctica
* Corresponding author.E-mail address: [email protected] (T.M. de Ch
http://dx.doi.org/10.1016/j.renene.2015.11.0140960-1481/© 2015 Elsevier Ltd. All rights reserved.
a b s t r a c t
This paper presents the design and analysis of a hybrid energy system for an Antarctic Station. Theresearch considered the constraints of the extreme climate, the logistics limitations and the technicalassets of the Brazilian Antarctic Station. The thermal and electrical annual profiles of the Station, thespreadsheets of the organic solid waste, and the local measured data of wind and sun were investigated.The application of anaerobic digestion, combined heat and power generation, use of photovoltaic panelsand wind turbines were analysed. In the renewables analyses, 25 years of local climatic data wereassessed. The influences of air density, temperature and ground reflectance on the renewable generationwere also investigated. In order to assess potentials hybrid energy systems for the Brazilian AntarcticStation, possible topologies were organized in groups and then analysed by consumption, performanceand feasibility. The methodology supported the identification of an efficient and feasible energy systemfor the Brazilian Station. The proposed system reached 37% of fuel saves considering the original demandprofile of the Station. This work adopted the liter of oil as a currency, thus in any future time the resultscan be used for financial studies.
© 2015 Elsevier Ltd. All rights reserved.
1. Introduction
Antarctic research Stations resemble small isolated villages,requiring water, heating, waste treatment and power generation toensure the human survival conditions [1]. In this scenario, one ofthe most disturbing elements related to the impact of the humanactivities is the use of fossil fuels for energy production. Theemitted gases, the risks of spills, and the difficulty of logistics inAntarctica, make the use of fuels harmful and complex. Thepollution can affect the researches and impact the local fauna andflora. The final cost of the fuel in Antarctica, is also a problem.Literature suggests that in some Stations, the difficult of trans-portation and handling of fuels makes the final cost more thanseven times higher compared to the origin [2].
In this context, the integrationof renewable energy in the Station'spower plants has becoming the most adopted alternative to reducethe environmental impacts, extend the autonomy and minimize theenergy costs [2e9]. However, design hybrid energy systems for the
risto).
cold continent requires a thorough study of local constraints andenergy resources for achieving robustness and autonomy required tothe safe operation even in harsh conditions [2,5,10].
This paper presents the methodology applied on the research ofrenewable energy integration in the Brazilian Antarctic Station [9].Scientific expeditions to Antarctica were made and a comprehen-sive energy investigation of Comandante Ferraz Antarctic Station(EACF, Portuguese acronym) was conducted. The energy con-sumption profiles and the local energy resources were assessed.Finally, several compositions of the hybrid energy systems wereanalysed and the most adequate to EACF, identified.
On February 25, 2012, due to a fuel leak, a severe fire consumed70% of EACF [11]. This research addresses an ultimate and historicalregister of the EACF's complete operational profile. The indicatorsand methodology presented in this paper assisted the benchmarkfor new installations of EACF, which has the construction plannedfor 2015e2018 [12].
2. Material and methods
The research was conducted through scientific expeditions toAntarctica (2008e2011 summers), an energy audit of the EACF
T.M. de Christo et al. / Renewable Energy 88 (2016) 236e246 237
during the 2011 expedition, the estimation of the local energy re-sources and analyses of hybrid energy systems, subjected to thelocal logistic restrictions and worst climate characteristics. Thestatistical analysis was made in dedicated software, and the sim-ulations were performed in HOMER (Hybrid Optimization of Mul-tiple Energy Resources) software [13].
During the expeditions, were performed electrical measure-ments in the generators, in electrical panels and circuits, mea-surements of temperature on the external water pipes, copy ofequipments documentation (generators, boilers and incinerator),copy of the annual spreadsheets of fuels consumption, interviewswith the plant operators and the review of technical assets as built.
The annual electricity consumption profile of the EACF, wasestimated based on the annual fuels spreadsheet, which wasupdated daily by the technicians of the Brazilian Navy. The 2011generators daily fuel consumption were processed considering theefficiency curve of the diesel based generator, Cummins C200-D6-4,at 60% of load. For this load, 36% of the fuel is transformed inelectricity. The diesel proprieties used to convert the daily fuelvolumes in daily energy was the HOMER standard values (lowerheating value of 43.2 MJ/kg, and density of 820 kg/m3).
The annual thermal load profile of the Station, were also esti-mated based on the 2011 annual fuels spreadsheet and cited dieselproprieties. The fuel volumes registered in each boiler's tank supply(the boiler tanks were supplied only once or twice per week), wereprocessed using a simplemoving average (30 days period). The resultwas the daily average boiler consumption alongoneyear. To estimatethe thermal load, the daily fuel averages were finally processedconsidering a boiler efficiency of 90% and the diesel proprieties.
Three-phase voltage and currents of the grid were registeredwith an energy analyser, brand Embrasul, model RE6000, withintegration time set to 100 ms. The measurements were made onthe generator output, on all electrical panels and heating cablescircuits. The electrical loads profile was obtained expressing thepercentage of active power consumption per groups of loads, like:general loads; communication systems; laboratories; and heating.
The estimation of the amount of solid waste useful for energyproduction was made based on the monthly spreadsheets of thewaste generated in the Station and on the EACF's waste classifica-tion presented by Woelffel et al. [14]. The organic solid waste wascounted and the average generation per inhabitant were calculated.The estimation of possible biogas generationwas made consideringthe conversion parameters and technologies presented by Reichertand Hessami et al. [15,16]. Was selected a Chinese digester tech-nology for household organic waste, with 20 days of retentionperiod and production of 31,1 m3 of biogas per tonne. Was assumeda biogas calorific value of 20 MJ/m3.
The estimation of cogeneration capacity was made consideringthe 2011 fuels spreadsheets, the diesel based generators energyflows diagrams presented by Lora & Nascimento and the generatorCummins C200-D6-4 efficiency curve [17]. According to thesedocuments, was considered that in the generators, 36% of theconsumed fuel was transformed in electricity, 40% in recoverableheat and 24% in losses.
To perform the solar energy resource estimation, the global hor-izontal radiation, the transparency index and the influence of groundreflection were assessed. For this was used the monthly solar datafrom NASA Surface Meteorology and Solar Energy programme(average of 1983e2005 from satellite measurements) [18]. Theaverage ground reflectance was considered 70% based on Lainestudies [19]. To evaluate the useful solar energy, a commerciallyavailable monocrystalline photovoltaic solar system (327 W of peakpower, 20.1% of panel efficiency and a power temperature coefficientof �0.38%/�C) with MPPT (Maximum Power Point Tracking) wasanalysed in different fixed-tilt positions and tracking techniques,
considering the influence of temperature and also and also overalllosses of 20% (soiling of the panels, shading, snow cover and wiringlosses). The estimation was performed using HOMER software.
In order to estimate the local wind energy resource, 25 years(monthly averages, 1986e2010) of local climatic data provided bythe National Institute for Space Research from the Brazilian Ant-arctic Meteorology Project, were assessed [20]. The data wasmeasured in a 10-m tower, installed at 16 m above sea level andsituated about 100 m from the Station. The maximum and standarddeviations of annual wind speeds were calculated using statisticalsoftware and the values were used later to specify the reliabilitylimits of the wind energy estimation. The characterization of thewind resource was made through the histograms of wind speeds(3 h averages, 1994e2006), by the equivalent Weibull distributionfunctions (using maximum likelihood algorithm) and average airdensity for each month. The Wind Power Density (WPD) and thewind turbines energy production were estimated also consideringair density. These investigations were performed in the Wind-oGrapher, dedicated software for wind data analysis [21].
The assessment of the advantages and disadvantages of eachalternative in the Station's power plant was carried out by thesimulation of several hybrid compositions, always with the dieselas base. Before the simulation of the hybrid systems the imputeddata and assets parameters in HOMER were validated. The hybridenergy systems are assigned in three groups according to therelation between renewable potency and the mean electricity de-mand of the Station. The systemswere compared in terms of annualfuel saves, performance, area required for the installation,complexity, advantages and logistic effort considering local re-strictions, in accordance with the Antarctic Environmental Protocol[22]. Finally, was selected the hybrid energy system that best fit toall the cited conditions, with minimum equivalent payback (pre-sumed based on the performance and in the amount of assets ofeach energy system).
3. Results
The proposed methodology made possible the comprehensionof the Station's energy system dynamics with the integration ofrenewable and cogeneration systems, and also the identification ofthe most adequate configuration for deployment in the EACF. Theenergy audit of the building, the local energy resources assessment,and finally, the analysis of the renewable integration, are shown asthe elementary investigations.
3.1. Energy audit of the Station
The analysis of the power generation system and loads identi-fied possibilities for energy efficiency actions, heat recovery andrenewable energy integration. The buildings were completelydependent on diesel fuel, and the annual oil consumption in 2011,358,985 L, was more than the local storage capacity, 300,000 L. Totransfer all the oil from the ship to the Station, every summer,approximately 60 complex and risky trips with the oil-carryingvessel were required. For electricity generation, there were fourgenerators Cummins C200-D6-4, of 240 kVA each, but the opera-tion of only one was more than sufficient for the normal Stationoperation (without maintenance activities). One of the generatorswas only for emergency use. For heating the water and the Station'sinterior, two redundant diesel boilers, of 120,000 kcal/h each, wereused on monthly alternation.
The energy audit of the EACF performed in 2011 quantified that78% of fuel was consumed for electricity generation and 18% forheating the water and Station's interior. The diesel oil consumptionfor the generators was 21% higher in the summer and winter
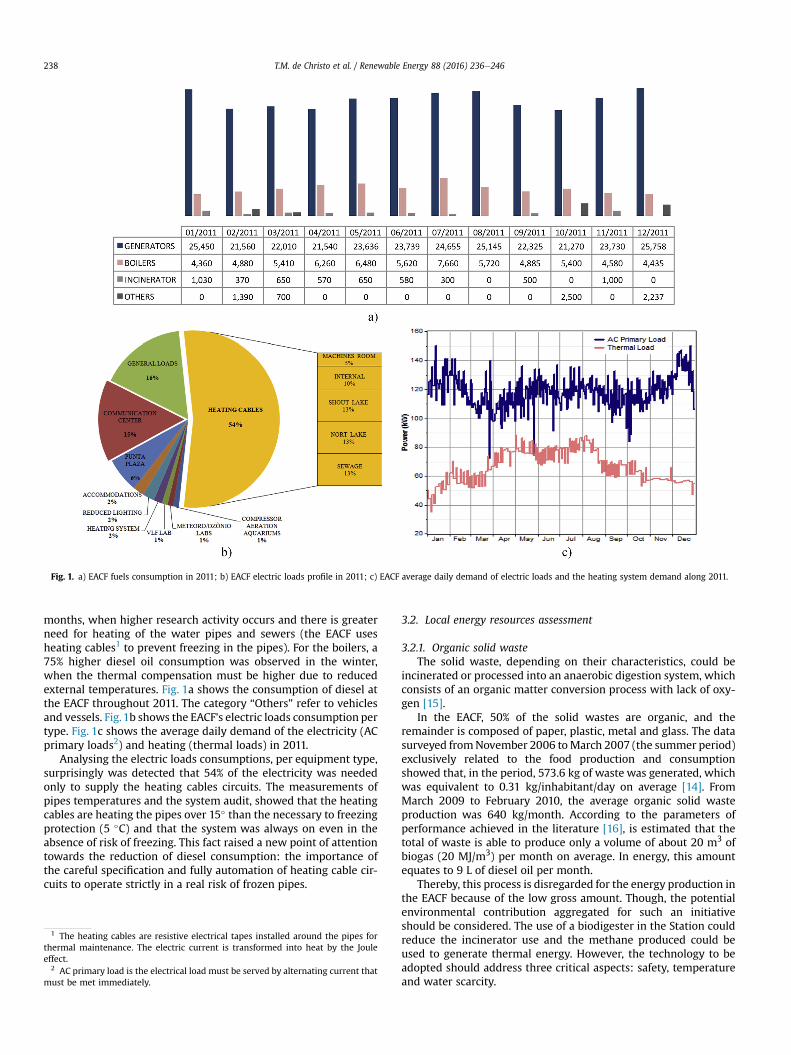
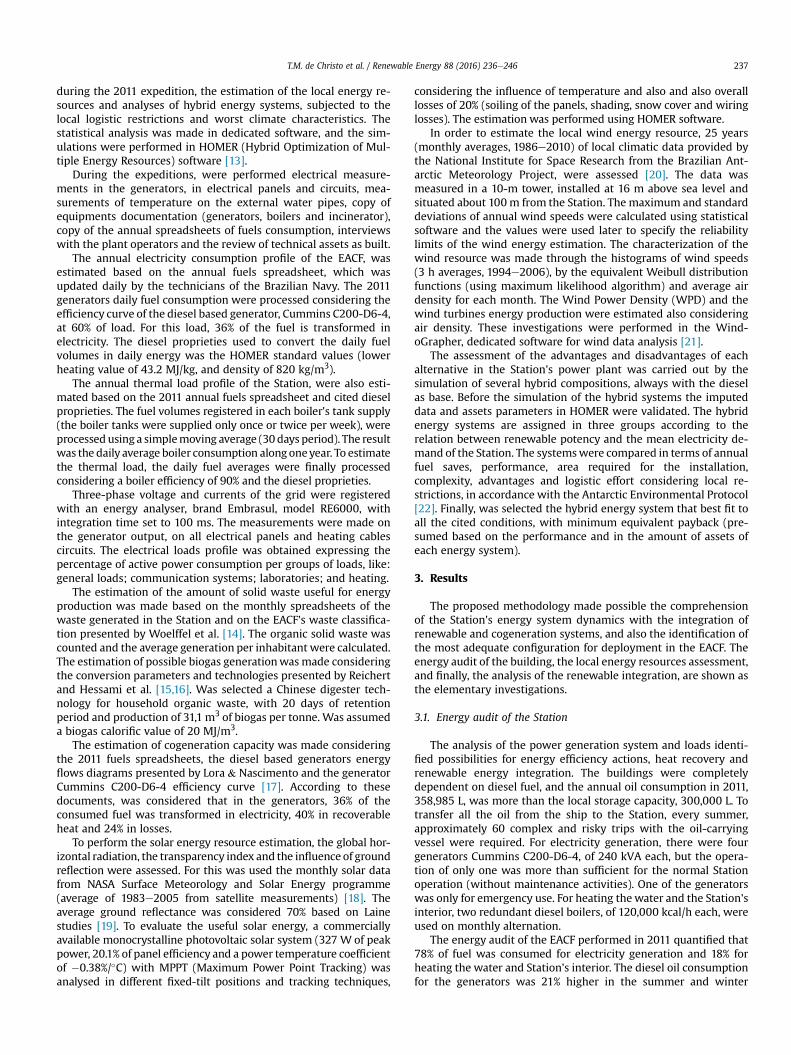
Fig. 1. a) EACF fuels consumption in 2011; b) EACF electric loads profile in 2011; c) EACF average daily demand of electric loads and the heating system demand along 2011.
T.M. de Christo et al. / Renewable Energy 88 (2016) 236e246238
months, when higher research activity occurs and there is greaterneed for heating of the water pipes and sewers (the EACF usesheating cables1 to prevent freezing in the pipes). For the boilers, a75% higher diesel oil consumption was observed in the winter,when the thermal compensation must be higher due to reducedexternal temperatures. Fig. 1a shows the consumption of diesel atthe EACF throughout 2011. The category “Others” refer to vehiclesand vessels. Fig.1b shows the EACF's electric loads consumption pertype. Fig. 1c shows the average daily demand of the electricity (ACprimary loads2) and heating (thermal loads) in 2011.
Analysing the electric loads consumptions, per equipment type,surprisingly was detected that 54% of the electricity was neededonly to supply the heating cables circuits. The measurements ofpipes temperatures and the system audit, showed that the heatingcables are heating the pipes over 15� than the necessary to freezingprotection (5 �C) and that the system was always on even in theabsence of risk of freezing. This fact raised a new point of attentiontowards the reduction of diesel consumption: the importance ofthe careful specification and fully automation of heating cable cir-cuits to operate strictly in a real risk of frozen pipes.
1 The heating cables are resistive electrical tapes installed around the pipes forthermal maintenance. The electric current is transformed into heat by the Jouleeffect.
2 AC primary load is the electrical load must be served by alternating current thatmust be met immediately.
3.2. Local energy resources assessment
3.2.1. Organic solid wasteThe solid waste, depending on their characteristics, could be
incinerated or processed into an anaerobic digestion system, whichconsists of an organic matter conversion process with lack of oxy-gen [15].
In the EACF, 50% of the solid wastes are organic, and theremainder is composed of paper, plastic, metal and glass. The datasurveyed fromNovember 2006 toMarch 2007 (the summer period)exclusively related to the food production and consumptionshowed that, in the period, 573.6 kg of waste was generated, whichwas equivalent to 0.31 kg/inhabitant/day on average [14]. FromMarch 2009 to February 2010, the average organic solid wasteproduction was 640 kg/month. According to the parameters ofperformance achieved in the literature [16], is estimated that thetotal of waste is able to produce only a volume of about 20 m3 ofbiogas (20 MJ/m3) per month on average. In energy, this amountequates to 9 L of diesel oil per month.
Thereby, this process is disregarded for the energy production inthe EACF because of the low gross amount. Though, the potentialenvironmental contribution aggregated for such an initiativeshould be considered. The use of a biodigester in the Station couldreduce the incinerator use and the methane produced could beused to generate thermal energy. However, the technology to beadopted should address three critical aspects: safety, temperatureand water scarcity.
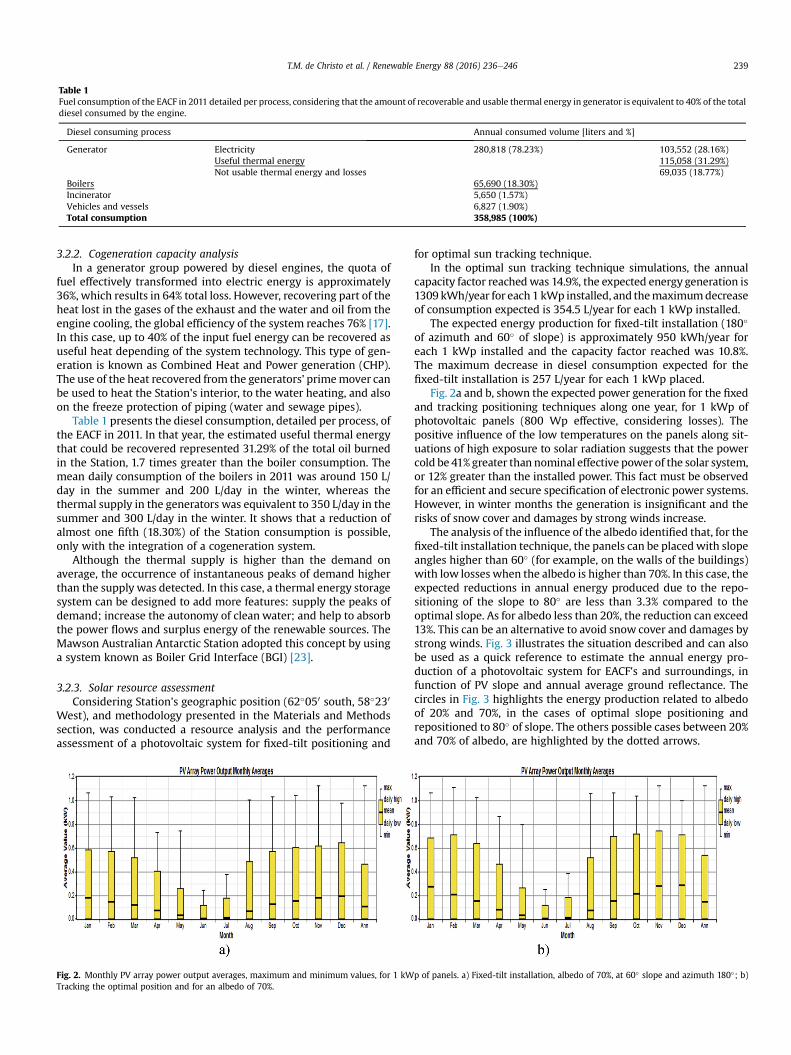
Table 1Fuel consumption of the EACF in 2011 detailed per process, considering that the amount of recoverable and usable thermal energy in generator is equivalent to 40% of the totaldiesel consumed by the engine.
Diesel consuming process Annual consumed volume [liters and %]
Generator Electricity 280,818 (78.23%) 103,552 (28.16%)Useful thermal energy 115,058 (31.29%)Not usable thermal energy and losses 69,035 (18.77%)
Boilers 65,690 (18.30%)Incinerator 5,650 (1.57%)Vehicles and vessels 6,827 (1.90%)Total consumption 358,985 (100%)
T.M. de Christo et al. / Renewable Energy 88 (2016) 236e246 239
3.2.2. Cogeneration capacity analysisIn a generator group powered by diesel engines, the quota of
fuel effectively transformed into electric energy is approximately36%, which results in 64% total loss. However, recovering part of theheat lost in the gases of the exhaust and the water and oil from theengine cooling, the global efficiency of the system reaches 76% [17].In this case, up to 40% of the input fuel energy can be recovered asuseful heat depending of the system technology. This type of gen-eration is known as Combined Heat and Power generation (CHP).The use of the heat recovered from the generators' primemover canbe used to heat the Station's interior, to the water heating, and alsoon the freeze protection of piping (water and sewage pipes).
Table 1 presents the diesel consumption, detailed per process, ofthe EACF in 2011. In that year, the estimated useful thermal energythat could be recovered represented 31.29% of the total oil burnedin the Station, 1.7 times greater than the boiler consumption. Themean daily consumption of the boilers in 2011 was around 150 L/day in the summer and 200 L/day in the winter, whereas thethermal supply in the generators was equivalent to 350 L/day in thesummer and 300 L/day in the winter. It shows that a reduction ofalmost one fifth (18.30%) of the Station consumption is possible,only with the integration of a cogeneration system.
Although the thermal supply is higher than the demand onaverage, the occurrence of instantaneous peaks of demand higherthan the supply was detected. In this case, a thermal energy storagesystem can be designed to add more features: supply the peaks ofdemand; increase the autonomy of clean water; and help to absorbthe power flows and surplus energy of the renewable sources. TheMawson Australian Antarctic Station adopted this concept by usinga system known as Boiler Grid Interface (BGI) [23].
3.2.3. Solar resource assessmentConsidering Station's geographic position (62�050 south, 58�230
West), and methodology presented in the Materials and Methodssection, was conducted a resource analysis and the performanceassessment of a photovoltaic system for fixed-tilt positioning and
Fig. 2. Monthly PV array power output averages, maximum and minimum values, for 1 kWTracking the optimal position and for an albedo of 70%.
for optimal sun tracking technique.In the optimal sun tracking technique simulations, the annual
capacity factor reachedwas 14.9%, the expected energy generation is1309 kWh/year for each 1 kWp installed, and themaximumdecreaseof consumption expected is 354.5 L/year for each 1 kWp installed.
The expected energy production for fixed-tilt installation (180�
of azimuth and 60� of slope) is approximately 950 kWh/year foreach 1 kWp installed and the capacity factor reached was 10.8%.The maximum decrease in diesel consumption expected for thefixed-tilt installation is 257 L/year for each 1 kWp placed.
Fig. 2a and b, shown the expected power generation for the fixedand tracking positioning techniques along one year, for 1 kWp ofphotovoltaic panels (800 Wp effective, considering losses). Thepositive influence of the low temperatures on the panels along sit-uations of high exposure to solar radiation suggests that the powercold be 41% greater than nominal effective power of the solar system,or 12% greater than the installed power. This fact must be observedfor an efficient and secure specification of electronic power systems.However, in winter months the generation is insignificant and therisks of snow cover and damages by strong winds increase.
The analysis of the influence of the albedo identified that, for thefixed-tilt installation technique, the panels can be placedwith slopeangles higher than 60� (for example, on the walls of the buildings)with low losses when the albedo is higher than 70%. In this case, theexpected reductions in annual energy produced due to the repo-sitioning of the slope to 80� are less than 3.3% compared to theoptimal slope. As for albedo less than 20%, the reduction can exceed13%. This can be an alternative to avoid snow cover and damages bystrong winds. Fig. 3 illustrates the situation described and can alsobe used as a quick reference to estimate the annual energy pro-duction of a photovoltaic system for EACF's and surroundings, infunction of PV slope and annual average ground reflectance. Thecircles in Fig. 3 highlights the energy production related to albedoof 20% and 70%, in the cases of optimal slope positioning andrepositioned to 80� of slope. The others possible cases between 20%and 70% of albedo, are highlighted by the dotted arrows.
p of panels. a) Fixed-tilt installation, albedo of 70%, at 60� slope and azimuth 180�; b)
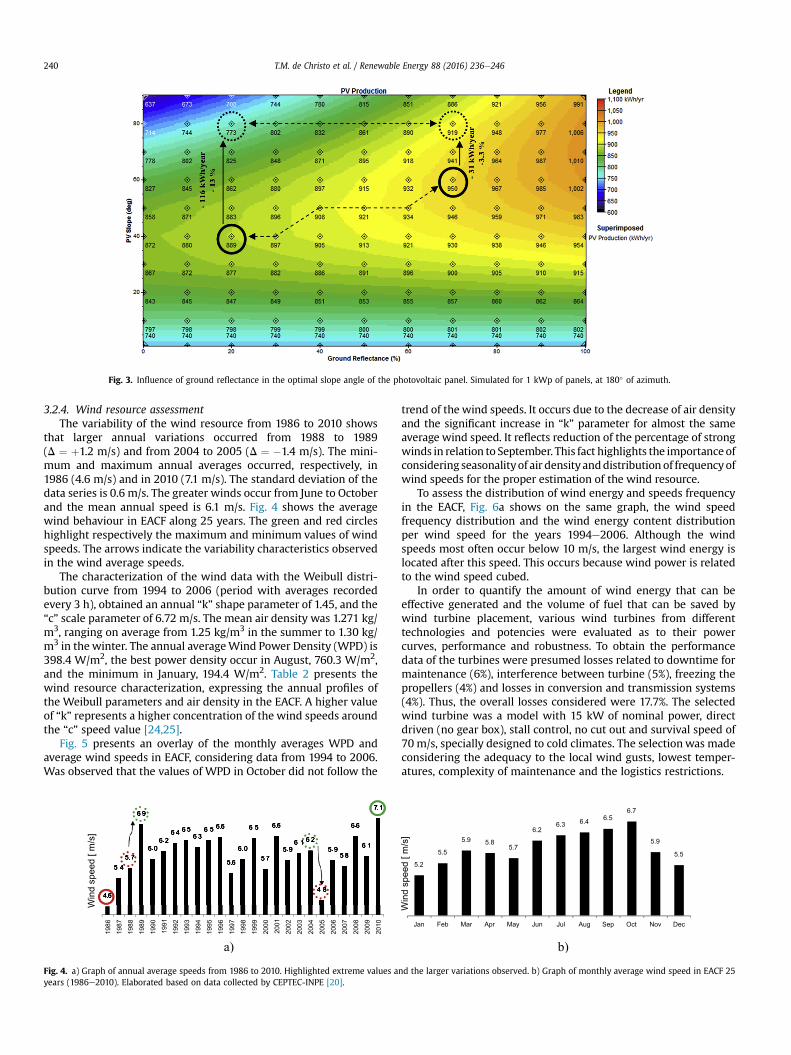
Fig. 3. Influence of ground reflectance in the optimal slope angle of the photovoltaic panel. Simulated for 1 kWp of panels, at 180� of azimuth.
T.M. de Christo et al. / Renewable Energy 88 (2016) 236e246240
3.2.4. Wind resource assessmentThe variability of the wind resource from 1986 to 2010 shows
that larger annual variations occurred from 1988 to 1989(D ¼ þ1.2 m/s) and from 2004 to 2005 (D ¼ �1.4 m/s). The mini-mum and maximum annual averages occurred, respectively, in1986 (4.6 m/s) and in 2010 (7.1 m/s). The standard deviation of thedata series is 0.6 m/s. The greater winds occur from June to Octoberand the mean annual speed is 6.1 m/s. Fig. 4 shows the averagewind behaviour in EACF along 25 years. The green and red circleshighlight respectively the maximum and minimum values of windspeeds. The arrows indicate the variability characteristics observedin the wind average speeds.
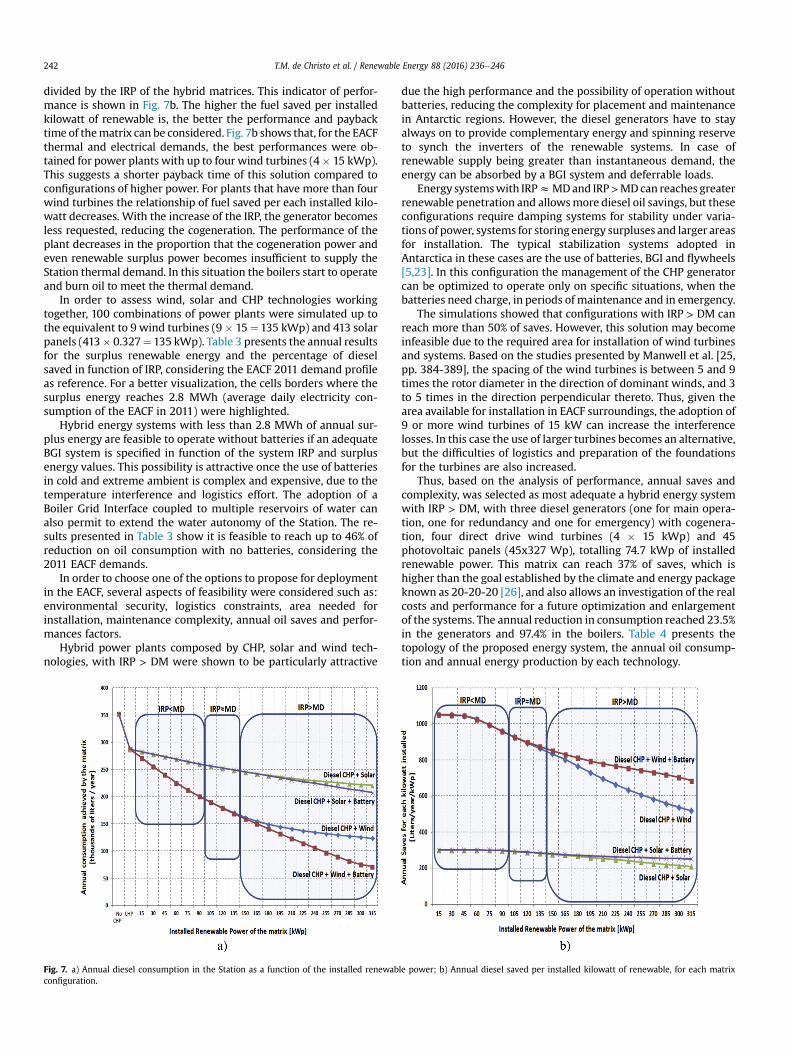
The characterization of the wind data with the Weibull distri-bution curve from 1994 to 2006 (period with averages recordedevery 3 h), obtained an annual “k” shape parameter of 1.45, and the“c” scale parameter of 6.72 m/s. The mean air density was 1.271 kg/m3, ranging on average from 1.25 kg/m3 in the summer to 1.30 kg/m3 in the winter. The annual averageWind Power Density (WPD) is398.4 W/m2, the best power density occur in August, 760.3 W/m2,and the minimum in January, 194.4 W/m2. Table 2 presents thewind resource characterization, expressing the annual profiles ofthe Weibull parameters and air density in the EACF. A higher valueof “k” represents a higher concentration of the wind speeds aroundthe “c” speed value [24,25].
Fig. 5 presents an overlay of the monthly averages WPD andaverage wind speeds in EACF, considering data from 1994 to 2006.Was observed that the values of WPD in October did not follow the
Fig. 4. a) Graph of annual average speeds from 1986 to 2010. Highlighted extreme values ayears (1986e2010). Elaborated based on data collected by CEPTEC-INPE [20].
trend of the wind speeds. It occurs due to the decrease of air densityand the significant increase in “k” parameter for almost the sameaverage wind speed. It reflects reduction of the percentage of strongwinds in relation to September. This fact highlights the importanceofconsidering seasonalityof air densityanddistribution of frequencyofwind speeds for the proper estimation of the wind resource.
To assess the distribution of wind energy and speeds frequencyin the EACF, Fig. 6a shows on the same graph, the wind speedfrequency distribution and the wind energy content distributionper wind speed for the years 1994e2006. Although the windspeeds most often occur below 10 m/s, the largest wind energy islocated after this speed. This occurs because wind power is relatedto the wind speed cubed.
In order to quantify the amount of wind energy that can beeffective generated and the volume of fuel that can be saved bywind turbine placement, various wind turbines from differenttechnologies and potencies were evaluated as to their powercurves, performance and robustness. To obtain the performancedata of the turbines were presumed losses related to downtime formaintenance (6%), interference between turbine (5%), freezing thepropellers (4%) and losses in conversion and transmission systems(4%). Thus, the overall losses considered were 17.7%. The selectedwind turbine was a model with 15 kW of nominal power, directdriven (no gear box), stall control, no cut out and survival speed of70 m/s, specially designed to cold climates. The selectionwas madeconsidering the adequacy to the local wind gusts, lowest temper-atures, complexity of maintenance and the logistics restrictions.
nd the larger variations observed. b) Graph of monthly average wind speed in EACF 25
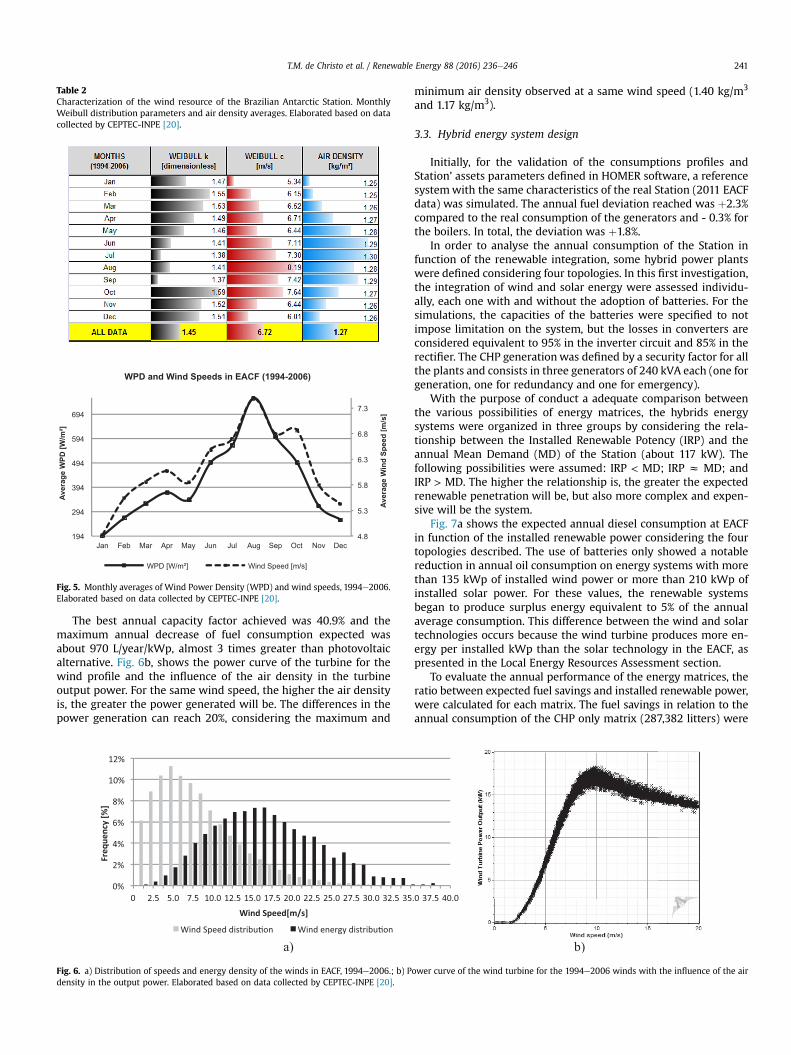
Table 2Characterization of the wind resource of the Brazilian Antarctic Station. MonthlyWeibull distribution parameters and air density averages. Elaborated based on datacollected by CEPTEC-INPE [20].
Fig. 5. Monthly averages of Wind Power Density (WPD) and wind speeds, 1994e2006.Elaborated based on data collected by CEPTEC-INPE [20].
T.M. de Christo et al. / Renewable Energy 88 (2016) 236e246 241
The best annual capacity factor achieved was 40.9% and themaximum annual decrease of fuel consumption expected wasabout 970 L/year/kWp, almost 3 times greater than photovoltaicalternative. Fig. 6b, shows the power curve of the turbine for thewind profile and the influence of the air density in the turbineoutput power. For the same wind speed, the higher the air densityis, the greater the power generated will be. The differences in thepower generation can reach 20%, considering the maximum and
Fig. 6. a) Distribution of speeds and energy density of the winds in EACF, 1994e2006.; b) Pdensity in the output power. Elaborated based on data collected by CEPTEC-INPE [20].
minimum air density observed at a same wind speed (1.40 kg/m3
and 1.17 kg/m3).
3.3. Hybrid energy system design
Initially, for the validation of the consumptions profiles andStation’ assets parameters defined in HOMER software, a referencesystemwith the same characteristics of the real Station (2011 EACFdata) was simulated. The annual fuel deviation reached was þ2.3%compared to the real consumption of the generators and - 0.3% forthe boilers. In total, the deviation was þ1.8%.
In order to analyse the annual consumption of the Station infunction of the renewable integration, some hybrid power plantswere defined considering four topologies. In this first investigation,the integration of wind and solar energy were assessed individu-ally, each one with and without the adoption of batteries. For thesimulations, the capacities of the batteries were specified to notimpose limitation on the system, but the losses in converters areconsidered equivalent to 95% in the inverter circuit and 85% in therectifier. The CHP generationwas defined by a security factor for allthe plants and consists in three generators of 240 kVA each (one forgeneration, one for redundancy and one for emergency).
With the purpose of conduct a adequate comparison betweenthe various possibilities of energy matrices, the hybrids energysystems were organized in three groups by considering the rela-tionship between the Installed Renewable Potency (IRP) and theannual Mean Demand (MD) of the Station (about 117 kW). Thefollowing possibilities were assumed: IRP < MD; IRP z MD; andIRP > MD. The higher the relationship is, the greater the expectedrenewable penetration will be, but also more complex and expen-sive will be the system.
Fig. 7a shows the expected annual diesel consumption at EACFin function of the installed renewable power considering the fourtopologies described. The use of batteries only showed a notablereduction in annual oil consumption on energy systems with morethan 135 kWp of installed wind power or more than 210 kWp ofinstalled solar power. For these values, the renewable systemsbegan to produce surplus energy equivalent to 5% of the annualaverage consumption. This difference between the wind and solartechnologies occurs because the wind turbine produces more en-ergy per installed kWp than the solar technology in the EACF, aspresented in the Local Energy Resources Assessment section.
To evaluate the annual performance of the energy matrices, theratio between expected fuel savings and installed renewable power,were calculated for each matrix. The fuel savings in relation to theannual consumption of the CHP only matrix (287,382 litters) were
ower curve of the wind turbine for the 1994e2006 winds with the influence of the air
T.M. de Christo et al. / Renewable Energy 88 (2016) 236e246242
divided by the IRP of the hybrid matrices. This indicator of perfor-mance is shown in Fig. 7b. The higher the fuel saved per installedkilowatt of renewable is, the better the performance and paybacktime of thematrix can be considered. Fig. 7b shows that, for the EACFthermal and electrical demands, the best performances were ob-tained for power plants with up to four wind turbines (4� 15 kWp).This suggests a shorter payback time of this solution compared toconfigurations of higher power. For plants that have more than fourwind turbines the relationship of fuel saved per each installed kilo-watt decreases. With the increase of the IRP, the generator becomesless requested, reducing the cogeneration. The performance of theplant decreases in the proportion that the cogeneration power andeven renewable surplus power becomes insufficient to supply theStation thermal demand. In this situation the boilers start to operateand burn oil to meet the thermal demand.
In order to assess wind, solar and CHP technologies workingtogether, 100 combinations of power plants were simulated up tothe equivalent to 9 wind turbines (9 � 15 ¼135 kWp) and 413 solarpanels (413� 0.327¼ 135 kWp). Table 3 presents the annual resultsfor the surplus renewable energy and the percentage of dieselsaved in function of IRP, considering the EACF 2011 demand profileas reference. For a better visualization, the cells borders where thesurplus energy reaches 2.8 MWh (average daily electricity con-sumption of the EACF in 2011) were highlighted.
Hybrid energy systems with less than 2.8 MWh of annual sur-plus energy are feasible to operate without batteries if an adequateBGI system is specified in function of the system IRP and surplusenergy values. This possibility is attractive once the use of batteriesin cold and extreme ambient is complex and expensive, due to thetemperature interference and logistics effort. The adoption of aBoiler Grid Interface coupled to multiple reservoirs of water canalso permit to extend the water autonomy of the Station. The re-sults presented in Table 3 show it is feasible to reach up to 46% ofreduction on oil consumption with no batteries, considering the2011 EACF demands.
In order to choose one of the options to propose for deploymentin the EACF, several aspects of feasibility were considered such as:environmental security, logistics constraints, area needed forinstallation, maintenance complexity, annual oil saves and perfor-mances factors.
Hybrid power plants composed by CHP, solar and wind tech-nologies, with IRP > DM were shown to be particularly attractive
Fig. 7. a) Annual diesel consumption in the Station as a function of the installed renewabconfiguration.
due the high performance and the possibility of operation withoutbatteries, reducing the complexity for placement and maintenancein Antarctic regions. However, the diesel generators have to stayalways on to provide complementary energy and spinning reserveto synch the inverters of the renewable systems. In case ofrenewable supply being greater than instantaneous demand, theenergy can be absorbed by a BGI system and deferrable loads.
Energy systemswith IRPzMDand IRP>MDcan reaches greaterrenewable penetration and allowsmore diesel oil savings, but theseconfigurations require damping systems for stability under varia-tions of power, systems for storing energy surpluses and larger areasfor installation. The typical stabilization systems adopted inAntarctica in these cases are the use of batteries, BGI and flywheels[5,23]. In this configuration the management of the CHP generatorcan be optimized to operate only on specific situations, when thebatteries need charge, in periods of maintenance and in emergency.
The simulations showed that configurations with IRP > DM canreach more than 50% of saves. However, this solution may becomeinfeasible due to the required area for installation of wind turbinesand systems. Based on the studies presented by Manwell et al. [25,pp. 384-389], the spacing of the wind turbines is between 5 and 9times the rotor diameter in the direction of dominant winds, and 3to 5 times in the direction perpendicular thereto. Thus, given thearea available for installation in EACF surroundings, the adoption of9 or more wind turbines of 15 kW can increase the interferencelosses. In this case the use of larger turbines becomes an alternative,but the difficulties of logistics and preparation of the foundationsfor the turbines are also increased.
Thus, based on the analysis of performance, annual saves andcomplexity, was selected as most adequate a hybrid energy systemwith IRP > DM, with three diesel generators (one for main opera-tion, one for redundancy and one for emergency) with cogenera-tion, four direct drive wind turbines (4 � 15 kWp) and 45photovoltaic panels (45x327 Wp), totalling 74.7 kWp of installedrenewable power. This matrix can reach 37% of saves, which ishigher than the goal established by the climate and energy packageknown as 20-20-20 [26], and also allows an investigation of the realcosts and performance for a future optimization and enlargementof the systems. The annual reduction in consumption reached 23.5%in the generators and 97.4% in the boilers. Table 4 presents thetopology of the proposed energy system, the annual oil consump-tion and annual energy production by each technology.
le power; b) Annual diesel saved per installed kilowatt of renewable, for each matrix
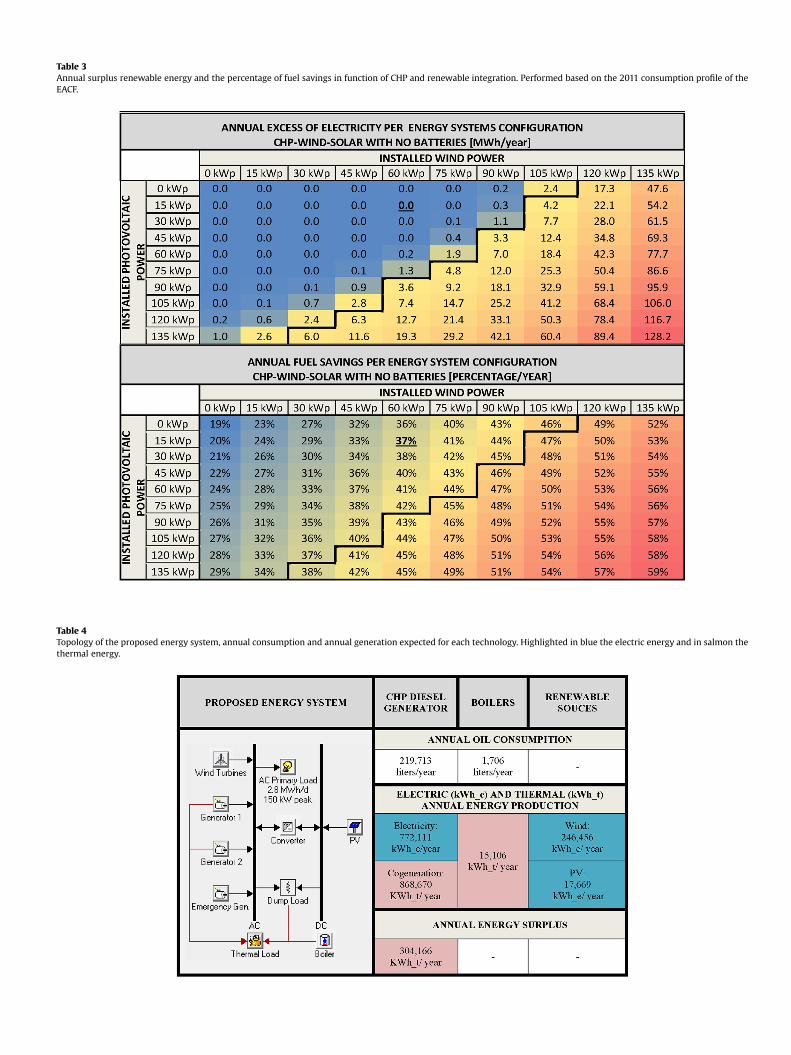
Table 3Annual surplus renewable energy and the percentage of fuel savings in function of CHP and renewable integration. Performed based on the 2011 consumption profile of theEACF.
Table 4Topology of the proposed energy system, annual consumption and annual generation expected for each technology. Highlighted in blue the electric energy and in salmon thethermal energy.
T.M. de Christo et al. / Renewable Energy 88 (2016) 236e246244
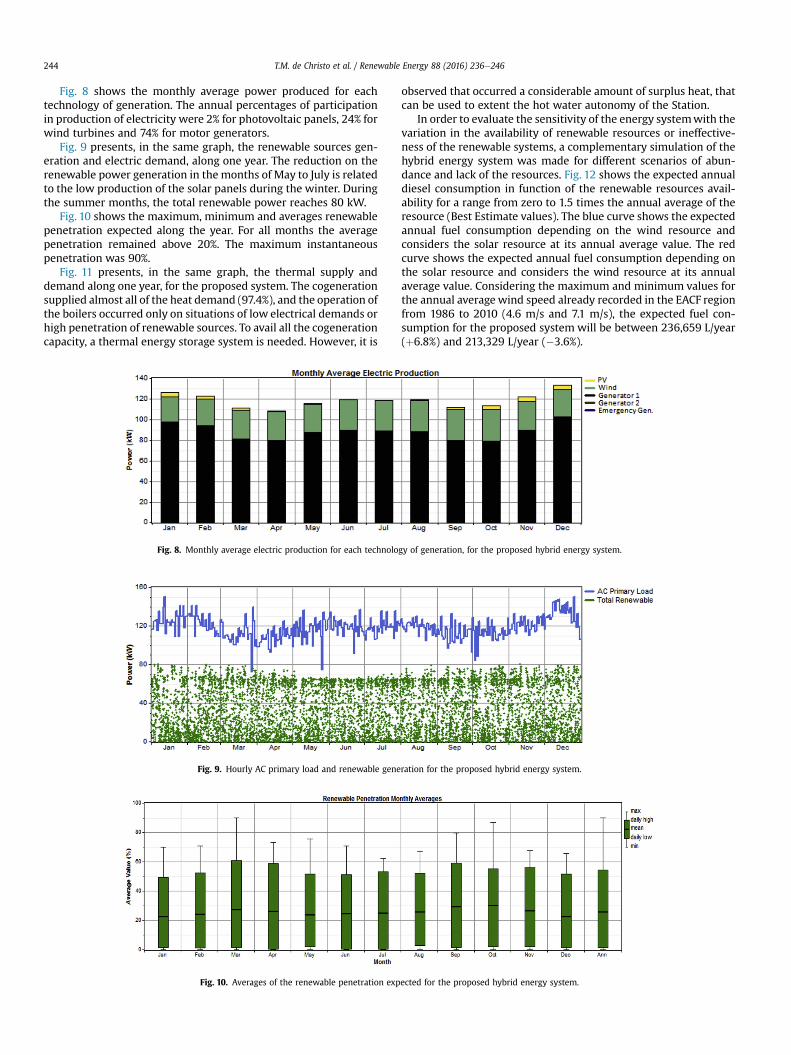
Fig. 8 shows the monthly average power produced for eachtechnology of generation. The annual percentages of participationin production of electricity were 2% for photovoltaic panels, 24% forwind turbines and 74% for motor generators.
Fig. 9 presents, in the same graph, the renewable sources gen-eration and electric demand, along one year. The reduction on therenewable power generation in the months of May to July is relatedto the low production of the solar panels during the winter. Duringthe summer months, the total renewable power reaches 80 kW.
Fig. 10 shows the maximum, minimum and averages renewablepenetration expected along the year. For all months the averagepenetration remained above 20%. The maximum instantaneouspenetration was 90%.
Fig. 11 presents, in the same graph, the thermal supply anddemand along one year, for the proposed system. The cogenerationsupplied almost all of the heat demand (97.4%), and the operation ofthe boilers occurred only on situations of low electrical demands orhigh penetration of renewable sources. To avail all the cogenerationcapacity, a thermal energy storage system is needed. However, it is
Fig. 8. Monthly average electric production for each technolo
Fig. 10. Averages of the renewable penetration exp
Fig. 9. Hourly AC primary load and renewable gene
observed that occurred a considerable amount of surplus heat, thatcan be used to extent the hot water autonomy of the Station.
In order to evaluate the sensitivity of the energy systemwith thevariation in the availability of renewable resources or ineffective-ness of the renewable systems, a complementary simulation of thehybrid energy system was made for different scenarios of abun-dance and lack of the resources. Fig. 12 shows the expected annualdiesel consumption in function of the renewable resources avail-ability for a range from zero to 1.5 times the annual average of theresource (Best Estimate values). The blue curve shows the expectedannual fuel consumption depending on the wind resource andconsiders the solar resource at its annual average value. The redcurve shows the expected annual fuel consumption depending onthe solar resource and considers the wind resource at its annualaverage value. Considering the maximum and minimum values forthe annual average wind speed already recorded in the EACF regionfrom 1986 to 2010 (4.6 m/s and 7.1 m/s), the expected fuel con-sumption for the proposed system will be between 236,659 L/year(þ6.8%) and 213,329 L/year (�3.6%).
gy of generation, for the proposed hybrid energy system.
ected for the proposed hybrid energy system.
ration for the proposed hybrid energy system.
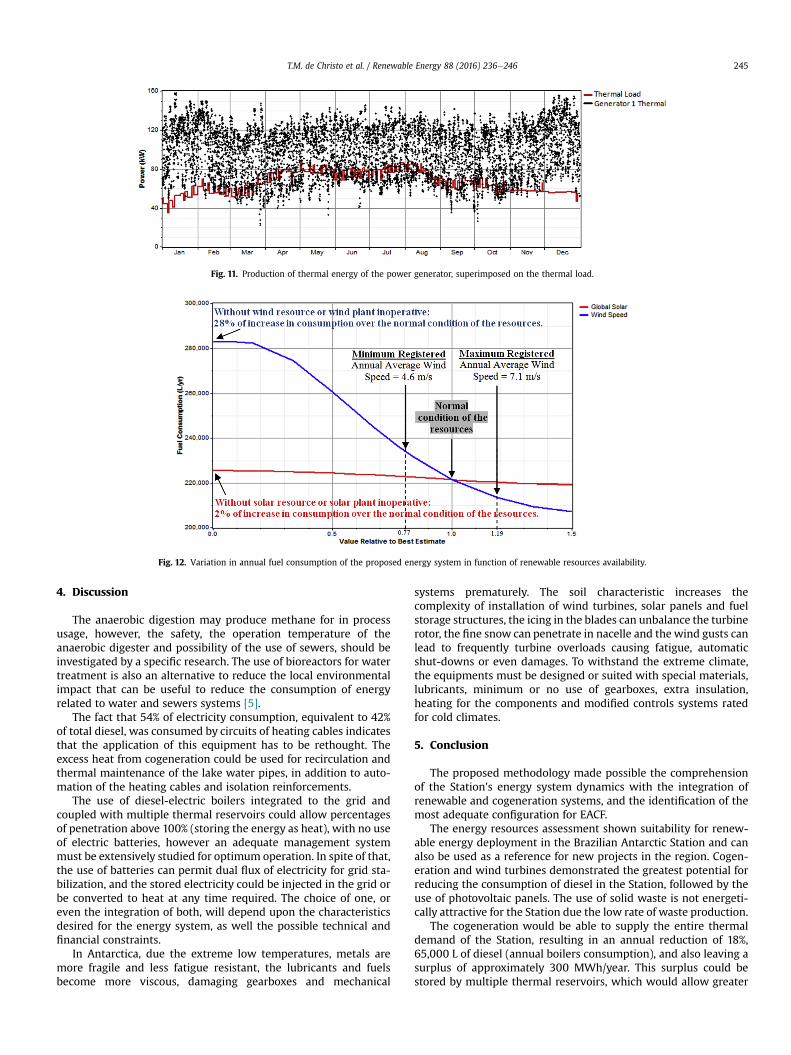
Fig. 11. Production of thermal energy of the power generator, superimposed on the thermal load.
Fig. 12. Variation in annual fuel consumption of the proposed energy system in function of renewable resources availability.
T.M. de Christo et al. / Renewable Energy 88 (2016) 236e246 245
4. Discussion
The anaerobic digestion may produce methane for in processusage, however, the safety, the operation temperature of theanaerobic digester and possibility of the use of sewers, should beinvestigated by a specific research. The use of bioreactors for watertreatment is also an alternative to reduce the local environmentalimpact that can be useful to reduce the consumption of energyrelated to water and sewers systems [5].
The fact that 54% of electricity consumption, equivalent to 42%of total diesel, was consumed by circuits of heating cables indicatesthat the application of this equipment has to be rethought. Theexcess heat from cogeneration could be used for recirculation andthermal maintenance of the lake water pipes, in addition to auto-mation of the heating cables and isolation reinforcements.
The use of diesel-electric boilers integrated to the grid andcoupled with multiple thermal reservoirs could allow percentagesof penetration above 100% (storing the energy as heat), with no useof electric batteries, however an adequate management systemmust be extensively studied for optimum operation. In spite of that,the use of batteries can permit dual flux of electricity for grid sta-bilization, and the stored electricity could be injected in the grid orbe converted to heat at any time required. The choice of one, oreven the integration of both, will depend upon the characteristicsdesired for the energy system, as well the possible technical andfinancial constraints.
In Antarctica, due the extreme low temperatures, metals aremore fragile and less fatigue resistant, the lubricants and fuelsbecome more viscous, damaging gearboxes and mechanical
systems prematurely. The soil characteristic increases thecomplexity of installation of wind turbines, solar panels and fuelstorage structures, the icing in the blades can unbalance the turbinerotor, the fine snow can penetrate in nacelle and the wind gusts canlead to frequently turbine overloads causing fatigue, automaticshut-downs or even damages. To withstand the extreme climate,the equipments must be designed or suited with special materials,lubricants, minimum or no use of gearboxes, extra insulation,heating for the components and modified controls systems ratedfor cold climates.
5. Conclusion
The proposed methodology made possible the comprehensionof the Station's energy system dynamics with the integration ofrenewable and cogeneration systems, and the identification of themost adequate configuration for EACF.
The energy resources assessment shown suitability for renew-able energy deployment in the Brazilian Antarctic Station and canalso be used as a reference for new projects in the region. Cogen-eration and wind turbines demonstrated the greatest potential forreducing the consumption of diesel in the Station, followed by theuse of photovoltaic panels. The use of solid waste is not energeti-cally attractive for the Station due the low rate of waste production.
The cogeneration would be able to supply the entire thermaldemand of the Station, resulting in an annual reduction of 18%,65,000 L of diesel (annual boilers consumption), and also leaving asurplus of approximately 300 MWh/year. This surplus could bestored by multiple thermal reservoirs, which would allow greater
T.M. de Christo et al. / Renewable Energy 88 (2016) 236e246246
autonomy and safety in the operation of the Station.The wind resource assessment shows that the annual mean
WPD is around 400W/m2 (at 10 m of high), the best power densityoccur in August, 760.3 W/m2, and the minimum in January,194.4 W/m2. The analysis of the wind turbines results in an annualcapacity factor of 40.9% and an annual reduction of up to 970 L ofdiesel for each installed kilowatt.
The use of photovoltaic panels can reach an annual capacityfactor of 14.9%, but had a potential for reducing diesel consumptionalmost three times smaller than the wind generation. The low in-tensity of solar radiation in winter and the snow cover can lead thephotovoltaic system to the non operational condition in this season.However, during the summer, when most of the research isdeveloped, the system presents an excellent production rate. Duethe risk of damage by wind gusts, the installation in the walls of thebuildings prove to be alternative, reducing only 3.3% the annualproduction, for an albedo of 70%.
Was identified that is feasible to reach up to 46% of reduction onoil consumption with no batteries, considering the 2011 EACF de-mands. However, the best performances were obtained for con-figurations with up to three or four wind turbines. For matriceswithmore than four wind turbines the relationship of fuel saves perinstalled kilowatt decreased in greater proportion. This decreasewas related to the cogeneration reduction and boiler operation.
The energy systems design methodology presented in thisresearch, led to an energy solution of IRP < DM, with three CHPgenerators (one for main operation, one for redundancy and one foremergency), four direct drive wind turbines and 45 photovoltaicpanels, totalling 74,7 kWp of installed renewable power. This spe-cific system configuration can reach 37% of saves, suggests the bestpayback, and also allows an investigation of the real costs ofdeployment, maintenance and operation of the systems, as well asthe life span, for future optimization and enlargement of theStation.
In this paper, the systems assessments were performed usingthe litre of diesel as a currency. Thus, in any future time these re-sults can be converted to financial indicators.
Acknowledgements
We thank CAPES (Coordination of Improvement of Higher LevelEducation Personnel), CNPq (National Council for Scientific andTechnological Development), SECIRM (Secretariat of the Intermin-isterial for Sea Resources), and the National Institute of Science andTechnology for Environmental Research in Antarctica (CNPq, pro-cess # 574018/2008-5 and FAPERJ, process # E-16/170,023/2008).The authors also thank National Institute for Space Research andBrazilian Navy.
References
[1] C. E. de Alvarez, Arquitetura na Ant�artica: Enfase nas edificaç~oes brasileiras emmadeira (Master thesis), USP, S~ao Paulo, 1996.
[2] Tina Tin, Benjamin K. Sovacool, David Blake, Peter Magill, Saad El Naggar,Sven Lidstrom, Kenji Ishizawa, Johan Berte, Energy efficiency and renewableenergy under extreme conditions: case studies from Antarctica, Renew. En-ergy. ISSN: 0960-1481 35 (8) (August 2010) 1715e1723. http://dx.doi.org/10.1016/j.renene.2009.10.020.
[3] H.W. Teetz, T.M. Harms, T.W. von Backstr€om, Assessment of the wind powerpotential at SANAE IV base, Antarctica: a technical and economic feasibilitystudy, Renew. Energy. ISSN: 0960-1481 28 (13) (October 2003) 2037e2061.http://dx.doi.org/10.1016/S0960-1481(03)00076-4.
[4] Jürgen R. Olivier, Thomas M. Harms, Dani€el J. Esterhuyse, Technical and eco-nomic evaluation of the utilization of solar energy at South Africa's SANAE IVbase in Antarctica, Renew. Energy. ISSN: 0960-1481 33 (5) (May 2008)1073e1084. http://dx.doi.org/10.1016/j.renene.2007.05.044.
[5] K.V. Rattinghe, Princess Elisabeth Research Station at Antarctica - RenewableEnergy Systems Design, Simulation and Optimization (Master Thesis), 2008.Delft.
[6] C. Boccaletti, S. U. R. I. Dept. of Electr. Eng., P. Di Felice, E. Santini, Designingwind plants for extreme ambient conditions, in: XIX International Conferenceon Electrical Machines - ICEM 2010, Rome, 2010, pp. 1e6, http://dx.doi.org/10.1109/ICELMACH.2010.5607915.
[7] Z. Smith, M. Negnevitsky, X. Wang, K. Michael, Cold climate energy produc-tion, in: Power Engineering Conference (AUPEC), 2013 Australasian Univer-sities, vol., no., pp. 1 -6, Sept. 29 2013 -Oct. 3 2013, http://dx.doi.org/10.1109/AUPEC.2013.6725369
[8] Chiara Boccaletti, Pietro Di Felice, Ezio Santini, Integration of renewable powersystems in an Antarctic Research Station, Renew. Energy. ISSN: 0960-1481 62(February 2014) 582e591. http://dx.doi.org/10.1016/j.renene.2013.08.021.
[9] T.M. de Christo, Uma Proposta de Matriz Energ�etica para a Estaç~ao Ant�articaComandante Ferraz: Uma Experiencia Aplic�avel a Novas Edificaç~oes (Masterthesis), UFES, Vit�oria, 2012.
[10] Javier Sanz Rodrigo, Jeroen van Beeck, Jean-Marie Buchlin, Wind engineeringin the integrated design of princess Elisabeth Antarctic base, Build. Environ.ISSN: 0360-1323 52 (June 2012) 1e18. http://dx.doi.org/10.1016/j.buildenv.2011.12.023.
[11] BBC, Two die in fire at Brazil's Antarctic research station, 2012 [Online].Available, http://www.bbc.com/news/world-latin-america-17168526[Accessed 2012].
[12] SECIRM, in: International Bidding Process No 02/2014-Reconstruction of theComandante Ferraz Antarctic Station, June 2014 [Online]. Available, https://www.mar.mil.br/secirm/ingles/licitacoes.html#concorrencia-02-2014[Accessed April 2014].
[13] H.O.M.E.R. Energy, Hybrid optimization of multiple energy resources software,2011 [Online]. Available, http://www.homerenergy.com/ [Accessed 2011].
[14] A.B. Woelffel, C.E. Alvarez, G.R. Soares, D.O. Cruz, Solid residues generated bythe activities of production and food consumption in the Antarctica StationCommander Ferraz (Brazil), in: VI Argentine and III Latin-American Sympo-sium on Antarctic Research, Buenos Aires, Argentina, September 2007.
[15] G.A. Reichert, Aplicaç~ao da digest~ao anaer�obia de resíduos s�olidos urbanos:uma revis~ao, in: 23º Congresso Brasileiro de Engenharia Sanit�aria e Ambiental,2005 pp. III-242.
[16] Mir-Akbar Hessami, Sky Christensen, Robert Gani, Anaerobic digestion ofhousehold organic waste to produce biogas, Renew. Energy. ISSN: 0960-14819 (1e4) (SeptembereDecember 1996) 954e957. http://dx.doi.org/10.1016/0960-1481(96)88438-2.
[17] E.E.S. Lora, M. A. R. d. Nascimento, Geraç~ao termel�etrica: planejamento, pro-jeto e operaç~ao, Interciencia Press, Rio de Janeiro, 2004.
[18] NASA, NASA's Surface and Solar Energy Data Set, 2011 [Online]. Available,http://eosweb.larc.nasa.gov/sse/.
[19] V. Laine, Antarctic Ice Albedo, Temperature and Sea Ice Concentration Trends,1981e2000, in: EUMETSAT 511 Meteorological Satellite Conference, 2007, p.50.
[20] CPTEC-INPE, Ant�artica - Projeto de Meteorologia, 2010 [Online]. Available,http://antartica.cptec.inpe.br/ [Accessed 2010].
[21] WindoGrapher, Wind Resource Analysis and Wind Resource AssessmentSoftware, 2011 [Online]. Available, http://www.windographer.com [Accessed2011].
[22] ATS, The Protocol on Environmental Protection to the Antarctic Treaty, 2011[Online] Available, http://www.ats.aq/e/ep.htm [Accessed 2012].
[23] AAD, Australian Antarctic Division, 29 June 2011 [Online]. Available, http://www.antarctica.gov.au/living-and-working/stations [Accessed 2011].
[24] M.R. Patel, Wind and Solar Power Systems, CRC Press, New York, 1999.[25] J. Manwell, J. McGowan, A. Rogers, Wind Energy Explained - Theory Design
and Application, Baffins Lane, John Wiley & Sons Ltd Press, Chichester, En-gland, 2002.
[26] EU Commission, 2020 Climate & Energy Package, 2012 [Online]. Available,http://ec.europa.eu/clima/policies/strategies/2020/index_en.htm [Accessed2012].