rends in malta - national statistics office ( nso ) study chosen by university students were...
TRANSCRIPT


National Statistics Office
TRENDS IN MALTA2016

ii National Statistics Office - Malta
Published by the National Statistics OfficeLascaris Valletta, VLT 2000MaltaTel.: (+356) 25997000Fax: (+356) 25997103 / 25997205e-mail: [email protected]://www.nso.gov.mt
Trends in Malta 2016National Statistics Office,Valletta: vi, 106p.
ISBN: 978-99957-29-60-8
For further information please contact:
Dissemination UnitNational Statistics OfficeLascarisValletta VLT 2000MaltaTel: (+356) 25997219Fax: (+356) 25997205

Trends in Malta 2016 iii
Preface ivForeword vSOCIETY 1ECONOMY 62LABOUR MARKET 96
CONTENTS

iv National Statistics Office - Malta
PREFACEThe publication Trends in Malta is a statistical compendium containing macro indicators which provide information on an array of topics reflecting current Maltese society.
The booklet is presented in a style which should appeal to a wide audience. It includes concise notes introducing each module, as well as statistical tables which make good use of infographics. These provide an interesting graphical insight on the various economic areas and their social and environmental impacts.
As Chairman I note with satisfaction the contribution of all the statistics units within the National Statistics Office which enabled this publication. The work done also reflects the effort of the Director General, to provide a fresh look to NSO publications, bringing them in line with current trends.
The publication also points to the new way NSO is reaching out to its stakeholders, the media, and the general public.
Prof Albert Leone GanadoChairman Malta Statistics Authority

Trends in Malta 2016 v
FOREWORDStatistics are used to shed light on virtually all aspects of society. Within this context, the NSO has compiled this publication which charts Malta’s development by summarising evolving trends in various areas such as demography, health, education, employment, consumption and industry.
In 2015, immigration was the main driver behind population growth, with the number of immigrants being almost triple the number of births. In the same year, the top two fields of study chosen by university students were Business, administration and law, and Health and welfare. Between 2005 and 2016, traffic casualties went up by 60 per cent while in the gainfully occupied sector, the employment rate in Services increased by nearly 14 per cent in contrast to a fall in Manufacturing.
Statistics need to be produced and communicated bearing in mind the needs of users. Among these, we identify those with
a general interest, those with an institutional interest, those with a commercial or specific interest and those with a research interest. This publication is designed to appeal to all our user groups but above all, it is designed to be a working tool and handy reference work. With this in mind, we have selected a sector which is likely to affect many in our range of users – the employment sector – and have compiled a profile of a typical worker in 2015 compared to the typical employed person a decade ago.
The information presented is underpinned by the body of official statistics produced by the NSO but is by no means representative of the whole statistical output of the Office. All news releases and publications can be viewed and downloaded from the NSO website: www.nso.gov.mthttps://twitter.com/NSOMALTAhttps://www.facebook.com/nsomalta/
Reuben FenechDirector General National Statistics Office

vi National Statistics Office - Malta

SOCIETY
2 Society
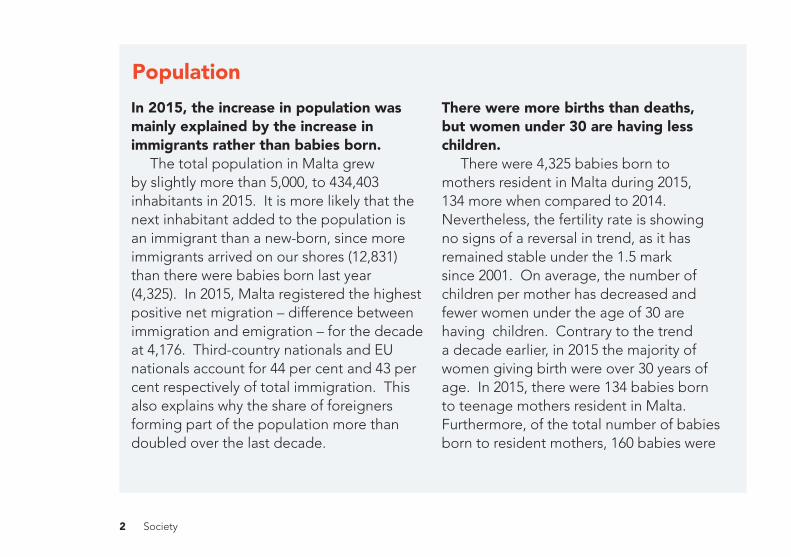
PopulationIn 2015, the increase in population was mainly explained by the increase in immigrants rather than babies born.
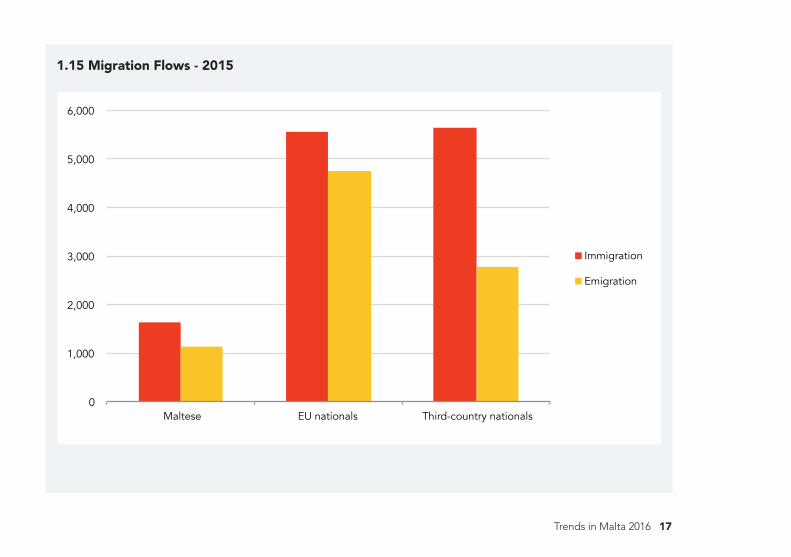
The total population in Malta grew by slightly more than 5,000, to 434,403 inhabitants in 2015. It is more likely that the next inhabitant added to the population is an immigrant than a new-born, since more immigrants arrived on our shores (12,831) than there were babies born last year (4,325). In 2015, Malta registered the highest positive net migration – difference between immigration and emigration – for the decade at 4,176. Third-country nationals and EU nationals account for 44 per cent and 43 per cent respectively of total immigration. This also explains why the share of foreigners forming part of the population more than doubled over the last decade.
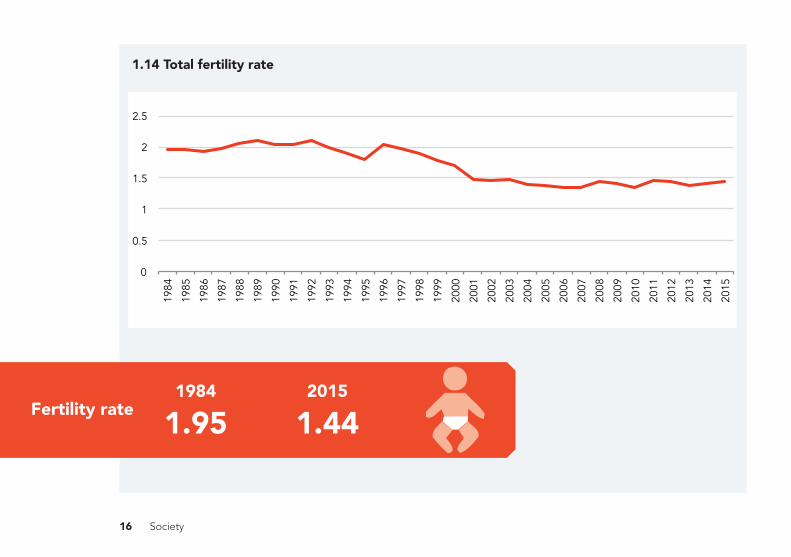
There were more births than deaths, but women under 30 are having less children.
There were 4,325 babies born to mothers resident in Malta during 2015, 134 more when compared to 2014. Nevertheless, the fertility rate is showing no signs of a reversal in trend, as it has remained stable under the 1.5 mark since 2001. On average, the number of children per mother has decreased and fewer women under the age of 30 are having children. Contrary to the trend a decade earlier, in 2015 the majority of women giving birth were over 30 years of age. In 2015, there were 134 babies born to teenage mothers resident in Malta. Furthermore, of the total number of babies born to resident mothers, 160 babies were

Trends in Malta 2016 3
1,844 of the immigrants arriving in Malta in 2015 were asylum seekers, with the majority coming from Libya (49 per cent) and Syria (23 per cent). Syria Libya
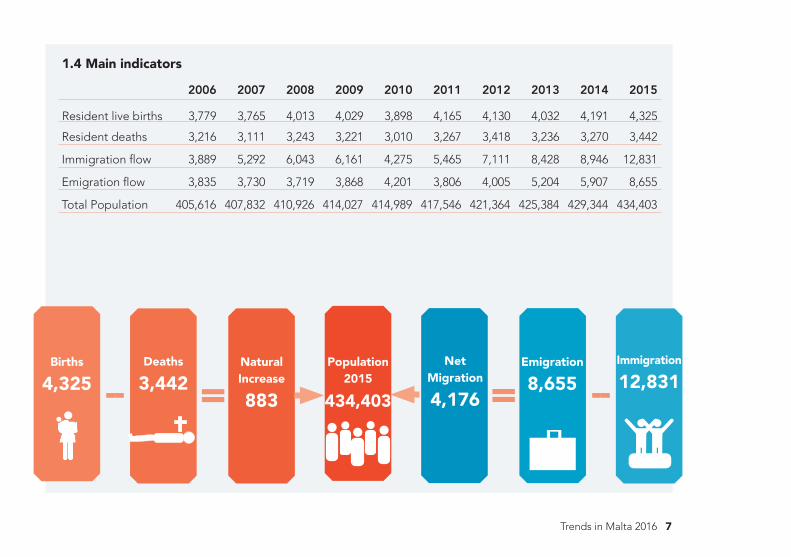
registered as having an ‘unknown father’. Deaths recorded in 2015 amounted to 3,442, 172 deaths more than in 2014, resulting in a natural increase of 883 persons. The natural population growth between 2011 and 2015 was quite stable with an average of 842 every year. However, whereas in 1995 those aged less than 15 and the 65+ accounted for 21.9 per cent and 11.4 per cent of the population respectively, in 2015 those aged less than 15 accounted for 14.2 per cent of the population and the 65+ accounted for 19.0 per cent of the population.
Over 12,000 immigrants came to Malta in 2015.
12,831 immigrants arrived in Malta in 2015, more than three times as much as a decade earlier. Taking into account the 8,655 emigrants, migration resulted in 4,176 more inhabitants. 1,844 of the immigrants (arriving in Malta) were asylum seekers, the majority of whom were from Libya (49 per cent) and Syria (23 per cent).
4 Society
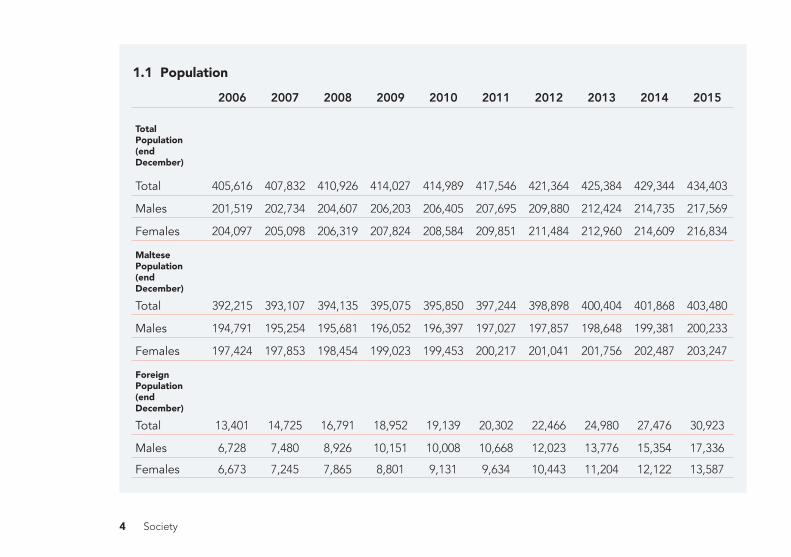
1.1 Population
2006 2007 2008 2009 2010 2011 2012 2013 2014 2015
Total Population (end December)
Total 405,616 407,832 410,926 414,027 414,989 417,546 421,364 425,384 429,344 434,403
Males 201,519 202,734 204,607 206,203 206,405 207,695 209,880 212,424 214,735 217,569
Females 204,097 205,098 206,319 207,824 208,584 209,851 211,484 212,960 214,609 216,834
Maltese Population (end December)
Total 392,215 393,107 394,135 395,075 395,850 397,244 398,898 400,404 401,868 403,480
Males 194,791 195,254 195,681 196,052 196,397 197,027 197,857 198,648 199,381 200,233
Females 197,424 197,853 198,454 199,023 199,453 200,217 201,041 201,756 202,487 203,247
Foreign Population (end December)
Total 13,401 14,725 16,791 18,952 19,139 20,302 22,466 24,980 27,476 30,923
Males 6,728 7,480 8,926 10,151 10,008 10,668 12,023 13,776 15,354 17,336
Females 6,673 7,245 7,865 8,801 9,131 9,634 10,443 11,204 12,122 13,587

Trends in Malta 2016 5
1.2 Total Population (end December) and percentage change
0.0%
0.2%
0.4%
0.6%
0.8%
1.0%
1.2%
1.4%
400,000
405,000
410,000
415,000
420,000
425,000
430,000
435,000
440,000
2006 2007 2008 2009 2010 2011 2012 2013 2014 2015
Total Population Rate of change (%)
6 Society
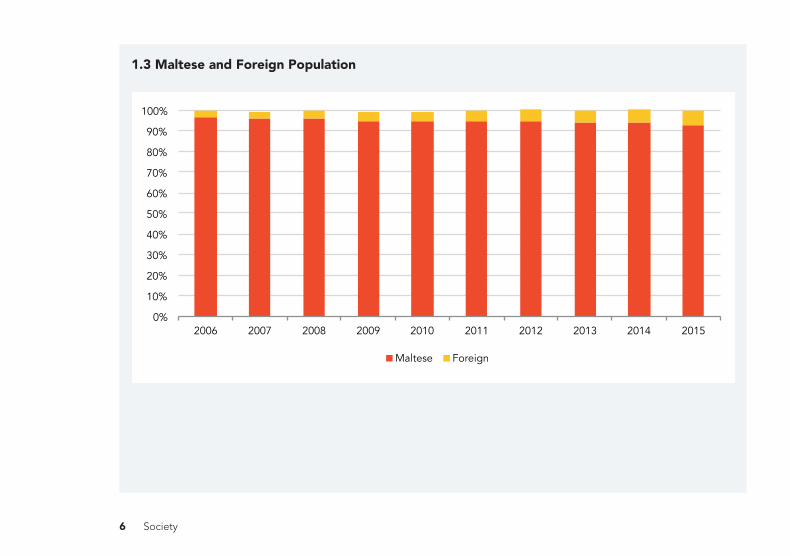
1.3 Maltese and Foreign Population
0%
10%
20%
30%
40%
50%
60%
70%
80%
90%
100%
2006 2007 2008 2009 2010 2011 2012 2013 2014 2015
Maltese Foreign
Trends in Malta 2016 7
1.4 Main indicators
2006 2007 2008 2009 2010 2011 2012 2013 2014 2015
Resident live births 3,779 3,765 4,013 4,029 3,898 4,165 4,130 4,032 4,191 4,325
Resident deaths 3,216 3,111 3,243 3,221 3,010 3,267 3,418 3,236 3,270 3,442
Immigration flow 3,889 5,292 6,043 6,161 4,275 5,465 7,111 8,428 8,946 12,831
Emigration flow 3,835 3,730 3,719 3,868 4,201 3,806 4,005 5,204 5,907 8,655
Total Population 405,616 407,832 410,926 414,027 414,989 417,546 421,364 425,384 429,344 434,403
Births
4,325Deaths
3,442-- = = --Natural Increase
883
Population 2015
434,403
Net Migration
4,176
Emigration
8,655Immigration
12,831

8 Society
1.5 Total Population
390,000
395,000
400,000
405,000
410,000
415,000
420,000
425,000
430,000
435,000
440,000
2006 2007 2008 2009 2010 2011 2012 2013 2014 2015

Trends in Malta 2016 9
14.2%
27.0%
39.7%
19.0%
0-14 15-34 35-64 65+
21.9%
28.0% 38.7%
11.4%
0-14 15-34 35-64 65+
14.2%
27.0%
39.7%
19.0%
0-14 15-34 35-64 65+
21.9%
28.0% 38.7%
11.4%
0-14 15-34 35-64 65+
1.6 Age composition of total population: 1995
1995 2015
1.7 Age composition of total population: 2015

10 Society
1.8 Population by district: 2015
30%
18% 16%
15%
14%
7%
Northern Harbour
Southern Harbour
South Eastern
Northern
Western
Gozo and Comino

Trends in Malta 2016 11
Population Projections: EUROPOP (EUROpean POPulation
projections) are a series of population projections released by
Eurostat, the Statistical Office of the European Communities.
The latest set of European Population projections refer to
the base year 2013, thus short named as EUROPOP2013.
EUROPOP2013 is a 'Convergence Trends' scenario that
includes short-term (nowcasting), medium-term (trend) and
long-term (convergence) components.
Computations are based on a cohort-component method
with 1 January 2013 as the base population, disaggregated by
sex and age. Data on population, live births and deaths used
as input data in the EUROPOP2013 round are official statistics
provided by the national statistical authorities to Eurostat in
the frame of annual demographic data collection. Migration
flows have been measured in terms of net migration (including
statistical adjustment) and computed as residual from the
annual demographic balance.
The ‘main input dataset’, which defines the frame of the main
scenario for producing population projections, includes:
• 2013 base-population;
• assumptions for fertility, mortality and international net
migration (including statistical adjustment).
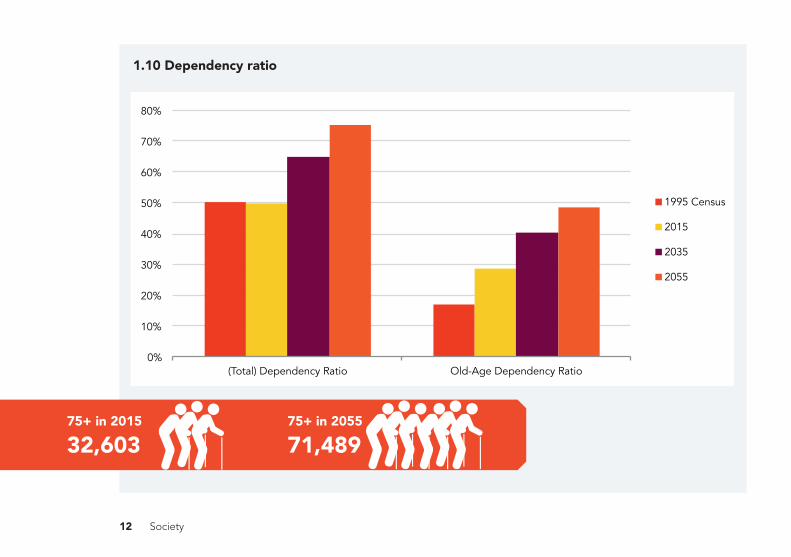
2015 2035 2055
Total 434,403 461,048 472,918
0-14 61,889 68,726 72,403
15-24 52,822 49,790 48,583
25-34 64,546 49,589 56,019
35-44 59,813 59,557 56,608
45-54 53,316 63,839 50,840
55-64 59,276 56,751 57,861
65-74 50,138 47,257 59,115
75+ 32,603 65,539 71,489
1.9 Projected total population: 2035 and 2055
12 Society
1.10 Dependency ratio
75+ in 2055
71,489 75+ in 2015
32,603
0%
10%
20%
30%
40%
50%
60%
70%
80%
(Total) Dependency Ratio Old-Age Dependency Ratio
1995 Census
2015
2035
2055

Trends in Malta 2016 13
Total resident births Maltese resident births Foreign resident births
2006 3,779 3,711 68
2007 3,765 3,683 82
2008 4,013 3,880 133
2009 4,029 3,891 138
2010 3,898 3,777 121
2011 4,165 3,943 222
2012 4,130 3,838 292
2013 4,032 3,666 366
2014 4,191 3,698 493
2015 4,325 3,732 593
* Classification of Maltese live births:
• 2006-2010:
All babies born and registered with the Public Authorities in Malta, one of whose parents is Maltese.
• 2011 onwards:
All babies born in wedlock and registered with the Public Authorities in Malta, one of whose parents is Maltese.
All babies born outside wedlock and registered with the Public Authorities in Malta, having a Maltese mother.
1.11 Total and Maltese* resident live births

14 Society
0
100
200
300
400
500
600
700
2006 2007 2008 2009 2010 2011 2012 2013 2014 2015
1.12 Foreign resident live births

Trends in Malta 2016 15
0
500
1,000
1,500
2,000
2,500
3,000
3,500
4,000
4,500
2006 2007 2008 2009 2010 2011 2012 2013 2014 2015
40+
30-39
20-29
Under 20
1.13 Total live births resident in Malta by age of mother
16 Society
1.14 Total fertility rate
1984 2015
1.95 1.44
0
0.5
1
1.5
2
2.5
1984
1985
1986
1987
1988
1989
1990
1991
1992
1993
1994
1995
1996
1997
1998
1999
2000
2001
2002
2003
2004
2005
2006
2007
2008
2009
2010
2011
2012
2013
2014
2015
Fertility rate
Trends in Malta 2016 17
1.15 Migration Flows - 2015
0
1,000
2,000
3,000
4,000
5,000
6,000
Maltese EU nationals Third-country nationals
Immigration
Emigration

18 Society
1.16 Boats arriving in Malta with irregular immigrants*
*Figures regarding irregular immigrants arriving by boat include airlifted persons who were found at sea
0
10
20
30
40
50
60
70
80
90
0
500
1,000
1,500
2,000
2,500
3,000
2002 2003 2004 2005 2006 2007 2008 2009 2010 2011 2012 2013 2014 2015
Boats Pe
rson
s
Total persons on board
Number of boats arriving
Pers
ons

Trends in Malta 2016 19
1.17 Total applications for asylum filed with the Office of the Refugee Commissioner by quarter
1.18 Asylum first instance decisions taken by the Office of the Refugee CommissionerYear Refugee status Subsidiary protection or
other forms of protectionRejections
2011 70 814 722
2012 35 1,398 157
2013 43 1,563 299
2014 191 1,068 476
2015 263 987 241
0
500
1,000
1,500
2,000
2,500
2011 2012 2013 2014 2015
Quarter 4
Quarter 3
Quarter 2
Quarter 1

20 Society
1.19 Total applications for asylum by country of citizenship: 2015
Libya 49%
Syria 23%
Eritrea 4%
Ukraine 4%
Somalia 3%
Other countries 17%

Trends in Malta 2016 21
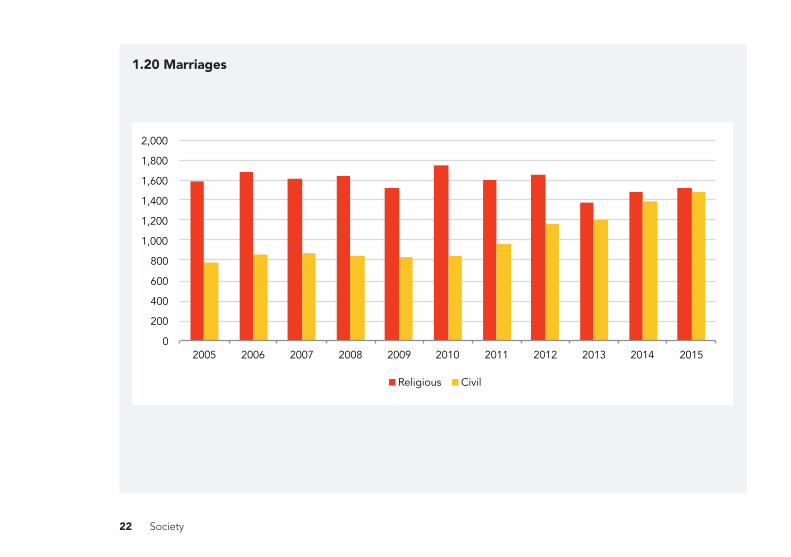
Family formation and dissolutionCivil marriages (including marriages among foreigners) were almost at par with religious marriages in 2015. A decade earlier the number of civil marriages equated to half the number of religious marriages.
There were 3,002 new marriages in 2015. The number of separations, annulments and divorces registered in 2015 were 656, 91 and 468 respectively. Almost half of the registered marriages were civil in 2015, whereas a decade earlier the ratio was one civil marriage for every three registered. The number of marriages increased marginally over the last decade but the number of separations remained at the same level. Since divorce was legalised in 2011, the number of annulments has been declining steadily. In 2015, the number of annulments and divorces obtained from abroad reached 91
2,3742005
3,0022015
Number of marriages occurring in Malta and Gozo
and 96 respectively. The number of divorces obtained from Malta stood at 372 in 2015.The preferred period for tying the knot is the second quarter of the year followed by the third quarter of the year. It is also clear that the number of foreigners choosing to get married in Malta is steadily on the increase.
22 Society
1.20 Marriages
0
200
400
600
800
1,000
1,200
1,400
1,600
1,800
2,000
2005 2006 2007 2008 2009 2010 2011 2012 2013 2014 2015
Religious Civil

Trends in Malta 2016 23
1.22 Quarterly incidence of marriages
Year1st
Quarter2nd
Quarter3rd
Quarter4th
Quarter2005 237 864 779 494
2006 234 929 828 545
2007 214 906 877 482
2008 207 850 921 504
2009 183 899 822 449
2010 200 956 894 546
2011 194 932 919 517
2012 248 1,090 981 504
2013 217 1,002 885 474
2014 244 1,119 961 547
2015 294 1,130 1,012 566
1.21 Number of marriages occurring in Malta and Gozo and percentage of which civil marriages
Total marriages % civil marriages2005 2,374 32.8
2006 2,536 33.8
2007 2,479 34.9
2008 2,482 33.8
2009 2,353 35.3
2010 2,596 32.6
2011 2,562 37.6
2012 2,823 41.4
2013 2,578 46.5
2014 2,871 48.3
2015 3,002 49.3

24 Society
1.23 Quarterly incidence of marriages: 2015
0%
5%
10%
15%
20%
25%
30%
35%
40%
1st Quarter 2nd Quarter 3rd Quarter 4th Quarter

Trends in Malta 2016 25
1.24 Marriages by nationality of spouses
0
200
400
600
800
1,000
1,200
1,400
1,600
1,800
2,000
Maltese Bride
Foreign Bride
Maltese Bride
Foreign Bride
Maltese Bride
Foreign Bride
Maltese Bride
Foreign Bride
2000 2005 2010 2015
Num
ber o
f Mar
riage
s
Maltese Groom
Foreign Groom

26 Society
1.25 Number of registered separations, annulments and divorces recognised by Maltese Authorities
YearTotal
separationsTotal
annulments
Total divorces obtained
from abroad
Total divorces obtained
from Malta
2006 560 200 42
2007 637 167 35
2008 535 188 31
2009 527 166 38
2010 566 124 47
2011 518 178 73 42
2012 554 133 69 441
2013 666 90 61 338
2014 662 77 76 323
2015 656 91 96 372
Total divorces obtained from Malta till end 2015
1,516

Trends in Malta 2016 27
1.26 Number of registered annulments and divorces
0
50
100
150
200
250
300
350
400
450
500
2006 2007 2008 2009 2010 2011 2012 2013 2014 2015
Total annulments Total divorces obtained from abroad Total divorces obtained from Malta
28 Society
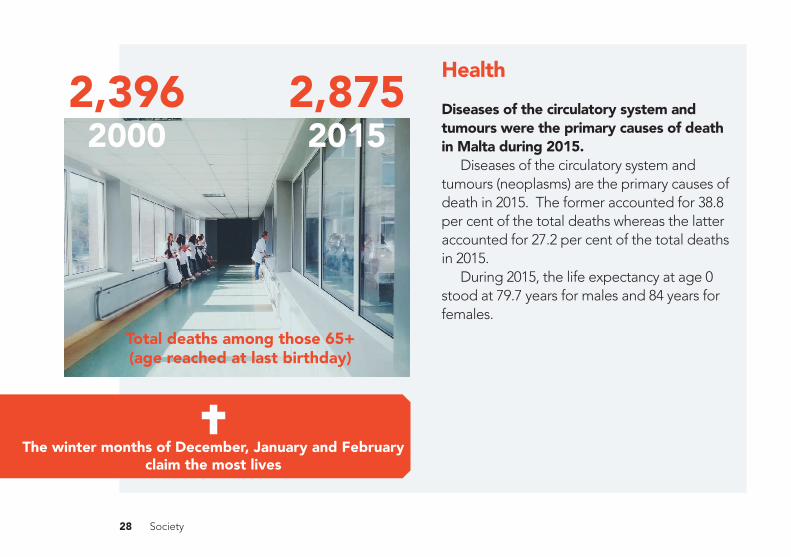
HealthDiseases of the circulatory system and tumours were the primary causes of death in Malta during 2015.
Diseases of the circulatory system and tumours (neoplasms) are the primary causes of death in 2015. The former accounted for 38.8 per cent of the total deaths whereas the latter accounted for 27.2 per cent of the total deaths in 2015.
During 2015, the life expectancy at age 0 stood at 79.7 years for males and 84 years for females.
2,396 2000
2,8752015
Total deaths among those 65+ (age reached at last birthday)
The winter months of December, January and February claim the most lives

Trends in Malta 2016 29
1.28 Deaths by age reached at last birthday
Year Under 20 20-44 45-64 65+2000 46 71 428 2,396
2001 40 82 394 2,388
2002 42 82 413 2,469
2003 37 105 423 2,581
2004 47 82 407 2,470
2005 45 74 459 2,554
2006 33 91 484 2,608
2007 41 105 481 2,484
2008 48 92 552 2,551
2009 39 95 481 2,606
2010 37 87 478 2,408
2011 44 91 471 2,661
2012 32 101 500 2,785
2013 35 71 434 2,696
2014 34 88 428 2,720
2015 40 78 449 2,875
1.27 Deaths annual review
Males Females Total2000 1,491 1,450 2,941
2001 1,465 1,439 2,904
2002 1,585 1,421 3,006
2003 1,584 1,562 3,146
2004 1,492 1,514 3,006
2005 1,577 1,555 3,132
2006 1,667 1,549 3,216
2007 1,610 1,501 3,111
2008 1,668 1,575 3,243
2009 1,672 1,549 3,221
2010 1,489 1,521 3,010
2011 1,664 1,603 3,267
2012 1,746 1,672 3,418
2013 1,636 1,600 3,236
2014 1,655 1,615 3,270
2015 1,732 1,710 3,442

30 Society
1.29 Deaths by age reached at last birthday
0
500
1,000
1,500
2,000
2,500
3,000
3,500
2000
2001
2002
2003
2004
2005
2006
2007
2008
2009
2010
2011
2012
2013
2014
2015
65+
45-64
20-44
Under 20

Trends in Malta 2016 31
1.30 Causes of death
MTL 1* Causes of death 20151 Certain infectious and parasitic diseases 22
2 Neoplasms 936
3/4 Endocrine, Nutritional and Metabolic diseases, and diseases of blood forming organs 191
5 Mental and behavioural disorders 139
6 Diseases of the nervous system and diseases of the ear and mastoid process 99
9 Diseases of the circulatory system 1,334
10 Diseases of the respiratory system 348
11 Diseases of the digestive system 98
12 Diseases of the skin and subcutaneous tissue 19
13 Diseases of the Musculo-skeletal system and the connective tissue 16
14 Diseases of the genito-urinary system 84
15/16 Pregnancy, childbirth and the puerperium, and certain conditions originating in the perinatal period
12
17 Congenital malformations, deformations and chromosomal abnormalities 15
18 Symptoms, signs and abnormal clinical and laboratory findings n.e.c. 15
20 External causes of morbidity and mortality 114
All causes 3,442* Mortality tabulation list 1, ICD-10
Note: Neoplasm: (also termed a tumour) an abnormal growth of tissue cells which could be benign, pre-malignant or malignant.

32 Society
1.31 Most common causes of death
39%
27%
10%
6%
18%
Diseases of the circulatory system
Tumour (Neoplasms)
Diseases of the respiratory system
Endocrine, Nutritional and Metabolic diseases and, diseases of blood forming organs
Other

Trends in Malta 2016 33
EducationIn the academic year 2014/2015, Church-run schools registered the highest average class sizes. The Northern District welcomed the largest number of foreign students at primary level. Females outnumbered males in tertiary programmes.
Primary education students enrolled during the scholastic year 2014/2015 stood at 24,593, an increase of 553 pupils when compared to the previous academic year. Secondary education students declined to 21,215 in 2014/2015 from 21,805 registered a year earlier. State-run primary schools scored the lowest average class size level with 17 students in each class. On the other hand, average class size is the largest in Church-run institutions both at primary and secondary school level. Apart from English and Maltese which are compulsory, Italian and French are the two most popular languages taught at secondary level, as they are studied by 52.9 per cent and 28.9 per cent of students respectively.
Students enrolled in post-secondary (referring to 6th forms & MCAST/ITS Courses at ISCED levels 3 & 4) and tertiary (referring to ISCED levels 5 to 7) education increased by 244 and 623 respectively when compared to the previous academic year. Female students enrolled in tertiary programmes outnumbered males, making up 56.0 per cent of total students at this level. The most popular fields of study among students attending the University of Malta and MCAST at the tertiary level were business, administration and law (2,940 students) and arts and humanities (348 students) respectively.
State-run primary schools in the Northern Harbour District welcomed the highest number of foreign nationals from all of Malta and Gozo. This stood at 40 per cent during 2014/2015. The majority of these students came from the United Kingdom (18.1 per cent), followed by Bulgaria (9.5 per cent) and Italy (9.3 per cent). The highest proportions of foreign students at the tertiary level originated from the United Kingdom, followed by Kuwait, Bulgaria, Italy and Russia.

34 Society
1.32 Number of student enrolments by level of education2012/2013 2013/2014 2014/2015
Primary 23,619 24,040 24,593
Secondary 22,533 21,805 21,215
Special Schools 224 194 174
Post-secondary 1 10,404 10,614 10,858
Tertiary2 12,496 12,480 13,1031 Refers to 6th forms, and MCAST/ ITS courses at ISCED levels 3 & 42 Refers to ISCED levels 5 to 7
of the total student population at tertiary level are females
56%

Trends in Malta 2016 35
1.33 Students enrolled in primary education levels
24,593Primary students enrolled in
2014/2015
3,600
3,700
3,800
3,900
4,000
4,100
4,200
4,300
4,400
Year 1 Year 2 Year 3 Year 4 Year 5 Year 6
2013/2014
2014/2015

36 Population
0
5
10
15
20
25
30
State Church Independent
Ave
rage
num
ber o
f stu
dent
s
School Type
Primary Level
Secondary Level
1.35 Average class size: 2014/2015
1.34 Students enrolled in secondary education levels
3,400
3,600
3,800
4,000
4,200
4,400
4,600
4,800
5,000
Form 1 Form 2 Form 3 Form 4 Form 5
1.33 Students enrolled in secondary education levels
2013/2014
2014/2015
Aver
age
no. o
f stu
dent
s

Trends in Malta 2016 37
0.0
10.0
20.0
30.0
40.0
50.0
60.0
Italian French German Spanish Other
% T
otal
Primary Level
Secondary Level
1.36 Foreign Language Studies by level: 2014/2015 *
* It is possible for students to be enrolled in more than one language
Total foreign studentsin tertiary education 807

37%
30%
12%
8%
8% 5%
Northern District
Northern Harbour District
South Eastern District
Gozo and Comino
Western District
Southern Harbour District
38 Society
1.38 Foreign students attending state primary schools: 2014/2015
1.37 State school students by school district - 2014/2015
Absolute Percentage
Malta Foreigners Not Specified Malta Foreigners Not SpecifiedGozo and Comino 767 28 0 96.5 3.5 0.0
Northern District 1,868 349 4 84.1 15.7 0.2
Northern Harbour District 2,851 419 106 84.4 12.4 3.1
South Eastern District 2,235 123 98 91.0 5.0 4.0
Southern Harbour District 2,617 65 238 89.6 2.2 8.2
Western District 1,647 63 263 83.5 3.2 13.3

Trends in Malta 2016 39
1.39 State primary school foreign students by nationality: 2014/2015
190
100
97
82
66
United Kingdom
Bulgaria
Italy
Syria
Libya
190
100
97
82
66
United Kingdom
Bulgaria
Italy
Syria
Libya
190
100
97
82
66
United Kingdom
Bulgaria
Italy
Syria
Libya
190
100
97
82
66
United Kingdom
Bulgaria
Italy
Syria
Libya

40 Society
1.41 Fields of study preferred by University of Malta students: 2014/2015*
* Includes UoM students at ISCED levels 5 to 7 * Includes Higher national diplomas, Bachelors degrees and Masters programmes
1.40 Students in tertiary education by sex: 2014/2015*
2,940
2,375
1,219
1,217
990
Business, administration and law
Health and welfare
Social sciences, journalism and information
Arts and humanities
Natural sciences, mathematics and statistics
2,940
2,375
1,219
1,217
990
2,940
2,375
1,219
1,217
990
Business, administration and law
Health and welfare
Social sciences, journalism and information
Arts and humanities
Natural sciences, mathematics and statistics
56%
44%
Females
Males

Trends in Malta 2016 41
1.42 MCAST students by preferred field of study and level: 2014/2015
* Equivalent to ISCED levels 3 & 4 ** Equivalent to ISCED levels 5 & 6
0 200 400 600 800 1,000 1,200
Engineering, manufacturing and construction
Information and Communication Technologies
Arts and humanities
Business, administration and law
Post
sec
onda
ry*
Tert
iary
**
92.6% of students in engineering, manufacturing and construction in vocational institutions are males

42 Society
1.43 Foreign nationals in tertiary education by provenance: 2014/2015*
* Only the top 5 countries are being reported here
0 20 40 60 80 100 120 140 160 180 200
Russia
Italy
Bulgaria
Kuwait
United Kingdom
Number of students
Nat
iona
lity

Trends in Malta 2016 43
TrafficThe number of licensed motor vehicles was almost equal to the number of persons aged 18+ in 2015.
The stock of licensed motor vehicles continued to increase in 2016, reaching 358,947, an increase of 3.5 per cent over the end of 2015. This also represents an increase of 17.8 per cent over the beginning of 2010 and an increase of 32.3 per cent over the beginning of 2005. The net stock of licensed vehicles increased to an average of 33 vehicles per day in 2016, up from 20 vehicles per day in 2011.
The number of traffic fatalities by motorcycle was 9 in 2016, the highest since 2005. This accounted for almost 41 per cent of the total traffic fatalities (22) recorded in 2016.
358,947licensed motor vehicles 2016

44 Society
Year Agricultural Bus, Coach & Minibus Motorcycle Passenger car Commercial
vehicle Total
2010 Q1 1,531 1,851 14,541 237,142 45,243 300,308 Q2 1,561 1,846 14,622 238,449 45,127 301,605 Q3 1,568 1,846 14,761 240,447 45,139 303,761 Q4 1,583 1,851 14,844 241,257 45,170 304,705
2011
Q1 1,592 1,858 14,967 242,271 45,083 305,771 Q2 1,607 2,079 15,195 244,606 45,067 308,554 Q3 1,623 1,780 15,438 246,416 45,152 310,409 Q4 1,644 1,756 15,564 247,685 45,298 311,947
2012
Q1 1,650 1,756 15,685 248,558 45,378 313,027 Q2 1,664 1,767 15,722 249,834 45,312 314,299 Q3 1,678 1,764 15,774 250,343 45,308 314,867 Q4 1,694 1,746 15,815 250,035 45,220 314,510
1.44 Stock of licensed motor vehicles

Trends in Malta 2016 45
2013 Q1 1,716 1,750 15,981 251,011 45,417 315,875 Q2 1,725 1,770 16,338 253,253 45,634 318,720 Q3 1,738 1,776 16,678 255,331 46,361 321,884 Q4 1,759 1,712 16,899 256,598 45,992 322,960
2014
Q1 1,775 1,718 17,144 258,430 46,091 325,158 Q2 1,798 1,778 17,613 261,556 46,308 329,053 Q3 1,815 1,787 18,015 264,300 46,538 332,455 Q4 1,830 1,795 18,379 266,518 46,727 335,249
2015 Q1 1,838 1,832 18,716 268,253 46,867 337,506 Q2 1,865 1,846 19,326 270,844 47,100 340,981 Q3 1,875 1,962 19,759 273,567 47,380 344,543 Q4 1,905 1,955 20,088 275,380 47,590 346,918
2016 Q1 1,922 1,970 20,821 276,976 47,697 349,386 Q2 1,954 2,011 21,823 279,032 47,851 352,671 Q3 1,965 1,998 22,713 281,295 48,175 356,146 Q4 1,989 1,999 23,227 283,138 48,594 358,947
1.44 (cont.) Stock of licensed motor vehicles

46 Society
1.45 Stock of licensed vehicles
270,000
280,000
290,000
300,000
310,000
320,000
330,000
340,000
350,000
360,000
370,000
2010 2011 2012 2013 2014 2015 2016

Trends in Malta 2016 47
Traffic casualties up by
60% 2005 - 2016
1.46 Road traffic accidents, casualties and fatalities
Year Traffic Accidents Traffic Casualties Fatalities
2005 14,814 1,156 16
2006 14,776 1,196 10
2007 15,382 1,209 14
2008 14,242 1,172 15
2009 14,877 1,069 21
2010 13,727 1,079 15
2011 14,264 1,577 17
2012 14,546 1,599 9
2013 14,070 1,582 18
2014 14,473 1,796 10
2015 15,504 1,711 11
2016 15,245 1,853 22

48 Society
Use of digital mediaIn 2015, people aged between 20 and 24 were more likely to use social media on a daily basis than other cohorts. The most popular online shopping items were clothing and sports goods.
In 2015, more than three-fourths of the local population (78.4 per cent) used the internet at least once in their life. Of these, 97.2 per cent made use of the internet on a daily basis.
The use of mobile internet has increased in popularity among all age groups. The most common means of accessing the internet remotely is through mobile phones, with a total of 185,314 individuals accessing the internet via these devices.
195,836 individuals made use of social media at least once in their life and 82.5 per cent made use of such media on a daily basis. The use of social media is especially
popular with individuals aged between 20 and 24. This age group alone accounts for 17.6 per cent of individuals who use social media daily.
Clothes and sports goods are the items mostly purchased online, with 52.8 per cent of these purchases made by females. The internet is mostly used for communication purposes and to access information.
52.8%online purchasesby females

Trends in Malta 2016 49
0
5,000
10,000
15,000
20,000
25,000
30,000
35,000
16-19 20-24 25-29
Mobile Phone
Portable Computer
0
10,000
20,000
30,000
40,000
50,000
60,000
70,000
80,000
90,000
100,000
16-24 25-34 35-44 45-54 55-64 65-74
1.47 Use of mobile internet among youths: 2015
1.48 Use of mobile internet by age group0
5,000
10,000
15,000
20,000
25,000
30,000
35,000
16-19 20-24 25-29
Mobile Phone
Portable Computer
pers
ons
pers
ons
52.8%online purchasesby females

50 Society
1.49 Use of social networks by frequency: 2015
80% 85% 90% 95% 100%
16-19
20-24
25-29 Every day or almost every day
At least once a week (but not every day)
Less than once a week
1.50 Percentage of youths using social networks: 2015
0 10,000 20,000 30,000 40,000 50,000 60,000 70,000 80,000 90,000
100,000
Every day or almost every day At least once a week (but not every day)
Less than once a week
Males
Females
pers
ons
0 10,000 20,000 30,000 40,000 50,000 60,000 70,000 80,000 90,000
100,000
Every day or almost every day At least once a week (but not every day)
Less than once a week
Males
Females
80% 85% 90% 95% 100%
16-19
20-24
25-29 Every day or almost every day
At least once a week (but not every day)
Less than once a week

Trends in Malta 2016 51
1.51 Online shopping by gender: 2015*
* Multiple response was permitted
0
10,000
20,000
30,000
40,000
50,000
60,000
70,000
Clothes, sports goods
Electronic equipment
Holiday accommodation
Other travel arrangements
Books, magazines, newspapers
(including books)
Males
Females

52 Society
1.52 Users’ main online activities for private purposes: 2015
0
20,000
40,000
60,000
80,000
100,000
120,000
16-34 35-54 55-74
Age group
Civic and political participation
Personal Life
Access to Information
Communication

Trends in Malta 2016 53
Billed electricity consumptionIn 2015, the household sector consumed almost one-third of all the electricity generated. The construction industry registered the highest average annual increases in billed electricity consumption between 2010 and 2015.
From 2010 to 2015, billed electricity consumption increased by 2.2 per cent per year on average. The only decrease was registered in 2013 with a drop of 0.1 per
cent. The household sector remains the largest consumer taking up almost one-third of the electricity delivered to end users. At 28 per cent, the second largest consumer of electricity is the industrial sector, although the share of electricity consumed by this sector has decreased from 29 per cent in 2010 to 27 per cent in 2015. Agriculture and construction are the smallest sectors, each taking up a share of 1 per cent. However, construction registered the highest rate of increase from all sectors with an average of 11 per cent per year.
The industrial sector consumed
27% of billed electricity
consumption in 2015

54 Society
1.53 Billed electricity consumption by sector, Mwh
Economic sector 2010 2011 2012 2013 2014 2015
Agriculture, forestry and fishing 11,228 9,955 10,613 11,006 11,921 12,038
Mining and quarrying; manufacturing; electricity, gas, steam and air conditioning supply; water supply; sewerage, waste management and remediation activities
517,800 538,241 540,341 536,203 521,160 541,512
Construction 16,196 16,087 17,471 19,292 24,775 26,991
Wholesale and retail trade; repair of motor vehicles and motorcycles; transportation and storage; accommodation and food service activities
360,860 361,422 381,707 385,118 399,247 415,427
Public administration and defence; compulsory social security; education; human health and social work activities
188,683 199,138 214,964 219,221 238,013 264,887
Remaining service activities 110,522 114,265 125,032 120,404 124,121 132,800
Households 588,327 587,891 618,712 615,424 633,765 630,298
Total 1,793,617 1,826,999 1,908,841 1,906,669 1,953,001 2,023,954

Trends in Malta 2016 55
1.54 Billed electricity consumption by sector: 2015
31%
27%
20%
13%
7% 1%
1%
Households
Mining and quarrying; manufacturing; electricity, gas, steam and air conditioning supply; water supply; sewerage, waste management and remediation activities
Wholesale and retail trade; repair of motor vehicles and motorcycles; transportation and storage; accommodation and food service activities
Public administration and defence; compulsory social security; education; human health and social work activities
Remaining service activities
Construction
Agriculture, forestry and fishing

56 Society
WasteIn 2015, mineral and solidified waste accounted for the highest share of total waste generated. The majority of municipal waste generated was landfilled.
The bulk of waste generation is made up of mineral and solidified waste, mainly generated by construction, demolition activities and dredging of port areas. Fluctuations occur in response to large infrastructural and building projects. Recyclable waste, made up of metals primarily, has followed an upward trend from 2009 onwards.
Municipal waste generation peaked in 2008 at 276 thousand tonnes. Amounts have subsequently decreased reaching a low of 245 thousand tonnes in 2011. 2015 has seen the most significant increase over the last five years at 5 per cent. From 2004 to 2015 the landfilling of municipal waste has always
The majority of municipal
waste generated
is landfilled

Trends in Malta 2016 57
surpassed the 80 per cent mark. The highest landfilling rates occurred from 2007 to 2010 when the Sant'Antnin Waste Treatment Plant was undergoing refurbishment works. Material recycling has shown an upward trend from 2008 onwards, peaking in 2013 at 20,000 tonnes. Waste recovered by composting (anaerobic digestion) was recorded for 2011 and 2012, as from 2013 onwards compost was disposed at the landfill.
Malta's urban wastewater treatment plants (UWWTPs) became fully operational in June 2011. Annual data which is available from 2012 onwards shows that the Biochemical Oxygen Demand (BOD)* of treated urban wastewater remained relatively stable. On the other hand, figures for the Chemical Oxygen Demand (COD)* show an average rate of increase of 3 per cent per year. The discharge of total suspended solids has shown a constant increase between
Municipal waste generation peaked in 2008 at
276 thousand tonnes
2012 and 2014, but dropped by 29 per cent in 2015. In terms of percentage reductions in pollutant concentrations all mandatory thresholds have been respected except for the COD value registered in 2015, which is 7 percentage points lower than the threshold (75 per cent).
* BOD and COD both measure the amount of organic compounds present in wastewater.

58 Society
1.55 Waste generation, by waste type
0
500,000
1,000,000
1,500,000
2,000,000
2,500,000
3,000,000
3,500,000
2004 2005 2006 2007 2008 2009 2010 2011 2012 2013 2014 2015
tonn
es
Chemical and medical wastes Recyclable wastes Discarded equipment and vehicles
Animal and vegetal wastes Mixed ordinary wastes Common sludges
Mineral and solidified wastes

Trends in Malta 2016 59
1.56 Municipal waste treatment
0
50,000
100,000
150,000
200,000
250,000
300,000
2004 2005 2006 2007 2008 2009 2010 2011 2012 2013 2014 2015
tonn
es
Material recycling Composting Energy recovery - Incineration
Disposal - Incineration Disposal - Landfill

60 Society
1.57 Pollutant concentrations in treated urban wastewater discharge into the sea
1.58 Percentage reductions in pollutant concentrations for Urban Wastewater Treatment
Year Biochemical Oxygen Demand (%) Chemical Oxygen Demand (%) Total Suspended Solids (%)2012 91 76 89
2013 93 76 92
2014 93 76 91
2015 89 68 91
0
500
1,000
1,500
2,000
2,500
3,000
0
2,000
4,000
6,000
8,000
10,000
12,000
14,000
16,000
18,000
2012 2013 2014 2015
Kg/day (TSS) K
g O
2/da
y
Biochemical Oxygen Demand Chemical Oxygen Demand Total Suspended Solids (refer to right axis)
Kg/day (TSS)Kg O
2/day

Trends in Malta 2016 61
1.59 Percentage reductions in pollutant concentrations - urban wastewater treatment
60%
65%
70%
75%
80%
85%
90%
95%
2012 2013 2014 2015
Biochemical Oxygen Demand Chemical Oxygen Demand Total Suspended Solids

ECONOMY

Trends in Malta 2016 63
Growth in the real economy was mainly driven by domestic demand in 2015.
In 2015, the economy expanded by 7.4 per cent. Malta’s growth outpaced the growth registered at EU28 level which stood at 2.2 per cent and the Euro Area 19 at 2.0 per cent, a pattern observed since 2012.
The contribution of domestic demand to growth was 11.8 percentage points. Domestic demand was driven mainly by investment with a contribution of 8.4 percentage points and total final consumption expenditure with a contribution of 3.4 percentage points to real
Source: NSO, Eurostat
2.1 Economic Growth
National Accounts
-6%
-4%
-2%
0%
2%
4%
6%
8%
10%
2001 2002 2003 2004 2005 2006 2007 2008 2009 2010 2011 2012 2013 2014 2015
European Union (28 countries) Euro area (19 countries) Malta

64 Economy
2.2 Contributors to growth in chain linked volumes (in percentage points)Contributors to growth 2010 2011 2012 2013 2014 2015Total final consumption expenditure 0.2pp 2.5pp 0.9pp 1.3pp 2.8pp 3.4pp
Gross Fixed Capital Formation 4.8pp -3.5pp 0.3pp -0.3pp 1.5pp 8.4pp
Exports of goods and services 10.2pp 3.0pp 11.7pp 2.4pp 8.3pp 6.1pp
Goods 5.9pp 0.7pp 7.6pp -3.1pp -2.0pp 0.0pp
Services 4.3pp 2.3pp 4.1pp 5.4pp 10.4pp 6.1pp
Imports of goods and services 11.4pp -0.5pp 8.7pp 0.7pp 2.4pp 10.3pp
Goods 8.6pp -2.4pp 5.3pp -1.3pp 1.6pp 9.6pp
Services 2.8pp 1.8pp 3.4pp 2.0pp 0.8pp 0.7pp
GDP growth rate 3.5% 1.4% 2.6% 4.5% 8.3% 7.4%
Domestic Demand 5.0pp -1.0pp 1.2pp 1.0pp 4.3pp 11.8pp
Inventories -0.2pp -1.2pp -1.6pp 1.9pp -1.9pp -0.3pp
External Demand -1.2pp 3.5pp 3.0pp 1.6pp 5.9pp -4.1pp
GDP growth. On the other hand, net exports contributed negatively to economic growth at -4.1 percentage points. This was mainly
brought about by the high import content of investment.

Trends in Malta 2016 65
The services sector was the main contributor to growth in private consumption in 2015.
Total final consumption expenditure was driven by private final consumption expenditure with a contribution of 2.6 percentage points to real growth. Private final consumption expenditure increased by 5.3 per cent in
2015, 2.3 percentage points more than the rate registered in 2014. An analysis of final consumption by durability (domestic concept) indicates that over the past fifteen years, growth was mainly generated by services and durable goods. However, the increase in the share of services in private final consumption expenditure was more pronounced.
2.3 Final consumption expenditure of households (domestic concept)
0
500
1,000
1,500
2,000
2,500
3,000
2000
2001
2002
2003
2004
2005
2006
2007
2008
2009
2010
2011
2012
2013
2014
2015
Durable goods Semi-durable goods Non-durable goods Services
0
500
1,000
1,500
2,000
2,500
3,000
2000
2001
2002
2003
2004
2005
2006
2007
2008
2009
2010
2011
2012
2013
2014
2015
mill
ion
Durable goods Semi-durable goods Non-durable goods Services

66 Economy
2.4 Final consumption expenditure of households (domestic concept)
0
1,000
2,000
3,000
4,000
5,000
6,000
2000 2005 2010 2015
mill
ion
Durable goods Semi-durable goods Non-durable goods Services

Trends in Malta 2016 67
it grew by 48.8 per cent, the highest growth recorded since the year 2000. Investment in transport equipment contributed 3.9 percentage points to overall GDP growth and is mainly attributable to investment in the aviation industry, while investment in metal products and machinery contributed a further 3.3 percentage points to the overall GDP growth and is mainly attributable to the energy sector. However, the high import content of this investment caused a negative impact on GDP growth of 4.1 percentage points.
Growth was partly due to investments in the aviation and energy sectors, but the positive effect was partly offset by the high import content.
Government final consumption expenditure increased by 3.8 per cent during 2015, slowing down from 6.5 per cent in the previous year. Notwithstanding this drop, Government final consumption expenditure contributed 0.7 percentage points to real growth.
Gross fixed capital formation (GFCF) was the biggest driver of GDP growth in 2015, as
Investment in metal products and machinery contributed 3.3 percentage points to the overall GDP growth, mainly attributable to the energy sector.

68 Economy
Government Finance*In 2015, lower deficit and government debt were registered.
Economic growth led to a further decline in the deficit, from 2.1 per cent of the GDP in 2014 to 1.4 per cent of the GDP in 2015. This was also reflected by a significant decline in the government debt from 67.0 per cent to 64.0 per cent as a percentage of the GDP in 2014 and 2015 respectively, even though it is still above the ceiling set by the European Commission. General government debt stands at €5,621.9 million, an increase of €200.8 million from the previous year.
Another key indicator is the overall tax burden, expressed as the total amount of direct and indirect taxes along with actual social contributions as a percentage of GDP.
Throughout the past 10 years, the total tax revenue has been consistently above the 31 per cent tax-to-GDP ratio reaching a tax burden of 33.7 per cent in 2015, compared to the 34.0 per cent tax as a percentage of GDP from the preceding year. Increased participation in the labour market together with the increase in Foreign Direct Investment (FDI), contributed to the higher tax inflows.
Over the past 10 years, interest expenditure, which is the amount that the government (as a debtor) becomes liable to pay to creditors over a specific period of time, in proportion to GDP has decreased as a result of lower interest rates and more recently, negative interest rates. The interest-to-GDP ratio went down from 3.0 per cent in 2012 to 2.6 per cent in 2015 – a decline of 0.4 percentage points.
* GDP used in this section is in line with News Release 142/2016 published on 6 September 2016.

Trends in Malta 2016 69
2.5 General Government deficit as a % of GDP*
2.6 Government Deficit and Debt2012 2013 2014 2015
in millions of Euro
Government deficit -261.5 -199.1 -165.9 -120.3Government debt 4,872.5 5,246.3 5,421.1 5,621.9
as a % of GDP
Government deficit -3.6 -2.6 -2.1 -1.4Government debt 67.6 68.4 67.0 64.0
Tax burden 32.2 32.4 34.0 33.7Interest expenditure 3.0 2.9 2.9 2.6
0
1
2
3
4
5
2006 2007 2008 2009 2010 2011 2012 2013 2014 2015
as a
% o
f GD
P
* Maastricht deficit criteria at 3 per cent.

70 Economy
2.7 General Government debt as a % of GDP*
* Maastricht debt criteria at 60 per cent.
54
56
58
60
62
64
66
68
70
72
2006 2007 2008 2009 2010 2011 2012 2013 2014 2015
as a
% o
f GD
P

Trends in Malta 2016 71
2.8 The composition of total government expenditure (as a % of GDP)
2001 2015
Malta EU-28 Malta EU-28
Compensation of employees
14.3 10.3 12.7 10.1
Intermediate consumption 4.5 5.2 6.8 6.0
Property income, payable 3.8 3.4 2.6 2.3
Gross capital formation 3.7 3.0 4.4 2.9
Social benefits and social transfers in kind 12.2 18.9 11.7 21.0
Subsidies, payable 1.3 1.3 1.3 1.3
Current transfers, payable 1.5 2.1 2.3 2.3
Capital transfers, payable 0.6 1.2 1.5 1.1
Total expenditure 41.8 45.3 43.2 47.0

72 Economy
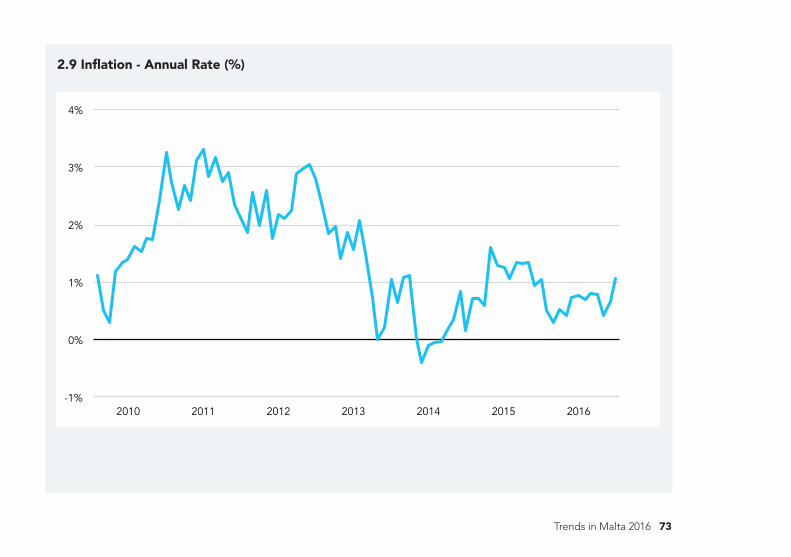
InflationInflation in 2016 was mainly driven by the Food Index, in particular, higher prices for restaurant services and the like.
The Maltese inflation rate (annual rate), as measured by the RPI, experienced a gradual drop from 2011 to 2014, starting off at 2.72 per cent in January 2011, whereas in December 2014 the rate stood at 0.15 per cent. The annual inflation rate fluctuated throughout 2015 and 2016, yet increased gradually reaching 1.06 per cent in December 2016. The
average rate of inflation in 2016 stood at 0.64 per cent. The increase observed in 2016 was mainly brought about by developments in the Food Index, in particular, higher prices for restaurant services and the like. This growth was partly offset by the drop in the Transport and Communication Index, reflecting lower fuel prices. The RPI went up from 100 in December 2009 to 111.99 recorded in December 2016. This means that if a basket of goods and services cost €100 in December 2009, in December 2016 you needed to spend €11.99 more to purchase the same basket.
Over 7 years prices increased by
11.99%
Trends in Malta 2016 73
2.9 Inflation - Annual Rate (%)
-1%
0%
1%
2%
3%
4%
2010 2011 2012 2013 2014 2015 2016

74 Economy
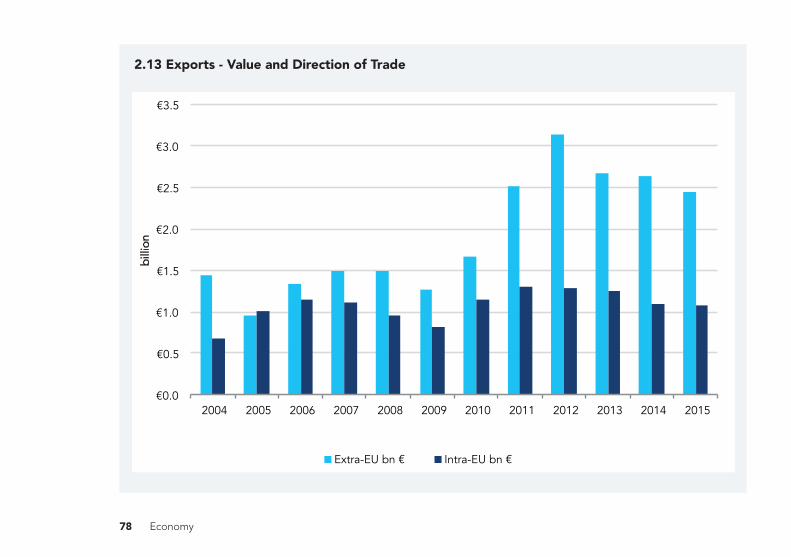
International tradeSince 2012, the value of goods exported outside the EU was more than twice the value exported to the EU.
In 2015, the value of Maltese imports and exports was less by €294.2 million and €210.5 million respectively when compared to the levels recorded in 2014. This decline was primarily brought about by the commodity group mineral fuels, lubricants and related materials. Accounting for more than half the imports were machinery and transport equipment (39.2 per cent) and mineral fuels, lubricants and related materials (27.9 per cent). The same commodity groups (but in reverse order) accounted for 65.9 per cent of the value of exports.
When it comes to the direction of trade, Malta imports mainly from the EU and exports more than two-thirds of the value of exports to countries outside the EU. Deducting the fuel component from the value of imports
and exports it can be noted that between 2010 and 2015, imports increased steadily reaching €4.4 billion in 2015, whereas exports remained relatively stable, hovering between €2.0 billion and €2.5 billion.

Trends in Malta 2016 75
2.10 Value of Imports of goods (€6.1 billion): 2015
39%
28%
9%
8%
8%
7% 1%
Machinery and transport equipment
Mineral fuels, lubricants and related materials
Food and live animals
Chemicals and related products, n.e.s.
Miscellaneous manufactured articles
Manufactured goods classified chiefly by material
Beverages and tobacco

76 Economy
2.11 Value of Exports of goods (€3.5 billion): 2015
38%
27%
12%
10%
7%
4% 2%
Mineral fuels, lubricants and related materials
Machinery and transport equipment
Miscellaneous manufactured articles
Chemicals and related products, n.e.s.
Food and live animals
Manufactured goods classified chiefly by material
Other

Trends in Malta 2016 77
2.12 Imports - Value and Direction of Trade
0.0
0.5
1.0
1.5
2.0
2.5
3.0
3.5
4.0
4.5
2004 2005 2006 2007 2008 2009 2010 2011 2012 2013 2014 2015
billi
on
Extra-EU bn Intra-EU bn
78 Economy
2.13 Exports - Value and Direction of Trade
0.0
0.5
1.0
1.5
2.0
2.5
3.0
3.5
2004 2005 2006 2007 2008 2009 2010 2011 2012 2013 2014 2015
billi
on
Extra-EU bn Intra-EU bn

Trends in Malta 2016 79
2.14 Value of Imports & Exports excluding fuel
0.0
0.5
1.0
1.5
2.0
2.5
3.0
3.5
4.0
4.5
5.0
2010 2011 2012 2013 2014 2015
billi
on
Imports Exports

80 Economy
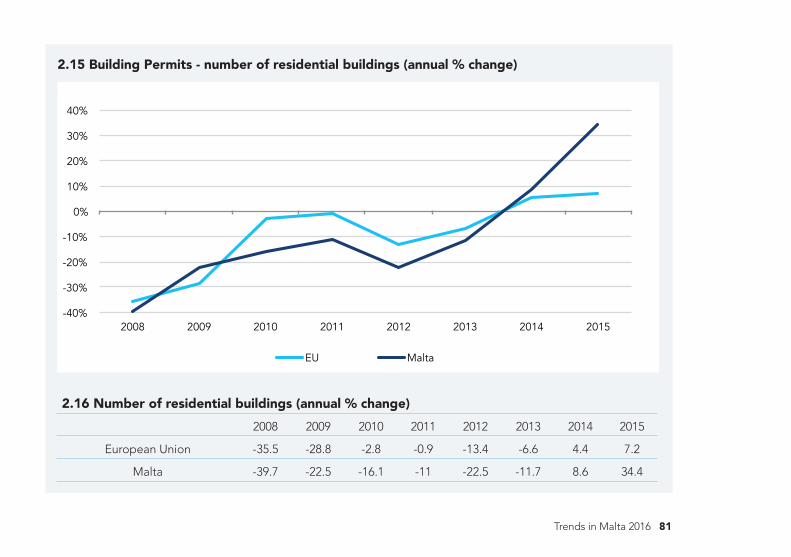
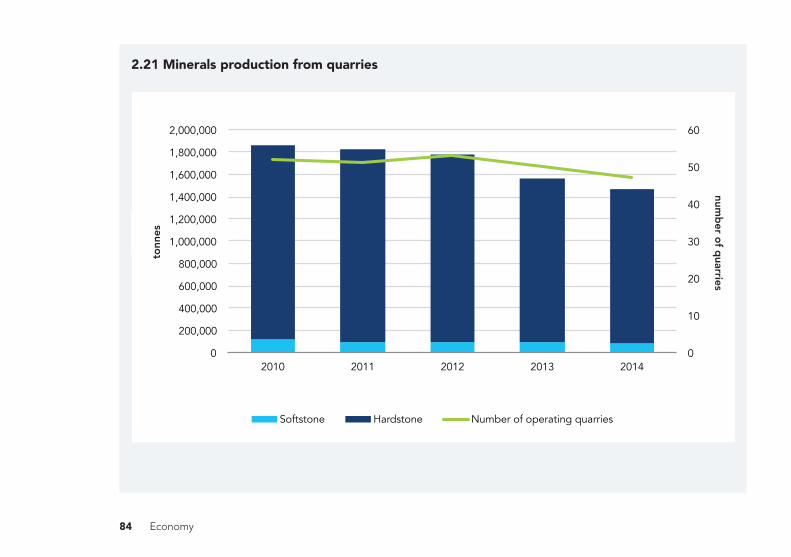
Construction In 2015, building permits increased by 34.4 per cent. Between 2010 and 2014, mineral production from quarries decreased by 21 per cent.
The absolute number of permits issued in 2015 increased by over 34 per cent when compared to 2014. This is the highest increase registered during these last years and is much higher than the average increase of 7.2 per cent registered at EU level. This is in line with the amount of useful floor area registered in 2015, which increased by over 19 per cent when compared to 2014. Again, this was the highest increase registered in the past years and more pronounced than the increase registered at EU level of 6.6 per cent.
From 2010 to 2014, mineral production from quarries has decreased by 21 per cent. Hardstone quarries have recorded year-on-year decreases with the most significant
drop being recorded in 2013. Softstone production has also decreased by an average of 6 per cent per year. The number of operating quarries has likewise gone down from 52 in 2010 to 47 in 2014 due to the closing down or temporary suspension of activities in softstone quarries.
+34.4%Building Permits
Trends in Malta 2016 81
-40%
-30%
-20%
-10%
0%
10%
2008 2009 2010 2011 2012 2013 2014 2015
EU Malta EU Malta
-40%
-30%
-20%
-10%
0%
10%
20%
30%
40%
2008 2009 2010 2011 2012 2013 2014 2015
EU Malta
2.15 Building Permits - number of residential buildings (annual % change)
2.16 Number of residential buildings (annual % change) 2008 2009 2010 2011 2012 2013 2014 2015
European Union -35.5 -28.8 -2.8 -0.9 -13.4 -6.6 4.4 7.2
Malta -39.7 -22.5 -16.1 -11 -22.5 -11.7 8.6 34.4

82 Economy
2.18 Useful floor area in square metres (annual % change) 2008 2009 2010 2011 2012 2013 2014 2015
European Union -33.8 -28.0 -3.7 -0.3 -12.4 -6.8 0.3 6.6
Malta -40.2 -21.8 -13.1 -5.9 -9.4 -1.1 10.1 19.2
2.18 Building Permits - useful floor area in square metres (annual % change)
-50%
-40%
-30%
-20%
-10%
0%
10%
20%
30%
2008 2009 2010 2011 2012 2013 2014 2015
EU Malta

Trends in Malta 2016 83
2.20 Total production from quarries, tonnesYear Softstone Hardstone Total
2010 112,246 1,753,748 1,865,994
2011 92,680 1,735,216 1,827,896
2012 94,515 1,685,621 1,780,136
2013 99,363 1,464,232 1,563,595
2014 84,409 1,386,482 1,470,891
2.19 Number of operating quarriesYear Softstone Hardstone Total
2010 28 24 52
2011 27 24 51
2012 28 25 53
2013 25 25 50
2014 23 24 47
84 Economy
2.21 Minerals production from quarries
0
10
20
30
40
50
60
0
200,000
400,000
600,000
800,000
1,000,000
1,200,000
1,400,000
1,600,000
1,800,000
2,000,000
2010 2011 2012 2013 2014
num
ber o
f qua
rrie
s
t onn
es
Softstone Hardstone Number of operating quarries
tonn
es
number of quarries

Trends in Malta 2016 85
TourismThe number of inbound tourists is increasing while the average length of stay is decreasing. Non-EU nationals, in 2015, spent more than EU nationals on average. Between 2010 and 2015, nights spent abroad by the Maltese went up by 38.8 per cent and the preferred destinations were Italy and the UK. Every Maltese spends an average €991 when abroad.
Between 2001 and 2015, Malta recorded an increase of 55.6 per cent in inbound tourists. In 2015, Malta recorded the second lowest average length of stay (7.9) in 15 years. More than half of inbound tourists stayed in St. Julians and in St. Paul’s Bay (including Bugibba and Qawra) during 2015, whereas total expenditure per capita stood at €919. The highest expenditure per capita was recorded by inbound tourists from outside the EU (€1,230) and the lowest expenditure per capita was recorded by inbound tourists from Italy (€632).
The majority of inbound tourists (58.6 per cent) stayed in hotels, followed by those who stayed in holiday furnished premises (16.0 per cent) and with friends or relatives (12.6 per cent). During 2015, inbound tourists preferred to use national airlines, even though low cost airlines are making inroads.
Between 2010 and 2015, outbound tourist trips and nights spent by Maltese residents recorded an increase of 44.8 per cent and 38.8 per cent respectively. In 2015, the most popular destinations were Italy, the UK, Germany, France and Spain. In 2015, the average length of stay stood at 7.7, down by 0.4 of a night when compared to 2014. National airlines were the preferred mode of transportation in 2015, however low-cost airlines accounted for a higher share when compared to the previous two years. In 2015, total expenditure per capita by resident tourists stood at €991. The lowest and highest expenditures per capita were recorded by Maltese residents visiting Italy (€719) and Switzerland (€1,203) respectively.

86 Economy
2.22 Inbound tourists, nights spent and total expenditure (€000s) by year
Year Inbound Tourists Total nights Total expenditure
2001 1,146,262 10,533,025 960,402
2002 1,098,446 10,483,326 984,301
2003 1,089,548 11,114,287 1,001,626
2004 1,156,440 11,170,794 1,028,870
2005 1,170,816 11,085,382 1,009,578
2006 1,124,232 10,661,386 999,279
2007 1,243,506 11,016,992 1,061,944
2008 1,290,856 10,962,463 1,069,436
2009 1,182,490 9,949,378 924,927
2010 1,338,841 11,147,898 1,131,987
2011 1,415,019 9,984,080 1,221,327
2012 1,443,414 11,859,521 1,326,474
2013 1,582,153 12,890,268 1,440,379
2014 1,689,809 13,522,112 1,528,765
2015 1,783,366 14,151,599 1,639,067

Trends in Malta 2016 87
2.23 Preferred mode of transportation by inbound tourists
2.24 Localities in which inbound tourists resided
0%
10%
20%
30%
40%
50%
60%
70%
80%
90%
100%
2013 2014 2015
National Airlines
Low Cost Airlines
Sea Operator
24%
22%
15%
14%
3%
3%
3%
15% St. Julians
St. Pauls Bay/Bugibba/Qawra
Sliema
Mellieha
Gzira
Floriana
Valletta
Other

88 Economy
2.25 Expenditure per capita by inbound tourists: 2015
0
200
400
600
800
1,000
1,200
1,400
Italy
Cro
atia
Slov
enia
Pola
nd
Bul
garia
Hun
gary
Gre
ece
Lith
uani
a
Rom
ania
Latv
ia
Swed
en
Spai
n
EU 2
8
Cyp
rus
Net
herla
nds
Fran
ce
Slov
akia
Irela
nd
UK
Aus
tria
Ger
man
y
Den
mar
k
Bel
gium
Port
ugal
Esto
nia
Luxe
mbo
urg
Cze
ch re
publ
ic
Finl
and
Non
-EU
Expenditure per capita Average expenditure per capita ( 919)

Trends in Malta 2016 89
2.27 Outbound tourists, nights spent and total expenditure
Year Outbound Tourists Total nights Total expenditure (€000s)
2010 294,323 2,349,282 281,425
2011 308,483 2,314,141 297,036
2012 331,096 2,547,301 338,394
2013 363,463 2,869,647 369,964
2014 390,701 3,181,351 387,689
2015 426,244 3,260,926 422,247
2.26 Percentage share of nights by type of accommodation: 2015
59%
16%
13%
4% 4%
3% 3%
Hotel
Holiday furnished premises
Staying with Friends or Relatives
Other rented accommodation
Other collective accommodation
Own Private Residence
Other Private Accommodation

90 Economy
2.28 Preferred mode of transportation by Maltese
€422 millionOutbound tourists, total expenditure 2015
0%
10%
20%
30%
40%
50%
60%
70%
80%
90%
100%
2013 2014 2015
National Airlines
Low Cost Airlines
Sea Operator

Trends in Malta 2016 91
2.29 Expenditure per capita by outbound tourists: 2015
0
200
400
600
800
1,000
1,200
1,400
Italy
Hun
gary
Pola
nd
Bel
gium
Spai
n an
d C
anar
y Is
land
s
Fran
ce
UK
Bul
garia
Irela
nd
Gre
ece
Net
herla
nds
Aus
tria
Ger
man
y
Turk
ey
Switz
erla
nd
Expenditure per capita Average expenditure per capita ( 991)

92 Economy
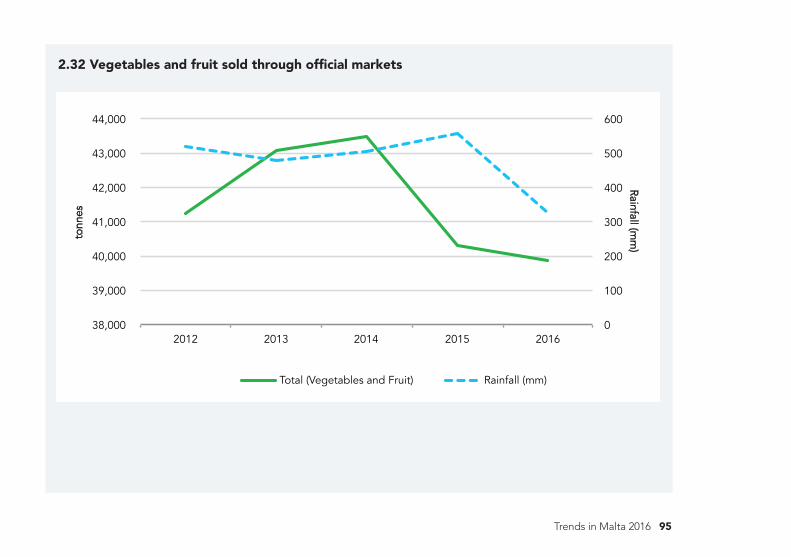
AgricultureDespite the lower rainfall recorded during 2016, vegetables sold through official markets increased.
The low rainfall recorded last year brought about a marginal decrease in tonnes of vegetables and fruit sold through official markets. However a closer look at the two agricultural categories separately, reveals that for fruit the relationship between rainfall and the amount sold through official markets appears to be positive, implying that lower rainfall adversely affects the production of fruit. On the other hand, the amount of vegetables sold through official markets went up despite the lower rainfall levels recorded.

Trends in Malta 2016 93
0
100
200
300
400
500
600
0
400
800
1,200
1,600
2,000
2,400
2,800
3,200
2012 2013 2014 2015 2016
Rainfall (mm
)
tonn
es
Fruit Rainfall (mm)
2.30 Fruit sold through official markets

94 Economy
2.31 Vegetables sold through official markets
0
100
200
300
400
500
600
36,000
37,000
38,000
39,000
40,000
41,000
42,000
2012 2013 2014 2015 2016
Rainfall (mm
)
tonn
es
Vegetables Rainfall (mm)
Trends in Malta 2016 95
2.32 Vegetables and fruit sold through official markets
0
100
200
300
400
500
600
38,000
39,000
40,000
41,000
42,000
43,000
44,000
2012 2013 2014 2015 2016
Rainfall (mm
)
tonn
es
Total (Vegetables and Fruit) Rainfall (mm)

LABOUR MARKET

Trends in Malta 2016 97
Labour market
Between 2005 and 2015, the employment rate went up by more than 10 percentage points mainly due to a higher proportion of females joining the labour market.
Between 2005 and 2015 the employment rate for those aged between 20 and 64 years increased by 10.4 percentage points. Whereas the employment rate of males remained quite constant with an absolute increase of 1.7 per cent over 11 years, females’ share in employment for the same age group increased by 18.8 percentage points.
More mothers are staying in or joining the labour force. In 11 years the number of mothers in employment almost doubled, reaching a total of 26,612. However, males still made up 60.9 per cent of the employed population in 2015.
Males made up 60.9 per cent of the employed population in
2015.
60.9%39.1%

98 Labour Market
3.1 Employment rate (20 to 64 years)
50%
55%
60%
65%
70%
2005 2006 2007 2008 2009 2010 2011 2012 2013 2014 2015

Trends in Malta 2016 99
3.2 Employed by gender: 2005
3.3 Employed by gender: 2015
Males 102,574
Mothers 14,185
Non-mothers 31,532
Females 45,717
Males 110,918
Mothers 26,612
Non-mothers 44,656
Females 71,268

100 Labour Market
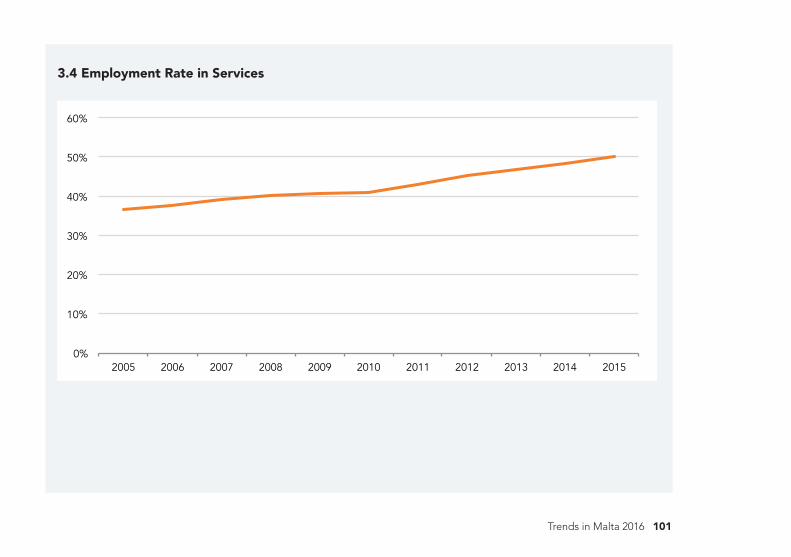
Profile of an employed personIn 2015, male workers typically earned €1,300 per annum more than female workers. Between 2005 and 2015, employment in the manufacturing sector went down while in the services sector it went up.
In 2005, a typical employed male was in his late twenties, early thirties, earning €12,600 per annum and working as a craft or trades worker. In 2015, the typical male worker was is still in his late twenties, early thirties but had a professional job and earned €17,000. Among females, in 2005 a typical worker was in her late twenties, early thirties, with a secondary level of education,
earning €11,900 per annum and performed clerical work. Eleven years later, females had a tertiary education level, earned €15,700 and were engaged in a professional occupation.
When looking at the employment rates for different economic activities, one can observe that though still a major industry, manufacturing is no longer the leading employer within the labour market. Its place is being taken up by the service industry which over the past eleven years has picked up momentum in terms of the number of persons employed. Over the period 2005-2015, the employment rate in the services sector increased by 13.8 percentage points, mainly due to an increase in the female employed population. On the other hand, manufacturing dropped by 2.3 percentage points over the same period.
The employment rate in the services sector increased by 13.8 percentage points, mainly due to an increase in the female employed population
Trends in Malta 2016 101
3.4 Employment Rate in Services
0%
10%
20%
30%
40%
50%
60%
2005 2006 2007 2008 2009 2010 2011 2012 2013 2014 2015

102 Economy
3.5 Employment Rate in Manufacturing
0%
1%
2%
3%
4%
5%
6%
7%
8%
9%
10%
11%
2005 2006 2007 2008 2009 2010 2011 2012 2013 2014 2015

Trends in Malta 2016 103
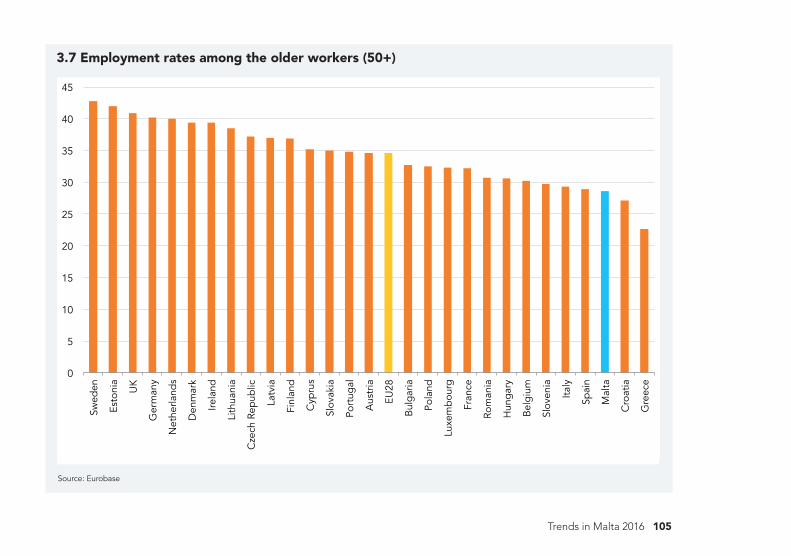
Youth and elderly employmentIn 2015, Malta registered the fifth highest employment rate among the young and the third lowest employment rate among the old.
Malta features among the countries with the highest youth employment rates. In fact, the national rate is the fifth highest registered at EU level and is 12.5 percentage points higher than the EU28 average. The Netherlands ranks first with a rate of 60.8 per cent while at just 13.0 per cent, Greece is the country with the lowest youth employment rate. On the other side of the spectrum, Malta is among the countries with the lowest employment rates for older workers (50+). Only Croatia and Greece have lower rates at
Malta has one of the highest youth employment rates in the EU
EU level. Topping the list of countries with the highest employment rates for older workers are Sweden and Estonia at 42.8 per cent and 42.0 per cent respectively.

104 Labour Market
3.6 Employment rates among the young (15-24)
0
10
20
30
40
50
60
70
Net
herla
nds
Den
mar
k
Aus
tria
UK
Mal
ta
Ger
man
y
Swed
en
Finl
and
Esto
nia
Latv
ia
EU28
Slov
enia
Luxe
mbo
urg
Irela
nd
Cze
ch R
epub
lic
Lith
uani
a
Fran
ce
Pola
nd
Hun
gary
Cyp
rus
Rom
ania
Bel
gium
Slov
akia
Port
ugal
Bul
garia
Cro
atia
Spai
n
Italy
Gre
ece
Source: Eurobase
Trends in Malta 2016 105
3.7 Employment rates among the older workers (50+)
0
5
10
15
20
25
30
35
40
45 Sw
eden
Esto
nia
UK
Ger
man
y
Net
herla
nds
Den
mar
k
Irela
nd
Lith
uani
a
Cze
ch R
epub
lic
Latv
ia
Finl
and
Cyp
rus
Slov
akia
Port
ugal
Aus
tria
EU28
Bul
garia
Pola
nd
Luxe
mbo
urg
Fran
ce
Rom
ania
Hun
gary
Bel
gium
Slov
enia
Italy
Spai
n
Mal
ta
Cro
atia
Gre
ece
Source: Eurobase
106 Labour Market
Labour costsIn 2015, 6.9 per cent of salaries and wages earned by employees were paid for days which were not actually worked.
Labour costs at a national level almost doubled over the past 16 years. In 2000, the average cost per hour was of €7.07 and by 2015 this surged to €12.90. In 2005, more expensive rates were paid by employers within the financial and insurance activities whereas in 2015, the highest labour costs were in the education services sector.
The largest share of labour costs (93.1 per cent according to the Labour Cost Survey conducted in 2012) was taken up by wages and salaries. It is estimated that 6.9 per cent of the salaries earned by employees are paid for days which are not actually worked. This includes days when employees are on paid vacation leave and paid special leave. The cost of sick leave, health insurance and
severance payments are also part of labour costs and in 2012 these amounted to 1.8 per cent of total labour costs. Vocational training took up 0.5 per cent of labour costs whereas other expenses such as recruitment costs, provision of uniforms and health and safety equipment, paid by employers for their workers, made up 0.4 per cent of total labour costs.
€12.90The average cost per hour in 2015 was €12.90, an increase of €5.83
since the year 2000.

