renato loiero – fortunato lambiase · renato loiero – fortunato lambiase 11th meeting of the...
TRANSCRIPT
Renato Loiero – Fortunato Lambiase
11th meeting of the Network of Public Finance Economistsin Public Administration
Brussels, 28 March 2017
#EU60
Outline
1. Barriers hampering investments
2. Cost Benefit Analysis, investments anddecision-making processdecision-making process
3. The Jessica programmes: the Italianexperience
2

I PartBarriers hampering investmentsBarriers hampering investments

Widely acknowledged facts and results
• The effect of public investment on growth is sizeable
• Strong decline in public investment following the crisis
• The level of investment is below pre-crisis level for many EUcountriescountries
• Subnational governments are key actors for public investment
• It's crucial to remove barriers hampering investments
4
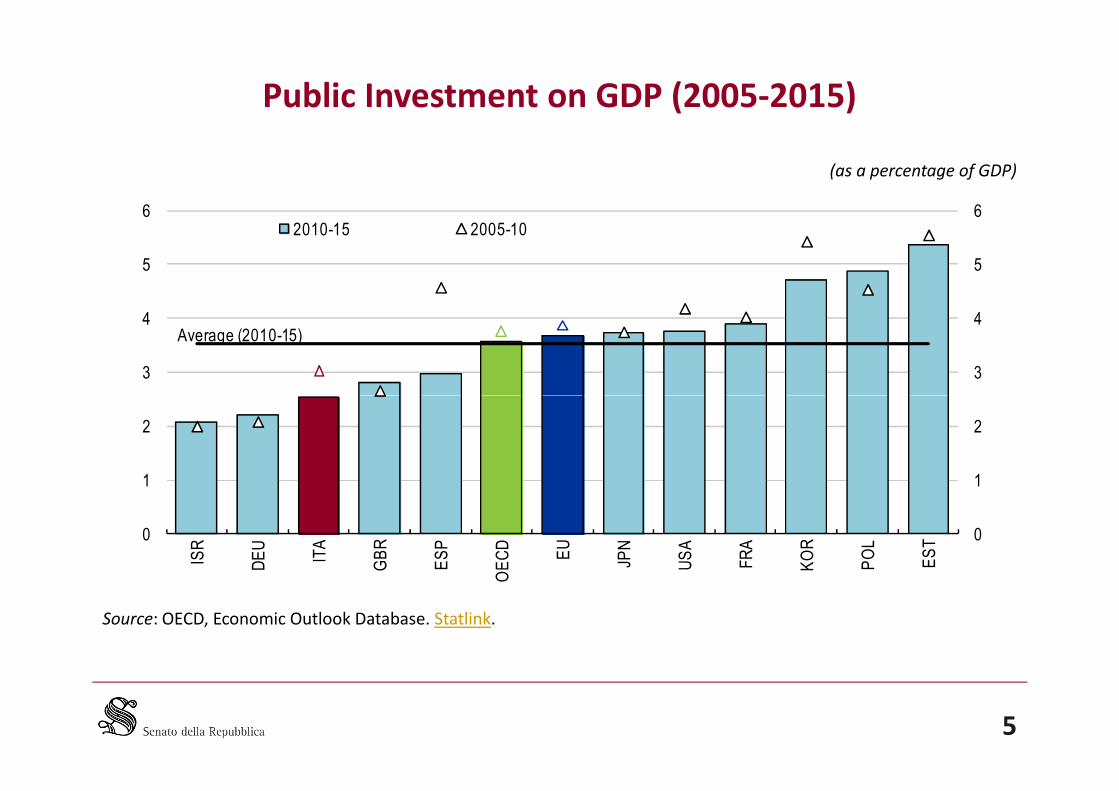
Public Investment on GDP (2005-2015)
(as a percentage of GDP)
3
4
5
6
3
4
5
62010-15 2005-10
Average (2010-15)
Source: OECD, Economic Outlook Database. Statlink.
5
0
1
2
0
1
2
ISR
DE
U
ITA
GB
R
ES
P
OE
CD
EU
JPN
US
A
FRA
KO
R
PO
L
ES
T
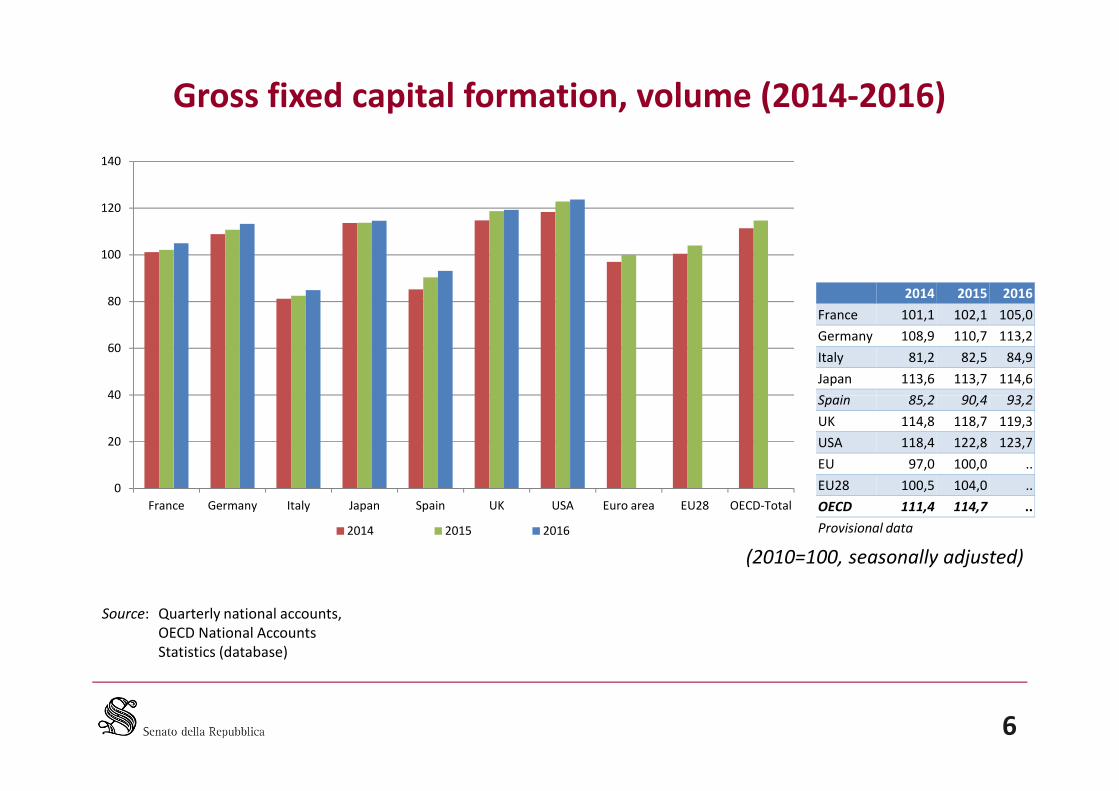
Gross fixed capital formation, volume (2014-2016)
40
60
80
100
120
140
2014 2015 2016
France 101,1 102,1 105,0
Germany 108,9 110,7 113,2
Italy 81,2 82,5 84,9
Japan 113,6 113,7 114,6
Spain 85,2 90,4 93,2
6
(2010=100, seasonally adjusted)
Source: Quarterly national accounts,OECD National AccountsStatistics (database)
0
20
40
France Germany Italy Japan Spain UK USA Euro area EU28 OECD-Total
2014 2015 2016
Spain 85,2 90,4 93,2
UK 114,8 118,7 119,3
USA 118,4 122,8 123,7
EU 97,0 100,0 ..
EU28 100,5 104,0 ..
OECD 111,4 114,7 ..
Provisional data

Investment and the productive capital stock
2,50
2,67
2,83
3,00
15
20
25
30% of GDP% of GDP
Private non-residential gross fixed capital formation (lhs)
Residential gross fixed capital formation (lhs)
Productive capital stock¹ (rhs)
1 Total economy less housing.
Source: OECD Analytical Database; and OECD, National accounts database. Statlink.
7
2,00
2,17
2,33
0
5
10
2000 01 02 03 04 5 6 7 8 9 10 11 12 13 14 15 16
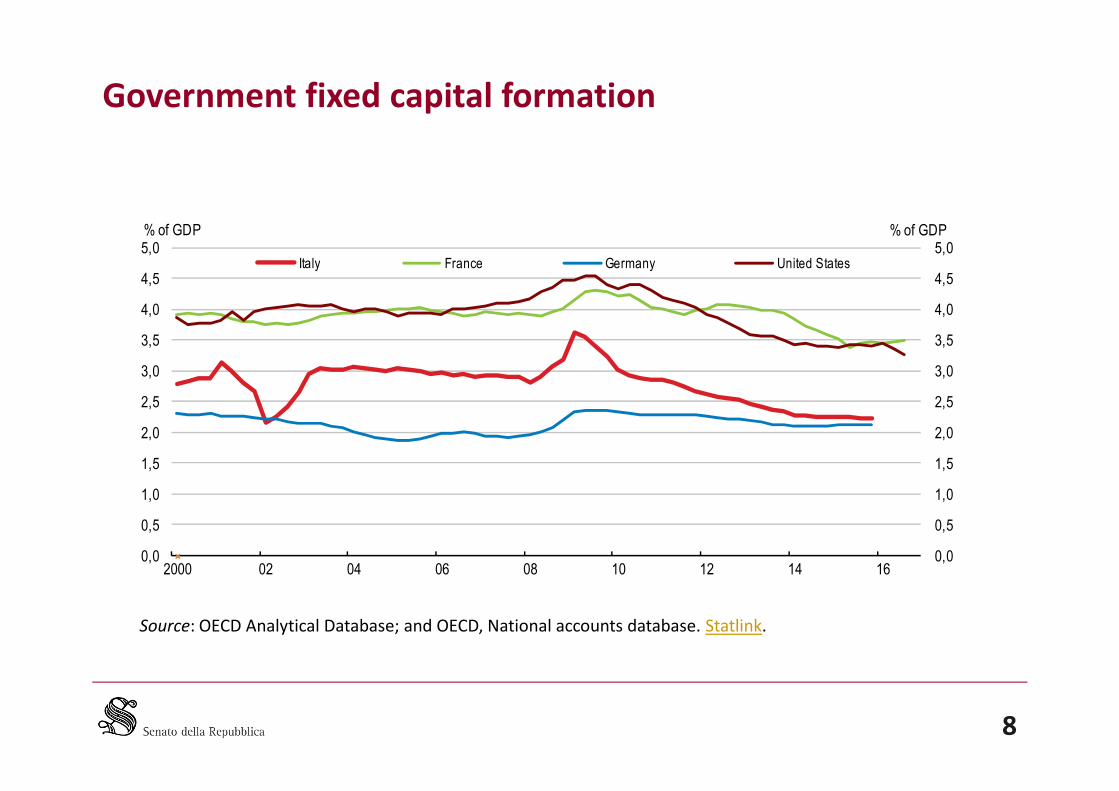
Government fixed capital formation
2,5
3,0
3,5
4,0
4,5
5,0
2,5
3,0
3,5
4,0
4,5
5,0% of GDP% of GDP
Italy France Germany United States
Source: OECD Analytical Database; and OECD, National accounts database. Statlink.
8
0,0
0,5
1,0
1,5
2,0
2,5
0,0
0,5
1,0
1,5
2,0
2,5
2000 02 04 06 08 10 12 14 16
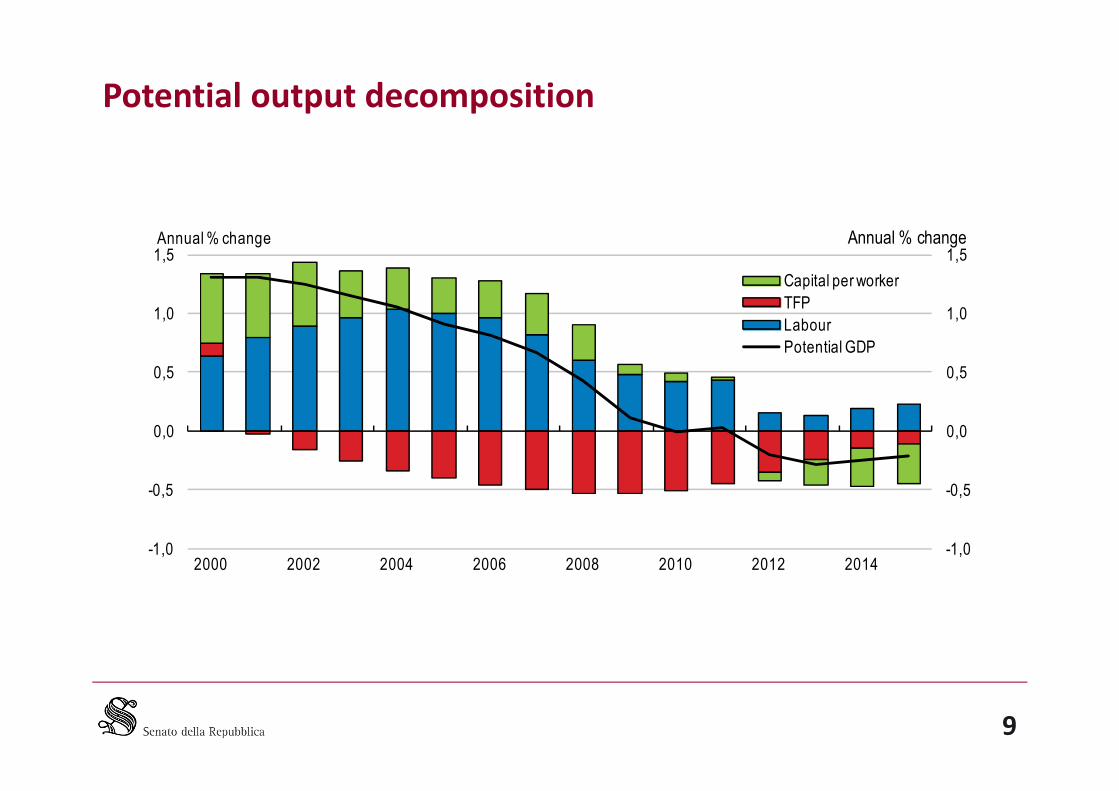
Potential output decomposition
0,5
1,0
1,5
0,5
1,0
1,5Annual % changeAnnual % change
Capital per worker
TFP
Labour
Potential GDP
9
-1,0
-0,5
0,0
-1,0
-0,5
0,0
2000 2002 2004 2006 2008 2010 2012 2014

Decomposition of labour productivity growth
3
4
3
4%%
TFP
Capital deepening
Labour productivity
10
-1
0
1
2
-1
0
1
2
ITA
DE
U
FR
A
ES
P
JPN
GB
R
US
A
KO
R
PO
L
LV
A

Real investment
90
95
100
105
90
95
100
105ITA OECD EUR
Index 2007 = 100 Index 2007 = 100
11
60
65
70
75
80
85
60
65
70
75
80
85
2000 2001 2002 2003 2004 2005 2006 2007 2008 2009 2010 2011 2012 2013 2014 2015
Barriers affect investments differently
• According to the:
– Nature of Investment
– Sector/market
– Subject
– Countries/business environment
12
How do barriers affect investments?
– cost of investing
– risks of investments
– level of competition
• Six categories of barriers
– Regulation– Regulation
– Legal and judicial system
– Market size and structure
– Public-sector promoter constraints
– Access to finance
– Human resources
13

Costs Risks Barriers to competition
RegulationRegulatory burdens and
administrative procedures;
regulatory fragmentation
Regulatory uncertainty
Barriers to market entry and
exit; incentives in regulated
sectors (e.g. utilities)
Legal and judicial
system
transaction and litigation
costs
Legislative uncertainty; weak
enforcement
Barriers to market entry and
exit
Market size and
structureMarket fragmentation Lack of standards
Implementation of
competition law and policy
Macroeconomic conditions (fiscal and monetary policies)
14
Public-sector
promoter
constraints
Infrastructure, public sector
efficiency and capacity
Weak planning and project
preparation capacity
Possible unintended
consequences of public
procurement procedures
Access to finance Cost of finance
Financial instability,
unavailability of instruments
to allocate risk
Limiting entry into new
product and geographical
markets
Human resources(labour market &
educational system)
Cost of qualified and skilled
resources
Education-job, skill and
qualification mismatches;
retaining trained workers
Obstacles to competition of
labour market restriction
International trade and capital movements
Integrated and adapted from EIB (2016) and World Bank (2005)

Solutions
National governments should:
• set priorities in I. strategies
• develop coordination platforms to foster joint I. by subnationalgovernments
• clarify competencies
Subnational governments should:Subnational governments should:
• improve medium-term planning, adopt multi-year horizon
• define credible enforcement mechanisms
• improve their capacities in handling public I.
15
Solutions
• Coping with regulatory uncertainty
• Access to finance
• Exploit Public Private Partnerships
16

Tangibles vs. intangibles investiments: crucial points
• Importance of intangibles I. for the knowledge-based economy
• Role of intellectual property rights law
• Access to finance for firms
• Well-designed framework policies
• Forward-looking education policies
• R&D activities
17

Financial support for private R&D investment
A.Direct public funding of business R&D (% of GDP) B. Indirect public support through R&D tax incentives3
0,1
0,2
0,1
0,2
2012-14¹ 2007-09²
Average (2012-14)
0,10
0,15
0,20
0,25
0,30
0,10
0,15
0,20
0,25
0,30
2014 2006
Average (2014)
1 Average of years 2012 and 2013 for France, Italy and the United States; 2014 for Latvia.
2 Average of years 2007 and 2009 for Poland; 2006 for Latvia.
3 The last available year is 2013 for France, Italy and the United States. Instead of 2006, data refer to 2007 for Italy, Korea and Sweden.
Source: Adapted Panel A: OECD, Science and Technology Indicators Database; Panel B: OECD, R&D Tax Incentives Database, www.oecd.org/sti/rd-tax-stats.htm,December 2016. Statlink.
18
00
LV
A
JPN
PO
L
ITA
DE
U
ES
P
OE
CD
EU
GB
R
FRA
KO
R
US
A
0,00
0,05
0,00
0,05
ES
T
DE
U
ITA
ES
P
US
A
OE
CD
EU
GB
R
JPN
KO
R
FRA
Average (2014)
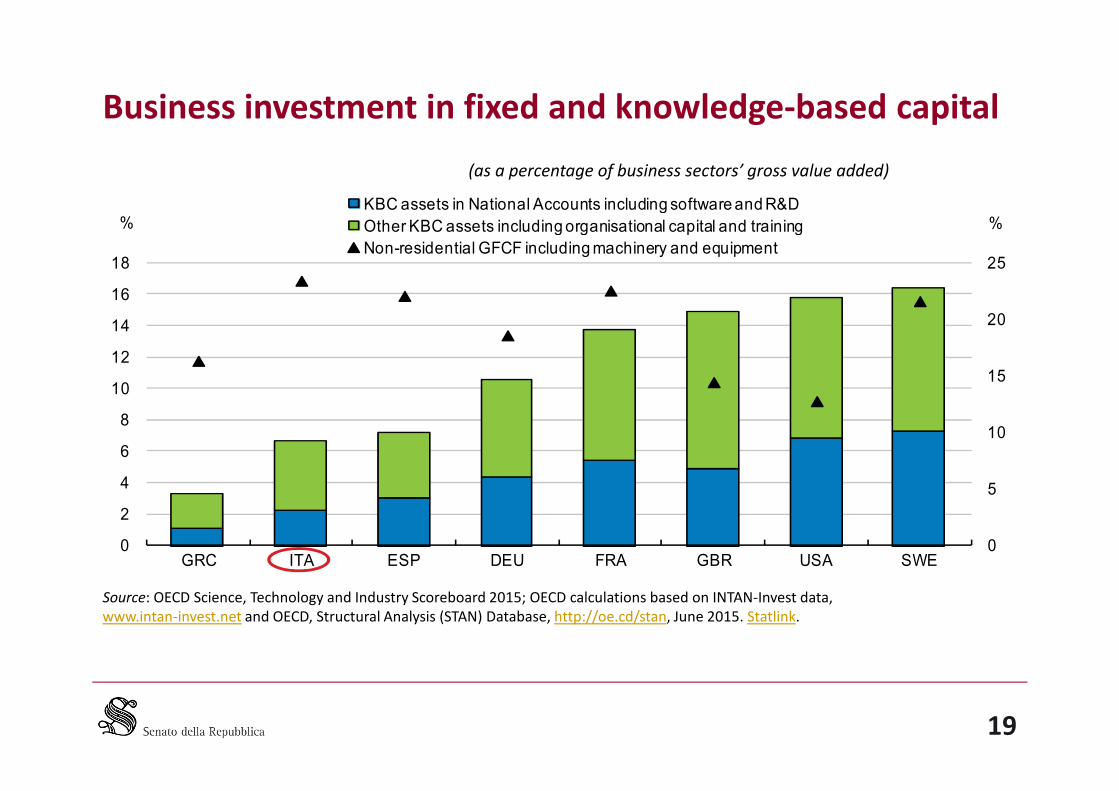
Business investment in fixed and knowledge-based capital
(as a percentage of business sectors’ gross value added)
15
20
25
10
12
14
16
18
%%KBC assets in National Accounts including software and R&D
Other KBC assets including organisational capital and training
Non-residential GFCF including machinery and equipment
Source: OECD Science, Technology and Industry Scoreboard 2015; OECD calculations based on INTAN-Invest data,www.intan-invest.net and OECD, Structural Analysis (STAN) Database, http://oe.cd/stan, June 2015. Statlink.
19
0
5
10
0
2
4
6
8
10
GRC ITA ESP DEU FRA GBR USA SWE
II PartCost Benefit Analysis, investments andCost Benefit Analysis, investments and
decision-making process
Reasons of the distance between decision-makers & CBA
1. Projects’ evaluation, in Italy, is mandatory (but weak enforcement)
2. CBA is a complex tool
3. Decision makers do not look only to economic efficiency
4. CBA may be, in practice, useless if opinion is already formed, or decisionis already taken (“pet projects”)
5. Decision makers do not share the theoretical foundation of CBA
21
“Putting into contact” decision makers and CBA
1. Employ CBA smartly, bring it closer to the decision maker
2. Adopt policy makers' point of view
3. Distributive analysis
4. The CBA in decision-making process4. The CBA in decision-making process
5. Improving "communication" of CBA
6. Building public acceptance
7. CBA must be carried out during the planning phase for comparingalternatives but also for a better understanding of objective and desiredoutcomes
22
Coping with arbitrariness
• Assessment tools are used, by their nature, to reduce the arbitrariness ofdecisions;
• Political decisions still have a component of arbitrariness that is related tothe personal responsibility of the decision maker
• Solutions:
– define a threshold of “unacceptability”
– consider all the priority projects
– allocation between intermediate projects
• The Guide to Cost-Benefit Analysis (obligatory for all major projectssubmitted to ESIF 2014-2020 LINK
23
III PartJessica programmes: the Italian experienceJessica programmes: the Italian experience

Financial instruments and Fund JESSICA
25

Pros and Cons (1)
Main benefits are:
• Leveraging
• Public resources invested on the most efficient projects
• Funded projects are financially sustainable
• Greater awareness• Greater awareness
• More effective processes of projects selection
• Availability of resources
• Capacity building (mixed)
26

Pros and Cons (2)
Weaknesses at regional level
• absence of a medium/long term strategic program
• focusing on new projects not in line with the timing of JESSICAfunds
• long lasting planning strategies that delay the inclusion of financialinstruments (like Jessica) within regional operational programmeinstruments (like Jessica) within regional operational programme
Weaknesses at municipal level
• difficulties in adopting an investment planning coherent with theplanning of financial instruments
• reimbursement of financial resources
27
Pros and Cons (3)
Critical issues:
• Timing of implementation
• Insufficient progress in the evaluative expertise
• Modest private participation
• PPP as purely substitute of the more
28
Pros and Cons (4)
• Institutional fragmentation
• Uncertainty on local budgets resources
• Insufficient analysis of project alternatives• Insufficient analysis of project alternatives
29
The way out: a Guide to the Feasibility Studies for the PPP
The Guide was made operational through the engineering of an executableapplication (Web application) useful to:
• evaluate ex ante the financial and economic feasibility of investments
• order on an economic merit criteria other potential projects or projectalternatives
• assess the financial and economic feasibility of projects consist of a set ofworksworks
• Link: http://sdf.irpet.it/login
30

Financial instruments’ success factors
• The financial instruments and their use within the 2014-2020 cycleare moving in the right direction.
• Critical success factors are:
– adopting multiannual investment strategy
– breaking down fragmentation
– supplying technical assistance to local administrations– supplying technical assistance to local administrations
– using evaluation tools
– reducing the time to market of investments
– engaging private investors
– exploiting PPP's potential
31
Conclusions
• Tackle weak strategic planning and project definition
• Periodically review needs and forecasts
• Promote the culture of evaluation
• Standardize processes and provide guidelines
• Improve project selection relying on objective and transparent criteria
• Support local administration in building capacities• Support local administration in building capacities
• Exploit synergies between tangibles and intangibles, as well as within thesame asset types
32

References
• De Jong J.; Ferdinandusse M.; Funda J.; Vetlov I. (2017), Theeffect of public investment in Europe: a model-basedassessment, European Central Bank, Working Paper Seriesno. 2021
• European Commission (2015), Member States InvestmentChallenges, Challenges to Member States' InvestmentEnvironments ITALY, SWD(2015)400 final/2
• European Commission (2016), Report on Public Finances inEMU, European Economy Institutional Paper no. 45
• European Commission (2017), II. Unlocking investment inintangible assets in Europe, European Economy InstitutionalPaper no. 49, Quaterly Report on the Euro Area, Volume
• International Monetary Fund (2017), G-20 FinanceMinisters and Central Bank Governors' Meetings, March 17-18, 2017, Baden-Baden, Germany.
• OECD (2017), Going for Growth, Chapter 4: Structural policyindicators, Economic Policy Reforms 2017
• OECD (2017), OECD Economic Surveys: Italy 2017, OECDPublishing, Paris.
• Pucher, J.; Martinos H.; Schausberger W. (2016), Obstaclesto investments at local and regional level, EU Committee ofthe Regions
• Scannapieco D. (2017), Il gruppo BEI in Italia nel 2016
• Special Task Force (Member States, Commission, EIB) onPaper no. 49, Quaterly Report on the Euro Area, Volume16, no. 1 (2017)
• European Investment Bank (2016), Breaking DownInvestment Barriers at Ground Level. Case studies and otherevidence related to investment barriers under the thirdpillar of the Investment Plan for Europe.
• Gerali A.; Notarpietro A.; Pisani M. (2015), Structuralreforms and zero lower bound in a monetary union. Bancad'Italia Working Paper no. 1002.
• Special Task Force (Member States, Commission, EIB) oninvestment in the EU, Final Task Force Report
• Tertre M. G. (2016), The removal of obstacles to investmentas part of the investment plan for Europe. EuropeanCommission, 4 October 2016 - Bruegel
• World Bank (2005), A Better Investment Climate forEveryone
33

#EU60