renal impairment: at the heart of diabetes care · framework for classifying biomarkers of incident...
TRANSCRIPT

Renal impairment: at the heart of diabetes care
Chairmen: M. Marre (France) S. Liatis (Greece)
Satellite symposium

The burden of renal complications in type 2 diabetes
A. Avogaro (Italy)

Satellite Symposium Servier
The burden of renal complications in Type 2 Diabetes
Angelo Avogaro
DIMED@UNIPD. Italy


Cell biology of diabetic nephropathy: Roles of endothelial cells, tubulointerstitial cells and podocytes
Journal of Diabetes Investigation Volume 6, Issue 1, pages 3-15, 11 JUL 2014 DOI: 10.1111/jdi.12255 http://onlinelibrary.wiley.com/doi/10.1111/jdi.12255/full#jdi12255-fig-0001
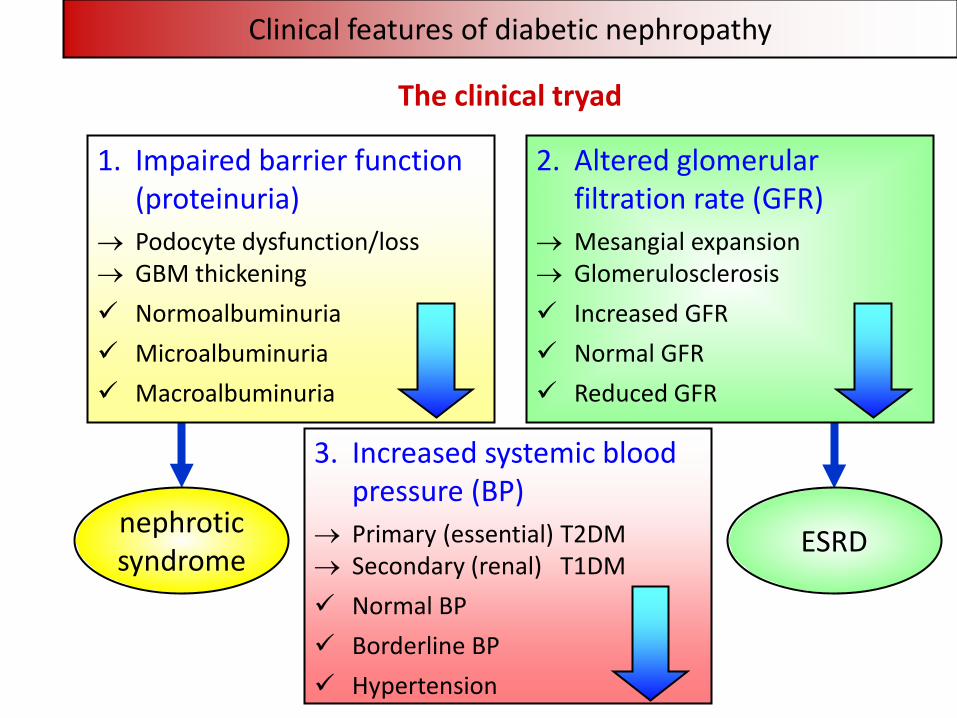
Clinical features of diabetic nephropathy
nephrotic syndrome ESRD
1. Impaired barrier function (proteinuria)
→ Podocyte dysfunction/loss → GBM thickening Normoalbuminuria Microalbuminuria Macroalbuminuria
3. Increased systemic blood pressure (BP)
→ Primary (essential) T2DM → Secondary (renal) T1DM Normal BP Borderline BP Hypertension
2. Altered glomerular filtration rate (GFR)
→ Mesangial expansion → Glomerulosclerosis Increased GFR Normal GFR Reduced GFR
The clinical tryad

CKD classification
<15
15-29
30-45
45-59
60-74
75-89
90-104
>105
Kidney failure G5
Severe G4
Moderate-severe G3b
Mild-moderate G3a
Mild
G2
Optimal
High G1
>2000 300-1999 30-299 10-29 <10
Nephrotic Very high High High-normal Optimal
A3 (macro) A2 (micro) A1 (normo)
Albuminuria (mg/g)
eGFR
, ml/
min
/1.7
3 m
2
Levey AS et al, Kidney Int 2011; 80:17–28
Kidney Disease: Improving Global Outcomes (KDIGO)

Progression to ESRD versus death from CVD
Annual transition rates through the stages of nephropathy and to death from any cause.
normoalbuminuria
microalbuminuria
macroalbuminuria
elevated plasma creatinine renal replacement therapy
D E A T H
1.4% (1.3-1.5%)
3.0% (2.6-3.4%)
3.6% (4.6-5.7%)
19.2% (14.0-24.4%)
2.0% (1.9-2.2%)
2.8% (2.5-3.2%)
2.3% (1.5-3.0%)
0.1% (0.1-0.2%)
0.3% (0.1-0.4%)
0.1% (0.0-0.1%)
The United Kingdom Prospective Diabetes Study (UKPDS) 64
Adler AI et al, Kidney Int 2003; 63:225–232

Albuminuria versus reduced eGFR in diabetic subjects
Ninomiya T et al, J Am Soc Nephrol 2009; 20:1813–1821
10,640 T2DM patients - median follow-up of 4.3 years
Adverse CVD and renal events by baseline eGFR and albuminuria
The Action in Diabetes and Vascular disease: preterAx and diamicroN-MR Controlled Evaluation (ADVANCE) Study

0
10
20
30
40
50
Maj
or a
cute
CVD
eve
nts (
%)
stages 3-5 CKD nonalbuminuric
n. 1,673
528 (31.6%)
stages 3-5 CKD albuminuric
n. 1,286
576 (44.8%)
No CKD
n. 9,865
stages 1-2 CKD
n. 2,949
794 (26.9%)
1,756 (17.8%)
Albuminuria versus reduced eGFR and CVD events
Penno G et al, J Hypertens 2011; 29:1802-1809
The Renal Insufficiency And Cardiovascular Events (RIACE) Study

Solini A et al, Diabetes Care 2012; 35:143-149
The Renal Insufficiency And Cardiovascular Events (RIACE) Study
Albuminuria versus reduced eGFR and CVD events by vascular bed
CKD stages 3-5 nonalbuminuric
CKD stages 3-5 albuminuric CKD stages 1-2
OR 95% CI OR 95% CI OR 95% CI
Total CVD events 1.52 1.34-1.73 1.90 1.66-2.19 1.20 1.08-1.33
Coronary events 1.51 1.30-1.76 1.27 1.08-1.49 0.90 0.79-1.02
Cerebrovascular events 1.22 1.01-1.48 1.69 1.40-2.00 1.41 1.20-1.65
Peripheral events 1.40 1.11-1.76 1.88 1.52-2.34 1.51 1.25-1.82
Logistic regression analysis with stepwise variable selection
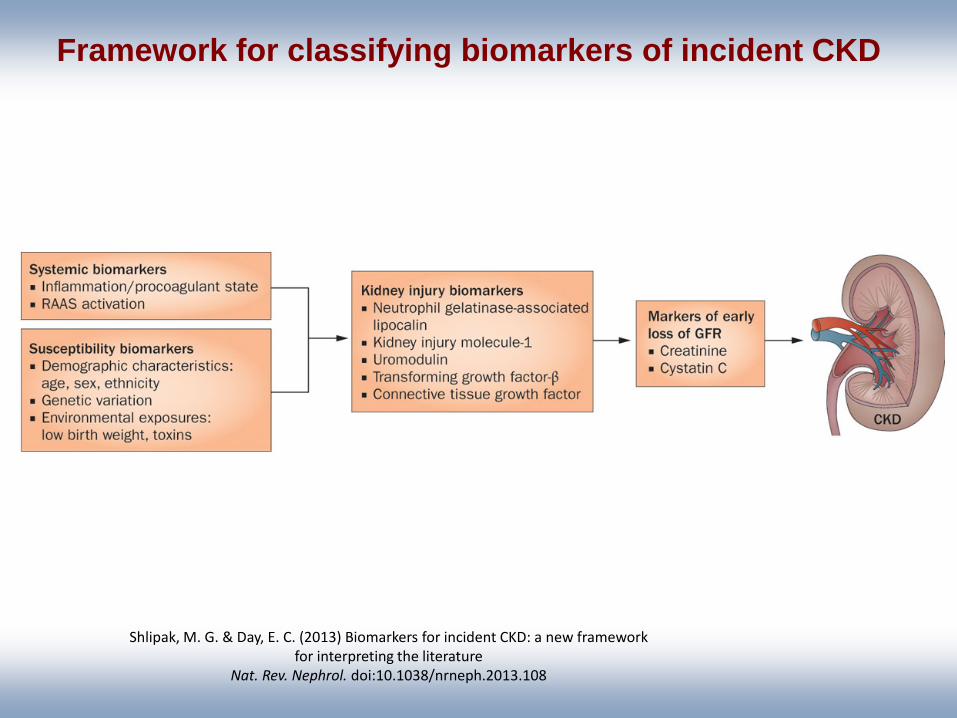
Framework for classifying biomarkers of incident CKD
Shlipak, M. G. & Day, E. C. (2013) Biomarkers for incident CKD: a new framework for interpreting the literature
Nat. Rev. Nephrol. doi:10.1038/nrneph.2013.108

Biomarkers of CKD and microalbuminuria in the Framingham Heart Study
Shlipak, M. G. & Day, E. C. (2013) Biomarkers for incident CKD: a new framework for interpreting the literature
Nat. Rev. Nephrol. doi:10.1038/nrneph.2013.108

From: Evaluation and Management of Chronic Kidney Disease: Synopsis of the Kidney Disease: Improving Global Outcomes 2012 Clinical Practice Guideline
Ann Intern Med. 2013;158(11):825-830. doi:10.7326/0003-4819-158-11-201306040-00007

Fadini et al. Cardiovasc Res 2010
The balance between damage and repair

Endothelial progenitor cells
EPCs represent an integrated component of
the vascular system involved in vascular repair

Choi et al ATVB 2004
Rookmaker et al, Am J Pathol 2003
GLOMERULAR REPAIR BY BM CELLS
Endothelial Mesangial Monocytes
02468
101214161820
CTRL CRF DM non-DM
EPC
s / m
m2
*
Endothelial progenitor cells repair the glomerulus
Makino et al, Diabetic Medicine 2009
Low CD34+ cell count
High CD34+ cell count

Circulating endothelial and CD34+ progenitors in diabetes
Type 2 diabetes
Fadini et al. JACC 2005
Pre-diabetes
Fadini et al. Diabetologia 2007
EPCs CPCs
Type 1 diabetes
Hörtenhuber et al. DCare 2013

Progenitor cell levels predict microvascular outcomes N=187 type 2 diabetic patients, followed-up for 3.9 years
Fadini et al. JCEM 2015
+
CD34+
CD133
+
CD133
+
CD34
+
KDR+
CD34
+
KDR+
CD133
+
KDR+
CD133
+
CD34
0
100
200
300
400
500 NoYes
Cel
l cou
nt /
106
+
CD34+
CD133
+
CD133
+
CD34
+
KDR+
CD34
+
KDR+
CD133
+
KDR+
CD133
+
CD34
0.0
1.0
2.0
3.0
4.0
5.0
Low (below median)High (above median)
Ons
et /
prog
ress
ion
(% p
er y
r)
UAER
**
**
** ** **
****
+
CD34+
CD133
+
CD133
+
CD34
+
KDR+
CD34
+
KDR+
CD133
+
KDR+
CD133
+
CD34
0.0
1.0
2.0
3.0
4.0
5.0O
nset
/ pr
ogre
ssio
n (%
per
yr)
**
**
CKD
****
+
CD34+
CD133
+
CD133
+
CD34
+
KDR+
CD34
+
KDR+
CD133
+
KDR+
CD133
+
CD34
0
100
200
300
400
500
Cel
l cou
nt /
106


Mean HbA1c at the final visit
7.3%
6.5%
Treatments in intensive control group at the end
of follow-up
Gliclazide MR 91%
Metformin 74%
Insulin 40%
TZD 17%
Glucose control in ADVANCE
Δ 0.67% (95% CI 0.64 - 0.70); p<0.001
Standard Intensive
Mea
n H
bA1c
(%)
6.0
6.5
7.0
7.5
8.0
8.5
9.0
Follow-up (Months)
0 6 12 18 24 30 36 42 48 54 60 66
Patel A et al., N Engl J Med 2008; 358(24): 2560-72

Major microvascular events (glucose arm)
Microvascular 526 605 14% (3 to 23)
New or worsening nephropathy 230 292 21% (7 to 34)
New or worsening retinopathy 332 349 5% (-10 to 18)
Number of patients with event Intensive Standard (n=5,571) (n=5,569)
Relative risk reduction (95% CI)
Favors Intensive
Favors Standard
Hazard ratio 0.5 1.0 2.0
†P=0.01
‡P=0.006
†
‡
Patel A et al., N Engl J Med 2008; 358(24): 2560-72

Multifactorial Intervention and CVD in Patients with Type 2 diabetes. The Steno-2 Study.
Gaede P et al., N Engl J Med 348: 383-393, 2003
160 people with DMT2 and microalbuminuria
Mean follow-up: 7.8 years

Effect of a Multifactorial Intervention on CV events/mortality in Type 2 Diabetes Development or Progression of Diabetic Nephropathy
Gaede P et al., N Engl J Med 348: 383-393, 2003 Gaede P et al., N Engl J Med 358: 580-591, 2008
0.39 (0.17-0.87) p=0.003
31
16
0.44 (0.25-0.77) p=0.004
37
20
STENO-2 Study
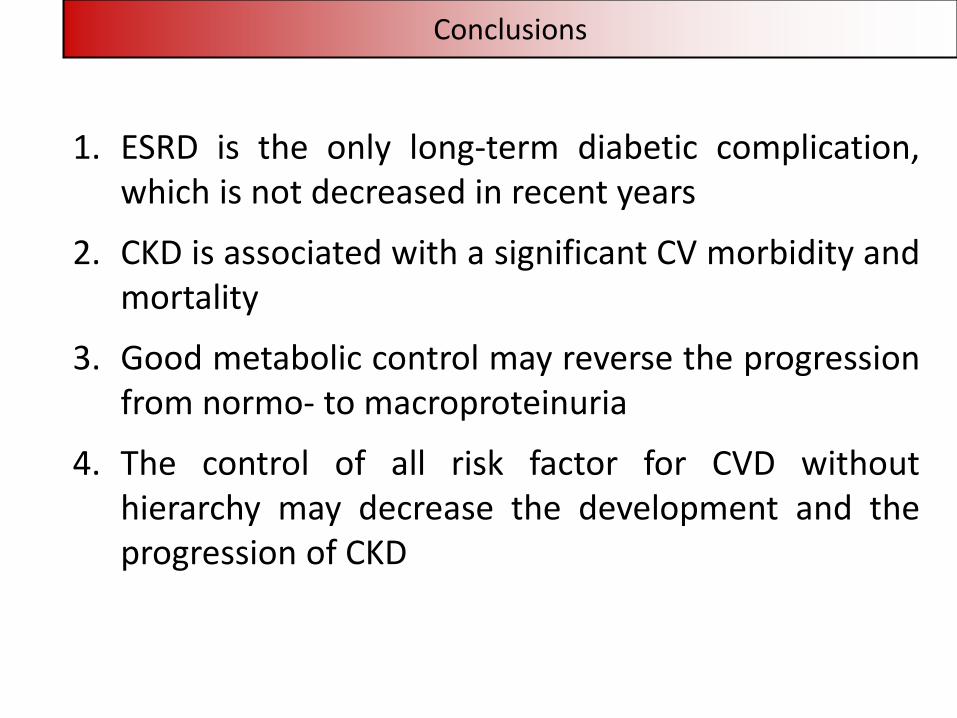
Conclusions
1. ESRD is the only long-term diabetic complication, which is not decreased in recent years
2. CKD is associated with a significant CV morbidity and mortality
3. Good metabolic control may reverse the progression from normo- to macroproteinuria
4. The control of all risk factor for CVD without hierarchy may decrease the development and the progression of CKD