removal efficiencies, uptake mechanisms and competitive
TRANSCRIPT

Portland State University Portland State University
PDXScholar PDXScholar
Dissertations and Theses Dissertations and Theses
Summer 9-20-2018
Removal Efficiencies, Uptake Mechanisms and Removal Efficiencies, Uptake Mechanisms and
Competitive Effects of Copper and Zinc in Various Competitive Effects of Copper and Zinc in Various
Stormwater Filter Media Stormwater Filter Media
Emily Heleva-Ponaski Portland State University
Follow this and additional works at: https://pdxscholar.library.pdx.edu/open_access_etds
Part of the Environmental Engineering Commons, and the Water Resource Management Commons
Let us know how access to this document benefits you.
Recommended Citation Recommended Citation Heleva-Ponaski, Emily, "Removal Efficiencies, Uptake Mechanisms and Competitive Effects of Copper and Zinc in Various Stormwater Filter Media" (2018). Dissertations and Theses. Paper 4556. https://doi.org/10.15760/etd.6441
This Thesis is brought to you for free and open access. It has been accepted for inclusion in Dissertations and Theses by an authorized administrator of PDXScholar. Please contact us if we can make this document more accessible: [email protected].
Removal Efficiencies, Uptake Mechanisms and Competitive Effects of Copper
and Zinc in Various Stormwater Filter Media
by
Emily Heleva-Ponaski
A thesis submitted in partial fulfillment of the
requirements for the degree of
Master of Science
in
Civil and Environmental Engineering
Thesis Committee:
Gwynn Johnson, Chair
William Fish
James Pankow
Portland State University
2018

i
ABSTRACT
Polluted stormwater, if not treated, can compromise water quality
throughout our hydrologic cycle, adversely affecting aquatic ecosystems.
Common stormwater pollutants, copper and zinc, have been identified as primary
toxicants in multiple freshwater and marine environments. For small-scale
generators, stormwater management can be cumbersome and implementation of
common BMPs impractical thus catch basins are popular though not the most
environmentally conscious and sustainable option. This study aims to
characterize the potential of a mobile media filter operation for the treatment and
on-site recycling of catch basin stormwater. The removal capacities of various
commercially available filter media (e.g. a common perlite; Earthlite™, a medium
largely composed of biochars; and Filter33™, a proprietary porous medium) were
measured using binary injection solutions modeled after local catch basin
stormwater characteristics. The results of filtration experiments, rapid small-scale
column tests (RSSCTs), indicate that the transport of metals in Perlite is primarily
impacted by nonspecific sorption whereas in Earthlite™ and Filter33™ both
nonspecific and specific sorption are present. For all media and experimentation,
there was a consistent preferential uptake of copper such that copper displayed
delayed arrival and/or greater removal than zinc. Moreover, the observed snow
plow effects and concentration plateaus in Earthlite™ and Filter33™ RSSCTs
suggest rate limited ion exchange and specific sorption in addition to ion
competition. Earthlite™ exhibited an approach velocity dependent removal
ii
efficiency in the RSSCTs and pseudo second order uptake behavior for zinc in
kinetic batch experiments. At the lab scale equivalent of the proposed field scale
flow rate, Filter33™ displayed the greatest average zinc removal of 8.6 mg/g. In
all, this research indicates that test parameters (i.e. pH, competitive ions
solutions, empty bed contact time, flow rate) based on the natural environment
and field scale operation can greatly impact removal efficiency in filter media.

iii
TABLE OF CONTENTS
ABSTRACT ........................................................................................................... i
LIST OF TABLES ................................................................................................. v
LIST OF FIGURES ...............................................................................................vi
1.0 INTRODUCTION ............................................................................................ 1
2.0 BACKGROUND .............................................................................................. 8
2.1 Metals .......................................................................................................... 8
2.2 Sorption Mechanisms .................................................................................. 9
2.3 Ion Exchange Reactions ............................................................................ 10
2.4 Filter Media ................................................................................................ 11
2.4.1 Selected Media .................................................................................... 11
2.5 Removal Mechanisms: Previous Studies................................................... 13
2.5.1 Perlite .................................................................................................. 13
2.5.2 Biochar ................................................................................................ 16
2.6 Research Objective ................................................................................... 18
3.0 MATERIALS AND METHODS ...................................................................... 20
3.1 Reagents ................................................................................................... 20
3.2 Filter Media ................................................................................................ 20
3.3 Sample Collection ...................................................................................... 21
3.4 Apparati: Filtration Studies ......................................................................... 23
3.5 Synthetic Solutions .................................................................................... 24
3.6 Batch Experiments .................................................................................... 26
3.7 Filtration Experiments ................................................................................ 27
3.8 Sample and Data Analysis ......................................................................... 30
3.8.1 Particle Size Analysis .......................................................................... 30
3.8.2 Solids Analysis .................................................................................... 30
3.8.3 Sample Analysis .................................................................................. 31
3.8.5 Data Analysis ....................................................................................... 32

iv
3.8.5.1 Batch Experiments ......................................................................... 32
3.8.5.2 Filtration Experiments .................................................................... 34
3.8.5.3 Digests ........................................................................................... 36
4.0 RESULTS AND DISCUSSION ..................................................................... 38
4.1 Filtration Experiments ................................................................................ 38
4.1.1 Nonreactive Tracer .............................................................................. 38
4.1.2 Metals .................................................................................................. 39
4.1.2.1 Perlite ............................................................................................ 39
4.1.2.2 Earthlite™ ...................................................................................... 43
4.1.2.3 Filter33™ ....................................................................................... 47
4.1.3 Pentafluorobenzoic Acid ...................................................................... 52
4.1.3.1 Earthlite™ ...................................................................................... 52
4.1.3.2 Filter33™ ....................................................................................... 52
4.2 Filtration Experiment Comparison ............................................................. 54
4.2.1 Competitive Displacement ................................................................... 54
4.2.2 Snow plow Effects ............................................................................... 55
4.2.3 Concentration Plateau ......................................................................... 57
4.3 Column Digests ......................................................................................... 58
4.3.1 Perlite .................................................................................................. 58
4.3.2 Earthlite™ ............................................................................................ 61
4.4 Kinetic Batch Studies: Earthlite™ .............................................................. 62
5.0 CONCLUSION .............................................................................................. 68
REFERENCES ................................................................................................... 71
APPENDIX A. Solids Analysis ............................................................................ 77
APPENDIX B. Particle Size Analysis .................................................................. 79
v
LIST OF TABLES
Table 1. Chemical composition of perlite ............................................................ 13
Table 2. Ion concentrations in the synthetic rainwater and Pacific NW rainwater
........................................................................................................................... 13
Table 3. Total metals of the TriMet Merlo location A stormwater and Oregon
highway stormwater runoff averages .................................................................. 25
Table 4. Calculated and measured metals removal for Perlite, Earthlite™ and
Filter33™ ............................................................................................................ 62
Table 5. Initial zinc concentrations and experimental long-term maximum zinc
removal for multiple binary metals Earthlite™ kinetic batch tests ....................... 66
Table 6. Initial binary metals concentrations for Earthlite™ kinetic batch tests with
calculated retardation factors.............................................................................. 66
vi
LIST OF FIGURES
Figure 1. Standard Lynch-style catch basin .......................................................... 6
Figure 2. Silicon groups at the surface of perlite………………………………….. 13
Figure 3. Alumina hydrous oxide surface groups................................................ 13
Figure 4. Stormwater sample collection locations on the TriMet Merlo property. 22
Figure 5. PFBA breakthrough curves for Perlite systems ................................... 39
Figure 6. Breakthrough curves for zinc transport in Perlite columns ................... 41
Figure 7. Breakthrough curves for copper transport in Perlite columns .............. 41
Figure 8. Measured breakthrough curves for copper and zinc with a 24-hour flow
interrupt .............................................................................................................. 42
Figure 9. Zinc breakthrough curves for Earthlite™ systems ............................... 44
Figure 10. Copper breakthrough curves for Earthlite™ systems at
flowrates ………………………………….. ............................................................ 45
Figure 11. Effluent zinc concentrations and pH from Earthlite™ column 4 before
and after a 25-hr flow interruption ....................................................................... 45
Figure 12. Effluent copper concentrations from Earthlite™ column 4 with 25-hr
flow interruption .................................................................................................. 46
Figure 13. Complete zinc breakthrough curve for Filter33™ .............................. 49
Fig. 14. Effluent copper concentrations from F2 with an 8-day flow interruption 49
Figure 15. Effluent zinc concentrations from F2 during four discrete flow
interruptions ........................................................................................................ 51
Figure 16. Zinc elutions for Filter33™ systems ................................................... 51
Figure 17. Complete PFBA breakthrough curves for F2 and F3 ......................... 53
Figure 18. PFBA arrival waves for F2 and F3 ………………………………….. ... 54
Figure 19. Observed snow plow effects in Filter33™ (F2 and F3) and Earthlite™
(E4). .................................................................................................................... 56
Figure 20. PFBA arrival waves for Filter33™ (F2 and F3) and Earthlite™ (E4).. 58
Figure 21. Percent metals removal for quartered sections of Perlite column 3 ... 59
Figure 22. Percent zinc removal for quartered sections of the Earthlite™ columns
........................................................................................................................... 60
vii
Figure 23. Percent copper removal for quartered sections of the Earthlite™
columns .............................................................................................................. 60
Figure 24. Measured and modeled zinc removal in Earthlite™ kinetic batch tests
........................................................................................................................... 64
Figure 25. Measured copper removal in Earthlite™ kinetic batch tests .............. 64
Figure 26. Representative results of zinc aqueous concentration and percent
removal in Earthlite™ kinetic batch tests ............................................................ 65
1
1.0 INTRODUCTION
In natural environments, stormwater is part of the water cycle, thus after a
storm event, runoff water often rejoins the surrounding surface and groundwater
systems. Unfortunately, in urban environments, this hydrologic flow component,
either as interception, baseflow, interflow, or even infiltration, can be disrupted by
impervious surfaces creating stormwater runoff. In general, stormwater runoff is
commonly considered a pollutant source as overland water flow tends to gather
oils, chemicals, heavy metals, and sediment from a variety of surfaces (e.g.
roads, roofs). Consequently, this polluted stormwater, if not treated, can
compromise water quality throughout our hydrologic cycle (USEPA, 2018b).
To address this problem, the Clean Water Act (CWA) was established in
1972 to protect surface water systems from pollution. In this act, stormwater
runoff pollution is separated into two categories: nonpoint source and point
source. Nonpoint source runoff pollution in an urban environment may come from
streets, parks, and roofs, and is generally defined as runoff pollution without a
discrete point source. Unfortunately, nonpoint source pollution is the “leading
remaining cause of water quality problems” around the world (USEPA, 2017).
Point source pollution, as defined by the CWA, is “any discernible,
confined and discrete conveyance…from which pollutants are or may be
discharged” (USEPA, 2017). To regulate this type of pollution the United States
Environmental Protection Agency (USEPA) through the CWA authorizes states
to permit alternatives to stormwater management under the National Pollutant

2
Discharge Elimination System (NPDES) program (USEPA, 2018b). Under this
program, states issue, regulate and enforce NPDES permits, while the USEPA
maintains the right to oversee any and all operations. In general, NPDES permits
protect surface water quality by regulating the release of pollution (e.g. heavy
metals, oils and solids) from a point source to receiving surface water systems.
In the United States, typical point sources requiring NPDES stormwater permits
are municipal separate stormwater systems (i.e. publicly-owned conveyance
systems that discharge to surface waters), construction activities (e.g. ground
disruption, outdoor materials and equipment storage) and industrial activities
(e.g. petroleum refineries, salvage yards, transportation facilities with cleaning
operations).
Heavy metals (e.g. cadmium, copper, lead and zinc), total suspended
solids (TSS), oil/grease and pH are regulated under a typical NPDES stormwater
permit due to their potential adverse effects on aquatic ecosystems (USEPA,
2018b). For example, the olfactory system of salmonid species can be negatively
impacted by low concentrations of copper (Sandahl et al., 2007; Baldwin et al.,
2011). In a Santa Monica Bay stormwater discharge study, zinc was identified as
a primary toxicant of concern in fertilization tests performed with sea urchin (Bay
et al., 2003). A West Los Angeles highway runoff study found copper and zinc to
be the primary cause of toxicity in 90% of freshwater and marine species
sampled (Kayhanian et al., 2008). Additionally, excess solids in natural waters
can be harmful to aquatic life. Increased sediment loads in receiving surface
3
water systems related to runoff from mining and road construction have been
shown to negatively impact fish, invertebrates, spawning ground and general
biological activity (Brookes, 1986; Ribaudo, 1986; Bilotta and Brazier, 2008).
In urban environments, vehicles (specifically from brake pad wear, tire
wear and engine oil) are sources of heavy metal pollution in stormwater such that
parking lots and road surfaces tend to display higher levels of heavy metals when
compared to other common urban runoff (Davis et al., 2001; Charters et al.,
2016; Huber et al., 2016). Vehicle brake pads and runoff from copper roofing and
gutter materials are large contributors to copper pollution in residential and
industrial areas, entering stormwater runoff through dissolution (Nason et al.,
2012; Charters et al., 2016). Other copper pollution sources include, for example,
metal finishing, copper plating, engine oil, fertilizers, pesticides and industrial
releases (Sari el at., 2007; Ghassabzadeh et al., 2010; Nason et al., 2012). Zinc
pollution typically enters the urban water system through runoff from galvanized
structures, roofs, building siding, parking lots and roads (Charters et al., 2016;
Huber et al., 2016). Bridge deck and building siding runoff were found to be large
contributors to stormwater zinc concentration due to their concrete, painted wood
and galvanized components (Davis et al., 2001; Huber et al., 2016). Additionally,
roofs and roads are the primary sources of suspended solids in runoff due to
atmospheric deposition of sediment from industrial activities, vehicle emissions
and soils onto these surfaces and the subsequent storm events that wash them
off (Charters et al. 2016).
4
When in a stormwater stream, heavy metals can exist in two basic forms,
dissolved and particulate making TSS removal an important component of a
metals’ removal strategy. Many have noted the toxicity of dissolved metals in
their free ion form due to their ability to bind with aquatic biota and organisms,
specifically copper due to its high reactivity (Nason et al., 2012; Charters et al.,
2016). NPDES permits are commonly written for total metal concentrations due
to metal complexation and its dependency on stormwater characteristics (i.e.
hardness, pH, cation competition and organic ligand concentration) (Kinerson et
al., 1996).
With increased urbanization throughout the US, there has become a need
for alternatives to traditional end of the pipe approaches to stormwater treatment.
Many municipalities have developed stormwater management plans to help
address the obstacles and practicalities in removing pollutants from various and
challenging sources as well as offering an alternative to traditional treatment
through best management practices (BMPs) (USEPA, 2018b). BMPS are
stormwater controls that have been identified as ways to treat stormwater at its
source, thereby decreasing the load sent to a wastewater treatment plant. As a
result, BMPs can reduce costs, redirect stormwater back into the natural
environment and protect the environment from pollutants.
Commonly employed BMPs include biofilters, catch basins and media
filters. Biofilters range from rain gardens, bioswales, ecology embankments, to
retention ponds and constructed wetlands. These treatment systems aim to

5
capture and hold the runoff allowing for infiltration and removal of pollutants
(ODEQ, 2003; BES, 2004; Soil Science Society of America, 2018). Typically, the
delineation between various biofilters tends to lie in the size, construction, soil
amendments and treatment areas. Catch basins and media filters basically
separate the processes that a biofilter does into two distinct phases where, for
example, the catch basin aims to collect and store runoff while the media filter
aims to treat runoff.
A catch basin is usually a square concrete hole with a grate on top at a
runoff low point, though design and construction vary by location. In some
applications, catch basins are connected to the local/regional stormwater system
by drains and are primarily meant to help reduce the sediment load in the runoff
before feeding the stormwater into the conveyance system (Figure 1)(ODEQ,
2017). Other catch basins simply store runoff until it can be removed or treated
(e.g. a pump and haul approach to stormwater management). Regardless of
type, catch basins need to be maintained by cleaning and/or emptying settled
solids, but the frequency depends on location and precipitation.
A media filter, or stormwater filter, contains a filter medium designed to
target the primary pollutants of the source area it is treating. Stormwater flows
through the media filter which in application removes or filters the pollutant,
leaving treated water that then can be discharged into the environment
(assuming treatment levels have met local, permitted NPDES requirements)
(Barrett, 2005). This eliminates the need for removal and transportation

6
Figure 1. Standard Lynch-style catch basin with City of Portland design specifications (ODEQ, 2017).
(e.g. pump and haul) of the polluted water and while this alternative to managing
stormwater carries operation and maintenance costs it is widely considered a
cost-effective and sustainable option for many generators.
It is common for multiple and various generators in a similar geographical
area, all held to the same total maximum daily load (TMDL) pollutant limits, to
use similar BMPs (USEPA, 2018a). At the municipality or corporation level, for
example, the implementation of biofilters, conveyance alteration and/or other
common BPMs is typically considered practical (BES, 2016). On the other hand,
on-site stormwater management plans for smaller, private businesses may need
alternative solutions. Some companies can and do invest in alternatives (for
example, Arbor Lodge New Seasons, Portland, OR installed a bioswale in the
center of their parking lot), but space and upfront investment costs can create
barriers. There appears to be a need for onsite treatment of catch basin
7
stormwater that does not require a large initial investment and/or costly
operation/maintenance for the generator that is more environmentally conscious
and sustainable than pump, haul, and treat. One alternative solution many local-
scale generators find applicable, as they tend to require a small footprint, are
catch basins plus media filters; two convenient BMPs used in combination.
Another alternative, upcoming approach includes a “mobile” media filter facility.
For example, as stormwater is collected from similar pollutant loading zones (i.e.
multiple on-site catch basins), the waters could be treated by the “on-truck”
media filters and recycled (assuming treatment meets local, permitted NPDES
requirements) on site.
This study aims to characterize the potential of a mobile media filter
operation for the treatment and recycling of stormwater. The removal capacities
of various commercially available filter media (e.g. a common perlite, a medium
largely composed of biochars, and a proprietary porous medium) were measured
using pollutant concentrations modeled after stormwater samples collected from
local catch basins. NPDES permit pollutant levels were used to help characterize
filter efficiency and filter lifetime. Experiments aimed to qualify filter medium
performance were conducted under pumped conditions with the overall goal of
the project being to characterize cost-effective and sustainable stormwater
treatment alternatives for local/small-scale generators.

8
2.0 BACKGROUND
2.1 Metals
Copper is a transition metal that can have variable valance which
translates into multiple oxidation states, Cu(I) and Cu(II). In aqueous solutions,
Cu(I) is unstable and usually deprotonates to Cu(II). Cu(II) has an incomplete set
of d-shell electrons (e.g. 9 electrons in the d-shell) which means that it is
“strongly influenced by its surroundings, particularly by its coordinated ligands”
making it one of the most reactive divalent metals (Morel and Hering, 1993). In its
free divalent ion form, Cu(II) is toxic and bioavailable making it a concern in
natural water systems (Nason et al., 2012).
According to the Irving-Williams series wherein the stability of complexed
multivalent ions are ranked, Mn(II) < Fe(II) < Co(II) < Ni(II) < Cu(II) > Zn(II),
copper has a greater complex stability than other divalent metal ions due to its
high effective nuclear charge and ligand field stabilization energy (i.e. the
electrostatic interaction between the d-orbital electrons and approaching ligands)
(Morel and Hering, 1993). As described by Pankow (1991) when summarizing
metal/ligand complexation reactions, a larger equilibrium constant equals a more
stable complex. A review of stability constants of metals with ligands commonly
found in natural waters and present in aquatic organic material reveals that many
of the Cu(II) constants are greater than those of Zn(II) for that same metal:ligand
formation.
9
Zinc is a post-transition metal with one oxidation state, Zn(II), and being to
the right of copper on the periodic table, it is slightly larger. In its oxidized form,
zinc has a full d-orbital making it more stable than copper in the aqueous
environment and, therefore, less influenced by its surroundings. As discussed in
Morel and Hering (1993), Zn(II) has no ligand field stabilization energy explaining
“the most important difference in the relative degree of reactivity of various metal
complexes”.
2.2 Sorption Mechanisms
The uptake of fluid-phase molecules (e.g. cations in solution) by a sorbent
is commonly referred to as sorption, a “lumped term” capturing multiple
mechanisms responsible for those sorbate/sorbent reactions. Those reactions
are defined by electromagnetic interactions of the nuclei and electrons driven by
both physical and chemical processes (Muralikrishna and Manickam, 2017).
Physisorption (physical sorption) is a non-specific sorption that occurs as a result
of weak intermolecular forces (Van der Waals forces) that do not alter the surface
of the sorbent. It is common to assume that as physical sorption is due to
attractive forces and not chemical bonds, it can be reversible resulting in the
release (desorption) of sorbate. Chemisorption (chemical sorption) involves the
creation of chemical bonds between the sorbate (e.g. the ions in solution) and
the sorbent. This interaction is specific and as such alters the charge
characteristics of the sorbent usually making the process irreversible. For

10
example, with heavy metal ions, chemisorption with silanol and aluminol groups
involves a proton exchange as the metal bonds directly to the oxygen (Harsh,
2005).
𝐴𝑙 − 𝑂𝐻 + 𝑀2+(𝑎𝑞) ↔ 𝐴𝑙 − 𝑂𝑀+ + 𝐻+ (1)
In the above equation, the allophane surface becomes positively charged (the
charge characteristics change) and the solution becomes more acidic as a proton
is exchanged.
The previously mentioned sorption mechanisms take place on the surface
of the sorbent (often defined as adsorption), but at times there are more
complicated mechanisms (e.g. absorption reactions) taking place beyond these
surface interactions such as diffusive mass transfer which includes film diffusion,
pore diffusion, intraparticle diffusion and intraorganic matter diffusion (Johnson,
2005).
2.3 Ion Exchange Reactions
Ion exchange is defined when an ion in solution and an ion associated
with the sorbent exchange places, changing the solution concentration of that
ionic species yet preserving the electrical neutrality of the solution (Kumar and
Jain, 2013). This naturally occurring process can be enhanced using
manufactured sorbents (i.e. ion exchange media and resins) that target cations,
anions or both. Janvion et al. (1995) described this process using Na+ as the
exchangeable ion in the resin:
11
2𝑁𝑎𝑟+ + 𝑀𝑠
2+ ⇌ 𝑀𝑟2+ + 2𝑁𝑎𝑠
+ (2)
where subscripts r and s denote the ion exchange resin and solution,
respectively, showing it as a reversible process.
Previous research has suggested that ion exchange is a kinetically-
controlled process that can involve film and particle diffusion (Helfferich and
Plesset, 1958; Selim et al., 1992). Additionally, it has been reported to work in
tandem with sorption reactions and possibly controls the desorption process
(Caetano et al., 2009). Vaaramaa et al. (2003) observed competitive ion
displacement when evaluating organic and inorganic ion exchangers for metals
removal from drinking water. For example, the researchers noted effluent
concentrations of some metal ions exceeding initial concentrations (i.e. C/Co>1)
suggesting, when at exchange capacity and working with a multi-ion solution,
there is a release of less preferred ions (i.e. less competitive ions).
2.4 Filter Media
2.4.1 Selected Media
Perlite, an amorphous volcanic glass (SiO2) formed by the hydration of
obsidian, is commonly used in the construction, agriculture, food, beverage,
medical, and chemical industries (Gironas et al., 2008; MEC). When heated to its
softening range (760 to 1100 oC), perlite expands from 4 up to 20 times its
original size creating a medium that is light with a high total surface area.
Expanded perlite has been tested and used as a filter medium for stormwater

12
filtration in private and public sectors because it is cost effective and has
repeatedly been proven as an effective TSS remover (e.g. approximately 79%
removal efficiency) (CONTECH®, 2001, 2015; NJCAT, 2007; Gironas et al.,
2008). Moreover, variations of the medium have been studied as a heavy metals’
sorbent, but the overall effectiveness varies and has been shown to be highly
dependent on influent concentrations. In the literature, perlite is often viewed
more as a filtration medium than as an adsorptive medium.
Earthlite™ Stormwater Filter Media is a proprietary composite porous
medium composed of an organic biochar and other porous materials (Sunmark
Environmental). Biochar is a product produced as biomass (e.g. plant material)
undergoes pyrolysis in the absence of oxygen becoming a fine grained, porous,
charcoal-like material (Chen et al., 2011, Kolodynska el al., 2012). Much
research has been conducted on the quality and effectiveness of biochars as a
soil amendment (e.g. Beck et al., 2011). Researchers have shown the
effectiveness and overall properties of biochars largely depend on not only the
quality and structure of the parent materials but also on the biomass processing
conditions (e.g. temperature, hold times, moisture content, organic carbon and
hard carbon content). Few researchers have characterized the efficiency of the
composite Earthlite™ filter medium, but research conducted by Gray et al. (2015)
on biochars used by Earthlite™’s manufacturer has shown that at typical, natural
infiltration rates it can remove approximately 90% copper and 51% zinc
(dissolved). Other researchers have suggested that high biochar sorption

13
capacities of heavy metals are due to the large amount of oxygen containing
groups on the surface of biochar (Liu and Zhang, 2009; Kolodynska el al., 2012).
Filter33™ is a proprietary granular adsorptive medium that proposes
removal efficiencies of 88%, 96%, and 87% for copper, zinc, and TSS,
respectively (Clarus Water Solutions, 2015). Additionally, it is reported to be able
to handle acidic waste and a wide range of flow rates (2 to 200 gpm). Currently, it
is being used in industrial environments.
2.5 Removal Mechanisms: Previous Studies
2.5.1 Perlite
The complete chemical composition of perlite as outlined by Alkan and
Dogan (2001) is shown in Table 1 with the primary constituents being SiO2 (71-
75%) and Al2O3 (12.5-18%).
Table 1. Chemical composition of perlite (Alkan and Dogan, 2001).

14
The silicon atoms attach to monovalent hydroxyl groups creating the silicon
groups: hydroxyl, silanediol and silanetriol as shown below.
Figure 2. Silicon groups at the surface of perlite (Alkan and Dogan, 2001).
The alumina atom is proposed to have the following hydrous oxide surface
groups:
Figure 3. Alumina hydrous oxide surface groups (Alkan and Dogan, 2001).
These surface hydroxyl groups are primarily responsible for the sorption of metal
ions in perlite. Furthermore, since these are surface events and hydroxyl groups
are easily accessible, perlite sorption tends to be rapid.
Previous copper perlite studies have reported an optimal pH of 5 for
maximum removal (e.g. sorption capacity) and noted that copper hydroxide
precipitates occur above this pH (Sari et al. 2007; Swayampakula et al., 2009). In
kinetic batch tests, removal efficiencies for multiple metals including copper were
15
seen to plateau between 90 and 150 minutes which lead researchers to suggest
that the sorption follows pseudo second order (PSO) kinetics (Mathialagan and
Viraraghavan, 2002; Sari et al. 2007; Ghassabzadeh et al., 2010). A study of
chitosan-coated perlite beads using binary and tertiary solutions observed more
favorable adsorption for Cu(II) as compared to Co(II) and Ni(II) in both kinetic
batch and column studies. Moreover, the presence of another metal ion in
solution decreased the adsorption capacity of the primary ion (i.e. Cu(II)), but this
effect was most pronounced with Ni(II) (Swayampakula et al., 2009).
Zinc has not received as much attention in the literature due to its less
aggressive nature as an ion in aquatic/aqueous systems, but one study outlines
the optimal adsorption parameters found with batch tests. Zinc experienced max
sorption between pH 5 and 6, which is slightly higher than that of copper.
Researchers reported rapid adsorption during the first three hours followed by a
plateau suggesting a rate-limited diffusion process of zinc from external to
internal binding sites (Silber et al., 2012). Competitive effects of other metal ions
were not tested though Zn(II) adsorption appeared to enhance phosphorous
adsorption.
The long-term fate of both copper and zinc metal ions have been shown to
be affected by solution pH, reaction kinetics (e.g. contact time) and/or
competitive effects, suggesting that there could be a combination of specific and
non-specific adsorption mechanisms contributing to their overall sorption and
transport behavior.

16
2.5.2 Biochar
The composition and surface area of biochars differ greatly depending on
the parent material used, but in general, they are composed of C, H, O, N and
sometimes Si (Liu and Zhang 2009; Chen et al. 2011; Gray et al. 2015). The
surface functional groups of biochar are mainly oxygen containing groups such
as carboxylic, lactone and phenolic hydroxylic groups (Liu and Zhang 2009).
Similar to perlite, these oxygens are responsible for metal sorption. Multiple
studies suggest that the sorption follows PSO kinetics for all metals, assuming
chemisorption, and that intraparticle diffusion could be the rate limiting sorption
mechanism (Liu and Zhang 2009; Chen et al., 2011; Kolodynska el al., 2012).
More specifically, both Cu(II) and Zn(II) have been shown to exhibit
maximum sorption capacities to biochars at a solution pH of 5 (Chen et al. 2011;
Kolodynska el al. 2012). Research conducted by Kolodynska et al. (2012) on the
uptake of Cu(II), Cd(II), Pb(II), and Zn(II) ions in solution to a biochar produced
from pig and cow manure showed that when solution pH was below 7, there was
a measured temporal variability in solution pH with pH initially increasing followed
by a decrease. Researchers suggested these findings indicate ion exchange or
precipitation mechanisms as part of the sorption process to the biochar.
Equilibrium times for both metal ions were between 30 and 60 minutes and
followed PSO as commonly reported by other researchers and mentioned
previously. Additionally, in batch studies conducted by this group of researchers,
as the sorbent dose was increased, the sorption capacity decreased, while the

17
overall sorption increased, an observation noted by others as well (Chen et al.
2011; Kolodynska el al. 2012). This is thought to be due to a conglomeration of
the sorbent, decreasing individual particle surface area thereby reducing access
to available sorption sites on the biochar. Interestingly, the authors suggest the
subsequent measured increase in overall sorption is due to the increase in
sorbent dose.
In a single copper metal solution, measured removal efficiencies
approached 57-98% depending on the parent material of the biochars (Chen et
al. 2011; Kolodynska el al. 2012). At low concentrations (~6 mg/L) of both metals
(binary solutions), the effects of sorption capacities of one metal on the other
were minimal. In binary solutions at higher concentrations, Zn(II) barely affected
Cu(II) sorption capacity (Chen et al., 2011) and another study saw Cu(II) sorption
changes of less than 20% in the presence of Zn(II) (Kolodynska et al., 2012). On
the other hand, Zn(II) sorption was greatly impacted (decrease of 75-85%) at
concentrations greater than or equal to 63 mg/L and 65 mg/L for copper and zinc,
respectively (Chen et al., 2011). In all, it appears that metal ions, especially
Cu(II), compete for binding sites making their sorption capacities highly solution
dependent.
Biochar metals sorption, as with perlite, appear to be impacted by pH,
contact time, and/or competitive effects suggesting that there could be a
combination of specific and non-specific adsorption mechanisms contributing to
their overall sorption capacities.
18
2.6 RESEARCH OBJECTIVE
Most of the published research conducted on the efficiency of filter media
for removing heavy metals from solution has focused on optimizing sorption
(removal) by pH manipulation. Furthermore, many of the studies have been
conducted with single metal ion solutions or, when conducted using binary and
tertiary solutions, the metal ion ratios in solution were at concentrations not
representative of the natural environment. Additionally, many researchers have
only characterized filter efficiency under static (batch) or dynamic (column)
conditions while few have compared the results of these different approaches.
Furthermore, much of the research conducted under flow through conditions has
been performed at low flow rates thereby more closely resembling infiltration
rates in the natural environment.
This research aims to characterize the potential of a mobile media filter
operation for the treatment and recycling of stormwater with three primary focal
points: first is to investigate removal efficiencies of various alternative filter media
under induced, uniform flow conditions consistent with the performance expected
for an onsite pump and treat operations. Secondly, this research characterizes
the sorption mechanisms responsible for uptake in select filter media using
multiple techniques such as static and kinetic batch studies plus flow through
columns including flow interrupts on the measured breakthrough curves. Finally,
this research represents natural stormwater conditions as much as possible in
19
order to represent removals that are indicative of working filter conditions. To
best represent natural stormwater characteristics, solutions were modeled after
pH and metal ion ratios that were found in local field samples. Likewise, a
synthetic rainwater based on a local rainwater composition measurement was
used as the base solution for all experimentation.
20
3.0 MATERIALS AND METHODS
3.1 Reagents
Copper chloride dihydrate (CuCl2∙2H2O > 99%) and anhydrous zinc
chloride (ZnCl2 >95 %) were purchased from Aldrich (Milwaukee, WI) and
Mallinckrodt (St. Louis, MO), respectively. Salts of ammonium sulfate ((NH-
4)2SO4), sodium nitrate (NaNO3), and calcium chloride dihydrate (CaCl2∙2H2O)
were purchased from Fisher Scientific (Fair Lawn, NJ). Sodium sulfate (Na2SO4)
and potassium chloride (KCl) were sourced from Sigma-Aldrich (St. Louis, MO)
and Mallinckrodt (Phillipsburg, NJ), respectively. Pentafluorobenzoic acid
(C6F5CO2H, 99%) was purchased from Alfa Aesar (Ward Hill, MA). Trace metal
grade hydrochloric acid (HCl 36.5-38%), trace metal grade nitric acid (HNO3 67-
70%) and reagent grade sodium hydroxide (NaOH 50%) were purchased from
VWR (Radnor, PA), Fisher Scientific (Fair Lawn, NJ) and EM Science (Cherry
Hill, NJ), respectively.
3.2 Filter Media
Perlite, an amorphous volcanic glass formed by the hydration of obsidian,
was sourced from Contech® Engineered Solutions (Portland, OR). Particle size
analysis of a representative (grab) sample of Perlite characterized in this work
yielded a uniformity coefficient (d60/d10) of 2.8. Other medium characteristics were
calculated from rapid small-scale column tests (RSSCTs) yielding a bulk density
of 0.18 g/cm3, an average particle density of 0.43 g/cm3, and a porosity of

21
approximately 57%. To ensure uniform and homogeneous perlite grab samples,
Perlite passing an ASTM E-11 sieve no.10 (2 mm aperture) and retained on a
sieve no. 40 (0.42 mm) was used in the RSSCT.
Earthlite™ Stormwater Filter Media, a commercial heterogeneous biochar
medium, was sourced from Sunmark Environmental (Portland, OR). Particle size
analysis of a representative (grab) sample of the medium yielded a uniformity
coefficient of 5.0. Other medium characteristics were calculated from RSSCT,
with an average bulk density of 0.50 g/cm3, particle density of 1.0 g/cm3, and an
approximate porosity equal to 52%. Medium passing an ASTM- E-11 sieve
no.10 (4.75 mm aperture) was used in kinetic batch tests and in the RSSCT.
Filter33™, a uniform and highly homogeneous, commercially-available
granular filter medium, was sourced from Clarus Water Solutions (Portland, OR).
Particle size analysis of a representative (grab) sample of the medium resulted in
a uniformity coefficient of 1.9. Other medium characteristics were calculated from
the RSSCT: a bulk density of 0.71 g/cm3, an average particle density of 2.35
g/cm3, and a porosity of approximately 70%.
3.3 Sample Collection
Stormwater samples were collected from three different catch basins on
the TriMet Merlo property in Beaverton, OR (see Figure 1) at the following
locations: the employee/visitor parking lot (A); the bus throughway from the
washing station to the property exit (B); and immediately after the bus washing
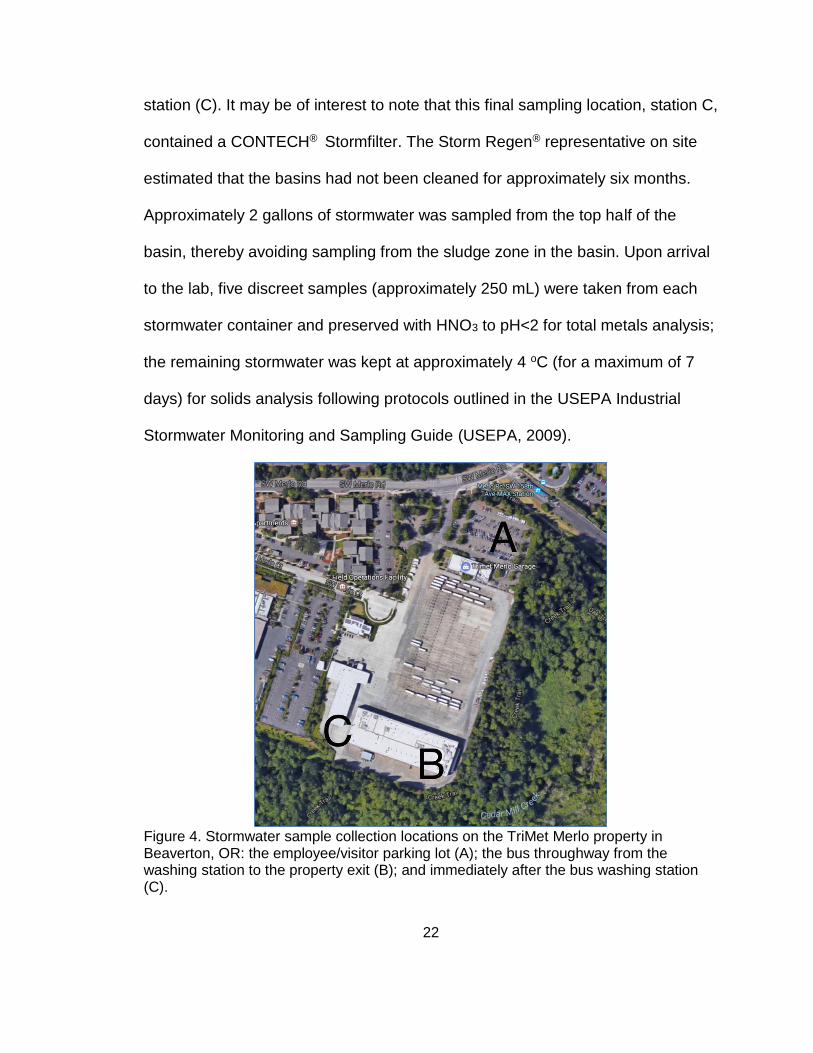
22
station (C). It may be of interest to note that this final sampling location, station C,
contained a CONTECH® Stormfilter. The Storm Regen® representative on site
estimated that the basins had not been cleaned for approximately six months.
Approximately 2 gallons of stormwater was sampled from the top half of the
basin, thereby avoiding sampling from the sludge zone in the basin. Upon arrival
to the lab, five discreet samples (approximately 250 mL) were taken from each
stormwater container and preserved with HNO3 to pH<2 for total metals analysis;
the remaining stormwater was kept at approximately 4 oC (for a maximum of 7
days) for solids analysis following protocols outlined in the USEPA Industrial
Stormwater Monitoring and Sampling Guide (USEPA, 2009).
Figure 4. Stormwater sample collection locations on the TriMet Merlo property in Beaverton, OR: the employee/visitor parking lot (A); the bus throughway from the washing station to the property exit (B); and immediately after the bus washing station (C).

23
3.4 Apparati: Filtration Studies
All filtration experiments were conducted as RSSCT in vertically-
positioned acrylic soil columns (Soil Measurement Systems, Tucson, AZ), 6 cm
in length with 2.5 cm inner diameter. To ensure uniform flow distribution, a fine
nylon mesh followed by a porous plastic frit with distribution holes was used at
the end caps for column tests done using Filter33™. Distribution plates,
emplaced at the inlet and outlet of the column, for column tests conducted using
Earthlite™, consisted of a fine nylon mesh followed by a layer of filter medium,
approximately 8-mm thick, composed of Earthlite™ particles passing a sieve no.
4 and retained on sieve no. 10 (i.e. less than 4.75 mm and greater than 2 mm). A
similar set of distribution plates, using Perlite particles retained on sieve no. 10,
were created for column tests using Perlite.
Between the distribution plates, the main portion of the Perlite column was
comprised of medium passing sieve no. 10 and retained on sieve no. 40. To
create a homogenous core, Perlite was added in 3-4 mm layers with layer
interconnection being created by touch mixer (Fisher Scientific, Fair Lawn, NJ)
vibration on three equidistant outer column locations. A similar packing technique
was employed for the Earthlite™ columns with medium passing a sieve no. 4
though, for layer interconnection, the column was tapped on the counter three
times, rotated a third, tapped three more times; this was continued for one full
rotation. The unsieved medium used in the Filter33™ columns was applied
mimicking the Earthlite™ packing/interconnection technique.

24
3.5 Synthetic Solutions
All solutions were created using water generated from distilled water
purification in a NANOpure Diamond system (Barnstead, Dubuque, IA) that
creates purified water with 18.2 MΩ-cm and <5-10 ppb TOC. Prior to
experimental use, the nanopure water was aerated for 8-12 hours on a Vibrax
VXR orbital shaker (IKA, Wilmington, NC) or an Orbit shaker bath (Lab line,
Melrose Park, IL). A recipe for a synthetic rainwater stock solution based on
average ion concentration profiles of rainwater collected in the Pacific NW (Junge
1958; Junge and Werby 1958) was created using ammonium sulfate
((NH4)2SO4), sodium sulfate (Na2SO4), potassium chloride (KCl), sodium nitrate
(NaNO3), and calcium chloride dihydrate (CaCl2∙2H2O) (Table 1).
Table 2. Ion concentrations in the synthetic rainwater and Pacific NW rainwater.
Ion Synthetic Rainwater Concentration (mg/L)
Average Pacific NW Concentration (mg/L)
NH4+ 0.06 0.06
Ca2+ 0.19 0.19
K+ 0.06 0.06
Na+ 0.25 0.48
Cl- 0.39 0.41
NO3- 0.06 0.10
SO42- 0.64 0.67
Based on the reported solubility products for salts in the synthetic
rainwater, several of the target concentrations were adjusted from the original
recipe to ensure all ions remained in solution (i.e. minimizing precipitate
formation). This stock ion solution was then diluted 1:1000 stock

25
rainwater:nanopure water by mass using an Ohaus Ranger 7000 (Parsippany,
NJ). This synthetic rainwater was used as the background solution for all
experiments and standards.
Binary solutions composed of target heavy metals, copper and zinc, were
created based on the relative ratios of those metals measured in stormwater
samples collected at station A (i.e. an approximate 1:4 Cu:Zn ratio). Additionally,
the pH of all experiments conducted using these binary solutions was maintained
at the average pH measured at the field site (pH = 6.2) (see Table 2). It may be
of interest to note that the total metals concentrations of the collected stormwater
at the TriMet Merlo station A were comparable to Oregon highway stormwater
runoff averages reported by Nason et al. (2012).
For RSSCT experimentation, the binary metals solution (~2 mg-Cu/L and
8 mg-Zn/L) was made using metal salts (CuCl2∙2H2O and ZnCl2) dissolved in the
synthetic rainwater, added by mass using an Adventurer AX 324 and/or Ohaus
Ranger 7000 (Ohaus, Parsippany, NJ). A similar procedure was used to create
batch binary metals solutions with initial aqueous concentrations at a wider range
of concentrations and at 1:2 and 1:4 Cu:Zn metals ratios. Solution pH was
adjusted using 0.1 M NaOH or HNO3 to reach the experimentation pH of 6.2.
Table 3. Total metals of the TriMet Merlo location A stormwater and Oregon highway stormwater runoff averages reported by Nason et al. (2012).
Merlo Station A, g/L Oregon Highway Runoff, g/L
Cadmium 0.2 0.7
Copper 19 21 Lead 16 13
Zinc 85 108
26
3.6 Batch Experiments
Kinetic batch studies aimed to characterize the reaction chemistry (e.g.
temporal variability and competitive effects) of heavy metals to Earthlite™ were
conducted using a binary solution of Cu(II) and Zn(II) at a range of
concentrations (19-32 mg-Cu/L and 54-119 mg-Zn/L) at binary ratios equal to
approximately 1:2 and 1:4 Cu:Zn and at pH of approximately 6.2. Nalgene bottles
and caps (HDPE, 250 mL) were weighed using a PJ3600 Deltarange (Mettler,
Columbus, OH). Approximately 10 grams of filter medium and 100 grams of
binary solution were added creating a 1:10 solids:solution ratio. The bottle was
capped, gently tumbled by hand (inverted 5 times) and placed on its side in an
Orbit shaker table (Lab-line, Melrose Park, IL) at 75 rpm. Reactor times started
and stopped upon placement into and removal from the shaker table. The
reactor’s content (solids and solution) was poured through a Whatman 40 filter (8
m retention) nested in a glass funnel. Samples were allowed to filter for
approximately 10 minutes; any solution not filtered during that interval was not
considered part of the sample. After filtration, a pH reading was taken followed by
AAS analysis.
The batches utilized two controls, a lab blank and a medium blank, that
underwent the complete batch process. The lab blank contained synthetic
rainwater and the medium blank contained pH-adjusted (pH 6.2) synthetic
rainwater and the medium. The measured medium blank average was subtracted
from the final measured sample concentrations, respectively.
27
3.7 Filtration Experiments
Columns packed with either Perlite, Earthlite™ or Filter33™ media were
saturated using the synthetic rainwater at 0.25 mL/min for 12-24 hours followed
by 0.35 mL/min for 12-24 hours and finished at 0.5 mL/min for at least 24 hours
using a Series II HPLC pump (Scientific Systems Inc., State College, PA).
Uniform fluid flow through the packed columns was from bottom to top in all
experimentation.
For column/flow-through experiments at flows greater than 0.5 mL/min,
saturation was continued at 1.0 mL/min for a minimum of 12 hours. For studies at
flows greater than 1mL/min, flow was increased in increments to help prevent
preferential pathway formation. The experimental flow was held for approximately
30 minutes prior to the start of the experiment. Column weights were recorded
between flow increases as well as before and after an injection or elution.
Samples were collected with a Retriever 500 (Teledyne ISCO, Lincoln,
NE) or a Spectra/Chrom CF-2 (Spectrum, New Brunswick, NJ) fraction collector.
It may be of interest to note, for experiments over long collection intervals (i.e.
times greater than one day) these collectors accumulated a small/negligible
delay error in experimental sample times. Flow rates were measured by mass on
the Adventurer AX 324 (Ohaus, Parsippany, NJ). During the experiments,
sample pH (including that of the influent solution and discrete effluent solution
volumes) was read within 30 minutes of collection; the injection reservoir was

28
sampled at time increments of 5-10 hours with overall injection times requiring
between one to three days total. Between sample collection/experimentation and
analysis, all samples were covered and stored at 4C.
Column experiments conducted to characterize overall fluid flow through
the various select filter media were performed using a nonreactive tracer (NRT).
The select packed columns were injected with a 500 mg/L PFBA solution until
complete breakthrough (C/Co = 1) was achieved. The columns were then eluted
with PFBA-free synthetic rainwater until measured PFBA concentrations reached
below our reporting limit (~1 mg/L). Duplicate NRTs were performed on Perlite
column 1 (P1) and Perlite column 2 (P2) at flowrates of approximately 0.5 and 1
ml/min (P1) and at 1 and 10 ml/min (P2). Interestingly, NRT experiments using
PFBA were attempted on the Earthlite™ and Filter33™ columns; both media
reacted with the available tracer (PFBA).
Perlite columns 1, 2 and 3 (P1, P2 and P3) were injected with the binary
metals solution (~2 mg-Cu/L and 8 mg-Zn/L, pH~6.2) at 10, 10 and 1 mL/min,
respectively, until complete breakthrough (C/Co = 1) of zinc was achieved
(approximately 10 pore volumes injected). Flow interrupts lasting approximately
24 hours were performed on P2 and P3 during the injection but after complete
breakthrough of zinc. Perlite columns P1 and P2 were eluted with synthetic
rainwater until zinc readings on the AAS were below the reporting limit (~<0.1
mg/L).
Earthlite™ columns 1, 2, 3 and 4 (E1, E2, E3 and E4) were injected with
29
the binary metals solution (~2 mg-Cu/L and 8 mg-Zn/L, pH~6.2) at flowrates
equal to 3, 5, 1, and 3 ml/min, respectively. The binary metals solution was
injected for approximately 220, 400, 460, and 430 pore volumes (i.e. bed
volumes), respectively. Flow on E4 was interrupted for ~25 hours during this
initial injection. A PFBA injection was performed on Earthlite™ column 5 (E5) at 5
mL/min for approximately 12 pore volumes (PV).
Filter33™ columns 1, 2 and 3 (F1, F2, and F3) were injected with
approximately 400, 1900 and 1700 pore volumes of the binary metals solution
(~2 mg-Cu/L and 8 mg-Zn/L, pH~6.2). These flow-through experiments were
conducted at average flowrates of 1, 10, and 10 ml/min, respectively. After
complete breakthrough was measured for zinc (C/Co = 1) in F2, multiple flow
interrupts were conducted, each lasting between 6 to 8 days in total. Discrete
samples were collected following these flow interrupts, measuring
rebounding/recovering concentrations in the effluent. Following each flow
interrupt, F2 was flushed with the binary metals solution for an additional 360 to
900 pore volumes. After a total of approximately 4800 pore volumes of binary
metals solution injection, F2 was eluted with metals-free synthetic rainwater as
follows: 45 PV at 10 mL/min, 25 PV at 0.5 mL/min, 3 day flow interrupt, 5 PV at
10 mL/min. A PFBA arrival and elution at 10 mL/min immediately followed the
final rainwater elution on F2.
F3 was eluted at 10 mL/min in the following manner: synthetic rainwater
(50 PV), nanopure water (50 PV), 12 day flow interrupt, nanopure water (50 PV),

30
20 day flow interrupt, synthetic rainwater (35 PV). A PFBA arrival, 13 day flow
interrupt, elution at 10 mL/min followed the final rainwater elution on C3.
3.8 Sample and Data Analysis
3.8.1 Particle Size Analysis
A particle size analysis was performed on Perlite, Earthlite™ and
Filter33™ media following the American Society for Testing and Materials
(ASTM) procedures C136-01 and D2487-10 using ASHTO E-11 sieves 1/4", 4, 6,
10, 40, 100, 150 and 200 (ASTM 2001, 2010).
3.8.2 Solids Analysis
Solids analysis was performed on the stormwater per section 2540 B, C
and D of the Standard Methods for the Examination of Water and Wastewater
(APHA, 2012). Total suspended solids (TSS) samples were processed using a
300 mL glass funnel and base (Kimble Kontes LLC, Vineland, New Jersey) with a
1.2 m retention filter (MilliporeSigma, Burlington, MA). Total solids (TS) were
weighed and dried in glass beakers. Sample weights were recorded using an
AJ100 analytical balance (Mettler, Columbus, OH) after drying in an International
1350F convection oven (VWR, Radnor, PA). For QA/QC, all samples were
measured in triplicate and redried/reweighed until the measured mass difference
was less than 4%.
31
3.8.3 Sample Analysis
PFBA was analyzed using a U-1800 UV-Visible spectrophotometer
(Hitatchi, Tokyo, Japan) at a wavelength of 226 nm. Standardization of the UV-
Vis was achieved by calibrating the instrument to a 10-point standard curve with
concentrations ranging from 1 to 525 mg/L. To stay within the instruments linear
response range, samples and standards above 175 mg/L were diluted 1:3 using
PFBA-free synthetic rainwater. Synthetic rainwater was analyzed every 10
samples to track and adjust for any quantifiable baseline shifts.
Stock solutions of 500.14 mg-Cu/L and 500.57 mg-Zn/L liter were made
using copper and zinc salts (CuCl2∙2H2O and ZnCl2), nanopure water and HNO3
on an AJ100 analytical balance (Mettler, Columbus, OH). Standardization of the
AA-7000 Atomic Absorption Spectrophotometer (Shimadzu, Kyoto, Japan) was
achieved by calibrating the instrument to a 9-point copper and a 10-point zinc
standard curve with concentrations ranging from approximately 0.1-8 mg Cu/L
and 0.1-2 mg Zn/L. Copper and zinc samples from the batches, digests and
transport studies were analyzed at wavelengths of 345.8 and 636.2 nm,
respectively.
Every 10-15 samples, standard checks and metals-free synthetic
rainwater blanks were read to ensure a less than 10% error and to track
quantifiable baseline shifts, respectively. Baseline shifts, as absorbance
measured using synthetic rainwater, were subtracted from sample absorbance,
accordingly. Samples that were outside of the calibration curve range were
32
diluted by mass using the Adventurer AX 324 (Ohaus, Parsippany, NJ) with
synthetic rainwater prior to analysis.
Sample pH readings were taken using a SympHony pH probe (VWR,
Radnor, PA) in combination with a 420A pH meter (Orion, Beverly, MA) or using
a HI 98190 pH/ORP meter (Hanna, Woonsocket, RI).
3.8.4 Digests
Filter media collected after binary metals solution column tests were
digested according to ISO 11466.3 method as outlined by Pena-Icart et al. (2011)
to quantify total metals concentrations. Sample size was increased from the
protocol (0.25 to 1 g) to achieve a more representative grab sample; acid
volumes were increased to reflect this change. The solids were air dried prior to
digestion. Samples were digested on Central Scientific hotplate (Chicago, Illinois)
and analyzed by AAS. Digest blanks and spikes were employed to account for
procedural background and recovery.
3.8.5 Data Analysis
3.8.5.1 Batch Experiments
In kinetic batch experiments, the overall uptake/removal of target heavy
metal in solution (reported as mass of metal removed relative to mass of sorbent)
was determined by mass difference for each time step at all ratios and
concentrations of copper and zinc. Based on a Visual MINTEQ analysis of metals
33
solution chemistry at solution pH equal to 6.2, performing a mechanistic analysis
of sorption in these experiments is complicated, at minimum, by the potential for
metal precipitate formation. Consequently, metal uptake herein is referred to as
removal. Metals removal was determined using the commonly employed mass
balance expression:
𝑚𝑒𝑡𝑎𝑙𝑠 𝑟𝑒𝑚𝑜𝑣𝑎𝑙 = 𝑞𝑡 =(𝐶𝑜−𝐶𝑡)𝑉
𝑚 (3)
where qt is the removal at time t (mg/g), Co is the initial solution concentration
(mg/L), Ct is the solution concentration at time t (mg/L), V is the volume of metals
solution (L) and m is the mass of the solids (g). Additionally, the percent of
metals removal was determined as follows:
% 𝑚𝑒𝑡𝑎𝑙𝑠 𝑟𝑒𝑚𝑜𝑣𝑎𝑙 = ((𝐶𝑜−𝐶𝑡)
𝐶𝑜∗ 𝑉) ∗ 100 (4)
with all variables as previously described.
Target metal removals were modeled using a pseudo second-order (PSO)
expression as described in Equation 5.
𝑡
𝑞𝑡=
1
𝑘2𝑞𝑒2 +
𝑡
𝑞𝑒 (5)
where qt is metals removal at time t (mg/g), qe is long-term, maximum, metals
removal (mg/g), and k2 is the second-order reaction rate coefficient (g/(mg-min)).
The values of k2 and qe describing the temporal variability and long-term,

34
maximum metals removal were determined using linear regression analysis of
measured mass removals expressed as t/qt (min g/mg) verse time (min).
The retardation factor (R), often used to qualify transport behavior of
reactive pollutants through porous media, was calculated using data collected
from the batch experiments as follows:
𝑅 = 1 + ρ𝑏 𝐾𝐷
∗
𝜃= 1 +
ρ𝑏 (𝑞𝑒𝐶𝑒
∗1000)
𝜃 (6)
where ρb is the medium’s measured dry bulk density (g/cm3), KD* is defined as
the apparent equilibrium distribution coefficient describing the overall distribution
of mass between sorbent and solution phase, qe is the measured equilibrium
(maximum) metals removal (mg/g), Ce equals the equilibrium solution
concentration of target heavy metal (mg/L), and is defined by the volumetric
water content of the filter medium.
3.8.5.2 Filtration Experiments
Moment analysis of measured breakthrough curves for target heavy metal
transport through the filter media was conducted to estimate mass removals and
to qualify overall transport behavior. The zeroth moment of measured, complete
breakthrough curves describes the total mass recovered and was calculated as
follows:
𝑀0 = ∫ 𝐶∗𝑑𝑇 = ∑ 𝐶∗ ̅̅ ̅̅ ∆𝑇 (7)
35
The first moment, providing information on the center of mass and its arrival time,
was calculated using:
𝑀1 = ∫ 𝐶∗𝑇𝑑𝑇 = ∑ 𝐶∗𝑇 ̅̅ ̅̅ ̅̅ ∆𝑇 (8)
The normalized first moment, representing the apparent residence time of the
system, was calculated as:
𝑀1
𝑀𝑜 =
∫ 𝐶∗𝑇𝑑𝑇
∫ 𝐶∗𝑑𝑇= ∑
𝐶∗𝑇̅̅ ̅̅ ̅∆𝑇
𝐶∗∆𝑇 (9)
In the above moment analysis, C* is nondimensional concentration (C/Co) and T
is nondimensional time expressed as pore volumes (PV).
The retardation factor was determined for those transport experiments
resulting in complete breakthrough curves (defined for those measured
breakthrough curves exhibiting complete mass recovery) using the corrected first
moment. For example, the retardation factor describing the transport of PFBA
through Perlite was calculated using Equation 10.
𝑅 = 𝑀1
𝑀𝑜 −
1
2𝑃𝑊 (10)
where M1 and M0 are as defined previously and PW is defined as the
nondimensional pulse width (i.e. the pore volumes of solution injected/input into
the column). Additionally, given complete breakthrough (with measured
concentrations in the effluent approaching C/Co = 1), estimates of the retardation

36
factor was determined by calculating the area above the measured arrival wave
using the following zero moment:
𝑀𝑜 = ∫(1 − 𝐶∗)𝑑𝑇 = ∑(1 − 𝐶∗) ̅̅ ̅̅ ̅̅ ̅̅ ̅̅ ̅̅ ∆𝑇 (11)
with all parameters as described previously.
Finally, an estimate of the long-term, maximum, metals removal (qe), as
defined previously, achieved following complete breakthrough (C/Co = 1) of target
metals through the filter media) was determined as the area above the measured
breakthrough curve for target metals relative to the column medium mass (see
Equation 12).
𝑀𝑜
𝑚=
∫(1−𝐶)𝑑𝑉
𝑚=
∑ 1−𝐶 ̅̅ ̅̅ ̅̅ ̅∆𝑉
𝑚 (12)
where C is the measured concentration of the target heavy metal (mg/L) and V is
the volume of solution pumped through the filter medium (L) and m is the total
mass of medium in the column (g).
3.8.5.3 Digests
The digests were used to estimate the metal removal and the percent
metals removal of the media in the Perlite and Earthlite™ RSSCT. In both
calculations, it was assumed there was uniform metals distribution in each layer.
The metals removal was calculated:

37
𝑚𝑒𝑡𝑎𝑙𝑠 𝑟𝑒𝑚𝑜𝑣𝑒𝑑 = ∑(
𝑚𝑚𝑒𝑡𝑎𝑙𝑚𝑠𝑜𝑙𝑖𝑑𝑠
∗𝑚𝑙𝑎𝑦𝑒𝑟)
𝑚 (13)
where mmetals is the mass of metals in the digest sample (mg), msolids is the mass
of solids in the digested sample (g), mlayer is the mass of solids in the layer (g)
and m is the total mass of solids in the column (g).
The percent metals removed was estimated from the following
relationship:
% 𝑚𝑒𝑡𝑎𝑙𝑠 𝑟𝑒𝑚𝑜𝑣𝑒𝑑 = (
𝑚𝑚𝑒𝑡𝑎𝑙𝑚𝑠𝑜𝑙𝑖𝑑𝑠
∗𝑚𝑙𝑎𝑦𝑒𝑟
𝑃𝑊∗𝐶𝑜) ∗ 100 (14)
where mmetals is the mass of metals in the digested sample (mg), msolids is the
mass of solids in the digested sample (g), mlayer is the mass of solids in the layer
(g), PW is the pulse width (L) and Co is the initial concentration (mg/L).
38
4. RESULTS AND DISCUSSION
4.1 Filtration Experiments
The measured effluent concentrations of target heavy metals reported in
the following discussion are of total metals and as such will be referred to as
copper and zinc throughout.
4.1.1 Nonreactive Tracer
Nonreactive tracer (NRT) experiments were performed to characterize the
overall hydrodynamics of fluid flow in the rapid small scale column tests. These
experiments also served to qualify the overall reproducibility between discrete
column tests. Tracer experiments conducted in duplicate on Perlite column 1
(P1) and Perlite column 2 (P2) yield similar arrival waves with a small,
reproducible degree of dispersion for each RSSCT, independent of discrete
packing and flowrate (Figure 5). These findings were further supported by
modeling results (e.g. moment analysis and numerical modeling to the advection
dispersion equation) of the overall physical hydrodynamics (results not shown).
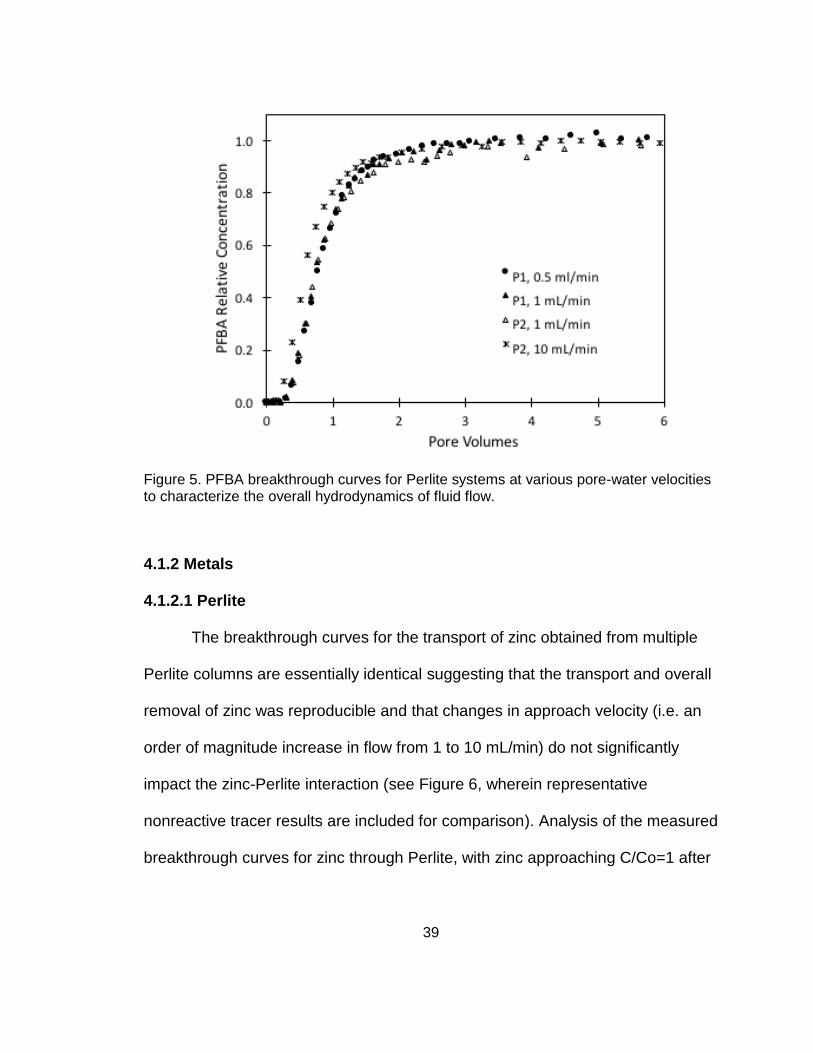
39
Figure 5. PFBA breakthrough curves for Perlite systems at various pore-water velocities to characterize the overall hydrodynamics of fluid flow.
4.1.2 Metals
4.1.2.1 Perlite
The breakthrough curves for the transport of zinc obtained from multiple
Perlite columns are essentially identical suggesting that the transport and overall
removal of zinc was reproducible and that changes in approach velocity (i.e. an
order of magnitude increase in flow from 1 to 10 mL/min) do not significantly
impact the zinc-Perlite interaction (see Figure 6, wherein representative
nonreactive tracer results are included for comparison). Analysis of the measured
breakthrough curves for zinc through Perlite, with zinc approaching C/Co=1 after
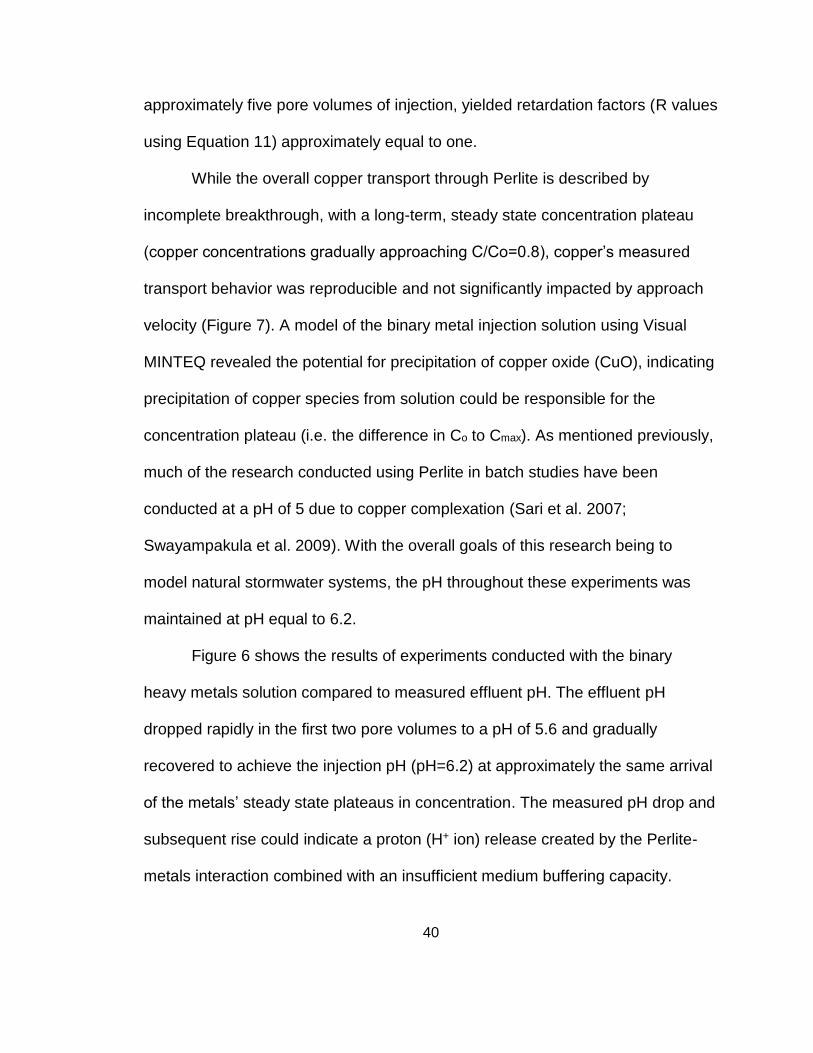
40
approximately five pore volumes of injection, yielded retardation factors (R values
using Equation 11) approximately equal to one.
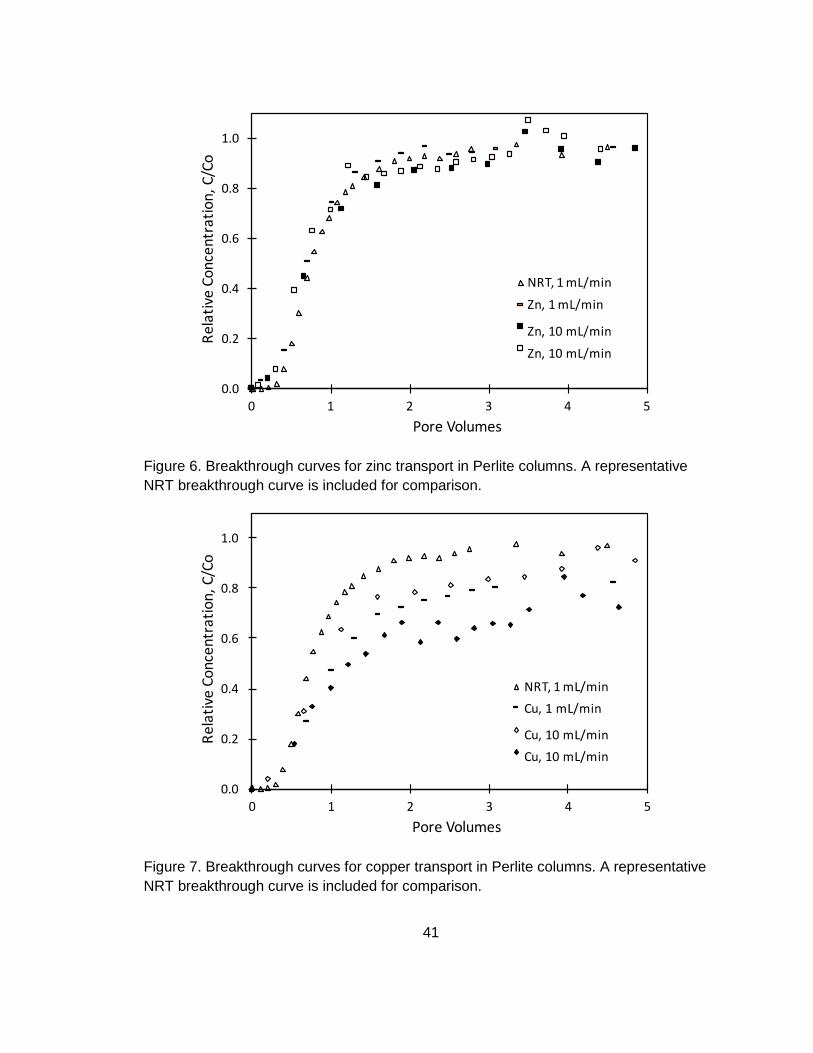
While the overall copper transport through Perlite is described by
incomplete breakthrough, with a long-term, steady state concentration plateau
(copper concentrations gradually approaching C/Co=0.8), copper’s measured
transport behavior was reproducible and not significantly impacted by approach
velocity (Figure 7). A model of the binary metal injection solution using Visual
MINTEQ revealed the potential for precipitation of copper oxide (CuO), indicating
precipitation of copper species from solution could be responsible for the
concentration plateau (i.e. the difference in Co to Cmax). As mentioned previously,
much of the research conducted using Perlite in batch studies have been
conducted at a pH of 5 due to copper complexation (Sari et al. 2007;
Swayampakula et al. 2009). With the overall goals of this research being to
model natural stormwater systems, the pH throughout these experiments was
maintained at pH equal to 6.2.
Figure 6 shows the results of experiments conducted with the binary
heavy metals solution compared to measured effluent pH. The effluent pH
dropped rapidly in the first two pore volumes to a pH of 5.6 and gradually
recovered to achieve the injection pH (pH=6.2) at approximately the same arrival
of the metals’ steady state plateaus in concentration. The measured pH drop and
subsequent rise could indicate a proton (H+ ion) release created by the Perlite-
metals interaction combined with an insufficient medium buffering capacity.
41
Figure 6. Breakthrough curves for zinc transport in Perlite columns. A representative
NRT breakthrough curve is included for comparison.
Figure 7. Breakthrough curves for copper transport in Perlite columns. A representative
NRT breakthrough curve is included for comparison.

42
Figure 8. Measured breakthrough curves for copper and zinc with a 24-hour flow
interrupt (represented by a vertical black line) at approxmently 20 pore volumes.
Representative effluent pH readings are included. Experiment was conducted at an
average flowrate equal to 10 mL/min.
The results of a 24-hour flow interrupt followed by continued injection of
the binary metals solution conducted on P3 are shown in Figure 8. Effluent
concentrations of both target metals decreased in the resident fluid followed by a
rapid return to pre-interruption concentrations in less than five pore volumes.
Analysis of rebounding metals concentrations assuming first order reaction
kinetics produced reaction rate constants (k1) of 0.0032/min with an R2 = 0.82
and 0.0028/min with an R2 = 0.59 for zinc and copper, respectively. These results
suggest physical sorption and/or ion exchange reactions occur during the static
state. The overall target metals’ transport behavior measured through Perlite
43
suggests that nonspecific sorption mechanisms dominate. The observed uptake
and evidence of mass loss (indicated by the measured steady-state plateau of
copper at C/Co=0.8, for example) in comparison to other studies published in the
literature could be due to the use of test parameters mimicking the natural
environment versus testing under optimized filtration conditions as commonly
reported in the literature (i.e. optimized pH, contact time, temperature and
sorbent dose) (e.g. Alkan and Dogan, 2001; Ghassabzadeh et al. 2010; Sari et
al. 2007).
4.1.2.2 Earthlite™
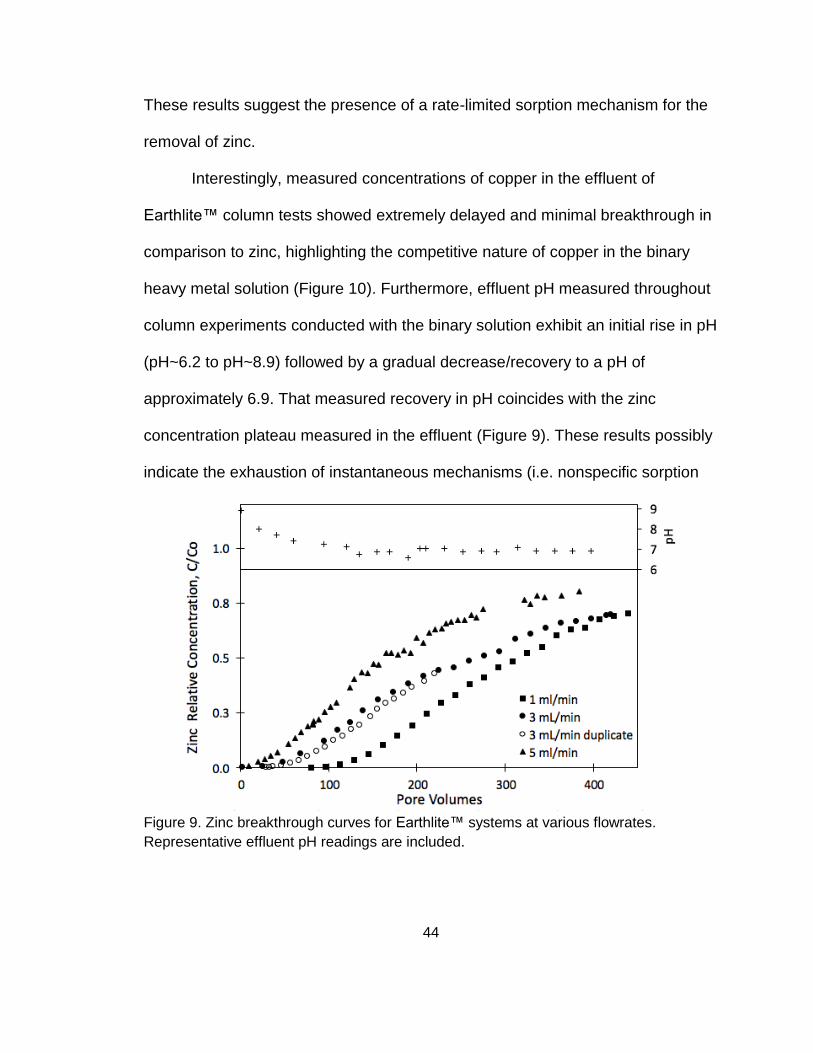
The measured arrival waves for the transport of zinc through Earthlite™
obtained from multiple rapid small-scale columns have comparable shapes yet
show an approach velocity dependent removal efficiency such that as fluid flow
decreases Earthlite™ exhibits greater overall removal efficiencies (see Figure 9).
For example, complete removal of zinc was measured after approximately 100
bed volumes at influent flowrate equal to 1 mL/min (with breakthrough of zinc
occurring thereafter), while said breakthrough occurred after approximately 30
bed volumes as the flowrate was increased to 5 mL/min. Additionally, apparent
retardation factors (using Equation 11) for zinc equaling 130 and 240 for
flowrates of 5 and 1 mL/min, respectively, support this trend, wherein the
measured transport of zinc through Earthlite™ is impacted by the fluid flowrate.
44
These results suggest the presence of a rate-limited sorption mechanism for the
removal of zinc.
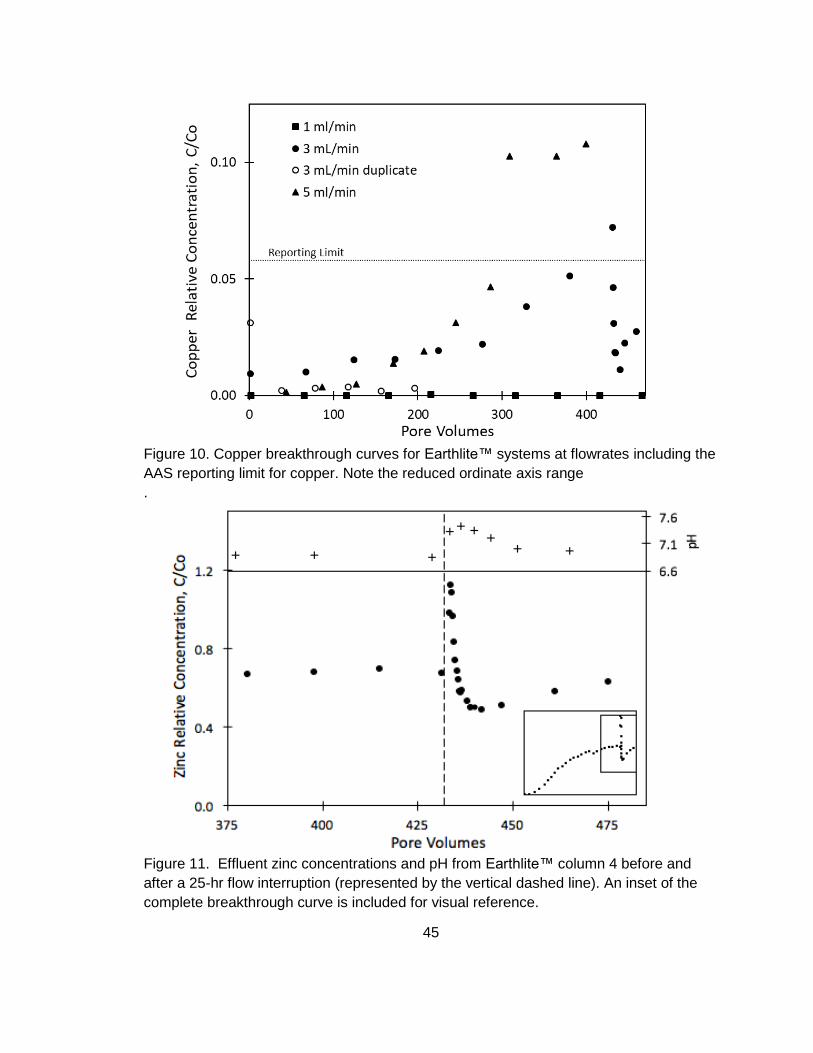
Interestingly, measured concentrations of copper in the effluent of
Earthlite™ column tests showed extremely delayed and minimal breakthrough in
comparison to zinc, highlighting the competitive nature of copper in the binary
heavy metal solution (Figure 10). Furthermore, effluent pH measured throughout
column experiments conducted with the binary solution exhibit an initial rise in pH
(pH~6.2 to pH~8.9) followed by a gradual decrease/recovery to a pH of
approximately 6.9. That measured recovery in pH coincides with the zinc
concentration plateau measured in the effluent (Figure 9). These results possibly
indicate the exhaustion of instantaneous mechanisms (i.e. nonspecific sorption
Figure 9. Zinc breakthrough curves for Earthlite™ systems at various flowrates.
Representative effluent pH readings are included.
45
Figure 10. Copper breakthrough curves for Earthlite™ systems at flowrates including the
AAS reporting limit for copper. Note the reduced ordinate axis range
.
Figure 11. Effluent zinc concentrations and pH from Earthlite™ column 4 before and
after a 25-hr flow interruption (represented by the vertical dashed line). An inset of the
complete breakthrough curve is included for visual reference.
46
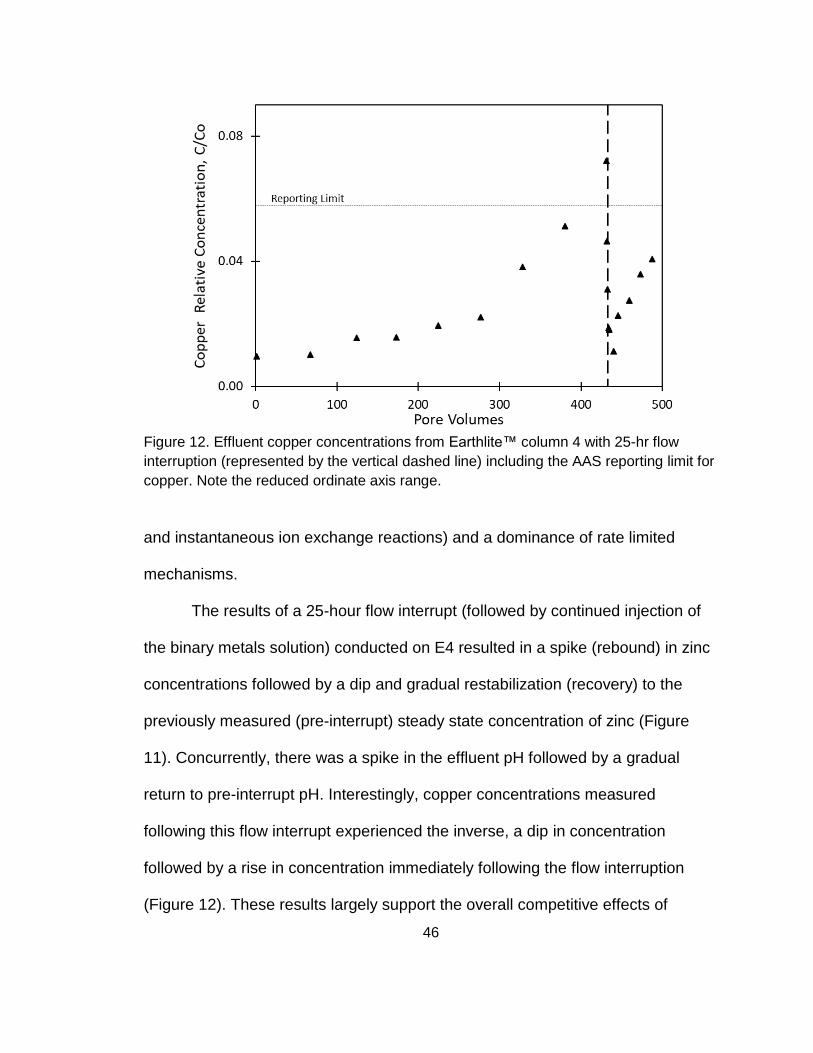
Figure 12. Effluent copper concentrations from Earthlite™ column 4 with 25-hr flow
interruption (represented by the vertical dashed line) including the AAS reporting limit for
copper. Note the reduced ordinate axis range.
and instantaneous ion exchange reactions) and a dominance of rate limited
mechanisms.
The results of a 25-hour flow interrupt (followed by continued injection of
the binary metals solution) conducted on E4 resulted in a spike (rebound) in zinc
concentrations followed by a dip and gradual restabilization (recovery) to the
previously measured (pre-interrupt) steady state concentration of zinc (Figure
11). Concurrently, there was a spike in the effluent pH followed by a gradual
return to pre-interrupt pH. Interestingly, copper concentrations measured
following this flow interrupt experienced the inverse, a dip in concentration
followed by a rise in concentration immediately following the flow interruption
(Figure 12). These results largely support the overall competitive effects of
47
copper. For example, copper overtook zinc’s occupied sites on the medium
resulting in a higher concentration of zinc in the resident fluid and a lower overall
copper concentration. Thereafter, additional binary metal solution (e.g. more
copper) was introduced creating a competitive takeover of additional zinc sites
which presented as elevated zinc (and decreased copper concentration) post
resident fluid flush (in comparison to pre-interrupt conditions). Moreover, the
observed post interrupt pH trend suggests ion exchange equilibrium occurred in
the static state (e.g. giving time for protons (H+ ions) to participate in the
interaction). Gu et al. (1995) saw similar competitive displacement and
concentration spikes in column experiments as sorption sites became limited
while the working solution contained multiple species with differing uptake
potentials (a snow plow effect).
4.1.2.3 Filter33™
The results from the initial Filter33™ RSSCT (F1) conducted at 3 mL/min
showed that after nearly 400 PV of binary metals solution injection, effluent
concentrations of both target heavy metals remained below reporting limits
(results not shown). Subsequently, columns F2 and F3 were conducted at an
increased flowrate (10 mL/min), one closely modeling (scaled for size) the
flowrates expected in the mobile treatment unit. The measured transport
behavior of zinc through the Filter33™ medium (columns F2 and F3) exhibited
similar overall behavior in that the initial zinc breakthrough began near 700 PV
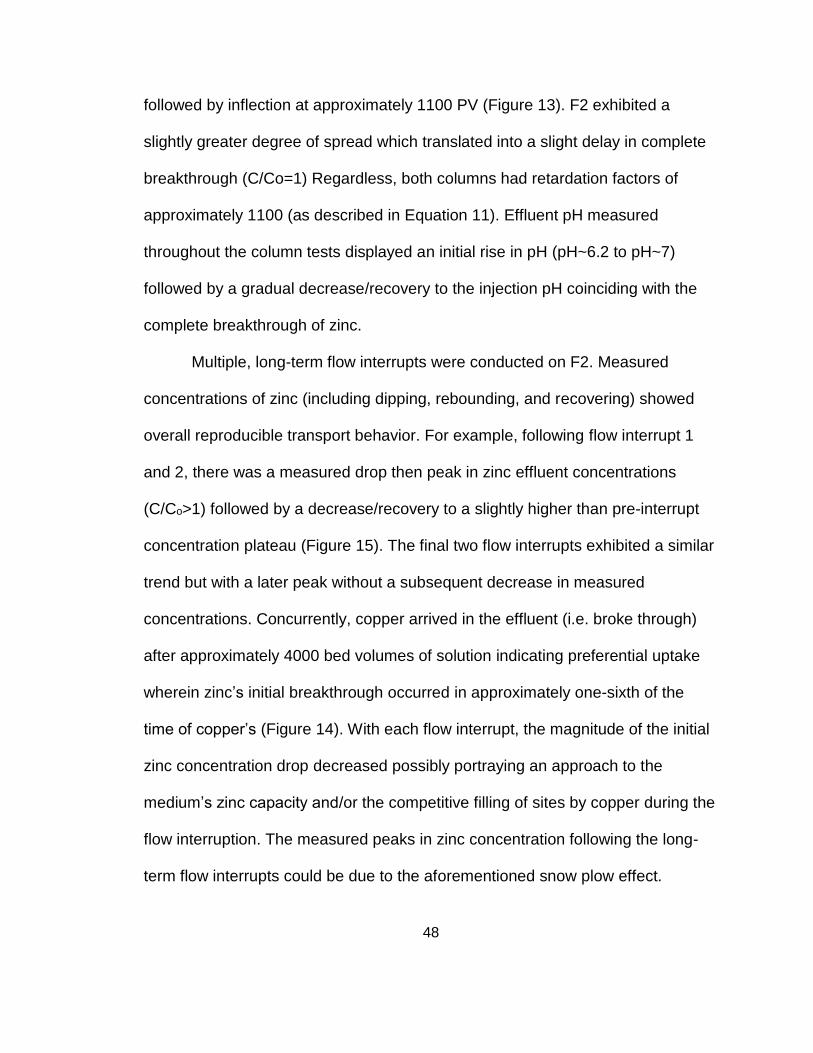
48
followed by inflection at approximately 1100 PV (Figure 13). F2 exhibited a
slightly greater degree of spread which translated into a slight delay in complete
breakthrough (C/Co=1) Regardless, both columns had retardation factors of
approximately 1100 (as described in Equation 11). Effluent pH measured
throughout the column tests displayed an initial rise in pH (pH~6.2 to pH~7)
followed by a gradual decrease/recovery to the injection pH coinciding with the
complete breakthrough of zinc.
Multiple, long-term flow interrupts were conducted on F2. Measured
concentrations of zinc (including dipping, rebounding, and recovering) showed
overall reproducible transport behavior. For example, following flow interrupt 1
and 2, there was a measured drop then peak in zinc effluent concentrations
(C/Co>1) followed by a decrease/recovery to a slightly higher than pre-interrupt
concentration plateau (Figure 15). The final two flow interrupts exhibited a similar
trend but with a later peak without a subsequent decrease in measured
concentrations. Concurrently, copper arrived in the effluent (i.e. broke through)
after approximately 4000 bed volumes of solution indicating preferential uptake
wherein zinc’s initial breakthrough occurred in approximately one-sixth of the
time of copper’s (Figure 14). With each flow interrupt, the magnitude of the initial
zinc concentration drop decreased possibly portraying an approach to the
medium’s zinc capacity and/or the competitive filling of sites by copper during the
flow interruption. The measured peaks in zinc concentration following the long-
term flow interrupts could be due to the aforementioned snow plow effect.
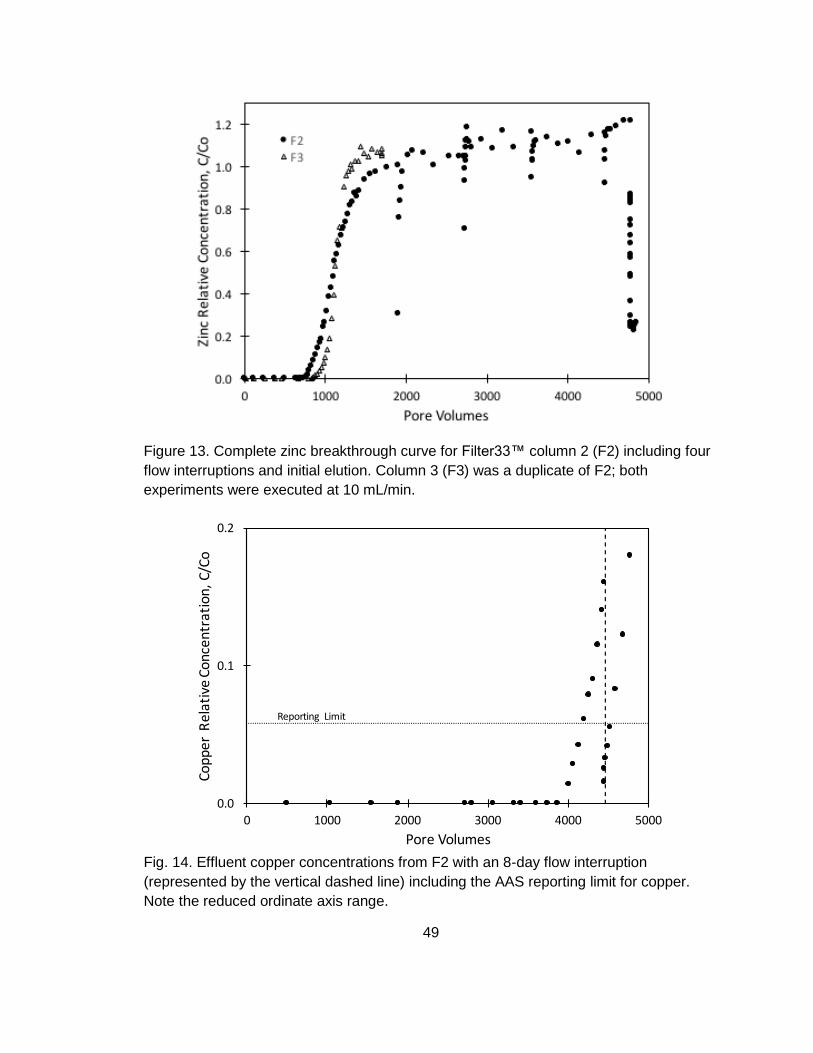
49
Figure 13. Complete zinc breakthrough curve for Filter33™ column 2 (F2) including four
flow interruptions and initial elution. Column 3 (F3) was a duplicate of F2; both
experiments were executed at 10 mL/min.
Fig. 14. Effluent copper concentrations from F2 with an 8-day flow interruption
(represented by the vertical dashed line) including the AAS reporting limit for copper.
Note the reduced ordinate axis range.
0.0
0.1
0.2
0 1000 2000 3000 4000 5000
CopperRelativeConcentration,C/Co
PoreVolumes
Reporting Limit

50
Interestingly, during the flow interrupts and subsequent reinjections, pH
measured in the effluent remained relatively constant at an average of 6.04
0.04 possibly indicating a spent/small ion exchange capacity such that the
medium is no longer buffering the solution. Furthermore, as the columns were
subsequently eluted with heavy metal-free synthetic rainwater solution, the
effluent pH held around 6 while the influent pH dropped to approximately 5.3
suggesting elution desorption with a resulting ion exchange potential (i.e. an
opening of sites for the H+ ion).
Elution experiments conducted on F2 and F3 (results shown in Figure 16)
again show similar overall transport behavior for zinc, independent of resident
zinc concentrations in the filter media (with greater than 790 g of zinc loaded on
F2 compared to 270 g on F3). The initial F2 elution displayed a dip, spike, dip,
then elution tailing trend that was mimicked in a smaller overall magnitude in the
subsequent F2 elutions; F3 elutions displayed a comparable trend at lower
concentrations (Figure 16). These results suggest that magnitude of the elution
trend and tailing concentration are related to the overall mass loaded, both being
greater for F2. Additionally, the tailing concentrations could indicate a portion of
rate limited desorption, more specifically, Caetano et al. (2009) suggested that
elution tailing concentrations demonstrate the presence of an ion exchange
controlled desorption process.

51
Figure 15. Effluent zinc concentrations from F2 during four discrete flow interruptions.
Note that time zero on the abscissa represents the end of the first flow interruption (FI 1)
and the beginning of the first reinjection.
Figure 16. Zinc elutions for Filter33™ systems executed as follows. F2: 45 PV at 10
mL/min, 25 PV at 0.5 mL/min, 3-day flow interrupt, 5 PV at 10 mL/min. F3: synthetic
rainwater (50 PV), nanopure water (50 PV), 12-day flow interrupt, nanopure water (50
PV), 20-day flow interrupt, synthetic rainwater (35 PV). Note that time zero on the
abscissa represents the end of the binary metals solution injection and the beginning of
the elutions.
0.0
0.2
0.4
0.6
0.8
1.0
1.2
0 500 1000 1500 2000 2500
ZincRelativeConcentration
PoreVolumes
FI1- 7days
FI2- 8days
FI3- 6days
FI4- 8days
0.0
0.3
0.5
0.8
1.0
0 50 100 150
ZincRelativeConcentration,C/Co
PoreVolumes
F2
F3
52
4.1.3 Pentafluorobenzoic Acid
4.1.3.1 Earthlite™
A PFBA arrival on Earthlite™ column 5 (E5) showed early breakthrough
and appeared to reach a concentration plateau of C/Co = 0.6 after 12 pore
volumes. These results indicate chemical reactions ongoing between this target
organic acid species and the Earthlite™ filter medium. Batch experiments aimed
to qualify the potential reaction between Earthlite™ and PFBA showed similar
reaction chemistry. The arrival wave exhibited significant nonideality with a
rounded front possibly indicating biodegradation mass loss possibly due to
microbial content in the proprietary composite Earthlite™ filter medium.
4.1.3.2 Filter33™
Batch (static) experiments aimed to qualify the potential reaction between
Filter33™ and PFBA showed negligible reaction chemistry. On the other hand,
the results of column (kinetic) experiments conducted with PFBA through
Filter33™ (F2 and F3 following complete characterization of target metal
removal) indicate reproducible reaction chemistry and kinetics with PFBA
concentrations plateauing at approximately C/Co=0.8 (i.e. without complete
breakthrough) followed by an early elution concentration spike (Figure 17).
Normalizing the measured effluent PFBA concentrations in F2 and F3 to their
respective maximum concentrations and retardation factors, the PFBA
breakthrough curves display a similar shape and inflection point again indicating
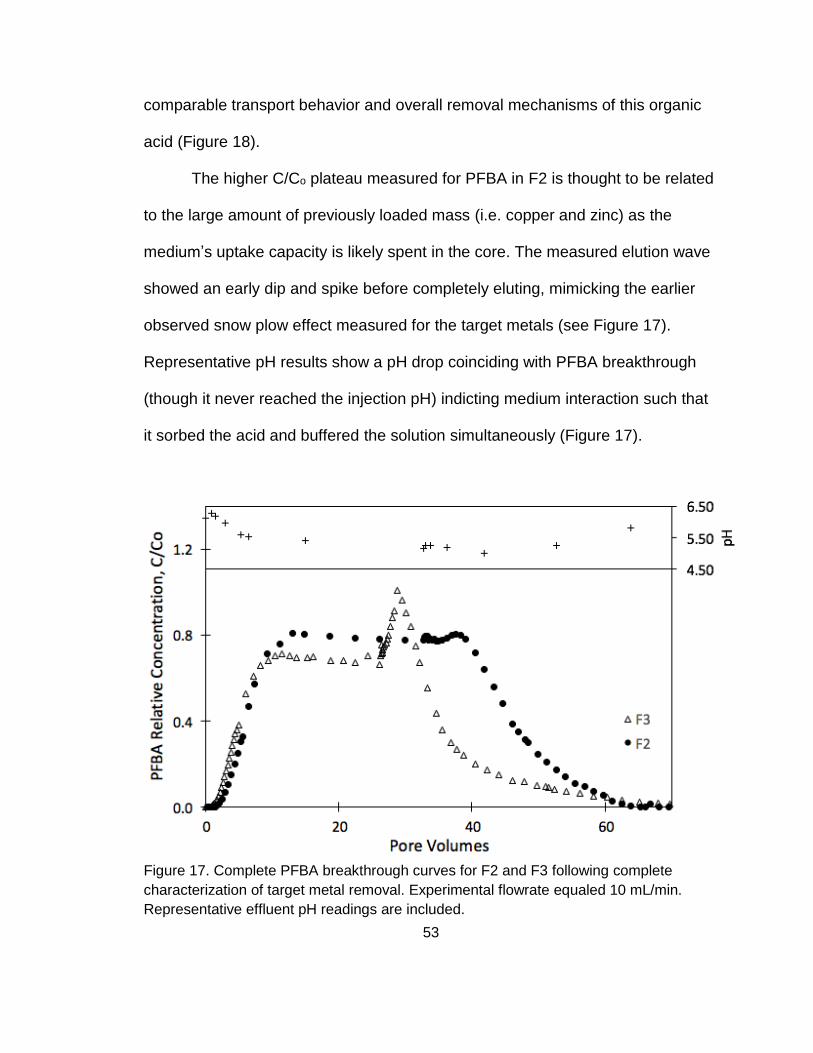
53
comparable transport behavior and overall removal mechanisms of this organic
acid (Figure 18).
The higher C/Co plateau measured for PFBA in F2 is thought to be related
to the large amount of previously loaded mass (i.e. copper and zinc) as the
medium’s uptake capacity is likely spent in the core. The measured elution wave
showed an early dip and spike before completely eluting, mimicking the earlier
observed snow plow effect measured for the target metals (see Figure 17).
Representative pH results show a pH drop coinciding with PFBA breakthrough
(though it never reached the injection pH) indicting medium interaction such that
it sorbed the acid and buffered the solution simultaneously (Figure 17).
Figure 17. Complete PFBA breakthrough curves for F2 and F3 following complete
characterization of target metal removal. Experimental flowrate equaled 10 mL/min.
Representative effluent pH readings are included.

54
Figure 18. PFBA arrival waves for F2 and F3 normalized to their respective maximum
concentrations on the ordinate and scaled by the retardation factor on the abscissa.
These adjustments allow for direct comparison of transport behavior.
4.2 Filtration Experiment Comparison
4.2.1 Competitive Displacement
For all filter media tested herein, Perlite, Earthlite™ and Filter33™, there
was a consistent preferential uptake of copper during the initial injection of the
binary metals solution. In addition, flow interrupts conducted in Earthlite™ and in
Filter33™ media resulted in a decrease in copper concentrations followed by a
marked spike (C/Co>1) in zinc concentrations. As previously mentioned, this drop
in copper concentrations could indicate a competitive takeover of reactive sites
on or in the filter medium during the static (no-flow) state followed by a continued
0.0
0.2
0.4
0.6
0.8
1.0
0 1 2 3
PFBARelativeConcentration,C/Cmax
ScaledPoreVolumes
F2
F3

55
site dominance as new solution (e.g. more copper) was introduced to the system
causing a subsequent resulting spike in zinc concentrations. Copper is small,
highly reactive in its ionic form and is more stable as a complex in comparison to
zinc thus an uptake preference to these composite filter media was as expected.
4.2.2 Snow plow Effects
Snow plow effects have been seen in numerous studies under different
scenarios (i.e. at exchange capacity, with large changes in injection
concentration, competitive displacement) suggesting that multiple factors can
contribute to the phenomena. When working with metal ions, Vaaramaa et al.
(2003) noted effluent concentrations exceeding initial concentrations suggesting,
when at exchange capacity, there is a release of less preferred ions. Selim et al.
(1992) saw a prominent snow plow effect following a large change in the
concentration of the injection solution (i.e. eluting after an injection) and theorizes
that this concentration change causes the matrix to release sorbed species
creating a spike in effluent concentration (Starr et al. 1979). Finally, Gu et al.
(1995) saw competitive displacement as sorption sites became limited while the
working solution contained multiple species with differing uptake potentials.
The most prominent snow plow effects were observed after a flow
interrupt was conducted in Earthlite™ and during the metals elution and PFBA
elution in Filter33™ (F2 and F3, respectively) (see Figure 19). The Earthlite™

56
snow plow is thought to indicate a competitive site takeover by copper during the
flow
Figure 19. Observed snow plow effects in Filter33™ (F2 and F3) and Earthlite™ (E4).
Note that time zero on the abscissa represents the end of a flow interruption and the
beginning of a reinjection.
interruption compounded by an almost full ion capacity. The results of the snow
plows measured in Filter33™ elutions suggest that the change in injection
concentration and a competitive ion site takeover could have both contributed to
the snow plow due to pre elution flow interrupts (each lasting approximately 29
and 13 days for F2 and F3, respectively). The results of multiple flow interrupts
conducted on Filter33™ (during the F2 metals injection) showed a small degree
of snow plow effects, though it was less instantaneous and significant/obvious
suggesting less redistribution and competitive effects of copper as compared to
0.0
0.3
0.5
0.8
1.0
1.3
0 5 10 15 20
RelativeConcentration,C/Co
PoreVolumes
F2- Metalselution
F3- PFBAelution
E4- MetalsFI

57
those measured with Earthlite™. Additionally, a larger part of Earthlite™’s
sorption could be participating in ion exchange thus its post interrupt peak is due
to both ion-exchange and sorption mechanisms, creating a peak more noticeable
than those observed after the Filter33™ flow interrupts.
4.2.3 Concentration Plateau
A concentration plateau trend was observed during the Earthlite™ target
metals and PFBA injections and during the Filter33™ PFBA injection possibly
suggesting mass loss behavior/mechanisms in the two media. Comparing the
overall transport behavior measured for PFBA in Earthlite™ compared to
Filter33™ shows markedly different arrival waves (breakthrough behavior) in the
two media. The nonideal shape of the arrival wave of PFBA through Earthlite™
suggests the early PFBA removal mechanisms are slightly disparate for the two
media though they both display a similar long-term concentration plateau (Figure
20). Theoretically, it is possible that initially only a portion of the sites are
participating in uptake and a significant portion of sorption is rate limited such
that as C/Co approaches 0.6 all of the sites are participating in uptake creating
the long-term plateau. Future studies are warranted to further characterize these
findings.

58
Figure 20. PFBA arrival waves for Filter33™ (F2 and F3) and Earthlite™ (E4), scaled by
their retardation factors on the abscissa. These adjustments allow for direct comparison
of transport behavior.
4.3 Column Digests
Digests were performed on the Perlite and Earthlite™ column media to
characterize the metals distribution within each column as percent removal and
removal using equations 13 and 14, respectively.
4.3.1 Perlite
The digests performed for columns P1 and P2 were grab samples from
the entire core while P3 was quartered with sub samples being pulled from each
quarter. P1 and P3 displayed similar zinc removal values; P2 removal was
double that of the other two columns (see Table 5). The increase of removal for
0.0
0.2
0.4
0.6
0.8
1.0
0 1 2 3
PFBARelativeConcentration,C/Co
ScaledPV
F2
F3
E5
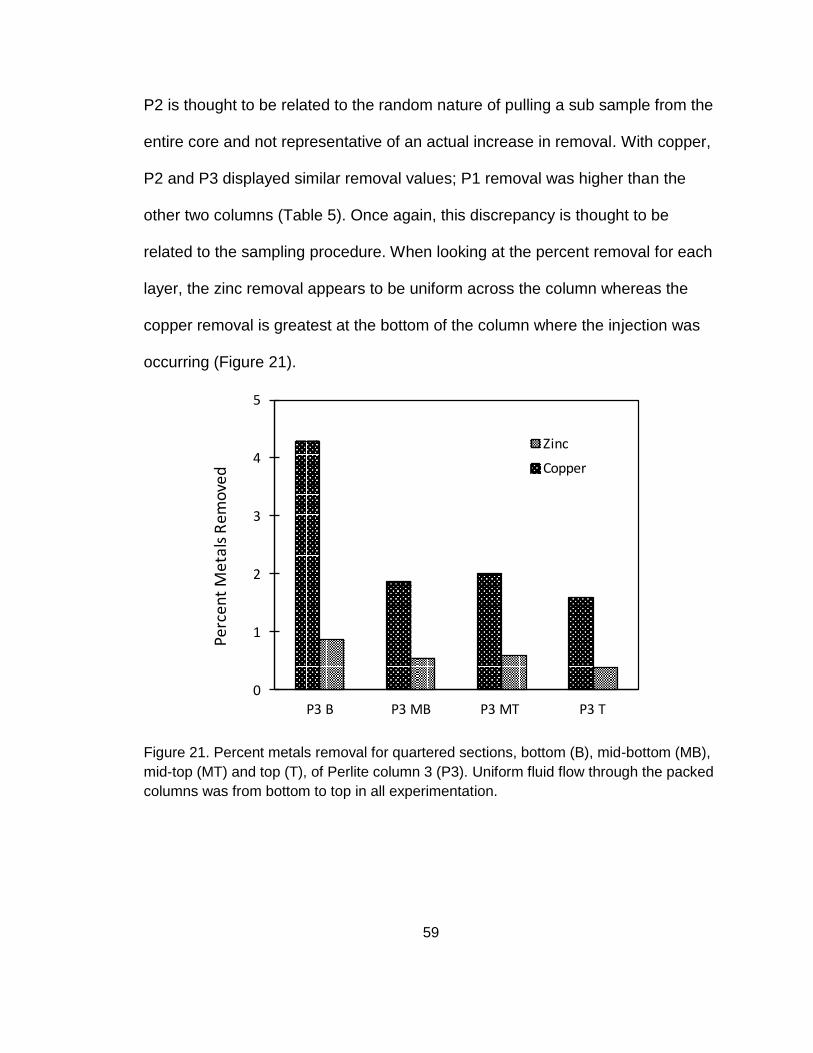
59
P2 is thought to be related to the random nature of pulling a sub sample from the
entire core and not representative of an actual increase in removal. With copper,
P2 and P3 displayed similar removal values; P1 removal was higher than the
other two columns (Table 5). Once again, this discrepancy is thought to be
related to the sampling procedure. When looking at the percent removal for each
layer, the zinc removal appears to be uniform across the column whereas the
copper removal is greatest at the bottom of the column where the injection was
occurring (Figure 21).
Figure 21. Percent metals removal for quartered sections, bottom (B), mid-bottom (MB),
mid-top (MT) and top (T), of Perlite column 3 (P3). Uniform fluid flow through the packed
columns was from bottom to top in all experimentation.
0
1
2
3
4
5
P3TP3MTP3MBP3B
PercentMetalsRem
oved
Zinc
Copper

60
Figure 22. Percent zinc removal for quartered sections, bottom (B), mid-bottom (MB),
mid-top (MT) and top (T), of the Earthlite™ columns. Uniform fluid flow through the
packed columns was from bottom to top in all experimentation.
Figure 23. Percent copper removal for quartered sections, bottom (B), mid-bottom (MB),
mid-top (MT) and top (T), of the Earthlite™ columns. Uniform fluid flow through the
packed columns was from bottom to top in all experimentation.
61
4.3.2 Earthlite™
Digests conducted for RSSCT done for Earthlite™ (E2) included a grab
sample from the entire core and the other Earthlite™ columns (E1, E3 and E4)
were quartered with subsamples being pulled from each quarter. The zinc digest
removals appeared to correlate with the amount of mass loaded such that as
more mass is loaded, the removal increases (Table 4). A similar trend is seen for
the copper removal except for E2 which is probably related to the composite core
sample. As for percent removal, the bottom three layers have an average zinc
removal of 15% and the top layer has an average removal of 8% (Figure 22). All
the columns have the lowest percent copper removal in the top layer with a
gradual ascension to the highest in the bottom layer and the percent removals
are greater than zinc’s in the bottom and mid bottom layers (Figure 23). The
metals distribution could indicate available zinc sorption capacity remaining in the
top column layer only whereas copper appears to have remaining capacity in all
but the bottom layer. If more mass had been loaded on the columns, it is possible
that the copper would have started to displace zinc as it worked up through the
column.
The overall metal’s removal estimated from column digests for each
column was compared to the removals measured in RSSCT calculated using
Equation 12 (Table 4). The Perlite copper digest and RSSCT removal averages
are 0.011 0.002 and 0.015 0.002 mg/g, respectively. The Perlite zinc digest
removal and RSSCT removal averages are 0.022 0.006 and 0.025 0.002
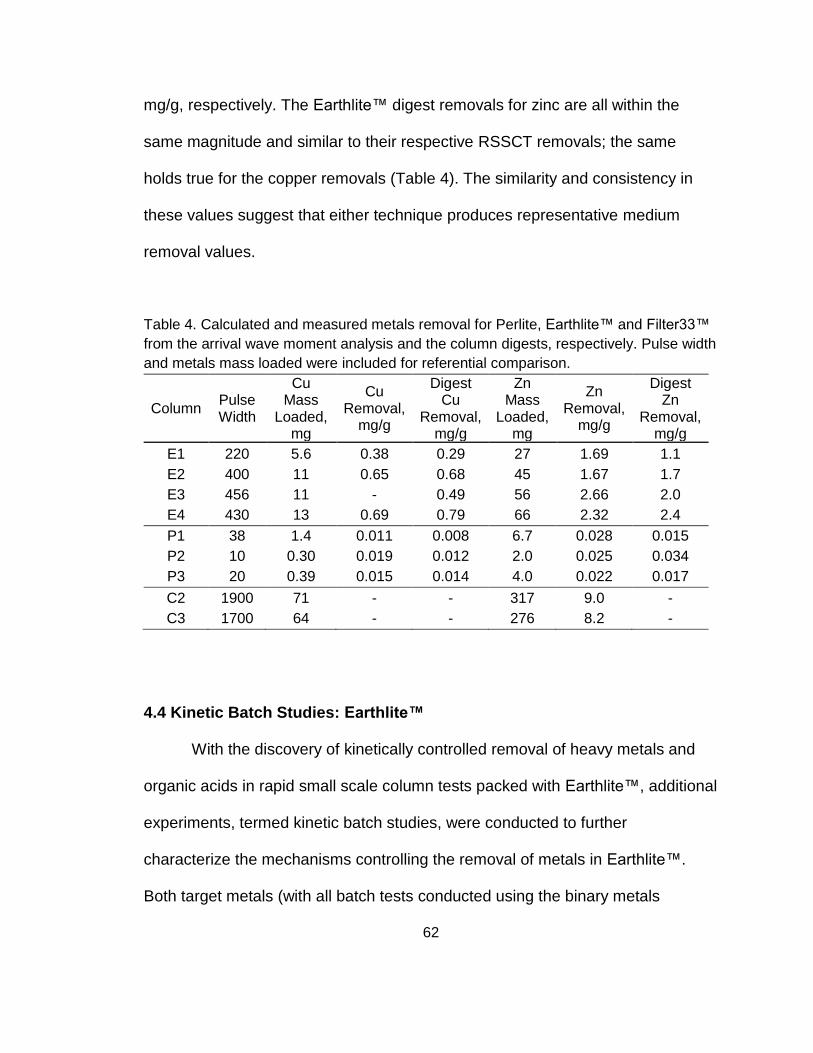
62
mg/g, respectively. The Earthlite™ digest removals for zinc are all within the
same magnitude and similar to their respective RSSCT removals; the same
holds true for the copper removals (Table 4). The similarity and consistency in
these values suggest that either technique produces representative medium
removal values.
Table 4. Calculated and measured metals removal for Perlite, Earthlite™ and Filter33™
from the arrival wave moment analysis and the column digests, respectively. Pulse width
and metals mass loaded were included for referential comparison.
Column Pulse Width
Cu Mass
Loaded, mg
Cu Removal,
mg/g
Digest Cu
Removal, mg/g
Zn Mass
Loaded, mg
Zn Removal,
mg/g
Digest Zn
Removal, mg/g
E1 220 5.6 0.38 0.29 27 1.69 1.1
E2 400 11 0.65 0.68 45 1.67 1.7
E3 456 11 - 0.49 56 2.66 2.0
E4 430 13 0.69 0.79 66 2.32 2.4
P1 38 1.4 0.011 0.008 6.7 0.028 0.015
P2 10 0.30 0.019 0.012 2.0 0.025 0.034
P3 20 0.39 0.015 0.014 4.0 0.022 0.017
C2 1900 71 - - 317 9.0 -
C3 1700 64 - - 276 8.2 -
4.4 Kinetic Batch Studies: Earthlite™
With the discovery of kinetically controlled removal of heavy metals and
organic acids in rapid small scale column tests packed with Earthlite™, additional
experiments, termed kinetic batch studies, were conducted to further
characterize the mechanisms controlling the removal of metals in Earthlite™.
Both target metals (with all batch tests conducted using the binary metals
63
solution) yielded an overall greater maximum removal as initial solution
concentration increased (as described by Equation 3) (Figures 24 and 25). These
findings agree with kinetic biochar/heavy metal batch tests presented by
Kolodynska et al. (2012) and Liu and Zhang (2009). Supporting those results
found in column experiments, copper exhibited greater, preferential removal in
the presence of Earthlite™ with copper’s removal efficiency (Equation 4)
measured in batch almost immediately approaching 97-99%, greater than the
highly time dependent removal for zinc of approximately 50-90%(Figures 26 and
27). The copper concentration and percent removal increase slightly over the 24
hour test period, achieving nearly instantaneous equilibrium concentrations in the
presence of Earthlite™, whereas zinc showed marked kinetically controlled
behavior (e.g. significant, nonlinear increases in removal as contact time
increases from 5 to 200 min).
Various studies reported in the literature have shown metals uptake to
biochar is well described by the pseudo second order (PSO) equation (Equation
5) (e.g. Kolodynska et al. 2012, Liu and Zhang 2009, Chen et al. 2011). The PSO
model fits the zinc data well (R2 > 0.99) suggesting that specific sorption is taking
place (Table 5). Likewise, average calculated retardation factors (R values in
Equation 6) of 4420 and 221 for copper and zinc, respectively, indicate a
significant preferential uptake for copper reinforcing the observed competitive
effects and apparent instantaneous equilibrium of copper (Table 6).

64
Figure 24. Measured and modeled zinc removal in Earthlite™ kinetic batch tests at
various initial concentrations of the binary metals solution.
Figure 25. Measured copper removal in Earthlite™ kinetic batch tests at various initial
concentrations of the binary metals solution.
0.0
0.2
0.4
0.6
0.8
1.0
1.2
0 500 1000 1500
ZincRemoved,mg/g
Time,min
Cu30/Zn118
Cu19/Zn101
Cu22/Zn99
Cu23/Zn54
0.0
0.1
0.2
0.3
0.4
0 500 1000 1500
CopperRem
oved,m
g/g
Time,min
Cu30/Zn118
Cu19/Zn101
Cu22/Zn99
Cu23/Zn54
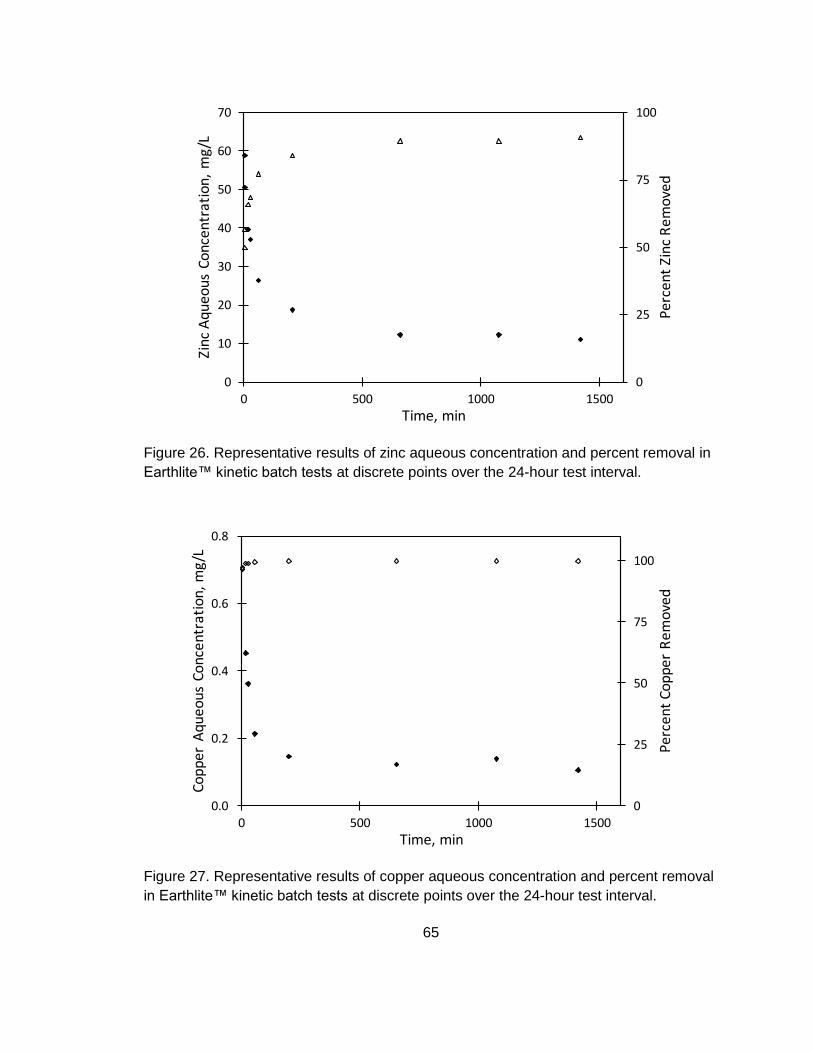
65
Figure 26. Representative results of zinc aqueous concentration and percent removal in
Earthlite™ kinetic batch tests at discrete points over the 24-hour test interval.
Figure 27. Representative results of copper aqueous concentration and percent removal
in Earthlite™ kinetic batch tests at discrete points over the 24-hour test interval.
0
25
50
75
100
0
10
20
30
40
50
60
70
0 500 1000 1500
PercentZincRemoved
ZincAqueousConcentration,mg/L
Time,min
0
25
50
75
100
0.0
0.2
0.4
0.6
0.8
0 500 1000 1500
PercentCopperRem
oved
CopperAqueousConcentration,m
g/L
Time,min
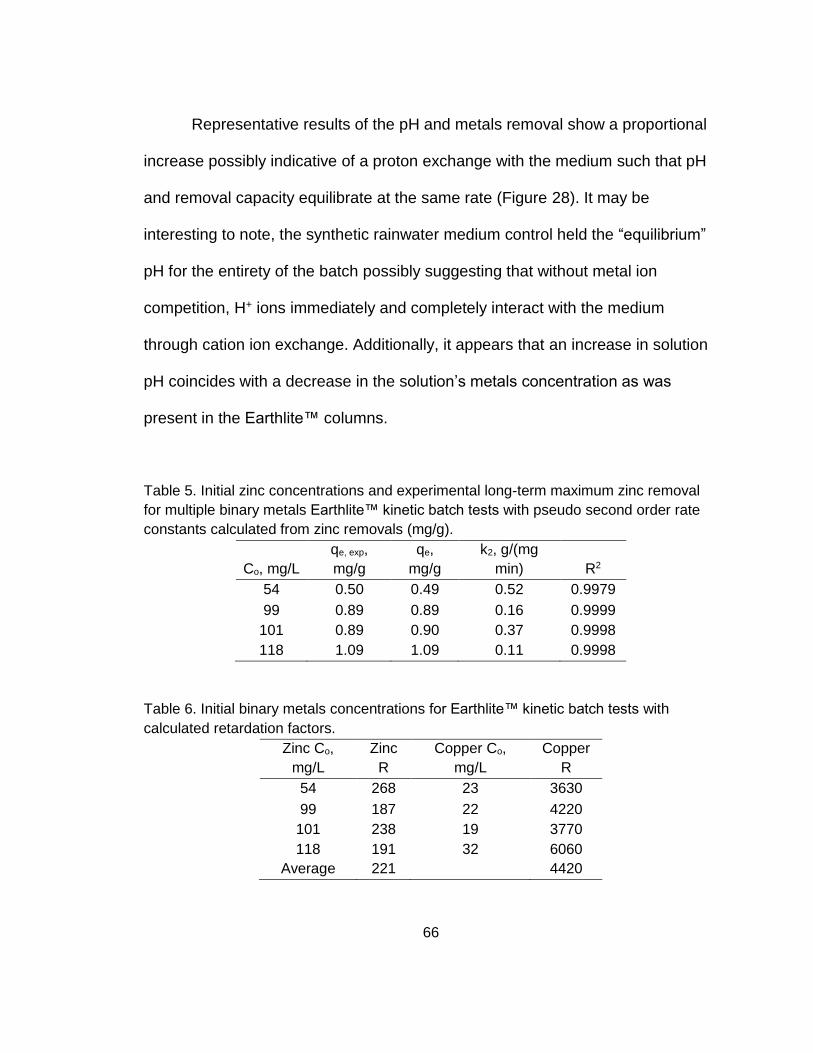
66
Representative results of the pH and metals removal show a proportional
increase possibly indicative of a proton exchange with the medium such that pH
and removal capacity equilibrate at the same rate (Figure 28). It may be
interesting to note, the synthetic rainwater medium control held the “equilibrium”
pH for the entirety of the batch possibly suggesting that without metal ion
competition, H+ ions immediately and completely interact with the medium
through cation ion exchange. Additionally, it appears that an increase in solution
pH coincides with a decrease in the solution’s metals concentration as was
present in the Earthlite™ columns.
Table 5. Initial zinc concentrations and experimental long-term maximum zinc removal
for multiple binary metals Earthlite™ kinetic batch tests with pseudo second order rate
constants calculated from zinc removals (mg/g).
Co, mg/L
qe, exp,
mg/g
qe,
mg/g
k2, g/(mg
min) R2
54 0.50 0.49 0.52 0.9979
99 0.89 0.89 0.16 0.9999
101 0.89 0.90 0.37 0.9998
118 1.09 1.09 0.11 0.9998
Table 6. Initial binary metals concentrations for Earthlite™ kinetic batch tests with
calculated retardation factors.
Zinc Co,
mg/L
Zinc
R
Copper Co,
mg/L
Copper
R
54 268 23 3630
99 187 22 4220
101 238 19 3770
118 191 32 6060
Average 221 4420
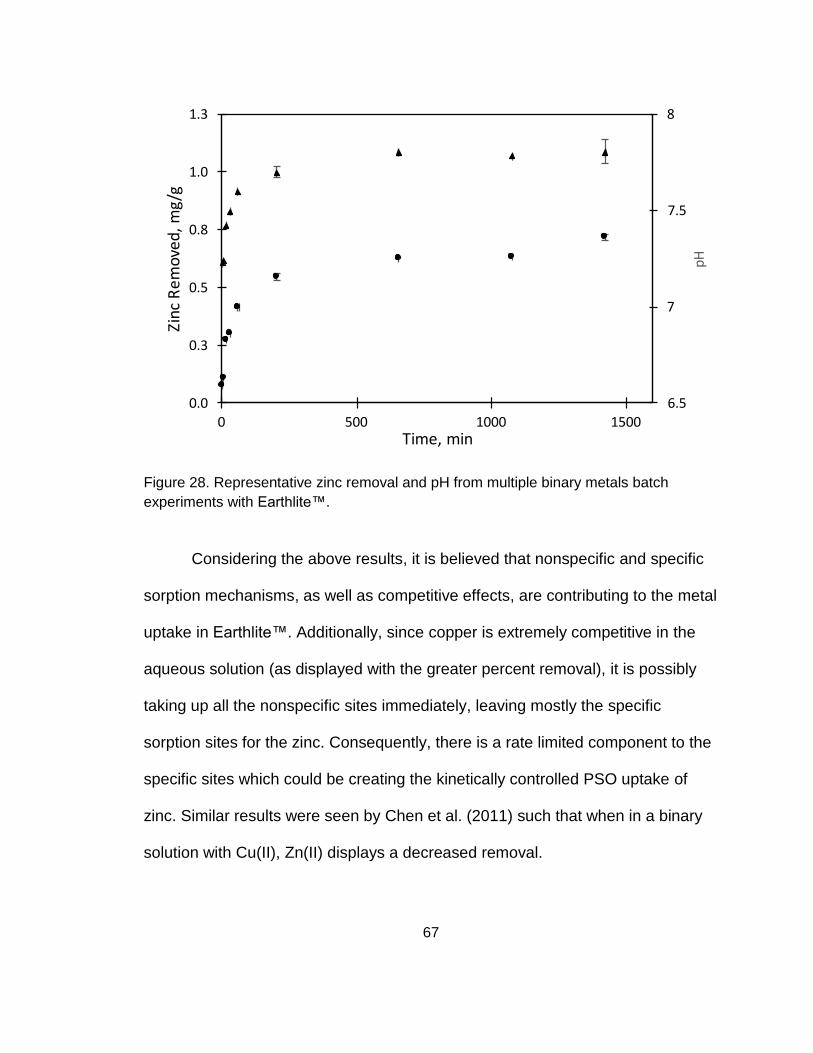
67
Figure 28. Representative zinc removal and pH from multiple binary metals batch
experiments with Earthlite™.
Considering the above results, it is believed that nonspecific and specific
sorption mechanisms, as well as competitive effects, are contributing to the metal
uptake in Earthlite™. Additionally, since copper is extremely competitive in the
aqueous solution (as displayed with the greater percent removal), it is possibly
taking up all the nonspecific sites immediately, leaving mostly the specific
sorption sites for the zinc. Consequently, there is a rate limited component to the
specific sites which could be creating the kinetically controlled PSO uptake of
zinc. Similar results were seen by Chen et al. (2011) such that when in a binary
solution with Cu(II), Zn(II) displays a decreased removal.
6.5
7
7.5
8
0.0
0.3
0.5
0.8
1.0
1.3
0 500 1000 1500
pH
ZincRemoved,mg/g
Time,min
68
5. CONCLUSION
The results of filtration experiments conducted using various filter media
indicate that the transport of metals in Perlite is primarily impacted by nonspecific
sorption whereas in Earthlite™ and Filter33™ both nonspecific and specific
sorption are present. For all media and experimentation, there was a consistent
preferential uptake of copper such that copper displayed delayed arrival and/or
greater percent removal than zinc. Moreover, the observed snow plow effects
and concentration plateaus in Earthlite™ and Filter33™ RSSCT suggest rate
limited ion exchange and specific sorption in addition to ion competition.
Supporting those results found in column experiments, copper exhibited greater,
preferential removal in the presence of Earthlite™ with copper’s removal
efficiency measured in batch almost immediately approaching 97-99%, greater
than the highly time dependent removal for zinc of approximately 50-90%.
Due to copper’s significantly retarded breakthrough in the RSSCT, the
following medium removal comparison was based solely on zinc. Perlite had
negligible zinc removal, averaging 0.025 0.002 mg/g. The zinc removal
obtained for Earthlite™ showed an approach velocity dependent removal
efficiency such that as fluid flow decreased Earthlite™ exhibited greater overall
removal efficiencies. For example, the zinc removals were 1.60 and 2.60 mg/g at
flow rates of 5 and 1 mL/min. This trend is also supported by the retardation
factors (130 and 240 at 5 and 1 mL/min) and the results of column digests.
Filter33™ displayed the greatest average zinc removal of 8.6 mg/g supported by
69
its retardation factor of 1100. Earthlite™ and Filter33™ showed organic acid
removal capabilities with estimated retardation factors of 2.4 and 5.3,
respectively. Further research in necessary to better characterize the observed
acid-medium interactions.
When applying these results to expected performance for a mobile media
filtration system, removal must be viewed alongside flow rate due to proposed
system conditions (i.e. pumping flow rates). Perlite and Filter33™ could handle
the upper flow rate of 10 mL/min (the lab scale equivalent of the proposed field
scale flow); Earthlite™’s maximum flow was 5 mL/min. Considering flow,
measured copper and zinc removals and proposed TSS removal, Perlite and
Filter33™ could possibly work well in series (i.e. a treatment train approach to
stormwater management) wherein a Perlite filter removes TSS before the
stormwater is introduced to Filter33™, potentially prolonging the life and
efficiency of the system. Future studies are warranted to investigate the feasibility
of the proposed series configuration using synthetic stormwater. In addition,
system operators need to be aware of the possibility of concentration spikes after
a system flow interruption and recirculation of at least the first bed volume is
advised. Moreover, the Filter33™ elution results indicate that medium
regeneration (i.e. desorption) potential is correlated to the previously loaded
mass thus delays/lapses in medium maintenance could result in lengthy or
incomplete regeneration. In all, this research indicates that test parameters (i.e.
pH, competitive ions solutions, empty bed contact time, flow rate) based on the

70
natural environment and field scale operation can greatly impact removal
efficiency in filter media.

71
REFERENCES
Alkan, M., and Doǧan, M. (2001). Adsorption of copper(II) onto perlite. Journal of Colloid and Interface Science, 243(2), 280–291. https://doi.org/10.1006/jcis.2001.7796
American Public Heath Association (APHA) (2012). Standard Methods for the
Examination of Water and Wastewater, 22nd edn. Washington, DC: American Public Heath Association.
ASTM. (2001). Sieve Analysis of Fine and Coarse Aggregates (C136). West
Conshohocken, PA: ASTM International. ASTM. (2010). Classification of Soild for Engineering Purposes (Unified Soil
Classification System) (D2487). West Conshohocken, PA: ASTM International.
Baldwin, D. H., Tatara, C. P., and Scholz, N. L. (2011). Copper-induced olfactory
toxicity in salmon and steelhead: Extrapolation across species and rearing environments. Aquatic Toxicology, 101(1), 295–297. https://doi.org/10.1016/j.aquatox.2010.08.011
Barrett, M. E. (2005). Performance comparison of structural stormwater best
management practices. Water Environment Research, 77(1), 78–86. https://doi.org/10.2175/106143005x41654
Bay, S., Jones, B. H., Schiff, K., and Washburn, L. (2003). Water quality impacts
of stormwater discharges to Santa Monica Bay. Marine Environmental Research, 56(1–2), 205–223. https://doi.org/10.1016/S0141-1136(02)00331-8
Bilotta, G. S., and Brazier, R. E. (2008). Understanding the influence of
suspended solids on water quality and aquatic biota. Water Research, 42(12), 2849–2861. https://doi.org/10.1016/j.watres.2008.03.018
Brookes, A. (1986). Response of aquatic vegetation to sedimentation
downstream from river channelisation works in England and Wales. Biological Conservation, 38(4), 351–367. https://doi.org/10.1016/0006-3207(86)90060-1
Bureau of Environmental Services (BES). (2004). Stormwater Solutions
Handbook. Portland. Retrieved from www.nature.org/healthyair Bureau of Environmental Services (BES). (2016). City of Portland Stormwater
72
Management Manual. https://doi.org/10.1016/B978-1-85617-567-8.50011-1 Caetano, M., Valderrama, C., Farran, A., and Cortina, J. L. (2009). Phenol
removal from aqueous solution by adsorption and ion exchange mechanisms onto polymeric resins. Journal of Colloid and Interface Science, 338(2), 402–409. https://doi.org/10.1016/j.jcis.2009.06.062
Charters, F. J., Cochrane, T. A., and O’Sullivan, A. D. (2016). Untreated runoff
quality from roof and road surfaces in a low intensity rainfall climate. Science of the Total Environment, 550, 265–272. https://doi.org/10.1016/j.scitotenv.2016.01.093
Chen, X., Chen, G., Chen, L., Chen, Y., Lehmann, J., McBride, M. B., and Hay,
A. G. (2011). Adsorption of copper and zinc by biochars produced from pyrolysis of hardwood and corn straw in aqueous solution. Bioresource Technology, 102(19), 8877–8884. https://doi.org/10.1016/j.biortech.2011.06.078
Clarus Water Solutions. (2015). Products. Retrieved May 24, 2018, from
http://claruswatersolutions.com/products.html CONTECH® Stormwater Solutions Inc. (2001). Product Evaluation: Silt loam
TSS removal efficiency of a stormwater BMP. CONTECH® Stormwater Solutions Inc.: Portland OR.
CONTECH® Stormwater Solutions Inc. (2015). StormFilter Configuration Guide.
CONTECH® Stormwater Solutions Inc.: Portland OR. Davis, A. P., Shokouhian, M., and Ni, S. (2001). Loading estimates of lead,
copper, cadmium, and zinc in urban runoff from specific sources. Chemosphere, 44(5), 997–1009. https://doi.org/10.1016/S0045-6535(00)00561-0
Gary, Miles and Kleber, Markus. (2015). University Research Test Results.
Retrieved from http://earth-lite.com/rain/stormwater-results/university-research-information/.
Ghassabzadeh, H., Mohadespour, A., Torab-Mostaedi, M., Zaheri, P., Maragheh,
M. G., and Taheri, H. (2010). Adsorption of Ag, Cu and Hg from aqueous solutions using expanded perlite. Journal of Hazardous Materials, 177(1–3), 950–955. https://doi.org/10.1016/j.jhazmat.2010.01.010
Gironás, J., Adriasola, J. M., and Fernández, B. (2008). Experimental Analysis
and Modeling of a Stormwater Perlite Filter. Water Environment Research,
73
80(6), 524–539. https://doi.org/10.2175/193864708X267432 Gu, B., Mehlhorn, T. L., Liang, L., and McCarthy, J. F. (1996). Competitive
adsorption, displacement, and transport of organic matter on iron oxide: II. Displacement and transport. Geochimica et Cosmochimica Acta, 60(16), 2977–2992. https://doi.org/10.1016/0016-7037(96)00157-3
Harsh, J. (2005). Amorphous Materials. Encyclopedia of Soils in the Environment
(pp: 64-71). Elsevier. https://doi.org/10.1016/B0-12-348530-4/00207-1 Helfferich, F., and Plesset, M. S. (1958). Ion exchange kinetics. A nonlinear
diffusion problem. The Journal of Chemical Physics, 28(3), 418–424. https://doi.org/10.1063/1.1744149
Huber, M., Welker, A., and Helmreich, B. (2016). Critical review of heavy metal
pollution of traffic area runoff: Occurrence, influencing factors, and partitioning. Science of the Total Environment, 541, 895–919. https://doi.org/10.1016/j.scitotenv.2015.09.033
Janvion, P., Motellier, S., and Pitsch, H. (1995). Ion-exchange mechanisms of
some transition metals on a mixed.pdf, 715, 105–115. Johnson, D. (2005). POLLUTANTS | Persistent Organic (POPs). In Encyclopedia
of Soils in the Environment (pp. 264–271). Elsevier. https://doi.org/10.1016/B0-12-348530-4/00560-9
Kayhanian, M., Stransky, C., Bay, S., Lau, S. L., and Stenstrom, M. K. (2008).
Toxicity of urban highway runoff with respect to storm duration. Science of the Total Environment, 389(2–3), 386–406. https://doi.org/10.1016/j.scitotenv.2007.08.052
Kinerson, R. S., Mattice, J. S., and Stine, J. F. (1996). The Metals Translator:
Guidance For Calculating A Total Recoverable Permit Limit From A Dissolved Criterion. United States Environmetal Protection Agency: Office of Water, (June), 1–67. https://doi.org/EPA 823-B-96-007
Kołodyńska, D., Wnetrzak, R., Leahy, J. J., Hayes, M. H. B., Kwapiński, W., and
Hubicki, Z. (2012). Kinetic and adsorptive characterization of biochar in metal ions removal. Chemical Engineering Journal, 197, 295–305. https://doi.org/10.1016/j.cej.2012.05.025
Kumar, S., and Jain, S. (2013). History, introduction, and kinetics of ion
exchange materials. Journal of Chemistry, 2013. https://doi.org/10.1155/2013/957647
74
Liu, Z., and Zhang, F. S. (2009). Removal of lead from water using biochars
prepared from hydrothermal liquefaction of biomass. Journal of Hazardous Materials, 167(1–3), 933–939. https://doi.org/10.1016/j.jhazmat.2009.01.085
Mathialagan, T., & Viraraghavan, T. (2002). Adsorption of cadmium from
aqueous solutions by perlite. Hazardous Materials, 94, 291–303. https://doi.org/10.1081/SS-120016698
Minerals Education Coalition (MEC). Minerals Database: Perlite. Minerals
Education Coalition. Retrieved on from https://mineralseducationcoalition.org/minerals-database/perlite/
Morel, Francois M.M. and Hering, Janet G. (1993) Principles and Applications of
Aquatic Chemistry. New York, NY: John Wiley and Sons, Inc. Muralikrishna, I. V., and Manickam, V. (2017). Industrial Wastewater Treatment
Technologies, Recycling, and Reuse. In Environmental Management (pp. 295–336). Elsevier. https://doi.org/10.1016/B978-0-12-811989-1.00013-0
Nason, J. A., Sprick, M. S., and Bloomquist, D. J. (2012). Determination of
copper speciation in highway stormwater runoff using competitive ligand exchange - Adsorptive cathodic stripping voltammetry. Water Research, 46(17), 5788–5798. https://doi.org/10.1016/j.watres.2012.08.008
New Jersey Department of Environmental Protection (NJCAT). (2007). NJCAT
Technology Verification Stormwater Management Stormfilter Contech Stormwater Soltuions Inc. Retrieved from http://www.imbriumsystems.com/Portals/0/documents/sc/testing/NJCAT Verification Stormceptor OSR 2007.pdf
Oregon Department of Environmental Quality (ODEQ). (2003). Biofilters for
Stormwater Discharge Pollution Removal. Retrieved from http://www.oregon.gov/deq/FilterPermitsDocs/biofiltersV2.pdf
Oregon Department of Environmental Quality (ODEQ). (2017). Portland Harbor :
Catch Basins. Pankow, James F. (1991) Aquatic Chemistry Concepts. Beaverton, OR: Lewis
Publishers. Peña-Icart, M., Villanueva Tagle, M. E., Alonso-Hernández, C., Rodríguez
Hernández, J., Behar, M., and Pomares Alfonso, M. S. (2011). Comparative study of digestion methods EPA 3050B (HNO3-H2O2-HCl) and ISO 11466.3
75
(aqua regia) for Cu, Ni and Pb contamination assessment in marine sediments. Marine Environmental Research, 72(1–2), 60–66. https://doi.org/10.1016/j.marenvres.2011.05.005
Ribaudo, M. O. (1986). Consideration of Offsite Impacts in Targeting Soil
Conservation Programs. Land Economics, 62(4), 402–411. Sandahl, J. F., Baldwin, D. H., Jenkins, J. J., and Scholz, N. L. (2007). A sensory
system at the interface between urban stormwater runoff and salmon survival. Environmental Science and Technology, 41(8), 2998–3004. https://doi.org/10.1021/es062287r
Sari, A., Tuzen, M., Citak, D., and Soylak, M. (2007). Adsorption characteristics
of Cu(II) and Pb(II) onto expanded perlite from aqueous solution. Journal of Hazardous Materials, 148(1–2), 387–394. https://doi.org/10.1016/j.jhazmat.2007.02.052
Selim, H. M., Buchter, B., Hinz, C., and Ma, L. (1992). Modeling the Transport
and Retention of Cadmium in Soils: Multireaction and Multicomponent Approaches. Soil Sci, Soc. Am. J, 56(January), 1004–1015. https://doi.org/10.2136/sssaj1992.03615995005600040002x
Silber, A., Bar-Yosef, B., Suryano, S., & Levkovitch, I. (2012). Zinc adsorption by
perlite: Effects of pH, ionic strength, temperature, and pre-use as growth substrate. Geoderma, 170(3), 159–167. https://doi.org/10.1016/j.geoderma.2011.11.028
Soil Science Society of America (2018). Rain Gardens and Bioswales. Retrieved
from https://www.soils.org/discover-soils/soils-in-the-city/green-infrastructure/important-terms/rain-gardens-bioswales
Starr, J. L., and Parlange, J.-Y. 1979. Dispersion in Soil Columns: The Snow
Plow Effect1. Soil Sci, Soc. Am. J. 43:448-450. doi:10.2136/sssaj1979.03615995004300030005x
Sunmark Environmental. Earthlite Stormwater Filter Media. Retrieved from
http://earth-lite.com/rain/ Swayampakula, K., Boddu, V. M., Nadavala, S. K., & Abburi, K. (2009).
Competitive adsorption of Cu (II), Co (II) and Ni (II) from their binary and tertiary aqueous solutions using chitosan-coated perlite beads as biosorbent. Journal of Hazardous Materials, 170(2–3), 680–689. https://doi.org/10.1016/j.jhazmat.2009.05.106

76
United States Environmental Protection Agency. (2009). Industrial Stormwater Monitoring and Sampling Guide.
United States Environmental Protection Agency. (2017). Polluted Runoff :
Nonpoint Source Pollution. Retrieved from https://www.epa.gov/nps/what-nonpoint-source
United States Environmental Protection Agency. (2018a). Impaired Waters and
Stormwater. Retrieved from https://www.epa.gov/tmdl/impaired-waters-and-stormwater
United States Environmental Protection Agency. (2018b). National Pollutant Discharge Elimination System (NPDES). Retrieved from https://www.epa.gov/npdes/npdes-stormwater-program
Vaaramaa, K., and Lehto, J. (2003). Removal of metals and anions from drinking
water by ion exchange. Desalination, 155(2), 157–170. https://doi.org/10.1016/S0011-9164(03)00293-5
77
APPENDIX A. Solids Analysis Table 1. Total Suspended Solids (TSS) for TriMet Merlo stormwater samples. B2 had %difference > 4% and was omitted.
Sample
initial mass filter+boat
(g)
final mass filter+boat (g)
1/22/17 Volume
(ml) mass
TSS (g)
mass TSS (mg)
TSS (mg/L)= mass TSS (mg) /vol (mL)*1000
Average TSS
(mg/L)
blank 2.1764 2.1757 60 -0.0007
A1 2.1986 2.2103 35 0.0117 12 334
A2 2.2619 2.2709 30 0.0090 9 300
A3 2.2551 2.2661 32 0.0110 11 344 326
B1 2.2016 2.2076 63 0.0060 6 95
B3 2.2126 2.2174 50 0.0048 5 96 96
C1 2.1986 2.2016 97 0.0030 3 31
C2 2.2877 2.2905 93 0.0028 3 30
C3 2.2521 2.2554 114 0.0033 3 29 30
Table 2. Total Solids (TS) for TriMet Merlo stormwater samples. A2 and C1 had %difference > 4% and were omitted.
Sample
initial mass filter+boat
(g)
final mass filter+boat (g)
1/22/17 Volume
(ml) mass
TSS (g)
mass TSS (mg)
TSS (mg/L)= mass TSS (mg) /vol (mL)*1000
Average TSS
(mg/L)
blank 49.5336 49.5292 61 -0.0044
A1 49.9475 49.9846 103 0.0371 37 360
A3 49.2657 49.306 114 0.0403 40 354 357
B1 49.2366 49.2564 155 0.0198 20 128
B2 50.0729 50.0938 160 0.0209 21 131
B3 49.4699 49.4881 145 0.0182 18 126 128
C2 47.9114 47.9681 471 0.0567 57 120
C3 60.6605 60.7155 450 0.055 55 122 121
78
Table 3. Total Dissolved Solids (TDS) for TriMet Merlo stormwater samples.
Sample
initial mass filter+boat
(g)
final mass filter+boat (g)
1/22/17 Volume
(ml)
mass TSS (g)
mass TSS (mg)
TSS (mg/L)= mass TSS (mg) /vol (mL)*1000
Average TSS (mg/L)
blank 49.2274 49.2216 61 61 0 ND ND
A1 35
A2 30
A3 49.2971 49.2945 32 97 0 ND ND
B1 63
B2 44
B3 61.1724 61.1815 50 157 0 9 58
C1 97
C2 93
C3 48.4375 48.462 114 304 0 25 81
79
APPENDIX B. Particle Size Analysis Table 4. Earthlite™ particle size analysis.
Sieve Number
Mass Total (pan+media) (g)
Mass media (g)
% on Sieve Cumulative %
Particle Size (mm)
Percent Passing
1/4 375.26 38.28 17.7 17.72 6.30 82.28
4 412.67 37.41 17.3 35.05 4.75 64.95
6 452.71 40.04 18.5 53.59 3.35 46.41
10 493.02 40.31 18.7 72.25 2 27.75
40 546.97 53.95 25.0 97.23 0.42 2.77
200 552.95 5.98 2.8 100.00 0.075 0.00
>200 552.95 0.00 0.0 100.00 <0.075 0.00
Total Mass 215.97
Table 5. Perlite particle size analysis.
Sieve Number
Mass Total (pan+media) (g)
Mass media (g)
% on Sieve Cumulative %
Particle Size (mm)
Percent Passing
1/4 336.93 0.00 0.0 0.00 6.30 100.00
4 337.03 0.10 0.2 0.21 4.75 99.79
6 342.7 5.77 11.9 12.12 3.35 87.88
10 370.23 33.30 68.7 80.85 2 19.15
40 344.04 7.11 14.7 95.52 0.42 4.48
200 337.92 0.99 2.0 97.56 0.075 2.44
>200 338.11 1.18 2.4 100.00 <0.075 0.00
Total Mass 48.45

80
Table 6. Filter33™ particle size analysis.
Sieve Number
Mass media (g)
% on Sieve Cumulative %
Particle Size (mm)
Percent Passing
1/4 0.0 0.00 6.30 100.00
4 0.0 0.00 4.75 100.00
40 48.69 18.3 18.29 0.43 81.71
60 156.95 59.0 77.25 0.25 22.75
100 59.57 22.4 99.62 0.15 0.38
200 1.00 0.4 100.00 0.075 0.00
>200 0.0 100.00 <0.075 0.00
Total Mass 266.21