remote sensing for index insurance
TRANSCRIPT

Remote sensing for index insuranceFindings and lessons learned for smallholder agriculture

© 2017 International Fund of Agricultural Development (IFAD)
The designations employed and the presentation of material in this publication do not imply
the expression of any opinion whatsoever on the part of the International Fund for Agricultural
Development of the United Nations concerning the legal status of any country, territory, city
or area or of its authorities, or concerning the delimitation of its frontiers or boundaries. The
designations “developed” and “developing” economies are intended for statistical convenience
and do not necessarily express a judgement about the stage reached by a particular country or
area in the development process.
This publication or any part thereof may be reproduced without prior permission from IFAD,
provided that the publication or extract therefrom reproduced is attributed to IFAD and the title
of this publication is stated in any publication and that a copy thereof is sent to IFAD.
ISBN 978-92-9072-772-9
Printed January 2018
Front cover: ©ESA-BELSPO 2014, produced by VITO

Remote sensing for index insuranceFindings and lessons learned for smallholder agriculture

2
Table of contents
Acronyms 6
Acknowledgements 8
executive summAry 9
1. BAckground 13
Insurance for smallholder agriculture: the need, the opportunities 13
and the challenges
Data for index insurance 16
Remotely sensed data 19
2. Project goAl, oBjectives And orgAnizAtion 21
Project overview 21
Needs of end-users, stakeholders and clients 23
3. remote sensing overview And APProAches 29
Rainfall estimates 31
Soil moisture estimates 32
Evapotranspiration estimates 33
Vegetation indices 34
Synthetic Aperture Radar data 35
4. selection of regions of interest And croPs 37
5. ground dAtA used 41
Yield data 41
Rainfall data 49
6. designing insurAnce indices 53
Developing index insurance structures 53
Unit areas of insurance 58
7. mAPPing 61
Mapping satellite images 61
Maps and masks 61
SAR-based maps 62
Other maps and masks used in this project 64
General findings 64

3
Remote sensing foR index insuRance findings and lessons leaRned foR smallHoldeR agRicultuRe
8. descriPtion of the methodologies 67
EARS methodology (relative evapotranspiration estimates) 68
GeoVille methodology (soil moisture estimates) 69
FEWS NET methodology (actual evapotranspiration estimates) 71
IRI methodology (rainfall estimates) 74
ITC methodology (vegetation indices) 76
VITO methodology (vegetation indices combined with rainfall estimates) 79
9. PerformAnce Assessment 83
Historical performance analysis 83
Product testing 98
10. oPerAtionAl APPlicABility 107
Availability and source of data 107
Cost and sustainability 110
Ownership and transparency 115
General performance and suitability 118
11. conclusions 125
Programming features 125
Technical features 128
Performance of remote sensing methodologies 131
12. recommendAtions 135
references 138
Annexes 141
Annex I. Scoring methodology 141
Annex II. Impact of changes in the yield threshold and in payout 144
acceptability parameters
Annex III. Comparison of base and fixed-ELC products 151
Annex IV. Performance of products per RSSP over aCR yields 153
Annex V. Findings of the SAR mapping 171
4
tABle of contents
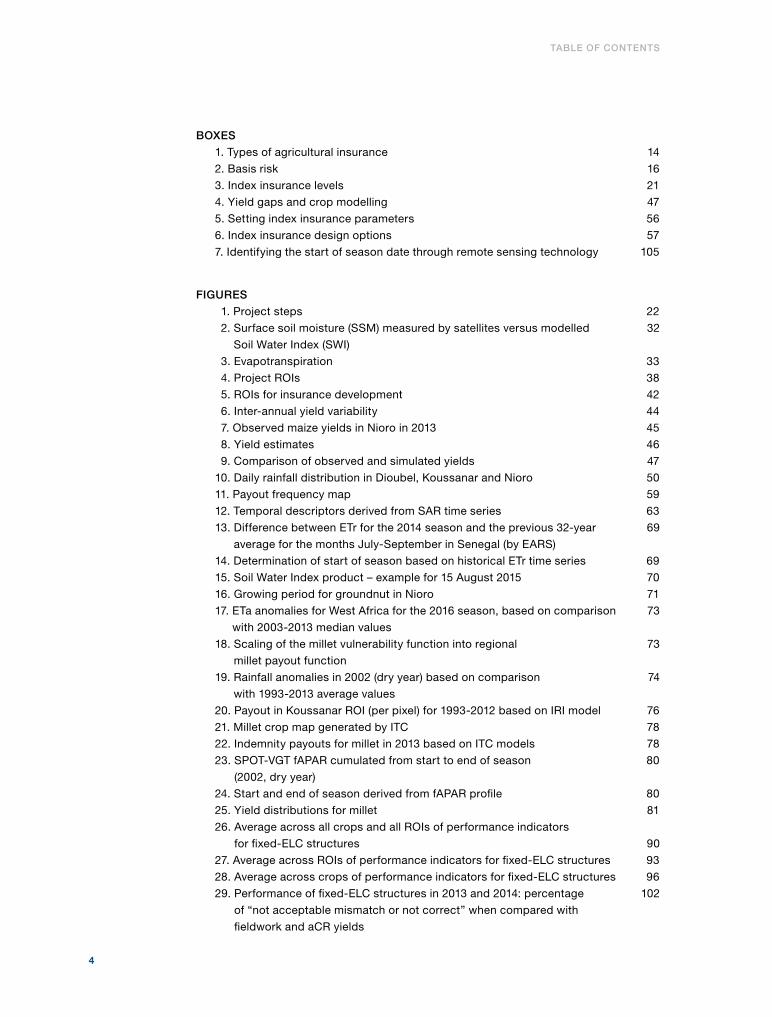
figures
1. Project steps 22
2. Surface soil moisture (SSM) measured by satellites versus modelled 32
Soil Water Index (SWI)
3. Evapotranspiration 33
4. Project ROIs 38
5. ROIs for insurance development 42
6. Inter-annual yield variability 44
7. Observed maize yields in Nioro in 2013 45
8. Yield estimates 46
9. Comparison of observed and simulated yields 47
10. Daily rainfall distribution in Dioubel, Koussanar and Nioro 50
11. Payout frequency map 59
12. Temporal descriptors derived from SAR time series 63
13. Difference between ETr for the 2014 season and the previous 32-year 69
average for the months July-September in Senegal (by EARS)
14. Determination of start of season based on historical ETr time series 69
15. Soil Water Index product – example for 15 August 2015 70
16. Growing period for groundnut in Nioro 71
17. ETa anomalies for West Africa for the 2016 season, based on comparison 73
with 2003-2013 median values
18. Scaling of the millet vulnerability function into regional 73
millet payout function
19. Rainfall anomalies in 2002 (dry year) based on comparison 74
with 1993-2013 average values
20. Payout in Koussanar ROI (per pixel) for 1993-2012 based on IRI model 76
21. Millet crop map generated by ITC 78
22. Indemnity payouts for millet in 2013 based on ITC models 78
23. SPOT-VGT fAPAR cumulated from start to end of season 80
(2002, dry year)
24. Start and end of season derived from fAPAR profile 80
25. Yield distributions for millet 81
26. Average across all crops and all ROIs of performance indicators
for fixed-ELC structures 90
27. Average across ROIs of performance indicators for fixed-ELC structures 93
28. Average across crops of performance indicators for fixed-ELC structures 96
29. Performance of fixed-ELC structures in 2013 and 2014: percentage 102
of “not acceptable mismatch or not correct” when compared with
fieldwork and aCR yields
Boxes
1. Types of agricultural insurance 14
2. Basis risk 16
3. Index insurance levels 21
4. Yield gaps and crop modelling 47
5. Setting index insurance parameters 56
6. Index insurance design options 57
7. Identifying the start of season date through remote sensing technology 105

5
Remote sensing foR index insuRance findings and lessons leaRned foR smallHoldeR agRicultuRe
tABles
1. Project partners 23
2. Index insurance programme and product design stages and 24
stakeholder roles
3. Passive and active remote sensing systems 30
4. Features of selected crop monitoring regions 39
5. ELCs by crop type 54
6. Product design options selected by RSSPs 55
7. Overview of remote sensing methodologies 67
8. Evapotranspiration 68
9. Soil moisture 70
10. Actual evapotranspiration 72
11. Rainfall estimates 75
12. Vegetation index 77
13. Vegetation index and rainfall 79
14. Colour coding adopted in historical performance analysis 85
15. Summary of product performance for fixed-ELC index structures 87
averaged across all structures developed (all regions, all crops)
16. Summary of product performance for fixed-ELC index structures 92
averaged over ROIs
17. Summary of product performance for fixed-ELC index structures 95
averaged over crops
18. Overall performance analysis (criteria and Evaluation Committee scores) 97
19. 2013 and 2014 average yield values derived from the project fieldwork 99
20. Overview of performance of fixed-ELC structures for each RSSP 100
compared with 2013-2014 project fieldwork yields
21. Overview of performance of fixed-ELC structures for each RSSP 101
compared with 2013-2014 aCR yields (DAPSA)
22. Percentage of “not acceptable mismatch or not correct” for fixed-ELC 102
structures for 2013-2014 aCR yields
23. Percentage of “not acceptable mismatch or not correct” for fixed-ELC 103
structures for 2013-2014 project fieldwork yields
24. Product testing analysis (questions and Evaluation Committee scores) 104
25. Results of scoring on availability and source of data 110
26. Results of scoring on sustainability of data 115
27. Results of scoring on ownership and transparency 118
28. Results of scoring on performance and suitability 123

6
Acronyms
aCR aggregated at communauté rurale level
AFD Agence Française de Développement (French Development Agency)
ASCAT Advanced Scatterometer
AYII area yield index insurance
CM covariate mismatch (indicator)
CR communauté rurale
DAPSA Direction de l’Analyse, de la Prévision des Statistiques Agricoles
(Directorate for Agricultural Analysis, Forecasting and Statistics)
DEP department
EARS Environmental Analysis and Remote Sensing
ELC expected loss cost (pure risk premium)
ESA European Space Agency
EoS end of season
ET evapotranspiration
ETa evapotranspiration, actual
ETr evapotranspiration, relative
ET0 Evapotranspiration, potential
ERS European Remote Sensing satellite
fAPAR fraction of Absorbed Photosynthetically Active Radiation
FAO Food and Agriculture Organization of the United Nations
FEWS NET Famine Early Warning Systems Network
IRI International Research Institute for Climate and Society
(Earth Institute, Columbia University)
ISRA Institut Sénégalais de Recherches Agricoles (Senegalese Institute
for Agricultural Research)
ITC Faculty of Geo-Information Science and Earth Observation
(University of Twente)
JRC Joint Research Centre (of the European Commission)
LST land surface temperature

7
Remote sensing foR index insuRance findings and lessons leaRned foR smallHoldeR agRicultuRe
MARS Monitoring Agricultural Resources Programme (of the European
Commission Joint Research Centre)
MPCI multi-peril crop insurance
NASA National Aeronautics and Space Administration
NDVI Normalized Difference Vegetation Index
RFE rainfall estimate
ROI region of interest
RSSP remote sensing service provider
SAR Synthetic Aperture Radar
SoS start of season
SWI Soil Water Index
UAI unit area of insurance
VITO Vlaamse Instelling voor Technologisch Onderzoek (Flemish Institute
for Technological Research)
WII weather index insurance
WFP World Food Programme
WMO World Meteorological Organization
WRMF Weather Risk Management Facility

8
Acknowledgements
This publication was developed by Emily Coleman, William Dick, Sven Gilliams,
Isabelle Piccard, Francesco Rispoli and Andrea Stoppa.
The content is based on the project “Improving Agricultural Risk Management in
Sub-Saharan Africa: Remote Sensing for Index Insurance”, which was made possible
with funding from the Agence Francaise de Développement and an additional
contribution from the Belgian Federal Science Policy Office. The project was
implemented by the Weather Risk Management Facility of the International Fund
for Agricultural Development and the World Food Programme. The Flemish Institute
for Technological Research (VITO) provided significant contributions and support
throughout the project.
The project also benefited from close collaboration with Franziska Albrecht,
Massimo Barbieri, Sandro Calmanti, Kees de Bie, Mbaye Diop, Helen Greatrex, Eva
Haas, Francesco Holecz, Harikishan Jayanthi, Jolien van Huystee, Jan Militzer, Bertrand
Muller, Daniel Osgood, Marcello Petitta, the late Andries Rosema, and James Verdin.
We are further grateful for the additional expertise and insights provided by the
project’s evaluation committee: Zoltan Bartalis, Fabrizio Battazza, Rogerio Bonifacio,
Molly Brown, Michael Carter, Bamba Diop, Mathieu Dubreuil, Monica Garcia, Ola
Gråbak, Joachim Herbold, Peter Hoefsloot, Marcel Kuettel, Olivier Leo, Shadreck
Mapfumo, Michele Meroni, Bertrand Muller, Oscar Rojas, Christina Ulardic, Sébastien
Weber and Andreas Weigel.
Peer reviewers: Jyothi Bylappa, Mathieu Dubreuil, Steven Jonckheere, Christa
Ketting and Maria Elena Mangiafico
Editors: Chris Jarzombek and Janet Sharpe
Graphic designer: Andrea Wohr
9
Remote sensing foR index insuRance findings and lessons leaRned foR smallHoldeR agRicultuRe
Executive summary
Index insurance has a role to play in agricultural development and risk management,
yet it faces operational and technical challenges to reach scale and sustainability. Data
are a key challenge and were the focus of the project “Improving Agricultural Risk
Management in Sub-Saharan Africa: Remote Sensing for Index Insurance”. Limited
availability, accessibility, quantity and poor quality of data on the ground are some
of the primary technical constraints preventing scale-up and sustainability of index
insurance. Without sufficient quality data, either it is impossible to design products
for some areas and countries, or products that are designed can become unreliable,
not compensating when they should. These inconsistencies intensify vulnerability,
lead to distrust of insurance, and ultimately have an impact on demand. This
publication details the project, which investigated overcoming issues with ground
data by using remote sensing data for index insurance. It describes the different
remote sensing options and opportunities available for index insurance, but it also
recommends further investment in research and development, supplementary
ground data and capacity-building going forward.
With financial support from the Agence Francaise de Développement (AFD) and
an additional contribution from the Belgian Federal Science Policy Office (BELSPO),
the project was carried out by the Weather Risk Management Facility (WRMF). The
WRMF was established by the International Fund for Agricultural Development
(IFAD) and the World Food Programme (WFP) in 2008. It supports initiatives aimed
at reducing smallholders’ vulnerability to weather and other agricultural production
risks, in order to encourage and protect investments in smallholder agricultural
production and contribute to food security. The WRMF does this through research,
technical assistance and capacity-building, and implementation of innovative risk
management solutions, such as agricultural index insurance.
Smallholder farmers, the focus of the project, are particularly exposed to the
unpredictability of climate-related risks. Such risks are difficult to tackle because
they typically strike many farmers in the same area and at the same time, making
most risk management approaches or coping mechanisms unfeasible. In addition,
climate change further intensifies these risks.
Climate-related production risks trap households in poverty and food
insecurity. Without reliable tools to protect against these risks, smallholders forgo
opportunities to become more productive by continuing to focus on more resilient
but less profitable production activities and not investing in better quality inputs
and technology. Exacerbating this situation, financial service providers fear offering
financial products and services; input suppliers limit their outreach; and even the
sustainability of well-intended donor and government interventions is threatened
by external shocks.

10
Agricultural insurance can offer part of the solution, by helping to protect assets
and encourage productive investments in smallholder agriculture, unlock access to
credit; increase resilience of rural households and businesses, and improve food
security. This publication focuses on index insurance for crops. To overcome the
limitations of ground-based data, index insurance developers are turning to remote
sensing approaches, such as satellite data. However, despite the significant experience
developed in drought insurance for pasture, applications for smallholders’ cropping
activities are relatively new, and remote sensing data are not yet being used to their
full potential for index insurance.
One bottleneck is the lack of reliable information on remote sensing for index
insurance, including different methodology options and their possible combinations,
what works best in which areas and for which types of crops, and whether and how
remote sensing solutions can be mainstreamed into index insurance. These are
some of the challenges that the project sought to address. Its overall goal was to
contribute scalable and sustainable approaches to index insurance and to evaluate
the feasibility of remote sensing for index insurance to benefit smallholder farmers.
Based on extensive research into the sector, the project developed and tested seven
innovative remote sensing methodologies over two crop seasons in Senegal. These
methodologies were evaluated to produce findings and recommendations on the
performance of the different indices in accurately depicting village-level yield loss
due to weather and other perils (depending on the remote sensing approach); and
on the operational feasibility and implementation needed to mainstream remote
sensing in index insurance operations.
The project united a wide range of different actors whose expertise spanned remote
sensing, insurance and reinsurance, aid and development, and agricultural research.
This publication concludes that remote sensing methodologies are operationally
feasible for index insurance. However, it was a challenge for the indices developed
to reflect local yield, and basis risk remains a key concern. Although remote sensing
data are increasingly available, and at no cost, local knowledge and data from the
ground are still essential to design, calibrate and validate remote sensing indices. The
findings highlighted a very high variability of yields achieved by individual farmers,
even in the same village in the same year. The potential for basis risk is strongly
influenced by the size of the area set by the insurer under which all policyholders
are grouped, the uniformity of local yield losses experienced in a loss event, and
the ability of the methodologies to detect such yield losses. Performance analysis
showed that whatever the methodology, product design has a critical influence on
how accurately loss can be captured. In addition, limited availability of expertise to
design indices is a challenge.
executive summAry

11
Remote sensing foR index insuRance findings and lessons leaRned foR smallHoldeR agRicultuRe
In order to further improve index insurance products based on remote sensing
and to scale up, it is recommended that:
• additional research and development activities be supported to further
improve the potential of remote sensing for index insurance;
• further investment be made in ground data collection protocols, capacity and
systems;
• different remote sensing approaches, dedicated mapping tools, and ground-
level sources of data and information be combined to improve the quality of
index insurance structures;
• future initiatives focus on developing proper segmentation of the size of the
insured area;
• schemes based on remotely sensed data be carefully planned for measures
aimed at mitigating the occurrence of basis risk events; and
• capacity of private and public remote sensing institutions be built in order to
fill current gaps in expertise and ensure future sustainability.

12
©IFAD/Susan Beccio

13
Remote sensing foR index insuRance findings and lessons leaRned foR smallHoldeR agRicultuRe
1. Background
Insurance for smallholder agriculture: the need, the opportunities and the challengesSmallholder farmers currently produce 70 per cent of Africa’s food supply and
80 per cent of the food consumed in Africa and Asia. Due to increasing population
growth, the global food supply will need to almost double by 2050. To meet that
demand, more than US$83 billion per year needs to be invested in smallholder
agriculture (IFAD, 2013). However, smallholders are vulnerable to a range of
individual and widespread risks. These risks can be mitigated, in part, by agricultural
insurance, which comes in many forms. This publication focuses on index insurance.
risksDespite the dependence of Africa and Asia on smallholder farmers, yield gaps, losses
and poor supply are prevalent due to lack of or weak access, distribution, availability
and stability of:
• natural resources, particularly land and water
• quality inputs
• production practices
• transport and storage
• markets
• financial services
• external investment
• infrastructure
• capacity and instruments to manage risks.
Smallholder farmers are particularly exposed to the unpredictability of climate-
related risks, especially drought and floods, and risks such as pests and disease.
These risks are difficult to tackle because they typically strike many farmers in
the same area at the same time (systemic risks), making most risk management
approaches or coping mechanisms unfeasible. In addition, climate change further
intensifies these risks.
These climate-related production risks trap households in poverty and food
insecurity. Without reliable tools to protect themselves against these risks,
smallholders forgo opportunities to become more productive: they focus on more
resilient but less profitable production activities and do not invest in better quality
inputs and technology. This situation is exacerbated by financial service providers
who are wary of offering financial products and services; by input suppliers who
limit their outreach; and by external shocks that threaten the sustainability of well-
intended donor and government interventions (IFAD, 2015).

14
1. BAckground
Agricultural insuranceAgricultural insurance can offer part of the solution by helping to protect assets
and encourage productive investments in smallholder agriculture, unlock access
to credit; increase resilience of rural households and businesses, and improve
food security. Within this context, it is little wonder that the international
community – including the G7, the G20 and the Paris Agreement (adopted at the
Paris Climate Conference (COP21) in 2015) – has pledged to support scaling up of
agricultural insurance. Agricultural insurance products are diverse (see Box 1), but
this publication focuses on index insurance for crops as opposed to insurance for
livestock or indemnity insurance.
Box 1. types of agricultural insurance
indemnity products• Named peril crop insurance (e.g. hail)• Multi-peril crop insurance (MPCI) (yield guarantee)• Accident and mortality livestock insurance
index-based products• Weather index insurance (WII) using ground-based or remotely sensed measures of
weather variables• Area yield index insurance (AYII) using ground measurement• Index insurance using remote sensing to monitor cropping or pasture conditions
In indemnity insurance, compensation is based on measured loss or damage,
and therefore requires an insurer to make individual farm visits to set up coverage
and to assess loss. This makes it costly and difficult to administer efficiently and
effectively for smallholders, and it leaves open the problems of moral hazard and
adverse selection. The most widespread indemnity insurance product (multi-peril
crop insurance, or MPCI) is based on measurement of shortfalls of actual yield at the
individual farm level compared with expected yield.
In contrast, index insurance payments are based on an indirect indicator intended
to be a proxy for loss or damage. The index is built on historical data, and it uses
current season data to verify when a payment is triggered. Generally, all farmers
within a given area purchase the same policy, for the same price, and receive the
same payouts when the index triggers.
The reduced administrative costs and the simplified and automated claims
processes make index insurance more accessible for smallholder agriculture. The
standardized nature of the product also means that it can be bundled with other
services, such as credit or inputs, and delivered through aggregators. It protects
against systemic risks (also known as covariate risks) – which affect many people
in the same area and at the same time, be it a local area, across a region or a whole
country – and are typically difficult to recover from quickly without external help or
appropriate financial tools in place. Because the index insurance products are built

15
Remote sensing foR index insuRance findings and lessons leaRned foR smallHoldeR agRicultuRe
on existing data, they are based on objective and transparent information, which
means some of the risk can be transferred to national or international markets.
Advances in index insurance have helped the agricultural insurance market in
developing countries grow in recent years. In Africa, between 2011 and 2014, the
number of people covered by agricultural insurance grew by 560 per cent (from
0.2 million to 1.1 million people), which is partly attributable to new index
insurance products (Microinsurance Network, 2016). Despite some successful
schemes and increasing government commitments, penetration is still low in most
developing countries.
challenges facing index insuranceThere is consensus within the sector on the challenges facing index insurance that
need to be overcome if offerings are to be scaled up and made sustainable. The
main challenges fall into two categories: (i) delivery challenges and (ii) technical
product challenges.
In terms of delivery, the key issues to be overcome are:
• delivering at scale and at a low cost;
• bringing added value for clients and partners – be they smallholder farmers,
value chain actors, microfinance institutions, or governments – and this
value might be achieved either through bundling index insurance with other
products or through benefiting farmers indirectly by covering the business
risks faced by financial institutions or those that arise in the value chain; and
• building insurance awareness and understanding among clients and partners.
Technical product challenges can relate to basis risk, which is the mismatch between
the actual loss and the compensation received (see Box 2). Development costs and
product replication also represent challenges since products need to be tailored to
each location and crop (in the case of crop-specific products). Limited availability,
quantity and quality of on-the-ground weather and yield data are also important
technical challenges.
Insurance payouts that do not correspond to the true losses experienced by the
farmer and intended to be covered by the policy carry the danger of poor value
to the client, client dissatisfaction and reputational risk for the insurer and for
all stakeholders.
The extent of basis risk can be influenced by the spatial resolution of the satellite
images, where index measurements may be in the form of single pixels or groups
of pixels that are aggregated to form the unit area of insurance (UAI). The UAI is
the area set by the insurer under which all policyholders are grouped, paying the
same premium and having the same payout rates related to their sums insured (see
page 58). Understanding the extent of variation of crop yields at the level of the
individual farmer, village and larger aggregated area is important in implementing
index insurance. Similarly, understanding the causes of crop loss (if it is related to
weather or to other risks such as pests and disease, or due to low-intensity farming

16
1. BAckground
and diverse farming practices) is extremely important in the interpretation of
potential basis risk.
The Regulator of Insurance in each country is responsible for consumer protection,
and index insurance products need to demonstrate product quality through their
ability to match losses with payouts. Index insurance products can be crop-specific
or intended to reflect more general crop losses (primarily due to drought).
Data for index insuranceVarious studies have analysed lessons from different index insurance schemes
around the world and identified common challenges with on-the-ground data
infrastructure as a constraint to further scale-up (IFAD-WFP 2010; European
Commission Joint Research Centre, 2013; Hellmuth M.E., et. al 2009; World Bank
Commodity Risk Management Group, 2008; and MicroSave, 2013). Index insurance
is complex to design in a way that highly correlates with the losses the policy intends
to cover.
ground data needs for index-based insuranceWeather index insurance (WII) and area yield index insurance (AYII) are the most
common forms of index insurance. Both WII and AYII require ground data for
designing the index and operating the contract. WII based on ground measurements
relies on both historical and current weather data, and some agricultural data to
design and calibrate products. AYII relies on historical yield data for design and
pricing, and on current yield data to provide compensation when yield losses occur.
Box 2. Basis risk
Basis risk is a key constraint for index insurance. In its widest sense, basis risk is the difference between the loss experienced by the farmer and the payout triggered. However, identifying the differences between losses and payouts received by the farmers can be complex. Such differences depend on the index insurance methodology on which the coverage is based. For example, pest and disease losses are not covered by a weather index insurance contract.
A key dimension of index insurance is the distinction between average losses experienced in the coverage area as a whole (covariate risk) and losses experienced by individual farmers (idiosyncratic risk). Causes of basis risk could be related to the distance from the point of measurement of the indexed variable and the geography or size of the unit area of insurance (UAI) (spatial basis risk), or to the timing of the start of crop season, which may differ from the measurements established in the index insurance contract (temporal basis risk).
If parameters such as triggers and exits are incorrectly calibrated, or the relationship between the index measurement and the crop yield is not clear, basis risk may be attributed to product design (product basis risk).
Despite these complexities, the general and wider definition of basis risk remains useful. However, it must be remembered that, when determining whether basis risk has occurred, it is necessary to consider the cover intended by each index insurance methodology. This difference emphasizes the importance of clarity in the wording of the insurance policy and of educational outreach when index insurance is sold.
17
Remote sensing foR index insuRance findings and lessons leaRned foR smallHoldeR agRicultuRe
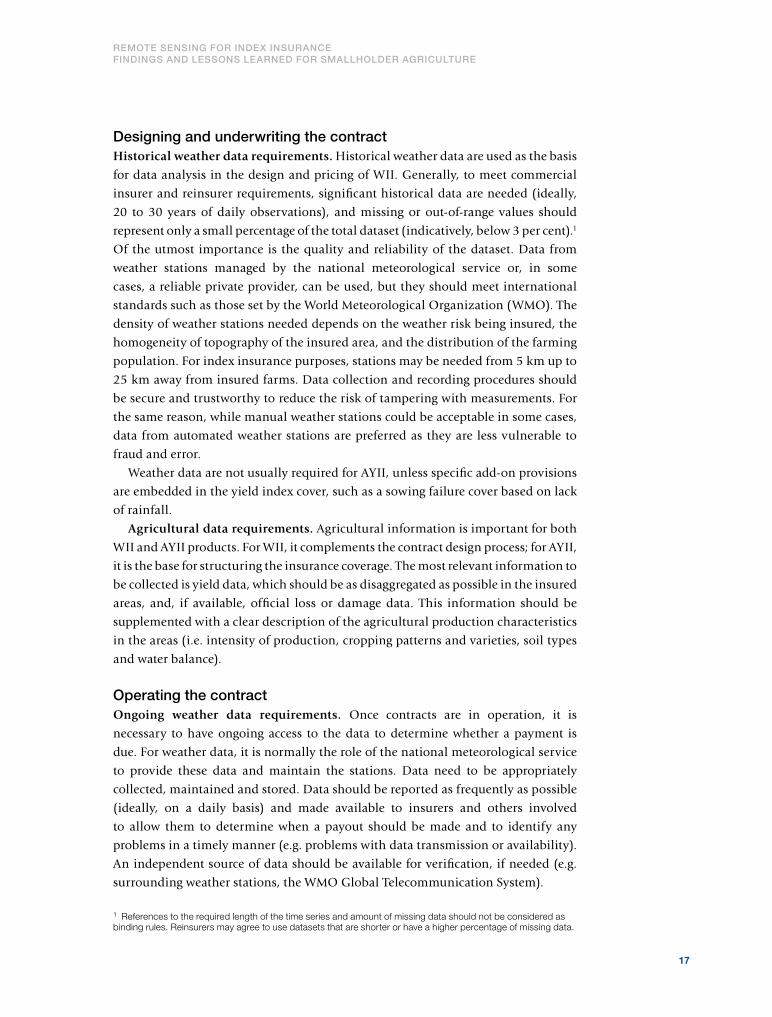
designing and underwriting the contractHistorical weather data requirements. Historical weather data are used as the basis
for data analysis in the design and pricing of WII. Generally, to meet commercial
insurer and reinsurer requirements, significant historical data are needed (ideally,
20 to 30 years of daily observations), and missing or out-of-range values should
represent only a small percentage of the total dataset (indicatively, below 3 per cent).1
Of the utmost importance is the quality and reliability of the dataset. Data from
weather stations managed by the national meteorological service or, in some
cases, a reliable private provider, can be used, but they should meet international
standards such as those set by the World Meteorological Organization (WMO). The
density of weather stations needed depends on the weather risk being insured, the
homogeneity of topography of the insured area, and the distribution of the farming
population. For index insurance purposes, stations may be needed from 5 km up to
25 km away from insured farms. Data collection and recording procedures should
be secure and trustworthy to reduce the risk of tampering with measurements. For
the same reason, while manual weather stations could be acceptable in some cases,
data from automated weather stations are preferred as they are less vulnerable to
fraud and error.
Weather data are not usually required for AYII, unless specific add-on provisions
are embedded in the yield index cover, such as a sowing failure cover based on lack
of rainfall.
Agricultural data requirements. Agricultural information is important for both
WII and AYII products. For WII, it complements the contract design process; for AYII,
it is the base for structuring the insurance coverage. The most relevant information to
be collected is yield data, which should be as disaggregated as possible in the insured
areas, and, if available, official loss or damage data. This information should be
supplemented with a clear description of the agricultural production characteristics
in the areas (i.e. intensity of production, cropping patterns and varieties, soil types
and water balance).
operating the contractOngoing weather data requirements. Once contracts are in operation, it is
necessary to have ongoing access to the data to determine whether a payment is
due. For weather data, it is normally the role of the national meteorological service
to provide these data and maintain the stations. Data need to be appropriately
collected, maintained and stored. Data should be reported as frequently as possible
(ideally, on a daily basis) and made available to insurers and others involved
to allow them to determine when a payout should be made and to identify any
problems in a timely manner (e.g. problems with data transmission or availability).
An independent source of data should be available for verification, if needed (e.g.
surrounding weather stations, the WMO Global Telecommunication System).
1 References to the required length of the time series and amount of missing data should not be considered as binding rules. Reinsurers may agree to use datasets that are shorter or have a higher percentage of missing data.

18
1. BAckground
Ongoing agricultural data requirements. Yield data are needed at a level of
disaggregation appropriate to the area covered by the contract. To match the timelines
required by the insurance transactions, data should be reported in a timely manner.
challenges with dataLimited availability, accessibility, quantity and poor quality of data on the ground
are some of the main technical constraints preventing scale-up and sustainability of
index insurance. Without sufficient quality data, it is impossible to design products
for some areas and countries, or products that are designed are unreliable and do
not compensate when they should. This intensifies vulnerability, leads to distrust of
insurance, and ultimately has an impact on demand.
Weather data. Weather data that meet all the necessary requirements are
rarely available in developing countries and are especially scarce in those areas
needing coverage. This deficiency limits scaling up of WII. The completeness of
the historical dataset is highly variable for different areas, particularly for daily
data, which are needed for index design. Similarly, the density of weather stations
forming the national network varies considerably from country to country. Even
if the perfect datasets exist, they are not necessarily accessible or available or for
commercial purposes. Apart from the cost of obtaining the data, successful design
and operationalization requires a good understanding to be reached with national
meteorological services to manage and provide the data required for operating index
insurance. Installing new weather stations just for the purposes of index insurance
would create an issue in terms of the number that would be needed to cover often
dispersed populations, across heterogeneous areas, as well as costly long-term
maintenance. Furthermore, there would be no historical record available. In certain
circumstances, artificial datasets can be calculated in areas where new stations are
installed to partly overcome this problem; however, it is not a viable solution in all
cases for scaling up.
Yield data. Good quality yield data covering a sufficient time series at the
required disaggregated level are frequently unavailable. For WII, the lack of quality
yield data has a relevant impact on contract development. For AYII, yield data are an
essential requirement since they are needed to both structure the insurance coverage
and determine compensation. In practice, local staff of ministries of agriculture or
national statistical departments collect yield data; however, it is often the case that
yield data are unreliable or not available at the appropriate level of disaggregation,
or reporting is slow after harvest, which delays payouts. Index insurance schemes
that require a reliable and ongoing flow of quality yield data may need to set up
dedicated yield collection methodologies and procedures, but it is not always
possible to do so.

19
Remote sensing foR index insuRance findings and lessons leaRned foR smallHoldeR agRicultuRe
Remotely sensed dataWith the challenges of ground-based data, the sector has begun to turn to satellite
data either as a possible supplement to ground-based data indices or to create remote
sensing index insurance products.
Remotely sensed indices do not take direct measurement on the ground. Instead,
remote sensors on satellites collect different types of datasets based on specific
biophysical dynamics, such as cloud temperature to estimate rainfall, evaporation
and transpiration of water from the soil/plant system (evapotranspiration), soil
moisture content or vegetation greenness. These data are typically calibrated with
some ground information to create index data. The index is designed to proxy yield
loss based on the remote sensing parameters used.
Remotely sensed data have several advantages over ground-based data that make
them interesting potential alternatives. In particular, remotely sensed data:
• are difficult for the parties involved in the insurance transaction to influence;
• are spatially continuous across large areas of the earth;
• may have extended historical records;
• can be available in near real-time;
• can be freely accessible and available in their unprocessed version;
• can generate a large spectrum of indices that detect biophysical changes in
plant growth such as soil moisture, rainfall, temperature and vegetation
greenness; and can, therefore, calculate yield loss due to risks beyond rainfall.
Because of these advantages, remote sensing-based index insurance could help with
scalability and sustainability issues. However, remotely sensed data are not yet being
used to their full potential for index insurance.
One bottleneck is that there is a lack of reliable information on remote sensing
for index insurance, including different methodology options and their possible
combinations, what works best in which areas and for which types of crops, and
whether and how remote sensing solutions can be mainstreamed into index
insurance. These are some of the challenges that the project ‘‘Improving Agricultural
Risk Management in Sub-Saharan Africa: Remote Sensing for Index Insurance’’
sought to address (see Chapter 2).

20
©IFAD/Olivier Asselin

21
Remote sensing foR index insuRance findings and lessons leaRned foR smallHoldeR agRicultuRe
2. Project goal, objectives and organization
Project overviewWith financial support from the Agence Francaise de Développement (AFD) and an
additional contribution from the Belgian Federal Science Policy Office (BELSPO),
the International Fund for Agricultural Development (IFAD) and World Food
Programme (WFP) implemented an innovative project “Improving agricultural risk
management in sub-Saharan Africa: remote sensing for index insurance”, which ran
from 2012 to 2016. The project was designed to fill a critical information gap and
address a scaling-up constraint for index insurance. Its overall goal was to contribute
to scalable and sustainable approaches to index insurance, with the objective
of evaluating the feasibility of remote sensing for index insurance to benefit
smallholder farmers.
Based on extensive research into the sector, the project developed and tested
seven innovative remote sensing methodologies over two seasons in Senegal. These
were evaluated to produce findings and recommendations on:
• the performance of the different indices in accurately depicting village-level
yield loss due to weather and other perils (depending on the remote sensing
approach) (see Box 3); and
• the operational feasibility and implementation needs for mainstreaming
remote sensing in index insurance operations.
Box 3. index insurance levels
Indices could be used in operational insurance schemes delivered at the micro level or, in more aggregated forms, at the meso level. Even if index insurance is distributed through aggregators, it is classified as a micro-level index insurance where the policyholder is the farmer. This structure is the most common internationally. Although there has been much interest in meso-level index insurance (where the aggregator acts as policyholder and is responsible for decisions on distribution of payouts), there are very few operational examples. A key example of macro-level index insurance is African Risk Capacity, where government is the policyholder.
To help analyse performance, each season, crop monitoring on the ground took
place in Senegal in three regions of interest (ROIs), 20 km x 20 km areas that were
identified in Diourbel, Koussanar and Nioro. These ROIs differ in rainfall pattern
and risk profile (see Chapter 4).

22
2. Project goAl, oBjectives And orgAnizAtion
Seven remote sensing service providers (RSSPs) were selected for participation
in the project: Environmental Analysis and Remote Sensing (EARS), Famine Early
Warning Systems Network (FEWS NET), GeoVille, the International Research
Institute for Climate and Society (IRI), the Faculty of Geo-Information Science and
Earth Observation (University of Twente) (ITC), sarmap and the Flemish Institute
for Technological Research [Vlaamse Instelling voor Technologisch Onderzoek] (VITO),
the latter also acted as the project’s technical coordinator. The RSSPs developed
index structures to cover losses of maize, groundnut and millet in each of the ROIs2
that were the basis for testing and performance analysis.3 However, it was not the
objective of the project to commercialize the structures designed as insurance
contracts. At the same time, ground monitoring of crops was being undertaken to
assess the ground situation and support analysis of index performance. Official
government yield statistics from 2002 were used to support the analysis of the
methodologies tested.
The project united a wide range of different actors who would not normally have
collaborated. Their expertise spanned remote sensing, insurance and reinsurance,
aid and development and agricultural research (see Table 1).
A multidisciplinary evaluation committee was tasked with assessing the technical
and operational performance of the methodologies developed (see Chapter 8),
and highlighting the opportunities and constraints of each methodology to better
understand the feasibility of remote sensing for index insurance.
figure 1. Project steps
2 Diourbel did not include maize as it is not grown there.3 sarmap was tasked with developing and testing crop maps based on Synthetic Aperture Radar (SAR) data and not insurance contract structures.
2012Research and set up
2013-2015R&D cycleProduct development TestingGround monitoringPerformance analysis
2016EvaluationLessons and �ndings
2017+Scaling up for IFAD, WFP and index insurance sector

23
Remote sensing foR index insuRance findings and lessons leaRned foR smallHoldeR agRicultuRe
Needs of end-users, stakeholders and clientsThe project focused on end-users and their needs, considering the ways in
which stakeholders might implement and maintain sustainable index insurance
programmes that make use of remote sensing.
Although insurers may be considered the primary end-users, there are a wide
range of stakeholders who need to be brought together to design and implement
agricultural insurance products and programmes. Insurers have a central role, but
they may not be the prime movers of such initiatives. In developing countries,
programmes are often initiated by donors and development agencies, working in
conjunction with insurers and national partners in both private and public sectors.
Insurance is often integrated into agricultural development programmes and linked
to supply chains, and it may be bundled with finance. These stakeholders and
their needs are best considered in the context of the different stages of insurance
programme design and implementation planning (see Table 2).
table 1. Project partners
management and coordination
IFAD-WFP Weather Risk Management Facility (WRMF) in cooperation with technical experts in agricultural insurance and risk management.
remote sensing service providers
EARS, FEWS NET, GeoVille, IRI, ITC, sarmap, and VITO (which also acted as the project’s technical coordinator)
crop monitoring
Senegalese Institute for Agricultural Research (ISRA) together with experts from the International Cooperation Centre in Agricultural Research for Development (CIRAD) and the Regional Research Centre for Improving Adaptation to Drought (CERAAS)
Project evaluation committee
• Insurance sector: Swiss Re and other reinsurance experts, PlaNet Guarantee• Remote sensing experts: National Aeronautics and Space Administration (NASA),
European Space Agency, Italian Space Agency, WFP, FAO, European Commission Joint Research Centre (JRC), Technical University of Denmark
• Index insurance development actors: experts from World Bank’s Global Index Insurance Facility (GIIF), BASIS I4
• In-country agricultural and remote sensing experts: Centre de Suivi Ecologique, ISRA, CIRAD/CERAAS
24
2. Project goAl, oBjectives And orgAnizAtion
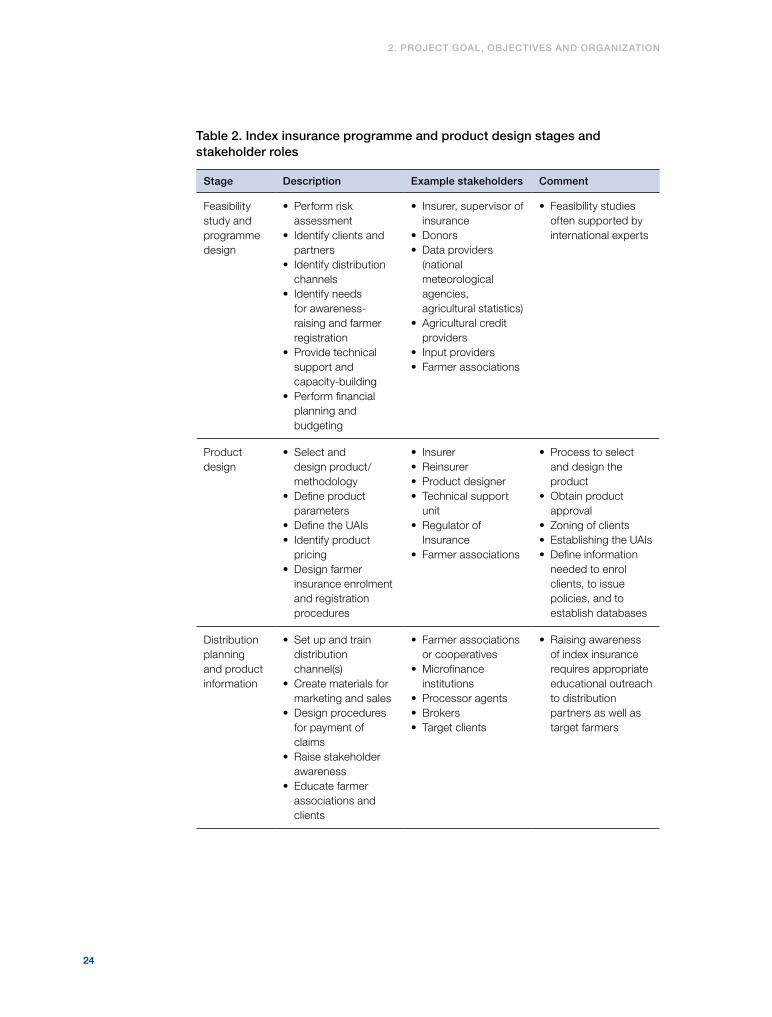
table 2. index insurance programme and product design stages and stakeholder roles
stage description example stakeholders comment
Feasibility study and programme design
• Perform risk assessment
• Identify clients and partners
• Identify distribution channels
• Identify needs for awareness-raising and farmer registration
• Provide technical support and capacity-building
• Perform financial planning and budgeting
• Insurer, supervisor of insurance
• Donors• Data providers
(national meteorological agencies, agricultural statistics)
• Agricultural credit providers
• Input providers• Farmer associations
• Feasibility studies often supported by international experts
Product design
• Select and design product/methodology
• Define product parameters
• Define the UAIs• Identify product
pricing• Design farmer
insurance enrolment and registration procedures
• Insurer• Reinsurer• Product designer• Technical support
unit• Regulator of
Insurance• Farmer associations
• Process to select and design the product
• Obtain product approval
• Zoning of clients• Establishing the UAIs• Define information
needed to enrol clients, to issue policies, and to establish databases
Distribution planning and product information
• Set up and train distribution channel(s)
• Create materials for marketing and sales
• Design procedures for payment of claims
• Raise stakeholder awareness
• Educate farmer associations and clients
• Farmer associations or cooperatives
• Microfinance institutions
• Processor agents• Brokers• Target clients
• Raising awareness of index insurance requires appropriate educational outreach to distribution partners as well as target farmers

25
Remote sensing foR index insuRance findings and lessons leaRned foR smallHoldeR agRicultuRe
Additionally, the project focused on smallholders as the clients of index insurance.
The demand for index insurance schemes is strongest if farmers are individually
insured, and the ultimate policyholder is the smallholder (under “micro-level” index
insurance schemes) (see Box 3). This means the smallholder is directly covered and
would see a direct benefit from the insurance coverage even if the insurance product
itself is bundled with other financial and non-financial services. This is different from
purely meso-level schemes in which an entity, such as a microfinance institution, is
the policyholder; or macro-level schemes, such as African Risk Capacity, where the
government is the policyholder. Both schemes can have indirect or direct benefits
for a smallholder farmer, depending on the design. In this project, the remit was
set to see whether the remote sensing methodologies could depict losses occurring
for smallholders at the village level, and to determine the UAI appropriate to each
methodology, within which smallholders could be grouped (see page 58 for more
on UAIs).
remote sensing implications for insurers The potential opportunities for insurers to use remote sensing for improving and
scaling up index insurance are significant. The project was designed to consider
both the technical and operational opportunities and the specific requirements and
challenges remote sensing involves for insurers.
Key challenges for insurers • Technical complexity and access to expertise. The move into index insurance –
particularly using remote sensing – is a departure for insurers, whose core
business is a diverse range of motor, commercial and personal lines of insurance.
Under traditional indemnity insurance, the insurer controls almost all aspects of
underwriting and distribution, with only loss adjustment delegated to third
parties. The introduction of weather index insurance or area yield index insurance
means insurers need to develop new technical skills and to access specialists in
index insurance design and agro-meteorology, when setting index parameters
based on the analysis of weather data and agricultural production data. With
index insurance products based on remote sensing technology, another layer
of technical complexity is added.
• Access to agricultural and risk information and experts. Technical expertise
is needed to ensure that the index product can be context-specific for the target
clients. For example, access is needed to experts who understand agricultural
risks, causes of loss, farming systems and crop varieties, as well as soil water
balance. This requires that the insurer set up contacts with outside organizations
or experts in such disciplines as agricultural research, extension, etc. Insurers
need either to access fully outsourced feasibility studies to design the product
and programme (see Table 2) or to work with national actors. In comparing
different methodologies of remote sensing, a factor of importance to the insurer
is the extent of ground-truthing needed to calibrate the products in the areas
26
2. Project goAl, oBjectives And orgAnizAtion
that will be insured (and thus to design operational products). If strong local
fieldwork (including data collection or community participation) is needed,
this is a potential constraint and creates additional costs in implementation
while limiting the speed of roll-out and the opportunity to scale up.
• Basis risk. Basis risk remains the single, largest challenge of index insurance.
Insurance payouts that do not correspond to the true loss experienced by
the farmer, and which were caused by perils intended to be covered by the
policy, carry the danger of poor value to the client, client dissatisfaction,
and reputational risk for the insurer and for all stakeholders. A key question,
therefore, is how each remote sensing methodology “performs”, in terms
of both underpayment and overpayment against losses. The extent of basis
risk is closely linked to the resolution of the remote sensing, where index
measurements may be made through single pixels, or groups of pixels that are
aggregated to form the UAI. An objective of the project has been to understand
the extent of variation of crop yields at the level of the individual farmer, village
and larger aggregated area. Similarly, understanding the causes of crop loss
(whether related to weather or to other risks such as pests and disease, or due
to low-intensity farming and diverse farming practices) is extremely important
in order to interpret the potential basis risk from different methodologies.
Key opportunities for insurers• Farmer enrolment, satellite resolution and unit areas of insurance. The
opportunities opened up by pixel data at a higher resolution might seem very
attractive to an insurer as, in theory, this could allow payouts to be measured
from data that are specific to local areas such as villages. For an insurer, the
decision on the optimum UAI is very important. The UAI should be small
enough to allow payouts to match the losses at a local level, but not so small
that the allocation of farmers to UAIs becomes a complex task (likewise, index
design becomes complex if indices need to be calibrated to a very local level).
A UAI that is too small could actually increase basis risk.
• Harnessing technology for distribution and sales. The development of
technology such as high resolution mapping via geographical information
systems (GIS) helps insurers better understand the geographical distribution of
a portfolio of insured farmers, their locations, factors affecting risks and land
use; it also strongly supports effective distribution and underwriting of index
insurance. For example, the insurance marketed by ACRE (Agriculture and
Climate Risk Enterprise) in Kenya is linked to reporting of sowing and location
by mobile phone.4 Further, understanding the geographical distribution of a
portfolio of insured farmers is important in order to understand the spread of
risk and likely financial outcomes.
4 See http://www.wfo-oma.com/climate-change/case-studies/kilimo-salama-safe-agriculture-index-based-agriculture-insurance.html

27
Remote sensing foR index insuRance findings and lessons leaRned foR smallHoldeR agRicultuRe
• Portfolio information, mapping and geographical information systems.
Another potential advantage of remote sensing is that it allows the insurer to
have a good informational database in its sales areas, where a client database
is linked to a GIS platform held by the insurer. Agricultural insurance in
developed countries now relies heavily on technology (tablets or devices) to
record locations of insured farmers, and map information such as land use,
fields boundaries and client insurance information (e.g. premiums, claims,
yield history). Although there are fewer needs for individual client information
in index insurance, insurers consider it very important to understand their
clients, their locations, and factors affecting risks and land use. Remote sensing
offers excellent opportunities to build GIS data systems with a user interface
for insurers.

28
©IFAD/Susan Beccio

29
Remote sensing foR index insuRance findings and lessons leaRned foR smallHoldeR agRicultuRe
3. Remote sensing overview and approaches
For more than 20 years, agricultural monitoring has been one of the primary
operational applications of earth observation. Remote sensing can significantly
contribute to providing a timely and accurate picture of crop growth and development
as it can gather information over large areas with a high revisit frequency. Moreover,
the availability of remote sensing data archives allows users to compare climate and
vegetation over time and analyse trends.
Many national and international remote sensing-based agricultural monitoring
systems have emerged over the past decades. Well known examples are the FAO
Global Information and Early Warning System (GIEWS), the JRC Monitoring
Agricultural Resources (MARS), the USAID Famine Early Warning System (FEWS
NET) and the ISRA Crop Watch systems. These applications have remained primarily
in the public sector but, over the past decade, the interest from the private sector has
been steadily growing.
There are two main types of remote sensing systems – “passive” sensors and
“active” sensors. Passive sensors measure either sunlight being reflected (visual
and near-infrared light) or radiation being emitted (thermal or microwave) from
the earth’s surface. Like our eyes, these sensors operate largely within the optical
spectrum, producing images that are recognizable and easily interpreted. Passive
sensors, however, do not provide information in the case of cloud coverage.
Active sensors are independent from the sun’s illumination because they have
their own energy source (usually microwave) directed towards the earth’s surface.
Radio detection and ranging (RADAR), for example, sends microwave radiation at a
specific polarization (horizontal or vertical), which is backscattered from (bounced
off) the earth’s surface and recorded again by the sensor. The amount of energy
received by the sensor is determined by, among other variables, the surface roughness
and moisture content, and can be interpreted accordingly. RADAR images are more
difficult to interpret, but the key advantage of active sensors is that images can be
acquired at any time of the day and in cloudy weather conditions.
30
3. remote sensing overview And APProAches
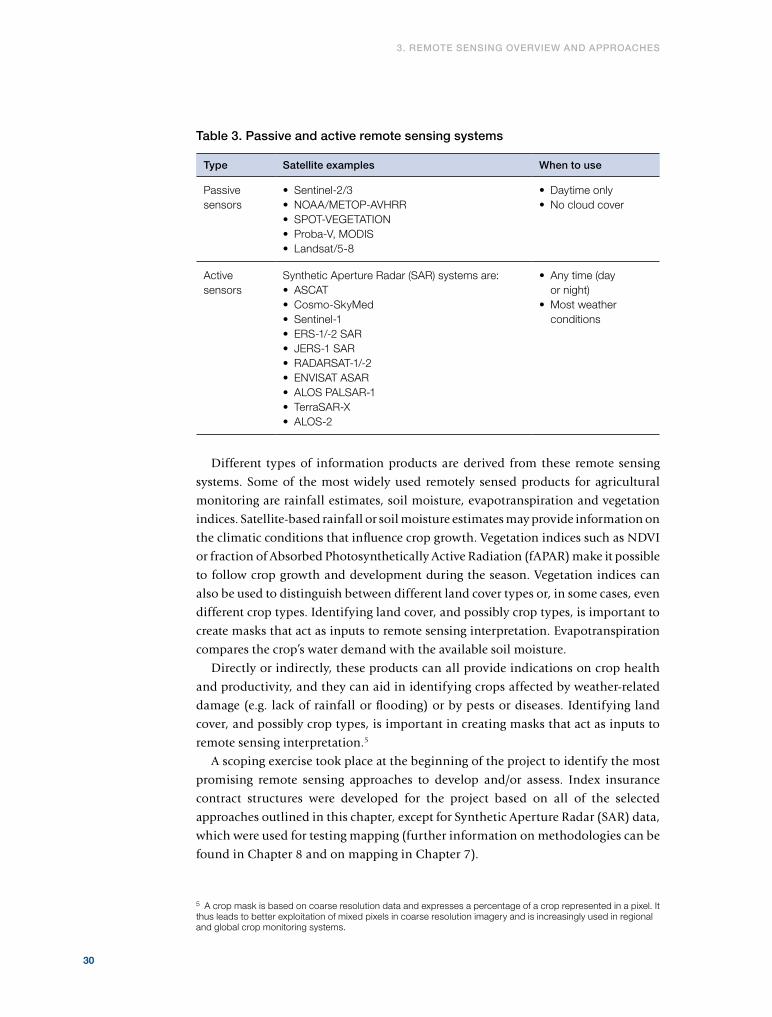
table 3. Passive and active remote sensing systems
type satellite examples when to use
Passive sensors
• Sentinel-2/3• NOAA/METOP-AVHRR• SPOT-VEGETATION• Proba-V, MODIS • Landsat/5-8
• Daytime only• No cloud cover
Active sensors
Synthetic Aperture Radar (SAR) systems are: • ASCAT• Cosmo-SkyMed• Sentinel-1• ERS-1/-2 SAR• JERS-1 SAR• RADARSAT-1/-2• ENVISAT ASAR• ALOS PALSAR-1• TerraSAR-X• ALOS-2
• Any time (day or night)
• Most weather conditions
Different types of information products are derived from these remote sensing
systems. Some of the most widely used remotely sensed products for agricultural
monitoring are rainfall estimates, soil moisture, evapotranspiration and vegetation
indices. Satellite-based rainfall or soil moisture estimates may provide information on
the climatic conditions that influence crop growth. Vegetation indices such as NDVI
or fraction of Absorbed Photosynthetically Active Radiation (fAPAR) make it possible
to follow crop growth and development during the season. Vegetation indices can
also be used to distinguish between different land cover types or, in some cases, even
different crop types. Identifying land cover, and possibly crop types, is important to
create masks that act as inputs to remote sensing interpretation. Evapotranspiration
compares the crop’s water demand with the available soil moisture.
Directly or indirectly, these products can all provide indications on crop health
and productivity, and they can aid in identifying crops affected by weather-related
damage (e.g. lack of rainfall or flooding) or by pests or diseases. Identifying land
cover, and possibly crop types, is important in creating masks that act as inputs to
remote sensing interpretation.5
A scoping exercise took place at the beginning of the project to identify the most
promising remote sensing approaches to develop and/or assess. Index insurance
contract structures were developed for the project based on all of the selected
approaches outlined in this chapter, except for Synthetic Aperture Radar (SAR) data,
which were used for testing mapping (further information on methodologies can be
found in Chapter 8 and on mapping in Chapter 7).
5 A crop mask is based on coarse resolution data and expresses a percentage of a crop represented in a pixel. It thus leads to better exploitation of mixed pixels in coarse resolution imagery and is increasingly used in regional and global crop monitoring systems.
31
Remote sensing foR index insuRance findings and lessons leaRned foR smallHoldeR agRicultuRe
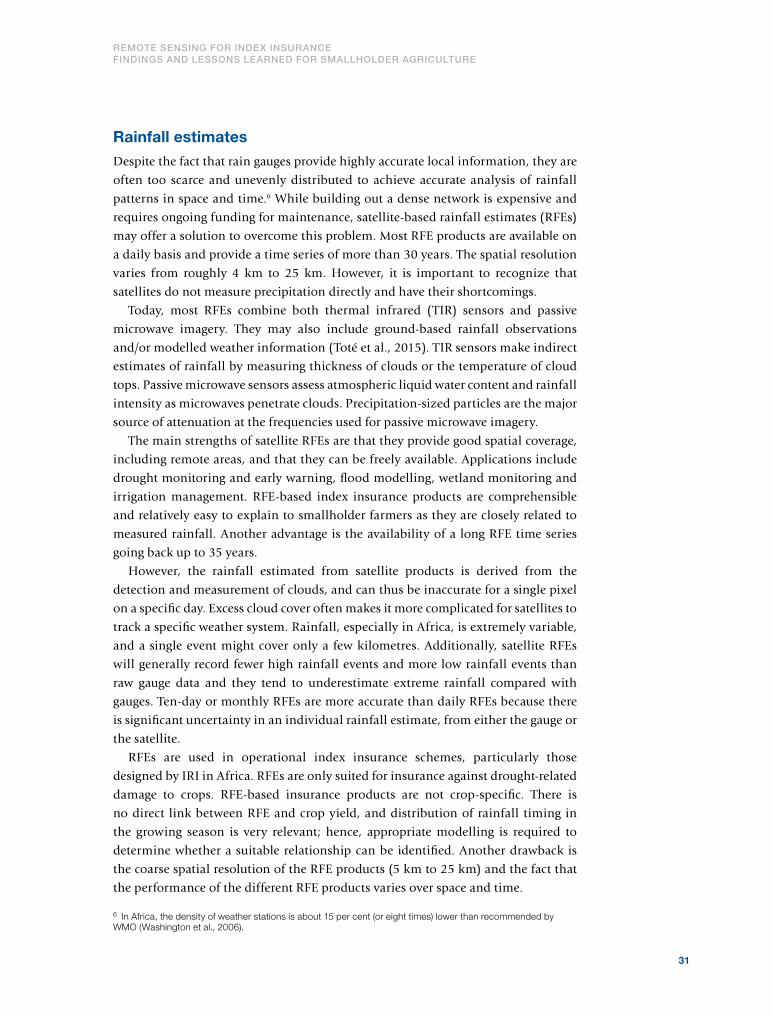
Rainfall estimatesDespite the fact that rain gauges provide highly accurate local information, they are
often too scarce and unevenly distributed to achieve accurate analysis of rainfall
patterns in space and time.6 While building out a dense network is expensive and
requires ongoing funding for maintenance, satellite-based rainfall estimates (RFEs)
may offer a solution to overcome this problem. Most RFE products are available on
a daily basis and provide a time series of more than 30 years. The spatial resolution
varies from roughly 4 km to 25 km. However, it is important to recognize that
satellites do not measure precipitation directly and have their shortcomings.
Today, most RFEs combine both thermal infrared (TIR) sensors and passive
microwave imagery. They may also include ground-based rainfall observations
and/or modelled weather information (Toté et al., 2015). TIR sensors make indirect
estimates of rainfall by measuring thickness of clouds or the temperature of cloud
tops. Passive microwave sensors assess atmospheric liquid water content and rainfall
intensity as microwaves penetrate clouds. Precipitation-sized particles are the major
source of attenuation at the frequencies used for passive microwave imagery.
The main strengths of satellite RFEs are that they provide good spatial coverage,
including remote areas, and that they can be freely available. Applications include
drought monitoring and early warning, flood modelling, wetland monitoring and
irrigation management. RFE-based index insurance products are comprehensible
and relatively easy to explain to smallholder farmers as they are closely related to
measured rainfall. Another advantage is the availability of a long RFE time series
going back up to 35 years.
However, the rainfall estimated from satellite products is derived from the
detection and measurement of clouds, and can thus be inaccurate for a single pixel
on a specific day. Excess cloud cover often makes it more complicated for satellites to
track a specific weather system. Rainfall, especially in Africa, is extremely variable,
and a single event might cover only a few kilometres. Additionally, satellite RFEs
will generally record fewer high rainfall events and more low rainfall events than
raw gauge data and they tend to underestimate extreme rainfall compared with
gauges. Ten-day or monthly RFEs are more accurate than daily RFEs because there
is significant uncertainty in an individual rainfall estimate, from either the gauge or
the satellite.
RFEs are used in operational index insurance schemes, particularly those
designed by IRI in Africa. RFEs are only suited for insurance against drought-related
damage to crops. RFE-based insurance products are not crop-specific. There is
no direct link between RFE and crop yield, and distribution of rainfall timing in
the growing season is very relevant; hence, appropriate modelling is required to
determine whether a suitable relationship can be identified. Another drawback is
the coarse spatial resolution of the RFE products (5 km to 25 km) and the fact that
the performance of the different RFE products varies over space and time.
6 In Africa, the density of weather stations is about 15 per cent (or eight times) lower than recommended by WMO (Washington et al., 2006).

32
3. remote sensing overview And APProAches
Soil moisture estimatesMoisture in the soil determines crop growth and agricultural production.
Observations from both active and passive microwave satellites can be used to map
soil moisture in the upper soil layer (< 5cm) (Srivastava et al., 2016). The European
Space Agency’s (ESA) CCI SM v02.1 dataset – which dates back to 1978 and is based
on the statistical blending of active and passive satellite sensor data – is an example
of a soil moisture dataset that is often used for research purposes. Other operational
datasets include ASCAT, AMSR-E and SMOS-based soil moisture estimates and
datasets derived from NOAA’s SMOPS or NASA’s SMAP soil moisture missions.
Most soil moisture products are available on a daily basis. The spatial resolution of
the global products ranges from 1 km to 50 km. However the 1 km Sentinel-1 soil
moisture product was not available at the time of the project. Due to the natural
variability in rainfall, topography, soil characteristics and vegetation properties, soil
moisture may vary considerably from one location to another and from one moment
to another in the season. This natural variability in soil moisture content and local
variability in the performance of the satellite-based soil moisture algorithms can
also result in the quality of the global soil moisture products (especially the older
ones) being quite variable (Dorigo et al., 2015).
Soil moisture, as measured by remote sensing techniques, represents only the first
few centimetres of the soil. However, for agricultural monitoring a representation of
root-zone soil moisture is more important. Therefore, the Soil Water Index (SWI) was
Horizons
0 (Organic)
A (Surface)
B (Subsoil)
C (Substratum)
R (Bedrock)
SWI
SSM
figure 2. surface soil moisture (ssm) measured by satellites versus modelled soil water index (swi)

33
Remote sensing foR index insuRance findings and lessons leaRned foR smallHoldeR agRicultuRe
figure 3. evapotranspiration
Source: www.salinitymanagement.org.
developed by the Vienna University of Technology (TU Wien) (Wagner, 1998) in the
late 1990s to represent the soil moisture content in the first metre of the soil. The
SWI is calculated using a two-layer water model (see Figure 2). A revised version of
the product, using ASCAT satellite data as input, is made available in near real-time
by the Copernicus Global Land Service.
Satellite-based soil moisture data support the monitoring of droughts, floods and
wetlands, and are frequently used as input for water and irrigation management.
Thanks to the availability of long time series, soil moisture data are also often used
for climate studies.
Soil moisture data are not yet used in operational index insurance schemes,
although they may offer some potential. Soil moisture-based index insurance
products are comprehensible and may be relatively easy to explain to smallholder
farmers. Another advantage for building insurance products is the availability
of a long time series of data. However, just like RFE, soil moisture products are
only suited for insurance against drought-related damage to crops. It is assumed
that lower soil water content leads to a reduction in vegetation activity and hence
reduced crop yields. Other drawbacks include the coarse spatial resolution and the
variable accuracy of the global soil moisture products.
Evapotranspiration estimatesEvapotranspiration (ET) is the sum of evaporation and plant transpiration from the
earth’s land and ocean surfaces to the atmosphere. Evaporation accounts for the
movement of water to the air from sources such as the soil, canopy interception and
water bodies.
Precipitation
Transpiration
Evaporation

34
3. remote sensing overview And APProAches
Actual ET (ETa) is a function of the water demand by the crop (potential ET or
ET0) and the water reserves in the soil. ETa can be derived from satellite observations
using two different approaches. The most common approach is to use land surface
energy balance models. Input to these models consists of visible, NIR and TIR
observations from satellite sensors such as Meteosat or MODIS, whether or not
complemented with weather station data. The second approach relies on the ability
of satellite-based vegetation indices (Vis) to trace the crop growth and estimate the
basal crop coefficient (Kcb), i.e. a crop-specific conversion factor needed to adjust
potential ET (estimated from weather station data) to the crop-specific ETa.
Relative evapotranspiration (ETr) is derived by dividing ETa by ET0. ETr provides
an indication of plant water availability in the root zone and can be considered a
measure of actual plant water use.
ET products are usually made available on an 8-day to 10-day basis. The spatial
resolution varies from roughly 1 km to 3 km. Depending on the satellite observations
used, the time series can go back up to 35 years.
ET is a good indicator for agricultural drought. FAO addressed the relationship
between crop yield and water use in the late 1970s, proposing a simple equation
where relative yield reduction is related to the corresponding relative reduction in
ET (Steduto et al., 2012).
ET is a key variable that plays a strategic role in water resource management,
agriculture, ecology and climate change. ETa anomaly products generated by
FEWS NET are used for African agricultural drought monitoring and food security
status assessment.
In 2009, EARS started FESA Micro-insurance with the aim of developing low cost
micro-insurance for Africa based on ETr derived from Meteosat data. Since 2011,
crop-specific insurance products have been developed and provided for maize,
wheat, rice, beans and cotton in Benin, Burkina Faso, Kenya, Mali, Rwanda and
Tanzania. ET-based index insurance products pay out when the ET calculated for
one or more windows is lower than the pre-defined threshold.
Vegetation indicesThe time series of optical satellite data from sensors such as SPOT-VGT, Proba-V,
NOAA/METOP-AVHRR and MODIS have been used for many years by the public
sector to monitor and map vegetation anomalies over large areas, and to assess major
damage caused by extreme climatic conditions. Thanks to their frequent availability,
these images are very interesting for monitoring crop growth and development. One
drawback is their rather coarse spatial resolution with pixel sizes varying between
250 m and 1 km. Increasingly, high-resolution images (10-20 m) are becoming
available, but the time series, which are currently less than 10 years, are still too
limited for high resolution agricultural monitoring (for further discussion see the
section on unit areas of insurance, page 58). Crop monitoring with optical satellite
images can be hampered by persistent cloud cover, though special techniques, such
as profile smoothing or data fusion, may offer a solution to overcome this problem.

35
Remote sensing foR index insuRance findings and lessons leaRned foR smallHoldeR agRicultuRe
The best-known vegetation index is the Normalized Difference Vegetation Index
(NDVI). It is a simple product based on the combination of the measured reflectances7
in the red and near-infrared parts of the spectrum. NDVI is a good indicator of
the amount and the condition of the vegetation. More advanced indicators include
the fraction of Absorbed Photosynthetically Active Radiation (fAPAR) and the Leaf
Area Index (LAI). Compared with NDVI, these model-based, biophysical variables
often show a better correlation with crop yield and primary production. Due to its
sensitivity to vegetation stress, fAPAR is often used as a drought indicator among
others by the JRC European Drought Observatory.
Insurance programmes based on vegetation indices, mainly NDVI, currently exist
and are implemented on a sizeable scale in Canada, Ethiopia, India, Kenya, Spain and
the United States. In most cases, these are grassland or livestock products insuring
against drought, although similar products for crops are also being developed in
Ethiopia with the support of ITC.
As it is a good indicator of vegetation vigour (or health) and yield, NDVI is
suitable for index-based insurance to provide cover against drought or other perils
that are impacting crop yield (e.g. those pests or diseases that have a visible impact
on the plants’ health condition). The relationship between NDVI and crop yields,
however, is highly variable depending on crops and regions. It also assumes that
sufficiently long time series of accurate and preferably fine-scale yield data are
available for calibration, which, in practice, may be problematic, especially in
developing countries.
Synthetic Aperture Radar dataSynthetic Aperture Radar (SAR) data are frequently used for crop mapping
(localization and identification of crops; for more details, see Chapter 7), but they
can also be used for monitoring crop growth and development. SAR systems can
penetrate clouds, which is an advantage when monitoring crops in areas that are
frequently covered by clouds. SAR images provide information on a crop’s structure,
unlike optical images, which provide information on its health. By taking advantage
of the particular sensitivity of SAR-to-surface roughness and moisture content,
additional information about soil preparation can be discovered. For example,
by monitoring changes in surface roughness, soil tillage and/or crop-specific field
activities can be detected. SAR data are frequently used to monitor rice in Cambodia,
India, Indonesia, the Philippines, Thailand and Viet Nam.
In combination with a crop growth model, the technique also makes it possible
to estimate rice yield. Index insurance products using SAR were developed for South
East Asia in collaboration with sarmap as part of the RIICE project (http://www.
riice.org/).
7 Reflectance is the ratio of the intensity of reflected radiation to that of the radiation incident on a surface.

36
©IFAD/Sarah Morgan

37
Remote sensing foR index insuRance findings and lessons leaRned foR smallHoldeR agRicultuRe
4. Selection of regions of interest and crops
Senegal was chosen as a good test country to better understand the different
performance and viability of remote sensing for index insurance. It was also chosen
because of the variability of its weather and climate patterns and its conducive
operational conditions.
The three 20 km x 20 km areas known as regions of interest (ROIs) were located
within Diourbel, Koussanar and Nioro. These were the areas on which development,
testing and performance analysis of insurance contract structures took place. They
were selected because they represent typical areas producing smallholder annual
crops and because of the different seasonal precipitation patterns within Senegal
that progressively decrease from south to north. The selection criteria included
existing crop monitoring in the areas, in addition to the following considerations:
• Koussanar is one of the project sites for the R4 Rural Resilience Initiative
of WFP and Oxfam America (which includes operational implementation
of index insurance); has less cultivated land and poor food security; and
produces maize.
• Diourbel and Nioro are situated within the groundnut basin and demonstrate
differing but relatively more intensive and well-organized agriculture.
• Nioro produces seeds, and maize is prevalent.
• In all of the areas, both millet and groundnut are cultivated.
• All ROIs are exposed to the same production risks and constraints, including:
- dependence on rainfall
- lack of timely access to quality seeds, inputs and technology
- poor soil quality (lack of phosphate and deforestation)
- birds and pests.
Each ROI was defined by precise geographic boundaries, which enabled sourcing
of the correct satellite and ground data to develop the methodologies and contract
structures for testing. Different structures were developed for the predominant
crops in each area. Intensive ground data monitoring took place within these ROIs
during each season of the project to validate the performance and accuracy of the
indices developed.

38
4. selection of regions of interest And croPs
figure 4. Project rois
Region of interest
Isohyet (mm)
Regional capital
Mauritania
0 100
Mali
GuineaGuinea-Bissau
Gambia
dakar
diourbel
kaffrine
Koussanar
tambacounda
nioro
fatick
300
400
500
700
600
800 900
1000
11001100
1000
1200
1200
1300
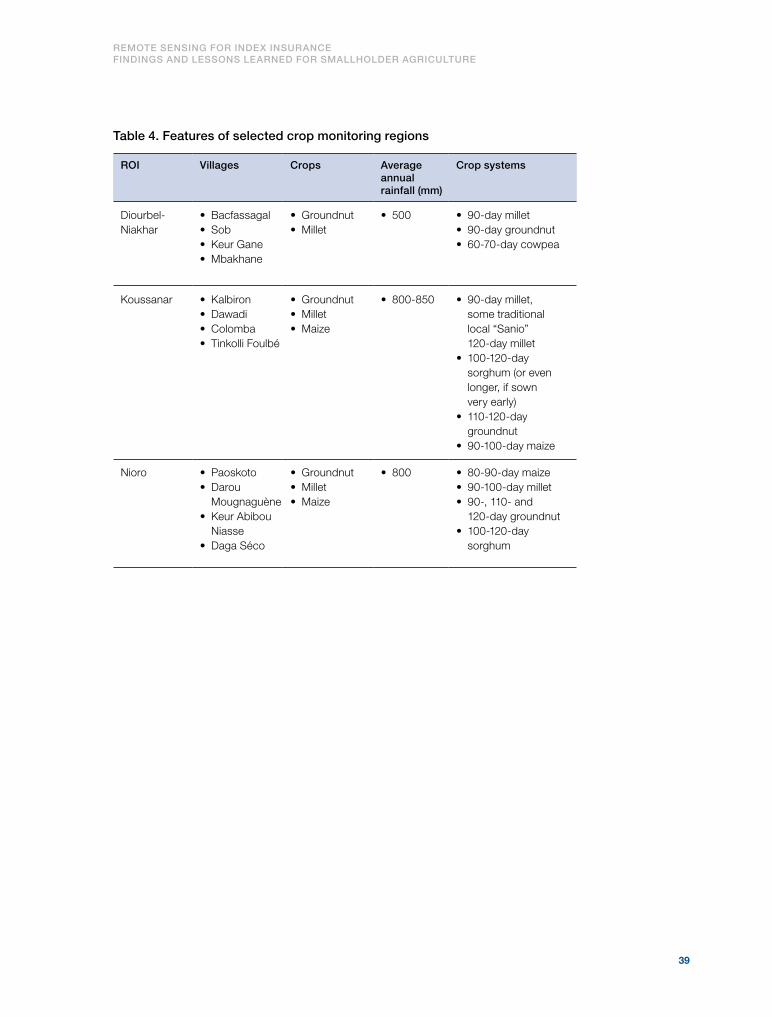
39
Remote sensing foR index insuRance findings and lessons leaRned foR smallHoldeR agRicultuRe
table 4. features of selected crop monitoring regions
roi villages crops Average annual rainfall (mm)
crop systems
Diourbel-Niakhar
• Bacfassagal• Sob• Keur Gane• Mbakhane
• Groundnut• Millet
• 500 • 90-day millet• 90-day groundnut• 60-70-day cowpea
Koussanar • Kalbiron• Dawadi• Colomba• Tinkolli Foulbé
• Groundnut• Millet• Maize
• 800-850 • 90-day millet, some traditional local “Sanio” 120-day millet
• 100-120-day sorghum (or even longer, if sown very early)
• 110-120-day groundnut
• 90-100-day maize
Nioro • Paoskoto• Darou
Mougnaguène• Keur Abibou
Niasse• Daga Séco
• Groundnut• Millet• Maize
• 800 • 80-90-day maize • 90-100-day millet• 90-, 110- and
120-day groundnut• 100-120-day
sorghum

40
©IFAD/Sarah Morgan

41
Remote sensing foR index insuRance findings and lessons leaRned foR smallHoldeR agRicultuRe
5. Ground data used
Ground data were used to calibrate remote sensing insurance contract structures
and to carry out analysis of their performance – both in past years and during the
project’s test seasons.
The focus was mainly on yield data. Official yield statistics going back to 2001
were sourced and underlying field level data were obtained. Separately, yield and
rainfall data were more intensively collected and analysed specifically for the project.
Aside from for the calibration and performance analysis of the insurance
products, the yield and rainfall data were also analysed to produce supplementary
information on yield and rainfall behaviour in the ROIs.
Yield datahistorical yield data
Agricultural statistics for SenegalIn Senegal, the Direction de l’Analyse, de la Prévision des Statistiques Agricoles (DAPSA),
as part of the Ministry of Agriculture, is responsible for collecting agricultural
statistics. Crop yield and area statistics are provided for 14 regions (Dakar, Diourbel,
Fatick, Kaffrine, Kaolack, Kédougou, Kolda, Louga, Matam, Saint-Louis, Sedhiou,
Tambacounda, Thies and Ziguinchor) and 45 departments (i.e. départments, DEPs).
At the administrative level, these departments are further divided into communautés
rurales (CRs) (see Figure 5).
DAPSA yield statistics at the department level (DEP)The department (DEP) is the official data collection unit of DAPSA. DEP yield
and area statistics are published online (http://senegal.countrystat.org/home/fr/).
Historical data are available from 1997 onwards. A description of how the data are
collected in the field and how the statistics are calculated can also be found on the
DAPSA website.
As can be seen in Figure 5, the spatial extent of the departments is much larger
than the 20 km x 20 km ROIs selected for insurance product development; and
the ROIs do not necessarily fall within one department only. Furthermore, the
departments vary widely in size, such that Nioro and Diourbel are much smaller
departments than Tambacounda (where Koussanar is located). The DEP statistics
also reveal a large variability between departments. It thus became clear that the
project required more detailed yield information.
At the request of the project, the field-level crop yield data that form the basis
of the DEP statistics were received from DAPSA for a subset of CRs (see Figure 5,
yellow-green CRs). From the field level, aggregated yield datasets for crop yield data
were derived at various levels. These derived yield statistics were used by some of the

42
5. ground dAtA used
figure 5. rois for insurance development
Diourbel, Koussanar, Nioro ROIs (in red), the departments (in black), the communautés rurales (CR) intersecting with these ROIs (in blue and dashed) and the number of DAPSA yield observations per CR (yellow-green colour scale).
RSSPs to calibrate their insurance models. The data were also used to evaluate the
performance of insurance products developed. Basic quality checks were performed
on the yield statistics by comparing the data with yields collected in the frame of
the project.
Derived yield datasetsDAPSA yield statistics at the village level
The field-level crop yields received from DAPSA were first aggregated8 at the village
level. In total, the project received field-level crop yield data for the period 2001-
2014 for 286 villages. This dataset was used by ITC to calibrate their yield model.
8 It should be noted that the statistical yield sampling methodology for Senegal (based on FAO guidelines) is tuned to obtain accurate yield estimates at the department level of aggregation. Using these data at lower aggregation levels increases the chance of mismatches caused by insufficient yield data.
Paos KotoNgole
Ndiob
Ngoye
DiakhaoNakhar
NgayokhemePatar
Prokhane
Taiba Massene Malem Niani
Koussanar
2000
Sinthiou Malem
Nioro Koussanar
Diourbel
km
Project ROI
CRs used per ROI
3-4
4-6
6-9
9-11
11-12
Senegal departments
CRs with DAPSA observations

43
Remote sensing foR index insuRance findings and lessons leaRned foR smallHoldeR agRicultuRe
DAPSA yield statistics aggregated at the CR level
The field-level yield statistics obtained from DAPSA were also aggregated over
the CRs that intersected with the 20 km x 20 km ROIs to form the “aggregated at
communauté rurale level” (aCR) yields.
The selected CRs per ROI are listed below:
• DIOURBEL: Diakhao, Ndiob, Ngayokheme, Ngohe, Ngoye, Niakhar, Patar
• NIORO: Paos Koto, Prokhane, Taiba Niassene
• KOUSSANAR : Koussanar, Malem Niani, Sinthiou Malem
Part of this aCR yield dataset (2001-2012) was used by VITO to design its index. The
complete dataset (2001-2014) was also used for validation and performance testing
of the developed index structures (see Chapter 9).
DAPSA yield statistics of the central CR of the ROI
A third option to use the yield data was selected for model development by FEWS
NET. This method used the central CR (cCR) of a 20 km x 20 km ROI for this project.
The selected CRs for each ROI are listed below:
• DIOURBEL: Patar
• NIORO: Paos Koto
• KOUSSANAR: no selection was made
Looking at Figure 5, it is clear that, for the Koussanar ROI, no CRs can be selected
because of size constraints. Moreover, none of the villages for which yield statistics
were available were located within this ROI. Therefore, no cCR yield values were
calculated for the Koussanar ROI.
yield variabilityThe historical DAPSA yield datasets (see page 41) and the field data collected under
the project (see page 44) highlight the high yield variability at the village and the
field level, for all years and for all crop types (see Figure 6). This variability is due
to several constraints (e.g. low and heterogeneous soil fertility, weeds, diseases)
affecting crops growing in non-intensified cropping conditions (e.g. no use of
improved seeds, fertilizers and pesticides) (Sultan et al., 2008). In addition, the
variability changes from year to year.
Overall, based on the average over the different regions, the variability is highest
for maize, followed by groundnut and millet. When comparing the ROIs, the yield
variability seems to be lower in Koussanar than in Diourbel and Nioro. It should
be noted, however, that sample size may be a problem in these regions, and, in
particular, in Koussanar.

44
5. ground dAtA used
figure 6. inter-annual yield variability
Inter-annual yield of groundnut, millet and maize yields in Diourbel, Koussanar and Nioro, measured by the average coefficient of variation (CV) for the years 2001-2014.
Source: DAPSA.
crop monitoringCrop monitoring took place in four groups of villages per ROI and for each principle
crop in order to validate and evaluate the performance of the different indices
developed by the RSSPs. At the same time, comparison of the yield data collected
from the fieldwork with the official yield statistics allowed these statistics to be
evaluated for model development in the ROIs (see Chapter 4).
Field data collection took place during the 2013 and 2014 growing seasons. Ten
fields per village were monitored for each crop in 2013 (see Figure 7), but this number
was extended to roughly 20 fields per village in 2014. The fields were monitored
before, during and at the end of the season, as well as post-harvest.
To gain a good qualitative understanding of the areas, a descriptive profile of
the test sites was developed based on interviews with local farmers and extension
officers active in the sites. From these interviews, information about production
patterns and techniques, crop varieties adopted and calendars, risk profile and yield
loss history was collected.
During the season, the project’s field data collection team made at least three
visits to the ROIs and collected geo-referenced information (e.g. planting, emerging
and flowering dates) from the identified villages in order to capture potential crop
yield variability due to soil properties, agricultural practices, farmer capacity, and
other variables among and within the ROIs. At the end of season, geo-referenced
information on grain yield at harvest was collected. If damage occurred, the
causes (e.g. weather-related, weed, pests, diseases) and the symptoms (e.g. wilting,
deficiencies) were noted. During an additional monitoring mission post-harvest,
grain extraction was checked, and dry grain and biomass were weighed. The
measurements provided useful information about yield variability within the ROIs.
The observed yields were also compared with the official yield statistics.
Groundnut
Millet
Maize
Diourbel Koussanar Nioro
CV
0.00
0.05
0.10
0.15
0.20
0.25
0.30
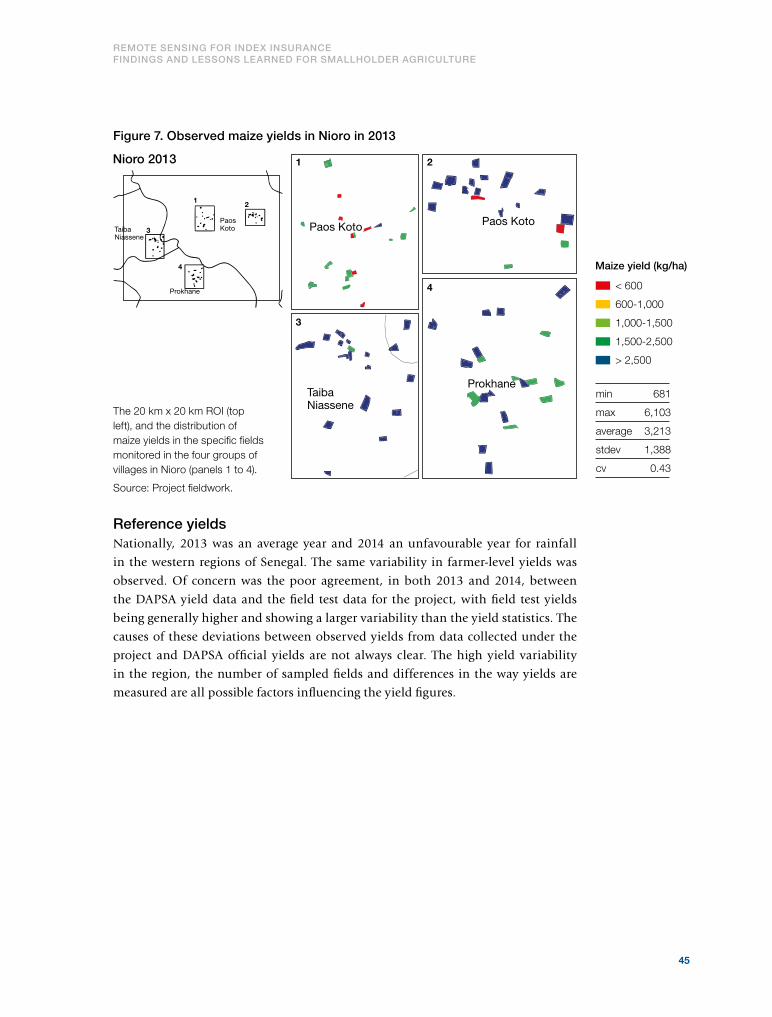
45
Remote sensing foR index insuRance findings and lessons leaRned foR smallHoldeR agRicultuRe
figure 7. observed maize yields in nioro in 2013
Paos KotoPaos KotoTaiba
Niassene
Prokhane
Paos Koto
ProkhaneTaiba Niassene
3
1Nioro 2013
12
3
4
2
4
Source: Project fieldwork.
reference yieldsNationally, 2013 was an average year and 2014 an unfavourable year for rainfall
in the western regions of Senegal. The same variability in farmer-level yields was
observed. Of concern was the poor agreement, in both 2013 and 2014, between
the DAPSA yield data and the field test data for the project, with field test yields
being generally higher and showing a larger variability than the yield statistics. The
causes of these deviations between observed yields from data collected under the
project and DAPSA official yields are not always clear. The high yield variability
in the region, the number of sampled fields and differences in the way yields are
measured are all possible factors influencing the yield figures.
< 600
600-1,000
1,000-1,500
1,500-2,500
> 2,500
min 681
max 6,103
average 3,213
stdev 1,388
cv 0.43
Maize yield (kg/ha)
The 20 km x 20 km ROI (top left), and the distribution of maize yields in the specific fields monitored in the four groups of villages in Nioro (panels 1 to 4).
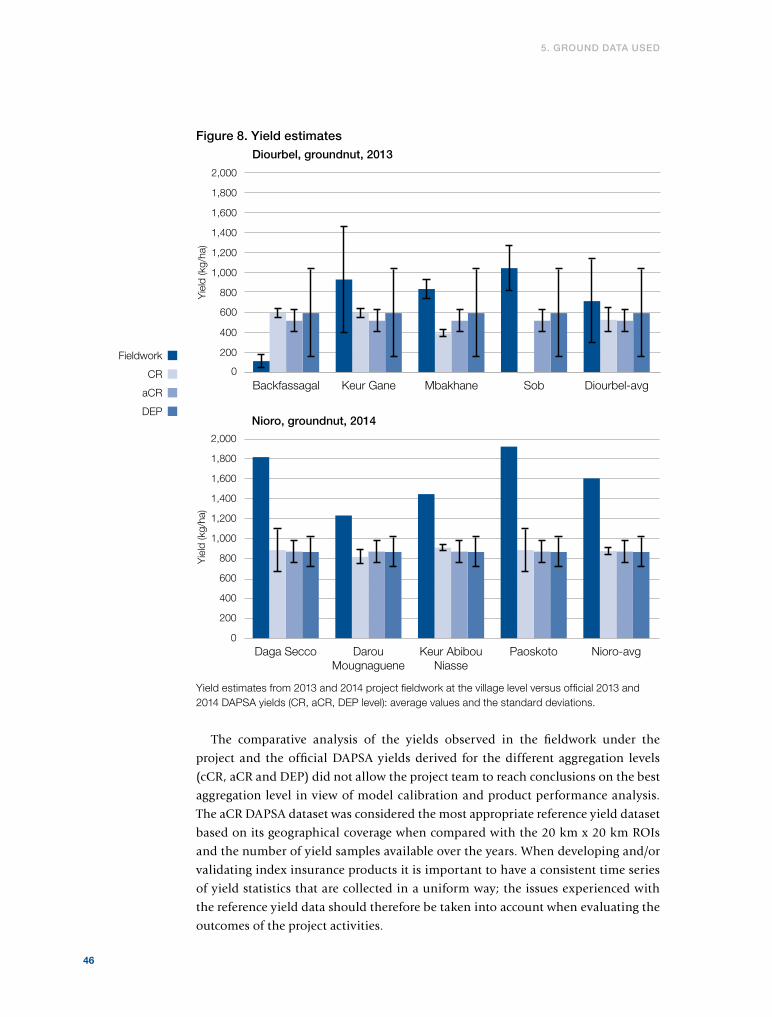
46
5. ground dAtA used
figure 8. yield estimates
0
200
400
600
800
1,000
1,200
1,400
1,600
1,800
2,000
Backfassagal Keur Gane Mbakhane Sob Diourbel-avg
Yie
ld (k
g/ha
)
Diourbel, groundnut, 2013
Yield estimates from 2013 and 2014 project fieldwork at the village level versus official 2013 and 2014 DAPSA yields (CR, aCR, DEP level): average values and the standard deviations.
The comparative analysis of the yields observed in the fieldwork under the
project and the official DAPSA yields derived for the different aggregation levels
(cCR, aCR and DEP) did not allow the project team to reach conclusions on the best
aggregation level in view of model calibration and product performance analysis.
The aCR DAPSA dataset was considered the most appropriate reference yield dataset
based on its geographical coverage when compared with the 20 km x 20 km ROIs
and the number of yield samples available over the years. When developing and/or
validating index insurance products it is important to have a consistent time series
of yield statistics that are collected in a uniform way; the issues experienced with
the reference yield data should therefore be taken into account when evaluating the
outcomes of the project activities.
0
200
400
600
800
1,000
1,200
1,400
1,600
1,800
2,000
Yie
ld (k
g/ha
)
Daga Secco DarouMougnaguene
Keur AbibouNiasse
Paoskoto Nioro-avg
Nioro, groundnut, 2014
Fieldwork
CR
aCR
DEP

47
Remote sensing foR index insuRance findings and lessons leaRned foR smallHoldeR agRicultuRe
figure 9. comparison of observed and simulated yields
Comparison of observed (DAPSA) aCR and DEP millet yields and simulated millet yields for Diourbel (2001-2014).
Depending on farming practices (more than on climate), observed yields may
vary considerably both within the same village and between villages in the same
region. These findings are indicative of the challenges inherent in any type of crop
insurance for smallholder farmers in the region.
The findings also show that it is important to distinguish between what is being
detected in “input-based methodologies” (e.g. RFE, soil moisture) and “output-
based methodologies” (e.g. vegetation or evapotranspiration indices). For example,
if the aim of the insurance policy is to cover damage caused by locust attacks, input-
based products such as RFE or soil moisture indices would be unsuitable.
Box 4. yield gaps and crop modelling
In non-intensified environments, the obtained yields are on average far below the potential yields (i.e. yields that could be obtained under the same climate conditions with good crop management).9 The difference between attainable and actual yields is known as the “yield gap” (Affholder et al., 2013; Lobell et al., 2009). Yield gaps can be assessed by comparing actual yields (observed) with simulated attainable yields given by crop models calibrated for farmers, crops/varieties and local soils and climate conditions (based on agronomical trials) (see figure below). As a consequence of being blurred by many factors, the link with climate (i.e. mainly rainfall patterns, and farmers’ yields, especially on a local scale such as the field or village) is rather weak, having recently been assessed at only 20 per cent to 40 per cent for millet in West Sahelian areas. In other words, climate explains only 20 per cent to 40 per cent of farmers’ millet yield variations (see Sultan et al., 2013; Traoré et al., 2011).
9 “Potential yields” are also known as “attainable yields” or “potential climatic yields”.
0
500
1,000
1,500
2,000
2,500
3,000
Mille
t yie
ld (k
g/ha
)
2001 2002 2003 2004 2005 2006 2007 2008 2009 2010 2011 2012 2013 2014
DAPSA-aCR
DAPSA-DEP
Simulated

48
5. ground dAtA used
No intensified crop management (or low-intensity crop management) could be considered a strategy adopted by farmers that allows them to cope with climate (rainfall) risks, since it prevents them from losing an investment in a bad year (De Rouw, 2004). Of course, no (or low) intensification is also due to economic and agricultural market situations. Historically, local crops (and varieties) had been selected by farmers because they were well-adapted to local rainfall patterns (highly variable between years), very resistant to drought conditions and able to produce a minimal yield regardless of the conditions. Those crops have limited absolute yield potential (around 3,500 kg/ha for millet), low harvest indices (i.e. grain/biomass ratio) (20-30 per cent) and low response to fertilizers and intensification. In synthesis, traditional Sahelian and Soudano-Sahelian cropping systems focus on resilience to climate shocks and climate variations.
yield gap
Simulated yields (t/ha)
Obs
erve
d yi
elds
(t/h
a)
0
1
2
3
4
5
0 1 2 3 4 5 6
Crop modelling techniques can be useful to simulate yields that could be obtained under optimal (or better) agronomical management and to assess the yield gap. These crop models are usually calibrated for local varieties, soil and climate conditions (with data from agronomical trails) and provide yield estimates for specific locations (“points”). Variations found in simulated yields are assumed to reflect precisely the impact of climate (rainfall) on the crop.
Simulated yields could be used to interpret or better understand observed yields (yield statistics). In the frame of the project, the SarraH model (Baron et al., 2003) was used to simulate millet yields for 2001-2014 in Diourbel and Nioro (Muller, 2016). Comparison of the model outputs (at “point” level) with DAPSA yield statistics at the aCR and DEP levels shows that, on average, the observed DAPSA yields are lower and vary much less than simulated yields. This may be due to the aggregation effect (regional “averaged” statistics versus “point” model output) combined with the fact that the model output better reflects climate variations. Whereas adverse years such as 2002 are clearly detected from the model simulations, this is not always obvious from the yield statistics. This indicates that the variability in the yield statistics is mostly related to factors other than climate. It is partly confirmed by the fact that in less intensified areas such as Koussanar the yield variability is lower than in more intensified areas such as Nioro; but this does not hold true for Diourbel. The modelling results indicate that the yield gaps for millet vary on average between 1,000 kg/ha and 2,000 kg/ha and that they are slightly smaller in the more intensified Nioro region than in Diourbel.
Yields allowedby climate
Yield gaps
Farmer yields

49
Remote sensing foR index insuRance findings and lessons leaRned foR smallHoldeR agRicultuRe
Rainfall datarainfall monitoringRainfall data were collected by the project’s field data collection team in coordination
with selected, trained local farmers through automatic and manual rain gauges
placed on farmers’ plots. In May and June 2013, approximately 40 rain gauges were
placed in project ROIs to supplement the Agence Nationale de l’Aviation Civile et de la
Météorologie (ANACIM) and ISRA gauges already present. The data were collected
and quality controlled after the 2013 and 2014 seasons.
The rainfall data were collected to gain more insight into the spatial variability
of rainfall and, ultimately, its impact on crop yields and farmer livelihoods (see
page 41). Many farmers in Senegal report a high spatial variability in rainfall. For
example, two villages within a few kilometres of each other can report substantially
different seasons. This information is critical when defining UAIs.
A second use of the gauge data was to better check and understand the
climatology in Senegal (south-north rainfall gradient) and its impact on agriculture.
The commencement and cessation of seasonal rainfall is the most important factor
determining the start and end dates of crop growth. In addition, lack of rainfall
(dry spells) in specific windows during the season may severely affect yield.
This information is crucial for robust index design. Rain gauge data were also
compared against IRI’s satellite rainfall product. Finally, the ground data provide an
independent validation source to examine the potential of hybrid satellite and rain
gauge products.10
Calibrating indices and assessing their performance can be difficult as there can
be significant variability in measurements of both yields and rainfall within ROIs
and even between farmers in the same village, and many variables (for example,
farming practices, and pests or disease) can affect the farmer’s final yield.
rainfall analysisAnalysis of the rainfall data collected by the project in 2013 points to clear differences
in the season, as experienced by the different ROIs.
The Sahel region, to which Senegal belongs, is characterized by significant rainfall
variability, not only over the years but also spatially, with large rainfall variations
over short distances.
For example, Diourbel had significantly different rainfall distribution, and it is
much drier than the other ROIs (Muller et al., 2010).
10 This issue was not addressed by the project.

50
5. ground dAtA used
figure 10. daily rainfall distribution in diourbel, koussanar and nioro
Smaller scale variations were also found within the ROIs. There is, of course, the
high spatial variability in rainfall that may explain local variations but the analysis
of the project data also revealed that part of the variation was related to human
factors, such as the method of rain gauge collection and/or the approach taken in
training the observers.11 Clear differences were found when comparing the amount
of rainfall measured by automatic rain gauges installed by ANACIM, manual rain
gauges run by ISRA observers with a lot of experience, and manual rain gauges run
by farmers with no experience.
11 In the case of the project ROIs, excessive rainfall was the cause of climate-related pests and diseases.
0 50 100Daily rainfall (mm)
100Daily rainfall (mm)
150 2000
20
40
60
0 50
Daily rainfall (mm)100
150 2000
100
80
60
40
20
120
0 50 150 2000
20
10
300
400
Koussanar
Nioro
Diourbel-Niakhar

51
Remote sensing foR index insuRance findings and lessons leaRned foR smallHoldeR agRicultuRe
Automatic rain gauges capture more low rainfall events. This discrepancy occurs
because water is less likely to evaporate away before the gauge is read, and rainfall can
be measured at a higher resolution. In addition, farmers sometimes failed to report
very low rainfall totals, as they were not deemed to be “useful” rainfall, or rainfall
that fell at night was not reported or incorrectly reported. The farmer rain gauge
measurements showed a higher standard deviation than the ISRA and automatic
gauges. This situation was expected, because the farmers had less experience than
the observers collecting data under the project and so they were more likely to make
a measurement error. They were also more likely to wait until the end of a rainfall
event before taking the reading even if it ran across a measuring period, or to take
the readings at slightly different times each day.
The varied locations of the rain gauges allowed an initial attempt at a spatial
analysis. Variograms (graphs depicting the spatial correlation of rainfall between
two points at a given distance) confirmed small measurement errors between
gauges at zero distance and showed the presence of convective rainfall as significant
variance was noted at less than 25 km distance. Unfortunately, the data were too
spatially limited for a full statistical analysis over the whole ROI.
Finally, the NOAA ARC2 satellite rainfall product was compared with the rain
gauge data. Basic comparisons were performed over a 3-day rolling average, a
10-day sum and a monthly sum. The agreement among rain gauge (point-based)
and satellite RFEs was reasonable, and it improved as more spatial averaging was
applied. This finding backs up the theory that satellite RFEs work best in index
insurance when they are looking at the big picture, rather than at whether an
insurance payout relies on the exact rainfall amount in one specific pixel on one
specific day. Normally, enhanced methods for comparing satellite and gauge data
are used to see which years they would have paid out on, rather than trying to
compare rainfall values directly. However, these methods rely on historical gauge
records, which were not available.

52
©IFAD/Marco Salustro

53
Remote sensing foR index insuRance findings and lessons leaRned foR smallHoldeR agRicultuRe
6. Designing insurance indices
Developing index insurance structuresRSSPs were asked to develop indices to be used for insuring against the impact of
drought (or drought and other perils – depending on the methodology capability)
on the yields of the selected crops in the ROIs. The project tasked the RSSPs with:
• analysing the risk profile of the selected cropping sites in Senegal (each covering
a 20 km x 20 km area);
• developing remote sensing indices to cover the selected crops against drought,
or drought and other perils;
• using the indices developed to create insurance structures to test in the crop
seasons of 2013 and 2014; and
• analysing the possibility of segmenting the ROIs into different UAIs.
Yield data up until 2012 and qualitative information sets (see Chapter 5) were made
available to the RSSPs to facilitate the design and calibration of the index insurance
structures they were commissioned to develop. Each RSSP had complete autonomy
in designing the index structures and in choosing which data and information to
use in support of the design activity. This situation resulted in a series of index
structures for each RSSP, known as the “base products.”
To harmonize the products for evaluation and make them more comparable, all
RSSPs were asked to adjust the parameters of their products so as to have a fixed
expected loss cost (ELC) for each crop. The ELC, also known as the “pure risk
premium”, can be calculated by taking the average of the potential historical payouts
that would have been provided by the contract structure in the observed period.
The ELC represents a key component of the final premium that will be charged to
the insured party; and it is, therefore, an important variable to be considered when
evaluating the feasibility of an insurance proposition.12 Index insurance structures
developed through different methodologies can be more comparable if carried
out for products that have similar premium costs (i.e. all things being equal, an
insurance product with a higher ELC would be more expensive as it would provide
larger and more frequent payouts).
12 The final commercial premium needs to be loaded to allow for uncertainty in the data, the cost of reinsurance, insurer margins (including distribution and overhead costs) and any other costs of doing business.

54
6. designing insurAnce indices
The project provided the RSSPs with dedicated guidance on how the ELC
adjustment was to be carried out. In particular, it asked the RSSPs to develop
structures that targeted ELC levels that were set considering the loss history of
each individual crop for the historical period observed (2001-2012). Given that the
different crops showed a relatively homogeneous risk exposure across the different
areas, ELCs were fixed for each crop and applied across all ROIs.13 The suggested
fixed-ELC rates are presented in Table 5.
The index structures that resulted from the restructuring exercise described above
have been identified as the “fixed-ELC products” and constitute the main reference
for the performance assessment.
table 5. elcs by crop type14
crop elc (same for each roi) (percentage)
Millet 4
Groundnut 6
Maize 8
selected design options There are many ways to structure index insurance products since the design depends
on the variable to be indexed, the object of the coverage and various operating
conditions (see table in Box 6 for a classification of the most common design options
in index insurance for crops). Table 6 presents the product design options selected by
the RSSPs participating in the project.
13 RSSPs that had not developed crop-specific indices were nevertheless asked to develop index structures with different ELCs.14 The recommended ELC levels for the different crops represented the upper limit. Where RSSPs had developed “base products” with lower ELCs, these were also considered acceptable, since it would not have been in line with the project objectives to alter an optimization process that had already achieved an index structure with a lower cost than requested.

55
Remote sensing foR index insuRance findings and lessons leaRned foR smallHoldeR agRicultuRe
table 6. Product design options selected by rssPs
rssPindexed variable (source and resolution)
Period covered
number of phases
start of coverage period
EARS RELATIVE EVAPOTRANSPIRATION (Meteosat – 3 km x 3 km)
Entire crop life
One or three
Dynamic
GeoVille SOIL MOISTURE (ERS – 25 km x 25 km; METOP ASCAT – 25 km x 25 km)
Growing phase
One Dynamic
FEWS NET ACTUAL EVAPOTRANSPIRATION (MODIS-based ET – 1 km x 1 km)
Entire crop life
One Fixed
IRI RAINFALL ESTIMATES (NOAA-based RFE ARC2 – 10 km x 10 km)
Two fixed windows at beginning and end of crop cycle with an interval in the central part of the covered period
Two Fixed
ITC NDVI (SPOT-VGT/Proba-V NDVI – 1 km x 1 km)
Entire crop life
One Dynamic
VITO fAPAR VEGETATION INDEX (SPOT-VGT/Proba-V fAPAR – 1 km x 1 km); and RAINFALL ESTIMATES (TAMSAT rainfall estimates – 4 km x 4 km)
Entire crop life
One Dynamic
Note: With reference to the classification presented in the table in Box 6, all products adopt a cumulative measurement for triggering a payout and have an incremental payout structure (i.e. the larger the deviation from the trigger the larger the payout).

56
6. designing insurAnce indices
Box 5. setting index insurance parameters
The objective of index insurance product design is to develop an index that effectively captures the relationship between the indexed variable and the potential crop loss, and to then define the structure that is most effective in providing payouts when losses are experienced, reducing basis risk as far as possible.
To convert an index into an insurance structure, it is necessary to set rules regulating the provision of payouts. In particular, it is necessary to define: • the maximum amount that the insured will be eligible to receive • the point at which the contract should start paying out • the point at which the maximum amount should be reached• the payout rate per index unit between payout point and maximum amount.
In more technical terms, this means defining, respectively: • the maximum payout: the highest payout the contract can provide • the trigger (or strike): the threshold above or below which payouts are due• the exit (or limit): the threshold above or below which no additional incremental payout
will be applied• the tick (or tick size): the incremental payout value per unit deviation from the trigger.
The figure presents an example of the definition of such parameters for a simple rainfall-deficit index insurance structure. • the maximum payout is set at €250• payouts are provided any time the cumulative precipitation falls below 600 mm
(Trigger = 600 mm)• the maximum payout is provided for rainfall levels of 300 mm or below (Exit = 300 mm)• given a maximum payout of €250, a trigger of 600 mm and an exit of 300 mm, the
monetary value of each deficit mm of rainfall below the trigger is: €250/(600 mm - 300 mm) or €0.8333 per mm (Tick = €0.8333 per mm).
example of index insurance payout structure
0
25
50
75
100
125
150
175
200
225
250
0 50 100 150 200 250 300 350 400 450 500 550 600 650 700 750 800
Eur
o
Rainfall (mm)
Exit
Trigger

57
Remote sensing foR index insuRance findings and lessons leaRned foR smallHoldeR agRicultuRe
Box 6. index insurance design options
The set of possible index combinations is virtually unlimited and, in the relatively short history of index insurance, numerous structures have been developed. The table below presents some of the possible criteria according to which index-based contracts can be classified.
Product design options for index insurance crops
Product parameter options
Indexed variable (based on remote sensing) Input-based (e.g. rainfall)
Output-based (e.g. yield or yield proxy)
Triggering measurement for indexed variable Cumulative
Average
Maximum
Minimum
Period covered by index Entire life cycle of crop
Fractions of crop life cycle
Start of coverage period Fixed
Dynamic
Number of phases into which covered period is divided
Typically 1-3 phases
Payout structure Incremental
Lump sum (single value payout)
Table modified from IFAD, 2011.
The design options presented in the table here have a critical influence on the nature of the insurance product to be offered: • An interesting distinction, relevant for the purposes of the project, is whether the index
focuses on the “input” or on the “output” side of the crop production process. Rainfall indices are a typical example of an “input-based index” and are structured on the operating assumption that the observed input is one of the key drivers of the specific crop production process,15 while many indices developed on the basis of remote sensing technology focus on the output side of the equation, i.e. indices that will be used as proxies for yield series, such as vegetation indices or evapotranspiration.
• How the trigger point is determined can be defined in different ways. The measure of the observed variable can be cumulative (e.g. sum of millimetres of rainfall over a defined period); an average over a period of time (e.g. average temperature); or a maximum or minimum value to be reached in order to generate a payout (e.g. high or low temperatures).
15 To be more accurate, the assumption behind rainfall index insurance for drought is that lack of rainfall will determine losses in production, and the design activity aims to quantify the relationship between lower-than-average precipitation and reduction in productivity.

58
6. designing insurAnce indices
• In terms of the coverage period, the insurance product can cover the entire crop calendar from sowing to harvest or concentrate only on specific portions of the crop life that are exposed to specific types of risks (e.g. flowering, maturity).
• The possibility of developing a “dynamic start” of the crop season is also particularly relevant where the start of certain agricultural activities and planting is strictly linked to the occurrence of determined environmental conditions. For some types of insurance products, if the coverage period and the crop calendar are not synchronized, the likelihood of an increase in basis risk is very high (a more detailed discussion on “start of season” indicators is provided in Box 7).
• Together with the dynamic start provision, a contract feature that accounts for the progression of the index variable in the different parts of the crop calendar may improve the performance of the insurance structure. In this respect, the crop life cycle can be segmented into different “phases” (each with its own index and defined period) in order to avoid having the overall cumulative value of the index hiding damages resulting from events in a specific phase of crop development. The actual structure of a phase contract is clearly an empirical issue, and it is dependent on crop/variety and location.
• Finally, the payout triggered by the index structure can be “incremental”, as in the case presented in the figure, where the damage is considered to be progressively more severe as the deviation from the trigger increases; or it can provide a “lump sum” payment in case an all-or-nothing type of event is covered, such as cases in which reaching a particularly sensitive threshold (e.g. a critical temperature) generates a total loss.
Unit areas of insurance When designing index insurance, one fundamental issue is the identification of
the unit areas of insurance (UAI), which can be defined as the geographical area
within which the specific index is applied and where policyholders pay the same
rates of insurance premium and are entitled to receive the same unitary payouts.
Traditionally, when developing indices based on ground station weather data, the
area to be covered by a specific index is empirically delimited based on the characters
of local weather patterns. In these cases, the UAI is usually represented by circles of
different radiuses, typically from 5 km to 20 km, depending on the climatological
features of the area.16
In the framework of the project, the assumption is that remote sensing
methodologies can provide useful insights into the spatial homogeneity of the
areas examined and, therefore, help in defining the UAIs. With remote sensing,
the spatial building block is the pixel, so UAIs can be developed as an aggregation
of pixels, depending on the resolution opportunity of the specific remote sensing
methodology adopted (different methodologies will operate at different resolution
scales providing results of different accuracy).
16 Under particular orographic conditions, the UAI can also take on different shapes.

59
Remote sensing foR index insuRance findings and lessons leaRned foR smallHoldeR agRicultuRe
In particular, while high resolution data may be extremely effective in mapping,
zoning and classifying the risk profile in full detail, the final indices developed for
insurance applications need to spatially cover a significant portion of the selected
test areas that will be defined as the UAI. Identifying UAIs that are too small would
conflict with the principles of index insurance according to which, in order for a
contract structure to benefit from the lack of asymmetric information (moral hazard
and adverse selection), the area of operation must be sufficiently large.17
RSSPs were asked to look into whether the outputs of their methodologies would
suggest segmenting each of the 20 km x 20 km ROIs into more than one UAI. The
RSSPs carried out interesting elaborations (as an example, see Figure 11), but, since
they had reached different output levels and more work would have been required
to finalize the analyses, the results of such activities have not been included in the
evaluation process. Nevertheless, this is a topic that deserves additional exploration
and is further discussed in the conclusions.
figure 11. Payout frequency map
The figure shows the payout frequency map for groundnut in Nioro and the ROI (square in black line) developed by RSSP VITO. It indicates how many times the index triggered at the pixel level in the period 2001-2014 and seems to suggest that the left section of the ROI has a more pronounced risk profile. Accordingly, the ROI could be segmented into different UAIs.
17 This does not mean that operating insurance on smaller areas is not possible or not advisable, but only that this would make the products closer to individual farmer crop insurance contracts, which were not the specific focus of the project. At the same time, it is also worth recalling that basis risk may increase as the size of the UAI increases.
0
1-2
3-4
5-6
7-8
9-10
11-14
Frequency of triggering (2001-2014)

60
©IFAD/Andrew Esiebo/Panos

61
Remote sensing foR index insuRance findings and lessons leaRned foR smallHoldeR agRicultuRe
7. Mapping
At the start of the project, it was considered that most of the insurance structures
would benefit from being combined with crop maps. For this reason, one RSSP,
sarmap, developed SAR-based maps for the different ROIs in Senegal for three
growing seasons during the project.
The goal was to determine whether, within the ROIs:
• the cultivated areas could be mapped;
• different crop types could be mapped; and
• how these maps could be used to improve the insurance products (e.g.
developing crop-specific products, definition of UAIs).
Some of the other RSSPs also developed and/or used maps and masks based on
optical satellite data.
Mapping satellite imagesSatellite images (optical and SAR or a combination of both) are frequently used to
map cultivated areas (cropland) or to map specific crop types. Either unsupervised
or supervised image classification techniques are applied. In the latter case, ground
surveys are organized to collected crop type information for a set of fields. The
ground dataset is used to “train” the classification algorithm. For crop type mapping,
the collection of training data is a prerequisite. Nevertheless, it may be difficult to
obtain accurate crop type maps for fragmented agricultural landscapes.
The key information for mapping is the temporal behaviour of the satellite signal
throughout the season, regardless of whether remote sensing data are acquired by
active or passive sensors, at a high or medium resolution. For SAR systems, this
temporal information is complemented with information on soil/plant roughness
and moisture content detected by the sensor; whereas optical systems provide
information on the crop’s vigour and health by measuring the light it reflects.
Maps and masks Cropland or crop type maps are images whereby a “class” (either cropland or a
specific crop) is attributed to each pixel. Such maps can be used to locate specific
crops or cropland. Highly detailed cropland maps can be used to “unmix” the signal
of less detailed satellite images. The maps can also be converted to masks whereby
a single class is extracted from the map. Such masks can be used to perform class-
specific analyses (e.g. crop-specific monitoring or insurance product development).
62
7. mAPPing
SAR-based mapsTo assess the contribution of various space-borne SAR acquisition systems and
modes for cultivated area mapping in Senegal, tests were performed by sarmap
in three subsequent years in the project ROIs using images from the Italian Space
Agency’s (ASI) Cosmo-SkyMed satellite. In 2013, the focus was set on the spatial
resolution whereby maps were generated from Cosmo-SkyMed X-band HH time
series with a very fine resolution of 3 metres. In 2014, the target was to understand
the effect of different acquisition modes (HH/HV polarizations) while degrading
the spatial resolution of the Cosmo-SkyMed time series to 15 metres. In 2015, maps
were generated with the newly launched 12-day Sentinel-1A data at C-band 20 metre
resolution and with dual polarization (VV/VH).18
SAR data are typically received from data providers in a form that is not suitable for
direct interpretation. Sophisticated data processing (Nelson et al., 2014) is therefore
necessary to obtain speckle-filtered temporal SAR data stacks, radiometrically
calibrated and geolocated according to the underlying topography.
Once processed, SAR time series can be interpreted in two ways:
• The temporal evolution of the radar backscattered energy (i.e. backscattering
coefficient) is analysed from an agronomic perspective by means of a dedicated
crop detection algorithm. The data must have been systematically acquired
and a priori knowledge of crop type, calendar, duration and crop practices
during the whole season must be available.
• From backscattering coefficient time series, temporal features such as the
minimum and maximum backscatter during the crop season are derived
(Holecz et al., 2015) (see Figure 12). Even if this approach does not allow for the
derivation of all the specific information obtained with the previous approach,
it provides, in a rather simple way, valuable information on the crop location,
the crop seasonal dynamics and, depending on the surrounding land cover
and crop types, to some extent, the crop type as well. The advantage is that it
does not require a priori information about the underlying agriculture because
the temporal features are not interpreted from an agronomic perspective.
18 A radar system using H (horizontal) and V (vertical) linear polarizations can have the following channels: HH – for horizontal transmit and horizontal receive, VV – for vertical transmit and vertical receive, HV – for horizontal transmit and vertical receive, VH – for vertical transmit and horizontal receive.
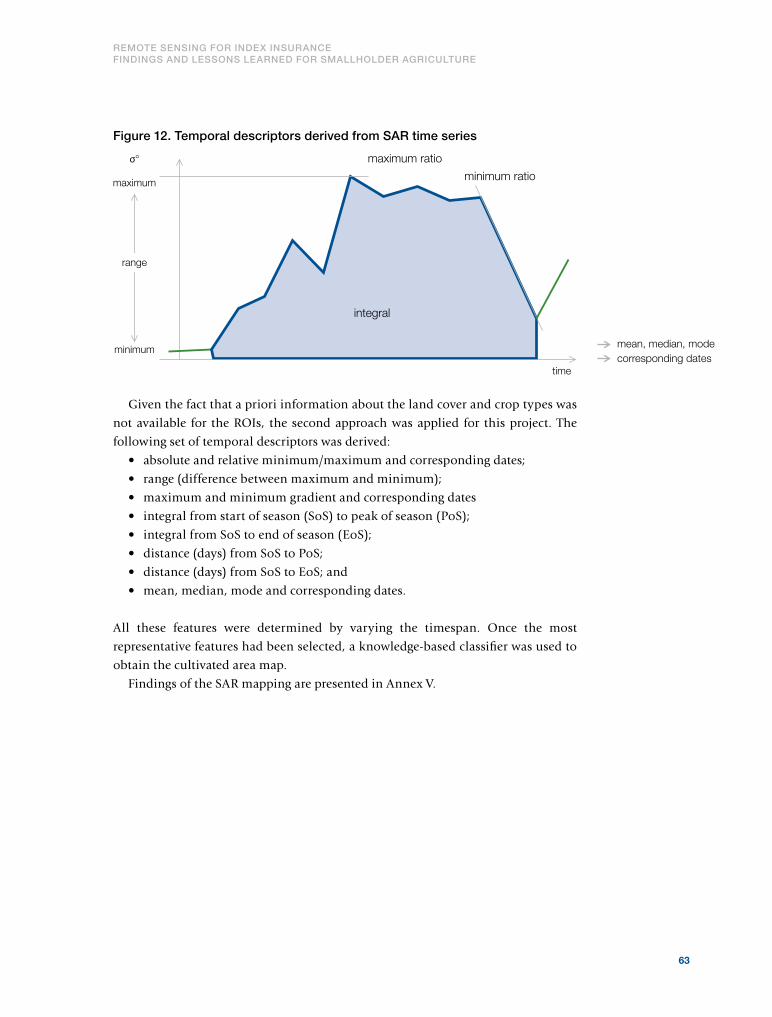
63
Remote sensing foR index insuRance findings and lessons leaRned foR smallHoldeR agRicultuRe
figure 12. temporal descriptors derived from sAr time series
Given the fact that a priori information about the land cover and crop types was
not available for the ROIs, the second approach was applied for this project. The
following set of temporal descriptors was derived:
• absolute and relative minimum/maximum and corresponding dates;
• range (difference between maximum and minimum);
• maximum and minimum gradient and corresponding dates
• integral from start of season (SoS) to peak of season (PoS);
• integral from SoS to end of season (EoS);
• distance (days) from SoS to PoS;
• distance (days) from SoS to EoS; and
• mean, median, mode and corresponding dates.
All these features were determined by varying the timespan. Once the most
representative features had been selected, a knowledge-based classifier was used to
obtain the cultivated area map.
Findings of the SAR mapping are presented in Annex V.
minimum
minimum ratiomaximum
maximum ratio
integral
σ°
time
range
mean, median, modecorresponding dates

64
7. mAPPing
Other maps and masks used in this projectITC produced three crop intensity maps (for millet, groundnut and maize) based
on time series of SPOT-VEGETATION data. NDVI clusters (zones) were generated
using an unsupervised classification technique (i.e. without ground data) and
subsequently interpreted using information on agricultural areas from FAO-GLCN
(Global Land Cover, 30 m) and DAPSA area statistics per crop. The crop intensity
maps indicate the respective growing areas for millet, groundnut and maize, and
were used to generate the “crop-specific” NDVI data that were then used as input for
model development.
FEWS NET also used the crop intensity maps produced by ITC for deriving crop-
wise drought vulnerability and payoff functions.
VITO applied a cropland mask (1 km resolution) to limit the analysis to cropland
areas. The mask was derived from a map (Vancutsem et al., 2012) of cropland areas
at 250 m for Africa, produced by the JRC from 10 existing land use/land cover
datasets that were harmonized and combined using specific expertise. The accuracy
of the cropland map was checked by comparison with two recent cropland extent
maps over Africa at 1 km: one derived from MODIS and the other derived from
five existing products using a validation sample of 3,591 pixels of 1 km² regularly
distributed over Africa and interpreted using high resolution images with the
Geowiki validation tool.
General findings No specific tests were set up to compare the performance of insurance products
with or without using cropland or crop type information; and, therefore, no firm
conclusions can be drawn on the effect of integrating this kind of information.
The results of the product performance analysis (see Chapter 9), however, seem to
indicate that the integration of crop-type maps, and to a lesser extent cropland maps,
has a positive influence on the performance of the insurance products, particularly
where crop-specific indices are concerned. This outcome might be due to the fact
that some of the products were found to perform better in areas where one crop is
dominant, which creates a remote sensing signal that is “better” than signals from
mixed crop zones, where performance was poorer.
Currently, no information is available on the exact location of the insured crops.
The crop-specific insurance products that are available today integrate information
on cultivated areas or typical growing areas for a certain crop, but only to a limited
extent. These products only perform well when the different crops grown in a certain
region show a similar behaviour and have similar relative yields.
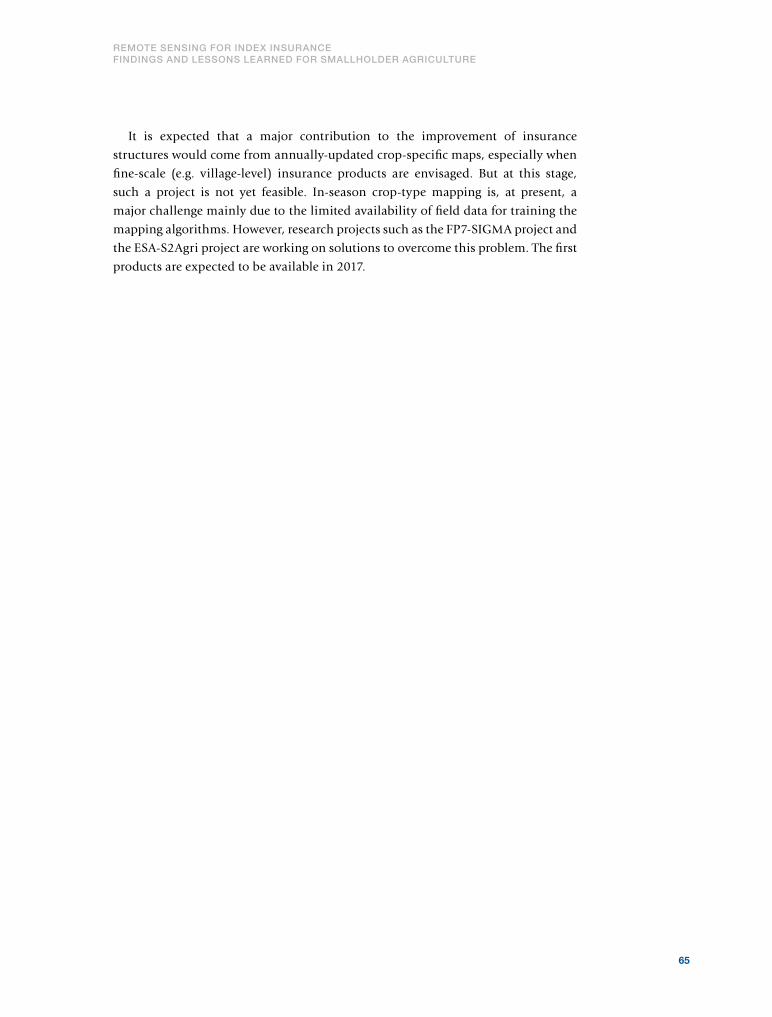
65
Remote sensing foR index insuRance findings and lessons leaRned foR smallHoldeR agRicultuRe
It is expected that a major contribution to the improvement of insurance
structures would come from annually-updated crop-specific maps, especially when
fine-scale (e.g. village-level) insurance products are envisaged. But at this stage,
such a project is not yet feasible. In-season crop-type mapping is, at present, a
major challenge mainly due to the limited availability of field data for training the
mapping algorithms. However, research projects such as the FP7-SIGMA project and
the ESA-S2Agri project are working on solutions to overcome this problem. The first
products are expected to be available in 2017.

66
©IFAD/J. Kasire

67
Remote sensing foR index insuRance findings and lessons leaRned foR smallHoldeR agRicultuRe
8. Description of the methodologies
The seven RSSPs selected for the project all had experience in developing
methodologies based on the most promising approaches outlined in Chapter 3.
Table 7 summarizes the different types of index products developed by the RSSPs.
Most of the indices developed are crop-specific, divided into fractions of crop life
cycle (vegetative, flowering, yield formation) and calibrated using historical yield
statistics (department- and village-level).
The following sections provide a brief description of each of the indices and the
methodologies used to derive the indices. Crop mapping and masking is described
separately in Chapter 7. 19
table 7. overview of remote sensing methodologies
rssP type of remote sensing product / approach
remote sensing data used
type of index
index target
EARS Relative evapotranspiration (ETr)
Start of season based on ETr
MSG-based relative ET (3 km x 3 km)
Estimation of yield deficit
Crop-specific
GeoVille Radar-based estimation of soil moisture
Start of season detection based on Soil Water Index (SWI)
ERS (25 km x 25 km) resolution and METOP ASCAT (25 km x 25 km)
Soil moisture deficit
Generic
FEWS NET Actual evapotranspiration (ETa)
MODIS-based ET (1 km x 1 km)
Estimation of yield deficit
Crop-specific
IRI Rainfall estimates (RFE) NOAA-based RFE ARC2 (10 km x 10 km)
Rainfall deficit
Generic
ITC Vegetation indices (NDVI) SPOT-VGT/Proba-V NDVI (1 km x 1 km)
Estimation of yield deficit
Crop-specific
sarmap19 Radar crop maps and start of season indicators
Cosmo-SkyMed data (3m*3m)
Agricultural mapping
Generic (cultivated land versus non-cultivated)
VITO Vegetation indices (fAPAR)
Start of season estimation based on rainfall estimates (RFE)
SPOT-VGT/Proba-V fAPAR (1 km x 1 km) and TAMSAT rainfall estimates (4 km x 4 km)
Estimation of yield deficit
Crop-specific
19 The sarmap mapping methodology and its findings are examined in Chapter 7 and Annex V.
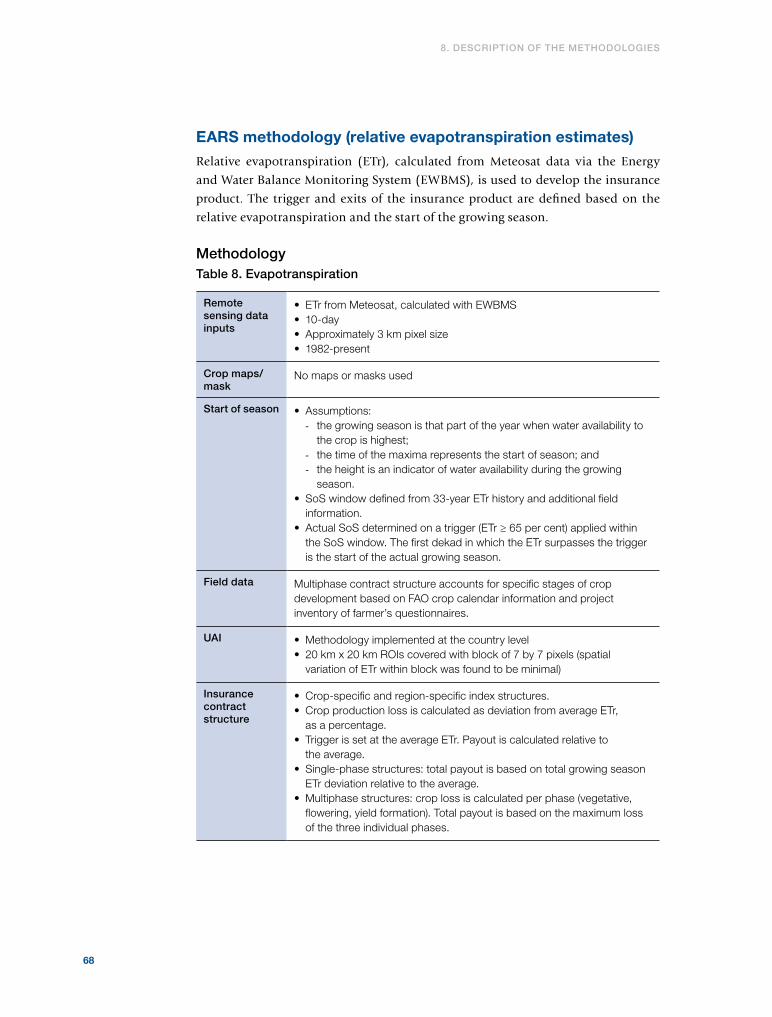
68
8. descriPtion of the methodologies
EARS methodology (relative evapotranspiration estimates)Relative evapotranspiration (ETr), calculated from Meteosat data via the Energy
and Water Balance Monitoring System (EWBMS), is used to develop the insurance
product. The trigger and exits of the insurance product are defined based on the
relative evapotranspiration and the start of the growing season.
methodologytable 8. evapotranspiration
remote sensing data inputs
• ETr from Meteosat, calculated with EWBMS• 10-day• Approximately 3 km pixel size• 1982-present
crop maps/ mask
No maps or masks used
start of season • Assumptions: - the growing season is that part of the year when water availability to
the crop is highest; - the time of the maxima represents the start of season; and - the height is an indicator of water availability during the growing
season. • SoS window defined from 33-year ETr history and additional field
information.• Actual SoS determined on a trigger (ETr ≥ 65 per cent) applied within
the SoS window. The first dekad in which the ETr surpasses the trigger is the start of the actual growing season.
field data Multiphase contract structure accounts for specific stages of crop development based on FAO crop calendar information and project inventory of farmer’s questionnaires.
uAi • Methodology implemented at the country level• 20 km x 20 km ROIs covered with block of 7 by 7 pixels (spatial
variation of ETr within block was found to be minimal)
insurance contract structure
• Crop-specific and region-specific index structures.• Crop production loss is calculated as deviation from average ETr,
as a percentage. • Trigger is set at the average ETr. Payout is calculated relative to
the average. • Single-phase structures: total payout is based on total growing season
ETr deviation relative to the average. • Multiphase structures: crop loss is calculated per phase (vegetative,
flowering, yield formation). Total payout is based on the maximum loss of the three individual phases.

69
Remote sensing foR index insuRance findings and lessons leaRned foR smallHoldeR agRicultuRe
figure 13. difference between etr for the 2014 season and the previous 32-year average for the months july-september in senegal (by eArs)
figure 14. determination of start of season based on historical etr time series
GeoVille methodology (soil moisture estimates)The GeoVille insurance product is based on soil moisture estimates derived from
ERS and ASCAT microwave observations. Payouts are based on the soil moisture
deficit (the difference between the long-term average and the respective year’s soil
moisture conditions) for the specific crop life cycle range, which is the determinative
period for crop yield.
0
10
20
30
40
50
60
70
80
90
100
0 2 4 6 8 10 12 14 16 18 20 22 24 26 28 30 363432
Rel
ativ
e ev
apot
rans
pira
tion
(ETr
)
Dekad
Growing season trigger
Sta
rtin
g w
indo
w
Veg
etat
ive
phas
e
Flow
erin
g ph
ase
Yel
d fo
rmat
ion
phas
e
-15
-7
0
8
15
Diourbel-6.7
Kaffrine-2.2 Koussanar
-7.4Nioro-3.0

70
methodologyfigure 15. soil water index product – example for 15 August 2015
table 9. soil moisture
remote sensing data inputs
• Surface soil moisture (SSM) estimates (25 km pixel size) representing the degree of saturation of the topmost soil layer (< 5 cm), ranging from 0 (dry) to 100 (wet). The ESA CCI SM v02.1 dataset (1979-2013) was used to identify the relationship between soil moisture variability and annual yields and to define the crop life cycle range having the strongest moisture-crop yield relationship.
• Soil Water Index (SWI) (10 km pixel size), reflecting the moisture conditions in the first meter of the soil profile. The ASCAT and ERS datasets were used for calculating insurance payouts.
• Daily data
crop maps/ mask
No maps or masks used
start of season The onset of the rains can be detected from the SWI profile.
field data • The FAO crop calendar provided information on planting, sowing and harvesting periods of local crops
• Yield statistics
uAi 1 pixel covering 25 km x 25 km
insurance contract structure
• The insurance coverage structure is based on the cyclic fraction, defined as the difference between the long-term average and the respective year’s moisture conditions for the specific crop life cycle range (e.g. growing period).
• To identify the period of the seasonal crop life cycle that is essential for high/low yields, correlation analysis is applied. The seasonal crop life cycle showing the highest correlation with crop yield is used to define trigger and exit points.
• The trigger value is defined as the difference between the long-term mean of the cyclic fraction and the first standard deviation for the period 2007-2014. The exit point is defined as the long-term mean of the cyclic fraction and the second standard deviation for the period 2007-2014.
100
90
80
70
60
50
40
30
20
10
0
Per
cen
t (%
)
8. descriPtion of the methodologies

71
Remote sensing foR index insuRance findings and lessons leaRned foR smallHoldeR agRicultuRe
figure 16. growing period for groundnut in nioro
0.05
0.10
0.15
0.20
0.25
0.30
0.35
Sur
face
soi
l moi
stur
e in
m3 /
m3
Jan Feb Mar Apr May Jun Jul Aug Sep Oct Nov Dec0.00
0.40Growing
Growing period is shown between green vertical lines. To calculate the cyclic fraction, the surface soil moisture for the year 2010 (blue line) and the long-term average surface soil moisture from 1990 to 2013 (grey line) are used. The dark green area indicates the cyclic fraction. The example shows an above-average condition.
FEWS NET methodology (actual evapotranspiration estimates)MODIS land surface temperature (LST) 8-day composites are used as a principal
input to a simplified surface energy balance model that estimates actual
evapotranspiration (ETa) at the land surface. This information is aggregated over
the FAO-based cropping calendar for Senegal for the different crops (maize, millet
and groundnuts). Vulnerability functions are defined based on drought-risk profiles
of the crops. These vulnerability models calibrated per crop over the different ROIs
form the basis of the insurance contracts developed by FEWS NET.
SSM 2010
SSM average (1990-2013)

72
methodologytable 10. Actual evapotranspiration
remote sensing data inputs
• ETa calculated from MODIS LST data using a simplified surface energy balance model
• 10-day composites• 1 km pixel size• 2000-present
crop maps/ mask
FEWS NET used the crop intensity maps produced by ITC for deriving crop-wise drought vulnerability and payoff functions.
start of season Fixed period
field data • FAO crop calendar• Rain gauge data• FEWS NET reports on food security and drought• Yield statistics of central communauté rurale (cCR) of each
20 km x 20 km ROI
uAi 20 km x 20 km ROI
insurance contract structure
• The insurance products have a fixed start and end date corresponding with the characteristic growing period of the crop (from FAO calendar and discussion with local experts).
• Crop-specific drought vulnerability models were developed over the regions. This consisted of establishing a statistical regression between relative cCR yield-deficits (with respect to potential yield) and the relative ET deficit (with respect to potential ET) cumulated over the growing season.
• The design of the insurance contracts consisted of transforming the crop-specific drought vulnerability functions into corresponding payout functions (see Figure 17).
8. descriPtion of the methodologies

73
Remote sensing foR index insuRance findings and lessons leaRned foR smallHoldeR agRicultuRe
figure 17. eta anomalies for west Africa for the 2016 season, based on comparison with 2003-2013 median values
figure 18. scaling of the millet vulnerability function into regional millet payout function
00
10
20
30
40
50
60
70
80
90
100
Rel
ativ
e m
illet y
ield
de�
cit (
%)
Relative cum. ETa de�cit (%)
Slope 2.3206
50 45 40 35 30 25 20 15 10 50
10
20
30
40
50
60
70
80
90
100
Relative millet yield de�cit (%)
Payout (% of the sum insured)
Exit(100%payout)
10 20 30 40 50 60 70 80 90 100
Trigger
Threshold point for starting payout(Rel. cum. ETa de�cit > 3%)
Threshold point for starting payout(Rel. yield de�cit > 7%)
% yield de�cit = 2.3206 * % relative ETa de�cit
Total crop failure (Rel. cum. ETa de�cit > 40% of seasonal total average ET)
Total crop failure (Rel. cum. ETa de�cit > 40%
of seasonal total average ET)
0
National boundary
Sub-national boundary
River
Lake
<50
50-70
70-90
90-110
110-130
130-150
>150
ETa anomaly (%)
Map produced by USGS/EROS.

74
IRI methodology (rainfall estimates)The IRI index design process is based on measuring rainfall during key periods
in the growing season. Remotely sensed RFEs are analysed over different periods
to best represent the adverse years in Senegal. The index is based upon amount of
rainfall in a specific period of the growing season for the different ROIs.
methodologyfigure 19. rainfall anomalies in 2002 (dry year) based on comparison with 1993-2013 average values
8. descriPtion of the methodologies
Anomaly based on 1993-2013
climate
rainfall anomaly
(mm)17
15
13
11
17
15
13
11
17
15
13
11
17
15
13
11
-17 -15 -13 -11 -17 -15 -13 -11 -17 -15 -13 -11
Jun: Dekad 2
Jul: Dekad 2
Aug: Dekad 2
Sep: Dekad 2
Jun: Dekad 3
Jul: Dekad 3
Aug: Dekad 3
Sep: Dekad 3
Jul: Dekad 1
Aug: Dekad 1
Sep: Dekad 1
Oct: Dekad 1
2002
Longitude
Latit
ude
50
40
30
20
10
0
-10
-20
-30
-40
-50
(mm
)

75
Remote sensing foR index insuRance findings and lessons leaRned foR smallHoldeR agRicultuRe
table 11. rainfall estimates
remote sensing data inputs
• NOAA CPC RFE-2.0 rainfall estimates • 10-day • Approximately 10 km pixel size• 1983-present
crop maps/ mask
No maps or masks used
start of season Fixed window
field data • Yield statistics at the department and the village level to detect adverse years
• Village interviews through IRI field visits • Literature review, including wider food security and drought reports
uAi 9 pixels covering approximately 30 km x 30 km
insurance contract structure
• A rainfall cap of 20 mm daily and 40 mm dekadal is set to prevent bias due to extreme rainfall.
• A climatological time series of 1993-2013 is used to avoid influence of long-term trends.
• Designed with two fixed windows covering the initial and the final part of the crop season (with a gap in the middle) reflecting the periods during which the crops are critically vulnerable to drought. Window selection based on: - crop calendars and expert assessment of the growing season; - a statistical investigation into which windows captured loss events; - farmer information (as available); and - expert assessment for final choice.
• Trigger and exit are defined per region based on information on historical loss events from farmer interviews and analysis of yield statistics.
• Two sets of indices: one index for each of the 9 RFE pixels and one for the average of the 9 RFE pixels that make up the UAIs.

76
figure 20. Payout in koussanar roi (per pixel) for 1993-2012 based on iri model
ITC methodology (vegetation indices)Based upon the historical SPOT-VEGETATION NDVI data, three crop maps (for
millet, maize and groundnuts) are generated for Senegal. At the village level,
these maps are used to extract temporal NDVI profiles for the different crops. The
(detrended) NDVI values, accounting for a variable start of the growing season, are
then used together with village yield values to develop crop-specific yield models for
Senegal. The yield estimates per pixel, subsequently aggregated at the ROI level, are
used to define the insurance coverage.
8. descriPtion of the methodologies
142
141
140
142
141
140
142
141
140
142
141
140
1993 1994 1995 1996 1997
1998 1999 2000 2001 2002
2003 2004 2005 2006 2007
2008 2009 2010 2011 2012
Koussanar
Longitude
Latit
ude
-14.1 -13.9 -14.1 -13.9 -14.1 -13.9-14.1 -13.9 -14.1 -13.9
totalpayout
100
90
80
70
60
50
40
30
20
10
0

77
Remote sensing foR index insuRance findings and lessons leaRned foR smallHoldeR agRicultuRe
methodologytable 12. vegetation index
remote sensing data inputs
• SPOT-VEGETATION / Proba-V NDVI • 10-day composites• 1 km pixel size• 1998-present
crop maps/ mask
Crop intensity maps were developed by means of cluster analysis whereby NDVI clusters (zones) were interpreted using information on agricultural areas from FAO-GLCN (Global Land Cover, 30 m) and DAPSA area statistics per crop. These maps were used to generate crop-specific NDVI profiles (corrected for trend effects).
start of season Based on NDVI values above a certain threshold around expected start of season (crop and region specific)
field data • Yield statistics at the village level• Crop calendar based on field information collected under the project
uAi • Methodology implemented by NDVI zones• Payout per pixel (1 km x 1 km) or aggregated to 20 km x 20 km ROI (but
with NDVI zone specific trigger and exit)
insurance contract structure
• Crop-specific (detrended) NDVI values, accounting for a variable start of the growing season, are used together with village yield values to develop crop-specific yield models for Senegal.
• The yield estimates per pixel, subsequently aggregated at the ROI level, are used to calculate the insurance payout. Payouts are calculated on the basis of the relative difference between the estimated yield and the trigger value.
• Trigger and exit are defined by using the averaged data by year and by NDVI zone. To reach the requested ELC, two parameters were used, one to adjust the trigger (Q) and one to adjust the exit thresholds (P):
Trigger = (Q*1st quartile)-((average-mode)/2)Exit = Trigger-(P*st.dev)
• Design of each crop-specific structure aimed to obtain a fixed ELC of 10 per cent and a “pay count” close to 15 per cent.
78
figure 21. millet crop map generated by itc
figure 22. indemnity payouts for millet in 2013 based on itc models
8. descriPtion of the methodologies
Millet 2013Indemnity amounts (%)
No index model
0% pay
0% pay
High: 100
Low: 0
55% Crop fractions 0%

79
Remote sensing foR index insuRance findings and lessons leaRned foR smallHoldeR agRicultuRe
VITO methodology (vegetation indices combined with rainfall estimates)Region-specific and crop-specific yield models are set up based on combinations
of vegetation indices (fAPAR derived from SPOT-VEGETATION/Proba-V data) and
rainfall estimates aggregated over critical periods during the growing season. Yield
statistics are used to calibrate these models. The yield estimates generated by the
models form the basis of the insurance contracts.
methodologytable 13. vegetation index and rainfall
remote sensing data inputs
• SPOT-VEGETATION / Proba-V fAPAR • 10-day composites• 1 km pixel size• 1998-present • TAMSAT rainfall estimates• 10-day composites• 4 km pixel size• 1983-present
crop maps/ mask
A cropland mask developed by JRC (Vancutsem et al., 2013) was used to limit the analysis to agricultural land pixels.
start of season Start and end of season are derived from temporal evolution of fAPAR values.
field data • Yield statistics of aCR• Information on local agricultural practices collected under the project
uAi aCR covering the 20 km x 20 km ROIs
insurance contract structure
• Region-specific and crop-specific yield models are set up based on combinations of vegetation indices (fAPAR derived from SPOT-VEGETATION/Proba-V data) and rainfall estimates aggregated over critical periods during the growing season. Yield statistics (aCR level) are used to calibrate these models.
• The yield estimates generated by the models form the basis of the insurance contracts. Payouts are calculated based on the relative difference between the estimated yield and the trigger value.
• Mathematical functions were sought to describe the probability of yield occurrence. Trigger and exit values are set for each aCR zone and crop combination based on the fitted distribution of the (village-level) yields for that aCR zone and crop.

80
figure 23. sPot-vgt fAPAr cumulated from start to end of season (2002, dry year)
fAPAR is expressed on a scale from 0 to 1. The figure shows the sum of the 10-daily fAPAR (0-1) from start to end of season (over number of 10-daily periods).
figure 24. start and end of season derived from fAPAr profile
GrowingseasonSoS
EoS
planting
EM VEG FL/GF R
fAP
AR
(-)
Dekad
010.00
0.55
0.50
0.45
0.40
0.35
0.30
0.25
0.20
0.15
0.10
0.05
04 10 13 16 19 22 25 28 31 3407
8. descriPtion of the methodologies
<10
10-20
20-30
30-40
40-50
50-60
60-70
>70
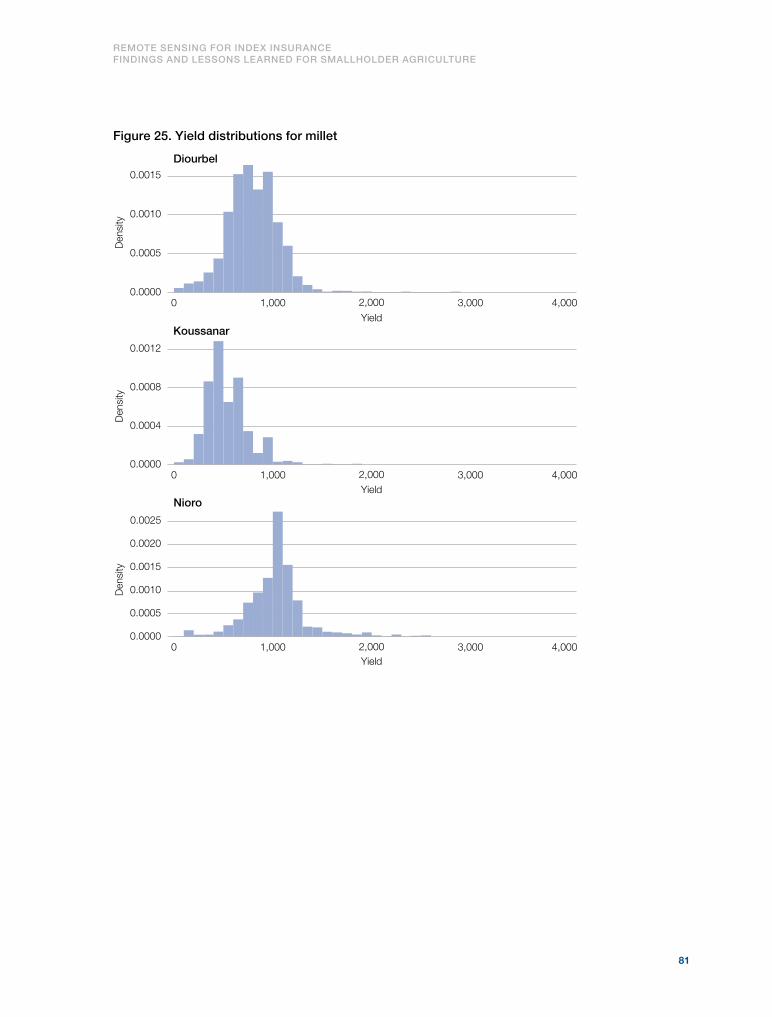
81
Remote sensing foR index insuRance findings and lessons leaRned foR smallHoldeR agRicultuRe
figure 25. yield distributions for millet
0.0008
0.0004
0.0012
Yield
Den
sity
Den
sity
Den
sity
2,000Yield
0.0005
0.0010
0.0015
0 1,000
Yield
3,000 4,000
0.0010
0.0005
0.0015
0.0020
0.0025
Koussanar
Nioro
Diourbel
0.0000
2,0000 1,000 3,000 4,0000.0000
2,0000 1,000 3,000 4,0000.0000

82
©IFAD/Horst Wagner

83
Remote sensing foR index insuRance findings and lessons leaRned foR smallHoldeR agRicultuRe
9. Performance assessment
The performance assessment of the index structures developed by the RSSPs has two
parts: historical performance analysis and product testing. Historical performance
analysis aims to show how well the methodologies can replicate crop loss over past
years in specified areas. Product testing gauges how well the methodologies can
“predict” losses, analysing and assessing their performance during the two test
seasons in comparison with data specifically collected by the project.
Historical performance analysisPerformance indicatorsAnalysis of the historical performance of index insurance products aims to determine
the ability of the methodologies to replicate the history of losses for selected crops
in selected areas. In this project, the methodologies were measured against the aCR
yield dataset (see pages 41-48).
There are inherent limitations to assessing product performance by comparing
the index values with the aCR yield dataset, including:
• Potential issues with yield data measurement.
• Differences in methodologies tailored to cover different sources of risk. In
particular:
- Input-based methodologies look only at the impact of drought on crop
production and focus on an input variable (rainfall); other sources of
production risk (e.g. pests and diseases) are not considered.
- Output-based methodologies look at variables connected to output (e.g.
amount of vegetation, evapotranspiration) and, therefore, are likely to more
closely match yield variations generated by drought and by other sources
of risk.20
While analysing historical performance is useful, it does not guarantee future
performance. There are many reasons why: changes in crop varieties or in agronomic
practices, the occurrence of weather events not previously experienced, or climate
change trends. Despite these inherent limitations, analysing historical performance
can still provide valuable clues to the general behaviour of the index.
20 Since the causes of loss recorded in the project analyses were mainly related to rainfall deficit, the performance assessment of input-based methodologies is unlikely to have been negatively affected by the occurrence of loss events other than rainfall deficit.

84
9. PerformAnce Assessment
Generally speaking, when assessing how well an index contract structure is
performing, the guiding principle is whether it is triggering appropriately-sized
payouts when losses are recorded. Two approaches were used in the analysis:
• counting the number of events in which a payout was missed or triggered
erroneously (see below, Counting the number of mismatches)
• cumulating the deviations between the reference yield outcome and the
payouts that were triggered or should have been triggered (see page 85,
Measuring the size of the mismatches).
counting the number of mismatchesThe proportion of counted mismatches is an intuitive indicator designed to show
how many times, on average, the index structures do not properly match the
payouts expected.21
Counting mismatches (not matching payout events) slightly deviates from
computing the number of false positives (payouts triggered when not required) or
false negatives (payouts not triggered when required) since it focuses more on the
size of the deviation from the payouts ideally expected. The rationale is that both
false positives and false negatives may not affect the performance of the insurance
contract significantly if the magnitude of the mismatch is small. What is more
relevant is the extent to which the payout matches the size of the loss. For example,
a payout of 2 per cent of the value insured when there is a 90 per cent recorded loss
represents a very poor outcome, even though a payout has been triggered; and even
though it would be classified as an “appropriate” event from a “false positive” and
“false negative” perspective.
In an adverse year,22 the index insurance structure is expected to trigger a payout
similar in size to the difference between the threshold and the recorded yield level.
“Non-accurately performing” events are considered situations in which the payout
and the yield deviation are significantly different in size.
To evaluate the performance of the index structures, a dedicated classification
was adopted that specifically accounts for the magnitude of the mismatches between
payout and yield reduction, leading to indicators that would provide the number
of occurrences that show a “correct + acceptable mismatch” and a “not acceptable
mismatch + not correct”. The reference values for such parameters have been set
at below a deviation of 5 percentage points for declaring a payout “correct” and
between 5 and 15 percentage points for the mismatch to be considered “acceptable”
(Table 14).
21 The project chose to present the indicator as referring to the share of events that are “not acceptable”, rather than to the share of “acceptable” events. This was partly to avoid confusion between the counting indicator with a measure of correlation between the yields and the indices. In addition, the real objective of such an indicator is to show the potential pitfalls of the indices in capturing losses, and focusing on the number of non-correct events may, in fact, be more appropriate. 22 For the purpose of this analysis, a crop year is classified as adverse when the recorded yield level is below 80 per cent of the historical average. Averages were calculated on the 2001-2014 interval and yields were not detrended.

85
Remote sensing foR index insuRance findings and lessons leaRned foR smallHoldeR agRicultuRe
table 14. colour coding adopted in historical performance analysis
class and colour code
definition final classification
correctIf payout is provided or not provided in accordance with yield behaviour, within a deviation of 5 percentage points
correct + Acceptable mismatch
Acceptable mismatch
If the mismatch between yield deviation and payout is between 5 and 15 percentage points. This class also includes events not performing correctly (false positives and false negatives) within a 15 percentage point deviation only.
not acceptable mismatch
If mismatch between yield deviation and payout exceeds 15 percentage points. not
acceptable mismatch + not correct
not correctIf not correct (false positives and false negatives) and mismatch above 15 percentage points.
measuring the size of the mismatches: covariate mismatch and over/undercompensation indicators
Covariate mismatch
An assessment approach based on the actual size of the “mismatch” between
losses and payouts was also developed. Such an approach is based on an indicator
that estimates the covariate mismatch (CM) between payouts and losses. The CM
indicator is expressed as a percentage of the amount of losses recorded over the
period observed, and provides a measure of how large, in aggregate, the payout
mismatches are.
The emphasis on the covariate component of yield losses is due to the fact that the
misalignment between payouts provided by an index insurance contract and losses
experienced by farmers (basis risk) is composed of a covariate element (i.e. the
comparison between the index values and the reference variable in a geographical
area), and an idiosyncratic element (i.e. the mismatch between the index values and
the values that the reference variable takes at the individual farmer level). As the
comparison between losses and payouts is carried out at the aggregate level, and
not at the individual farmer level, only the covariate dimension of the relationship
between losses and payouts is accounted for in the project analysis.

86
9. PerformAnce Assessment
The proposed CM indicator is structured as follows:
(Eq. 1)
Where: y is the recorded yield loss below the threshold; and x is the payout triggered.
For example, a covariate mismatch of 200 means that the deviation from the
ideal expected performance is two times larger than the actual amount of losses
experienced in the observed period.
Over/Undercompensation
In order to verify whether the index structures show a tendency to compensate
more or less than required, the deviations between losses and payouts have also
been broken down into overcompensation and undercompensation. These two
indicators capture different aspects of a payout mismatch. Undercompensation is
a concern for the insured party (e.g. smallholder farmers) and for the promoters
of an insurance programme (e.g. governments, development organizations) since
it signals that losses have not been fully covered and, therefore, that the insurance
product has not entirely fulfilled its purpose. However, overcompensation is also an
issue since a systematic tendency to pay out more than what is required is going to
be factored into the pricing process, generating a more expensive and, therefore, less
accessible product.
The overcompensation indicator is structured as follows:
(Eq. 2)
where y and x are as defined in Eq. 1 and is the number of events in which an
overcompensation has been observed.
The undercompensation indicator is structured as follows:
(Eq. 3)
where y and x are as defined in Eq. 1 and is the number of events in which an
undercompensation has been observed.
Overall performance of index structures across all regions and all crops
Table 15 and Figure 26 summarize the performance of the fixed-ELC index structures
averaged across all products developed for all regions and all crops. An explanation
of how to interpret the performance tables is presented in the notes to Table 15.

87
Remote sensing foR index insuRance findings and lessons leaRned foR smallHoldeR agRicultuRe
table 15. summary of product performance for fixed-elc index structures averaged across all structures developed (all regions, all crops)
1 2 3 4 5 6 7 8 9 10 11 12 13 14 15 16 17 18
rssP
co
rrec
t (n
um
ber
)
Acc
epta
ble
mis
mat
ch (n
um
ber
)
no
t ac
cep
tab
le m
ism
atch
(nu
mb
er)
no
t co
rrec
t (n
um
ber
)
su
m
co
rrec
t (p
erce
nta
ge)
Acc
epta
ble
mis
mat
ch (p
erce
nta
ge)
no
t ac
cep
tab
le m
ism
atch
(per
cen
tag
e)
no
t co
rrec
t (p
erce
nta
ge)
co
rrec
t an
d a
ccep
tab
le m
ism
atch
(per
cen
tag
e)
no
t ac
cep
tab
le m
ism
atch
+ n
ot
corr
ect
(per
cent
age)
Ave
rag
e p
erce
nta
ge
elc
*
ove
rco
mp
ensa
tio
n (n
um
ber
)
un
der
com
pen
sati
on
(nu
mb
er)
ove
rco
mp
ensa
tio
n (p
erce
nta
ge)
un
der
com
pen
sati
on
(per
cen
tag
e)
co
vari
ate
mis
mat
ch
EARS 61 24 8 10 103 59 23 8 10 83 17 5.6 3 2 15 15 196
FEWS NET 44 16 1 9 70 63 23 1 13 86 14 4.8 3 2 13 14 187
GeoVille 52 11 5 11 79 66 14 6 14 80 20 3.7 1 2 24 17 149
IRI 50 32 8 12 102 49 31 8 12 80 20 5.7 5 2 13 19 227
ITC 12 82 8 1 103 12 80 8 1 91 9 4.0 10 3 3 16 151
VITO 66 15 4 7 92 72 16 4 8 88 12 3.9 1 3 15 15 98
* ELC computed over the years 2001-2014 (14 years).

88
9. PerformAnce Assessment
How to read the tables:
column explanation
1 The six RSSPs
2 to 5 the number of observations classified in the four classes discussed above (see Counting the number of mismatches, page 84)
2 Correct
3 Acceptable mismatch
4 Not acceptable mismatch
5 Not correct
6 The total number of observations. Note that the number of observations changes for each RSSP since, for technical reasons, not all of them were able to develop index structures for all the crop/area combinations.23
7 to 10 the absolute number of observations (as a percentage) that fall into the different classes
7 Correct
8 Acceptable mismatch
9 Not acceptable mismatch
10 Not correct
23 The complete list of index structures developed for each of the crop area combinations, together with the respective performance indicators, is presented in Annex IV.

89
Remote sensing foR index insuRance findings and lessons leaRned foR smallHoldeR agRicultuRe
column explanation
11 to 12 Aggregate the values presented in columns 7 to 10 into the two summary indicators: (11) correct + acceptable mismatch (percentage); (12) not acceptable mismatch + not correct (percentage). the latter, together with the covariate mismatch indicator, are the key references for assessing the performance of the index structures and are also illustrated in the figures showing the key data that follow the tables.
11 Correct + acceptable mismatch
12 Not acceptable mismatch + not correct
13 The average ELC achieved by each RSSP. In the various tables, the ELC is averaged for each specific level of aggregation. The RSSPs were asked to develop structures with fixed ELCs for the different crops, but were also allowed to submit structures that had lower ELC levels than those recommended.
14 Number of events in which an overcompensation has been recorded.
15 Number of events in which an undercompensation has been recorded.
16 In percentage terms, the number of overcompensation events.
17 In percentage terms, the number of undercompensation events.
18 The values of the CM indicator23
Overall, the performance of the index structures lies between 9 per cent and
20 per cent of the “not acceptable mismatch + not correct (percentage)” indicator, and
between approximately 100 and 200 of the CM indicator. Therefore, the historical
analysis shows that 9 per cent to 20 per cent of the time, the indices did not behave
as expected (despite the significant tolerance thresholds considered) and that the
size of the mismatch is, on average, from one to two times the size of the actual
amount of payouts expected. Figure 26 also shows that the undercompensations are
quite homogeneous across RSSPs and, as the background tables in Annex IV suggest,
this seems to be because the various indices tend to systematically fail to capture
certain loss events.
With regard to overcompensations, the comparison between the number
of events and the percentage levels provides insights into the average size of the
exceeding payouts. For example, it shows how, on average, the indices developed
by ITC tend to pay out very frequently, more often than required (as shown by the
large number of overcompensating events), but the deviations from the amounts
expected are quite small (since the percentage of overcompensation values is also
relatively small).

90
9. PerformAnce Assessment
figure 26. Average across all crops and all rois of performance indicators for fixed-elc structures
Overcompensation
Undercompensation
0
Per
cent
age
EARS FEWSNET
GeoVille IRI ITC VITO
Not acceptable mismatch + not correct (percentage)
20
15
10
5
25
0
200
150
100
50
250
Per
cent
age
0
Num
ber
of e
vent
s
Over/Undercompensation events (number)
12
10
8
2
6
4
14
EARS FEWSNET
GeoVille IRI ITC VITO-5
5
10
15
20
25
30
35
40
0
0
1
2
3
4
5
6
7ELC (percentage)
EARS FEWSNET
GeoVille IRI ITC VITO
Per
cent
age
EARS FEWSNET
GeoVille IRI ITC VITO
Covariate mismatch
Over/Undercompensation values (percentage)
EARS FEWSNET
GeoVille IRI ITC VITO

91
Remote sensing foR index insuRance findings and lessons leaRned foR smallHoldeR agRicultuRe
Performance of index structures for region of interest (ROI)
The performance analysis at the regional level (Table 16 and Figure 26) shows different
dynamics between the number of mismatches and the cumulative deviations from
the expected payouts. The “not acceptable mismatch + not correct + not correct
(percentage)” indicator shows quite a heterogeneous performance across RSSPs,
without a clearly identifiable pattern. The CM, regardless of the RSSP considered,
is progressively higher, moving from Nioro at the lowest value to Koussanar to
Diourbel, which shows a significant increase. This all suggests that the number of
events in which payouts are not correctly triggered varies significantly across RSSPs,
which in turn could be influenced by the diversity in the methodologies.
Despite these differences, operational conditions in the Diourbel area seem to
make it harder to correctly match losses with index insurance structures. The number
of overcompensations and the amount of overcompensation (as a percentage) tend
to be highest in Diourbel, followed by Nioro. The number of undercompensations is
quite low and stable across the regions, but the amounts of undercompensation are
clearly highest in Nioro.
The performance analysis at the regional level is strongly linked with the
performance analysis at the crop level. Therefore, it is useful to consider the results
of both analyses together. For example, the fact Diourbel displays the lowest average
ELCs is explained by the fact that maize (the crop with the highest reference ELC) is
not grown in that area.

92
9. PerformAnce Assessment
table 16. summary of product performance for fixed-elc index structures averaged over rois
rssP
co
rrec
t (n
um
ber
)
Acc
epta
ble
mis
mat
ch (n
um
ber
)
no
t ac
cep
tab
le m
ism
atch
(nu
mb
er)
no
t co
rrec
t (n
um
ber
)
su
m
co
rrec
t (p
erce
nta
ge)
Acc
epta
ble
mis
mat
ch (p
erce
nta
ge)
no
t ac
cep
tab
le m
ism
atch
(per
cen
tag
e)
no
t co
rrec
t (p
erce
nta
ge)
co
rrec
t an
d a
ccep
tab
le m
ism
atch
(per
cen
tag
e)
no
t ac
cep
tab
le m
ism
atch
+ n
ot
corr
ect
(per
cent
age)
Ave
rag
e p
erce
nta
ge
elc
*
ove
rco
mp
ensa
tio
n (n
um
ber
)
un
der
com
pen
sati
on
(nu
mb
er)
ove
rco
mp
ensa
tio
n (p
erce
nta
ge)
un
der
com
pen
sati
on
(per
cen
tag
e)
co
vari
ate
mis
mat
ch
diourbel
EARS 18 4 1 5 28 64 14 4 18 79 21 5.0 3 2 23 12 424
FEWS NET 15 9 0 4 28 54 32 0 14 86 14 3.4 4 3 12 9 340
GeoVille 15 3 1 3 22 68 14 5 14 82 18 3.7 2 2 27 12 312
IRI 12 12 1 3 28 43 43 4 11 86 14 5.0 6 2 12 12 429
ITC 2 25 1 0 28 7 89 4 0 96 4 3.1 12 2 3 11 288
VITO 21 6 0 1 28 75 21 0 4 96 4 0.4 1 3 6 9 141
koussanar
EARS 18 9 5 1 33 55 27 15 3 82 18 6.1 3 2 16 12 140
FEWS NET
GeoVille 12 4 3 5 24 50 17 13 21 67 33 4.9 2 2 24 18 145
IRI 17 8 5 3 33 52 24 15 9 76 24 6.0 3 2 17 15 157
ITC 7 24 2 0 33 21 73 6 0 94 6 4.7 8 3 4 11 105
VITO 13 4 3 2 22 59 18 14 9 77 23 5.2 2 4 25 14 113
nioro
EARS 25 11 2 4 42 60 26 5 10 86 14 5.7 4 2 9 20 99
FEWS NET 29 7 1 5 42 69 17 2 12 86 14 5.7 2 2 15 18 84
GeoVille 25 4 1 3 33 76 12 3 9 88 12 2.7 1 2 22 20 44
IRI 21 12 2 6 41 51 29 5 15 80 20 6.0 5 2 11 28 163
ITC 3 33 5 1 42 7 79 12 2 86 14 3.9 11 3 3 26 106
VITO 32 5 1 4 42 76 12 2 10 88 12 5.3 2 2 14 20 60
* ELC computed over the years 2001-2014.

93
Remote sensing foR index insuRance findings and lessons leaRned foR smallHoldeR agRicultuRe
figure 27. Average across rois of performance indicators for fixed-elc structures24
24 FEWS NET was not able to develop index structures for Koussanar as no cCR yield statistics were available for this ROI.
Diourbel
Koussanar
Nioro0EARS FEWS
NETGeoVille IRI ITC VITO
0
Not acceptable mismatch+ not correct (percentage)
0
2
4
6
8
10
12Overcompensation events (number)
5
10
15
20
25
30
Overcompensation values(percentage)
25
20
15
10
5
35
30
12
10
8
2
6
4
400
350
300
250
200
150
100
50
450
EARS FEWSNET
GeoVille IRI ITC VITO
EARS FEWSNET
GeoVille IRI ITC VITO
0
5
10
15
20
25
30
0
1
2
3
4
5
6ELC (percentage)
EARS FEWSNET
GeoVille IRI ITC VITO
0
Per
cent
age
Per
cent
age
Per
cent
age
Per
cent
age
Num
ber
of e
vent
s
Num
ber
of e
vent
s
EARS FEWSNET
GeoVille IRI ITC VITO
Covariate mismatch
Undercompensation events (number)
EARS FEWSNET
GeoVille IRI ITC VITO
Undercompensation values(percentage)
EARS FEWSNET
GeoVille IRI ITC VITO0
94
9. PerformAnce Assessment
Performance of index structures at the crop level
Figure 28 shows that the highest percentages of events classified as “not acceptable
mismatch” or “not correct” are recorded for maize, followed by groundnut and
millet with the second and third highest, respectively. This dynamic suggests
that maize was the most challenging crop to cover with the remote sensing
index insurance structures.25 Maize also shows a relatively higher number of
both undercompensation events and undercompensation amounts. For the
overcompensation indicator, the patterns are less clear. The graph showing the
different ELCs in Figure 28 clearly represents the limits imposed for the fixed-
ELC structures that were set at below 8 per cent for maize, below 6 per cent for
groundnut and below 4 per cent for millet.
25 The apparently opposite indication stemming from the covariate mismatch indicator in Figure 28 is because maize is not grown in Diourbel, an area in which the CM indicator is highest.

95
Remote sensing foR index insuRance findings and lessons leaRned foR smallHoldeR agRicultuRe
table 17. summary of product performance for fixed-elc index structures averaged over crops
rssP
co
rrec
t (n
um
ber
)
Acc
epta
ble
mis
mat
ch (n
um
ber
)
no
t ac
cep
tab
le m
ism
atch
(nu
mb
er)
no
t co
rrec
t (n
um
ber
)
su
m
co
rrec
t (p
erce
nta
ge)
Acc
epta
ble
mis
mat
ch (p
erce
nta
ge)
no
t ac
cep
tab
le m
ism
atch
(per
cen
tag
e)
no
t co
rrec
t (p
erce
nta
ge)
co
rrec
t an
d a
ccep
tab
le m
ism
atch
(per
cen
tag
e)
no
t ac
cep
tab
le m
ism
atch
+ n
ot
corr
ect
(per
cent
age)
Ave
rag
e p
erce
nta
ge
elc
*
ove
rco
mp
ensa
tio
n (n
um
ber
)
un
der
com
pen
sati
on
(nu
mb
er)
ove
rco
mp
ensa
tio
n (p
erce
nta
ge)
un
der
com
pen
sati
on
(per
cen
tag
e)
co
vari
ate
mis
mat
ch
groundnut
EARS 25 7 4 3 39 64 18 10 8 82 18 5.6 3 2 18 12 210
FEWS NET 18 6 0 4 28 64 21 0 14 86 14 4.7 2 3 19 9 157
GeoVille 20 5 2 3 30 67 17 7 10 83 17 3.8 1 2 30 12 162
IRI 20 11 4 4 39 51 28 10 10 79 21 6.0 5 2 15 17 249
ITC 3 34 2 0 39 8 87 5 0 95 5 3.7 11 2 4 15 168
VITO 21 5 0 2 28 75 18 0 7 93 7 3.1 2 3 7 9 74
millet
EARS 25 9 2 3 39 64 23 5 8 87 13 4.0 3 2 15 12 260
FEWS NET 19 7 0 2 28 68 25 0 7 93 7 3.5 4 1 11 7 270
GeoVille 23 3 1 3 30 77 10 3 10 87 13 2.0 1 1 21 14 174
IRI 20 16 2 1 39 51 41 5 3 92 8 4.0 5 2 10 13 289
ITC 7 30 2 0 39 18 77 5 0 95 5 2.3 10 2 2 10 174
VITO 30 7 2 0 39 77 18 5 0 95 5 2.5 2 2 11 10 119
maize
EARS 11 8 2 4 25 44 32 8 16 76 24 8.0 4 3 10 20 77
FEWS NET 7 3 1 3 14 50 21 7 21 71 29 7.6 3 4 11 26 78
GeoVille 9 3 2 5 19 47 16 11 26 63 37 6.3 2 3 21 24 91
IRI 10 5 2 7 24 42 21 8 29 63 38 8.0 4 4 15 26 101
ITC 2 18 4 1 25 8 72 16 4 80 20 7.2 8 4 6 23 91
VITO 15 3 2 5 25 60 12 8 20 72 28 6.8 1 4 39 22 90
* ELC computed over the years 2001-2014.

96
9. PerformAnce Assessment
figure 28. Average across crops of performance indicators for fixed-elc structures
0EARS FEWS
NETGeoVille IRI ITC VITO
0
0
2
4
6
8
10
12
5
10
15
20
25
35
30
40
15
12
10
8
2
6
4
350
300
250
200
150
100
50
EARS FEWSNET
GeoVille IRI ITC VITO
EARS FEWSNET
GeoVille IRI ITC VITO
0
5
10
15
20
25
30
35
40
ELC (percentage)
EARS FEWSNET
GeoVille IRI ITC VITO
0
Num
ber
of e
vent
s
EARS FEWSNET
GeoVille IRI ITC VITO
EARS FEWSNET
GeoVille IRI ITC VITO
Not acceptable mismatch use+ not correct (percentage)
Overcompensation events (number)
Overcompensation values(percentage)
Per
cent
age
Per
cent
age
Per
cent
age
Per
cent
age
Num
ber
of e
vent
sCovariate mismatch
Undercompensation events (number)
Undercompensation values(percentage)
EARS FEWSNET
GeoVille IRI ITC VITO
25
20
10
5
40
35
30
1
2
3
4
5
7
6
9
8
0
0
Groundnut
Millet
Maize

97
Remote sensing foR index insuRance findings and lessons leaRned foR smallHoldeR agRicultuRe
Evaluation of historical performance analysis
The criteria considered by the Evaluation Committee in the evaluation of the
historical performance analysis and the scores allocated by the Evaluation
Committee members are summarized in Table 18. The scoring methodology used
for all the evaluation criteria discussed in chapters 9 and 10 is described in Annex I.
The criteria considered by the Evaluation Committee in evaluating product
testing were as follows:
(i) How do the indices developed perform in providing payouts in loss years
averaged across all structures developed (all regions, all crops)?
(ii) How do the indices developed perform in providing payouts in loss years
averaged at the ROI level?
(iii) How do the indices developed perform in providing payouts in loss years
averaged at the crop level?
table 18. overall performance analysis (criteria and evaluation committee scores)
rssP 1 2 3 share of maximum score (percentage)
share of maximum weighted score (percentage)
EARS 2.83 2.43 2.71 53 53
FEWS NET 2.83 3.29 2.86 60 60
GeoVille 3.00 2.86 3.14 60 60
IRI 2.50 2.57 2.71 52 52
ITC 3.50 3.57 3.71 72 72
VITO 4.00 4.29 4.00 82 82
Average across RSSPs
3.11 3.17 3.19 63 63
Weight per criterion
4.17 4.00 4.17
The scores assigned to the evaluation criteria for the historical performance analysis reach a level of 3.1/3.2 out of 5.0 on average across all RSSPs. The score range is quite large, as it goes from slightly below 2.5 to above 4.0 out of 5.0, highlighting the difference perceived in the ability of the methodologies to model historical losses.
The weights assigned to the three criteria are quite high and of similar dimensions, indicating that examining the performance of the indices at the different levels (overall, per-area and per-crop), rather than only at aggregate level, is considered a useful exercise. Because they were assigned similar weights, at aggregated level, the weighted scores are the same as the non-weighted scores. The Evaluation Committee members had different opinions on which level was more relevant but some pointed out that, despite the interesting indications stemming from the overall analysis, the more relevant insights come from the per-crop and the per-area analyses, since these refer more specifically to the implementation issues.

98
9. PerformAnce Assessment
While the Evaluation Committee members stressed that their observations apply
only to the cases explored in the project and that remote sensing methodologies
may perform differently in different conditions, the following key points emerged:
• Despite the differences among the products, the ability of the remote sensing
index structures to track the historical loss patterns of the crops in the test
areas is suboptimal, and substantial improvements in performance would be
required for them to be widely and effectively implemented on a commercial
basis. However, the significant limitations in the yield benchmarks available
for assessing performance mean that it is difficult to make any definitive and
objective statements, as the apparently poor performance could in part be
attributed to the nature and the aggregation of the yield data.
• Output-based methodologies performed relatively better than input-based
methodologies. The methodologies that seem to perform most accurately
are those based on vegetation indices (ITC and VITO). In developing their
methodologies, ITC and VITO adopted crop maps and masks, respectively,26
and this may have had a relevant impact on their performance. In addition,
the VITO methodology adopted a hybrid approach, combining the fAPAR
vegetation index with TAMSAT rainfall estimates.
• Future research could focus on exploring whether the relatively better
performance of the methodologies developed by ITC and VITO is due mainly
to the response of the vegetation indices and the fact that they operate at higher
resolutions than the input-based methodologies, or whether the use of crop
maps and masks and the synergy between different remote sensing approaches
play a relevant role.
Product testingDAPSA yield statistics for 2013 and 2014 were not used for product design and,
therefore, can be considered independent data that can be used to test the predictive
capacity of the indices developed (the DAPSA yield figures for 2001-2014 at aCR
level are presented in Chapter 5).
Product performance tests can be also carried out against the yield data per
crop and per test site generated as part of the on-the-ground monitoring activity
carried out for the project during the 2013 and 2014 growing seasons (see Table 19).
Crop growth, development and yield observed on such fields are considered to be
representative for the 20 km x 20 km ROIs.
26 ITC used crop-type maps, VITO used a cropland mask. See chapters 7 and 8 for more details.
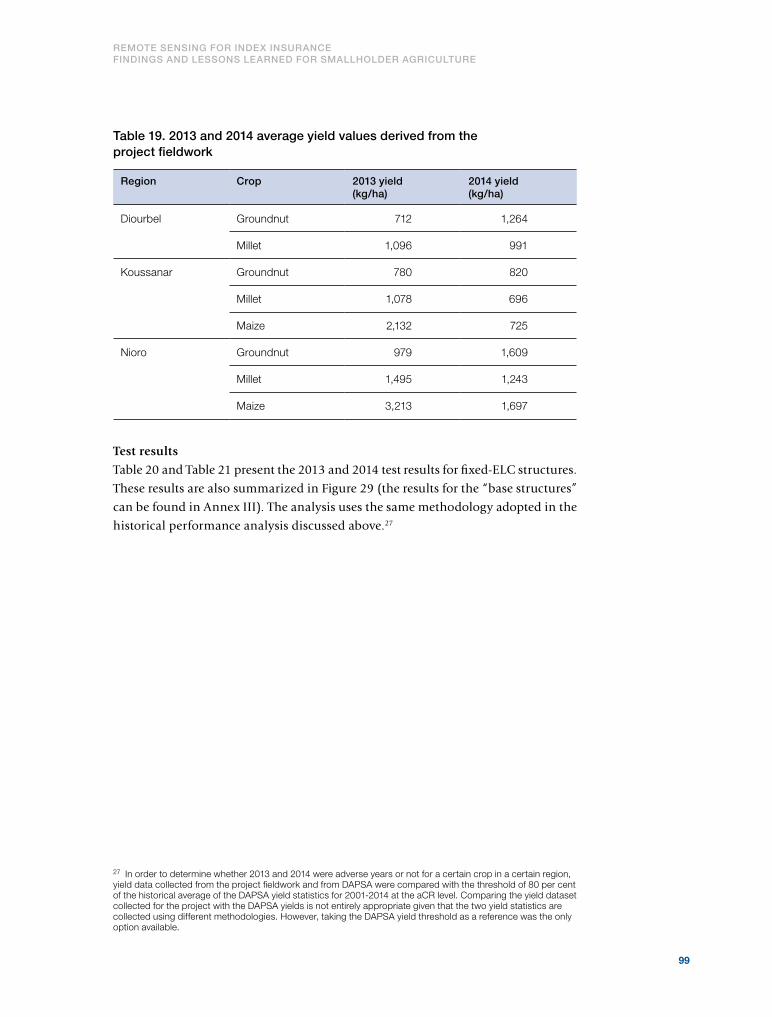
99
Remote sensing foR index insuRance findings and lessons leaRned foR smallHoldeR agRicultuRe
table 19. 2013 and 2014 average yield values derived from the project fieldwork
region crop 2013 yield (kg/ha)
2014 yield (kg/ha)
Diourbel Groundnut 712 1,264
Millet 1,096 991
Koussanar Groundnut 780 820
Millet 1,078 696
Maize 2,132 725
Nioro Groundnut 979 1,609
Millet 1,495 1,243
Maize 3,213 1,697
Test results
Table 20 and Table 21 present the 2013 and 2014 test results for fixed-ELC structures.
These results are also summarized in Figure 29 (the results for the “base structures”
can be found in Annex III). The analysis uses the same methodology adopted in the
historical performance analysis discussed above.27
27 In order to determine whether 2013 and 2014 were adverse years or not for a certain crop in a certain region, yield data collected from the project fieldwork and from DAPSA were compared with the threshold of 80 per cent of the historical average of the DAPSA yield statistics for 2001-2014 at the aCR level. Comparing the yield dataset collected for the project with the DAPSA yields is not entirely appropriate given that the two yield statistics are collected using different methodologies. However, taking the DAPSA yield threshold as a reference was the only option available.

100
9. PerformAnce Assessment
table 20. overview of performance of fixed-elc structures for each rssP compared with 2013-2014 project fieldwork yields28
crop deviation from acr yield threshold
rssP / Payout
Project fieldwork data
eArs fews net
geoville iri itc vito
2013
2014
2013
2014
2013
2014
2013
2014
2013
2014
2013
2014
2013
2014
diourbel
Groundnut 11.3 97.5 0.0 34.4 0.0 27.3 0.0 0.0 0.0 27.9 1.7 10.4 0.0 0.0
Millet 56.3 41.4 0.0 19.9 0.0 22.4 0.0 21.9 0.0 18.6 1.0 6.8 0.0 10.2
koussanar
Groundnut -0.9 4.2 0.0 20.1 - - 9.7 37.1 0.0 19.8 0.2 7.2 - -
Millet 31.8 -14.9 0.0 10.4 - - 0.0 21.9 0.0 13.1 0.1 3.8 0.0 27.7
Maize 119.1 -25.5 3.5 23.0 - - 20.5 47.5 0.0 26.3 4.4 8.1 0.0 59.3
nioro
Groundnut 16.1 90.9 0.0 13.8 0.0 25.9 0.0 37.1 11.6 20.0 3.0 0.4 0.0 16.3
Millet 90.9 58.7 0.0 15.2 0.0 15.7 0.0 0.0 7.8 13.4 2.0 0.3 0.0 4.8
Maize 98.7 4.9 0.0 27.3 0.0 35.7 0.0 47.4 15.5 26.7 42.8 34.1 0.0 0.0
Not acceptable mismatch or not correct (percentage)
0% 75% 0% 100% 13% 63% 13% 63% 13% 63% 0% 29%
28 To facilitate interpretation, Table 20 and Table 21 adopt a simplified colour coding in which the “correct” and “acceptable mismatch” and the “not correct” and “not acceptable mismatch” have, respectively, been grouped together. When the proposed indices perform in an acceptable fashion (“correct” or “acceptable mismatch”), the cells in the tables are coloured in green; when the index is “not correct” or shows a “not acceptable mismatch”, the cells are light red.

101
Remote sensing foR index insuRance findings and lessons leaRned foR smallHoldeR agRicultuRe
table 21. overview of performance of fixed-elc structures for each rssP compared with 2013-2014 acr yields (dAPsA)
crop deviation from acr yield threshold
rssP / Payout
Project fieldwork data
eArs fews net
geoville iri itc vito
2013
2014
2013
2014
2013
2014
2013
2014
2013
2014
2013
2014
2013
2014
diourbel
Groundnut -19.5 13.5 0.0 34.4 0.0 27.3 0.0 0.0 0.0 27.9 1.7 10.4 0.0 0.0
Millet -9.6 21 0.0 19.9 0.0 22.4 0.0 21.9 0.0 18.6 1.0 6.8 0.0 10.2
koussanar
Groundnut 25.2 -1.3 0.0 20.1 - - 9.7 37.1 0.0 19.8 0.2 7.2 - -
Millet -2.2 -2 0.0 10.4 - - 0.0 21.9 0.0 13.1 0.1 3.8 0.0 27.7
Maize 14.7 -14.4 3.5 23.0 - - 20.5 47.5 0.0 26.3 4.4 8.1 0.0 59.3
nioro
Groundnut 12 3.5 0.0 13.8 0.0 25.9 0.0 37.1 11.6 20.0 3.0 0.4 0.0 16.3
Millet 32 0.7 0.0 15.2 0.0 15.7 0.0 0.0 7.8 13.4 2.0 0.3 0.0 4.8
Maize 67.3 -21.1 0.0 27.3 0.0 35.7 0.0 47.4 15.5 26.7 42.8 34.1 0.0 0.0
Not acceptable mismatch or not correct (percentage)
13% 50% 20% 80% 25% 75% 25% 50% 25% 0% 14% 57%

102
9. PerformAnce Assessment
figure 29. Performance of fixed-elc structures in 2013 and 2014: percentage of “not acceptable mismatch or not correct” when compared with fieldwork and acr yields
Note: For EARS, FEWS NET and VITO, the “missing” bars in 2013 fieldwork data indicate that the values are actually 0.
Table 22 and Table 23 summarize the percentages of “not acceptable mismatch
or not correct” in Table 20 and Table 21. The tables show that, overall, the number
of recorded mismatches is extremely high. This is especially true for the year 2014,
which the on-the-ground monitoring indicates as a loss year and, therefore, one of
the years in which the index structures would need to perform accurately.
table 22. Percentage of “not acceptable mismatch or not correct” for fixed-elc structures for 2013-2014 acr yields
2013(percentage)
2014(percentage)
EARS 13 EARS 50
FEWS NET 20 FEWS NET 80
GeoVille 25 GeoVille 75
IRI 25 IRI 50
ITC 25 ITC 0
VITO 14 VITO 57
0
10
20
30
40
50
60
70
80
90
100
IRI ITC VITOEARS FEWS NET GeoVille
Per
cent
age
2013 Project �eldwork
2013 DAPSA aCR
2014 Project �eldwork
2014 DAPSA aCR
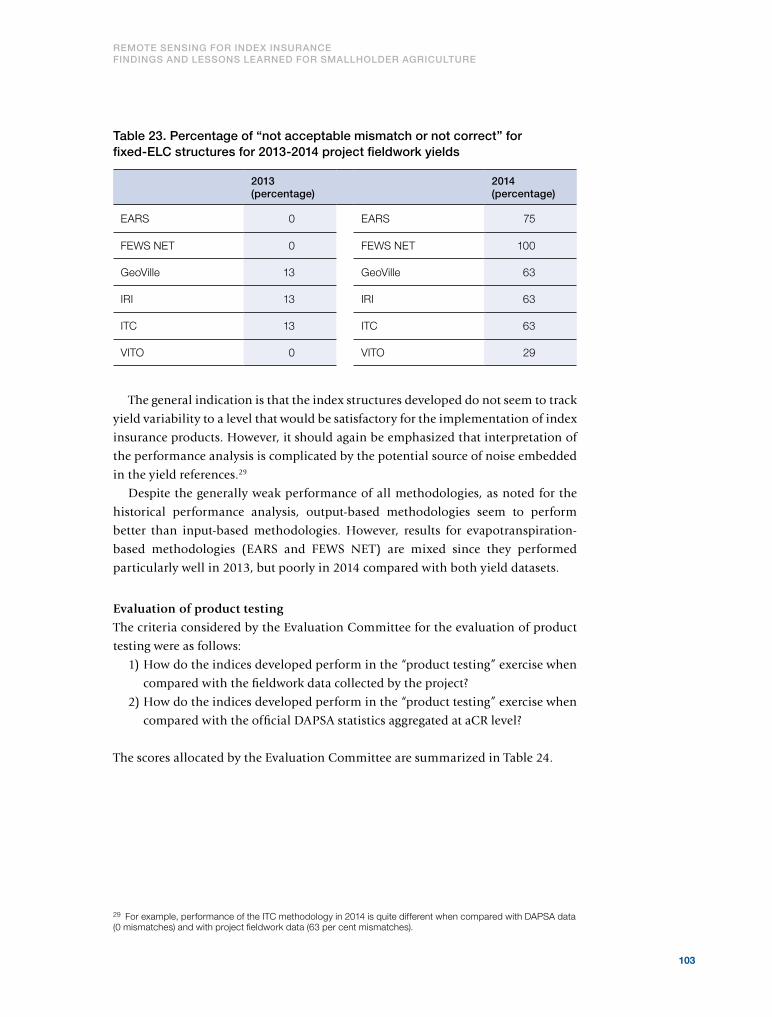
103
Remote sensing foR index insuRance findings and lessons leaRned foR smallHoldeR agRicultuRe
table 23. Percentage of “not acceptable mismatch or not correct” for fixed-elc structures for 2013-2014 project fieldwork yields
2013(percentage)
2014(percentage)
EARS 0 EARS 75
FEWS NET 0 FEWS NET 100
GeoVille 13 GeoVille 63
IRI 13 IRI 63
ITC 13 ITC 63
VITO 0 VITO 29
The general indication is that the index structures developed do not seem to track
yield variability to a level that would be satisfactory for the implementation of index
insurance products. However, it should again be emphasized that interpretation of
the performance analysis is complicated by the potential source of noise embedded
in the yield references.29
Despite the generally weak performance of all methodologies, as noted for the
historical performance analysis, output-based methodologies seem to perform
better than input-based methodologies. However, results for evapotranspiration-
based methodologies (EARS and FEWS NET) are mixed since they performed
particularly well in 2013, but poorly in 2014 compared with both yield datasets.
Evaluation of product testing
The criteria considered by the Evaluation Committee for the evaluation of product
testing were as follows:
1) How do the indices developed perform in the “product testing” exercise when
compared with the fieldwork data collected by the project?
2) How do the indices developed perform in the “product testing” exercise when
compared with the official DAPSA statistics aggregated at aCR level?
The scores allocated by the Evaluation Committee are summarized in Table 24.
29 For example, performance of the ITC methodology in 2014 is quite different when compared with DAPSA data (0 mismatches) and with project fieldwork data (63 per cent mismatches).

104
9. PerformAnce Assessment
table 24. Product testing analysis (questions and evaluation committee scores)
1 2 share of maximum score (percentage)
share of maximum weighted score(percentage)
EARS 2.17 2.67 48 48
FEWS NET 1.83 2.00 38 38
GeoVille 2.50 2.50 50 50
IRI 2.67 3.00 57 57
ITC 3.00 3.67 67 67
VITO 4.17 3.17 73 73
Average across RSSPs
2.72 2.83 56 56
Weight per criterion
3.80 4.00
The Evaluation Committee members acknowledged the challenges in generating
a long time series of data for the product tests, but at the same time pointed out that
in order to reach more robust conclusions, performance should, ideally, be assessed
over more seasons.
The weights assigned to the evaluation criteria for the product testing (3.8 and
4.0) indicate that, according to the evaluators, both tests are relevant. The product
testing scores are lower than the scores for the historical performance analysis: across
all RSSPs, the product tests reach an average level of 2.7 and 2.8 out of 5.0. This
suggests that the Evaluation Committee consider the performance of the product
testing quite weak.
Similar to the historical analysis, the range of scores assigned to the RSSPs is quite
large, going from slightly below 2.0 to slightly above 4.0 out of 5.0, which highlights
the difference perceived in the ability of the methodologies to cover yield losses.
In line with the findings of the technical analysis, and given the caveats mentioned
throughout this chapter, the evaluation process indicates that the product testing
does not provide evidence of successful application of the index structures tested in
the project, and that insurance schemes based on such approaches should carefully
plan for measures aimed at mitigating the occurrence of basis risk events.

105
Remote sensing foR index insuRance findings and lessons leaRned foR smallHoldeR agRicultuRe
Box 7. identifying the start of season date through remote sensing technology
One important parameter frequently adopted in the design of index insurance for crops is the start of season (SoS) date. The SoS can be identified with the time of sowing or the time of plant emergence. Index contracts can include specific provisions aimed at synchronizing the insurance coverage with the actual crop calendar (e.g. the contract coverage can be bound to start when precipitation reaches a specific rainfall threshold per day or per dekad – a 10-day period).
EARS, GeoVille and VITO tested their methodologies to determine whether they were able to capture the SoS date correctly. The project collected information on the SoS for the 2013 crop season for the different crops and areas, and this information was then compared with the SoS estimated through the remote sensing methodologies. The remote sensing approaches adopted by the RSSPs to identify the SoS were relative evapotranspiration for EARS, soil moisture for GeoVille and both rainfall estimates and vegetation indices for VITO.30 The table below summarizes the outcome of the SoS tests. In particular, the “Reference SoS” column refers to plant emergence per crop and area derived from field observations. The values in this column represent the earliest and latest dekad and the average dekad in brackets. The RSSPs provided one general figure per region and crop.
region crop reference sos
sos estimated by rssPs
eArs geoville vito
relative evapo- transpiration
soil moisture
rainfall estimates
vegetation indices
Diourbel Groundnut 19-20 (19.3) 19 - 19 21
Millet 19 (19) 19 - 19 21
Koussanar Groundnut 19-21 (20.0) 19 19 - -
Millet 19-21 (19.2) 19 19 - -
Maize 19-21 (19.2) - 19 16 19
Nioro Groundnut 17-21 (19.1) 19 18 - 21
Millet 16-21 (17.9) 19 18 - 21
Maize 17-21 (20.0) 19 18 18 21
The SoS dekads estimated using remote sensing tend to be within the same range as the observed SoS dekads. This applies to EARS, GeoVille and VITO RFEs. The apparent mismatch of the VITO SoS dates based on vegetation indices, which are generally late and sometimes even later than the observed SoS, is due to the nature of the optical remote sensing-derived indices. These indices are able to detect emerging crops only after a lag period, when they are well visible for the sensor, whereas rainfall or moisture-based indices will indirectly signal emergence much earlier.
The distinction between input-based and output-based methodologies is also relevant in this context. Field explorations indicate that, due to changes in climate patterns and to potential issues in the supply of inputs, sowing windows tend to be less predictable than in the past. Therefore, adopting approaches that actually monitor the situation on the ground may yield more accurate results than establishing SoS dates based on exogenous input parameters in specific time periods.
30 Specific tests carried out by sarmap using SAR data are described in Chapter 7 and Annex V.

106
©IFAD/Sarah Morgan

107
Remote sensing foR index insuRance findings and lessons leaRned foR smallHoldeR agRicultuRe
10. Operational applicability
The assessment of operational applicability considered the general features of the
methodologies. It did not evaluate the RSSPs themselves, nor did it evaluate the
actual performance test carried out in the project. Inevitably, there are criteria
where the interpretation depends on an evaluation of the RSSP rather than the
methodology, for example with regards to the type of commercial set-up.
The applicability of different methodologies for index insurance for smallholders
was evaluated based on criteria split across four sections related to non-test
dependent criteria, and one section of more general assessments:
• availability and source of base data and supplementary data/information;
• cost and sustainability of data acquisition, data processing, and product
development;
• ownership and transparency; and
• general performance and suitability.
Availability and source of dataThe availability and source of data is a key component for the feasibility and the
sustainability of any remote sensing methodology. Base data refers to the raw,
remote sensing data, which is then processed and may be combined with other data
to develop the final index insurance product.
A particularly relevant issue is the acknowledged trade-off between the availability
of historical remote sensing data and the level of spatial resolution at which the
data are available. Furthermore, remote sensing data may not be the only data
needed to develop indices for insurance; they are often supplemented with ground
information, such as crop calendars, agricultural practices, weather data and yield
data. It is therefore necessary to assess the entirety of the data needs of the various
methodologies.
The following criteria were used to evaluate the availability of base data and
supplementary data.
1. source of the data used in the methodologySatellite data have become much more available, diverse and accessible over the last
10 years. Not only has the number of data sources increased and diversified, but
providers (normally in the public sector, e.g. ESA and NASA) have been keen to open
up current data and historical databases to end-users.

108
10. oPerAtionAl APPlicABility
The RSSPs all used original data sources that are readily accessible, e.g. MODIS,
Meteosat, NOAA RFE2, SPOT VGT. Data used by RSSPs for index development
are, in some cases, already pre-processed or modelled (e.g. soil moisture, rainfall
estimates or evapotranspiration). In the case of radar remote sensing data, such as
that used by sarmap for mapping, specific missions (pre-programming of satellite
collection to areas of interest) are needed, and a long time series of historical radar-
based data is generally not available. However, this situation is set to change with
the introduction of Sentinel-1, which has frequent global coverage, making data
available without pre-programming.
2. for what historical period are the base data used for the index development available?Insurers and reinsurers typically prefer a long time series of data in order to give
confidence in the pricing, which also limits uncertainty loading to the premium
and allows assessment of trends. Although 30 years of data has commonly been
quoted as necessary to index reinsurers, much shorter time series (e.g. 15 years) can
be acceptable, bearing in mind that reinsurers of traditional agricultural insurance
frequently have to work with time series of 10 years or fewer. It is important to note
that any time series with limited missing data is considered relatively complete. High
evaluation scores reflected the long time series of Meteosatdata used by EARS, and
NOAA’s ARC2 RFE data used by IRI. In any case, the time series of data available to
RSSPs was considered an important criterion but not a constraint, with the shortest
time period being 15 years for FEWS NET. Note that the “supplementary data” also
needed to calibrate indices are far more problematic (see criterion 6).
3. At what level of spatial resolution are data collected?There is considerable variation in the resolution of the data used by RSSPs between
1 km x 1 km and 10 km x 10 km. While high resolution data may intrinsically be
considered more useful, in operational reality, index insurance schemes by their very
nature need sufficient resolution to set the UAI, within which a number of farmers
are grouped. An objective of this project has been to investigate the potential for
higher resolution index insurance, considering both the technical ability to supply
such an index – and, related to this, field data on the spatial variability of farmer
yields – to determine whether a methodology can capture precise information at a
high resolution.
Pixels may be aggregated to arrive at an average index value over several pixels
within a UAI, so the highest resolution remote sensing may not be required. This is an
important issue both technically, in terms of the granularity that each methodology
is capable of measuring or interpreting at a local level, and operationally, since
enrolment for insurance requires allocation of farmers to specific UAIs.

109
Remote sensing foR index insuRance findings and lessons leaRned foR smallHoldeR agRicultuRe
Potential for basis risk may be influenced by the UAI, and ultimately the trade-
off has to be decided by expert assessment in the context of methodology, farming
systems and crop diversification, as well as the scheme’s operational needs for
enrolment. A consensus, based on experience, is that most schemes are likely to
need UAIs somewhere between 3 km x 3 km and 10 km x 10 km.
4. Are data available at the global level or only for specific geographical regions or in specific situations?Generally, the data employed in the different methodologies are globally available.
5. can the potential lack of historical data be compensated for by using proxy variables that could help in carrying out the risk analysis and the insurance pricing?The extension of data series by proxy is relevant only in some cases where series
are more limited. However, extension of the time series by splicing with older data
may also introduce errors due to data quality and algorithms. In the future, this
problem should be lessened with the launch of new satellite’s “intercalibration” in
which existing datasets are already considered. This criterion is technically complex,
since it also relates to how different (re)insurers approach pricing, and whether they
attach more importance to recent data than to longer-term data. In any case, as
noted in criterion 2, data available for all methodologies are considered very good.
6. what supplementary data (e.g. crop calendars, agricultural practices, weather data, yield data) are required to effectively implement the methodology?With the focus on satellite data and data processing, there is a tendency to overlook
the important role of ground data in designing and calibrating indices. Crop
calendars and start of season (SoS) are used to determine a dynamic start date for
EARS, ITC, VITO and GeoVille. In the case of EARS, no calibration against yield
data is deemed necessary (although EARS has carried out previous calibration of
its model in the region). IRI’s methodology for insurance implementation relies on
fixed windows, calibration against farmers’ memory of bad years, known low-yield
years and a target frequency of payouts. Crop maps and masks are used by ITC,
FEWS NET, and VITO, where ITC calibrates against village-level yields; VITO against
aCR; and FEWS NET against cCR yield datasets. Although it can be attractive when
only limited supplementary data are needed, it ultimately depends on the ability of
the methodology used to perform well.

110
10. oPerAtionAl APPlicABility
table 25. results of scoring on availability and source of data
1 2 3 4 5 6 share of maximum score (percentage)
share of maximum weighted score (percentage)
EARS 4.33 5.00 3.75 4.25 5.00 2.75 84 83
FEWS NET
4.00 3.00 3.25 4.50 4.67 3.75 77 76
GeoVille 3.67 2.75 2.75 4.00 2.67 2.75 62 62
IRI 4.00 5.00 3.25 4.75 5.00 3.75 86 85
ITC 4.33 3.00 4.25 5.00 4.00 2.50 77 76
VITO 4.33 2.75 3.75 5.00 4.00 4.00 79 79
Average across RSSPs
4.11 3.58 3.50 4.58 4.22 3.25 78 77
Weight per criterion
4.0 4.5 4.3 4.0 3.0 4.5
Cost and sustainability If the cost of purchasing the base data and of using them in the development of
indices is not reasonable, it may not be possible to implement the indices developed
since this would add an unaffordable cost margin and thus increase premiums.
Given that most, if not all, base remote sensing data are now available for free, costs
refer mainly to technical needs for developing indices, operating remote sensing
monitoring during the season, and subsequent review and scaling up.
Sustainability refers to both the data sources used and the technical management
of the indices – continuing and reliable access to the base or raw image data, and
processing capacity or possible level of automation to create the derived or final,
marketable product. Operational implications for underwriting and distribution
were also considered.
The following criteria were used to evaluate cost and sustainability of data
acquisition, data processing and product development.
1. Are the base data free or do they need to be purchased?Data used by RSSPs are essentially free. The exception is SAR data, which was used
for the mapping; however, this is changing with the introduction of ESA’s Sentinel 1.
The cost of remote sensing data itself has ceased to be a significant factor, compared
with the cost of data processing expertise.
111
Remote sensing foR index insuRance findings and lessons leaRned foR smallHoldeR agRicultuRe
Another consideration is the potential cost of “supplementary data”. For example,
accessing or acquiring historical daily meteorological datasets or original data from
yield surveys can be problematic and costly (and it has been one of the driving forces
behind the interest in remote sensing index insurance).
2. if data are free, for whom are they free?Some data are free to all users; other data are free to early warning services (such as
FEWS NET); and some are free to private-sector users as long as they are not used
commercially.31 The cost of remote sensing data will depend on how a possible,
future operational service for the insurance sector will be classified. It may also
depend on whether “near-real time” or “archive” data are used (e.g. for Proba-V, all
data becomes free to all users one month after acquisition, which could become
relevant to timing of payout calculations).
While data access is now relatively universal at no cost, there are exceptions.
For example, access to near-real time data for Proba-V, as used by VITO at 1 km
resolution, is open source; however, the different policy for higher resolution data
(100 m and 300 m) means it could carry a cost. All methodologies rely on remote
sensing data at low or no cost.
3. can the free data be used in a commercial product (licensing)?A distinction needs to be made between the raw data themselves and processed data.
Generally, data providers place no restrictions on commercial end-user applications
of data, which are generally provided by public bodies such as space agencies. Where
processed data are required, either the ownership may be proprietary (e.g. EARS) or
permission may be needed (e.g. FEWS NET). However, no licensing requirements
were cited. Regulators of Insurance may take an interest in approving the source of
data used in insurance indices to ensure that data used to determine payouts come
from a reliable and independent source.
4. will the base data be available in both the short and the long term?The increasing number of satellite sensors and the increased interest in remote sensing
for agricultural monitoring and early warning provide a favourable expectation for
data continuity. Specifically, the data used by RSSPs are all expected to continue
being produced, as are replacements for redundant sensors.
5. should the current sensors used to collect base data get lost or damaged, will there be an appropriate replacement for the dataset being used?There is a high likelihood of replacement sensors being available. This criterion
is not considered a significant constraint or concern, although it remains an
important issue.
31 That is, whether data are free for “public use only” and not for “commercial use”.

112
10. oPerAtionAl APPlicABility
6. what is the cost of developing insurance indices on the basis of the specific methodologies examined?This question refers to processing and development costs, rather than any costs that
may be associated with data. The objective was to understand how commercially
scalable and sustainable each methodology might be, and to ensure the cost of
developing insurance indices would (at scale) be absorbed as a small proportion of
premium costs.
The RSSPs were selected primarily to allow different methodologies to be tested,
rather than to assess the management of programmes under which their indices
might be delivered or sold. In this respect, only EARS and IRI are providing actual
index design and implementation services (as a commercial company and as an
academic institution respectively). GeoVille is a commercial company providing
other remote sensing services but not yet index insurance at the time of this project.
For RSSPs not currently providing a service commercially (ITC, VITO, FEWS NET) it
was difficult to provide information on this criterion.
It was difficult to obtain clear and comparable information from all RSSPs,
as those RSSPs not providing a commercial service are not currently delivering
indices to end-users. IRI operates with a pre-agreed annual fee basis. EARS provides
services to end-users based on a fixed fee, offset against a commission on premiums
generated. Commercialization of methodologies to sell index insurance at scale has
not been the primary remit of most RSSPs.
Indeed, the absence in the market of service providers with the technical and
commercial capacity to provide scaled-up services is one of the key constraints
affecting the wider implementation of remote sensing index insurance. RSSPs
providing commercial services need to have the technical, human resources for
the timely design of indices, monitoring of outcomes and reporting of seasonal
outcomes, as well as some insurance knowledge. Unless there is a business model
associated with a methodology, it is not viable as a service to end-users as it currently
stands. A vibrant market for RSSPs can only be developed if there are sufficient
business opportunities..
A further critical point in the actual technical development of the index is the
extent of fieldwork needed for index calibration, the costs implied, and whether
this fieldwork is required only in the first year or at subsequent renewals as well.
Experience has shown that, with the actual implementation of index insurance, it
is very difficult not to have field calibration or validation. EARS has attempted to
minimize field validation; IRI, at the other end of the scale, has intensive community
participation at the village or village cluster level to obtain smallholder feedback on
past adverse years. If an index insurance programme has to be sustainable during
expansion after an initial donor-funded start-up phase, these are critical issues.

113
Remote sensing foR index insuRance findings and lessons leaRned foR smallHoldeR agRicultuRe
7. is the development process labour-intensive or can it be significantly automated?A highly intensive effort is required in the initial phases of index design. This
criterion specifically addresses index development and data processing, rather
than fieldwork. The processing of large volumes of remote sensing data (e.g. many
sites, linked to index triggers, exits, windows) requires skilled programming and
subsequent processing. EARS and IRI have set up their software systems to be able to
process and optimize index parameters on a large, spatial scale. ITC has undertaken
intensive initial work, pointing out that the initial investment should mean a much
lower intensity of work in subsequent years. Other factors are the size of the UAIs
(and therefore, the number of indices to be developed), and whether or not the
indices discriminate between specific crop types. This criterion is highly significant
in the context of the vision that remote sensing can allow scaling up, and also in
terms of automating index insurance using remote sensing.
Experience shows that each following year requires review and fine-tuning
of indices. If an index requires high initial start-up resources but lower ongoing
resources, it has a better chance of sustainability – if the start of financing can be
mobilized, with donor funding subsequently reduced to a low maintenance level.
Automated processing is an important consideration in achieving this objective.
There are some differences in data processing needs between indices based on
remote sensing and WII based on ground stations. Generally, the volumes of data
are much larger for remote sensing since there is full spatial coverage and thousands
of pixels, while WII is limited in historical analysis to existing station data. New
ground stations may require development of synthetic datasets based on algorithms.
In its simplest form, WII can be developed with fewer requirements for large-scale
data automation.
8. what are the capacity-building needs to develop processing and index design on a national or regional basis?At the outset of the project, it was assumed that needs would be identified in sub-
Saharan Africa at a national (or regional) level to maximize the technical capacity in
both remote sensing and insurance in order to design and maintain insurance indices.
However, it must be recognized that some insurers (particularly those not
intending to specialize or those with specific programmes needing index insurance)
might prefer to access a fully outsourced service for index design, training and
programme management. In this respect, meeting this criterion in terms of national
capacity-building does not apply for companies such as EARS, whose business model
is to provide services and to retain control of the product design and proprietary
processing. Nevertheless, all methodologies do require development of expertise.
To implement the methodologies of the other RSSPs, capacity could be transferred
to national institutions, and the RSSPs could provide training and support. This
set-up was particularly the case for IRI, where the RFE indices are less complex to
understand (being an input-based index, where the RFE values trigger the payouts)

114
10. oPerAtionAl APPlicABility
than the methodologies with more complex processing and design needs, such as
ITC, VITO and GeoVille. Evaluation of the criterion is not easy because of the above
factors, interest of the local insurance market in adopting index insurance (itself
dependent on the commercial potential), and whether there is a relevant institution
or institutional agreement to receive capacity-building and training. In the case
of Senegal, which has a single agricultural insurer and several index insurance
schemes, a working group initiative has identified a series of technical individuals
drawn from different institutions who will receive training, and a national insurer
that intends to develop its in-house capacity.
9. once adapted to a specific area, is the methodology easily scalable or does it require significant work for each new uAi to be covered?The main question here is, how much ground-truthing, or interface with local
communities, understanding of farming systems, soils and agro-meteorology, is
really required, considering that obtaining such local information can be costly and
require skilled personnel at a local level. In any case, before scaling up to other
regions, the validity of the product in the new region needs to be assessed against
local ground data.
EARS considered their methodology allowed rapid scaling up into new areas, with
limited field calibration. ITC’s approach has been to undertake wide geographical
analysis as the initial stage of product development, easing the task of scaling up.
They propose uniform premium rates within agro-ecological zones, but localized
payouts based on pixels. Experience in this issue will come from ITC’s introduction
of its methodology in Ethiopia. IRI has demonstrated its methodology in scaling up
in WFP and Oxfam America’s R4 programme and ACRE’s Kilimo Salama scheme
– although significant fieldwork is still required for several annual renewals of
insurance to ensure that parameters are correctly set and take into account the
last season.
The answers for VITO, GeoVille and FEWS NET are less clear, particularly as these
providers were not involved at the time in implementing index insurance. In any
case, moving into a new area requires UAIs to be established and indices designed
for each UAI. Experience of index design and operation in a country (e.g. through
a pilot scheme) informs the scaling up in similar areas, but it still requires that the
index be calibrated for each new UAI. In practical terms, this means that transfer to
other regions/countries requires the presence of a good local partner with access to
reliable yield data, as well as possible dedicated new yield data collection.

115
Remote sensing foR index insuRance findings and lessons leaRned foR smallHoldeR agRicultuRe
table 26. results of scoring on sustainability of data
1 2 3 4 5 6 7 8 9
EARS 4.00 4.00 4.00 4.75 5.00 3.50 4.67 1.67 4.50
FEWS NET
5.00 4.75 5.00 4.75 4.67 3.67 3.00 3.50 4.25
GeoVille 4.00 4.00 4.50 4.00 4.00 2.00 4.33 2.00 3.75
IRI 5.00 4.75 5.00 4.75 5.00 3.33 4.00 4.00 4.00
ITC 5.00 4.25 4.67 4.75 5.00 2.50 3.00 3.00 4.00
VITO 5.00 4.75 5.00 4.75 5.00 2.50 3.00 2.50 3.50
Average across RSSPs
4.67 4.42 4.69 4.63 4.78 2.92 3.67 2.78 4.00
Weight per criterion
3.3 3.5 3.8 4.0 4.3 4.3 4.3 4.7 4.3
share of maximum score(percentage)
share of maximum weighted score(percentage)
EARS 80 80
FEWS NET 86 85
GeoVille 72 71
IRI 89 88
ITC 80 79
VITO 80 78
Average across RSSPs 81 80
Ownership and transparency Ownership refers to whether the methodology for creating the insurance products is
proprietary or whether (and how easily) it can be adopted to develop indices by other
institutions or companies, especially within the countries of operation themselves.
For the operation of an insurance product to be acceptable to insurers and
reinsurers, it must be sufficiently transparent so that results leading to claims and
payouts can be technically audited while respecting ownership rights. This means,
in the case of remote sensing for index insurance, processing algorithms used to
create the product should be made available. Such information may also be required
in the underwriting process, to demonstrate the integrity of the data processing.

116
10. oPerAtionAl APPlicABility
The following criteria were used to evaluate ownership and transparency.
1. is the methodology proprietary?The methodology for EARS and GeoVille is proprietary; it is not proprietary for
the other RSSPs. Proprietary indices were scored by evaluators as less favourable
than those that do not have restrictions of a commercial nature. Another interesting
observation was that there could be advantages, such as a better sense of national
ownership, if the development of local proprietary solutions that are attractive to local
private-sector companies could be supported. At present, much index development
is driven by donors, foreign companies or foreign academic institutions, which
carries a risk of dependency on ongoing funding or service availability.
2. if the methodology is not proprietary, how technically challenging is its replication/adoption by other institutions?The focus of the evaluation is on the methodology used and not on the RSSP as an
entity. The implied response of non-proprietary methodologies (such as FEWS NET,
IRI and VITO) is that there is no theoretical objection to replication. But, as pointed
out, it would be technically challenging for a new service provider to replicate
exactly the methodologies on their own without specific capacity-building provided
by the developers of the methodologies.
This criterion is similar to criterion 1, as transfer of a proprietary methodology
to another institution is clearly not possible; it was scored low by evaluators. Any
replication or adoption by another institution requires skilled personnel, but this
varies according to the methodology. All RSSPs, except EARS, considered transfer
to be possible, although clearly more complex processing and index design (e.g.
involving masking or establishing SoS dates) and crop-specific indices require
increasingly skilled personnel. Interpreting the methodology and the outcomes may
require a range of skills (e.g. interpretation of agro-meteorology, farming systems
and farming technology levels), as well as remote sensing skills. Creation of a tailor-
made interface for insurers to use a methodology is also an important service to be
provided and can be an addition to a specific underlying methodology.
3. whether proprietary or not, are the processing algorithms available for audit in the event of a dispute?The issue underlying this criterion relates to the willingness of the RSSP to allow a full
technical audit of the processing to confirm the actual payout can be demonstrated
from the index as sold, including the data processing algorithms. Such an audit might
be required in the event of a dispute, and regulators of insurance would need to know
that such an audit would be feasible, should it be needed. All RSSPs, including those
with proprietary methodology, confirmed that this would be possible. Generally,
the Evaluation Committee considered that “black box” methodologies were less
acceptable, even if open to final audit in the event of a dispute.

117
Remote sensing foR index insuRance findings and lessons leaRned foR smallHoldeR agRicultuRe
4. would it be technically feasible to transfer the necessary know-how to develop the indices to organizations or companies in the countries of implementation?There is disagreement about the implications and value of exporting (decentralizing)
the core technologies to the countries where they will be used, since the processes
are complex and highly skilled. Private RSSPs, such as the EARS business model,
are not based on transferring methodology or its ownership, but rather supporting
client end-users in delivering insurance. This might suit some insurers implementing
index insurance.
On the other hand, there is a need to develop operational capacity for recipient
countries where local capacity-building is considered the optimum solution for
supporting index insurance development, particularly from the perspective of
development partners or donors. End-users need to decide whether they need to
buy or to develop insurance solutions by building national capacity.
Another comment was that developing indices in countries of implementation
might actually reduce the traceability and consistency of index design, and that
overseas management had advantages. It was noted that methodologies such as
FEWS NET – already active for early warning throughout Africa and working with
agrometeorological organizations – would have some advantages in transferring
capacity. But all RSSPs except EARS confirmed that they considered it technically
feasible to transfer know-how to national structures.
5. is the product commercially protected in a way that means it is not feasible to transfer the necessary know-how to develop the indices to organizations or companies in the countries of implementation?As noted in criterion 4, there is a willingness to achieve transfer in most cases. An
additional point raised by evaluators is that it is necessary to establish who is taking
responsibility for managing basis risk events – especially if the methodology is
supported only by a foreign service provider with no resources in-country, where
knowledge of local conditions is needed and some degree of seasonal monitoring
may be required. This emphasizes the need for strong local insurers and partners if
a service provider is only involved in index design from overseas.

118
10. oPerAtionAl APPlicABility
table 27. results of scoring on ownership and transparency
1 2 3 4 5 share of maximum score (percentage)
share of maximum weighted score (percentage)
EARS 1.50 1.00 3.75 1.33 1.67 37 39
FEWS NET 4.50 3.33 4.75 4.33 5.00 88 88
GeoVille 1.50 1.00 4.75 3.33 2.67 53 55
IRI 4.50 3.33 4.75 4.33 5.00 88 88
ITC 4.50 2.50 4.75 3.67 5.00 82 82
VITO 4.50 3.33 4.75 4.00 5.00 86 87
Average across RSSPs
3.50 2.42 4.58 3.50 4.06 72 73
Weight per criterion
3.0 4.0 4.8 3.5 4.3
General performance and suitability Each methodology has different features in relation to the measurements made, the
value of those measurements for insurance purposes, and any limitations implied
operationally. This means that one methodology may be better suited to a certain
context than another; for example, the ability to discriminate between crops, to
capture perils other than drought or to perform well/poorly at a crucial part of the
crop season. Methodologies were assessed for potential application limitations due
to factors such as climate, topography or region. The performance assessment here
relates to the general features of the methodologies, while the performance in the
project tests is assessed in Chapter 9.
An assessment of suitability captures how viable the methodology would be to
bring to market, considering aspects such as the speed at which values of indices can
be determined (and therefore the time it takes to make payments to insured farmers).
It also establishes whether there are any particular features of the methodology that
will have onerous operational implications for insurers, for example in underwriting
the risk, distribution, and validating and making payouts.
The following criteria were used to evaluate performance and suitability.
1. do the indices developed only cover drought or do they capture other perils as well?The underlying question is whether each methodology is “input-based” (e.g. RFEs) or
“output-based” (measuring vegetation greenness with NDVI, or evapotranspiration,
or soil moisture). Generally, an output-based index would be considered more
119
Remote sensing foR index insuRance findings and lessons leaRned foR smallHoldeR agRicultuRe
favourably than an input-based index, since it would intuitively be more likely to
approach actual yield, against which the project validated each methodology.
Responses for all RSSPs acknowledge that drought is the key peril the
methodologies measure. In theory, major anomalies to crop growth, greenness and
transpiration could also be caused by pests and disease. Measurements of output-
based remote sensing may become more complex due to any number of variables
– land use issues, uniformity and extent of cropping, mixed cropping, small field
sizes, high variability of yields between farmers, or presence of permanent trees or
pasture. In addition to pests and disease, flood is another peril affecting farmers –
it is not slow-acting like drought, but sudden and localized. Although flooding is
not directly measured by the methodologies within the project, it would also be
reflected in some of them (e.g. NDVI and soil moisture profiles). Given the number
of variables and their localized impact at the village level, remote sensing signals for
output-based methodologies used in the project reflected an average of the diverse
local circumstances, especially since there was no dominant single crop type.
However, with longer time series of higher resolution data being available in the
future, signals may become less mixed.
2. can the methodology discriminate between agricultural and non-agricultural activities?In all cases, the methodologies do not directly appear to be able to discriminate
between agricultural and non-agricultural activities from their signals alone,
and therefore the application of crop maps and masks is used to exclude pixels
dominated by non-cultivated areas or forest. ITC, FEWS NET and VITO are using this
approach in order to discriminate agricultural areas from non-agricultural areas.
ITC, VITO and FEWS NET methodologies use crop-specific proxies by masking
and then calibrate remote sensing data using other crop-specific information (i.e.
crop calendars, SoS, and yields for development of crop models). However, at best,
these can only give an indication for smallholder farming areas. Even 1 km x 1 km
resolution cannot discriminate land use other than an average. But crop masks are
an important tool (in this respect, the project also tested the use of SAR data for
mapping and masking). A significant factor influencing the signal from NDVI or
evapotranspiration outputs could be, for example, a high proportion of permanent
trees within a pixel or UAI; it is therefore important to remove such factors by
applying cropland masks.
3. can the methodology discriminate between crops?Discriminating between crops is a difficult criterion since the resolution being
addressed needs to be defined, given that smallholder farmers in sub-Saharan Africa
typically have fields of 0.5 ha. Clearly, discrimination is not possible at the field level,
but methodologies may be calibrated for different mixes of crop types (see previous
criterion). ITC, FEWS NET and VITO have used crop maps and masks as part of their
index development. This criterion highlights the difference between using remote

120
10. oPerAtionAl APPlicABility
sensing to detect cropland or crop type and developing index parameters that best
reflect the expected yield losses of particular crop types. For input-based indices such
as RFE, the signal is not influenced by land use since the focus is on measuring the
“input” variable (e.g. rainfall). For vegetation and evapotranspiration indices, land
use (cropped versus non-cropped land) and crop type are an inherent component of
the signal collected. Remote sensing interpretation for crop-specific and non-crop-
specific methodologies is described further in the conclusions (see Chapter 11).
A conclusion of this criterion is that no methodology can discriminate between
crops, but that extensive analytical work can allow an indication of the dominant
crop type at a higher level of aggregation (e.g. ITC).
4. is there a specific part of the crop season in which the methodology provides a particularly good performance (e.g. in detecting start of season)?While there is good start of season (SoS) estimation by GeoVille, ITC and VITO,
“good performance” in each phase of the season is less easy to define. Given the
increased concern over more inconsistent seasonal rainfall timing due to climate
change, the detection of SoS, and its incorporation into indices as a variable
inception date rather than a fixed date, may become increasingly relevant. RSSPs
were not requested to subdivide the season but to create indices reflecting overall
yields at the village level, so this criterion was not relevant to them.
5. is there a specific part of the crop season in which the methodology is known to be performing poorly?Generally, the evaluators agreed that there was no information available to respond
to this criterion. As with criterion 4, the index was intended to reflect the whole
season, not parts of it. Work in index design carried out for WFP by IRI shows that
vegetation indices targeting the end of the season (or the two weeks after harvest)
can reflect drought stress during maturation, but vegetation indices are less useful
in the vegetative stages.
6. Are there inherent limitations in the application of such methodology that are already known under certain climate, land use, topographical or other conditions, or in specific areas?This criterion delves into some detail and is complex. RFE is more problematic in
areas of strong topography and water bodies, and best reflects rainfall in convective
cloud conditions. Vegetation and evapotranspiration methodologies suffer from
cloud cover, or fragmented agricultural landscapes – particularly when using low
resolution satellite data. A more general point is that methodologies are reflecting
rainfall estimates, soil moisture and vegetation stress (which is primarily estimating
the effects of rainfall deficits on yields). Output-based methodologies such as
vegetation or evapotranspiration can reflect other causes of major losses, such as
certain pests, disease or farming practices.

121
Remote sensing foR index insuRance findings and lessons leaRned foR smallHoldeR agRicultuRe
7. how rapidly can the values of the indices be determined (days, weeks, months)?All RSSPs reported that the values of the indices could be determined rapidly after
the end of the insurance policy periods and therefore this is not a serious constraint
to any of the methodologies. FEWS NET would need two to three weeks to determine
values, but this would still be acceptable. In an operational situation, it seems
likely that rapid processing could be implemented for any given methodology. This
criterion is important since one advantage of index insurance is the ability to make
payouts to farmers very rapidly compared with traditional insurance, where field
assessments are needed. As an operational guideline, an ideal time to determine
an index would be a week after the end of the insurance window. More than three
weeks to a month from the end of a window starts to be a problem for insurers.
8. how complex is the product in terms of explaining its operation to potential clients?Some RSSPs do not have operational experience in index insurance, so this criterion
may have been difficult for the evaluators to answer. Here, “clients” refers mainly
to individual farmers. To have any positive and direct or indirect benefit, it is
imperative that clients understand what they are – and are not – covered for and how
index insurance works, even if the delivery model (e.g. a product linked to credit)
might mean the individual farmer does not actually make the decision to purchase
the product. It is equally important that others in the insurance distribution chain
understand the index and the principles of index insurance.
Experience has shown that farmers will accept indices that are technically
complex provided they perform well; they will also rely on trusted organizations
or key farmers in rural areas. What might be easy for an RSSP to understand would
not necessarily be easy for an insurer, a distribution agent or, ultimately, the
farmer. A sophisticated index may perform better, but more sophistication can be a
disadvantage when explaining it to the client, and when emphasizing the need for
the client to have trust in the implementing partner.
Practitioners within the Evaluation Committee were of the opinion that
evapotranspiration is not easy to explain to farmers, nor are the intricacies of
developing a drought vulnerability model and the logic of determining the trigger
and the exit. For vegetation indices, biomass/vegetation is not necessarily easy to
explain as it is not directly linked to crop yields. RFE has the most operational
experience and, at the time of writing, is relatively well accepted by farmers in
existing schemes. Soil moisture indices are not yet well-tested with smallholder
farmers for index insurance. Ultimately, farmers accept a “drought” index, including
the use of remote sensing, provided that it performs.

122
10. oPerAtionAl APPlicABility
9. Are there particular features of the methodology that will have onerous operational implications for insurers, for example in underwriting the risk, distribution, claims assessment or validation, or payment of claims?For this criterion, EARS and IRI have existing experience in operating index
insurance, as well as the necessary relationships with insurers, brokers, distribution
partners and operational linkages. Other RSSPs have not tested insurance linkages,
although ITC is doing so in Ethiopia.
Points noted by evaluators centre around the need for yield data collection at
a localized level for validating the accuracy of the indices (e.g. ITC methodology)
and the extent of fieldwork needed for calibration to create the index (e.g. IRI
methodology), which would be reflected in start-up costs and time. For VITO, the
local adaptation to crop types and region could be onerous in research in the initial
phases. In the case of EARS, implementation in the past has involved limited ground
calibration to strike a balance between ability to scale up and minimizing basis risk.
This criterion must also be considered in relation to capacity-building of a
national organization. A methodology with more onerous operational implications
would be more difficult or costly in terms of the transfer of know-how, methodology
and determining where national agricultural expertise and statistics may be more
easily accessed. For index insurance operations, the process of calculating the index
outcome and the payouts due is similar in all methodologies, and a major advantage
of index insurance over traditional insurance.
10. does the methodology and its index development have direct benefits for other end-user applications in agricultural risk management, early warning or other fields?Some RSSPs (e.g. FEWS NET, VITO) are extensively involved in early warning systems
and crop monitoring on a national and regional basis. Based on the ASCAT soil
water index (SWI) measurements, Geoville derives the onset of rains to determine
SoS. Remote sensing technology and applications for early warning are becoming
more sophisticated and expanding quickly. Other applications were not covered
in the RSSP responses (e.g. vulnerability mapping, risk assessment, monitoring of
flood or fire events and identification of current grazing areas and conditions).

123
Remote sensing foR index insuRance findings and lessons leaRned foR smallHoldeR agRicultuRe
table 28. results of scoring on performance and suitability
1 2 3 4 5 6 7 8 9 10
EARS 2.67 2.00 2.25 4.50 4.00 3.50 4.50 2.33 4.33 4.33
FEWS NET
2.33 2.67 2.50 2.00 3.50 3.50 2.50 2.33 3.33 4.67
GeoVille 2.33 2.00 2.00 4.50 4.00 3.00 3.50 2.67 3.33 4.33
IRI 2.67 2.00 2.50 2.00 3.50 4.00 2.50 3.67 3.67 4.67
ITC 4.33 2.67 2.25 2.50 4.00 3.50 4.25 3.33 3.00 4.33
VITO 4.67 2.67 2.50 2.50 4.00 4.00 4.00 3.67 3.00 4.67
Average across RSSPs
3.17 2.33 2.33 3.00 3.83 3.58 3.54 3.00 3.44 4.50
Weight per criterion
4.0 3.3 3.8 4.0 4.0 4.0 4.5 3.0 4.3 4.3
share of maximum score (percentage)
share of maximum weighted score (percentage)
EARS 69 71
FEWS NET 59 59
GeoVille 63 64
IRI 62 63
ITC 68 69
VITO 71 72
Average across RSSPs 65 66

124
©IFAD/Clarissa Baldin

125
Remote sensing foR index insuRance findings and lessons leaRned foR smallHoldeR agRicultuRe
11. Conclusions
With financial support from the Agence Francaise de Développement (AFD), IFAD
and WFP implemented this project to develop and test seven innovative remote
sensing methodologies over two seasons in Senegal in order to fill a critical
information gap and address a scaling-up constraint for index insurance. The overall
goal of the project was to contribute scalable and sustainable approaches to index
insurance and to evaluate the feasibility of remote sensing for index insurance to
benefit smallholder farmers. The methodologies were evaluated on:
• the performance of the different indices in accurately depicting village-level
yield loss due to weather and other perils (depending on the remote sensing
approach); and
• the operational feasibility and implementation needed to mainstream remote
sensing in index insurance operations.
Conclusions have been drawn from the project and divided into three main areas:
• programming features;
• technical features; and
• the performance of remote sensing methodologies applied in the project.
Programming features1. each of the methodologies tested fulfills the criterion of operational feasibility for insurance purposes. Each methodology tested could, indeed, support index insurance contracts that are
marketable to farmers and underwritten by insurance companies. As with any index
insurance product, contract development would require normal operational and
technical planning processes to be undertaken, such as identification of the target
clients, definition of UAIs, analysis of pricing and payout options, and distribution
and payout planning. None of the methodologies has barriers to implementation
from an operational standpoint. Some of the approaches are currently used in index
insurance, such as rainfall estimates (RFEs), evapotranspiration and vegetation.
Operationally, the same principles of index insurance apply to all methodologies,
particularly decisions on grouping farmers into UAIs for registration, premium
payment and payouts.
126
11. conclusions
2. two models currently exist for operationalizing remote sensing-based index insurance schemes: external service provision and transfer of capacity. “End-users” of insurance programmes based on remote sensing indices could be
divided into (i) insurers and their clients directly seeking remote sensing services in
the market, and (ii) wider development initiatives normally driven by governments,
international organizations and donors looking to develop in-country markets as
part of financial inclusion, agricultural development, agricultural risk management,
social protection or climate change adaptation approaches.
Private-sector initiatives tend to identify providers able to supply a complete
package of products and services, allowing both development and sale of index
insurance products. Government and development initiatives generally promote
the development of national capacity for index insurance involving public-private
partnerships. In the latter case, development of national capacity and capacity
transfer assumes major importance. An early decision is to determine whether,
based on timeline and strategy, index design and support should be fully or partially
outsourced (for either the short or the long term), and/or whether technical capacity
should be developed within the insurer and/or within technical institutions in-
country, for both design and maintenance of index insurance products.
3. Availability of expertise and dedicated service providers is a key challenge. The complexity and technical competence involved in designing insurance indices
is considerable. Organizations would need to house technicians spanning the
fields of remote sensing, agriculture and insurance. It seems likely that ongoing
support from international specialists would be needed, not least since there is so
much development in remote sensing (e.g. in increased resolution and in skilled
agricultural interpretation).
However, in scoping the market to set up the project, it was evident that there
were few technical service providers with relevant expertise and/or with an
existing model able to support operations. Much of the work on remote sensing for
agricultural development and risk management has been carried out by research or
international organizations. However, they are not currently structured to provide
sustained commercial services to meet the requirements and timelines of insurers,
or may not have the required expertise for services to support index insurance. The
limited availability and the cost of expertise, firms and organizations able to process
remote sensing data, to design and calibrate indices, and to carry out organizational
and technical planning of remote sensing index insurance represent a significant
constraint. This situation makes it more difficult to draw conclusions on the costs/
benefits of providing external services to insurers, or to determine costs of building
and maintaining national capacity. Remote sensing technical service providers have
only recently started to identify market opportunities.

127
Remote sensing foR index insuRance findings and lessons leaRned foR smallHoldeR agRicultuRe
4. knowledge of land use, local farming practices, agronomy and agro-meteorology is necessary. Agriculture, soils and climate can cause complex combinations in smallholder
farming areas that affect agricultural production and the yields actually achieved
by smallholder farmers. Additional local knowledge and data from the ground is
therefore essential to inform the analysis developed by remote sensing methodologies.
5. remote sensing data are increasingly available, but there are constraints on supplementary data in terms of availability and cost. Remote sensing data are no longer a constraint in terms of access or cost, whereas
supplementary data access and cost (e.g. yield data, meteorological data) is more often
problematic. SAR data32 are becoming more easily accessible and will be without cost
now the ESA Sentinel 1 satellites are launched. In addition, the increasing number
of satellites in orbit and the various space agencies’ policy of free data access is worth
noting. Supplementary data access and its cost, however, is a much more significant
issue. While remote sensing methodologies are of particular interest in overcoming
some constraints of ground data (especially yield data and meteorological data),
supplementary data are still needed for validation and calibration. Time series of
yield data are rarely available at a disaggregated level (e.g. village, sub-district),
and they are difficult to interpret due to high individual farmer yield differences in
smallholder agriculture. Daily meteorological data are dependent on past station
density and length of operation of stations. Collection of reliable rainfall data is
a demanding task; and when historical data exist, accessibility and affordability is
frequently problematic. The availability and cost of supplementary data is, therefore,
as important as the remote sensing data itself. The level of confidence in the quality
of all micro-level index methodologies in the project is dependent on supplementary
data being available.
6. the insurance regulatory authorities need to be involved and have, generally, been supportive of initiatives for remote sensing index insurance, provided consumer interests are properly protected. Remote sensing applications to index insurance have, so far, been acceptable to
regulatory authorities. The project confirmed that all the processing algorithms
were available for audit in the event of a dispute even when they were proprietary.
However, regulators will find it more challenging to verify and approve products
that are more complex to understand or that lack transparency, and they may
require external support. All specific products must be approved for the specific
programmes where they will be introduced; and each specific situation with specific
methodologies needs to be confirmed with the regulatory authorities in the country
involved. Regulatory authorities are likely to be concerned with the protection of
consumers and the independent confirmation of index outcomes.
32 SAR data were not used for designing indices but only for mapping purposes and were less available at the time of the project.

128
11. conclusions
7. consumer education will be a key component of success. Although project activities did not include a retail component, the project analyses
and elaborations suggest that a potential concern of index insurance based on
remote sensing technology is that it might be difficult to explain to smallholder
farmers (or unlikely to be trusted by them). Index products based on measurement
of weather (e.g. rainfall) or yield variables have some advantages in that they can be
readily understood by farmers, while more complex indices where the underlying
algorithms and parameters are difficult to explain may prove more challenging.
Experience shows that farmers will accept indices that are technically complex if
they can rely on trusted organizations or key farmers in rural areas. However, the
ultimate test of farmers’ trust remains the ability of the index to provide appropriate
payouts that match losses. Educational campaigns are essential so that there is
consumer awareness of how the index works, and what is and is not covered by
the insurance policy. This also applies to cases in which the delivery model (e.g. a
product linked to credit) is such that the individual farmer is not responsible for the
purchase decision of the product but would still be the recipient of any direct and
indirect benefits. It is equally important that others in the insurance distribution
chain understand the index and the principles of index insurance.
8. Access to reinsurance has generally ceased to be a limiting factor in starting index insurance programmes. There is an active international reinsurance market willing and able to provide
reinsurance financial capacity, although there is rarely any technical support.
The interest of reinsurers is high, and there do not appear to be any technical or
operational constraints to supporting any of the different methodologies tested in
this project. Reinsurers’ support will consider the business opportunity, the product
design and data quality, insurer client assessment and other factors such as potential
premium volume, reputational risk or portfolio diversification. Corporate social
responsibility may also play a role.
Technical features1. yield variability between individual farmers in the rois can create challenges in operating index insurance. Yield and yield loss was the benchmark for measuring performance of the indices
designed. Since farmers in the ROIs generally use low levels of farm inputs (such as
fertilizer) and do not farm intensively, yield variability is high. For the same reasons,
the yield gap between actual yields achieved and potential yields with improved
seeds and inputs is significant. In addition to yield differences attributed to farming
practices, localized rainfall patterns can be markedly different; and yield shortfalls
can also be caused by other risks such as pests and disease, and floods.

129
Remote sensing foR index insuRance findings and lessons leaRned foR smallHoldeR agRicultuRe
2. input-based and output-based methodologies offer different options for index insurance. Input-based indices, such as those using rainfall estimates and soil moisture,
focus on the variables that influence production. They measure factors that act as
determinants of crop growth and, ultimately, yields. Output-based indices, such as
those based on evapotranspiration or vegetation indices, attempt to directly track
changes in productivity. They work by receiving information from the actual ground
conditions, such as crop vigour or transpiration. Output-based measurements
reflect the average measurement over pixels where there could be a wide mix of crop
types and other land cover typical of smallholder agriculture. In contrast, the data
used in input-based methodologies are much less dependent on the actual ground
conditions. In index insurance, some of these indices would be expected to proxy
the expected yield loss due to drought (e.g. rainfall or soil moisture-based indices),
while others (e.g. evapotranspiration or vegetation based indices) would be expected
to proxy yield loss caused by a wider range of perils.
3. ground signal is complex for output-based remote sensing interpretation of smallholder farms. Larger-scale commercial farms (with large fields and continuous cropping areas)
produce better remote sensing signals that more uniformly reflect the growth
situation of a specific crop type. In contrast, smallholder farms have small field sizes,
diversified crop types, different proportions of crop and other land cover, as well
as a wide variation of yields between farmers and between villages. This situation
creates a complex ground signal for output-based remote sensing interpretation,
which measures the average value for the pixel.
4. the methodologies cannot discriminate between yield performance of different crop types in highly mixed cropping areas at a local (village) level. The development of crop-specific index insurance products requires more detailed
information. For example, it requires knowledge of the exact location of the target
crop type so that the satellite signal can be unmixed to obtain information for a
single crop type. Such information is not usually available. Consequently, insurance
products based on low-to-medium resolution indices generally perform better in
homogeneous areas or in areas where different crops show similar reactions to
drought, but their performance may not be as good in more complex environments.
To address this element, dominant crop types have been estimated within some
methodologies. In addition, index parameters (including inception dates and
insurance windows) require knowledge of SoS dates, crop types and crop maturity
lengths. Also required is knowledge of local farming practices, normal soil water
balance, crop varieties and soil moisture holding capacities during the product
design phase. Further, since mixed cropping and small field sizes predominate in
smallholder farming, signals received by sensors are an average for several crops,

130
11. conclusions
even for higher resolution remote sensing. Thus it may become difficult to design
products that are specific to certain crop types, which is why some of the project
indices were developed to be generic and not crop-specific.
5. A key dimension in operating index insurance is the accurate definition of the unit areas of insurance (uAis). Appropriate segmentation of the areas covered by insurance contracts is extremely
important; and remote sensing methodologies can actually provide useful insights
for the definition of spatially homogeneous areas. The spatial building block of
remote sensing technology is the pixel, so UAIs can be developed as an aggregation
of pixels, depending on the resolution opportunity of the specific methodology.
In this respect, different methodologies will operate at various resolution scales
providing results of different accuracy and with potentially better risk profiling
results the higher the resolution and the longer the time series available. The
explorations carried out by the RSSPs provided interesting indications on risk
distribution patterns within the ROIs, but also highlighted the need to carry out
more specific and dedicated activities to develop modelling approaches for risk
segmentation. This could also relate to the application of remote sensing technology
for segmenting UAIs in insurance schemes based on data measured on the ground.
6. there are key operational considerations in determining the appropriate size of uAis. For example, registering farmers for insurance requires that all clients are allocated
to a specific UAI. This may not be practical at high resolution, requiring a significant
workload in geo-referencing individual clients. In addition, defining UAIs based on
one or few “high resolution” pixels (i.e. smaller pixels), where values are sensitive
and may differ from surrounding pixels, may actually increase the chance of
anomalous payouts. In empirical terms, areas somewhere between 3 km x 3 km and
10 km x 10 km seem to be realistic. Where methodologies allow for higher resolution,
appropriate aggregation of pixels should be used to determine suitable UAIs.
7. Basis risk remains the main concern to both insurers and insured farmers.The potential for basis risk is strongly influenced by the size of the UAI, the
uniformity of local yield losses experienced in a loss event, and the ability of
the methodologies to detect such yield losses. Index insurance products based
on remote sensing technology (and indeed station-based WII and AYII) are best
calibrated to provide payments in the most serious loss years, when crop yield loss
can be expected to be very widespread and affect all farmers within the defined
UAIs. Although remote sensing data are available over very wide areas surrounding
the insured areas, it is the index performance within the specific UAI that dictates
whether a farmer has suffered from basis risk. Basis risk gives rise to reputational

131
Remote sensing foR index insuRance findings and lessons leaRned foR smallHoldeR agRicultuRe
risk for both insurers and partners, and to the distrust of farmers if payouts expected
are not delivered. Basis risk is also a primary concern of insurance regulators, who
protect consumer interests.
Performance of remote sensing methodologies1. the lack of appropriate yield data and ground information is one of the primary challenges in designing and testing index insurance. With the focus on satellite data, there is a tendency to overlook the critical role of
appropriate ground data needed to design, calibrate and validate indices. One of the
original aims of the project was to investigate the potential of remotely sensed data
for index insurance to overcome some of the ground data challenges. For testing
and evaluation purposes, obtaining reliable ground data, particularly yield data, is
still a challenge. Drawing reliable and significant conclusions on the use of different
remote sensing products for index insurance requires a considerable amount of good
quality historical yield data and ground information at levels of spatial aggregation
matching the requirements of the methodologies adopted. In developing countries,
where the index insurance products tested in this project would be applied, suitable
datasets were often not available. Challenges in the availability of appropriate
yield data were also experienced during the project – and, in particular, the yield
benchmarks used for index design, calibration and product testing were not of
the ideal aggregation level with respect to the selected ROIs. As a result, despite
the accuracy of the methodological procedures adopted, the project findings are
characterized by a degree of uncertainty due to the lack of ideal sets of yield data.
From a research and development perspective, the detailed analysis carried out
in the project reinforces the general understanding that appropriate yield data are
essential for product design and for reaching robust conclusions on the performance
of index insurance structures.
2. Product design has a critical influence on performance. Product design significantly influences the capabilities of the remote sensing
methodologies to capture productivity losses. Some of the RSSPs modified their
design between the tests in year one and year two, and generated significant
improvements in the performance of their structures. Further product design
improvements could be expected in operational schemes where an RSSP might have
the opportunity for additional field explorations and interactions with local experts.
Some RSSPs did not incorporate all information available (such as additional ground
data) for calibrating the indices, which could improve both design and calibration.

132
11. conclusions
3. Project analyses show that, overall, the historical performance of the index insurance structures (i.e. their ability to replicate the past history of losses to be covered by the insurance proposition) is suboptimal. Although not a guarantee of future behaviour, the analysis of historical performance
can provide clues to how the indices relate to crop variability. The main findings of
the historical performance analysis are as follows:
• Despite the differences between the products of the various RSSPs, the ability
of the remote sensing index structures to track the historical loss patterns
of the crops in the test areas is suboptimal, with a number of observations
not matching the expected outcome, ranging, overall, from 9 per cent to
20 per cent, and with even higher rates of mismatch when assessed at the crop
and the area levels.
• The significant limitations in the available yield benchmarks mean that
it is difficult to make definitive and objective statements, and the modest
performance of the index structures may be, in part, attributed to the nature
and the aggregation of the yield data.
It is important to point out that these findings cannot be generalized since they
apply only to the cases explored in the project, and that more relevant indications on
the performance of the index structures are provided by the product testing.
4. crop maps and masks can improve performance. Some of the RSSPs adopted or developed maps and masks with the objective of
identifying land use and exploring the possibility of differentiating between various
crops. In addition, one of the RSSPs was specifically tasked with (only) carrying out
dedicated explorations on the use of SAR data for mapping land use and crops. The
rationale behind the focus on mapping is that some of the project methodologies
(those that estimate the field performance of crops, such as approaches based on
vegetation indices and evapotranspiration) could generate more effective results if
they were able to segment areas to be monitored. Combining crop mapping or masking
with another remote sensing methodology might enable the development of more
crop-specific index structures. It would also add complexity to the data processing
carried out by the RSSPs to create the index insurance contract structures. In the
case of mapping based on SAR data, the results of the testing activities seem to be
promising and have provided useful indications on how to improve crop monitoring.
5. methodologies based on vegetation indices seemed to track loss histories more accurately. the use of crop maps and masks, and the combination of remote sensing approaches may have contributed to the relatively better performance. The two methodologies based on vegetation indices used crop maps or masks to
determine which parts of the ROIs were to be monitored in the index structure.

133
Remote sensing foR index insuRance findings and lessons leaRned foR smallHoldeR agRicultuRe
This may have had a relevant impact on their performance. In addition, one such
methodology adopted a hybrid approach, combining a vegetation index with
rainfall estimates. An interesting research question to be addressed in the future is,
therefore, whether the improved performance is mainly due to the actual response
of the vegetation indices and the fact that they operate at higher resolutions than
the input methodologies; or whether the use of crop maps or masks and the synergy
between different remote sensing approaches play a relevant role.
6. Product testing activities indicate that the index structures developed would not have tracked yield variability to a satisfactory level. Data and information collected on the ground in 2013 and 2014 provided a very
useful, though limited, testing opportunity since they had not been used for product
design and can, therefore, be considered for an independent “predictive” test. The
testing results show that, overall, the number of recorded mismatches was high. This
was particularly true for the year 2014, which the on-the-ground monitoring reports
indicate as a “loss year” and, therefore, one of the years in which the index structures
would need to perform accurately. However, it is also true that the interpretation of
the testing analysis is complicated by the potential source of noise embedded in the
yield references.
7. Performance of the remote sensing methodologies developed for the project varies across different crops and areas. The index insurance structures perform differently for the different selected crops
and in different test sites. These indications reinforce the notion that the evaluation
findings for such a complex testing activity are hard to generalize and are largely
dependent on the specific operating conditions. Setting up similar tests in other
areas and in other environments may further enhance the understanding of the
specific potential of each of the tools examined.
8. remote sensing methodologies can be usefully adopted for identifying key stages of the crop life such as the start of season (sos) or the end of season (eos) date. An important parameter that is frequently adopted is the SoS date (depending on
the case in point, the SoS can be identified with the time of sowing or with the
time of plant emergence). Index contracts can include specific provisions aimed at
synchronizing the contract with the actual crop calendar so that the coverage starts
when the crop enters the required growth stage. The project validation activities
compared the SoS estimates derived by remote sensing with the field observations
compiled by the monitoring institution and demonstrated the ability of some of the
methodologies to detect the actual start of the growing season. As for the spatial
analysis aimed at segmenting UAIs, remote sensing technology could be also used
to detect SoS in contract structures based on data measured on the ground.

134
©IFAD/Siegfried Modola

135
Remote sensing foR index insuRance findings and lessons leaRned foR smallHoldeR agRicultuRe
12. Recommendations
Remote sensing is, overall, a powerful tool that could expand and improve index
insurance, and allow scaling up. To support this, governments, donors, and the wider
insurance community should consider the following recommendations arising from
the project.
I. Additional research and development activities should be supported
to further improve the potential of remote sensing for index insurance. The
development community should support additional research and development
activities, combined with dedicated monitoring and evaluation frameworks,
to develop approaches that provide an acceptable performance level. Spatially
diversifying the scope of testing and evaluation activities is also important since the
performance of remote sensing-based methodologies varies across crops and areas.
II. Further investment should be made in ground data collection protocols,
capacity and systems. Ground data collection remains important for the development
of the index insurance sector. In many developing countries, yield statistics are of
low quality, with high frequencies of missing data and short time series, and at
a level of aggregation that makes validation and calibration of micro-level index
insurance problematic. The introduction of remote sensing in index insurance still
requires that there is continuing ground data, including yield and meteorological
data, but also good information on farming systems and practices, soil types and
land cover. Investment in such systems would not only bring benefit to agricultural
development in general, but would also positively impact the development and
sustainability of index insurance.
III. Different tools and available data sources should be combined to
develop suitable index insurance products. Combining different remote sensing
approaches, adopting dedicated mapping tools and integrating them with ground-
level sources of data and information can improve the quality of index insurance
structures. Currently, at both the national and the international level, remote
sensing data are collected, stored and managed separately from ground data, and
there is little or no coordination between them in terms of responsibilities, expertise
and systems. Any initiative to support the development of systems that make ground
and remote sensing data sources available and accessible would significantly benefit
the development of more comprehensive index insurance products.

136
12. recommendAtions
IV. Future initiatives should focus on developing appropriate methodologies
for segmenting UAIs to improve the performance of index insurance products.
The definition of appropriate UAIs is key to the successful implementation of index
insurance and should be based on operational considerations (minimum size
requirements to avoid asymmetric information and realistic administrative and
logistical frameworks) and also on the identification of areas that are homogeneous
with respect to the risks to be covered in the insurance policies. Remote sensing
could be used to develop dedicated risk profiling activities for the definition of
appropriate UAIs given the broad spatial coverage and long time series that satellite
data can provide. Given the technical complexity and the cost implications of such
activities, there seems to be a role for governments and donors in supporting the
development of these tasks.
V. Index insurance schemes based on remotely sensed data should carefully
plan for measures aimed at mitigating the occurrence of basis risk events.
Historical performance analysis and product testing activities of the project
indicate that for the smallholder areas studied there were mismatches between
losses incurred and payouts intended by the insurance scheme. As with other index
insurance products, consumer education is essential, and schemes should plan how
possible basis risk events should be managed or compensated.
VI. The capacity of private and public remote sensing institutions should be
built in order to fill current gaps in expertise and ensure future sustainability.
All remote sensing methodologies require highly technical skills to design, maintain
and update the indices. Currently, operational schemes for remote sensing index
insurance in developing countries have relied on external service provision, and
they have often been facilitated by development agencies and donors. Capacity-
building applies both to firms specializing in remote sensing in the private sector
and to national institutions as part of a public-private partnership.
For private-sector providers, investment decisions are likely to be driven by
commercial opportunity, which will depend on the scaling-up potential. For
national capacity, governments and donors are likely to dictate decisions, which
would be linked to the willingness of national insurers and stakeholders to join
such an initiative.

137
Remote sensing foR index insuRance findings and lessons leaRned foR smallHoldeR agRicultuRe
The project experience showed that index design is highly intensive in the initial
phases, particularly since skilled processing and programming of large volumes of
remote sensing data is required in order to structure products for different locations
and, therefore, higher initial investment could translate to a decreased intensity of
work in subsequent years. Even after the implementation of remote sensing index
insurance with some national institutions, it is likely that, for all methodologies,
continued technical support will be required from specialist remote sensing
institutions to build additional skills for maintenance and revisions. Scaling up of
remote sensing index insurance, and/or sharing resources with other applications of
remote sensing such as early warning systems, would bring down the unit cost to the
national institutions and the cost of ongoing external support.

138
References
Affholder, F., C. Poeydebat, M. Corbeels, E. Scopel, P. Tittonell. 2013. The yield gap of major food crops in family agriculture in the tropics: Assessment and analysis through field surveys and modelling. Field Crops Research 143: 106-118.
Awange, J.L., V.G. Ferreira, E. Forootan, E. Khandu, S.A. Andam-Akorful, N.O. Agutua, and X.F Heb. 2016. Uncertainties in remotely sensed precipitation data over Africa. Int. J. Climatol 36: 303-323.
Baron C., V. Bonnal, M. Dingkuhn, F. Maraux, M. Sarr. 2003. SARRA-H: Système d’Analyse Régional des Risques Agroclimatiques-Habillé (System for Regional Analysis of Agro-Climatic Risks). In: Struif Bontkes Tjark (ed.), Wopereis Marco (ed.). Decision support tools for smallholder agriculture in Sub-Saharan Africa: A practical guide. Muscle Shoals: IFDC, p. 192-194.
Black, E., E. Tarnavsky, R. Maidment, H. Greatrex, A. Mookerjee, T. Quaife, and M. Brown. 2016. The Use of Remotely Sensed Rainfall for Managing Drought Risk: A Case Study of Weather Index Insurance in Zambia. Remote Sens 8: 342; doi:10.3390/rs8040342.
European Commission Joint Research Centre, Institute for Environment and Sustainability, 2013. The challenges of index-based insurance for food security in developing countries. Ispra, Italy.
De Rouw, A. 2004. Improving yields and reducing risks in pearl millet farming in the African Sahel. Agricultural Systems 81: 73-93.
Dinku T., C. Funk, and D. Grimes. 2009. The Potential of Satellite Rainfall Estimates for Index Insurance. Annex to Hellmuth M.E., Osgood D.E., Hess U., Moorhead A. and Bhojwani H. (eds). Index insurance and climate risk: Prospects for development and disaster management. Climate and Society No. 2. International Research Institute for Climate and Society (IRI). New York: Columbia University.
Dorigo W., A. Gruber, R. De Jeu, W. Wagner, T. Stacke, A. Loew, C. Albergel, L. Brocca, D. Chung, R.M. Parinussa, and R. Kidd. 2015. Evaluation of the ESA CCI soil moisture product using ground-based observations. Remote Sensing of Environment Volume 162 (June): 380-395.
Hellmuth, M.E., D.E. Osgood, U. Hess, A. Moorhead, and H. Bhojwani (eds). 2009. Index insurance and climate risk: Prospects for development and disaster management. Climate and Society No. 2. International Research Institute for Climate and Society (IRI). New York: Columbia University.
Holecz, F., L. Gatti, F. Collivignarelli, M. Barbieri. 2015. On the use of temporal-spectral descriptors for crop mapping, monitoring and crop practices characterization. IGARSS Symposium. Milan.
IFAD. 2013. Smallholders, food security, and the environment. Rome: International Fund for Agricultural Development.
IFAD. 2015. Annual Report on Results and Impact of IFAD Operations. Rome: International Fund for Agricultural Development.
IFAD-WFP. 2010. The Potential for Scale and Sustainability in Weather Index Insurance for Agriculture and Rural Livelihoods. Rome: International Fund for Agricultural Development.
IFAD-WFP. 2011. Weather Index-based Insurance in Agricultural Development – A Technical Guide. Rome: International Fund for Agricultural Development.
MicroSave. 2013. Towards de-risking disasters: taking stock of microinsurance for disaster risk reduction. Index-based microinsurance in South and South East Asia.

139
Remote sensing foR index insuRance findings and lessons leaRned foR smallHoldeR agRicultuRe
Microinsurance Network. 2016. The Landscape of Microinsurance Africa 2015. Luxembourg.
Lobell, D.B., K.G. Cassman, and C.B. Field. 2009. Crop yield gaps: their importance, magnitudes, and causes. Annual Review of Environment and Resources 34: 179-204.
Muller, Bertrand. 2016. CIRAD. Crop modeling analysis. Written contribution to project (unpublished).
Muller, B., O. Mahul, W. Dick, I. Wade, F. Affholder, and M. Fall. 2010. L’assurance agricole: un outil potentiel d’appui au développement en Afrique de l’Ouest soudano-sahélienne. Report delivered at CIRAD symposium: “Agir en situation d’incertitude. La construction individuelle et collective des régimes de protection et d’adaptation en agriculture” November 22-24. Montpellier.
Nelson, A., and 43 others. 2014. Towards an operational SAR-based rice monitoring system in Asia: examples from 13 demonstration sites across Asia in the RIICE project. Special Issue of Remote Sensing in Food Production and Food Security. Remote Sensing 6 (11).
Srivastava, P.K., G.P. Petropoulos, and Y.H. Kerr. 2016. Satellite Soil Moisture Retrieval. Techniques and Applications.
Stanirimova, R., H. Greatrex, R. Diro, G. McCarney, J. Sharoff, B. Mann, A. Louis D’ Agostino, M. Rogers-Martinez, S. Blakeley, C. Small, P. Ceccato, T. Dinku, and D.E. Osgood. 2013. Using Satellites to Make Index Insurance Scalable. Final IRI Report to the ILO Micro-Insurance Innovation Facility.
Steduto, P., T.C. Hsiao, E. Fereres, D. Raes. 2012. Crop yield response to water. FAO irrigation and drainage paper 66.
Sultan, B., S. Janicot, C. Baron. M. Dingkuhn, B. Muller, S. Traoré, and B. Sarr. 2008. Les impacts agronomiques du climat en Afrique de l’ Ouest: une illustration des problèmes majeurs. Sécheresse 19 (1): 29-37.
Sultan, B., P. Roudier, P. Quirion, A. Alhassane, B. Muller, M. Dingkuhn, P. Ciais, M. Guimberteau, S. Traore, and C. Baron. 2013. Assessing climate change impacts on sorghum and millet yields in the Sudanian and Sahelian savannas of West Africa, Environ. Res. Lett. 8 014040 doi:10.1088/1748-9326/8/1/014040
Toté, C., D. Patricio, H. Boogaard, R. van der Wijngaart, E. Tarnavsky, and C. Funk. 2015. Evaluation of Satellite Rainfall Estimates for Drought and Flood Monitoring in Mozambique. Remote Sens. 7: 1758-1776.
Traoré, S. B., A. Alhassane, B. Muller, M. Kouressy, L. Somé, B. Sultan, P. Oettli, L. Siéné, C. Ambroise, S. Sangaré, M. Vaksmann, M. Diop, M. Dingkuhn, M., and C. Baron. 2011. Characterizing and modeling the diversity of cropping situations under climatic constraints in West Africa. Atmos. Sci. Let. DOI: 10.1002/asl.332.
Vancutsem C., E. Marinho, F. Kayitakire, L. See, and S. Fritz. 2012. Harmonizing and combining existing land cover/use datasets for cropland areas monitoring at the African continental scale. Luxembourg: Publications Office of the European Union.
Wagner, W. 1998. Soil moisture retrieval from ERS scatterometer data.
Washington, R., M. Harrison, D. Conway, E. Black, A, Challinor, D. Grimes, R. Jones, A. Morse, G. Kay, and M. Todd. 2006. Africa climate change: Taking the short route. Bulletin of American Meteorological Society 87: 1355-1366.
World Bank Commodity Risk Management Group. 2008. The International Task Force on Commodity Risk Management in Developing Countries: Activities, Findings and the Way Forward.

140
©IFAD/Wairimu Mburathi

141
Remote sensing foR index insuRance findings and lessons leaRned foR smallHoldeR agRicultuRe
Annexes
ANNEX I
Scoring methodology
To provide a quantitative assessment for each criterion of an RSSP’s methodology, the
Evaluation Committee used the following scoring chart (see Table A-1).
table A-1. scoring chart
score meaning
5 Excellent
4 Good
3 Medium
2 Poor
1 Very poor
In addition, the Evaluation Committee considered how important each criterion was
in the assessment using the following weighting chart (see Table A-2).
table A-2. weighting chart
weight meaning
5 Very important
4 Important
3 Medium
2 Minor importance
1 Not important

142
Annex i. scoring methodology
The evaluation methodology took into account the scores and weights of each
criterion. The steps were as follows:
1. For each criterion, for each RSSP, the average score given by members of the
Evaluation Committee was calculated.
2. Within each criteria set, the maximum possible score was calculated by
multiplying the number of criteria per set by 5 (i.e. the maximum score allowed
per criterion). For example, in the “availability and source of data” set with
6 criteria, the maximum possible score for an RSSP would be (6 x 5) = 30.
3. The sums of the average score per criterion for each RSSP from (1) and the
maximum possible score from (2) were then used to determine the share of
maximum score that represents the percentage of the maximum possible score
obtainable by each RSSP in a specific criteria set.
The final step was to adjust the scores according to the weighting of the importance
assigned to each criterion by the Evaluation Committee. Hence, the following
additional calculations were carried out:
4. The average weight assigned to each criterion by the evaluators per criteria set
was calculated.
5. The average weights assigned for all the criteria in a set were summed to provide
a maximum weighted score per set.
6. The score for each RSSP from (1) was then adjusted to take into account the
average weight assigned for that criterion, to determine the average weighted
score per RSSP for that set, i.e. (score, from (1)) x (average weight for the criteria
from (4)).
7. The average weighted scores for each RSSP from (6) were then summed for
each RSSP in each set and expressed as a percentage of the maximum weighted
score (5), to provide an indicative share of maximum weighted score, which is
expressed as a percentage.
Where not all responding Evaluation Committee members provided a score or weight
for a particular criterion, the data from those who did respond were averaged.
An example to illustrate the methodology is provided in Table A-3. It shows the
scores for a particular RSSP for “availability and source of data” (where there are six
criteria). The calculations of the share of maximum score and the share of maximum
weighted score are shown. These two outputs are used in chapters 9 and 10 in
discussing the results of the evaluation of the performance assessment, which was
dependent on the tests, and of the operational applicability, which was not dependent
on the testing exercises.

143
Remote sensing foR index insuRance findings and lessons leaRned foR smallHoldeR agRicultuRe
table A-3. example calculation using the scores of one rssP for the six “availability and source of data” criteria, to arrive at the share of maximum score and the share of maximum weighted score
criterion Average score per criterion (1 to 5)
Average weight per criterion (1 to 5)
Average weight per criterion in percentage (as a share of 5, the maximum value)
Average weighted score
1 4.33 4.00 80 3.47
2 5.00 4.50 90 4.50
3 3.75 4.25 85 3.19
4 4.25 4.00 80 3.40
5 5.00 3.00 60 3.00
6 2.75 4.50 90 2.48
Maximum possible score
30.00
Sum of average scores
25.08
Share of maximum score 84
Maximum weighted score 24.25
Sum of average weighted scores 20.03
Share of maximum weighted score 83

144
ANNEX II
Impact of changes in the yield threshold and in payout acceptability parameters
Scenarios developed The performance assessment was expanded by developing dedicated sensitivity
analyses to examine the behaviour of the index structures developed by the RSSPs
when some of the key reference parameters change over defined intervals.
The following scenarios were developed:
• A comparison between the payouts generated by the index structures and the
losses when the yield thresholds, which had been originally set at 80 per cent,
vary between 90 per cent and 60 per cent.33
• An analysis of the impact of modifying the tolerance levels set for classifying
a payout as “correct” or “acceptable” when measuring the absolute difference
between the payouts ideally expected and the payouts actually triggered.
Variations in the yield threshold A change in the yield threshold (i.e. the contract “trigger”) will alter the loss levels
targeted by the index insurance contract and will therefore determine a different set
of expected payouts according to the threshold selected. For any specific event, the
lower the yield threshold, the lower the yield amounts that should be covered and,
therefore, the lower the payouts expected.
In reviewing the outcome of this analysis, it is important to note that the RSSPs
were specifically requested to tune their structures to an 80 per cent yield threshold
and that, accordingly, the actual performance should be assessed with respect to
that specific threshold. What the sensitivity analyses presented in this Annex can
add is information on how “robust” the index structures are in matching losses at
different coverage levels or, in other words, how sensitive their performance may be
to changes in the thresholds and how finely tuned the contract design will need to
be. This is not necessarily an indication of better or worse performance, but rather
of how sensitive product design may be to different coverage levels. The analyses are
segmented by crop type, as the different levels of tolerance to shock of the different
crops have a significant impact on how the index structures perform.
As shown in Figure A-1 and Figure A-2, changes in the yield threshold affect all
the assessment metrics discussed above.
With respect to the number of “not acceptable mismatch + not correct” payouts,
the general tendency is to observe a reduction of the indicator (i.e. a reduction of the
33 The reference threshold for the historical performance and product testing analyses was set at 80 per cent, given the thresholds usually adopted in index insurance and the risk levels to be covered in the project tests. Within these ranges, the project decided to adopt a relatively high coverage level in order to increase the frequency of the expected payouts and, consequently, generate more events against which the performance of the index structures could be assessed.
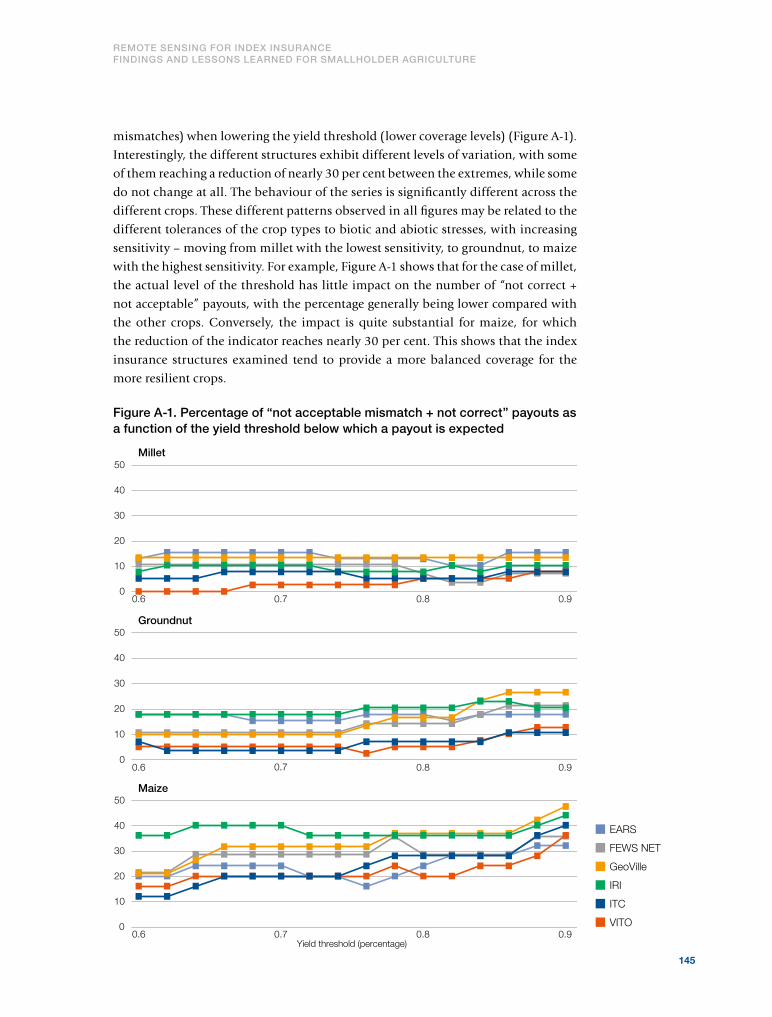
145
Remote sensing foR index insuRance findings and lessons leaRned foR smallHoldeR agRicultuRe
mismatches) when lowering the yield threshold (lower coverage levels) (Figure A-1).
Interestingly, the different structures exhibit different levels of variation, with some
of them reaching a reduction of nearly 30 per cent between the extremes, while some
do not change at all. The behaviour of the series is significantly different across the
different crops. These different patterns observed in all figures may be related to the
different tolerances of the crop types to biotic and abiotic stresses, with increasing
sensitivity – moving from millet with the lowest sensitivity, to groundnut, to maize
with the highest sensitivity. For example, Figure A-1 shows that for the case of millet,
the actual level of the threshold has little impact on the number of “not correct +
not acceptable” payouts, with the percentage generally being lower compared with
the other crops. Conversely, the impact is quite substantial for maize, for which
the reduction of the indicator reaches nearly 30 per cent. This shows that the index
insurance structures examined tend to provide a more balanced coverage for the
more resilient crops.
figure A-1. Percentage of “not acceptable mismatch + not correct” payouts as a function of the yield threshold below which a payout is expected
0.6 0.7 0.8
0.7
0.9
0.6
Yield threshold (percentage)
0.8 0.9
0.6 0.7 0.8 0.9
Millet
Groundnut
Maize
0
10
20
30
40
50
0
30
40
20
10
50
0
20
10
30
40
50
EARS
FEWS NET
GeoVille
IRI
ITC
VITO

146
Annex ii. imPAct of chAnges in the yield threshold And in PAyout AccePtABility PArAmeters
Interesting indications also stem from the analyses of the impact of a change in
the yield threshold on the covariate mismatch (CM) indicator which, as indicated
above, describes the relationship between observed losses and payouts triggered
that is presented in Equation 1:
(Eq. 1)Where: y is the recorded yield loss below the threshold; and x is the payout triggered.
In the CM indicator, the loss component y appears in both the numerator and the
denominator (see Eq. 1). Given the increasing patterns of the indicator as the yield
threshold falls (Figure A-2), it is clear that for lower threshold levels, the aggregate
yield loss in the denominator drops more than the sum of the deviations in the
numerator. From an insurance point of view, this indicates that while in absolute
terms mismatches are higher for higher yield thresholds (higher coverage levels), in
proportional terms the mismatches are larger when targeting extreme events. This
may imply that the index structures analysed are proportionally less accurate in
capturing more extreme events (lower yield thresholds).34
Interestingly, each crop behaves differently, with the mismatch increase rate
being progressively higher – from maize at the lowest rate, followed by groundnut,
and millet at the highest (Figure A-2). This mismatch is due to the fact that for more
resilient crops such as millet, yield reductions do not reach the range shown for
more sensitive crops such as maize.
34 It is important to remember that these general conclusions are affected by the fact that the index structures were not tuned for the different yield threshold levels, but they were developed to match the 80 per cent average yield threshold.

147
Remote sensing foR index insuRance findings and lessons leaRned foR smallHoldeR agRicultuRe
figure A-2. covariate mismatch indicator as a function of the yield threshold below which a payout is expected
changes in the thresholds for defining payouts “correct” or “acceptable” As mentioned earlier, the approach based on the number of events in which a
payout has been missed or has been triggered erroneously is based on the definition
of tolerance levels for classifying a payout as “correct” or “acceptable”, once the
absolute difference between the payouts ideally expected and the payouts actually
triggered has been calculated. In the performance assessment, the reference values
for such parameters were set at below 5 per cent for declaring a payout “correct”, and
0.70.6 0.8 0.9
Yield threshold (percentage)0.6 0.7 0.8 0.9
Millet
Groundnut
Maize
0
100
200
300
0
200
100
300
0
200
100
300
0.6 0.7 0.8 0.9
EARS
FEWS NET
GeoVille
IRI
ITC
VITO

148
Annex ii. imPAct of chAnges in the yield threshold And in PAyout AccePtABility PArAmeters
between 5 per cent and 15 per cent for the mismatch to be considered “acceptable”.35
Table A-4 summarizes the classification used in the performance analysis presented
in Chapter 9.
table A-4. colour coding adopted in historical performance analysis
class and colour code
definition final classification
correctIf payout is provided or not provided in accordance with yield behaviour, within a deviation of 5 percentage points
correct + Acceptable mismatch
Acceptable mismatch
If the mismatch between yield deviation and payout is between 5 and 15 percentage points. This class also includes events not performing correctly (false positives and false negatives) within a 15 percentage point deviation only.
not acceptable mismatch
If mismatch between yield deviation and payout exceeds 15 percentage points. not
acceptable mismatch + not correct
not correctIf not correct (false positives and false negatives) and mismatch above 15 percentage points.
In the analyses that follow, two different tests were conducted:
• Test 1: the “correctness” threshold is held fixed at 5 per cent while the
“acceptability” threshold spans the interval of 5-15 per cent (Figure A-3).
For example, when “acceptability” is at 5 per cent, given that “correctness” is
fixed at 5 per cent, the threshold for considering the mismatch tolerable (both
correct and acceptable) is at 10 per cent.
• Test 2: the correctness threshold is allowed to vary, spanning the interval
0-15 per cent, while the acceptability threshold is fixed at 10 per cent (Figure
A-4). Hence, the tolerable mismatch (both correct and acceptable) spans the
interval 10-25 per cent.
In both tests, the percentage of “not acceptable mismatch + not correct” payouts is
expected to decrease as the two tolerance parameters increase. However, each RSSP
structure has a different sensitivity to changes in such parameters, which reflects the
possibility of adapting a given contract structure to different expectations. In the
case of Test 1 (Figure A-3), the VITO structure shows a relatively stable percentage
of “not acceptable mismatch + not correct” payouts, regardless of the threshold for
35 This analysis only applies to the counting approach and not to the covariate mismatch indicators since the “tolerance levels” are not applied to the latter.

149
Remote sensing foR index insuRance findings and lessons leaRned foR smallHoldeR agRicultuRe
acceptable mismatch. This implies that this type of contract would perform equally
well regardless of the tolerance to accept mismatched and incorrect payouts. Other
types of contracts would not perform so well (high number of not correct payouts +
not acceptable payouts) when the tolerance is low, and would perform better when
the tolerance is higher.
Similar results are obtained in the case of Test 2 (Figure A-4), where the tolerance
is changed by allowing the correctness threshold to vary and by holding a fixed
10 per cent difference between the correct and acceptable thresholds.
figure A-3. Percentage of “not acceptable mismatch + not correct” payouts following changes in the acceptability thresholds (test 1)
5.0 7.5 12.510.0
7.5 12.510.0
15.0
5.0
Acceptable mismatch threshold (percentage)(correct match threshold is held �xed at 5%)
Per
cent
age
15.0
7.5 12.510.05.0 15.0
Millet
Groundnut
Maize
0
10
20
30
40
50
0
30
40
20
10
50
0
20
10
30
40
50
EARS
FEWS NET
GeoVille
IRI
ITC
VITO
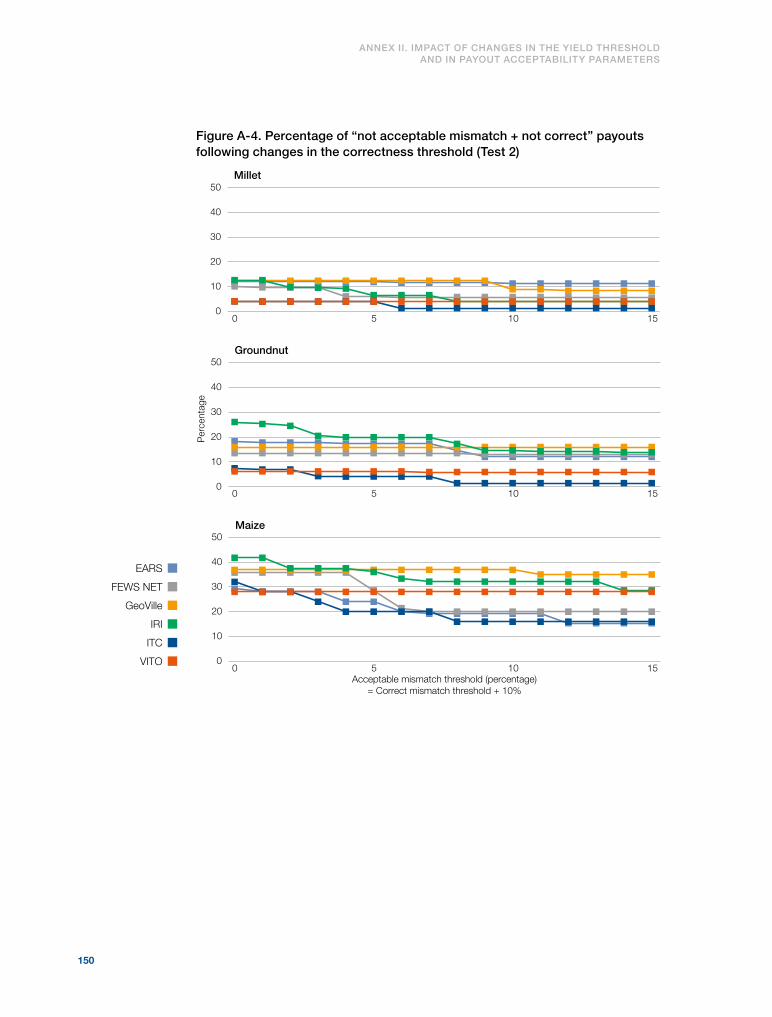
150
Annex ii. imPAct of chAnges in the yield threshold And in PAyout AccePtABility PArAmeters
figure A-4. Percentage of “not acceptable mismatch + not correct” payouts following changes in the correctness threshold (test 2)
0
10
20
30
40
50
0
30
40
20
10
50
0
20
10
30
40
50
Acceptable mismatch threshold (percentage)= Correct mismatch threshold + 10%
0 5 10 15
0 5 10 15
0 5 10 15
Millet
Groundnut
Maize
Per
cent
age
EARS
FEWS NET
GeoVille
IRI
ITC
VITO

151
Remote sensing foR index insuRance findings and lessons leaRned foR smallHoldeR agRicultuRe
ANNEX III
Comparison of base and fixed-ELC products
The following graphs present a comparison at aggregate level between the “base”
and the “fixed-ELC” structures and show the differences that have been generated
in the adjustment process while harmonizing the ELCs, of the index structures (see
page 53).
It is interesting to note how the changes affected the different RSSPs to different
degrees and also how the indicators have been altered in different ways.
The data underlying the dynamics illustrated in Figure A-5 are presented in
Annex IV.
figure A-5. comparison of base and fixed-elc index structures averaged over all regions and crops
EARS FEWSNET
GeoVille IRI ITC VITO
Not acceptable mismatch+ not correct (percentage)
0
2
4
6
8
10
12
Overcompensation events (number)
Overcompensation (percentage)
12
10
8
2
6
4
EARS FEWSNET
GeoVille IRI ITC VITO
EARS FEWSNET
GeoVille IRI ITC VITO
0
ELC (percentage)
EARS FEWSNET
GeoVille IRI ITC VITO
Per
cent
age
Per
cent
age
Per
cent
age
Per
cent
age
Num
ber
of e
vent
s
Num
ber
of e
vent
s
EARS FEWSNET
GeoVille IRI ITC VITO
Covariate mismatch
Undercompensation events (number)
EARS FEWSNET
GeoVille IRI ITC VITO
Undercompensation (percentage)
EARS FEWSNET
GeoVille IRI ITC VITO
0
600
500
700
400
300
200
100
800
20
10
30
50
40
60
5
10
15
20
25
10
20
30
50
40
60
0
25
20
15
10
5
45
35
40
30
0
0
0
Base structures
Fixed-ELC structures
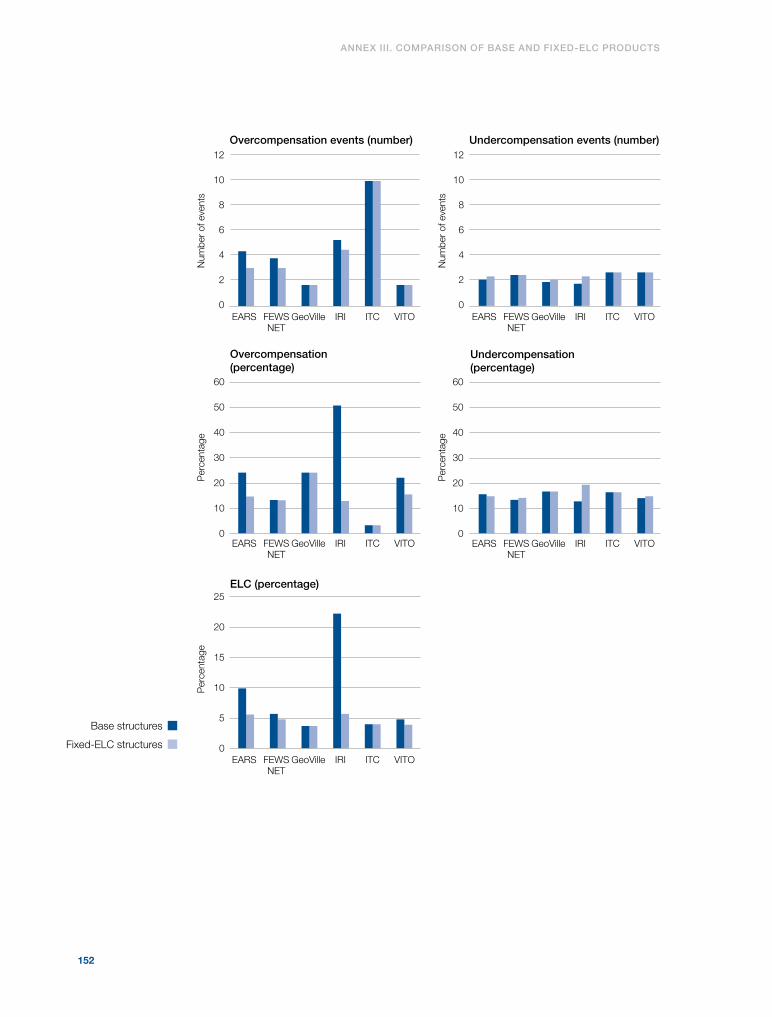
152
Annex iii. comPArison of BAse And fixed-elc Products
EARS FEWSNET
GeoVille IRI ITC VITO
Not acceptable mismatch+ not correct (percentage)
0
2
4
6
8
10
12
Overcompensation events (number)
Overcompensation (percentage)
12
10
8
2
6
4
EARS FEWSNET
GeoVille IRI ITC VITO
EARS FEWSNET
GeoVille IRI ITC VITO
0
ELC (percentage)
EARS FEWSNET
GeoVille IRI ITC VITO
Per
cent
age
Per
cent
age
Per
cent
age
Per
cent
age
Num
ber
of e
vent
s
Num
ber
of e
vent
s
EARS FEWSNET
GeoVille IRI ITC VITO
Covariate mismatch
Undercompensation events (number)
EARS FEWSNET
GeoVille IRI ITC VITO
Undercompensation (percentage)
EARS FEWSNET
GeoVille IRI ITC VITO
0
600
500
700
400
300
200
100
800
20
10
30
50
40
60
5
10
15
20
25
10
20
30
50
40
60
0
25
20
15
10
5
45
35
40
30
0
0
0
Base structures
Fixed-ELC structures

153
Remote sensing foR index insuRance findings and lessons leaRned foR smallHoldeR agRicultuRe
ANNEX IV
Performance of products per RSSP over aCR yields
IntroductionThis Annex presents the detailed results of the historical performance analysis
summarized in Chapter 9, which was carried out by comparing the index structures
developed by RSSPs and the average yields for the aggregated communautés rurales
(aCRs), that is, all CRs intersecting with the regions of interest (ROIs).
The fixed-ELC structures are index insurance structures harmonized in terms of
the expected loss cost per crop. The base structures are the products the RSSPs had
originally designed with no constraint on ELC levels.
In both sections of this annex, the reference yield benchmark values are
reported in the second row of each table and are equivalent to the deviation from
80 per cent of the average yield. Negative values in row 2 (“Deviation from yield
threshold”) indicate that a payout of the corresponding percentage size is expected,
while positive values indicate that the yield recorded is above the threshold and no
payout is required. The payout values triggered by the different methodologies are
presented in rows 3 to 8, each corresponding to a different RSSP.
Fixed-ELC structures table A-5. overview of performance of fixed-elc structures per rssP over acr yields (2001-2014)
green If correct or mismatch within 5 percentage points
light green If mismatch between 5 and 15 percentage points
orange If mismatch above 15 percentage points
red If not correct and mismatch above 15 percentage points (if not correct but with small mismatch in light green class)
white Unable to classify score as correct/not correct due to lack of necessary yield reference
grey No data

154
Diourbel
groundnut
Benchmark and rssP 20
01
2002
2003
2004
2005
2006
2007
2008
2009
2010
2011
2012
2013
2014
deviation from yield threshold
56.2 39.9 22.7 78.5 15.5 8.6 -1.0 26.3 28.6 -12.7 21.5 71.9 -19.5 13.5
elc
EARS 0.0 31.0 0.0 0.0 0.0 0.0 18.4 0.0 0.0 0.0 0.0 0.0 0.0 34.4 6.0
FEWS NET 5.1 0.0 0.0 18.6 0.0 0.0 0.0 0.0 0.0 0.0 0.0 0.0 0.0 27.3 3.6
GeoVille 0.0 0.0 0.0 37.1 0.0 0.0 0.0 0.0 0.0 0.0 0.0 3.4
IRI 0.0 13.8 0.0 7.9 0.0 0.0 19.0 0.0 3.0 0.0 12.5 0.0 0.0 27.9 6.0
ITC 0.4 13.4 7.2 2.3 0.8 6.9 1.1 4.4 0.3 0.2 2.5 0.4 1.7 10.4 3.7
VITO 0.0 0.0 0.0 0.0 0.0 0.0 0.0 0.0 0.0 0.0 0.0 2.3 0.0 0.0 0.2
rssP
co
rrec
t (n
um
ber
)
Acc
epta
ble
mis
mat
ch (n
um
ber
)
no
t ac
cep
tab
le m
ism
atch
(nu
mb
er)
no
t co
rrec
t (n
um
ber
)
su
m
co
rrec
t (p
erce
nta
ge)
Acc
epta
ble
mis
mat
ch (p
erce
nta
ge)
no
t ac
cep
tab
le m
ism
atch
(per
cen
tag
e)
no
t co
rrec
t (p
erce
nta
ge)
co
rrec
t an
d a
ccep
tab
le m
ism
atch
(per
cen
tag
e)
no
t ac
cep
tab
le m
ism
atch
+ n
ot
corr
ect
(per
cent
age)
ove
rco
mp
ensa
tio
n (n
um
ber
)
un
der
com
pen
sati
on
(nu
mb
er)
ove
rco
mp
ensa
tio
n (p
erce
nta
ge)
un
der
com
pen
sati
on
(per
cen
tag
e)
co
vari
ate
mis
mat
ch
EARS 9 1 1 3 14 64 7 7 21 71 29 3 2 28 16 346
FEWS NET 8 3 0 3 14 57 21 0 21 79 21 3 3 17 11 253
GeoVille 8 1 1 1 11 73 9 9 9 82 18 1 2 36 16 205
IRI 6 5 1 2 14 43 36 7 14 79 21 6 2 14 16 346
ITC 1 12 1 0 14 7 86 7 0 93 7 12 2 4 15 239
VITO 10 3 0 1 14 71 21 0 7 93 7 1 3 2 11 107
Annex iv. PerformAnce of Products Per rssP over Acr yields
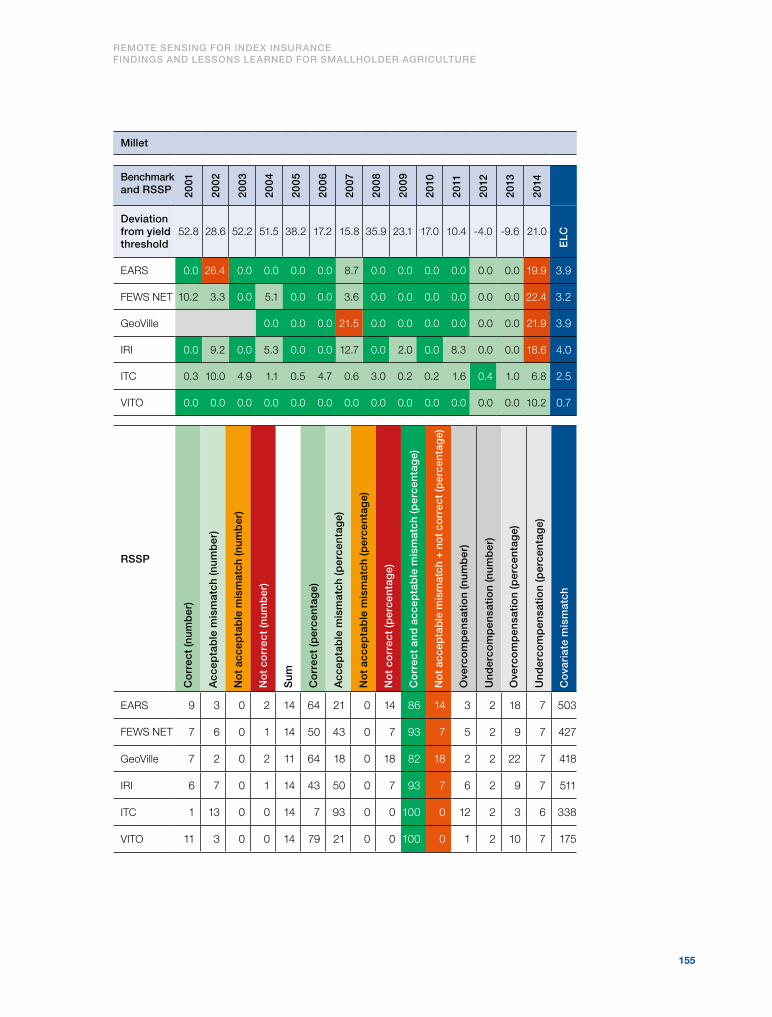
155
Remote sensing foR index insuRance findings and lessons leaRned foR smallHoldeR agRicultuRe
millet
Benchmark and rssP 20
01
2002
2003
2004
2005
2006
2007
2008
2009
2010
2011
2012
2013
2014
deviation from yield threshold
52.8 28.6 52.2 51.5 38.2 17.2 15.8 35.9 23.1 17.0 10.4 -4.0 -9.6 21.0
elc
EARS 0.0 26.4 0.0 0.0 0.0 0.0 8.7 0.0 0.0 0.0 0.0 0.0 0.0 19.9 3.9
FEWS NET 10.2 3.3 0.0 5.1 0.0 0.0 3.6 0.0 0.0 0.0 0.0 0.0 0.0 22.4 3.2
GeoVille 0.0 0.0 0.0 21.5 0.0 0.0 0.0 0.0 0.0 0.0 21.9 3.9
IRI 0.0 9.2 0.0 5.3 0.0 0.0 12.7 0.0 2.0 0.0 8.3 0.0 0.0 18.6 4.0
ITC 0.3 10.0 4.9 1.1 0.5 4.7 0.6 3.0 0.2 0.2 1.6 0.4 1.0 6.8 2.5
VITO 0.0 0.0 0.0 0.0 0.0 0.0 0.0 0.0 0.0 0.0 0.0 0.0 0.0 10.2 0.7
rssP
co
rrec
t (n
um
ber
)
Acc
epta
ble
mis
mat
ch (n
um
ber
)
no
t ac
cep
tab
le m
ism
atch
(nu
mb
er)
no
t co
rrec
t (n
um
ber
)
su
m
co
rrec
t (p
erce
nta
ge)
Acc
epta
ble
mis
mat
ch (p
erce
nta
ge)
no
t ac
cep
tab
le m
ism
atch
(per
cen
tag
e)
no
t co
rrec
t (p
erce
nta
ge)
co
rrec
t an
d a
ccep
tab
le m
ism
atch
(per
cen
tag
e)
no
t ac
cep
tab
le m
ism
atch
+ n
ot
corr
ect
(per
cent
age)
ove
rco
mp
ensa
tio
n (n
um
ber
)
un
der
com
pen
sati
on
(nu
mb
er)
ove
rco
mp
ensa
tio
n (p
erce
nta
ge)
un
der
com
pen
sati
on
(per
cen
tag
e)
co
vari
ate
mis
mat
ch
EARS 9 3 0 2 14 64 21 0 14 86 14 3 2 18 7 503
FEWS NET 7 6 0 1 14 50 43 0 7 93 7 5 2 9 7 427
GeoVille 7 2 0 2 11 64 18 0 18 82 18 2 2 22 7 418
IRI 6 7 0 1 14 43 50 0 7 93 7 6 2 9 7 511
ITC 1 13 0 0 14 7 93 0 0 100 0 12 2 3 6 338
VITO 11 3 0 0 14 79 21 0 0 100 0 1 2 10 7 175
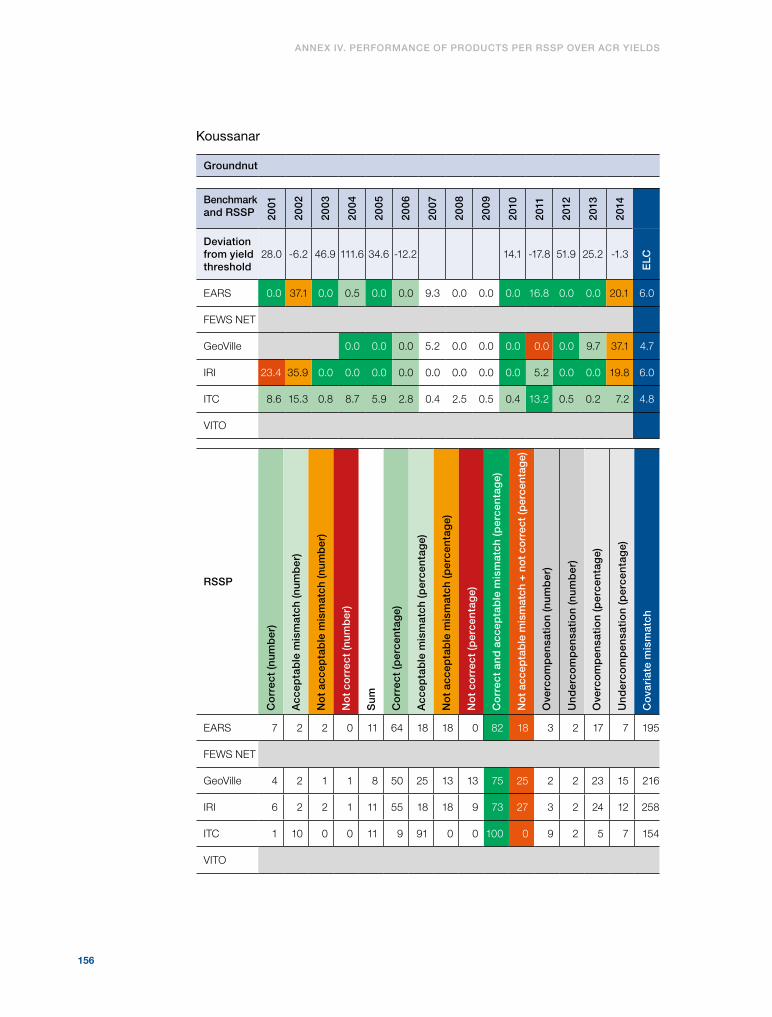
156
Annex iv. PerformAnce of Products Per rssP over Acr yields
Koussanar
groundnut
Benchmark and rssP 20
01
2002
2003
2004
2005
2006
2007
2008
2009
2010
2011
2012
2013
2014
deviation from yield threshold
28.0 -6.2 46.9 111.6 34.6 -12.2 14.1 -17.8 51.9 25.2 -1.3
elc
EARS 0.0 37.1 0.0 0.5 0.0 0.0 9.3 0.0 0.0 0.0 16.8 0.0 0.0 20.1 6.0
FEWS NET
GeoVille 0.0 0.0 0.0 5.2 0.0 0.0 0.0 0.0 0.0 9.7 37.1 4.7
IRI 23.4 35.9 0.0 0.0 0.0 0.0 0.0 0.0 0.0 0.0 5.2 0.0 0.0 19.8 6.0
ITC 8.6 15.3 0.8 8.7 5.9 2.8 0.4 2.5 0.5 0.4 13.2 0.5 0.2 7.2 4.8
VITO
rssP
co
rrec
t (n
um
ber
)
Acc
epta
ble
mis
mat
ch (n
um
ber
)
no
t ac
cep
tab
le m
ism
atch
(nu
mb
er)
no
t co
rrec
t (n
um
ber
)
su
m
co
rrec
t (p
erce
nta
ge)
Acc
epta
ble
mis
mat
ch (p
erce
nta
ge)
no
t ac
cep
tab
le m
ism
atch
(per
cen
tag
e)
no
t co
rrec
t (p
erce
nta
ge)
co
rrec
t an
d a
ccep
tab
le m
ism
atch
(per
cen
tag
e)
no
t ac
cep
tab
le m
ism
atch
+ n
ot
corr
ect
(per
cent
age)
ove
rco
mp
ensa
tio
n (n
um
ber
)
un
der
com
pen
sati
on
(nu
mb
er)
ove
rco
mp
ensa
tio
n (p
erce
nta
ge)
un
der
com
pen
sati
on
(per
cen
tag
e)
co
vari
ate
mis
mat
ch
EARS 7 2 2 0 11 64 18 18 0 82 18 3 2 17 7 195
FEWS NET
GeoVille 4 2 1 1 8 50 25 13 13 75 25 2 2 23 15 216
IRI 6 2 2 1 11 55 18 18 9 73 27 3 2 24 12 258
ITC 1 10 0 0 11 9 91 0 0 100 0 9 2 5 7 154
VITO
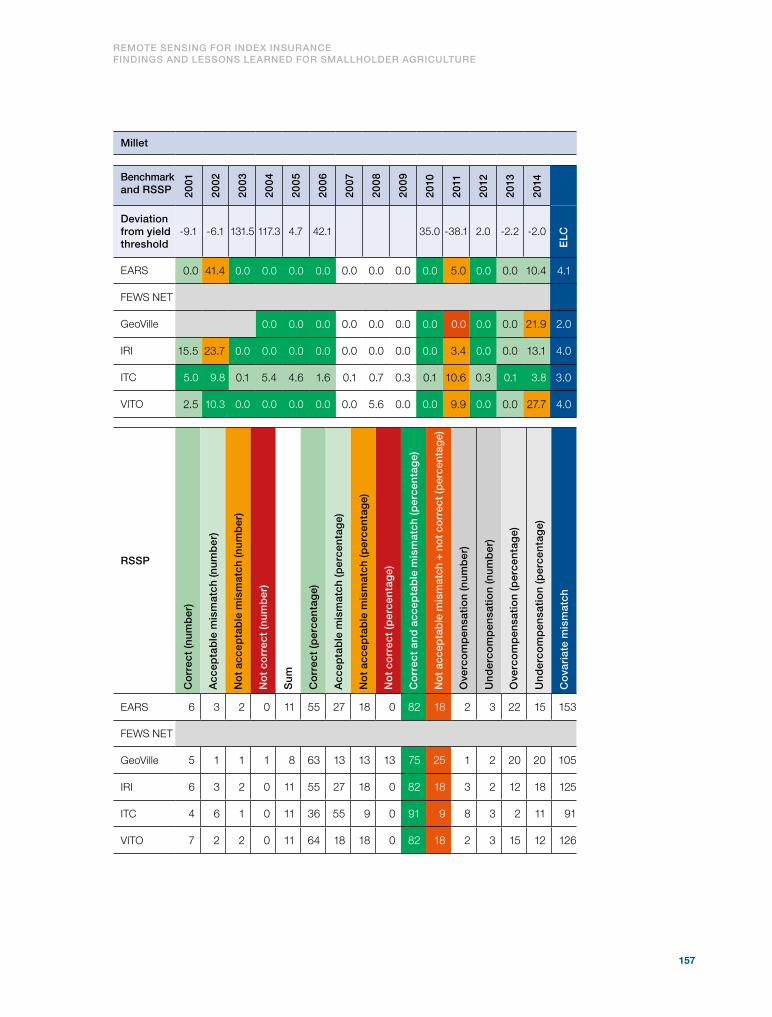
157
Remote sensing foR index insuRance findings and lessons leaRned foR smallHoldeR agRicultuRe
millet
Benchmark and rssP 20
01
2002
2003
2004
2005
2006
2007
2008
2009
2010
2011
2012
2013
2014
deviation from yield threshold
-9.1 -6.1 131.5 117.3 4.7 42.1 35.0 -38.1 2.0 -2.2 -2.0
elc
EARS 0.0 41.4 0.0 0.0 0.0 0.0 0.0 0.0 0.0 0.0 5.0 0.0 0.0 10.4 4.1
FEWS NET
GeoVille 0.0 0.0 0.0 0.0 0.0 0.0 0.0 0.0 0.0 0.0 21.9 2.0
IRI 15.5 23.7 0.0 0.0 0.0 0.0 0.0 0.0 0.0 0.0 3.4 0.0 0.0 13.1 4.0
ITC 5.0 9.8 0.1 5.4 4.6 1.6 0.1 0.7 0.3 0.1 10.6 0.3 0.1 3.8 3.0
VITO 2.5 10.3 0.0 0.0 0.0 0.0 0.0 5.6 0.0 0.0 9.9 0.0 0.0 27.7 4.0
rssP
co
rrec
t (n
um
ber
)
Acc
epta
ble
mis
mat
ch (n
um
ber
)
no
t ac
cep
tab
le m
ism
atch
(nu
mb
er)
no
t co
rrec
t (n
um
ber
)
su
m
co
rrec
t (p
erce
nta
ge)
Acc
epta
ble
mis
mat
ch (p
erce
nta
ge)
no
t ac
cep
tab
le m
ism
atch
(per
cen
tag
e)
no
t co
rrec
t (p
erce
nta
ge)
co
rrec
t an
d a
ccep
tab
le m
ism
atch
(per
cen
tag
e)
no
t ac
cep
tab
le m
ism
atch
+ n
ot
corr
ect
(per
cent
age)
ove
rco
mp
ensa
tio
n (n
um
ber
)
un
der
com
pen
sati
on
(nu
mb
er)
ove
rco
mp
ensa
tio
n (p
erce
nta
ge)
un
der
com
pen
sati
on
(per
cen
tag
e)
co
vari
ate
mis
mat
ch
EARS 6 3 2 0 11 55 27 18 0 82 18 2 3 22 15 153
FEWS NET
GeoVille 5 1 1 1 8 63 13 13 13 75 25 1 2 20 20 105
IRI 6 3 2 0 11 55 27 18 0 82 18 3 2 12 18 125
ITC 4 6 1 0 11 36 55 9 0 91 9 8 3 2 11 91
VITO 7 2 2 0 11 64 18 18 0 82 18 2 3 15 12 126
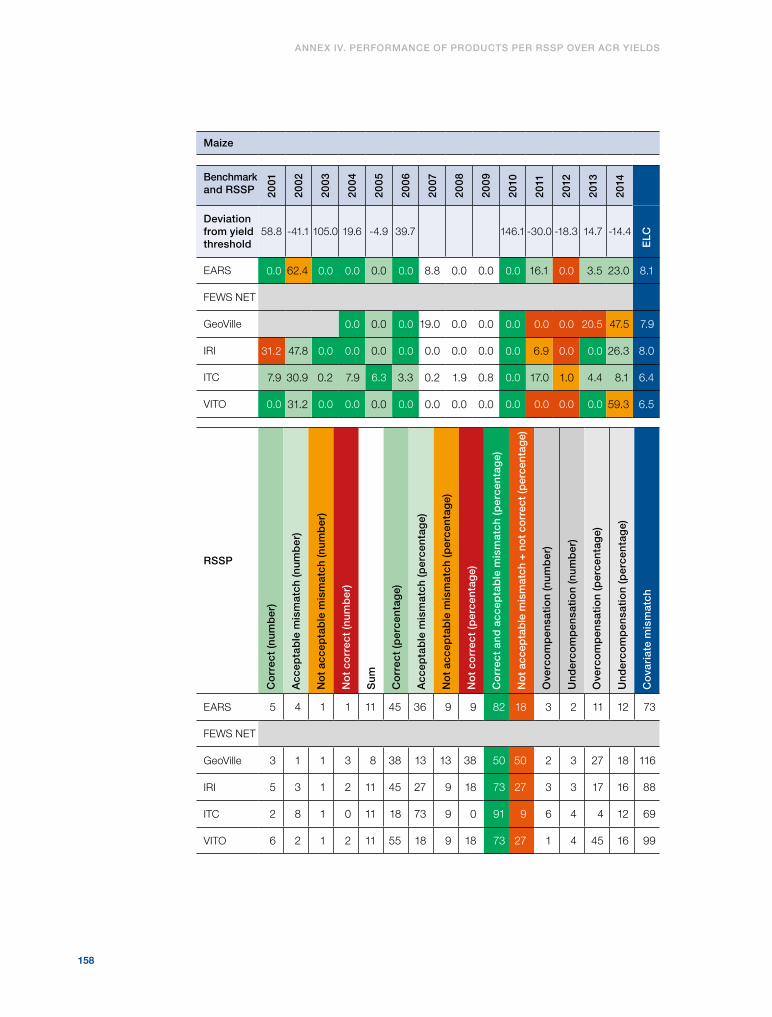
158
Annex iv. PerformAnce of Products Per rssP over Acr yields
maize
Benchmark and rssP 20
01
2002
2003
2004
2005
2006
2007
2008
2009
2010
2011
2012
2013
2014
deviation from yield threshold
58.8 -41.1 105.0 19.6 -4.9 39.7 146.1 -30.0 -18.3 14.7 -14.4
elc
EARS 0.0 62.4 0.0 0.0 0.0 0.0 8.8 0.0 0.0 0.0 16.1 0.0 3.5 23.0 8.1
FEWS NET
GeoVille 0.0 0.0 0.0 19.0 0.0 0.0 0.0 0.0 0.0 20.5 47.5 7.9
IRI 31.2 47.8 0.0 0.0 0.0 0.0 0.0 0.0 0.0 0.0 6.9 0.0 0.0 26.3 8.0
ITC 7.9 30.9 0.2 7.9 6.3 3.3 0.2 1.9 0.8 0.0 17.0 1.0 4.4 8.1 6.4
VITO 0.0 31.2 0.0 0.0 0.0 0.0 0.0 0.0 0.0 0.0 0.0 0.0 0.0 59.3 6.5
rssP
co
rrec
t (n
um
ber
)
Acc
epta
ble
mis
mat
ch (n
um
ber
)
no
t ac
cep
tab
le m
ism
atch
(nu
mb
er)
no
t co
rrec
t (n
um
ber
)
su
m
co
rrec
t (p
erce
nta
ge)
Acc
epta
ble
mis
mat
ch (p
erce
nta
ge)
no
t ac
cep
tab
le m
ism
atch
(per
cen
tag
e)
no
t co
rrec
t (p
erce
nta
ge)
co
rrec
t an
d a
ccep
tab
le m
ism
atch
(per
cen
tag
e)
no
t ac
cep
tab
le m
ism
atch
+ n
ot
corr
ect
(per
cent
age)
ove
rco
mp
ensa
tio
n (n
um
ber
)
un
der
com
pen
sati
on
(nu
mb
er)
ove
rco
mp
ensa
tio
n (p
erce
nta
ge)
un
der
com
pen
sati
on
(per
cen
tag
e)
co
vari
ate
mis
mat
ch
EARS 5 4 1 1 11 45 36 9 9 82 18 3 2 11 12 73
FEWS NET
GeoVille 3 1 1 3 8 38 13 13 38 50 50 2 3 27 18 116
IRI 5 3 1 2 11 45 27 9 18 73 27 3 3 17 16 88
ITC 2 8 1 0 11 18 73 9 0 91 9 6 4 4 12 69
VITO 6 2 1 2 11 55 18 9 18 73 27 1 4 45 16 99
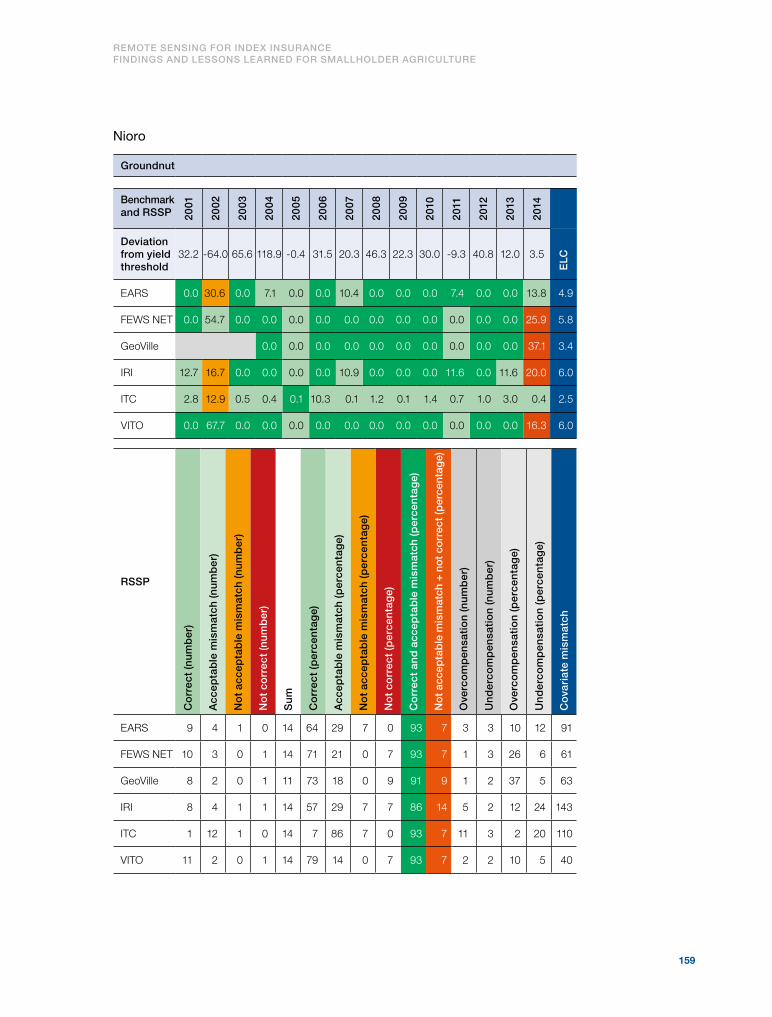
159
Remote sensing foR index insuRance findings and lessons leaRned foR smallHoldeR agRicultuRe
Nioro
groundnut
Benchmark and rssP 20
01
2002
2003
2004
2005
2006
2007
2008
2009
2010
2011
2012
2013
2014
deviation from yield threshold
32.2 -64.0 65.6 118.9 -0.4 31.5 20.3 46.3 22.3 30.0 -9.3 40.8 12.0 3.5
elc
EARS 0.0 30.6 0.0 7.1 0.0 0.0 10.4 0.0 0.0 0.0 7.4 0.0 0.0 13.8 4.9
FEWS NET 0.0 54.7 0.0 0.0 0.0 0.0 0.0 0.0 0.0 0.0 0.0 0.0 0.0 25.9 5.8
GeoVille 0.0 0.0 0.0 0.0 0.0 0.0 0.0 0.0 0.0 0.0 37.1 3.4
IRI 12.7 16.7 0.0 0.0 0.0 0.0 10.9 0.0 0.0 0.0 11.6 0.0 11.6 20.0 6.0
ITC 2.8 12.9 0.5 0.4 0.1 10.3 0.1 1.2 0.1 1.4 0.7 1.0 3.0 0.4 2.5
VITO 0.0 67.7 0.0 0.0 0.0 0.0 0.0 0.0 0.0 0.0 0.0 0.0 0.0 16.3 6.0
rssP
co
rrec
t (n
um
ber
)
Acc
epta
ble
mis
mat
ch (n
um
ber
)
no
t ac
cep
tab
le m
ism
atch
(nu
mb
er)
no
t co
rrec
t (n
um
ber
)
su
m
co
rrec
t (p
erce
nta
ge)
Acc
epta
ble
mis
mat
ch (p
erce
nta
ge)
no
t ac
cep
tab
le m
ism
atch
(per
cen
tag
e)
no
t co
rrec
t (p
erce
nta
ge)
co
rrec
t an
d a
ccep
tab
le m
ism
atch
(per
cen
tag
e)
no
t ac
cep
tab
le m
ism
atch
+ n
ot
corr
ect
(per
cent
age)
ove
rco
mp
ensa
tio
n (n
um
ber
)
un
der
com
pen
sati
on
(nu
mb
er)
ove
rco
mp
ensa
tio
n (p
erce
nta
ge)
un
der
com
pen
sati
on
(per
cen
tag
e)
co
vari
ate
mis
mat
ch
EARS 9 4 1 0 14 64 29 7 0 93 7 3 3 10 12 91
FEWS NET 10 3 0 1 14 71 21 0 7 93 7 1 3 26 6 61
GeoVille 8 2 0 1 11 73 18 0 9 91 9 1 2 37 5 63
IRI 8 4 1 1 14 57 29 7 7 86 14 5 2 12 24 143
ITC 1 12 1 0 14 7 86 7 0 93 7 11 3 2 20 110
VITO 11 2 0 1 14 79 14 0 7 93 7 2 2 10 5 40

160
Annex iv. PerformAnce of Products Per rssP over Acr yields
millet
Benchmark and rssP 20
01
2002
2003
2004
2005
2006
2007
2008
2009
2010
2011
2012
2013
2014
deviation from yield threshold
64.6 -25.7 35.5 41.5 34.1 24.6 25.8 26.3 29.9 34.8 14.9 10.9 32.0 0.7
elc
EARS 0.0 33.7 0.0 0.0 0.0 2.3 6.5 0.0 0.0 0.0 0.0 0.0 0.0 15.2 4.1
FEWS NET 0.0 39.0 0.0 0.0 0.0 0.0 0.0 0.0 0.0 0.0 0.0 0.0 0.0 15.7 3.9
GeoVille 0.0 0.0 0.0 0.0 0.0 0.0 0.0 0.0 0.0 0.0 0.0 0.0
IRI 8.5 11.2 0.0 0.0 0.0 0.0 7.3 0.0 0.0 0.0 7.8 0.0 7.8 13.4 4.0
ITC 2.1 10.2 0.3 0.3 0.1 0.0 0.0 1.0 0.1 1.1 0.4 0.7 2.0 0.3 1.3
VITO 0.0 35.6 0.0 0.0 0.0 0.0 0.0 0.0 0.0 0.0 0.0 0.0 0.0 4.8 2.9
rssP
co
rrec
t (n
um
ber
)
Acc
epta
ble
mis
mat
ch (n
um
ber
)
no
t ac
cep
tab
le m
ism
atch
(nu
mb
er)
no
t co
rrec
t (n
um
ber
)
su
m
co
rrec
t (p
erce
nta
ge)
Acc
epta
ble
mis
mat
ch (p
erce
nta
ge)
no
t ac
cep
tab
le m
ism
atch
(per
cen
tag
e)
no
t co
rrec
t (p
erce
nta
ge)
co
rrec
t an
d a
ccep
tab
le m
ism
atch
(per
cen
tag
e)
no
t ac
cep
tab
le m
ism
atch
+ n
ot
corr
ect
(per
cent
age)
ove
rco
mp
ensa
tio
n (n
um
ber
)
un
der
com
pen
sati
on
(nu
mb
er)
ove
rco
mp
ensa
tio
n (p
erce
nta
ge)
un
der
com
pen
sati
on
(per
cen
tag
e)
co
vari
ate
mis
mat
ch
EARS 10 3 0 1 14 71 21 0 7 93 7 4 0 8 0 125
FEWS NET 12 1 0 1 14 86 7 0 7 93 7 2 0 15 0 113
GeoVille 11 0 0 0 11 100 0 0 0 100 0 0 0 0 0 0
IRI 8 6 0 0 14 57 43 0 0 100 0 5 1 9 15 231
ITC 2 11 1 0 14 14 79 7 0 93 7 11 1 1 16 93
VITO 12 2 0 0 14 86 14 0 0 100 0 2 0 7 0 57

161
Remote sensing foR index insuRance findings and lessons leaRned foR smallHoldeR agRicultuRe
maize
Benchmark and rssP 20
01
2002
2003
2004
2005
2006
2007
2008
2009
2010
2011
2012
2013
2014
deviation from yield threshold
13.0 -66.8 10.4 -32.3 82.1 7.2 65.6 -6.6 46.6 220.7 13.7 -49.7 67.3 -21.1
elc
EARS 0.0 51.0 0.0 0.0 0.0 10.7 16.1 0.0 0.0 0.0 5.5 0.0 0.0 27.3 7.9
FEWS NET 0.0 50.9 0.0 0.0 0.0 0.0 16.0 0.0 3.3 0.0 0.0 0.0 0.0 35.7 7.6
GeoVille 0.0 0.0 0.0 0.0 0.0 0.0 0.0 3.8 0.0 0.0 47.4 4.7
IRI 17.0 22.3 0.0 0.0 0.0 0.0 14.6 0.0 0.0 0.0 15.5 0.0 15.5 26.7 8.0
ITC 0.5 21.1 0.9 0.1 0.2 9.2 0.1 0.6 0.1 0.6 1.0 0.8 42.8 34.1 8.0
VITO 0.0 100.0 0.0 0.0 0.0 0.0 0.0 0.0 0.0 0.0 0.0 0.0 0.0 0.0 7.1
rssP
co
rrec
t (n
um
ber
)
Acc
epta
ble
mis
mat
ch (n
um
ber
)
no
t ac
cep
tab
le m
ism
atch
(nu
mb
er)
no
t co
rrec
t (n
um
ber
)
su
m
co
rrec
t (p
erce
nta
ge)
Acc
epta
ble
mis
mat
ch (p
erce
nta
ge)
no
t ac
cep
tab
le m
ism
atch
(per
cen
tag
e)
no
t co
rrec
t (p
erce
nta
ge)
co
rrec
t an
d a
ccep
tab
le m
ism
atch
(per
cen
tag
e)
no
t ac
cep
tab
le m
ism
atch
+ n
ot
corr
ect
(per
cent
age)
ove
rco
mp
ensa
tio
n (n
um
ber
)
un
der
com
pen
sati
on
(nu
mb
er)
ove
rco
mp
ensa
tio
n (p
erce
nta
ge)
un
der
com
pen
sati
on
(per
cen
tag
e)
co
vari
ate
mis
mat
ch
EARS 6 4 1 3 14 43 29 7 21 71 29 4 4 10 26 81
FEWS NET 7 3 1 3 14 50 21 7 21 71 29 3 4 11 26 78
GeoVille 6 2 1 2 11 55 18 9 18 73 27 2 3 15 30 67
IRI 5 2 1 5 13 38 15 8 38 54 46 5 4 14 33 114
ITC 0 10 3 1 14 0 71 21 7 71 29 10 4 7 33 114
VITO 9 1 1 3 14 64 7 7 21 71 29 1 4 33 27 81

162
Annex iv. PerformAnce of Products Per rssP over Acr yields
Base structurestable A-6. overview of performance of base structures per rssP over acr yields
green If correct or mismatch within 5 percentage points
light green If mismatch between 5 and 15 percentage points
Pink If mismatch above 15 percentage points
red If not correct and mismatch above 15 percentage points (if not correct but with small mismatch in light green class)
white Unable to classify score as correct/not correct due to lack of necessary yield reference
grey No data

163
Remote sensing foR index insuRance findings and lessons leaRned foR smallHoldeR agRicultuRe
Diourbel
groundnut
Benchmark and rssP 20
01
2002
2003
2004
2005
2006
2007
2008
2009
2010
2011
2012
2013
2014
deviation from yield threshold
56.2 39.9 22.7 78.5 15.5 8.6 -1.0 26.3 28.6 -12.7 21.5 71.9 -19.5 13.5
elc
EARS 0.0 65.0 0.0 31.5 0.0 20.5 52.4 0.0 0.0 0.0 14.7 0.0 0.0 68.7 18.0
FEWS NET 5.1 0.0 0.0 18.6 0.0 0.0 0.0 0.0 0.0 0.0 0.0 0.0 0.0 27.3 3.6
GeoVille 0.0 0.0 0.0 37.1 0.0 0.0 0.0 0.0 0.0 0.0 0.0 3.4
IRI 0.0 61.0 0.0 15.0 0.0 0.0 35.0 0.0 0.0 0.0 23.0 0.0 0.0 93.0 16.2
ITC 0.4 13.4 7.2 2.3 0.8 6.9 1.1 4.4 0.3 0.2 2.5 0.4 1.7 10.4 3.7
VITO 0.0 0.0 0.0 0.0 0.0 0.0 0.0 0.0 0.0 0.0 0.0 2.3 0.0 0.0 0.2
rssP
co
rrec
t (n
um
ber
)
Acc
epta
ble
mis
mat
ch (n
um
ber
)
no
t ac
cep
tab
le m
ism
atch
(nu
mb
er)
no
t co
rrec
t (n
um
ber
)
su
m
co
rrec
t (p
erce
nta
ge)
Acc
epta
ble
mis
mat
ch (p
erce
nta
ge)
no
t ac
cep
tab
le m
ism
atch
(per
cen
tag
e)
no
t co
rrec
t (p
erce
nta
ge)
co
rrec
t an
d a
ccep
tab
le m
ism
atch
(per
cen
tag
e)
no
t ac
cep
tab
le m
ism
atch
+ n
ot
corr
ect
(per
cent
age)
ove
rco
mp
ensa
tio
n (n
um
ber
)
un
der
com
pen
sati
on
(nu
mb
er)
ove
rco
mp
ensa
tio
n (p
erce
nta
ge)
un
der
com
pen
sati
on
(per
cen
tag
e)
co
vari
ate
mis
mat
ch
EARS 6 2 1 5 14 43 14 7 36 57 43 6 2 42 16 853
FEWS NET 8 3 0 3 14 57 21 0 21 79 21 3 3 17 11 253
GeoVille 8 1 1 1 11 73 9 9 9 82 18 1 2 36 16 205
IRI 7 1 1 5 14 50 7 7 36 57 43 5 2 45 16 777
ITC 1 12 1 0 14 7 86 7 0 93 7 12 2 4 15 239
VITO 10 3 0 1 14 71 21 0 7 93 7 1 3 2 11 107

164
Annex iv. PerformAnce of Products Per rssP over Acr yields
millet
Benchmark and rssP 20
01
2002
2003
2004
2005
2006
2007
2008
2009
2010
2011
2012
2013
2014
deviation from yield threshold
52.8 28.6 52.2 51.5 38.2 17.2 15.8 35.9 23.1 17.0 10.4 -4.0 -9.6 21.0
elc
EARS 0.0 73.4 0.0 13.3 0.0 39.3 55.7 0.0 0.0 0.0 22.9 0.0 0.0 66.9 19.4
FEWS NET 10.2 3.3 0.0 5.1 0.0 0.0 3.6 0.0 0.0 0.0 0.0 0.0 0.0 22.4 3.2
GeoVille 0.0 0.0 0.0 21.5 0.0 0.0 0.0 0.0 0.0 0.0 21.9 3.9
IRI 0.0 61.0 0.0 15.0 0.0 0.0 35.0 0.0 0.0 0.0 23.0 0.0 0.0 93.0 16.2
ITC 0.3 10.0 4.9 1.1 0.5 4.7 0.6 3.0 0.2 0.2 1.6 0.4 1.0 6.8 2.5
VITO 0.0 0.0 0.0 0.0 0.0 0.0 0.0 0.0 0.0 0.0 0.0 0.0 0.0 10.2 0.7
rssP
co
rrec
t (n
um
ber
)
Acc
epta
ble
mis
mat
ch (n
um
ber
)
no
t ac
cep
tab
le m
ism
atch
(nu
mb
er)
no
t co
rrec
t (n
um
ber
)
su
m
co
rrec
t (p
erce
nta
ge)
Acc
epta
ble
mis
mat
ch (p
erce
nta
ge)
no
t ac
cep
tab
le m
ism
atch
(per
cen
tag
e)
no
t co
rrec
t (p
erce
nta
ge)
co
rrec
t an
d a
ccep
tab
le m
ism
atch
(per
cen
tag
e)
no
t ac
cep
tab
le m
ism
atch
+ n
ot
corr
ect
(per
cent
age)
ove
rco
mp
ensa
tio
n (n
um
ber
)
un
der
com
pen
sati
on
(nu
mb
er)
ove
rco
mp
ensa
tio
n (p
erce
nta
ge)
un
der
com
pen
sati
on
(per
cen
tag
e)
co
vari
ate
mis
mat
ch
EARS 6 3 0 5 14 43 21 0 36 64 36 6 2 45 7 2088
FEWS NET 7 6 0 1 14 50 43 0 7 93 7 5 2 9 7 427
GeoVille 7 2 0 2 11 64 18 0 18 82 18 2 2 22 7 418
IRI 7 2 0 5 14 50 14 0 36 64 36 5 2 45 7 1763
ITC 1 13 0 0 14 7 93 0 0 100 0 12 2 3 6 338
VITO 11 3 0 0 14 79 21 0 0 100 0 1 2 10 7 175

165
Remote sensing foR index insuRance findings and lessons leaRned foR smallHoldeR agRicultuRe
Koussanar
groundnut
Benchmark and rssP 20
01
2002
2003
2004
2005
2006
2007
2008
2009
2010
2011
2012
2013
2014
deviation from yield threshold
28.0 -6.2 46.9 111.6 34.6 -12.2 14.1 -17.8 51.9 25.2 -1.3
elc
EARS 0.0 39.1 0.0 2.5 0.0 0.0 11.3 0.0 0.0 0.0 18.8 0.0 0.0 22.1 6.7
FEWS NET
GeoVille 0.0 0.0 0.0 5.2 0.0 0.0 0.0 0.0 0.0 9.7 37.1 4.7
IRI 100.0100.0 0.0 0.0 0.0 0.0 0.0 0.0 4.0 0.0 46.0 10.0 0.0 86.0 24.7
ITC 8.6 15.3 0.8 8.7 5.9 2.8 0.4 2.5 0.5 0.4 13.2 0.5 0.2 7.2 4.8
VITO
rssP
co
rrec
t (n
um
ber
)
Acc
epta
ble
mis
mat
ch (n
um
ber
)
no
t ac
cep
tab
le m
ism
atch
(nu
mb
er)
no
t co
rrec
t (n
um
ber
)
su
m
co
rrec
t (p
erce
nta
ge)
Acc
epta
ble
mis
mat
ch (p
erce
nta
ge)
no
t ac
cep
tab
le m
ism
atch
(per
cen
tag
e)
no
t co
rrec
t (p
erce
nta
ge)
co
rrec
t an
d a
ccep
tab
le m
ism
atch
(per
cen
tag
e)
no
t ac
cep
tab
le m
ism
atch
+ n
ot
corr
ect
(per
cent
age)
ove
rco
mp
ensa
tio
n (n
um
ber
)
un
der
com
pen
sati
on
(nu
mb
er)
ove
rco
mp
ensa
tio
n (p
erce
nta
ge)
un
der
com
pen
sati
on
(per
cen
tag
e)
co
vari
ate
mis
mat
ch
EARS 7 2 2 0 11 64 18 18 0 82 18 4 1 14 12 217
FEWS NET
GeoVille 4 2 1 1 8 50 25 13 13 75 25 2 2 23 15 216
IRI 5 2 3 1 11 45 18 27 9 64 36 5 1 63 12 892
ITC 1 10 0 0 11 9 91 0 0 100 0 9 2 5 7 154
VITO

166
Annex iv. PerformAnce of Products Per rssP over Acr yields
millet
Benchmark and rssP 20
01
2002
2003
2004
2005
2006
2007
2008
2009
2010
2011
2012
2013
2014
deviation from yield threshold
-9.1 -6.1 131.5 117.3 4.7 42.1 35.0 -38.1 2.0 -2.2 -2.0
elc
EARS 0.0 51.4 0.0 0.0 0.0 0.0 9.3 0.0 0.0 0.0 15.0 0.0 5.1 20.4 7.2
FEWS NET
GeoVille 0.0 0.0 0.0 0.0 0.0 0.0 0.0 0.0 0.0 0.0 21.9 2.0
IRI 100.0100.0 0.0 0.0 0.0 0.0 0.0 0.0 4.0 0.0 46.0 10.0 0.0 86.0 24.7
ITC 5.0 9.8 0.1 5.4 4.6 1.6 0.1 0.7 0.3 0.1 10.6 0.3 0.1 3.8 3.0
VITO 5.1 21.1 0.0 0.0 0.0 0.0 0.0 11.4 0.0 0.0 20.2 0.0 0.0 56.8 8.2
rssP
co
rrec
t (n
um
ber
)
Acc
epta
ble
mis
mat
ch (n
um
ber
)
no
t ac
cep
tab
le m
ism
atch
(nu
mb
er)
no
t co
rrec
t (n
um
ber
)
su
m
co
rrec
t (p
erce
nta
ge)
Acc
epta
ble
mis
mat
ch (p
erce
nta
ge)
no
t ac
cep
tab
le m
ism
atch
(per
cen
tag
e)
no
t co
rrec
t (p
erce
nta
ge)
co
rrec
t an
d a
ccep
tab
le m
ism
atch
(per
cen
tag
e)
no
t ac
cep
tab
le m
ism
atch
+ n
ot
corr
ect
(per
cent
age)
ove
rco
mp
ensa
tio
n (n
um
ber
)
un
der
com
pen
sati
on
(nu
mb
er)
ove
rco
mp
ensa
tio
n (p
erce
nta
ge)
un
der
com
pen
sati
on
(per
cen
tag
e)
co
vari
ate
mis
mat
ch
EARS 7 1 3 0 11 64 9 27 0 73 27 3 2 22 16 188
FEWS NET
GeoVille 5 1 1 1 8 63 13 13 13 75 25 1 2 20 20 105
IRI 5 3 3 0 11 45 27 27 0 73 27 5 1 57 2 509
ITC 4 6 1 0 11 36 55 9 0 91 9 8 3 2 11 91
VITO 7 1 3 0 11 64 9 27 0 73 27 2 3 35 8 183

167
Remote sensing foR index insuRance findings and lessons leaRned foR smallHoldeR agRicultuRe
maize
Benchmark and rssP 20
01
2002
2003
2004
2005
2006
2007
2008
2009
2010
2011
2012
2013
2014
deviation from yield threshold
58.8 -41.1 105.0 19.6 -4.9 39.7 146.1 -30.0 -18.3 14.7 -14.4
elc
EARS 0.0 65.4 0.0 0.0 0.0 0.0 11.8 0.0 0.0 0.0 19.1 0.0 6.5 26.0 9.2
FEWS NET
GeoVille 0.0 0.0 0.0 19.0 0.0 0.0 0.0 0.0 0.0 20.5 47.5 7.9
IRI 100.0100.0 0.0 0.0 0.0 0.0 0.0 0.0 4.0 0.0 46.0 10.0 0.0 86.0 24.7
ITC 7.9 30.9 0.2 7.9 6.3 3.3 0.2 1.9 0.8 0.0 17.0 1.0 4.4 8.1 6.4
VITO 0.0 31.2 0.0 0.0 0.0 0.0 0.0 0.0 0.0 0.0 0.0 0.0 0.0 59.3 6.5
rssP
co
rrec
t (n
um
ber
)
Acc
epta
ble
mis
mat
ch (n
um
ber
)
no
t ac
cep
tab
le m
ism
atch
(nu
mb
er)
no
t co
rrec
t (n
um
ber
)
su
m
co
rrec
t (p
erce
nta
ge)
Acc
epta
ble
mis
mat
ch (p
erce
nta
ge)
no
t ac
cep
tab
le m
ism
atch
(per
cen
tag
e)
no
t co
rrec
t (p
erce
nta
ge)
co
rrec
t an
d a
ccep
tab
le m
ism
atch
(per
cen
tag
e)
no
t ac
cep
tab
le m
ism
atch
+ n
ot
corr
ect
(per
cent
age)
ove
rco
mp
ensa
tio
n (n
um
ber
)
un
der
com
pen
sati
on
(nu
mb
er)
ove
rco
mp
ensa
tio
n (p
erce
nta
ge)
un
der
com
pen
sati
on
(per
cen
tag
e)
co
vari
ate
mis
mat
ch
EARS 5 4 1 1 11 45 36 9 9 82 18 3 2 14 11 81
FEWS NET
GeoVille 3 1 1 3 8 38 13 13 38 50 50 2 3 27 18 116
IRI 5 2 3 1 11 45 18 27 9 64 36 4 2 62 7 242
ITC 2 8 1 0 11 18 73 9 0 91 9 6 4 4 12 69
VITO 6 2 1 2 11 55 18 9 18 73 27 1 4 45 16 99

168
Annex iv. PerformAnce of Products Per rssP over Acr yields
Nioro
groundnut
Benchmark and rssP 20
01
2002
2003
2004
2005
2006
2007
2008
2009
2010
2011
2012
2013
2014
deviation from yield threshold
32.2 -64.0 65.6 118.9 -0.4 31.5 20.3 46.3 22.3 30.0 -9.3 40.8 12.0 3.5
elc
EARS 0.0 30.6 0.0 7.1 0.0 0.0 10.4 0.0 0.0 0.0 7.4 0.0 0.0 13.8 4.9
FEWS NET 0.0 61.1 0.0 0.0 0.0 0.0 8.4 0.0 11.4 0.0 0.0 0.0 0.0 36.4 8.4
GeoVille 0.0 0.0 0.0 0.0 0.0 0.0 0.0 0.0 0.0 0.0 37.1 3.4
IRI 73.0 48.0 0.0 18.0 0.0 0.0 53.0 0.0 0.0 0.0 36.0 0.0 21.0 82.0 23.6
ITC 2.8 12.9 0.5 0.4 0.1 10.3 0.1 1.2 0.1 1.4 0.7 1.0 3.0 0.4 2.5
VITO 0.0 74.8 0.0 0.0 0.0 0.0 0.0 0.0 0.0 0.0 0.0 0.0 0.0 34.8 7.8
rssP
co
rrec
t (n
um
ber
)
Acc
epta
ble
mis
mat
ch (n
um
ber
)
no
t ac
cep
tab
le m
ism
atch
(nu
mb
er)
no
t co
rrec
t (n
um
ber
)
su
m
co
rrec
t (p
erce
nta
ge)
Acc
epta
ble
mis
mat
ch (p
erce
nta
ge)
no
t ac
cep
tab
le m
ism
atch
(per
cen
tag
e)
no
t co
rrec
t (p
erce
nta
ge)
co
rrec
t an
d a
ccep
tab
le m
ism
atch
(per
cen
tag
e)
no
t ac
cep
tab
le m
ism
atch
+ n
ot
corr
ect
(per
cent
age)
ove
rco
mp
ensa
tio
n (n
um
ber
)
un
der
com
pen
sati
on
(nu
mb
er)
ove
rco
mp
ensa
tio
n (p
erce
nta
ge)
un
der
com
pen
sati
on
(per
cen
tag
e)
co
vari
ate
mis
mat
ch
EARS 9 4 1 0 14 64 29 7 0 93 7 3 3 10 12 91
FEWS NET 9 4 0 1 14 64 29 0 7 93 7 3 3 19 4 93
GeoVille 8 2 0 1 11 73 18 0 9 91 9 1 2 37 5 63
IRI 6 1 2 5 14 43 7 14 36 50 50 6 2 46 8 394
ITC 1 12 1 0 14 7 86 7 0 93 7 11 3 2 20 110
VITO 10 3 0 1 14 71 21 0 7 93 7 2 2 23 5 75

169
Remote sensing foR index insuRance findings and lessons leaRned foR smallHoldeR agRicultuRe
millet
Benchmark and rssP 20
01
2002
2003
2004
2005
2006
2007
2008
2009
2010
2011
2012
2013
2014
deviation from yield threshold
64.6 -25.7 35.5 41.5 34.1 24.6 25.8 26.3 29.9 34.8 14.9 10.9 32.0 0.7
elc
EARS 0.0 39.7 0.0 0.0 0.0 8.3 12.5 0.0 0.0 0.0 4.3 0.0 0.0 21.2 6.1
FEWS NET 0.0 41.0 0.0 0.0 0.0 0.0 1.0 0.0 2.4 0.0 0.0 0.0 0.0 18.4 4.5
GeoVille 0.0 0.0 0.0 0.0 0.0 0.0 0.0 0.0 0.0 0.0 0.0 0.0
IRI 73.0 48.0 0.0 18.0 0.0 0.0 53.0 0.0 0.0 0.0 36.0 0.0 21.0 82.0 23.6
ITC 2.1 10.2 0.3 0.3 0.1 0.0 0.0 1.0 0.1 1.1 0.4 0.7 2.0 0.3 1.3
VITO 0.0 35.6 0.0 0.0 0.0 0.0 0.0 0.0 0.0 0.0 0.0 0.0 0.0 4.8 2.9
rssP
co
rrec
t (n
um
ber
)
Acc
epta
ble
mis
mat
ch (n
um
ber
)
no
t ac
cep
tab
le m
ism
atch
(nu
mb
er)
no
t co
rrec
t (n
um
ber
)
su
m
co
rrec
t (p
erce
nta
ge)
Acc
epta
ble
mis
mat
ch (p
erce
nta
ge)
no
t ac
cep
tab
le m
ism
atch
(per
cen
tag
e)
no
t co
rrec
t (p
erce
nta
ge)
co
rrec
t an
d a
ccep
tab
le m
ism
atch
(per
cen
tag
e)
no
t ac
cep
tab
le m
ism
atch
+ n
ot
corr
ect
(per
cent
age)
ove
rco
mp
ensa
tio
n (n
um
ber
)
un
der
com
pen
sati
on
(nu
mb
er)
ove
rco
mp
ensa
tio
n (p
erce
nta
ge)
un
der
com
pen
sati
on
(per
cen
tag
e)
co
vari
ate
mis
mat
ch
EARS 9 4 0 1 14 64 29 0 7 93 7 5 0 12 0 235
FEWS NET 10 2 1 1 14 71 14 7 7 86 14 4 0 9 0 145
GeoVille 11 0 0 0 11 100 0 0 0 100 0 0 0 0 0 0
IRI 7 0 1 6 14 50 0 7 43 50 50 7 0 44 0 1190
ITC 2 11 1 0 14 14 79 7 0 93 7 11 1 1 16 93
VITO 12 2 0 0 14 86 14 0 0 100 0 2 0 7 0 57
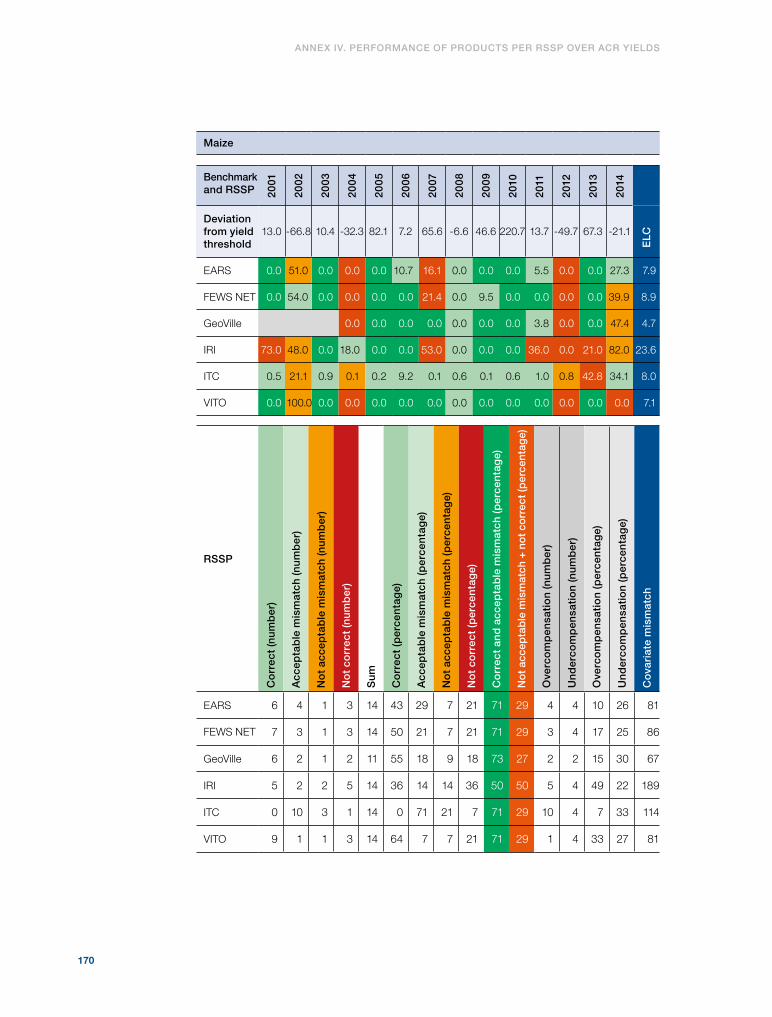
170
Annex iv. PerformAnce of Products Per rssP over Acr yields
maize
Benchmark and rssP 20
01
2002
2003
2004
2005
2006
2007
2008
2009
2010
2011
2012
2013
2014
deviation from yield threshold
13.0 -66.8 10.4 -32.3 82.1 7.2 65.6 -6.6 46.6 220.7 13.7 -49.7 67.3 -21.1
elc
EARS 0.0 51.0 0.0 0.0 0.0 10.7 16.1 0.0 0.0 0.0 5.5 0.0 0.0 27.3 7.9
FEWS NET 0.0 54.0 0.0 0.0 0.0 0.0 21.4 0.0 9.5 0.0 0.0 0.0 0.0 39.9 8.9
GeoVille 0.0 0.0 0.0 0.0 0.0 0.0 0.0 3.8 0.0 0.0 47.4 4.7
IRI 73.0 48.0 0.0 18.0 0.0 0.0 53.0 0.0 0.0 0.0 36.0 0.0 21.0 82.0 23.6
ITC 0.5 21.1 0.9 0.1 0.2 9.2 0.1 0.6 0.1 0.6 1.0 0.8 42.8 34.1 8.0
VITO 0.0 100.0 0.0 0.0 0.0 0.0 0.0 0.0 0.0 0.0 0.0 0.0 0.0 0.0 7.1
rssP
co
rrec
t (n
um
ber
)
Acc
epta
ble
mis
mat
ch (n
um
ber
)
no
t ac
cep
tab
le m
ism
atch
(nu
mb
er)
no
t co
rrec
t (n
um
ber
)
su
m
co
rrec
t (p
erce
nta
ge)
Acc
epta
ble
mis
mat
ch (p
erce
nta
ge)
no
t ac
cep
tab
le m
ism
atch
(per
cen
tag
e)
no
t co
rrec
t (p
erce
nta
ge)
co
rrec
t an
d a
ccep
tab
le m
ism
atch
(per
cen
tag
e)
no
t ac
cep
tab
le m
ism
atch
+ n
ot
corr
ect
(per
cent
age)
ove
rco
mp
ensa
tio
n (n
um
ber
)
un
der
com
pen
sati
on
(nu
mb
er)
ove
rco
mp
ensa
tio
n (p
erce
nta
ge)
un
der
com
pen
sati
on
(per
cen
tag
e)
co
vari
ate
mis
mat
ch
EARS 6 4 1 3 14 43 29 7 21 71 29 4 4 10 26 81
FEWS NET 7 3 1 3 14 50 21 7 21 71 29 3 4 17 25 86
GeoVille 6 2 1 2 11 55 18 9 18 73 27 2 2 15 30 67
IRI 5 2 2 5 14 36 14 14 36 50 50 5 4 49 22 189
ITC 0 10 3 1 14 0 71 21 7 71 29 10 4 7 33 114
VITO 9 1 1 3 14 64 7 7 21 71 29 1 4 33 27 81

171
Remote sensing foR index insuRance findings and lessons leaRned foR smallHoldeR agRicultuRe
ANNEX V
Findings of the SAR mapping
SAR mappingTemporal descriptors were derived (see Chapter 7) from Cosmo-SkyMed HH data
acquired for the different ROIs during the 2013 season with an interval of eight
days.36 The advantage in these images is the fine spatial resolution of 3 m. Cultivated
area maps were generated by applying knowledge-based classifiers to these temporal
descriptors. No a priori information on crop types, practices or surrounding land
cover was used.
Figure A-6 illustrates the SAR temporal descriptors (left) and the corresponding
seasonal cultivated area maps (middle and right) for Nioro. The different blue tones
of the map on the left may relate either to different crop types or to growth stages.
However, this could not be verified due to the lack of appropriate ground data, so no
crop type maps could be generated.
figure A-6. results for nioro
Colour composite of selected temporal descriptors (red corresponds to minimum, green to maximum, blue to span) (left); cultivated area map (cultivated area is coloured yellow, orange and green) (middle); detail of cultivated area map (black dots correspond to single trees and settlements; fields used for validation are coloured pink (right)).
The overall accuracy of the cultivated area maps was checked with field observations
collected specifically for the project. The accuracy was high (87-97 per cent), but it
should be mentioned that the field dataset was rather limited for this exercise and
contained mainly reference data for agricultural land with few reference points for
bare soil or shrubland.
36 A radar system using horizontal (H) and vertical (V) linear polarizations can have the following channels: HH – for horizontal transmit and horizontal receive, VV – for vertical transmit and vertical receive, HV – for horizontal transmit and vertical receive; VH – for vertical transmit and horizontal receive.

172
In 2014, temporal descriptors were also derived from Cosmo-SkyMed data but
with different operation modes (single HH or dual HV polarizations). The spatial
resolution was thereby reduced from 3 m to 15 m.
Figure A-7 compares the cultivated area maps for Koussanar for 2013 at 3 m
resolution (left) and 2014 at 15 m resolution (right). The impact of degrading the
resolution from 3 m to 15 m is limited.
figure A-7. cultivated area map for koussanar
2013 at 3 m resolution (left); and 2014 at 15 m resolution (right)
Dynamics between subsequent acquisitions are picked up much better and faster
by HV images than by HH images. This is illustrated in Figure A-7 for Koussanar.
HV also seems to be better suited for detecting the start of the season in this agro-
ecological zone.
figure A-8. maximum gradient for cosmo-skymed
HH (left) and HV (right): dark red = 0 dB, light red = +3 dB, yellow = +5 dB, light green = +8 dB, blue = >10 dB
Annex v. findings of the sAr mAPPing
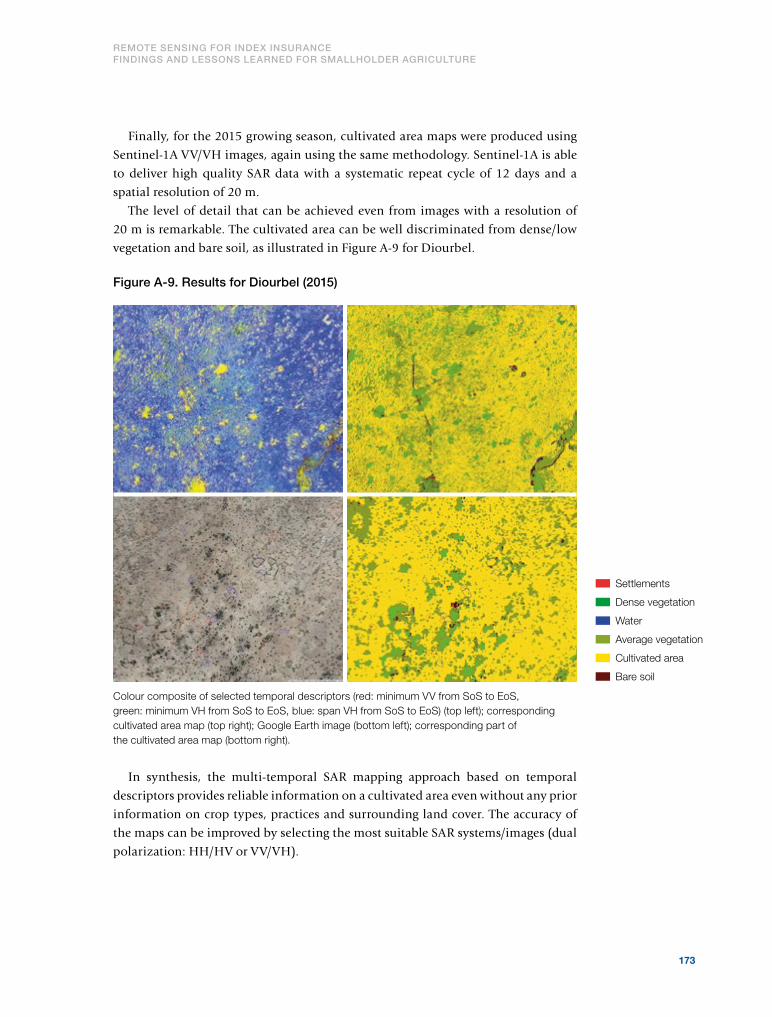
173
Remote sensing foR index insuRance findings and lessons leaRned foR smallHoldeR agRicultuRe
Finally, for the 2015 growing season, cultivated area maps were produced using
Sentinel-1A VV/VH images, again using the same methodology. Sentinel-1A is able
to deliver high quality SAR data with a systematic repeat cycle of 12 days and a
spatial resolution of 20 m.
The level of detail that can be achieved even from images with a resolution of
20 m is remarkable. The cultivated area can be well discriminated from dense/low
vegetation and bare soil, as illustrated in Figure A-9 for Diourbel.
figure A-9. results for diourbel (2015)
Colour composite of selected temporal descriptors (red: minimum VV from SoS to EoS, green: minimum VH from SoS to EoS, blue: span VH from SoS to EoS) (top left); corresponding cultivated area map (top right); Google Earth image (bottom left); corresponding part of the cultivated area map (bottom right).
In synthesis, the multi-temporal SAR mapping approach based on temporal
descriptors provides reliable information on a cultivated area even without any prior
information on crop types, practices and surrounding land cover. The accuracy of
the maps can be improved by selecting the most suitable SAR systems/images (dual
polarization: HH/HV or VV/VH).
Settlements
Dense vegetation
Water
Average vegetation
Cultivated area
Bare soil
174
Annex v. findings of the sAr mAPPing
The use of high resolution optical data (i.e., Sentinel-1A, 10-20m resolution)
was not considered since it was not available at the time. The next step could be
to integrate it, bearing in mind that cloud cover severely affects the data (mainly
during the first part of the crop season).
Finally, it is essential to point out that crop(land) mapping should always be
linked to ground information, in order to obtain a deeper understanding of the data
and therefore to better fine tune the algorithms. Unfortunately, for the purposes
of this project, the available field data were scarce or late. Thus, there is still a clear
margin for improvement.
Integration of maps and insurance productsThe actual integration of the SAR-based maps with the insurance products was not
addressed in this project. The primary problem is that, for the development of crop-
specific insurance structures, updated crop-type maps are needed annually as crop
types change, but such maps were not available for past years. The SAR-based maps
generated in the framework of this project only covered the 2013-2015 growing
seasons, and only the cultivated areas could be identified from these maps (and not
the crop types that were grown in specific fields in these seasons).
However, some of the RSSPs integrated, to a certain extent, cropland or crop-type
information into their insurance products by focusing the development and later
analysis on cultivated areas (VITO, FEWS NET) or specifically on areas growing
groundnut, millet and maize (ITC) that are identified from analysis of historical
time series of satellite images.

contact information
ifAd
Francesco Rispoli Email: [email protected]
www.ifad.org/topic/wrmf/overview
wfP
Fabio Bedini Email: [email protected]
Mathieu Dubreuil Email: [email protected]
Gernot Laganda Email: [email protected]
www.wfp.org/climate-change/initiatives/weather-risk-management-facility


International Fund for Agricultural Development
Via Paolo di Dono, 44 - 00142 Rome, ItalyTel: +39 06 54591 - Fax: +39 06 5043463Email: [email protected]
ifad-un.blogspot.com
www.facebook.com/ifad
instagram.com/ifadnews
www.twitter.com/ifadnews
www.youtube.com/user/ifadTV
World Food Programme
Via C.G. Viola, 68 Parco dei Medici 00148 Rome, Italy Tel: +39 06 65131 Fax: +39 06 6590632 www.wfp.org