remote monitoring and diagnostics for power generation gas
TRANSCRIPT

Remote Monitoring and Diagnostics
for Power Generation Gas Turbines
Charlie Nicol and Jon Aylett
Diagnostic Systems, Turbine Services Limited
Venture Building, Kelvin Campus
West of Scotland Science Park
Glasgow, G20 0SP, UK
Tel: +44 (0) 141 945 7000
mailto:[email protected]
http://www.tsltd.uk.com/proconditionmonitoring.html
skype:charlie_nicol?call
CHROMALLOY : POWER-GEN International 2010, Booth 3701

Remote Monitoring and Diagnostics for Power Generation Gas Turbines
Page 2
Abstract
Remote monitoring and diagnostics for power generation gas turbines requires collecting,
analysing and distributing information about the turbine. The information may be in raw form
or may have been analysed by monitoring and diagnostic software before it reaches staff.
Staff need certain skill levels dependent on what support there is from diagnostic software
analysis. The experience of monitoring power generation turbines remotely over many years
allows us to detail required software capabilities, staffing structures and reporting
mechanisms along with reasons why we choose these.
Some problems are identified early leading to scheduled outages whilst other problems lead
to turbine trips that need to be investigated after the event. Communication with the site is
very important as some fault conditions cannot be determined by the sensor input available.
Various problems will accrue over time and mechanisms need to be in place to track these.
Knowing the outstanding problems allows for efficient scheduling for repairs during either
planned or unplanned outages. Awareness of the operating condition of the turbine and
reacting to this as necessary is important for increasing availability and reliability.

Remote Monitoring and Diagnostics for Power Generation Gas Turbines
Page 3
Contents
Abstract ......................................................................................................................................2
1. Introduction .............................................................................................................................4
2. Skill Sets Needed ....................................................................................................................4
3. Infrastructure for Handling Turbine Data .................................................................................5
3.1 Collecting Data On-Site .....................................................................................................5
3.2 Storing Data .......................................................................................................................6
3.3 Distributing Data ...............................................................................................................7
4. Diagnostics .............................................................................................................................8
5. Monitoring Activities ............................................................................................................ 10
5.1 Frequency Based Checking .............................................................................................. 10
5.2 Event based checking ....................................................................................................... 11
5.3 Reporting back to site ...................................................................................................... 12
6. Examples .............................................................................................................................. 13
7. Conclusion ............................................................................................................................ 13
Appendix 1. Example - Frame 5 Status Summary ..................................................................... 14
Appendix 2. Example – Frame 5 Tiger Incident Report ............................................................. 18
Appendix 3. Example – Frame 6 Daily Automated Report Sample Pages .................................. 20

Remote Monitoring and Diagnostics for Power Generation Gas Turbines
Page 4
1. Introduction Remote monitoring and diagnostics for power generation gas turbines requires:
• collecting data from the gas turbine
• information technology infrastructure to make this data available remotely
• a means of processing this data to identify incidents and faults
• reporting mechanisms back to site
The processing of the data to identify incidents and faults can be done manually or computer
software can be used to assist in the process. Where skilled manpower resources are in short
supply we would like to have as much assistance from computer software as possible for this
identification.
The filtering of large quantities of data for significant events by the monitoring and
diagnostics software produces a spectrum of diagnostics from the detection that something is
abnormal through to the complete diagnosis of a fault.
Identifying the details of the faults that require repair is a mixture of using the diagnostics
provided by the monitoring and diagnostics system, using data exploration tools to get more
information and in some cases examining the turbine itself. Various support tools are needed
to ensure proper exploration of conclusions such as graphing and diagnostic message
management. The ease of use of these tools is one of the key aspects to providing a successful
monitoring and diagnostic system.
Organisations have a hierarchy of expertise and specialism within them. Depending on the
core role of the organization, they may resort to third party help in resolving problems.
Information flow within and out with the organisation is key to applying manpower resources
effectively.
Various problems will accrue over time and mechanisms need to be in place to track these.
Knowing the outstanding problems allows for efficient scheduling for repairs during either
planned or unplanned outages. Awareness of the operating condition of the turbine and
reacting to this as necessary is important for increasing availability and reliability.
2. Skill Sets Needed
Engineering staff resource is scarce. Monitoring and diagnostic contracts are usually part of
some larger long term service agreement (LTSA) framework. Often the details of what goes
on are hidden, and sometimes the data is too. You do need some turbine knowledge to use a
monitoring and diagnostic system effectively.
We have found that it is easier to train staff with some turbine knowledge to use monitoring
and diagnostic software than it is to train computer literate people about turbines. Using
monitoring and diagnostic software is a relatively easy task since it involves exploring data
using provided structures. Very little is created so it is essentially simpler than mastering the
full complexities of a database system or programming language.
Remote Monitoring and Diagnostics for Power Generation Gas Turbines
Page 5
Using a monitoring and diagnostic system is a good way for trainee engineers to learn more
about turbines as it reinforces theoretical understanding and allows them to investigate real
problems with assistance from more experienced staff as required. We think the best balance
is that monitoring turbines on a daily basis should form only part of the workload for any
given member of staff. Ideally that person has other work involvements with the site being
monitored. Compare this to a dedicated monitoring and diagnostic centre where this is the
sole function of the staff.
Getting the information remotely to the monitoring and diagnostic staff and then, if
necessary, remotely again to experienced personnel makes for efficient use of staff resources.
3. Infrastructure for Handling Turbine Data
3.1 Collecting Data On-Site
Data comes from the turbine control system, plant control system and any specialised
hardware that is connected such as vibration monitoring or emission monitoring systems. The
data collected from a turbine will depend on the age of the controller and the options
installed.
For example, with GE heavy duty gas turbine controllers we cannot get data from
Speedtronic Mk I and Mk II as they are analog. The cost of adding instrumentation to these
controllers to collect data for remote monitoring rapidly takes us toward the price of a new
control system. The cost of maintenance of these older controllers is such that many are being
replaced with new digital control systems, either from the OEM or from third parties.
Speedtronic MkIV controllers often have the ability to send data to a DCS system via
“datadump” or in the case of the later models, via modbus over a serial link. In both these
cases it is possible to tap into these signals and send a copy to the monitoring and diagnostic
software. Alternatively, the monitoring and diagnostic software can get information from the
printer output by setting the controller to print information continuously and capturing and
storing this electronically.
Speedtronic MkV controller data output will depend on the type of HMI attached and the
software running on that HMI. The most basic is the <I> HMI which is capable of producing
a serial modbus feed whose points can be configured by site. At the other end of the spectrum
the Cimplicity HMI provides an OPC server that makes data available.
Modern control systems generally provide an OPC interface and there are third party
software products that provide OPC interfaces to older digital controllers.
The data sampling frequency will depend on the type of faults to be detected and the amount
of storage available. Typically a once-per-second sampling provides the appropriate
compromise for an overview of many tags over many years. The diagnostic information may
relate to an immediate incident or refer to a longer time frame.

Remote Monitoring and Diagnostics for Power Generation Gas Turbines
Page 6
3.2 Storing Data
The data collected needs to be stored and analysed. The storage of the data can be
accomplished on-site and/or remotely. The technology used to store the data will influence
this choice. Ideally we would like to have no degradation of data resolution over time and be
able to move chunks of data around via email, FTP sites and USB keys. Usually this means
that the data is stored as files rather than in a database.
Remote Storage
Some monitoring and diagnostic systems transmit all the data remotely for storage to a
central server. The advantages of this are:
• no maintenance of storage facilities is required at site
• no software licenses are needed on-site for storage
The disadvantages are:
• communications can go down for extended periods of time resulting in loss of data
• the bandwidth of the communication infrastructure can be overloaded
• the number of points and frequency can be restricted by the communication
bandwidth
• access may not be allowed due to a companies Information Technology department
restrictions
Local Storage
Local storage of data advantages/disadvantages are the inverse of remote storage.
Hybrid Local/Remote Storage
By using a mixture of the two techniques we can produce a more robust bandwidth friendly
version. This assumes we are allowed remote access to the site, though even when this is not
possible, data can be transferred via USB key in the post, by email or a File Transfer Protocol
(FTP) site. Effectively we have remote access with a much longer update time when direct
remote access is denied. The benefits of a hybrid solution include
• no loss of data on extended communication failure
• reduced bandwidth since only diagnostic and summary data information are
transmitted on a regular basis
• specific high resolution data can be downloaded as required when drilling down lo
look at a specific problem
• full high resolution data can be transferred on USB keys at longer intervals such as
every two months

Remote Monitoring and Diagnostics for Power Generation Gas Turbines
Page 7
• any live data connection to site can be shared amongst all users as it is channelled
through a central server
• information is always available directly on-site
3.3 Distributing Data
We want to get the turbine data to a point in the organisation where the existing infrastructure
makes it easily available. For example, we can connect over normal phone links to sites and
bring information back to a central server which them makes it available on the internal
network and over the internet with appropriate security safeguards as shown in figure 1.
Figure 1- Example of a Monitoring and Diagnostics System Architecture
This structure means that many people all through the organisation can examine what has
happened to the turbine and experts can be called in to help resolve problems when required.
Often there are one or two people whose prime responsibility is to look after the turbine.
These people are the ones that use the monitoring and diagnostic system the most.
TIGER® is a registered trade mark of Turbine Services Limited

Remote Monitoring and Diagnostics for Power Generation Gas Turbines
Page 8
4. Diagnostics
There are many techniques for capturing knowledge about gas turbines, producing a spectrum
of diagnoses from the detection that something is abnormal through to the complete diagnosis
of a fault. The embedded knowledge depends on the appropriate sensors being available.
Even with few sensors (for example 80 analogs from a Speedtronic Mk IV) it is possible to
detect and diagnose many problems. Note that in some cases it is not possible to distinguish
between faults from the sensor input. Often site information is needed to resolve the cause of
observed behaviour in the monitoring and diagnostic system.
The kinds of embedded knowledge include
• Limit checking
• Rule Bases
• Performance models for heat rate and power
• Compressor Efficiency Models
• Measuring NOx Levels Against Targets
• Factored Running Hours and starts
• Qualitative Fuel System Models
• Neural Net Combustion Models
• Vibration analysis
It is important to have concise summaries of diagnostics that can be explored in depth if
necessary. We can look at the diagnostics produced in a number of ways and cross relate
these to highlight specific areas of interest. For example, we can use the importance or
severity of the diagnostic. A sample classification is
• critical – needs immediate attention
• fault – will not stop the turbine running, but needs to be addressed
• warning – abnormal behaviour detected, likely to be a fault
• event – status of the turbine has changed or minor abnormal behaviour detected
• information – diagnostics or digital changes occurring in the normal course of running
• controller messages – process and diagnostic messages and alarms from the controller
itself
We can provide structure to the information presented by examining
• complete time listing of every diagnostic
• number of occurrences - each different message shown once in the listing
accompanied by the number of times it has occurred in the query time period
• currently abnormal – diagnostics that have triggered out with the time period but are
still indicating an issue
• top level – if the diagnostics are organised in a hierarchical way, then we can present
the top level of that hierarchy and drill down into it to see more detail

Remote Monitoring and Diagnostics for Power Generation Gas Turbines
Page 9
An example of hierarchical classification is when the monitoring and diagnostic system takes
a set of messages in a given time span and recognises that they form a known pattern that is
attributable to a specific fault. The classification splits the messages into various categories
• determined by – why the main fault was concluded
• accounts for – other diagnostics that are a consequence of the fault
• other messages in the same area as the main diagnostic – for background information
In addition to the structures above, we can group the diagnostics into predefined areas such as
fuel, combustion, generator or vibration. These can help isolate issues. An example of area
classification is shown below in table 1.
Table 1. – example of area classification for diagnostics
steam turbine gas compressor seal oil
atomising air gas scrubber shutdown
start gas fuel turbine lp speed
compressor electrical transformer
water injection cranking cranking motor
mixed fuel fuel control temperature control
turbine control digital alarm
trip bearings gas fuel
air inlet compressor inlet generator
hp speed exhaust temp wheelspace
temp control speed control flame detection
nox steam lube oil grid
anti icing diesel start compressor disch
inlet guide vanes combustion liquid fuel
state turbine power controller
exhaust duct enclosure boiler
cooldown water wash cooling water
electric start hydraulic diesel speed
When turbines are being continuously monitored there is a need to know about particular
problems that have previously been reported and if plans to rectify the problem have been put
in place. This information needs to be available at the time the message is displayed. The
monitoring and diagnostic system can attach notes to messages indicating that further
information is available. These notes are available to all users. The system can also link
diagnostics directly into the turbine manual pages.
The presentation of the diagnostics is important as often digital tags will change in the normal
running of the turbine. We don’t necessarily want to ignore these as they may be relevant
additional information if an abnormality occurs, but in the normal running we want to be able
to suppress them. Filtering messages so that they do not appear in a normal diagnostic query
allows faster interpretation of the diagnostic list and makes new messages more obvious.
Remote Monitoring and Diagnostics for Power Generation Gas Turbines
Page 10
5. Monitoring Activities
There are three different types of monitoring activities
• frequency based checking – typically daily
• event based checking – investigating an incident or specific request
• summarising – typically quarterly reports
Generally we find that gas turbines are reliable. The control systems usually have redundancy
built in and problems develop over time. This means that checking on what has happened on
a daily basis is usually enough to spot and track problems as they develop.
Sometimes though, an event occurs that needs immediate attention. For example, after a trip
or on a start-up for a machine that is normally run constantly on base load.
Over time a number of faults are identified, not all of which can be fixed immediately. It is
important to record the history of the turbine and know what outstanding problems exist.
Providing summary reports facilitate this. Typically we find that producing a summary report
every quarter is sufficient. In addition, summary reports can be produced before an outage.
5.1 Frequency Based Checking
The checking of a turbine on a daily basis benefits hugely from assistance from a monitoring
and diagnostic system.
Consider if only a data historian is used, the staff will have to check each tag, cross check
relevant ones and potentially apply some form of comparison function by eye. If there are
200 analog tags, then this process can take a long time and since on any given day nothing
much will have happened, staff soon loose interest and keeping them motivated is a big issue.
Add to this the fact that some turbine knowledge is needed to review the data then you find
you have a situation where you have skilled staff not applying their skills to their full
potential and staff retention is a problem.
Using monitoring and diagnostic software to identify and keep track of problems with the
turbine maximises the time of skilled staff. Certain functionality contributes to the working
environment such as
• using diagnostics as the primary means to identify abnormalities and fault
• attaching notes to diagnostics to indicate the status of the issue especially with respect
to notifying and feed back from site
• filtering diagnostics that already have been notified and a resolution proposed
• automatically showing data for a rolling historical period on graphs, typically a week
is enough for a daily check
• Customised automated reports generated in word to allow adjustment and comments
to be added
Remote Monitoring and Diagnostics for Power Generation Gas Turbines
Page 11
Monitoring a turbine on a daily basis over a period of years builds up a context for the
machine. This context is very valuable in deciding whether a particular diagnostic is
significant enough to report to site. Site just really wants to know what is new that they have
to deal with. This context and the subsequent filtering of the diagnostics is facilitated by
attaching notes to a diagnostic message indicating its status. In addition, the notes allow
transferring of the context from one member of the diagnostic monitoring team to another.
The daily checking is a repetitive task, so we want the software to make it easy to look
through the relevant data for the day. Setting up automated reports with all the relevant
diagnostic queries and graphs is one way to do this. The problem with reports is that they are
not interactive. A better solution is to provide a tool set of diagnostic and graph windows
driven by the monitoring and diagnostic software that allows exploration of each tool
instance. This allows instant
• drilling down for more detail
• viewing of attached notes
• manipulation of the active message filters
The tool set can open many windows with a single click and once the data has been viewed,
each window is closed with a single click. If the windows are on top of each other then no
mouse movement is required, only a set of clicks. Optimization of these types of of
operational detail are important when an activity is carried out repetitively. Typically we find
that we have 20 windows for a daily check for a given turbine.
5.2 Event based checking
Events have a spectrum of severities from a sensor beginning to fail though to a turbine trip.
They can be identified in the course of daily monitoring or be notified to staff using the
monitoring and diagnostic system in a number of ways
• problem is flagged via a status screen on the monitoring and diagnostic system
• email or SMS message is sent to staff by the monitoring and diagnostic system
• phone call from site staff is received
Often time is of the essence in determining what has happened and in particular if it is safe to
restart the turbine.
A scenario detailing activities in investigating an incident is given below:
• an incident is notified to monitoring and diagnostic staff via an SMS message on a
mobile phone
• site is contacted to ascertain any background information and to notify them that the
monitoring and diagnostic team are investigating – sometimes the cause of the
incident is out with the turbine and associated systems, for example a lightning strike
taking out the generator
• a toolset with the current diagnostics and summary weekly trend graphs is loaded and
the time span for the incident is determined

Remote Monitoring and Diagnostics for Power Generation Gas Turbines
Page 12
• the once-per second data for around the time of the incident is downloaded from site
• the data is replayed through the system as if it were live, allowing examination of
screens and displaying of once-per second graphs
• the diagnostics are examined in detail with filters turned off – we want to see
everything that happed, including faults that have been identified before and currently
abnormal conditions that apply at the start of the data period
• diagnostic hierarchy and groupings are explored
• individual diagnostics are examined by bringing up notes, once per second graphs
and weekly trends of the turbine tags used in the diagnostic – the system identifies
automatically what these are
• historical searches of particular diagnostic occurrences are performed over all known
data for the turbine to see of it has occurred before – this can stretch back for many
years and is dependent for its effectiveness on an efficient searching mechanism
• predefined toolsets for once-per-second graphs and historical trends are examined
• longer term trends over years are set up for specific tags of interest
• specialised engineering resources are called in to assist in resolving the fault
• site is informed and a plan of action determined
• a report is produced by the remote monitoring and diagnostic team
5.3 Reporting back to site Ideally, the monitoring and diagnostic system should be available on-site allowing staff there
to investigate any incident. For remote monitoring and diagnostic situations we find that lack
of staff resources on-site mean that they rely on remote analysis.
Reports will typically consist of an explanation followed by relevant diagnostics, graphs,
trends and schematic screens. These images will come from automatically generated reports
and from screen captures. These are produced in Microsoft Word, converted to PDF and
uploaded to an FTP site. All interested parties are then sent a link to the document. We do not
send the document by email as it is typically large due to the images it contains.
Reports on a per incident basis accumulate over the months. We need to provide a status and
history that is easily referenced. Quarterly reports and status reports prior to outages provides
summary reports that are easily actionable by the site. Quarterly reports can also show long
term trends and performance measurements going back years. We include engineering and
site comments in the quarterly reports, these often indicate why the observed behaviour
occurred and what the proposed fix might be, with attendant timescales.

Remote Monitoring and Diagnostics for Power Generation Gas Turbines
Page 13
6. Examples
The following examples are in the appendices
1. Status summary for a GE frame 5 turbine
2. Incident report for “ID 1” on the status summary in Appendix 1
3. Sample pages from an automated report for a GE frame 6 turbine
7. Conclusion
We have examined the process of remote monitoring and diagnostics for power generation
gas turbines. This includes the software infrastructure, staffing structure, skills required,
support provided by software and details of tasks carried out.
Daily monitoring is carried out by a number of staff and this forms only part of what they do.
Investigating incidents uses engineering expertise from throughout the organisation.
Summaries are produced quarterly and prior to outages.
Diagnostic software assistance in the monitoring process greatly enhances staff productivity.
We have examined how such software is used and what information technology infrastructure
is needed to facilitate this.
The overall effect is to increase turbine availability and reliability and to maximise outage
activities.

Remote Monitoring and Diagnostics for Power Generation Gas Turbines
Page 14
Appendix 1. Example - Frame 5 Status Summary
ID DESCRIPTION ANALYSIS PA
GES
RECOMMENDATI
ON
1. Vibration
spikes on
generator
vibration
transducers
Since 7th March 2009, diagnostics has
indicated possible problems with the generator
DE vibration transducer on the turbine.
There are intermittent periods when the
transducer indicates frequent spiking. As there
is only one transducer on each bearing, it is not
possible to be certain if this is a real vibration
problem, or a symptom of intermittent
transducer faults. However, there are no
significant transient events observed on any of
the other key turbine parameters coincident
with these events, so this indicates that the
problem is more likely to be due to transducer
problems.
23,
24,
25,
36,
43
Change out.
2. Flame
detector
dropouts &
alarms
Since 10th March 2009, there have been
occasional dropouts on flame detector B, but
not on A. This normally occurs during periods
of reduced turbine power.
25,
26,
45
Change
out/clean.
3. Exhaust
temperature
spread
changes
On 10th
March 2009 there was also an increase
in exhaust temperature spread, from a low level
of 12 Deg C to about 25 Deg C. Although this
level was still quite low, it doubled during this
period, and unusually increases during a time
when other turbine parameters are fairly stable.
There is also an increase in the temperature
difference between the two 2nd stage aft
wheelspace thermocouples, which is most
likely caused by the increased spread. The
spread increase appears to be caused by a fall
in the combustion temperatures on combustion
can 3 and 4.
This problem has not re-occurred to date.
25,
26,
27,
29
Check Tx
floating seals.

Remote Monitoring and Diagnostics for Power Generation Gas Turbines
Page 15
ID DESCRIPTION ANALYSIS PA
GES
RECOMMENDATI
ON
4. Inlet guide
vane position
trouble
This problem continues to occur during turbine
startups for a few seconds as the turbine
reaches full speed no load.
34,
41
Calibrate.
5. Minor
negative
turbine power
This problem has occurred on several
shutdowns, for a few seconds before the
generator breaker opens.
35 Check and
adjust set
points.
6. High
generator
stator
temperatures
A generator breaker trip, followed by a
shutdown on March 28th
2009 may have been
caused by a thermocouple fault on stator slot
temperature thermocouple GDF20, which
began spiking at very high temperature levels.
No other turbine parameters exhibited
significant transients at the same time, so the
sensor fault probably caused the generator
stator high temperature alarm followed by the
generator stator high temperature trip breaker
alarm.
This sensor broke on 28th
March 2009. It has
not indicated high temperatures since that time,
but is still broken.
37,
38,
39
Renew &
calibrate.
7. Low
hydraulic
supply
pressure
alarm
This alarm has occurred during 3 shutdowns,
including the most recent on 16th
April 2009.
44 Adjust VR.
8. Exhaust
thermocouple
8 failure
This thermocouple failed on 28th
March 2009,
but was fixed on 14th
July 2009 and is currently
working.
45

Remote Monitoring and Diagnostics for Power Generation Gas Turbines
Page 16
ID DESCRIPTION ANALYSIS PA
GES
RECOMMENDATI
ON
9. High
wheelspace
stage 1 aft
outer 1 and 2
thermocouple
temperature
divergence
The differential temperature between the two
thermocouples has stayed at about 30 Deg C
throughout the report period, when the turbine
is running on load. This is higher than would
normally be expected.
33,
48
Refit.
10. High load
gear
temperature
On 13th and 20th August 2009, two high load
gear temperature alarms were detected. As
expected, these coincided with higher load gear
temperatures. The higher load gear
temperatures appeared to be related to higher
ambient temperatures. Unfortunately, the
ambient temperature readings were not
available from the turbine controller. However
as there is an inverse relationship between
turbine power and ambient temperatures when
the turbine is on temperature control, this can
be inferred from turbine power levels being
lower when the alarms occur. This may
indicate a developing problem with the lube oil
cooling system.
This alarm continues to occur intermittently
when the turbine is running. The last
occurrence was on 26th
August 2009.
50,
51,
52
Check oil
cooler
efficiency.
11. Compressor
trouble trip
Several turbine compressor trouble trips have
occurred immediately after turbine trips and
during turbine shutdowns. These trips are
normally a side effect of the initial trip, and
should not be a problem.
32,
40
No action
needed.
12. Low gas fuel
supply
pressure
Gas fuel pressure is often quite low, and this is
indicated by the gas fuel speed ratio valve
running at a high level, often being more than
90% open.
30 Increase
supply
pressure. Use
a gas fuel
compressor.

Remote Monitoring and Diagnostics for Power Generation Gas Turbines
Page 17
ID DESCRIPTION ANALYSIS PA
GES
RECOMMENDATI
ON
13. Compressor
bleed valves
slow to
actuate
Compressor bleed valves are quite slow to open
during trips and shutdowns. The delay can be
up to 17 seconds.
32,
40
Fit latest
version.
Relocate
outside of GT
enclosure.
14. Low lube oil
pressure on
turbine run
down
Low lube oil pressure digital activates when the
emergency lube oil pump stops just after the
trip and clears when the emergency lube oil
starts up when the turbine has stopped. So far,
there have been no low load oil pressure alarms
occurring as a result.
33 Recalibrate
pressure
switches and
oil supply
regulator.
Remote Monitoring and Diagnostics for Power Generation Gas Turbines
Page 18
Appendix 2. Example – Frame 5 Tiger Incident Report
Bearing Vibration Levels
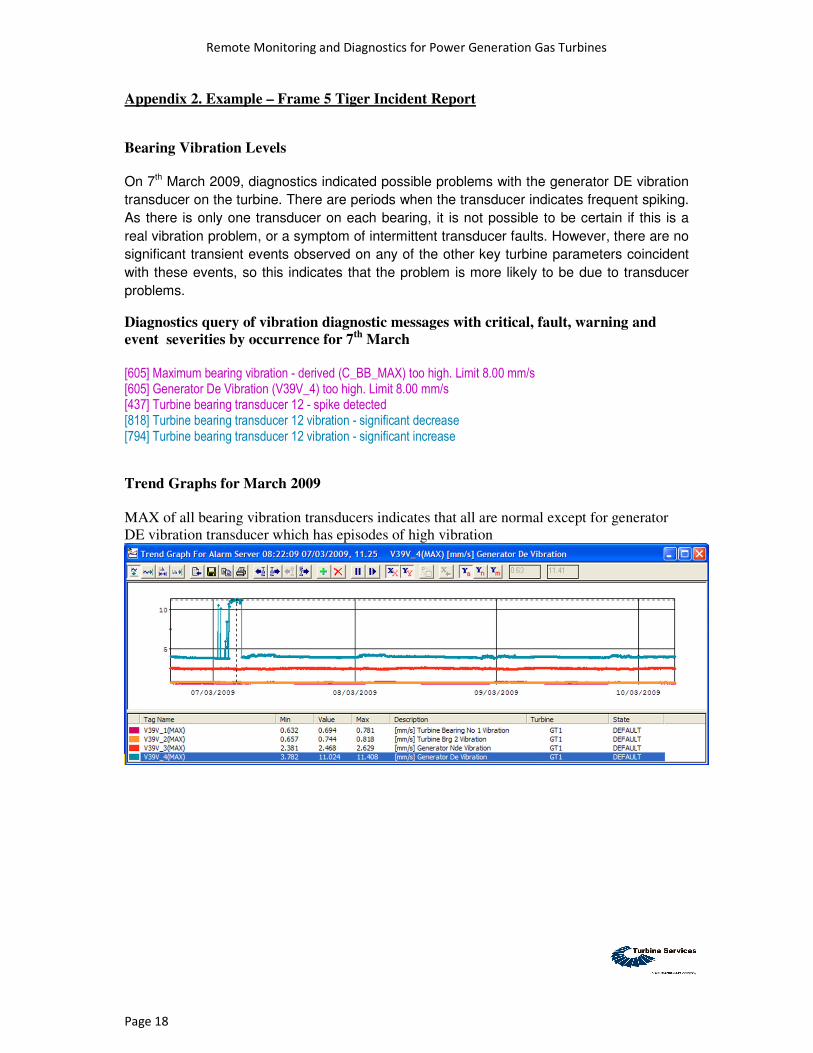
On 7th March 2009, diagnostics indicated possible problems with the generator DE vibration
transducer on the turbine. There are periods when the transducer indicates frequent spiking.
As there is only one transducer on each bearing, it is not possible to be certain if this is a
real vibration problem, or a symptom of intermittent transducer faults. However, there are no
significant transient events observed on any of the other key turbine parameters coincident
with these events, so this indicates that the problem is more likely to be due to transducer
problems.
Diagnostics query of vibration diagnostic messages with critical, fault, warning and
event severities by occurrence for 7th
March
[605] Maximum bearing vibration - derived (C_BB_MAX) too high. Limit 8.00 mm/s [605] Generator De Vibration (V39V_4) too high. Limit 8.00 mm/s [437] Turbine bearing transducer 12 - spike detected [818] Turbine bearing transducer 12 vibration - significant decrease [794] Turbine bearing transducer 12 vibration - significant increase
Trend Graphs for March 2009
MAX of all bearing vibration transducers indicates that all are normal except for generator
DE vibration transducer which has episodes of high vibration

Remote Monitoring and Diagnostics for Power Generation Gas Turbines
Page 19
MIN/MAX of generator DE vibration transducer indicates that during the episodes of high
vibration, the level is constantly changing
Data Graphs for March 2009
Generator DE vibration transducer indicates that during the episodes of high vibration, the
level is constantly spiking. This may indicate a transducer fault
Graph of all vibration transducers indicates that during spiking on the generator DE vibration
transducer the other vibration transducers are not affected. This also indicates a possible
transducer fault

Remote Monitoring and Diagnostics for Power Generation Gas Turbines
Page 20
Appendix 3. Example – Frame 6 Daily Automated Report Sample Pages
7-day Trend Report
24Hr Diagnostics
Long Term Performance
Report Generated on 30/01/2008 at 10:56:52
Table of Contents (note that the page numbers do not refer to this appendix – this is a sample)

Remote Monitoring and Diagnostics for Power Generation Gas Turbines
Page 21
Oil Temperatures
Power & Max Compressor Inlet Flange Temperature

Remote Monitoring and Diagnostics for Power Generation Gas Turbines
Page 22
Vibration
Power (DWATT & DVAR) & Lube Oil Header Temperature

Remote Monitoring and Diagnostics for Power Generation Gas Turbines
Page 23
Dry Corrected Power
Remote Monitoring and Diagnostics for Power Generation Gas Turbines
Page 24
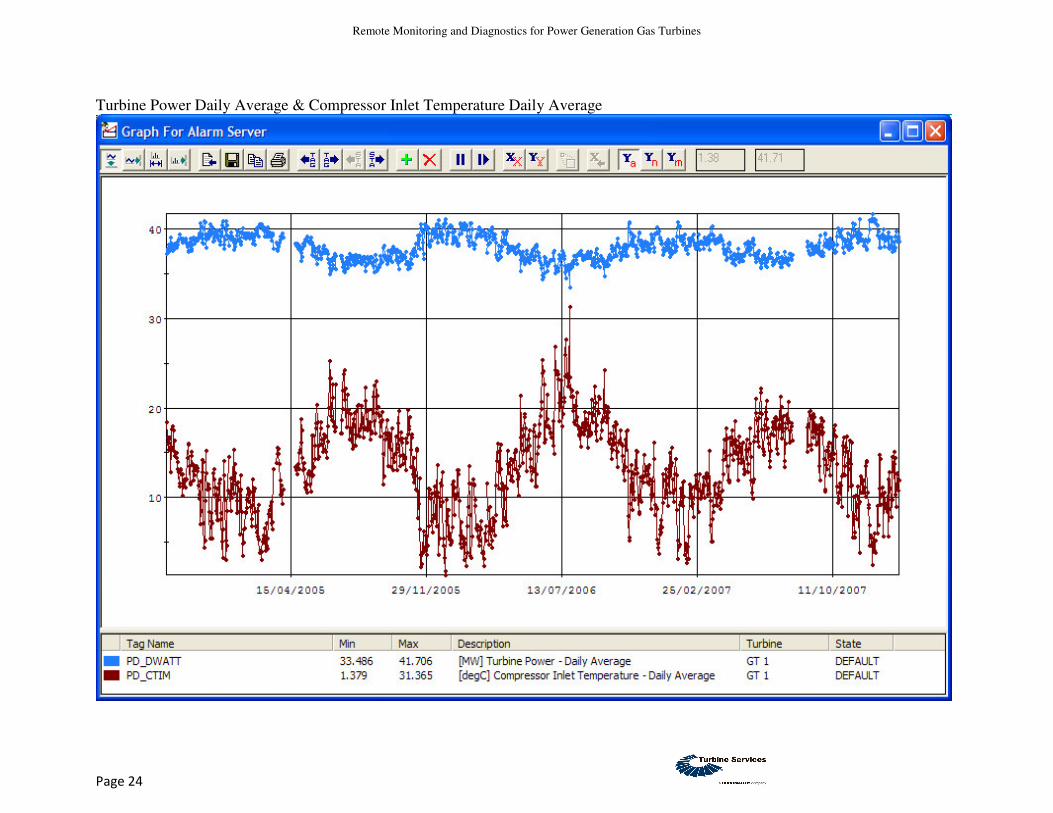
Turbine Power Daily Average & Compressor Inlet Temperature Daily Average

Remote Monitoring and Diagnostics for Power Generation Gas Turbines
Page 25
Diagnostics
Currently Abnormal
Currently abnormal diagnostics for turbine GT 1 with tag:all message:all severities:all alarms:all with filter 10:56:52 30/01/2008 Control panel temperature high (L26CTH_ALM) not in expected state (actual 1 expected 0)
10:56:52 30/01/2008 Exhaust thermocouple trouble (L30SPTA) not in expected state (actual 1 expected 0)
10:56:52 30/01/2008 Primary split above safe limit at high load (L3GSVM) not in expected state (actual 1 expected 0)
10:56:52 30/01/2008 Turbine compartment vent fan #1 - undercurrent rel (L51BT1) not in expected state (actual 1 expected 0)
10:56:52 30/01/2008 Above fast load rate T\.d. (L60DWR2Y) not in expected state (actual 1 expected 0)
10:56:52 30/01/2008 Lube oil tank level high (L71QH) not in expected state (actual 1 expected 0)
10:56:52 30/01/2008 Lube oil level trip (L71QT) not in expected state (actual 1 expected 0)
10:56:52 30/01/2008 Directional trip to primary - servo not (L94FXP1) not in expected state (actual 1 expected 0)
10:56:52 30/01/2008 Turbine temperature-wheelspace 3rd stg fwd outer (TTWS3FO2) too high. Limit 445.00 degC Highest Value: 508.77 Current Value: 508.53
10:56:52 30/01/2008 Turbine temperature-wheelspace 3rd stg fwd outer (TTWS3FO1) too high. Limit 445.00 degC Highest Value: 487.86 Current Value: 487.52
10:56:52 30/01/2008 Generator electrical trouble (L78GS_ALM) not in expected state (actual 1 expected 0)
10:56:52 30/01/2008 Lube oil level high (L71QH_ALM) not in expected state (actual 1 expected 0)
10:56:52 30/01/2008 T\.d. hydraulic supply pressure low (L63HQ1LY) not in expected state (actual 1 expected 0)
10:56:52 30/01/2008 Gas compartment vent fan #1 - undercurrent relay (L51VL2) not in expected state (actual 1 expected 0)
10:56:52 30/01/2008 Access compartment vent fan #2 - undercurrent rela (L51BA2) not in expected state (actual 1 expected 0)
10:56:52 30/01/2008 Wheelspace temperature high (L30WSA2) not in expected state (actual 1 expected 0)
10:56:52 30/01/2008 Combustion trouble (L30SPA) not in expected state (actual 1 expected 0)
10:56:52 30/01/2008 DLN Premix Combustion
10:56:52 30/01/2008 Wheelspace 3rd stage fwd outer differential temperature (C_WS3FODIFF) too high. Limit 20.00 degCR Highest Value: 21.36 Current Value: 21.01
10:56:52 30/01/2008 Turbine is running in high load range
10:56:52 30/01/2008 Compressor inlet air flow (AFQ) too low. Limit 100.00 kg/sec Lowest Value: 0.00 Current Value: 0.00