remining and restructure of a tailing deposit · pdf fileii keywords acid mine drainage;...
TRANSCRIPT

REMINING AND RESTRUCTURE OF A TAILING DEPOSIT Technical Feasibility
ANDREAS TUHAFENI SALOM MASTER DISSSERTATION PRESENTED TO FACULTY OF ENGINEERING OF THE UNIVERSITY OF PORTO MINING ENGINEERING
M 2017
i
Abstract
For more than 100 years, Panasqueira mine (Barroca Grande and Rio) has been a source of various
mineral concentrates such as wolfram and tin while copper, zinc and silver were extracted as by-
products. Nevertheless, apart from the concentrates that have fed the European industry, the process
of mining and beneficiation has produced generated tremendous amounts of waste materials
throughout, this is evidenced by the massive piles of tailing waste on the riverbed of the Zêzere River.
The Panasqueira tailings have been studied and investigated by various authors over the years, and
they raised various threatening environmental issues such as Acid Mine Drainage (AMD) generation,
soil and water contamination due to sulphide oxidation, and tailing dam instability due to exposure to
the climate. Apart from that, the tailing depositions can be potential economic mineral resources.
Therefore, due to the negative environmental impacts and the potential mineral resources, a technical
and economical solution to mitigate this site was proposed. This dissertation forms part of the
conceptual study that aims to develop a recoverability strategy and remediation plan for Rio tailing
dam with the aid of Vulcan Software (developed by Maptek, Australia). Vulcan software was used to
construct the tailing resource model for resource estimation, mine planning, and design. This process
was undertaken in five basic steps: database management, deposit modelling, pit design, pit
production, and rehabilitation design. In total, 108 samples consist of bulk samples and core drill that
were analysed with Energy Dispersive X-Ray Fluorescence (XRF), and Conductive Plasma Emission
Spectrometry (CPES) was used as the geochemical data input of the model. In addition to that, drone
survey data and digitised contour map data were used as surface topographical data to construct the
site model. Using Vulcan applications, imported data were managed, manipulated, and analysed to
produce both 2D and 3D models for visualisation. The classic statistical analysis and traditional inverse
distance square estimation method were used to determine the average grade values for five study
minerals in the tailings, which along with material volume data made it possible to estimate the size of
the potential tailing resources. The results for the five minerals studied produced average grade
estimations of 11.82 % As, 0.41 % Cu, 17.21 % Fe, 0.31 % W, and 0.89 % Zn, with mineral resources
estimated at 3.04 x10⁶ m3, of which only 1.32 x10⁶ m3 can be exploited through a direct digging and
loading method. To remediate the site, the hydraulic barrier cover system is proposed to cover the
restructure and reshaped dam slope. Even through estimation results show that is a certain volume of
minerals that can be remining for reprocessing these results was affected by the shortage of data and
sampling depth as many of the samples, as well as the error margin of base surface topographic map
data. Therefore, this study results must only be used as a feasibility study data input but not for decision
making unless more data is made available to improve the model accuracy and representativeness.

ii
Keywords
Acid mine drainage; Estimation; Modelling; Remining; Resources; Restoration, Restructure;
Tailing; Maptek Vulcan
TO:
Samantha and Zechariah
iii
Declaration
A dissertation submitted to the Faculty and the Board of Examiner of the Department of Mining and
Geo-Environmental Engineering, University of Porto – Faculty of Engineering (Faculdade de
Engenharia da Universidade do Porto - FEUP), Portugal as partial fulfilment of the requirements for
the degree of Master in Mining and Geo-Environmental Engineering -2016/2017.
I have clearly stated the contribution by others to jointly - authored works that I have included in my
dissertation.
I acknowledge that an electronic copy of my thesis must be lodged with the University Library and,
subject to the General Award Rules of the University of Porto. This dissertation may not be reproduced
without the prior written consent of the author. I warrant that this authorization does not, as far as I
know, infringe the rights of any third party.
iv
Acknowledgement
This dissertation is a combination of efforts, wisdom and brilliance of a cohesive team. Therefore, I
would like to acknowledge the following individuals for their guidance and encouragement, and the
following companies for their contributions in making this dissertation work successful:
My two supervisors, Prof. Alexandre Julio Machado Leite and Prof. José Manuel Soutelo
Soeiro de Carvalho, for their invaluable academic guidance throughout the research and
reading draft chapters and draft theses. On top of that they also provide me with the well set -
up computer laboratory with unlimited access for me to do my work without any challenges.
Prof António Manuel Antunes Fiuza (Department of Mining, University of Porto) for given us
this real project topic which is part of the main part of the ERA-MIN remine project for Cabeço
do Pião Tailings Deposit, Fundão, Portugal. We also would like all those who make it possible
for me to obtain the data used in this project work to the samples data used. And for teaching
me various course which become fundamental tools for this dissertation.
I wish to extend my thanks to Eye2MAP (Portugal) S.A for the drone data and material
provided and for their support throughout the dissertation.
I would like to gratefully thank Maptek Europe office management for given me a rare
opportunity to use their facilities and for the financial support for me to stay in Edinburgh while
learning the Vulcan software. Moreover, I would like to thank to Gary Buchanan (Operations
Manager - Maptek Europe office) for facilitating all those to happen I greatly appreciate to him.
My Vulcan software trainers Carles Xandri, Edia Briceno and Sarah Barker for provide me
with manual and teach me on how to use the software.
I would also like to express my appreciation to my teachers and professors at University of
Porto, especially to Batista and Aurora for finding time for all my questions.
My brother from another mother, my classmate and friend for the past 2 years, notable Douglas
for always been there to listen to my daily complains and allows us discussed them from time
to time. I know I cannot pay your valuable time but I would like to say thank you.
My friends Linea and Philemon for viewing and editing my work, thanks.
My partner Kandiwapa and daughter Samantha, my friends and family back home that give me
the energy needed at some moments, for selflessly giving their love and patience while I
undertook this study far away from them for the past 21 months.

v
Finally, I want to thank to my main sponsor The European Union, through the Erasmus Mundus
programme KITE without they financial support I could not be in Portugal at all. Thank you very much
to all those who contribute to this work.
vi
Table of Contents
Abstract ....................................................................................................................................... i
Declaration .................................................................................................................................. iii
Acknowledgement ...................................................................................................................... iv
Table of Contents ....................................................................................................................... vi
List of Figures ............................................................................................................................. x
List of Tables .............................................................................................................................. xiii
List of Symbols and abbreviation ............................................................................................. xiv
Chapter 1:Introduction and Background ................................................................................ - 1 -
1.1. Overview .......................................................................................................................... - 1 -
1.2. Motivation ........................................................................................................................ - 5 -
1.3. Problem statement .......................................................................................................... - 7 -
1.4. Significance of the study ................................................................................................. - 8 -
1.5. Objective of the project .................................................................................................. - 8 -
1.6. Scope of work .................................................................................................................. - 9 -
1.7. Dissertation outline ......................................................................................................... - 9 -
Chapter 2: Literature Review ................................................................................................... - 10 -
2.1. Introduction ..................................................................................................................... - 10 -
2.2. Rio tailing historical and environmental conditions .................................................... - 10 -
2.2.1. Study Area and climates ............................................................................................... - 10 -
2.2.2. Geology and mineralisation of the district ................................................................... - 12 -
2.2.3. Historical mining activities at Panasqueira area ........................................................... - 13 -
2.2.4. Previous study Environmental Considerations ............................................................. - 15 -
2.3. Mining computer application in mining planning and design .................................... - 20 -
2.3.1. Maptek Vulcan software ............................................................................................... - 20 -
2.3.2. Mine design and Planning using Vulcan ...................................................................... - 21 -
Chapter 3: Remining and Restoration Action Plan ................................................................ - 25 -

vii
3.1. Introduction ..................................................................................................................... - 25 -
3.2. Data collection and Processing ...................................................................................... - 25 -
3.2.1. Base topography map -T1955DATA ........................................................................... - 25 -
3.2.2. Geochemical analyses data ........................................................................................... - 26 -
3.2.2.1. Core drilling samples data ..................................................................................... - 26 -
3.2.2.2. Bulk samples data .................................................................................................. - 28 -
3.2.3. Tailing topography map - T2017DATA ....................................................................... - 29 -
3.2.4. Summary statistical analysis with Excel ...................................................................... - 30 -
3.2.5. Coordinate system conversion ...................................................................................... - 31 -
3.3. Modelling of Rio Tailing Dam ....................................................................................... - 32 -
3.3.1. Data Management and Structure .................................................................................. - 32 -
3.3.2. Data format and Structure ............................................................................................. - 33 -
3.3.2.1. Drill holes data ............................................................................................................ - 33 -
3.3.2.2. Topography data ......................................................................................................... - 36 -
3.3.3. Rio Project setup ........................................................................................................... - 37 -
3.3.4. Import drillholes and triangulation data ....................................................................... - 37 -
3.3.4.1. Entering data ......................................................................................................... - 37 -
3.3.5. Validate and Display of data ........................................................................................ - 39 -
3.3.5.1. Data validate .......................................................................................................... - 39 -
3.3.5.2. Display of data ...................................................................................................... - 40 -
3.3.5.3. Data sorting ........................................................................................................... - 42 -
3.3.5.4. Drillholes plotting ................................................................................................. - 42 -
3.3.5.5. Contouring display ................................................................................................ - 44 -
3.3.6. Data compositing .......................................................................................................... - 44 -
3.3.7. Statistical analyse by Vulcan ........................................................................................ - 45 -
3.4. Tailing Resource Modelling and Estimation ................................................................ - 46 -

viii
3.4.1. Block model construction ............................................................................................. - 47 -
3.4.2. Block viewing and manipulation .................................................................................. - 49 -
3.4.3. Data references and surface topography ....................................................................... - 55 -
3.4.4. Grade estimation ........................................................................................................... - 55 -
3.4.5. Tailing resource estimation .......................................................................................... - 60 -
3.5. Planning and Extraction Design for tailing .................................................................. - 61 -
3.5.1. Block Model Preparation .............................................................................................. - 61 -
3.5.2. Extraction design .......................................................................................................... - 63 -
3.5.2.1. Dam structure ........................................................................................................ - 63 -
3.5.2.2. Pit boundary .......................................................................................................... - 64 -
3.5.2.3. Bench and berm design ......................................................................................... - 65 -
3.5.2.4. Strip Design ........................................................................................................... - 66 -
3.5.2.5. Pit Design - Boolean ............................................................................................. - 67 -
3.5.2.6. Mineable resources calculation ............................................................................. - 69 -
3.5.2.7. Final pit shape ....................................................................................................... - 70 -
3.5.2.8. Extraction method ................................................................................................. - 72 -
3.6. Remediation Planning of the Rio Tailing ...................................................................... - 72 -
3.6.1. Assessment of the tailing materials and current infranstructure ................................... - 73 -
3.6.2. Slope reshaping ............................................................................................................. - 75 -
3.6.3. Cover for waste ............................................................................................................. - 77 -
3.6.3.1. Overview of tailing cover ...................................................................................... - 77 -
3.6.3.2. Closure option at Rio tailing dam ......................................................................... - 79 -
3.6.3.3. Cover measures ..................................................................................................... - 80 -
3.6.3.4. Proposed hydraulic barrier cover system .............................................................. - 80 -
3.6.3.5. Surface water management and monitoring system .............................................. - 82 -
3.6.3.6. Revegetation .......................................................................................................... - 82 -
ix
Chapter 4: Discussion ................................................................................................................ - 83 -
4.1. Introduction ..................................................................................................................... - 83 -
4.2. Tailing Resource Modelling and Estimation ................................................................ - 83 -
4.3. Planning and Design ....................................................................................................... - 86 -
4.4. Remediation Plan ............................................................................................................ - 87 -
Chapter 5: Conclusion ............................................................................................................... - 88 -
5.1. Conclusions .......................................................................................................................... - 88 -
5.2. Recommendations ............................................................................................................... - 89 -
References ................................................................................................................................... - 91 -
APPENDIX ................................................................................................................................. - 95 -

x
List of Figures
Figure 1. 1. Waste generation, 2014 (kg per inhabitant): Source: Eurostat (2014) .......................... - 2 -
Figure 2. 1. a) Panasqueira location in Portugal map, b) Panasqueira tailing deposition sites and the
main geological units, c) A wind rose of the prevailing winds on the top of the mine, on Barroca Grande
(Ávila, da Silva, and Candeias 2016) - 11 -
Figure 2. 2 Panasqueira tailing deposition sites on Barroca Grande and Rio tailing dam separate nature
by Zêzere river (Google Earth image, 2013) .................................................................................. - 11 -
Figure 2. 3. Photography view of S. Francisco de Assis (SFA), located downstream Barroca tailing
(Ávila, da Silva, and Candeias 2016). ............................................................................................. - 14 -
Figure 2. 4. Perspective (3D view) of the geophysical survey: Green - GPR profiles; Red - dipole-
dipole profiles (Grangeia et al. 2009). ............................................................................................ - 17 -
Figure 2. 5. Block Model Concept (Milawarma 1995) .................................................................. - 23 -
Figure 3. 1. Original part of the contour map – February 1955 (Source: Beralt Tin and Wolfram Ltd)
- 26 -
Figure 3. 2. Digitised base topography contour line – February 1955 ........................................... - 27 -
Figure 3. 3. 46 sampled location on 2017 topography .................................................................... - 28 -
Figure 3. 4. Bulk sampling process with Wheel Hoe Excavator .................................................... - 29 -
Figure 3. 5. Scan topography contour line – February 2017 .......................................................... - 30 -
Figure 3. 6. Rio mud dam project coordinate extents ..................................................................... - 37 -
Figure 3. 7. Import CSV file into a new database ........................................................................... - 38 -
Figure 3. 8. Database Validation dialog box ................................................................................... - 39 -
Figure 3. 9. Validation Error Report ............................................................................................... - 40 -
Figure 3. 10. Legend Editor Panel - Drill Legend .......................................................................... - 41 -
Figure 3. 11. Legend Editor Panel - Lithology Legend .................................................................. - 42 -
Figure 3. 12. 6 core drillholes points location displayed in Envisage ............................................ - 43 -
Figure 3. 13. 45 sample points location displayed in Envisage ...................................................... - 43 -
Figure 3. 14. Digitise contours at 10 unit intervals - February 1955 .............................................. - 44 -

xi
Figure 3. 15. Drillholes straight composite example (Maptek 2016) ............................................. - 45 -
Figure 3. 16. Histogram of the drill holes data for Rio tailing (As, Cu, Fe, Zn and W) ................. - 46 -
Figure 3. 17. Block construction new definition panel ................................................................... - 48 -
Figure 3. 18. Resource block model on plan view .......................................................................... - 49 -
Figure 3. 19. Resource block model on 3D view ............................................................................ - 50 -
Figure 3. 20. Typical block model header information .................................................................. - 51 -
Figure 3. 21. Typical horizontal sections layout – 340 Level ......................................................... - 52 -
Figure 3. 22. Typical horizontal sections layout – 460 Level ......................................................... - 52 -
Figure 3. 23. Typical horizontal sections layout – 480 Level ......................................................... - 53 -
Figure 3. 24. Typical horizontal sections layout – 540 Level ......................................................... - 53 -
Figure 3. 25. Typical vertical sections layout – X-Y LINE ........................................................... - 54 -
Figure 3. 26. Typical vertical sections layout – 50900N ................................................................ - 54 -
Figure 3. 27. Typical vertical sections layout – 35600E ................................................................. - 54 -
Figure 3. 28. Blocks variables reports ............................................................................................ - 58 -
Figure 3. 29. Typical full grade block model copper estimation - vertical sections layout – 460 Level -
59 -
Figure 3. 30. Typical sectional tailing grade block model copper estimation - vertical sections layout
– 460 Level ..................................................................................................................................... - 59 -
Figure 3. 31. Block model boundaries, priorities, inversion and projection ................................... - 62 -
Figure 3. 32. Rio topography with tailing deposition model .......................................................... - 63 -
Figure 3. 33. Tailing deposit resources model ................................................................................ - 63 -
Figure 3. 34. 3D tailing dimension structure (Grangeia et al. 2009). ............................................ - 64 -
Figure 3. 35. Pit boundaries polygon .............................................................................................. - 65 -
Figure 3. 36. Pit boundaries on the tailing topography model ........................................................ - 65 -
Figure 3. 37. The cross sectional showing bench layout (Pit resource) .......................................... - 66 -
Figure 3. 38. The cross sectional showing bench layout (Entire tailing resource) ......................... - 66 -

xii
Figure 3. 39. Strip polygon of the pit design .................................................................................. - 67 -
Figure 3. 40. Pit strip design triangulation model ........................................................................... - 67 -
Figure 3. 41. Pit formation model by Boolean method ................................................................... - 68 -
Figure 3. 42. Typical Pit formation model Boolean method – Intersecting triangulation .............. - 68 -
Figure 3. 43. Typical new pit formation model .............................................................................. - 68 -
Figure 3. 44. Mineable resources model ......................................................................................... - 69 -
Figure 3. 45. Mineable resources model ......................................................................................... - 70 -
Figure 3. 46. Final model of the pit with coarse tailing unmined .................................................. - 71 -
Figure 3. 47. General aspect of the contour map of Rio tailing ...................................................... - 71 -
Figure 3. 48. Release levels of concentrate from an untreated tailings deposition ......................... - 72 -
Figure 3. 49. Cabeço do Pião district and Rio tailings deposit image (Source: Google Earth image) ...-
74 -
Figure 3. 50. Reshaping process demonstration and transport system ........................................... - 76 -
Figure 3. 51. Final Reshape slope model proposed ....................................................................... - 77 -
Figure 3. 52. Full plan view of the reshape slope ........................................................................... - 78 -
Figure 3. 53. Reshape slope sectional view at X-X ........................................................................ - 78 -
Figure 3. 54. Schematic cross sections of cover system structure .................................................. - 81 -
Figure 4. 1. Grade estimation comparison ...................................................................................... - 84 -

xiii
List of Tables
Table 3. 1. Boreholes Identification ................................................................................................ - 28 -
Table 3. 2. The geochemical analysis results for five minerals studied. ........................................ - 31 -
Table 3. 3. The original coordinate system of the data ................................................................... - 31 -
Table 3. 4. Collar location of Rio tailing dam drill holes ............................................................... - 33 -
Table 3. 5. Typical survey table ...................................................................................................... - 34 -
Table 3. 6. Typical assay table ........................................................................................................ - 34 -
Table 3. 7. Typical geological table data ........................................................................................ - 35 -
Table 3. 8. Minerals concentration correlation ............................................................................... - 46 -
Table 3. 9. Nearest neighbour and Inverse distance square method resource estimation ............... - 60 -
Table 3. 10. Estimate resource mineable report .............................................................................. - 62 -
Table 3. 11. Tailing dimension ....................................................................................................... - 64 -
Table 3. 12. Mining resource calculation of optimum per bench report ........................................ - 70 -
xiv
List of Symbols and abbreviation
% percentage
°C Degrees Celsius
AMD Acid Mine Drainage
BRGM Bureau De Recherches Géologiques Et Minières
CIZ Central Iberian Zone
CPES conductive plasma emission spectrometry
CSV comma-separated values
DRX Diffraction des rayons X
EC European Commission
ERT Electrical Resistivity Tomography
EU European Union
FAO Food and Agriculture Organization of the United Nations
GIS Geographic Information System
GPR Ground Probing Radar Profiling
GPS Global Positioning System
IGM Instituto Geológico e Mineiro
Km Kilometre
m meter
m2 meter square
m3 Cubic meter
MHz Megahertz
mm millimetre
MMSD Mining, Minerals and Sustainable Development
Mt million tonnes
ODBC Open Database Connectivity
ppm parts per million
SD Sustainable Development
UTM Universal Time
WHO World Health Organization
XRF X-Ray Fluorescence
- 1 -
CHAPTER 1:INTRODUCTION AND BACKGROUND
1.1. Overview
Mining is one of the primary human operations that are responsible for the extraction of valuable
minerals (commodities) or other geological materials from the earth crust to meet the increased global
demand for commodities that are used by human being as needs to survive, and as sustainable
resources. It is worthnoting that non-renewable resources are the commonly extracted commodities,
and that different minerals may be exploited from the earth crust - either in their purty state or in the
concentrated, using surface mining methods or underground methods. Given that minerals are found
normally in compound forms to separate them from waste rocks, different mining techniques are
usually used to separate them from waste, and this is the beginning of the waste generation on the
mining process chain, as materials are separate, based on mineral concentration, commonly known as
the cut-off grade.
Mine waste are usually classified into two categories, namely: waste rocks and tailing. The waste rock
are synonymously referred to as the non-mineralised and low-grade mineralised rock extract from,
around or within the orebody during the exploitation refered to the materials with a low concentrate
than a defined cut off. In some cases, these rocks may be left behind on their original geological
position, but in most instances, especially on the surface operation, these materials are extracted along
with the mineralised materials before they end up in stockpiles around the mine site, and then they are
processed late or left unprocess. The separation decision is usually based on the processing plant
operation criteria, and economic or financial constraints. The latter, often referred to as processing
waste, refers to waste solids or slurries that remain after the treatment of minerals by the
hydrometallurgical separation involved in crushing, grinding, size-sorting, leaching and flotation,
which is done to remove the valuable minerals from the gauge. Generally, mining waste can be
generated from exploration, exploitation and the extraction of minerals, governed by the legislation on
mines, the technology of extraction and separation, and mineral deposit characterisic. For advanced
operations, the pyrometallurgical process has another form of waste called slag, which is usually
produced by its low quantity, compared to the waste rocks and tailing. The subject of tailing waste
deposition has been controversial issue all over the world due to its environmental impact when failure
arises. Since the past years, there has been different waste storage, and deposition that has been studied
throughout the world for various reasons, but a majority of them have been studied for environmental
and social concerns only in recently years we have seen the increase studies for economic benefits.
- 2 -
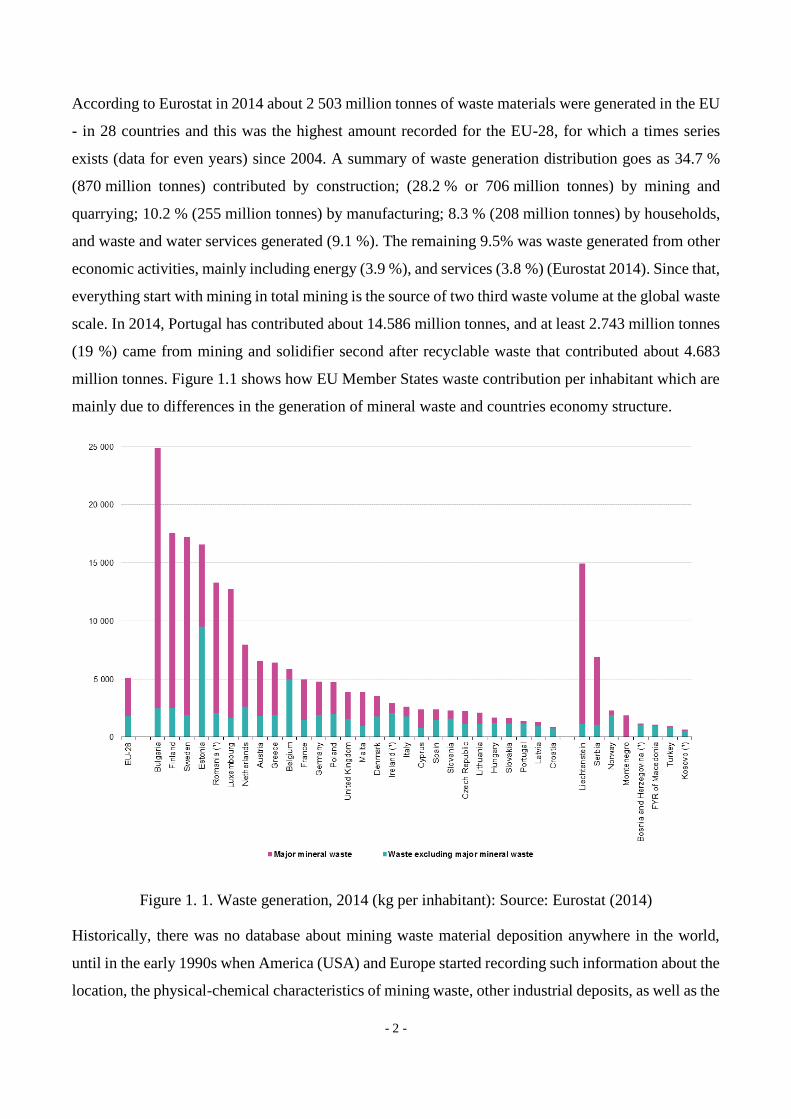
According to Eurostat in 2014 about 2 503 million tonnes of waste materials were generated in the EU
- in 28 countries and this was the highest amount recorded for the EU-28, for which a times series
exists (data for even years) since 2004. A summary of waste generation distribution goes as 34.7 %
(870 million tonnes) contributed by construction; (28.2 % or 706 million tonnes) by mining and
quarrying; 10.2 % (255 million tonnes) by manufacturing; 8.3 % (208 million tonnes) by households,
and waste and water services generated (9.1 %). The remaining 9.5% was waste generated from other
economic activities, mainly including energy (3.9 %), and services (3.8 %) (Eurostat 2014). Since that,
everything start with mining in total mining is the source of two third waste volume at the global waste
scale. In 2014, Portugal has contributed about 14.586 million tonnes, and at least 2.743 million tonnes
(19 %) came from mining and solidifier second after recyclable waste that contributed about 4.683
million tonnes. Figure 1.1 shows how EU Member States waste contribution per inhabitant which are
mainly due to differences in the generation of mineral waste and countries economy structure.
Figure 1. 1. Waste generation, 2014 (kg per inhabitant): Source: Eurostat (2014)
Historically, there was no database about mining waste material deposition anywhere in the world,
until in the early 1990s when America (USA) and Europe started recording such information about the
location, the physical-chemical characteristics of mining waste, other industrial deposits, as well as the
- 3 -
environmental impacts. Nevertheless, the only records available that are well-documented were written
after some of the historical tailing dam failure around world as from 1917 to April 2017 there were
242 tailing accidents recorded over the world. In Europe major know accidents are the Stava tailings
dam failure, near Trento, Italy in on 19th July 1985 that killed 268 people and cover about 435,000
square metres over 4.2 kilometres; the Aznalcollar mine tailing dam accident in Spain in April 1998,
which affected about 2 656 ha of Donana Nature Park, Baia Mare mine in January 2000, and the Baia
Borsa mine incident in March 2000 which happened in Romania. While the accidence of the decade
is the failure of Fundão tailings dam at Germano mine, Brazil in November 2015 that was due to
insufficient drainage as results of redesign, leading to liquefaction of the tailings sands shortly after a
small earthquake end up releasing the slurry pollutes North Gualaxo River, Carmel River and Rio
Doce over 663 km; and the latest one is 12 March 2017 Tonglvshan Mine in China that flooded the
fish pond downstream of approximately 27 hectares. It was after the abovementioned historical events
that different nations started realising the need to investigate and document mine waste deposition
within their territories, mainly sulphide and heavy minerals tailings, as they have observed them to be
a threat to the environment, society, and resources, such as water, soil as well as the impact on
greenhouse gas emissions (BRGM 2001, Puura, Marmo, and Alessandro 2002, Garcia et al. 2017,
ICOLD 2001, Bowker and Chambers 2015).
Following these incidents, various studies and investigations have been done, and it has called for
debates at different levels to reduce environmental pollution in order to conserve energy, to prevent
loss of lives and properties, and to respond to the scarcity of natural resource conservation (Hammond
1988). Between the years 2000 and 2002, the Mining, Minerals and Sustainable Development
(MMSD) research project was carried out to examine the role of the mineral sector in terms of
contributing to sustainable development, and how that contribution could be improved by the
International Institute for Environment and Development. After the MMSD study, the “Breaking New
Ground” report was published, highlighting the greatest challenges facing the world today, as
integrating economic activities with environmental integrity, social concerns, effective governance
systems, and access to information. This project elaborates the social barriers to sustainable
development, such as mistrust between the miner and communities where the operations are taking
place. The mistrust between the two groups is known to be due to the unfair distribution of costs and
benefits from the resources due to the fact that communities mostly view them as robbed they
resources, and they are left with massive environmental problems.
Concerning the environmental integrity, one of the challenges that threaten the mining sector towards
a sustainable world economy is the negative environmental legacy of the mining industry, which
- 4 -
includes the abundant mines and the massive volume tailing deposited around the world, causing
major environmental problems such as AMD. Several recommendations were drawn up to address in
the report, in order to increase the mining sector contribution and to accelerate the Sustainable
Development (SD) plan of the mining sector. In addition, all recommendations were drawn up within
four dimensions or ‘pillars’ of sustainable development, namely: social, environmental, political, and
economic pillar. In terms of mine legacies, the report recommends that the worst affected sites must
be identified, and they must be given a priority for remediation, in order to protect critical natural
features/areas and to limit further ecological environmental damage.
Europen Commission Proposed New Directive in June 2003 and this was implemented as the
European Directive 26/21/EC of 15 March 2006 on the management of waste from extractive
industries to oversees the permit conditions, storage, monitoring, and control of the mining waste to
guarantee that the environment and the entire society’s health is protected. The aim of the Directive is
to emphasise European member states to reduce environmental and health impacts of waste, and to
improve the EU’s resource efficiency. In addition, its objective is to reduce the amount of waste
generated, and to promote waste generation as a resource when it is unavoidable, achieve higher levels
of recycling, and the safe disposal of waste. Every EU member state is required to carry out
investigation, create a database that periodically update for their closed waste facilities which may
potentially cause threats to the environment and human health caused by waste from the extractive
industry through BAT and taking account of specifics of the operation and its location (Articles 1 and
4.3).
Like most European countries in Portugal, the Regional Information Network Decision-Support
System for Environmental Risk and Disaster Management (e-EcoRisk) project which was part of the
EU - Programme for research, technological development and demonstration on energy, environment
and sustainable development was carried out between 2004 and 2006 . The e-EcoRisk project was
established to a contribute to the decision-making process of environmental and civil protection
agencies with the responsivity to assess, prevent, mitigate, and control the probable and actual effects
of large-scale industrial spills on the environment. The sites were selected based on various reasons
such as their legacy, their current status, and the interaction with the environment, particularly the
rivers. Different site investigation and characterisation techniques (geotechnique and geophysical)
were used throughout to collected data and information for visualisation and interpretation to
understand the environment impacts, as well as to propose a solution to the challenges. e-EcoRisk
database allows access to the system information in real time from fixed and mobile wireless devices
via a regional enterprise network (Internet), using terrestrial and satellite high bandwidth

- 5 -
telecommunication systems. Nevertheless, several sites were not fully covered by this e-EcoRisk
project this has left more work needed to study the those sites as they are observed as threat.
1.2. Motivation
For more than 100 years, the district of Panasqueira in central of Portugal has been known as the global
sources of wolframite and tin mineral concentrate. In addition copper concentrate along with a minimal
quantity of zinc and silver mineral concentrate were extract as by-products. The extraction of minerals
has been excavated from several hydrothermal mineralisation deposits within the district of
Panasqueira since it was discovered (Candeias 2013, Ferreira da Silva et al. 2013, Smith 2006).
Mining is a dynamic and complex operation; unlike other industrial sectors, its negative distresses on
the environment are indisputable. This is evident to the visual disturbance of man-made mountains
created out of uneconomical materials, and both fine and coarse tailing are the residue of the processed
materials. The acid mine drainage, and heavy and toxic metal contamination of the riverbanks of
Zêzere River and surrounding district such as Barroca Grande, S. Francisco de Assis, Rio, Barroca,
and Dornelas do Zêzere are some environmental challenges that have been studied by various scholars
for the past years. The study area of interest is Cabeço do Pião (Rio) tailing that is about 5.1 km from
Barroca Grande. Barroca Grande is where the current underground adit processing plant and offices
are located. In fact, it is the current Panasqueira mine operation address after it was relocated from Rio
in 2001 (Boulet and Larocque 1998, Jung 2001, Moore and Luoma 1990, Naicker, Cukrowska, and
McCarthy 2003).
The processing plant was relocated to Rio around 1927 when owner at time abandoned Vale de Ermida
plant, and it has been operated using gravity, electromagnetic, and flotation separation. It is a fact that
in those years, the level of minerals extraction technology was low and the plant was changed from
time to time, and the environment regulation was quite poor. More than one million cubic metres of
complex, fine-to-fine sulfide materials are deposited on a mountainside overlaying the Zezere river,
imposing huge contamination risk.
A bulk of tailing has been stored in the pond and around a mountain that is located on the edge of the
Zezere river with an average height of 90 m and slope angle around 35 degrees.
According to Ávila et al. (2011), the deposition of tailing at Rio site can be traced back to 1905, and it
operates until 1996. The entire site has been exposed to the atmosphere conditions until June 2006
when the arsenopyrite stockpiles which are located near Rio village was capped with geotextile and
clay layer to minimise the atmospheric environment impacts (Crosby 2001, e-EcoRisk 2007, Gilchrist

- 6 -
and Mahmoud 1999). To minimise the hydrological environmental impact, two acid drainage
treatment plants were set up around Barroca Grande and Rio in order to collect, pump and treat the
seepage of acid mine drainage water from the tailing dams. The acid effluent is normally neutralised
with lime Ca(OH)2 to promote the precipitation and flocculation of metal when the pH increases. The
treated water was pumped into the river or re-used in the processing plant, while the mud and slush
were disposed via pipes in the open pond. The set-up prevention has never worked as expected, notably
during the winter and period of heavy rainfall as the system ends up overloaded, and it overflows as a
result of the AMD water enters the Zêzere river. The Zêzere River is part of the water supply source
that feed the three dams, which supplies water to major towns and villages such as Castelo de Bode
and Lisbon. In general, it contribute a portion to the water system of Lisbon. These reserves have a
total capacity of 1.86 x10⁶ m3 of water that are used for human consumption, recreation, fishing,
agriculture and sporting (e-EcoRisk 2007).
According to Candeias, Melo, et al. (2014), Rio tailing is a source of acid mine drainage that enters
the Zêzere river with a pH of approximately as 3 and high metal concentrate on which As and Fe
concentrations reduce downstream from ADM, due to the adsorbs and coprecipitate to form a
compound iron oxyhydroxides. In general, the hydrological impacts on the area due to AMD from the
tailings of Rio that are currently understood to a certain extent, mainly because their geological
background has been studied extensively, and it has even shown that there is no know nearby aquifer.
The great threat to the environment and the hydrogeological system will be the spill of the dam due to
the slope stability failure, or it may trigger heavy rainfall that can fill the dam, which could be a
potential danger and major disaster to the three downstream and the entire ecosystem.
The unconfined tailing and open impoundments are the major sources of pollution in the entire area as
the results of oxidation of sulphides and the unknown internal structure of the dam. The Rio tailing
dam geochemistry and mineralogy has been under investigation over the years by various author and
each study was a bit different from each other some of them are Ávila, da Silva, and Candeias (2016),
Ávila et al. (2011), Ávila et al. (2008), e-EcoRisk (2007).
Most studies were conducted to assess, identify, quantify or predict the environmental effects from the
high arsenic and iron concentration level record on the river. It has also been reported that the tailing
has had the highest concentrate of recovered minerals such W-Zn-Cu, which was due to the fact that
the dam was built when the technology of metal recovery was quite poor. This has motivated researcher
to study the reprocessing the tailing materials to extract minerals in order to generate funds for the
rehabilitation of the site. This will be done since that the tailing dam is located at a crucial location,
- 7 -
so if anything goes wrong, it will be a major disaster to the river, which is the source of water to the
three dams downstream and the communities. The generation of the funds is necessary, as there are no
funds from the National Program of Mine Rehabilitation due to the fact that the tailing site is a
properties of the municipality of Fundão, meaning it is not state owned. The rehabilitation of the site
is a significant step to reduce the risk of the failure of the dam, and to avoid any further environmental
incidents.
1.3. Problem statement
Given the background statements, it is necessary to summarise the threats and challenges concerning
the Rio tailing to the Zêzere River and the entire ecosystem:
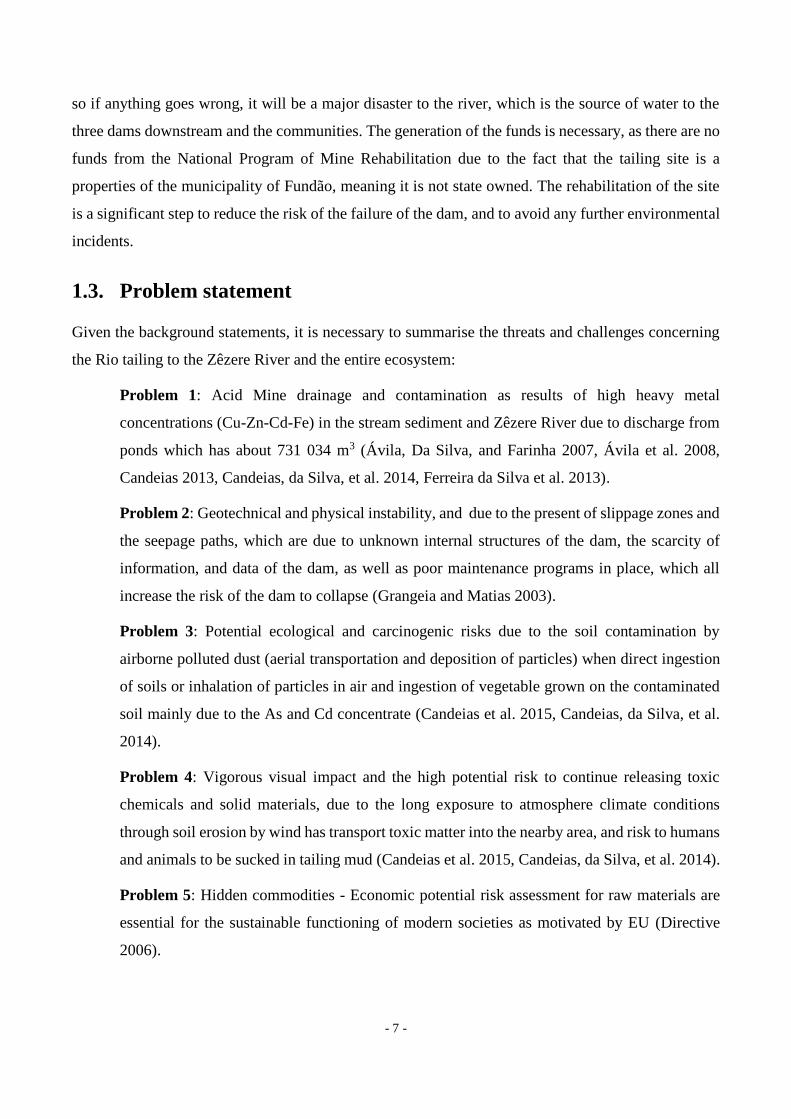
Problem 1: Acid Mine drainage and contamination as results of high heavy metal
concentrations (Cu-Zn-Cd-Fe) in the stream sediment and Zêzere River due to discharge from
ponds which has about 731 034 m3 (Ávila, Da Silva, and Farinha 2007, Ávila et al. 2008,
Candeias 2013, Candeias, da Silva, et al. 2014, Ferreira da Silva et al. 2013).
Problem 2: Geotechnical and physical instability, and due to the present of slippage zones and
the seepage paths, which are due to unknown internal structures of the dam, the scarcity of
information, and data of the dam, as well as poor maintenance programs in place, which all
increase the risk of the dam to collapse (Grangeia and Matias 2003).
Problem 3: Potential ecological and carcinogenic risks due to the soil contamination by
airborne polluted dust (aerial transportation and deposition of particles) when direct ingestion
of soils or inhalation of particles in air and ingestion of vegetable grown on the contaminated
soil mainly due to the As and Cd concentrate (Candeias et al. 2015, Candeias, da Silva, et al.
2014).
Problem 4: Vigorous visual impact and the high potential risk to continue releasing toxic
chemicals and solid materials, due to the long exposure to atmosphere climate conditions
through soil erosion by wind has transport toxic matter into the nearby area, and risk to humans
and animals to be sucked in tailing mud (Candeias et al. 2015, Candeias, da Silva, et al. 2014).
Problem 5: Hidden commodities - Economic potential risk assessment for raw materials are
essential for the sustainable functioning of modern societies as motivated by EU (Directive
2006).

- 8 -
Generally, the entire area of Rio tailing district can be classified as toxicological risks due to high
concentrate of metals such as arsenic and cadmium that have been detected over the years.
1.4. Significance of the study
Mine planning and design solutions are complex and tedious work carried out by different experts
from the various areas such as mining; geology and finance. This involved defining the mineralisation
of interest boundaries mine arrangements in the section, based on the geological, hydrogeological,
social, and environmental, technical, and economic data available. In the past, this process was labour
and paper intensive, time consuming, costly, and not to mention a prone error on design and
quantifying minerals deposits. The development and continuity development on the field of computer
application and numerical modelling over the years has been noted also on the mining industry.
Computer application in mining has become essential tools from data and information management,
planning and design process. Therefore, the benefits used by Maptek Vulcan software in this study is
simply to assess the available data collected from various sources, and to use them to define the status
of the Rio tailing dump resource. The results of this project will contribute significant to the future
planning evaluation tailing dump evaluation to determine the recovery of the major minerals on the
tailings for economic purposes, and strategic environmental and social management plans to minimise
the environmental impacts on the Zêzere River, and to meet the legislation and regulations.
1.5. Objective of the project
The aim of this project is to determine the technical preliminary feasibility and plan the exploitation
of the tailing muds materials from the Cabeço do Pião (Rio) tailing dam to extract and reprocess the
valuable and sulphide minerals effectively for economic benefits, and mining waste management to
minimise further acid mine drainage impact using Vulcan mining software. This should be carried out
using the available data and information from earlier researchers. Therefore, to achieve the overall aim
of the project, the following three objectives set to reach for this aim are:
1. To create geological resources model and estimate the quantity and quality of the Rio tailing
dam materials for exploitation with aid of computer software.
2. To develop and design a mining extraction plan for the tailing dams and transportation
system to the plant with an aid of computer software. Ensure that produced designs and plans
are as practical as possible.

- 9 -
3. To develop a combining mining waste environmental management and site rehabilitation
the re-sharpening of the topography to minimise further environmental impacts and instability.
1.6. Scope of work
The aim of this study is to utilise Maptek -Vulcan software to construct the geological model of the
Cabeço do Pião (Rio) tailing dam, and then plan the extraction and haulage strategies to extract
valuable minerals (W-Cu-Zn), and plan the rehabilitation of the dump. The study follows five basic
stages of mine planning from exploration database management, geological dump modelling,
extraction design, production scheduling, and site rehabilitation.
1.7. Dissertation outline
The format of the dissertation will reflect the quantity of the work carried out in each relevant area. In
this chapter, the author began by providing an overview of the project by stating the motivation factors
along with the problem under a series of sub-heading. In the following chapter, the author continues
to highlight the condition of the site under study and the need for urgent intervention by using the
available the tools. It goes on the following chapter where the tools are applied to find solutions to the
problems stated before to achieve the project objectives. Then in the second last chapter, an overall
discussion was done before concluding and recommendations were drawn up in the last chapter.
• Chapter 1 this introduction section that gives the study overview, problem and motivation
factors, the objectives and it significant to the society.
• Chapter 2 reviews the investigation work carried out thus far at the site and its discovery,
then it goes on to review the computer applications as a tool in mining planning and design
project
• Chapters 3 go into greater detail about specific aspects of the project simple to solve every
objective with the aid of computer software system;
• Chapter 4 summarise the works carried out in chapter 3 and highlight some of the major
challenges encountered in the process of carrying out the work.
• Chapter 5 provides conclusions and makes recommendations about future to improve the
results and solve the problem better.

- 10 -
CHAPTER 2: LITERATURE REVIEW
2.1. Introduction
To understand the significance of this study, and its future contributions, an extensive literature review
was undertaken to understand current issues and the solutions to minimise the acid mine drainage and
contamination of Zêzere river by Rio the tailing dam. This chapter is divide into two parts; in which
one part is about site mining history and environmental issues, and then the second part is about
computer applications as a tool in mining planning and project design.
2.2. Rio tailing historical and environmental conditions
2.2.1. Study Area and climates
Cabeço does Pião tailing also known as Rio tailing dam is part of Panasqueira mine district, which is
in the municipalities of Fundão, Castelo Branco District, Central of Portugal. The district is located
between the Gardunha and S. Pedro de Açor Mountains to the west of the Central Portugal depression
Cova da Beira (Beira Baixa province) about 20 km south-west of Serra da Estrela the highest mountain
in the mainland Portugal with 1993 m (Figure 2. 1). The local topography ranges have an altitude from
350 to 1080 m (Reis 1971), with a deep valley. The climate that has a major influential to AMD and
the stability of the dam, it is known to be aggressive in the district with the hot summer period and dry
while winter is very cold, rainy and windy. The annual average temperature is 12 °C, normally range
from 0 °C during winter to 30 °C in the summer time. The precipitation average per year is 1200 -1400
mm; with frequent snow experience at the altitude above 700 m while the evapotranspiration in the
region has an average around 1 080 mm (inag, 2016). The stream, except for the Zêzere river, are
usually dry in summer and flooded in winter. The river is the source of the water to the nearby
communities for drinking, agricultural, fishing while the land used for cattle breeding and cultivation
(Ávila et al. 2008, Candeias 2013, Candeias, da Silva, et al. 2014). In addition, the tailing dams are
properties of the municipality of Fundão and they have never been included in the National Program
for Mine Rehabilitation. Figure 2.2 shows the view of the study area and the district nearby it also
shows the imaginal boundaries of the district in line that goes through the river.

- 11 -
Figure 2. 1. a) Panasqueira location in Portugal map, b) Panasqueira tailing deposition sites and the
main geological units, c) A wind rose of the prevailing winds on the top of the mine, on Barroca
Grande (Ávila, da Silva, and Candeias 2016)
Figure 2. 2 Panasqueira tailing deposition sites on Barroca Grande and Rio tailing dam separate
nature by Zêzere river (Google Earth image, 2013)
- 12 -
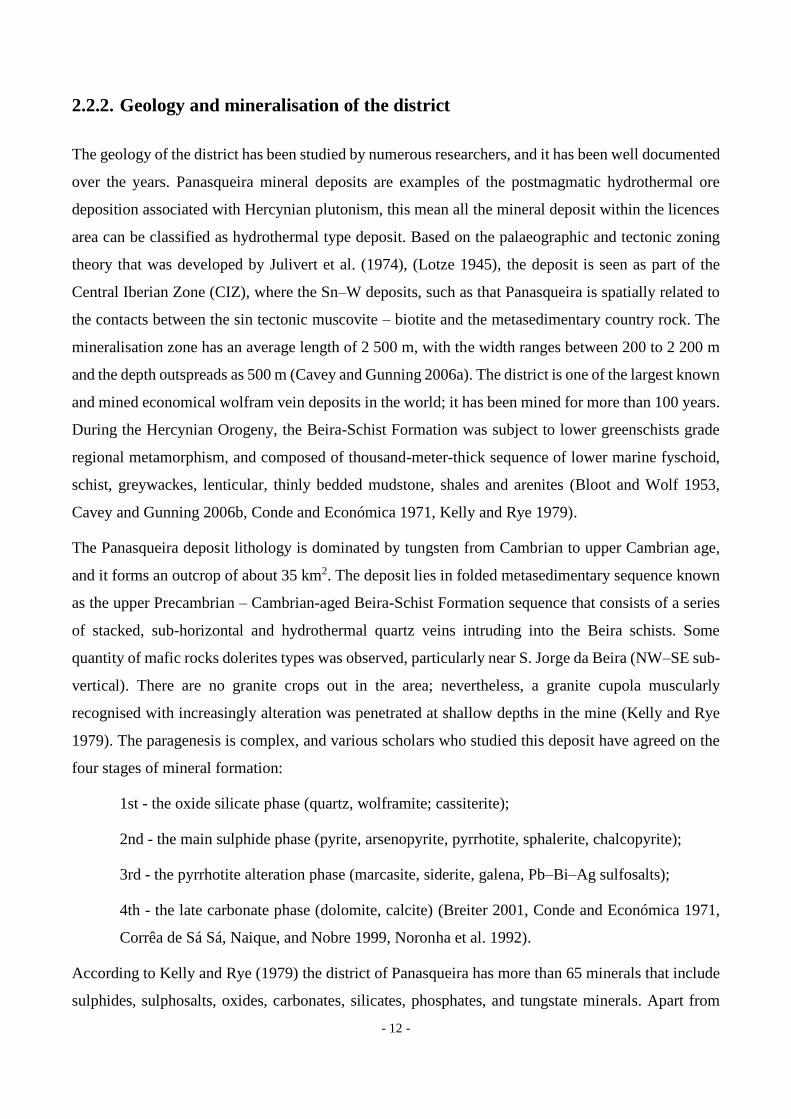
2.2.2. Geology and mineralisation of the district
The geology of the district has been studied by numerous researchers, and it has been well documented
over the years. Panasqueira mineral deposits are examples of the postmagmatic hydrothermal ore
deposition associated with Hercynian plutonism, this mean all the mineral deposit within the licences
area can be classified as hydrothermal type deposit. Based on the palaeographic and tectonic zoning
theory that was developed by Julivert et al. (1974), (Lotze 1945), the deposit is seen as part of the
Central Iberian Zone (CIZ), where the Sn–W deposits, such as that Panasqueira is spatially related to
the contacts between the sin tectonic muscovite – biotite and the metasedimentary country rock. The
mineralisation zone has an average length of 2 500 m, with the width ranges between 200 to 2 200 m
and the depth outspreads as 500 m (Cavey and Gunning 2006a). The district is one of the largest known
and mined economical wolfram vein deposits in the world; it has been mined for more than 100 years.
During the Hercynian Orogeny, the Beira-Schist Formation was subject to lower greenschists grade
regional metamorphism, and composed of thousand-meter-thick sequence of lower marine fyschoid,
schist, greywackes, lenticular, thinly bedded mudstone, shales and arenites (Bloot and Wolf 1953,
Cavey and Gunning 2006b, Conde and Económica 1971, Kelly and Rye 1979).
The Panasqueira deposit lithology is dominated by tungsten from Cambrian to upper Cambrian age,
and it forms an outcrop of about 35 km2. The deposit lies in folded metasedimentary sequence known
as the upper Precambrian – Cambrian-aged Beira-Schist Formation sequence that consists of a series
of stacked, sub-horizontal and hydrothermal quartz veins intruding into the Beira schists. Some
quantity of mafic rocks dolerites types was observed, particularly near S. Jorge da Beira (NW–SE sub-
vertical). There are no granite crops out in the area; nevertheless, a granite cupola muscularly
recognised with increasingly alteration was penetrated at shallow depths in the mine (Kelly and Rye
1979). The paragenesis is complex, and various scholars who studied this deposit have agreed on the
four stages of mineral formation:
1st - the oxide silicate phase (quartz, wolframite; cassiterite);
2nd - the main sulphide phase (pyrite, arsenopyrite, pyrrhotite, sphalerite, chalcopyrite);
3rd - the pyrrhotite alteration phase (marcasite, siderite, galena, Pb–Bi–Ag sulfosalts);
4th - the late carbonate phase (dolomite, calcite) (Breiter 2001, Conde and Económica 1971,
Corrêa de Sá Sá, Naique, and Nobre 1999, Noronha et al. 1992).
According to Kelly and Rye (1979) the district of Panasqueira has more than 65 minerals that include
sulphides, sulphosalts, oxides, carbonates, silicates, phosphates, and tungstate minerals. Apart from
- 13 -
quartz, dominate other minerals such as beryl, mica, and fluorite are some of the common minerals in
the area. Most of those minerals can only be analyse at microscopically level and this one of the
interesting part of many scientists. Over the years, the mine has been producing wolframite and
cassiterite concentrate along with copper as a secondary concentrate from chalcopyrite while
arsenopyrite rejected to the tailing with arsenic as high as 30%.
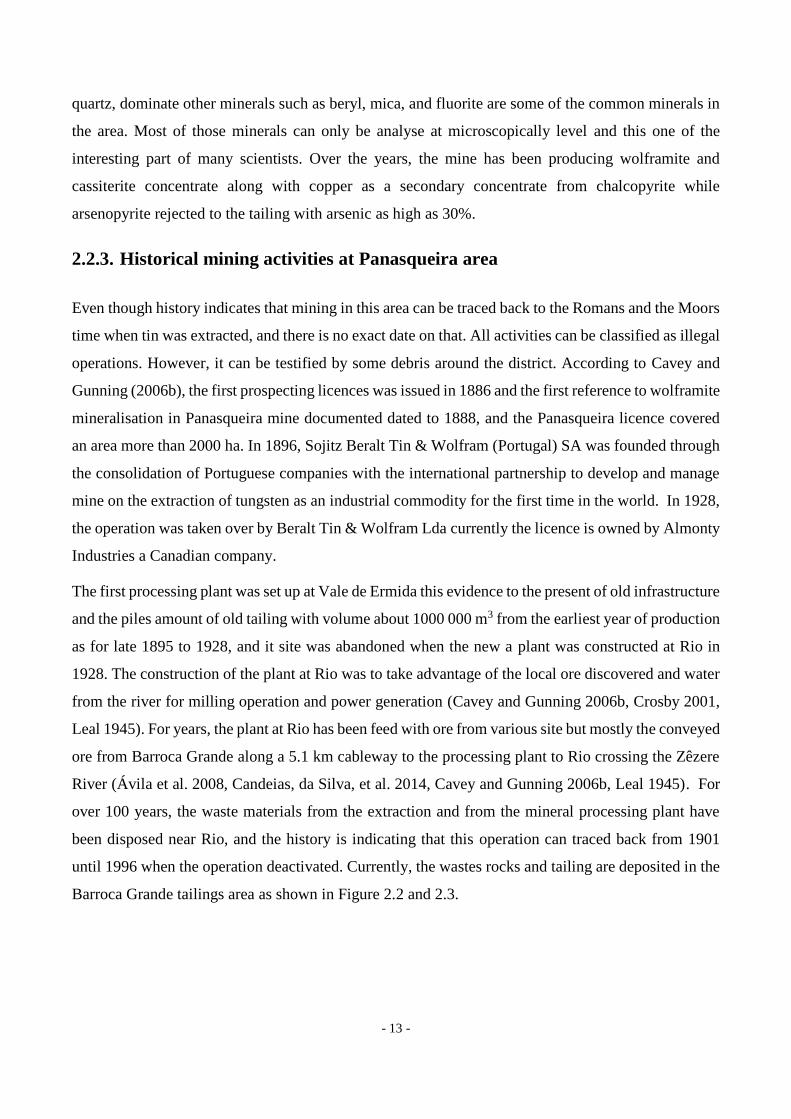
2.2.3. Historical mining activities at Panasqueira area
Even though history indicates that mining in this area can be traced back to the Romans and the Moors
time when tin was extracted, and there is no exact date on that. All activities can be classified as illegal
operations. However, it can be testified by some debris around the district. According to Cavey and
Gunning (2006b), the first prospecting licences was issued in 1886 and the first reference to wolframite
mineralisation in Panasqueira mine documented dated to 1888, and the Panasqueira licence covered
an area more than 2000 ha. In 1896, Sojitz Beralt Tin & Wolfram (Portugal) SA was founded through
the consolidation of Portuguese companies with the international partnership to develop and manage
mine on the extraction of tungsten as an industrial commodity for the first time in the world. In 1928,
the operation was taken over by Beralt Tin & Wolfram Lda currently the licence is owned by Almonty
Industries a Canadian company.
The first processing plant was set up at Vale de Ermida this evidence to the present of old infrastructure
and the piles amount of old tailing with volume about 1000 000 m3 from the earliest year of production
as for late 1895 to 1928, and it site was abandoned when the new a plant was constructed at Rio in
1928. The construction of the plant at Rio was to take advantage of the local ore discovered and water
from the river for milling operation and power generation (Cavey and Gunning 2006b, Crosby 2001,
Leal 1945). For years, the plant at Rio has been feed with ore from various site but mostly the conveyed
ore from Barroca Grande along a 5.1 km cableway to the processing plant to Rio crossing the Zêzere
River (Ávila et al. 2008, Candeias, da Silva, et al. 2014, Cavey and Gunning 2006b, Leal 1945). For
over 100 years, the waste materials from the extraction and from the mineral processing plant have
been disposed near Rio, and the history is indicating that this operation can traced back from 1901
until 1996 when the operation deactivated. Currently, the wastes rocks and tailing are deposited in the
Barroca Grande tailings area as shown in Figure 2.2 and 2.3.
- 14 -
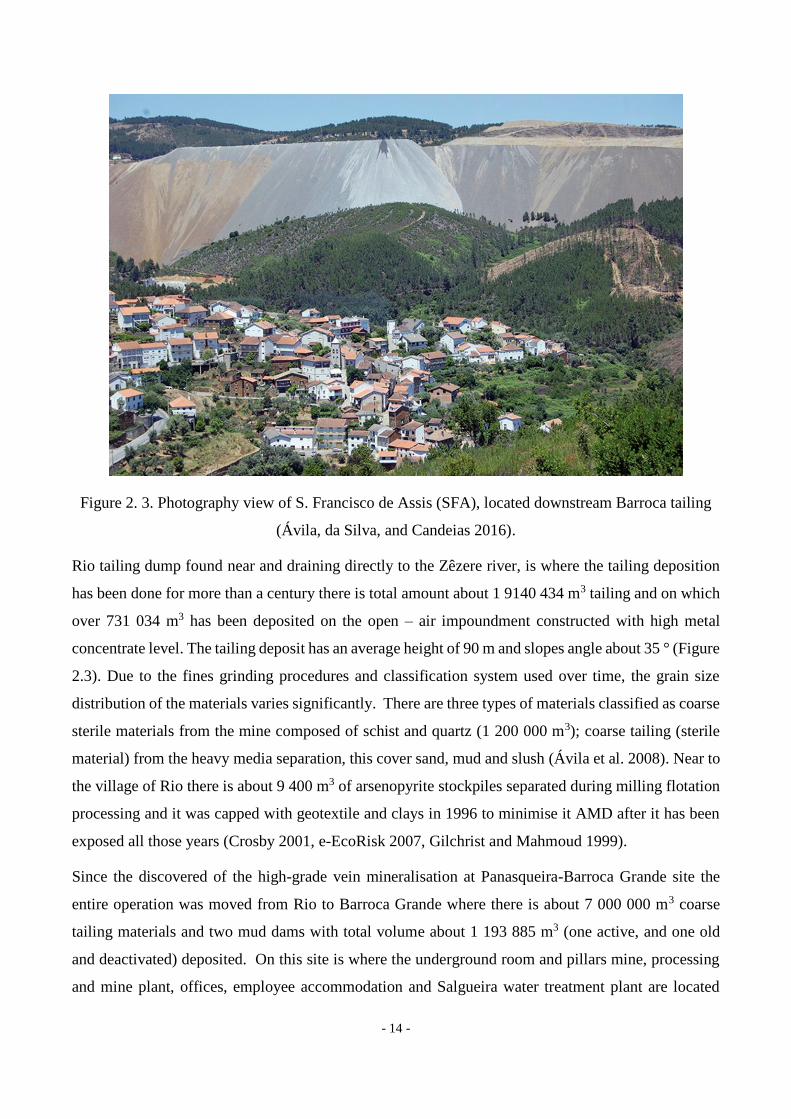
Figure 2. 3. Photography view of S. Francisco de Assis (SFA), located downstream Barroca tailing
(Ávila, da Silva, and Candeias 2016).
Rio tailing dump found near and draining directly to the Zêzere river, is where the tailing deposition
has been done for more than a century there is total amount about 1 9140 434 m3 tailing and on which
over 731 034 m3 has been deposited on the open – air impoundment constructed with high metal
concentrate level. The tailing deposit has an average height of 90 m and slopes angle about 35 ° (Figure
2.3). Due to the fines grinding procedures and classification system used over time, the grain size
distribution of the materials varies significantly. There are three types of materials classified as coarse
sterile materials from the mine composed of schist and quartz (1 200 000 m3); coarse tailing (sterile
material) from the heavy media separation, this cover sand, mud and slush (Ávila et al. 2008). Near to
the village of Rio there is about 9 400 m3 of arsenopyrite stockpiles separated during milling flotation
processing and it was capped with geotextile and clays in 1996 to minimise it AMD after it has been
exposed all those years (Crosby 2001, e-EcoRisk 2007, Gilchrist and Mahmoud 1999).
Since the discovered of the high-grade vein mineralisation at Panasqueira-Barroca Grande site the
entire operation was moved from Rio to Barroca Grande where there is about 7 000 000 m3 coarse
tailing materials and two mud dams with total volume about 1 193 885 m3 (one active, and one old
and deactivated) deposited. On this site is where the underground room and pillars mine, processing
and mine plant, offices, employee accommodation and Salgueira water treatment plant are located
- 15 -
(Cavey and Gunning 2006b). Salgueira water treatment plant is one of the surface treatment set up to
treat water from the old tailing pond and new pond, mine drainage water and seepage from the base of
the tailings. Lime is used as treatment chemical to treat polluted water by precipitate the sludge that
pumped to the tailing dam while the treated water is re-used in the plant or pump in the river streams.
Another water treatment plant is found at Rio. Panasqueira mine is one of the few mines in the world
that contribute significate during both good days and bad days in term of economic and political. It has
passed through different economic crisis and its production is from 1947 to 2001 about 96 456 tonnes
of WO3, 4 901 tonnes of SnO2, and 28 924 tonnes of Cu from more than 27 x 106 tonnes of rock except
for a brief period at the end of World War II and a second closure in the mid 1990’s (Cavey and
Gunning 2006b). Nerveless, there is huge controversy about it significant negative environmental and
social impact on the district over the years.
2.2.4. Previous study Environmental Considerations
Here are some of the notable research articles written by various authors related to the environmental
and social impact as results of the existence of Rio tailing deposition.
Dinis da Gama (2002) study the geotechnical and laboratory of the tailings in the River Zêzere waste
heap. This study investigates was done by drilling six boreholes and collect core samples to investigate
geotechnical and hydrological behaviour, that is, stability, landslides, a formation of ravines and
erosion. The samples were analysed at Beralt Tin and Wolfram laboratory to determine the
granulometric and mineralogical characteristics of Rio tailing materials. Those core samples were
again analysed by (Grangeia et al. 2009) with additional samples of mud and water that were collected
around the tailing dam to carry out an integrated investigation of the Rio tailings - Panasqueira mine
(Centre Portugal). An integrated investigation was simple multi multidisciplinary investigation
research that used geophysics analysis, geochemistry analysis and borehole information with the aid
of Geographic Information System (GIS) to characterise and presents results in the spatial domain.
This approach was carried out to determine the environmental impact and find solution those
challenges. Both study state that the analysed samples mineralisation distributions were significantly
varied and the materials were too fine with a potential to ca be transported as dust or in suspension by
the surface waters and accumulates on solid materials. They highlight that the coexistence of
wolframite, cassiterite, sulphides, carbonates, and silicates is responsible for the geochemical
behaviour in the Rio tailings environment and the AMD formation is the results of weathering of
sulphide-rich materials. This mainly due to the climate condition of the site also. The presence of

- 16 -
melanterite (Fe2+ (SO4) ·7(H2O)) and minor amounts of rozenite (Fe2+ (SO4) ·4(H2O)) and
szomolnokite (Fe2+ (SO4) · (H2O)) were observed with a Diffraction des rayons X (DRX)
identification. The conclude that the oxidation of the tailing and flow from open impoundments main
source of pollution in the surrounding area and is responsible for the mobilisation and migration of
metals from the mine wastes into the environment. This was justified by the stream sediment and water
samples that were found to be contaminated a distance downstream.
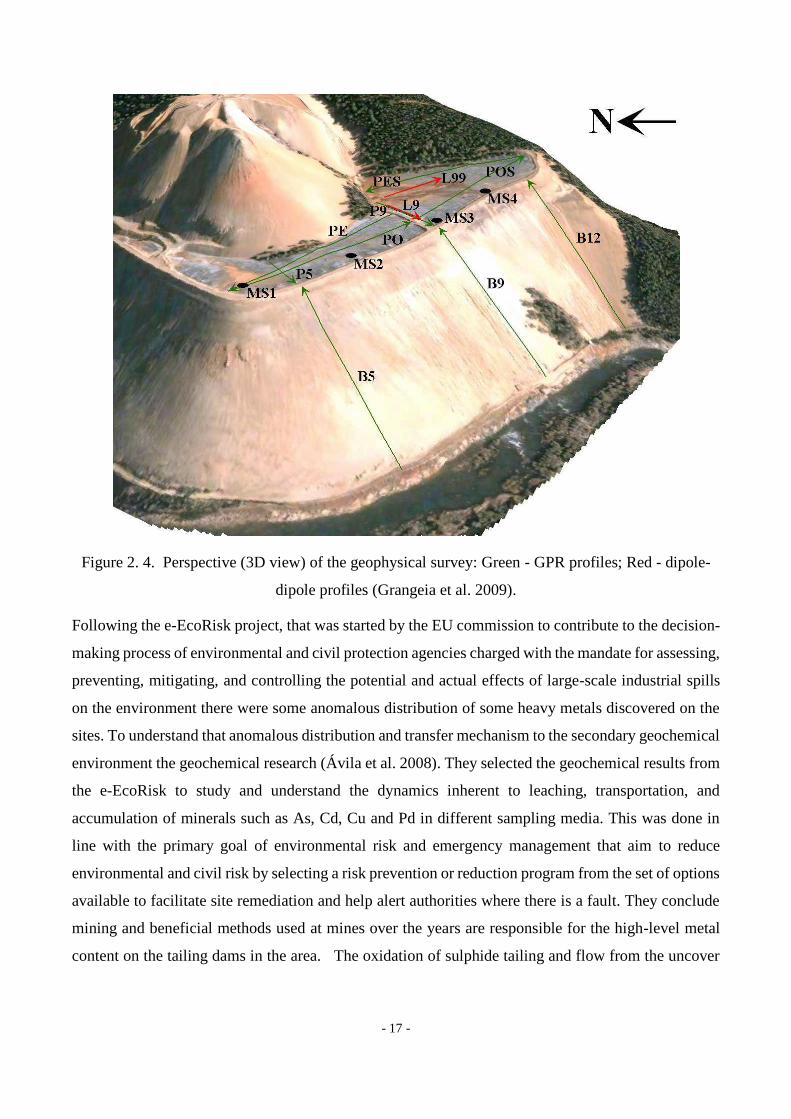
The second major site investigation done at Rio site was the geophysical survey consisted on Ground
Probing Radar (GPR) profiling and Electrical Resistivity Tomography (ERT) was carried out by
Grangeia and Matias (2003). The objective was to investigate the physical properties and supporting
structure of the tailing dam. This technique was chosen based on the literature to delineate geometrical
features and near-surface heterogeneities, to detect seepage paths for safety evaluation and to provide
data to be compared with geochemical data (Campbell and Fitterman 2000, Panthulu, Krishnaiah, and
Shirke 2001, Poisson et al. 2009, Sjödahl, Dahlin, and Johansson 2005, Van Dam et al. 2005, Vanhala
et al. 2005). The geophysical survey layout is shows on Figure 2.4. ERT data were acquire with the
Syscal R1 Plus resistivity meter with the dipole-dipole array, ten meters electrode separation and a
maximum dipole separation factor of eight and inverted by using the Res2div ver.3.4 of geotomo
software. The ERT data were used to investigate heterogeneities in the mud impoundment materials,
as well as, to locate schist bedrock under the tailings. While the GPR data that were used to determine
the thickness of the tailings and to locate eventual supporting structure were obtained by using the
PulseEkko IV with a 100 MHz unshielded antenna was the equipment (Grangeia and Matias 2003).
The results of the GPR was able to map shallow subsurface stratigraphy in the mud impoundment and
tailing slopes as well as to distinguish bounding surface and horizontal bedding. On the other hand,
the results of the ERT was capable to shows the bedrock limits on the mud impoundment. Based on
the interpreted of the survey the dam was seen an environmental threat in case its failure due to a
massive amount of mud in tailing, a low resistivity that assumes due to the higher water content and
too fine particles.
- 17 -
Figure 2. 4. Perspective (3D view) of the geophysical survey: Green - GPR profiles; Red - dipole-
dipole profiles (Grangeia et al. 2009).
Following the e-EcoRisk project, that was started by the EU commission to contribute to the decision-
making process of environmental and civil protection agencies charged with the mandate for assessing,
preventing, mitigating, and controlling the potential and actual effects of large-scale industrial spills
on the environment there were some anomalous distribution of some heavy metals discovered on the
sites. To understand that anomalous distribution and transfer mechanism to the secondary geochemical
environment the geochemical research (Ávila et al. 2008). They selected the geochemical results from
the e-EcoRisk to study and understand the dynamics inherent to leaching, transportation, and
accumulation of minerals such as As, Cd, Cu and Pd in different sampling media. This was done in
line with the primary goal of environmental risk and emergency management that aim to reduce
environmental and civil risk by selecting a risk prevention or reduction program from the set of options
available to facilitate site remediation and help alert authorities where there is a fault. They conclude
mining and beneficial methods used at mines over the years are responsible for the high-level metal
content on the tailing dams in the area. The oxidation of sulphide tailing and flow from the uncover
- 18 -
impoundment are the primary source of pollution in the area this was evidence by the anomalous
contents of Ag, As, Bi Cd, Cu, Zn, Sn, and W downstream.
Following those three investigations, there was a study by Grangeia et al. (2009) that investigate and
integrate the results of the above-mentioned investigation study, and this was done to further increase
the understanding of Rio tailing on the environment, compare and correlate the results to understand
the risk of that deposition. What is significant in this approach was the visualisation of the data in the
3D models of various variables to understand and compare they correlation. Apart from the results
from the earlier study other location were also sample and located with the GPS and they coordinate
were recorded and converted to the UTM coordinate to correspond to the true location for modelling
purpose. They result indicate that the geophysical has high resolution than a geochemical model. The
area of very low resistivity near the interpreted bedrock and coincident with a steep, mud fulfilled and
not permanent stream. While the high resistivity area was above low resistivity on the L9 ERT
resistivity section. Due to the complex geophysical and geochemical properties of the tailing dam along
the external influence, they indicate that the tailing dam has a high risk to the environmental due to the
difficulty to acquire the data to predict resistivity response signature.
To characterise the surfaces water chemical along the Zêzere river and predict the precipitation
minerals the geochemical research was done by (Ferreira da Silva et al. 2013). Surface water samples
were collected at selected location to evaluate the influence of the tailings and ADM on the nearest
streams as well as the way it contaminated the main Zêzere river through diffusion. The results shown
that the AMD discharge from the Rio tailing has pH low as 3 and high metal concentrate (As and Fe)
those depleted downstream from the ADM once As absorbs, coprecipitate and form various
compounds with iron oxyhydroxides. Other minerals such as melanterite and minor amounts of
rozenite and szomolnokite were observed on Rio tailing basement. They conclude that even there are
no aquifer systems on the studied are if any failure of the dam can lead to a major catastrophic to the
reserve dams and ecosystem as completely.
To understand the environmental impact due to tailing dams on the nearby towns a geochemical
investigation was carry out on S. Francisco de Assis, an agricultural village located between Barroca
Grande and Rio tailing with about 700 inhabitants. The goals of this study were to assess toxic metals
associations, determine the associated between the potential toxic elements and their spatial
distribution, to identify the possible contamination sources, and assess the risk of the threat of toxic
elements to the local communities of S. Francisco de Assis when ingestion of vegetables that grow in
their village. To achieved the goals of the field sampling were collected from rhizosphere samples,
- 19 -
vegetable (Solanum tubersum sav and Brassica olerácea L.) which are the significant part of the
community food, irrigation water and road dusts samples in privates’ residences. All the vegetable
samples analyses were reported to be contaminated by having a high ratio of arsenic, cadmium, and
lead, while the proportion of copper, zinc and magnesium was low to the guideline and above even the
proposed level by the FAO/WHO. The level of metal and metalloid in the water was low and
acceptable based on the Portuguese law but the water pH was slightly acidic. Based on the Ontario
guidelines, the level of Arsenic in the rhizosphere was recorded more, 20 times high than the
agricultural reference, which is 11 mg kg-1. The dust samples analysed exceed also the reference
acceptable risk and maximum acceptable values of As, cd, Cu, and Zn. The Wind and hydrological
factors were classified as the responsible factors on the transportation mechanism of elements from
the source's water been the medium while the soil is retention media. They conclude that the residences
are exposed to health risk through the intake of toxic elements mainly arsenic, cadmium and lead by
consuming their vegetables, which grow in their yard (Ávila, da Silva, and Candeias 2016, Candeias
2013, Ferreira da Silva et al. 2013). When the geochemical results and environment risk assessment
was done based on the risk assessment code Ag, Cd, Cu, and Zn were classified as high-risk chemical
while As as medium risk minerals (Candeias et al. 2015).
In general, all the researchers have come to the same conclusion that Barroca Grande tailing and Rio
tailing are the major source pollution and contamination to the Zêzere river and the entire environment
through AMD and contamination as well as contain very high concentrate toxic metal suspension. The
continuity of mechanical and chemical dispersion at the dams is evidence of ongoing problem that
continue affecting the district. The Rio tailing dam is estimated to have an average grades
mineralisation as followed: 4000 ppm for W, 6 800 ppm for Zn, 2 494 ppm for Cu and 76 350 ppm for
As. Another major concern raised is the stability of the Rio dam due to the poor geophysical structure
understanding of the dam and the climate influence such as heavy winter rainfall and hot summer.
Even through a lot of study and investigation has been carried out to define the impacts and threats
poses by the Panasqueira and open-air impoundments (Barroca Grande and Rio tailings) to the Zêzere
river and environmental a little has been done to solve this majesty. Apart from the arsenopyrite
stockpile (~9 400 m3), that was capped with geotextile and layers of clay in June 1996 (e-EcoRisk
2007).

- 20 -
2.3. Mining computer application in mining planning and design
In the past 60 years or so quantifying mineral resource, planning and design of mine operations it has
never been a simple stuck but rather than a stressful, labour intensive, costly and time consumer,
estimation, and design errors. All those has been due to massive data handling or lack of data, lot of
paperwork and misplacing of information that is needed for decision making to extract minerals or
abandoned it or even plan they deposition of facilities such as tailing dams. This situation has been
discharging and many mining problems have been abandoned results on major challenges found today.
One of the examples cited by Lane (1999) was the feasibility study of Palabola open pit mine at
Palabola mine, a copper operation that also operates a smelter and refinery complex based in the town
of Phalaborwa, in South Africa. It is on the record that three engineers carry out a feasibility; on which
two were working on site at Phalaborwa while the one in Johannesburg, the distance between them is
500 km. They manually created a detailed polygonal model of the ore body and drew up plans and
section that shows the grades of the polygon. From those plans and section together with planimeter
and calculators, they were able to estimate the tonnages and grade for the first trial pit and then for a
second trial before selected the final ultimate pit. This entire process is known to take them at least
about two years and it was done on single cut-off grade because if they could have to try more than
one grades it will take again a long time, costly and a lot of documentation.
But in recently years the advance in computer technology and mathematic knowledge it results on
computer technology become powerful tools in mining industry as they are provided benefits to
consider several majors factors those influence mining project outcome, efficient mine planning and
management information systems for dynamic judgement. In facts, computer application has made it
possible to obtain high accurate and superior quality results at high speed. Several companies have
developed mining computer application in this case belief summary about one other well develop and
common use software in the mining industry will be discussed below.
2.3.1. Maptek Vulcan software
This section gives a general overview of the mining computer application used in this study to create
the geological model and mineral reserve evaluation as whereas the mine planning production. Maptek
Vulcan is a dynamic graphical three-dimensional (3D) Modelling and Mine Planning Software,
developed by Maptek Ltd in Australia. It was chosen for this purpose due to it availability at the
University for the Students for training and its ability to validate and transform raw mining data into

- 21 -
dynamic 3D models, which are accurate for operations plans and mine designs base on the literature.
Generally, Maptek Vulcan is one of the few mining computer applications available today on the
market that can start using from exploration and geological modelling, mine design and development,
mine operations, optimisation and scheduling down to the final stage mine closure and rehabilitation
((Maptek 2012)). The complete software is developed by using advance mathematical and statistical
algorithm modelling and integrated tools mainly from the survey, drill and blast, grade control,
geotechnical analysis, geostatistics, and Lerch & Grossmann for optimisation.
Vulcan is user-friendly software that allows the construction models, data management and validation
database those directly created from historical records, drillholes and sampling logging, geophysical,
lithological data, digital and GIS data with a minimum need of digitisation. This mining application
has gone through a different revolution since it first development when it was a mini software to a
dynamic application that can manage and visualise very large and complex data sets, coordinate the
information and generate models at high speed. Vulcan is current applied in mining operations from
geological modelling of resources and mines design until mine closure and restoration without
discontinuity system by simply dynamic updating plans as data change. The software is available in
eight Bundle package that can be purchase depend on user need or operation stage, and the Bundle are
further divided into four modules or more.
2.3.2. Mine design and Planning using Vulcan
Normally mining is referred only to the extraction of minerals from the earth crust but, mining is the
process that starts from the characterization of minerals deposit (morphology, mineralogy, texture,
physical, chemical, and environmental) after that it is when the planning of the extraction can begin.
The planning of the minerals extraction usually depends on the mining method selected and the
equipment to use but all are controlled by the deposit size and depth. The similar approach that is used
to design the open pit mine or a mountain mine is also applicable to the used to planning and designing
methods to mining extraction from manmade deposit tailings materials (valuable minerals). Vulcan is
like other common mining computer applications that follow the traditional mining operation activities
from the exploration, development, operation and production schedule and rehabilitation. In the
following section, each major step will be discussed in the context of Vulcan:
Database construction: the process starts with the construction of the databases that will contain at
least three main general data set mainly from the either topographic survey, exploration (geochemical
and geophysical survey), visualisation of the survey and/or geological and hydrogeological modelling.
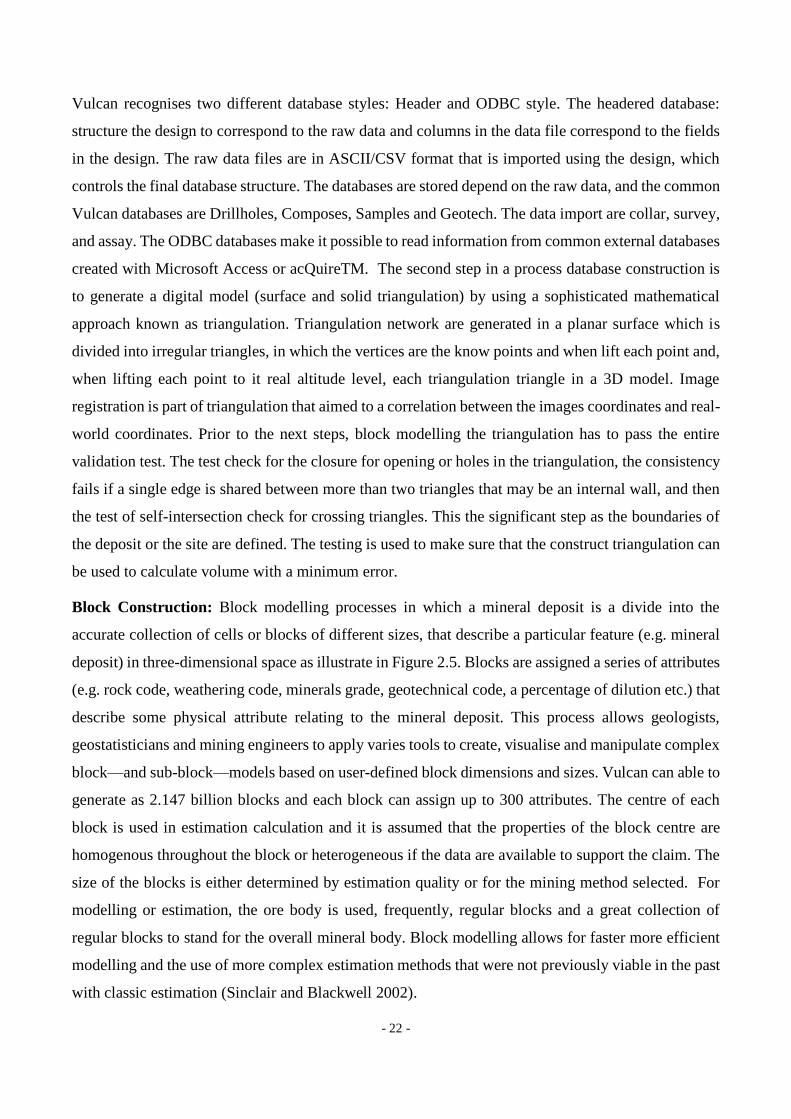
- 22 -
Vulcan recognises two different database styles: Header and ODBC style. The headered database:
structure the design to correspond to the raw data and columns in the data file correspond to the fields
in the design. The raw data files are in ASCII/CSV format that is imported using the design, which
controls the final database structure. The databases are stored depend on the raw data, and the common
Vulcan databases are Drillholes, Composes, Samples and Geotech. The data import are collar, survey,
and assay. The ODBC databases make it possible to read information from common external databases
created with Microsoft Access or acQuireTM. The second step in a process database construction is
to generate a digital model (surface and solid triangulation) by using a sophisticated mathematical
approach known as triangulation. Triangulation network are generated in a planar surface which is
divided into irregular triangles, in which the vertices are the know points and when lift each point and,
when lifting each point to it real altitude level, each triangulation triangle in a 3D model. Image
registration is part of triangulation that aimed to a correlation between the images coordinates and real-
world coordinates. Prior to the next steps, block modelling the triangulation has to pass the entire
validation test. The test check for the closure for opening or holes in the triangulation, the consistency
fails if a single edge is shared between more than two triangles that may be an internal wall, and then
the test of self-intersection check for crossing triangles. This the significant step as the boundaries of
the deposit or the site are defined. The testing is used to make sure that the construct triangulation can
be used to calculate volume with a minimum error.
Block Construction: Block modelling processes in which a mineral deposit is a divide into the
accurate collection of cells or blocks of different sizes, that describe a particular feature (e.g. mineral
deposit) in three-dimensional space as illustrate in Figure 2.5. Blocks are assigned a series of attributes
(e.g. rock code, weathering code, minerals grade, geotechnical code, a percentage of dilution etc.) that
describe some physical attribute relating to the mineral deposit. This process allows geologists,
geostatisticians and mining engineers to apply varies tools to create, visualise and manipulate complex
block—and sub-block—models based on user-defined block dimensions and sizes. Vulcan can able to
generate as 2.147 billion blocks and each block can assign up to 300 attributes. The centre of each
block is used in estimation calculation and it is assumed that the properties of the block centre are
homogenous throughout the block or heterogeneous if the data are available to support the claim. The
size of the blocks is either determined by estimation quality or for the mining method selected. For
modelling or estimation, the ore body is used, frequently, regular blocks and a great collection of
regular blocks to stand for the overall mineral body. Block modelling allows for faster more efficient
modelling and the use of more complex estimation methods that were not previously viable in the past
with classic estimation (Sinclair and Blackwell 2002).

- 23 -
Figure 2. 5. Block Model Concept (Milawarma 1995)
Compositing: Prior to the block estimation or grade estimation, the next steps is compositing.
Compositing term in mineral resource evaluation is refer to the procedure by which the values of
adjacent samples from boreholes are combine so that the value of the longer down-hole intervals can
be assess. The grade of each new interval is calculate based on the weighted average of the original
sample value. The objective of this is to remove sampling bias as a precursor to grade estimation in
block modelling and the effect of smoothing assays across drillholes and to produces ore body
intersections, either lithological composites or grade composites. Vulcan has six compositing
approaches are Straight, Run Length, Bench, Intersect Select and Geology (lithology). Geological
interpretation and exploration of data (pure statistical analysis) are carry out to prepare the data for
estimation and determine the best estimation techniques that can applied on the next stage blocks
estimation grade after compositing.
Grade Estimation: Block estimation or Grade estimation per block in Vulcan is the process of
interpretation values from a database or file into the block model. Grade estimation can be done by
using either simple traditional such as nearest neighbour inverse distance and advance geostatistics
estimation techniques such as simple kriging, and ordinary kriging, indicate kriging, indicate
simulation and uniform conditioning. The geostatistical estimation uses sample points taken at distinct

- 24 -
locations in a landscape and creates (interpolates) a continuous surface The Geostatistical estimator
provides two groups of interpolation techniques: deterministic and geostatistical. All methods rely on
the similarity of nearby sample points to create the surface.
Reserve Estimation: Upon complete the block grade estimation, the following step is Block Reserves
Estimation. Block reserves are calculated according to the parameters set in the early from the file
(solid triangulation and polygons). Vulcan has an option either to use the General Reserves, Polygon
or Advance Reserves approach. The general option is the simplest approach that allows reserves
calculation for up to six variables, using multiple block selection, grade cut offs and reports breakdown
by zone. The Polygon is similar to the General option except that it uses triangulations projection from
polygon to define the block selection criteria. Advance Reserves option allows for more complex
reserves calculation. Multiples triangulations may be reserved simultaneously and customised report
is generate based on these values. Block reserves are to be calculated restricted by regions that are
represent by solid triangulations or triangulations that are project from polygons.
Once estimation revealed throughout this dissertation, it will largely be used about the estimation of
grades and tonnages. This because estimation also used to estimate other spatially distributed property
such as rock-type, density, porosity or contaminant concentration.
Mine design and optimisation: Once the blocks grade and reserves estimation is completed and
validate the next step is to design the pit or mine and carry out the pit optimisation. Vulcan Pit design
tools are very powerful as they can be used to create modify open pit, leach pad, dump and stockpile
strings. Pit Optimisation tools allow one to define the optimal pit limits of an ore body based on the
predefined constraints. The two 3D advanced algorithms of optimisation as Lerchs & Grossmann and
the floating Cone algorithm. The tool allows the values to calculate manuals or automatically and is
flexible when applying costs to optimisation.
Those major steps followed in the process of planning and design mines using Vulcan software by
using the data that acquire from the different sources as mention already.

- 25 -
CHAPTER 3: REMINING AND RESTORATION
ACTION PLAN
3.1. Introduction
This chapter will present and elaborate in general fashion; the steps that have been followed in the case
of planning and design the extraction of the tailing reserves at Rio tailing dam. The chapter is divide
into five main section with each sub-section. The steps corresponding to the objectives of the project
starts with the data collection and processing, tailing model block modelling, tailing resource
estimation, exploitation planning and design, and finally reshaping and restoration plan. The general
purpose of this chapter is to provide details of the word breakdown carried to achieve the objectives
of the project with the aid of the Vulcan mining software.
3.2. Data collection and Processing
To achieve the objectives of this study the set of information and data required to be collected in a
different format and from different sources to construct a tailing model of the site in Vulcan software.
The nature of the data used in the construction of the geological model and mine design are very
comprehensive and the processing of the data to be acceptable for import into any software is essential.
Therefore, in this section a brief description of the data collection from various source and the
modification implemented on the data prior to the modelling and extraction design will be present here.
Three data sets collect and used for geological model construction and design are named as: 1955
contour map was assumed as a base topography map data source for the original surface triangulation,
geochemical samples analysis data for the geological characterisation and drone survey data for surface
tailing dam triangulation. All the samples location coordinates were georeferenced.
3.2.1. Base topography map -T1955DATA
The tailing block model was constructed with the digitize base topography map data of the site
corresponding to the contour map of the site of February 1955, obtained from the Beralt Tin and
Wolfram (Portugal) S.A. The 1955 base topography map that refers as the original site topography
map was required to provide the information on how the site topography was initial before the
deposition of the tailing materials. The map used in this study was the Surface Plan - Contour map for
Panasqueira Planta de Superficie - Couto Mineiro da Panasqueira) drawn at the scale of 1: 10 000, and
dates back as February 1955 (Figure 3.1). Since that, the map provided in JPG format and this format
- 26 -
does not immediately integrate directly into the model but it was imported into the ArcGIS/Vulcan for
digitising to generate contour lines and points. The data generated was able to create a database with
the information stored as a point data file with three attributes: Easting(X), Northing (Y) and Elevation
(Z) in meters, and stored in a LASer (las) file format as final input into Vulcan software (Figure 3.2).
In total 3 992 points were digitised and used to create the 1955 Surface Triangulation (1955ST). The
data were digitised and transform into an ETRS 89-PTTMO: EPSG: 3 763 coordinate systems as the
georeferenced system.
Figure 3. 1. Original part of the contour map – February 1955 (Source: Beralt Tin and Wolfram Ltd)
3.2.2. Geochemical analyses data
The geochemical data record used for this study corresponds two the investigation was undertaken:
2002 - Core drilling sampling and 2016/7 - Bulk sampling. Below two geochemical data set are
discussed to provide the information on how the data were acquire and used.
3.2.2.1. Core drilling samples data
Between the 22 May 2002 and 10 July 2002, unsystematic 6 boreholes were drilled to recover core
samples by using a Bonne Esperance probe by IGM (Instituto Geológico e Mineiro) at Rio Tailing
dam. They are shown in Figure 3.3 as DH_1 to DH_6 as presented in Table 3.1 with it details.

- 27 -
Figure 3. 2. Digitised base topography contour line – February 1955
The objectives were to recover the core samples that can be investigated for geotechnical and
hydrological behaviour for stability and environmental concern. In total 36 samples were extracted
from the core drill samples and they were chemical analyses in which 18 (3 per hole) were analyses in
2002 at BERALT Laboratory and the other 18 were analysis in 2005 at IGM-INETI.
The complete geochemical data acquisition process and results are elaborated by (Ávila et al. 2008,
Dinis da Gama 2002, Grangeia et al. 2011) in this case the author will present only a short analysis
procedure and equipment’s used as it is significant to understand it.
At IGM-INETI the X-Ray Fluorescence (XRF) was used to analysing S and W while As, Cu, Zn and
other elements were analysed by conductive plasma emission spectrometry (CPES). The reason the S
and W were analysed with the XRF is due high stability and accuracy analysis of the XRF compare to
the CPES). Reference materials (SO1, SO2, SO3, SO4, FER1, FER2, FER3, and FER4 from the
Canadian Centre for Mineral and Energy Technology; PACS-1 from NRS26 CNRC; and 2711 from
NIST) were used to determine the accuracy and analytical precision by duplicate samples in each
analytical set. The confidence limits were calculated to be within the 95 % confidence limits of the
recommended values given for this certified samples materials while the standard deviation was
between 5 and 10 % (Grangeia et al. 2011). The complete results table of the interest minerals for this
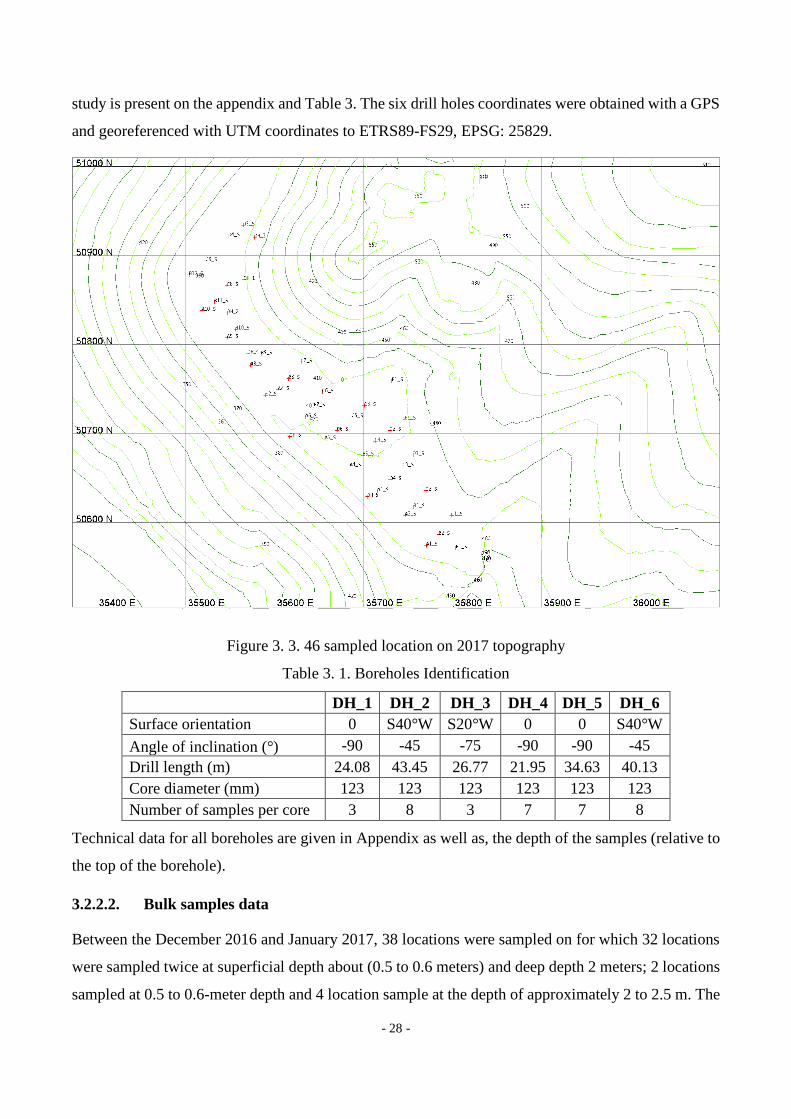
- 28 -
study is present on the appendix and Table 3. The six drill holes coordinates were obtained with a GPS
and georeferenced with UTM coordinates to ETRS89-FS29, EPSG: 25829.
Figure 3. 3. 46 sampled location on 2017 topography
Table 3. 1. Boreholes Identification
DH_1 DH_2 DH_3 DH_4 DH_5 DH_6
Surface orientation 0 S40°W S20°W 0 0 S40°W
Angle of inclination (°) -90 -45 -75 -90 -90 -45
Drill length (m) 24.08 43.45 26.77 21.95 34.63 40.13
Core diameter (mm) 123 123 123 123 123 123
Number of samples per core 3 8 3 7 7 8
Technical data for all boreholes are given in Appendix as well as, the depth of the samples (relative to
the top of the borehole).
3.2.2.2. Bulk samples data
Between the December 2016 and January 2017, 38 locations were sampled on for which 32 locations
were sampled twice at superficial depth about (0.5 to 0.6 meters) and deep depth 2 meters; 2 locations
sampled at 0.5 to 0.6-meter depth and 4 location sample at the depth of approximately 2 to 2.5 m. The
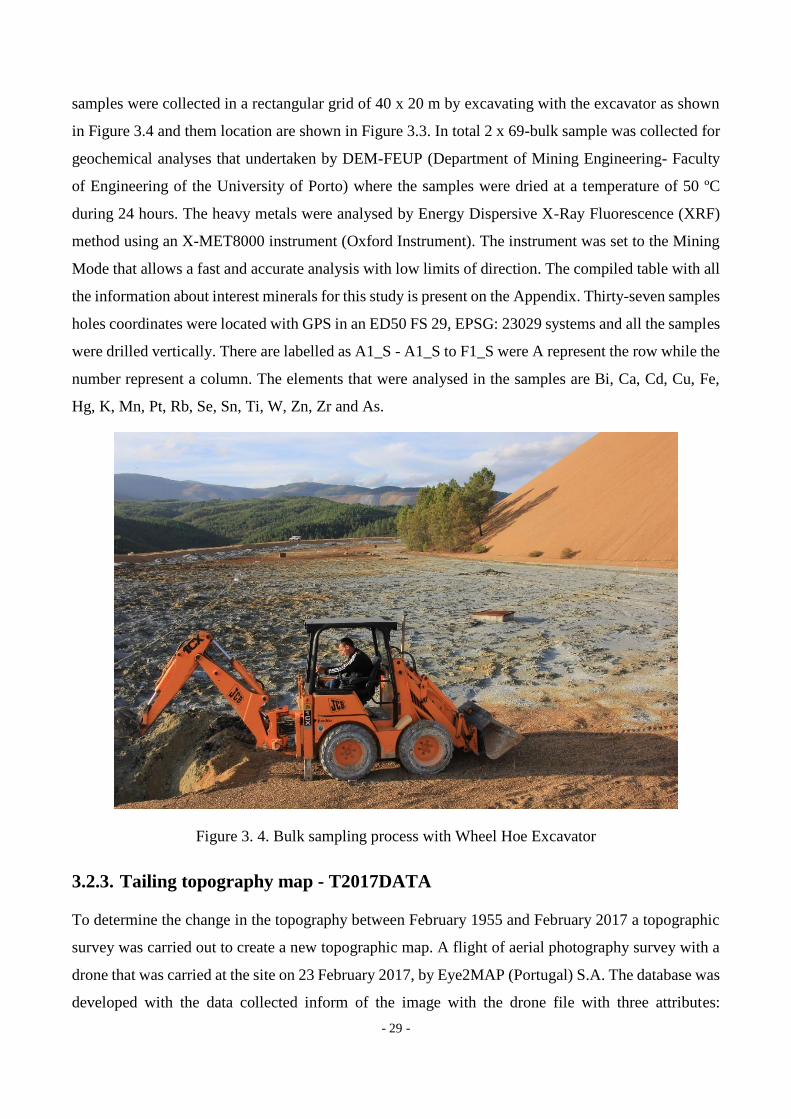
- 29 -
samples were collected in a rectangular grid of 40 x 20 m by excavating with the excavator as shown
in Figure 3.4 and them location are shown in Figure 3.3. In total 2 x 69-bulk sample was collected for
geochemical analyses that undertaken by DEM-FEUP (Department of Mining Engineering- Faculty
of Engineering of the University of Porto) where the samples were dried at a temperature of 50 ºC
during 24 hours. The heavy metals were analysed by Energy Dispersive X-Ray Fluorescence (XRF)
method using an X-MET8000 instrument (Oxford Instrument). The instrument was set to the Mining
Mode that allows a fast and accurate analysis with low limits of direction. The compiled table with all
the information about interest minerals for this study is present on the Appendix. Thirty-seven samples
holes coordinates were located with GPS in an ED50 FS 29, EPSG: 23029 systems and all the samples
were drilled vertically. There are labelled as A1_S - A1_S to F1_S were A represent the row while the
number represent a column. The elements that were analysed in the samples are Bi, Ca, Cd, Cu, Fe,
Hg, K, Mn, Pt, Rb, Se, Sn, Ti, W, Zn, Zr and As.
Figure 3. 4. Bulk sampling process with Wheel Hoe Excavator
3.2.3. Tailing topography map - T2017DATA
To determine the change in the topography between February 1955 and February 2017 a topographic
survey was carried out to create a new topographic map. A flight of aerial photography survey with a
drone that was carried at the site on 23 February 2017, by Eye2MAP (Portugal) S.A. The database was
developed with the data collected inform of the image with the drone file with three attributes:

- 30 -
Easting(X), Northing (Y) and Elevation (Z) in meters. The elevation assumes the Z to be on the surface
of the deposited tailing materials and it was considered as positive. These data points were then used
to create the new map and tailing dam triangulation, which refers as the 2017 surface triangulation
(2017ST). The information in the database for developing the model is stored as a point data see the
appendix. In total 36 998 584 points were recorded and used to create the topography map (Figure 3.5)
that creates the 2017 Surface Triangulation with Vulcan. The drone data for the topography were
obtained in an ETRS 89-PTTMO: EPSG: 3763 coordinate systems.
Figure 3. 5. Scan topography contour line – February 2017
To determine the volumetric, change the two-surface triangulation were merged to create a solid
triangulation by Boolean them to calculate the volumetric difference between the 1955ST and 2017ST
Solid triangulation.
3.2.4. Summary statistical analysis with Excel
The summary statistical analysis data of the 5 minerals taken into consideration for this study as it was
calculated using Microsoft excel to help us measure central tendency, the dispersion, skewness and
kurtosis of the two campaigned is presented in Table 3. 2.

- 31 -
Table 3. 2. The geochemical analysis results for five minerals studied.
3.2.5. Coordinate system conversion
When focusing on the data availability and quality of the measurements several factors must be
considered. Because the data and information used in this study were, extract from various source and
they were obtained at separate times with different objectives as well as the different
equipment/instruments it ends up that all data set were having they own different geographical
coordinate system as shown in Table 3.3. To achieve the objective of this study and the data to be
accurate to the reflect the true location sampled all the coordinate data were converted to a single
geographical coordinate system by using the Maptek I-Site Studio to the PTTM06 of the ETRS89
datum coordinate system. I-Site Studio is an intuitive point cloud processing package for Maptek
company and is used to Manage and define coordinate systems, including local mine grid coordinates,
and easily transform data between systems.
Table 3. 3. The original coordinate system of the data
String Coordinate system Code EPSG
Drone data ETRS89 PTTM06 of the ETRS89 datum 3763
GPS-2001 data ETRS89UTM UTM-29N of the ETRS89 datum 25829
GPS-2017 data ED50 1950 UTM FS29 23029
MAP-1955 data ETRS89 PTTM06 of the ETRS89 datum 3763
As Cu Fe W Zn
Sum 1227.09 41.36 1795.99 30.84 113.47
Minimum (%) 0.31 0.01 0.00 0.03 0.00
Maximum (%) 24.00 1.16 31.28 0.87 23.00
Range (%) 23.69 1.15 31.28 0.84 23.00
Mean (%) 11.80 0.40 17.27 0.30 1.09
First quartile 8.48 0.16 5.60 0.16 0.24
Third quartile 16.08 0.56 26.98 0.41 1.40
Standard Error (%) 0.62 0.03 1.10 0.02 0.22
95% confidence interval 1.22 0.05 2.18 0.03 0.44
99% confidence interval 1.62 0.07 2.88 0.05 0.58
Sample Variance (%) 39.58 0.07 125.64 0.03 5.11
Standard Deviation (%) 6.29 0.26 11.21 0.18 2.26
Coefficient of variation 0.53 0.66 0.65 0.59 2.07
Skewness -0.39 0.53 -0.54 0.38 9.00
Critical K-S sat. alpha = .05 0.13 0.13 0.13 0.13 0.13
Number of values 104.00 104.00 104.00 104.00 104.00

- 32 -
3.3. Modelling of Rio Tailing Dam
The first objective of this study was to construct a realistic tailing resource model for Rio tailing dam
for further exploitation planning and extraction design with the facilitation of Vulcan software. The
resource model was created through three main stages: data acquisition and management, geological
modelling, and the block modelling the general procedures will be presented below. Firstly, the drill
holes data were prepared in the Microsoft excel comma-separated values format before they were
imported into Vulcan for the block modelling process. The Vulcan Modeller used on the construction
of the block model are Mine Modeller Open Pit with the added tools from the such as Vulcan
GeostatModeller, Vulcan GeoModeller, and Survey.
3.3.1. Data Management and Structure
The database structure used in Vulcan is a common hierarchical or tree structure that consists of two
databases, namely: the Isis Database and Design Graphics Database. The Isis database is composed of
two files, which is: the index file (.isix) and the database file (.isis). The index file that is used to store
the drillholes, lithological, assay analytical, geophysical, survey and geochemical in form of Data
System File (*.dsf). Then depending on the type of the data contained in the database, they are denoted
by the file extension: Isis Database (.isis) and Design Graphics Database (.dgd).
In the Isis Database, design is recorded into the database as a header format, hence an Isis database is
also called a Headered database, which this is the database where data imported are managed. The
Headered Template design is an optimised Isis design that is used for drillholes, samples, geotechnical
and composition information. The Isis database provider store benefits on the data from the drillhole,
geophysical, lithogical and analytical analysis to be managed, to identify targets and preliminary
resources, and to test and validate. It also provides drill holes plotting, grinding, counting, and 3D
visualisation.
The Vulcan Explorer database (Design Graphics Database) has also two different database styles: the
Headered and the ODBC. The database files are containers within the appropriated folder, whereby
each of the databases contain the Design and the Objects. The design container comprised of the
database design file that describes and enforces the structure of the database, it specified how many
tables the databases containers, the name of those tables, and number and type of field contained within
each table, while the objects sub-folder lists every drillhole record in the database.
.
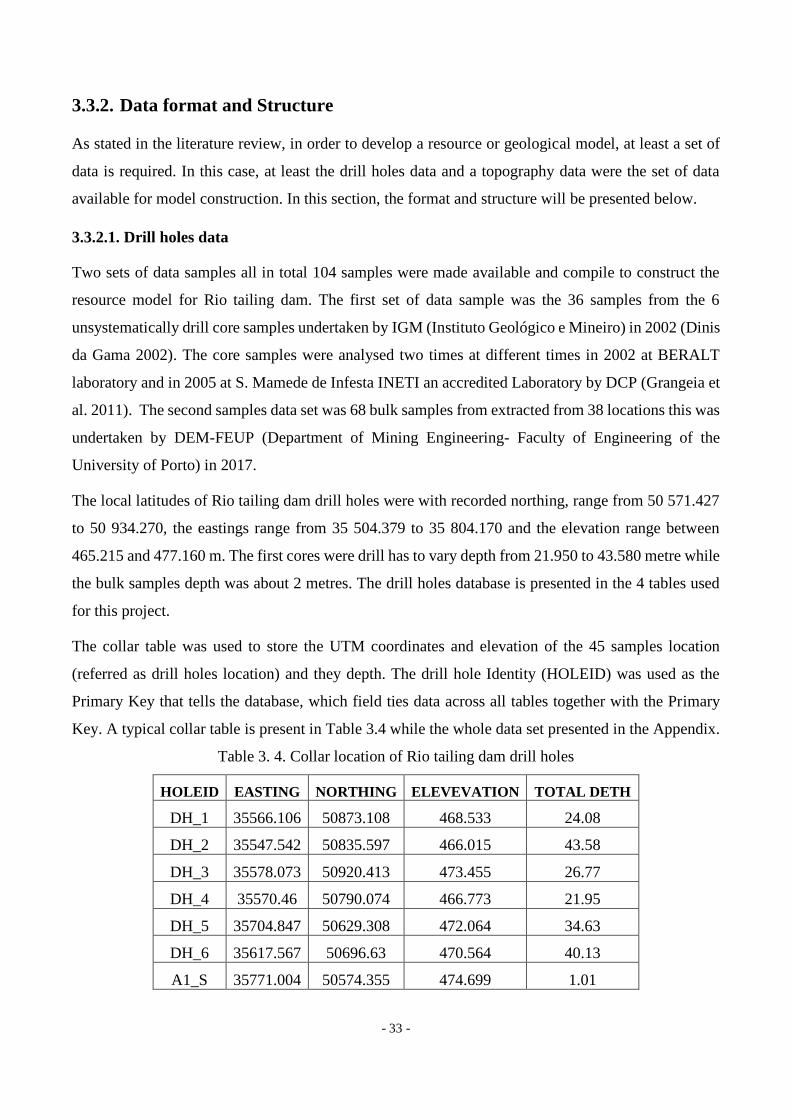
- 33 -
3.3.2. Data format and Structure
As stated in the literature review, in order to develop a resource or geological model, at least a set of
data is required. In this case, at least the drill holes data and a topography data were the set of data
available for model construction. In this section, the format and structure will be presented below.
3.3.2.1. Drill holes data
Two sets of data samples all in total 104 samples were made available and compile to construct the
resource model for Rio tailing dam. The first set of data sample was the 36 samples from the 6
unsystematically drill core samples undertaken by IGM (Instituto Geológico e Mineiro) in 2002 (Dinis
da Gama 2002). The core samples were analysed two times at different times in 2002 at BERALT
laboratory and in 2005 at S. Mamede de Infesta INETI an accredited Laboratory by DCP (Grangeia et
al. 2011). The second samples data set was 68 bulk samples from extracted from 38 locations this was
undertaken by DEM-FEUP (Department of Mining Engineering- Faculty of Engineering of the
University of Porto) in 2017.
The local latitudes of Rio tailing dam drill holes were with recorded northing, range from 50 571.427
to 50 934.270, the eastings range from 35 504.379 to 35 804.170 and the elevation range between
465.215 and 477.160 m. The first cores were drill has to vary depth from 21.950 to 43.580 metre while
the bulk samples depth was about 2 metres. The drill holes database is presented in the 4 tables used
for this project.
The collar table was used to store the UTM coordinates and elevation of the 45 samples location
(referred as drill holes location) and they depth. The drill hole Identity (HOLEID) was used as the
Primary Key that tells the database, which field ties data across all tables together with the Primary
Key. A typical collar table is present in Table 3.4 while the whole data set presented in the Appendix.
Table 3. 4. Collar location of Rio tailing dam drill holes
HOLEID EASTING NORTHING ELEVEVATION TOTAL DETH
DH_1 35566.106 50873.108 468.533 24.08
DH_2 35547.542 50835.597 466.015 43.58
DH_3 35578.073 50920.413 473.455 26.77
DH_4 35570.46 50790.074 466.773 21.95
DH_5 35704.847 50629.308 472.064 34.63
DH_6 35617.567 50696.63 470.564 40.13
A1_S 35771.004 50574.355 474.699 1.01
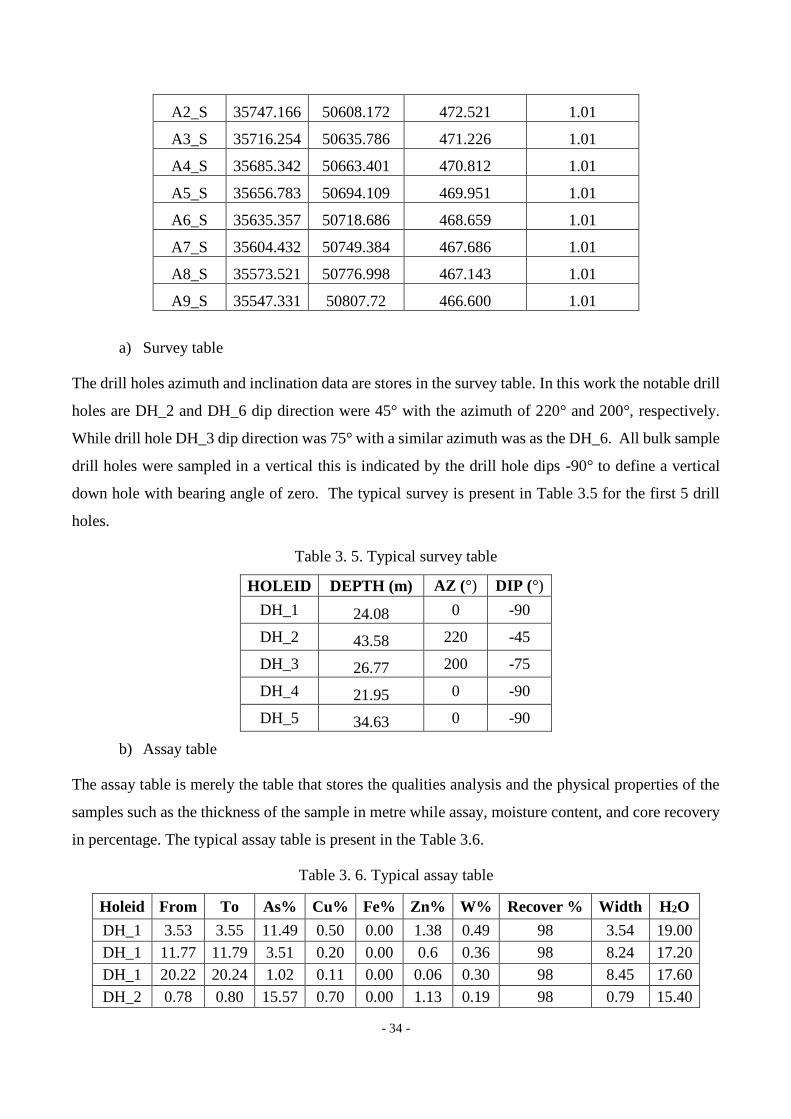
- 34 -
A2_S 35747.166 50608.172 472.521 1.01
A3_S 35716.254 50635.786 471.226 1.01
A4_S 35685.342 50663.401 470.812 1.01
A5_S 35656.783 50694.109 469.951 1.01
A6_S 35635.357 50718.686 468.659 1.01
A7_S 35604.432 50749.384 467.686 1.01
A8_S 35573.521 50776.998 467.143 1.01
A9_S 35547.331 50807.72 466.600 1.01
a) Survey table
The drill holes azimuth and inclination data are stores in the survey table. In this work the notable drill
holes are DH_2 and DH_6 dip direction were 45° with the azimuth of 220° and 200°, respectively.
While drill hole DH_3 dip direction was 75° with a similar azimuth was as the DH_6. All bulk sample
drill holes were sampled in a vertical this is indicated by the drill hole dips -90° to define a vertical
down hole with bearing angle of zero. The typical survey is present in Table 3.5 for the first 5 drill
holes.
Table 3. 5. Typical survey table
HOLEID DEPTH (m) AZ (°) DIP (°)
DH_1 24.08 0 -90
DH_2 43.58 220 -45
DH_3 26.77 200 -75
DH_4 21.95 0 -90
DH_5 34.63 0 -90
b) Assay table
The assay table is merely the table that stores the qualities analysis and the physical properties of the
samples such as the thickness of the sample in metre while assay, moisture content, and core recovery
in percentage. The typical assay table is present in the Table 3.6.
Table 3. 6. Typical assay table
Holeid From To As% Cu% Fe% Zn% W% Recover % Width H2O
DH_1 3.53 3.55 11.49 0.50 0.00 1.38 0.49 98 3.54 19.00
DH_1 11.77 11.79 3.51 0.20 0.00 0.6 0.36 98 8.24 17.20
DH_1 20.22 20.24 1.02 0.11 0.00 0.06 0.30 98 8.45 17.60
DH_2 0.78 0.80 15.57 0.70 0.00 1.13 0.19 98 0.79 15.40

- 35 -
DH_2 22.16 22.18 1.15 0.12 0.00 0.36 0.24 98 21.38 19.80
DH_2 38.91 38.93 1.15 0.08 0.00 0.08 0.27 98 16.75 34.80
c) Geology logging table
The geology table is used to store the lithology, thickness and description of the rock as they were
recorded from the field mapping. Twenty-six core descriptions were used to classify the types of
materials found on the dam based on the six drill boreholes of 2002. The major description is
Ferruginous Crust Yellow, Brown and Red (FCYBR) with 30 values followed by Grey Mud
(GYMUD) with 26 values the remained has between 1 to 6 values. There was some location where
there was no description recorded. This classification was based on the tailing stratigraphy or location
of the sample on the tailing dams. The example of the DH_1 drill hole is presented in Table 3.7.
Table 3. 7. Typical geological table data
HOLEID FROM TO LITH WIDTH CORE DESCRIPTION
DH_1 0.00 3.40 GYMUD 3.40 Grey Mud
DH_1 3.40 3.75 FCYBR 0.35 Ferruginous Crust Yellow, Brown
and Red
DH_1 3.75 4.05 0.30
DH_1 4.05 4.20 FCYBR 0.15 Ferruginous Crust Yellow, Brown
and Red
DH_1 4.20 5.60 GYMUD 1.40 Grey Mud
DH_1 5.60 5.74 FCYBR 0.14 Ferruginous Crust Yellow, Brown
and Red
DH_1 5.74 7.10 1.36
DH_1 7.10 7.50 FCYBR 0.40 Ferruginous Crust Yellow, Brown
and Red
DH_1 7.50 8.50 1.00
DH_1 8.50 8.70 FCYBR 0.20 Ferruginous Crust Yellow, Brown
and Red
DH_1 8.70 10.00 GYMUD 1.30 Grey Mud
DH_1 10.00 10.20 FCYBR 0.20 Ferruginous Crust Yellow, Brown
and Red
DH_1 10.20 11.60 1.40
DH_1 11.60 12.40 FCYBR 0.80 Ferruginous Crust Yellow, Brown
and Red
DH_1 12.40 12.88 0.48
All data table were store in comma-separated values (CSV) file format in tabular data (numbers and
text) in plain text. Files in the CSV format are import to and export from Vulcan programs that store
data in tables, such as Microsoft Excel.

- 36 -
3.3.2.2. Topography data
The topography data are stored in files based on the format as Vulcan has two storage databases the
design database polygon and the triangulation. The design database is a specialise type of Isis database,
which store topography data in format of CAD objects (points, lines, polygons, layers etc.) it is created
within Envisage and the data have a rigid structure with less flexible name convention. Data are stored
in the points table and polylines tables. The point table in the design databases is used to store data as
single coordinate field (easting, northing, and elevation) and those pointes are combined to make up
makes up the polyline. The polyline table is the header table that can be viewed in Isis and it store
general information about the lines, polygon and layer in the Isis database. The polygon data are stored
with the information about the entire polygon that consists of the polygon ID, and the code for the
polygon identification and description as well as the polygon type for either an open or a closed
polygon, and the polygon value.
Triangulations are the highly accurate mathematic representation of the data in 3-dimension that can
be used create complex model or feature from a set of data points, lines, polygon or import in the
Envisage when created by other software such as I-Studio in the DXF or 00t format. There are two
triangulations categories the surface and solid. They differ as the surface is an open 3D representative
of the data while the solid is closed model body. The open refer to the triangulation that has a distinct
edge and does not encompass a volume while the solid triangulation is the opposite of the surface. The
triangulation model is series of 3-dimensions coordinates points and linkages between them, which
form a series of triangulated planes that define a surface or enclose volume and are known to honour
all the points’ data. Some of the triangulation models commonly used in Vulcan are site topography
or terrain model, faulted surfaces, pit shell and ore body models (Maptek 2012). The two surface
triangulation created with the topography data are 2017ST.00t (36 998 584 points) and 1955ST.00t (3
992 points) all the points are represented by three attributes X, Y and Z (easting, northing and
elevation) see the appendix.
The local coordinates of 1955ST.00t that is referred to the surface topography map of 1955 are between
northing 49 941.820 to 51 668.65; easting 35210.700 to 36558.970; and collar elevation from 350.000
to 630.000 m. And for the 2017ST.00t that is referred as the surface topography map of 2017 it
coordinates are between northing 35309.059 to 35893.480; easting 50404.436 to 51224.031; and collar
elevation from 352.136 to 561.219 m. These data are provided on the filename as Base topography
data - T1955DATA.csv and Tailing topography data - T2017DATA.txt, respectively.

- 37 -
3.3.3. Rio Project setup
After the data were gathered and organised on the structure that is supported by the Maptek Vulcan
software the Project File (DG1) was set-up by first defining the project extends (boundaries) to create
a work Area of the project. The project perimeter was determined with the minimum and maximum
values of easting and northing plus a buffer space to create enough space around data for design and
manipulation, which is actually the boundary working area of the project. In this study, the DG1 extents
parameter that was used is present on Figure 3.6 with the project name RIOZMUDDAM as taken from
Vulcan. The project coordinates are in metre and the default display grid was used even though the all
data were converted to the PTTM06 of the ETRS89 coordinate system.
Figure 3. 6. Rio mud dam project coordinate extents
3.3.4. Import drillholes and triangulation data
3.3.4.1. Entering data
There are various ways to transfer data into Vulcan. In this case, the direct import option of data
between the Vulcan and Microsoft Excel was used to enter the drill holes data into Vulcan Envisage.
This is the simplest and effective way to move in the drillhole information into the Vulcan Isis drillhole

- 38 -
database. Since that, the data were organised on the CSV format files they were imported into the CSV
database file type as illustrated in Figure 3.7. Due to the structures hierarchical structure of the Isis
database the lower tables is required to have an index field link the upper table that defined Data file
to Record connection dialogue, in this case, the collar CSV was used as the Header table and the HoleId
was select as an Index field of all the tables (Maptek 2012). The drill holes database created was viewed
in Isis to ensure that the data imported were acceptable for the work. This was done by launching the
Isis database and opening the database through the Vulcan Explorer. The database is sorted by drill
hole that represent sampled locations and each hole has several associated tables imported.
Figure 3. 7. Import CSV file into a new database
Topography files were imported directly in Vulcan Explorer by merely copying the folder/file from I-
Studio and paste them in the project design folder/file. The other option used was by using the toolbar
Model option then list all the triangulation in the computer and load them on the Vulcan Explorer and
Drag-and-drop them into Envisage displayer to view them and validate them.
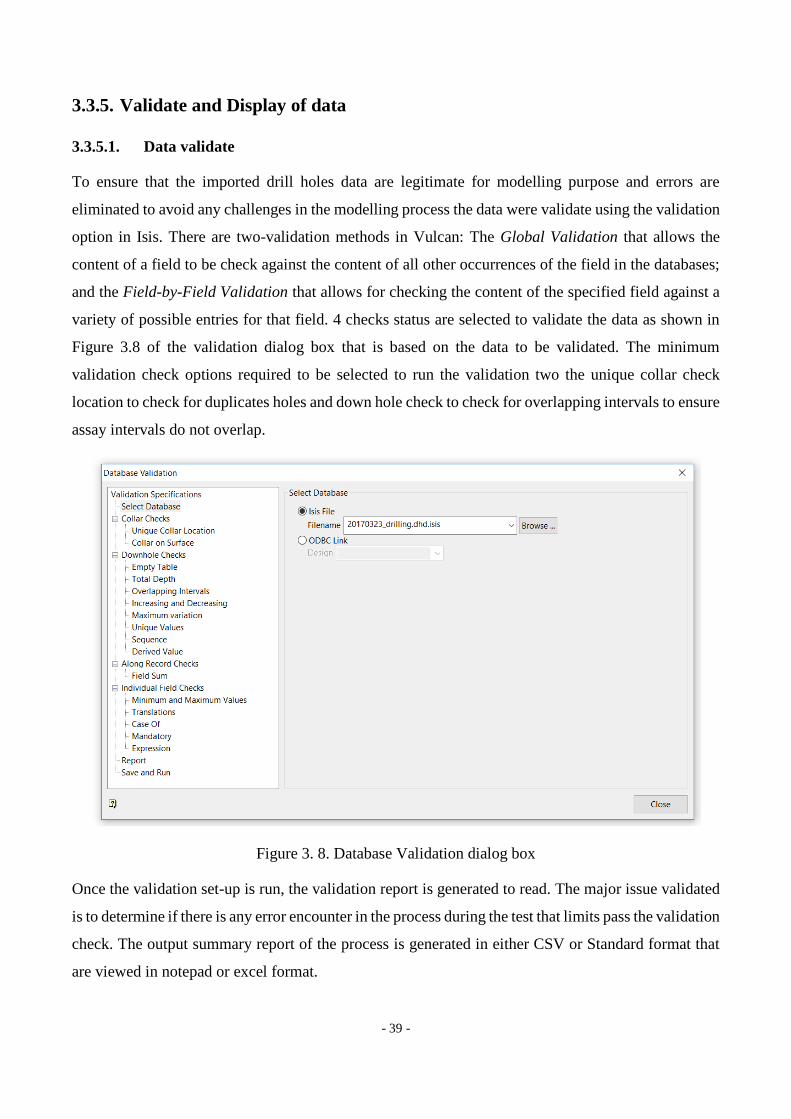
- 39 -
3.3.5. Validate and Display of data
3.3.5.1. Data validate
To ensure that the imported drill holes data are legitimate for modelling purpose and errors are
eliminated to avoid any challenges in the modelling process the data were validate using the validation
option in Isis. There are two-validation methods in Vulcan: The Global Validation that allows the
content of a field to be check against the content of all other occurrences of the field in the databases;
and the Field-by-Field Validation that allows for checking the content of the specified field against a
variety of possible entries for that field. 4 checks status are selected to validate the data as shown in
Figure 3.8 of the validation dialog box that is based on the data to be validated. The minimum
validation check options required to be selected to run the validation two the unique collar check
location to check for duplicates holes and down hole check to check for overlapping intervals to ensure
assay intervals do not overlap.
Figure 3. 8. Database Validation dialog box
Once the validation set-up is run, the validation report is generated to read. The major issue validated
is to determine if there is any error encounter in the process during the test that limits pass the validation
check. The output summary report of the process is generated in either CSV or Standard format that
are viewed in notepad or excel format.
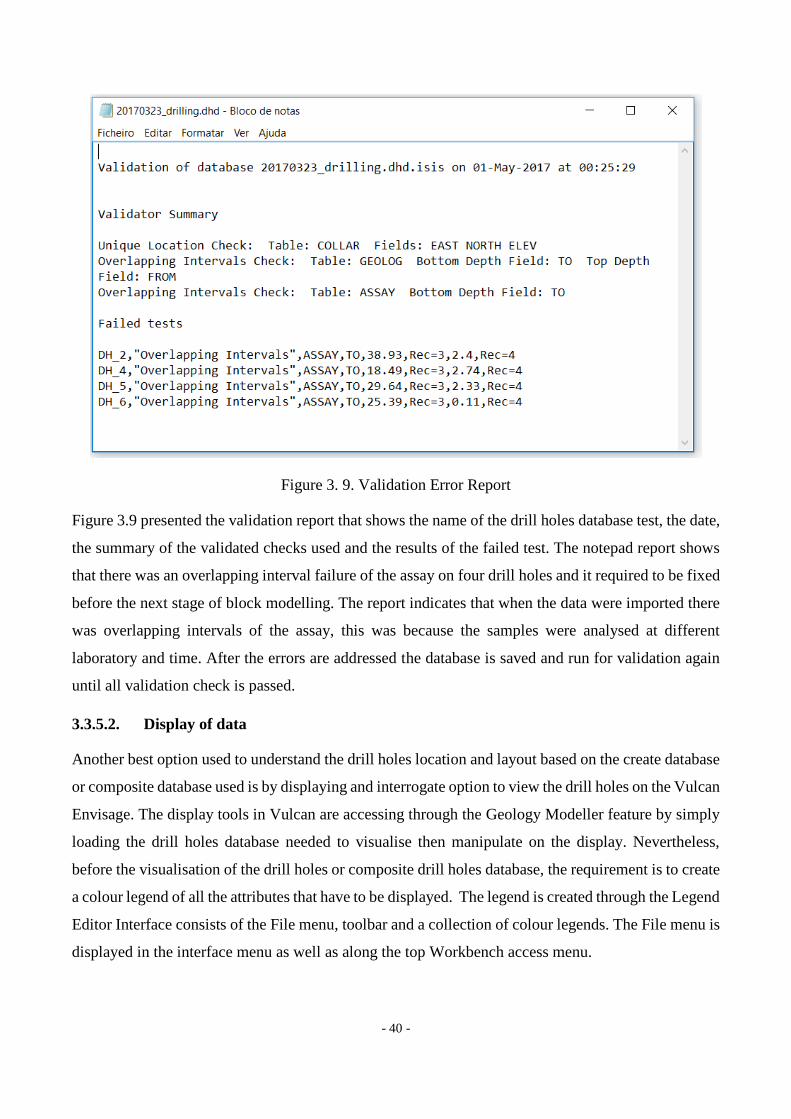
- 40 -
Figure 3. 9. Validation Error Report
Figure 3.9 presented the validation report that shows the name of the drill holes database test, the date,
the summary of the validated checks used and the results of the failed test. The notepad report shows
that there was an overlapping interval failure of the assay on four drill holes and it required to be fixed
before the next stage of block modelling. The report indicates that when the data were imported there
was overlapping intervals of the assay, this was because the samples were analysed at different
laboratory and time. After the errors are addressed the database is saved and run for validation again
until all validation check is passed.
3.3.5.2. Display of data
Another best option used to understand the drill holes location and layout based on the create database
or composite database used is by displaying and interrogate option to view the drill holes on the Vulcan
Envisage. The display tools in Vulcan are accessing through the Geology Modeller feature by simply
loading the drill holes database needed to visualise then manipulate on the display. Nevertheless,
before the visualisation of the drill holes or composite drill holes database, the requirement is to create
a colour legend of all the attributes that have to be displayed. The legend is created through the Legend
Editor Interface consists of the File menu, toolbar and a collection of colour legends. The File menu is
displayed in the interface menu as well as along the top Workbench access menu.
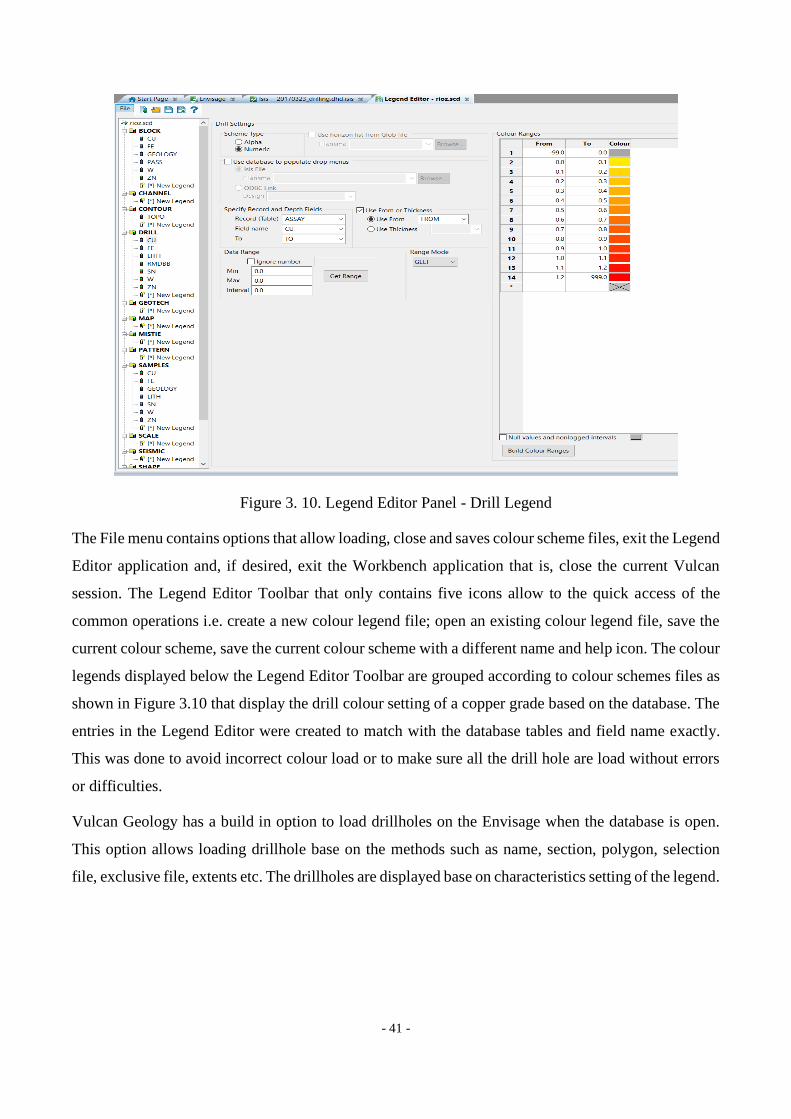
- 41 -
Figure 3. 10. Legend Editor Panel - Drill Legend
The File menu contains options that allow loading, close and saves colour scheme files, exit the Legend
Editor application and, if desired, exit the Workbench application that is, close the current Vulcan
session. The Legend Editor Toolbar that only contains five icons allow to the quick access of the
common operations i.e. create a new colour legend file; open an existing colour legend file, save the
current colour scheme, save the current colour scheme with a different name and help icon. The colour
legends displayed below the Legend Editor Toolbar are grouped according to colour schemes files as
shown in Figure 3.10 that display the drill colour setting of a copper grade based on the database. The
entries in the Legend Editor were created to match with the database tables and field name exactly.
This was done to avoid incorrect colour load or to make sure all the drill hole are load without errors
or difficulties.
Vulcan Geology has a build in option to load drillholes on the Envisage when the database is open.
This option allows loading drillhole base on the methods such as name, section, polygon, selection
file, exclusive file, extents etc. The drillholes are displayed base on characteristics setting of the legend.
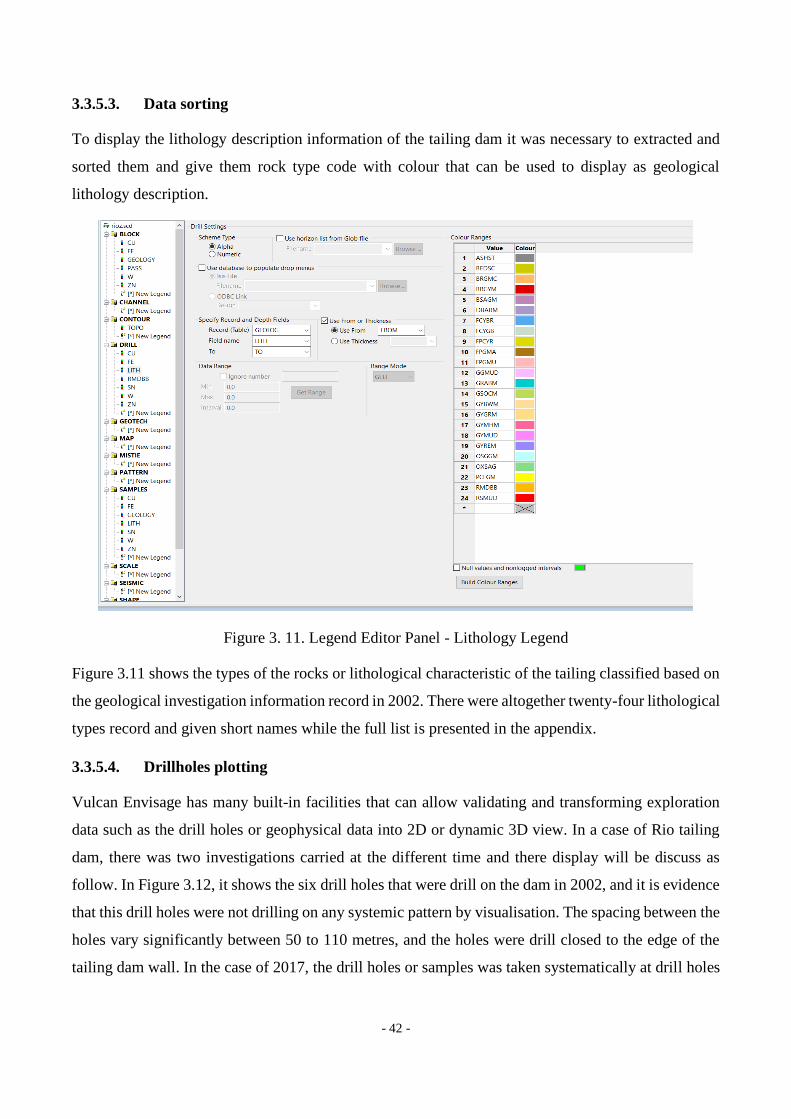
- 42 -
3.3.5.3. Data sorting
To display the lithology description information of the tailing dam it was necessary to extracted and
sorted them and give them rock type code with colour that can be used to display as geological
lithology description.
Figure 3. 11. Legend Editor Panel - Lithology Legend
Figure 3.11 shows the types of the rocks or lithological characteristic of the tailing classified based on
the geological investigation information record in 2002. There were altogether twenty-four lithological
types record and given short names while the full list is presented in the appendix.
3.3.5.4. Drillholes plotting
Vulcan Envisage has many built-in facilities that can allow validating and transforming exploration
data such as the drill holes or geophysical data into 2D or dynamic 3D view. In a case of Rio tailing
dam, there was two investigations carried at the different time and there display will be discuss as
follow. In Figure 3.12, it shows the six drill holes that were drill on the dam in 2002, and it is evidence
that this drill holes were not drilling on any systemic pattern by visualisation. The spacing between the
holes vary significantly between 50 to 110 metres, and the holes were drill closed to the edge of the
tailing dam wall. In the case of 2017, the drill holes or samples was taken systematically at drill holes

- 43 -
spacing about 40 metres in the North-West area, and about 25 metres in the Southeast area (Figure
3.13).
Figure 3. 12. 6 core drillholes points location displayed in Envisage
Figure 3. 13. 45 sample points location displayed in Envisage

- 44 -
3.3.5.5. Contouring display
Contour maps are essential to visualise the exploration data in order to check the holes spreading within
the region. Figure 3.14 shows the digitise contouring from the Surface Plan - Contour map for
Panasqueira (Planta de Superficie - Couto Mineiro da Panasqueira) that was drawn at the scale of 1:
10 000, and dates back as February 1955. It is clear in the figure that the area was a flat surface and it
also shows the river and the valley which is shown by the river feed streams mostly in the centre map.
It further shows the highest elevation level that is about 615 m above the sea level reference and the
lowest point is the river at 345 m above the sea level reference. In general, the area is the mountain
with a dip about 25 degrees and dip direction about 250 degrees.
Figure 3. 14. Digitise contours at 10 unit intervals - February 1955
3.3.6. Data compositing
Drillhole data represents samples intervals as vectors there for block modelling and block model
estimation the samples are required to be represented as points. Therefore, to convert the drillholes
database data to the samples data the data has to be composite with the aim to remove sampling bias
as a precursor to grade estimation in the block modelling drillholes assay data are composite to sample
data in this study the straight composite was used. The straight composite method extracts each logged
interval from a drillhole database and writes it out as composites point data. This is use to obtain a
samples database that respect the distribution of logged samples intervals. This means that only one
point will represent the whole interval, so that the data could be asymmetrically represent and grade
estimation may slip valuable data near the ends of the interval (example in Figure 3.15).
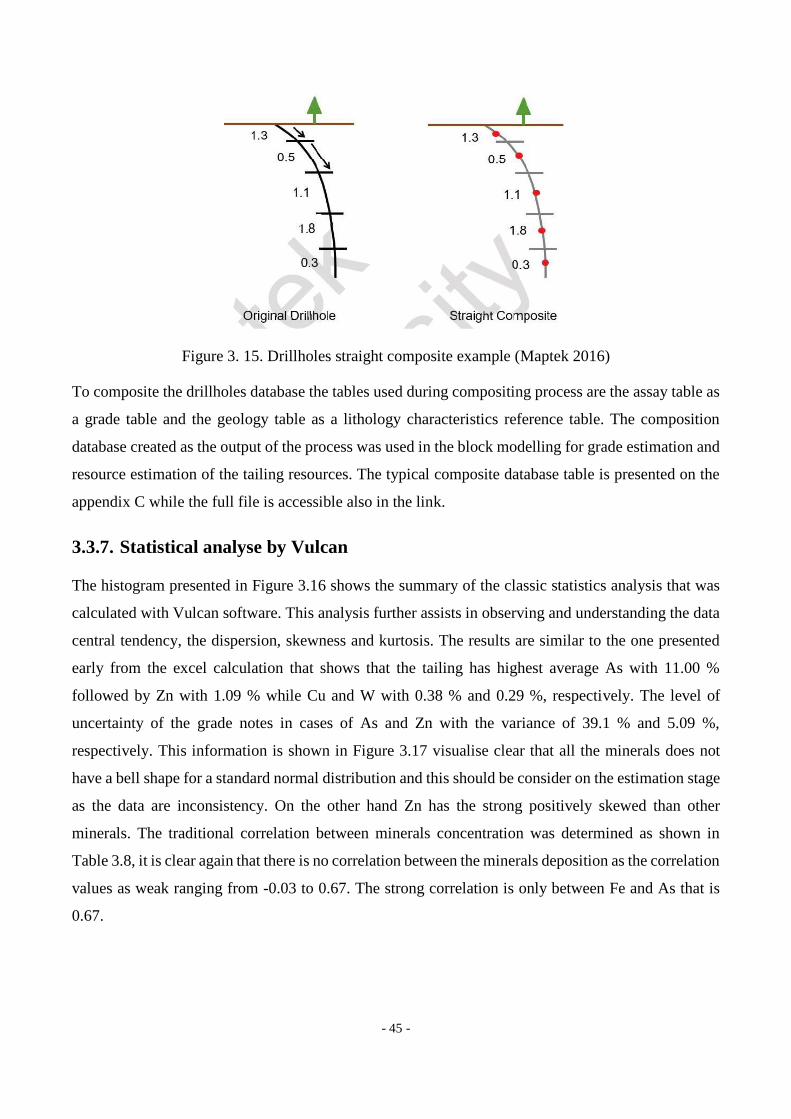
- 45 -
Figure 3. 15. Drillholes straight composite example (Maptek 2016)
To composite the drillholes database the tables used during compositing process are the assay table as
a grade table and the geology table as a lithology characteristics reference table. The composition
database created as the output of the process was used in the block modelling for grade estimation and
resource estimation of the tailing resources. The typical composite database table is presented on the
appendix C while the full file is accessible also in the link.
3.3.7. Statistical analyse by Vulcan
The histogram presented in Figure 3.16 shows the summary of the classic statistics analysis that was
calculated with Vulcan software. This analysis further assists in observing and understanding the data
central tendency, the dispersion, skewness and kurtosis. The results are similar to the one presented
early from the excel calculation that shows that the tailing has highest average As with 11.00 %
followed by Zn with 1.09 % while Cu and W with 0.38 % and 0.29 %, respectively. The level of
uncertainty of the grade notes in cases of As and Zn with the variance of 39.1 % and 5.09 %,
respectively. This information is shown in Figure 3.17 visualise clear that all the minerals does not
have a bell shape for a standard normal distribution and this should be consider on the estimation stage
as the data are inconsistency. On the other hand Zn has the strong positively skewed than other
minerals. The traditional correlation between minerals concentration was determined as shown in
Table 3.8, it is clear again that there is no correlation between the minerals deposition as the correlation
values as weak ranging from -0.03 to 0.67. The strong correlation is only between Fe and As that is
0.67.

- 46 -
Figure 3. 16. Histogram of the drill holes data for Rio tailing (As, Cu, Fe, Zn and W)
Table 3. 8. Minerals concentration correlation
W Cu Zn Fe As
W 1.00
Cu 0.184 1.00
Zn 0.084 0.109 1.00
Fe 0.032 0.493 0.005 1.00
As 0.109 0.433 -0.034 0.671 1.00
3.4. Tailing Resource Modelling and Estimation
To understand the geological controls on grade distribution throughout a tailing deposition is vital to
the development of a robust valuation approach of mining potential resources. Nowadays 2D or 3D
computerised model of geology, density, thickness and grade are essential to estimation mineral grade
and resource. 3D Models main objectives are to display and provide the graphical view of the deposit

- 47 -
shape in both the horizontal and vertical section view. The construction of the tailing resource model
is similar to the geological model that normally demonstrates into three steps: block model
construction, block viewing and manipulation, and grade and resources estimation. In the following
section, each step will be discussed on how it was carried in the context of this project.
3.4.1. Block model construction
Block model construction is the initial step in the process of block modelling. Due to the significant
of the resource model level of accurate required for the model to reflect the reality is high and the
acceptable error is minimum. Therefore, to achieve that it starts with the familiarity with the location
to be a model and the data gathered for block modelling. The construction of the block model in Vulcan
is initial procedure with the creation of the block model definition file (. bdf) this access through a
build in Block Modeller in Envisage or Block Model Utility in Workbench. The block model utility
has six panels or options that have to be help defined the geological/resource block model (Orientation,
schemes, variables, boundaries limits and exceptions) as shown in Figure 3.17.
The first panel is used to define the block origin and orientation. The origin is the easting (X), northing
(Y) and elevation (Z) values points of the block that represent the lower left corner of the block model
on the plan view or the map grid origin. The elevation value is referred to the lowest elevation at the
site. The rotation of the block is define based on the deposit orientation, which can define as the
bearing, plunge and dip. In this study, the bearing was 90°, while plunge and dip were 0° this was
determined by analysing the drillholes data and topography.
The second option is schemes that allow defining the block extents and dimensions in the 3D spatial
used to build the model boundaries. In this option, there are two sub-options the parent block scheme
that defined the maximum block size in the model, and the sub-blocks that define the smaller blocks
dimensions, which are the factor of parents, block size. Subblocks are essential to increase the accuracy
of estimation and achieve better calculation in short periods.
The third panel is used to define the block variables (attributes) that used to create the model. Vulcan
has the option to enter up to 300 variables that can be either numeric or alphanumeric value (geology,
grade, etc.).
Then the fourth panel allows setting up the definition the block model boundaries were the individual
block are going to end and what field’s values assigned to the cells individual created. This is done by
using triangulation that can either be an inclusive or exclusive interface to the previously entered
variables that are used to define the boundaries whether a variable occurs inside or outside, above or
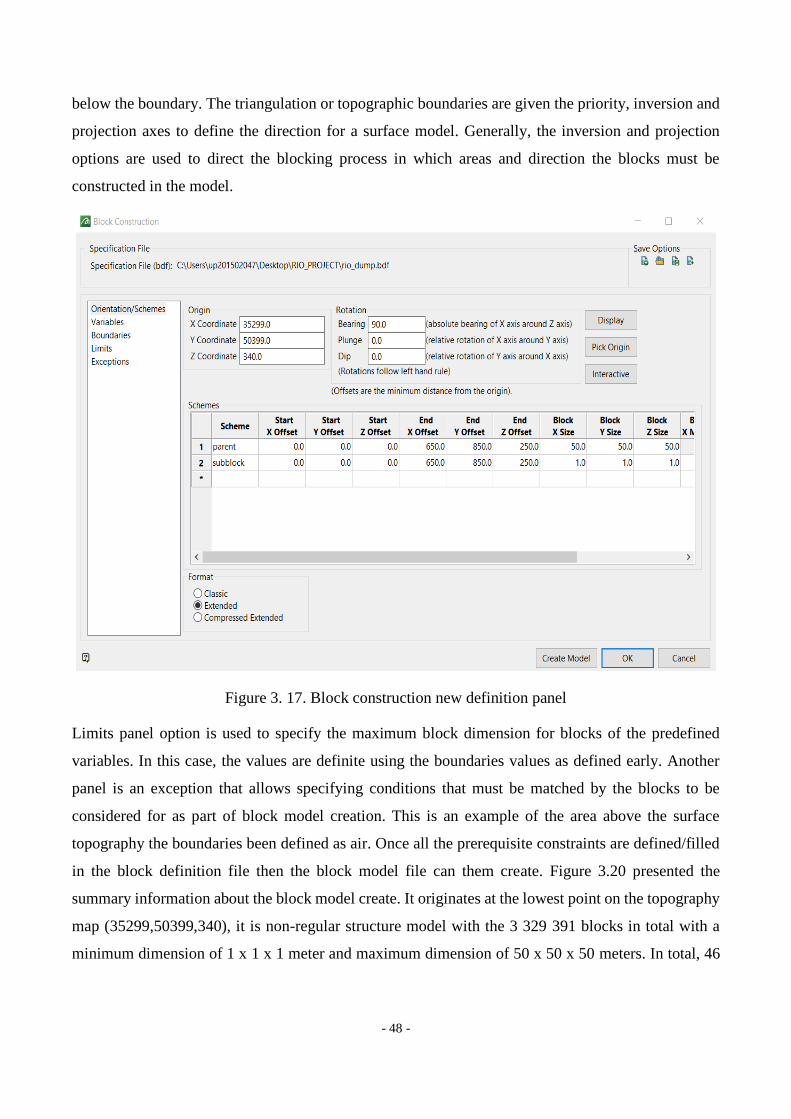
- 48 -
below the boundary. The triangulation or topographic boundaries are given the priority, inversion and
projection axes to define the direction for a surface model. Generally, the inversion and projection
options are used to direct the blocking process in which areas and direction the blocks must be
constructed in the model.
Figure 3. 17. Block construction new definition panel
Limits panel option is used to specify the maximum block dimension for blocks of the predefined
variables. In this case, the values are definite using the boundaries values as defined early. Another
panel is an exception that allows specifying conditions that must be matched by the blocks to be
considered for as part of block model creation. This is an example of the area above the surface
topography the boundaries been defined as air. Once all the prerequisite constraints are defined/filled
in the block definition file then the block model file can them create. Figure 3.20 presented the
summary information about the block model create. It originates at the lowest point on the topography
map (35299,50399,340), it is non-regular structure model with the 3 329 391 blocks in total with a
minimum dimension of 1 x 1 x 1 meter and maximum dimension of 50 x 50 x 50 meters. In total, 46
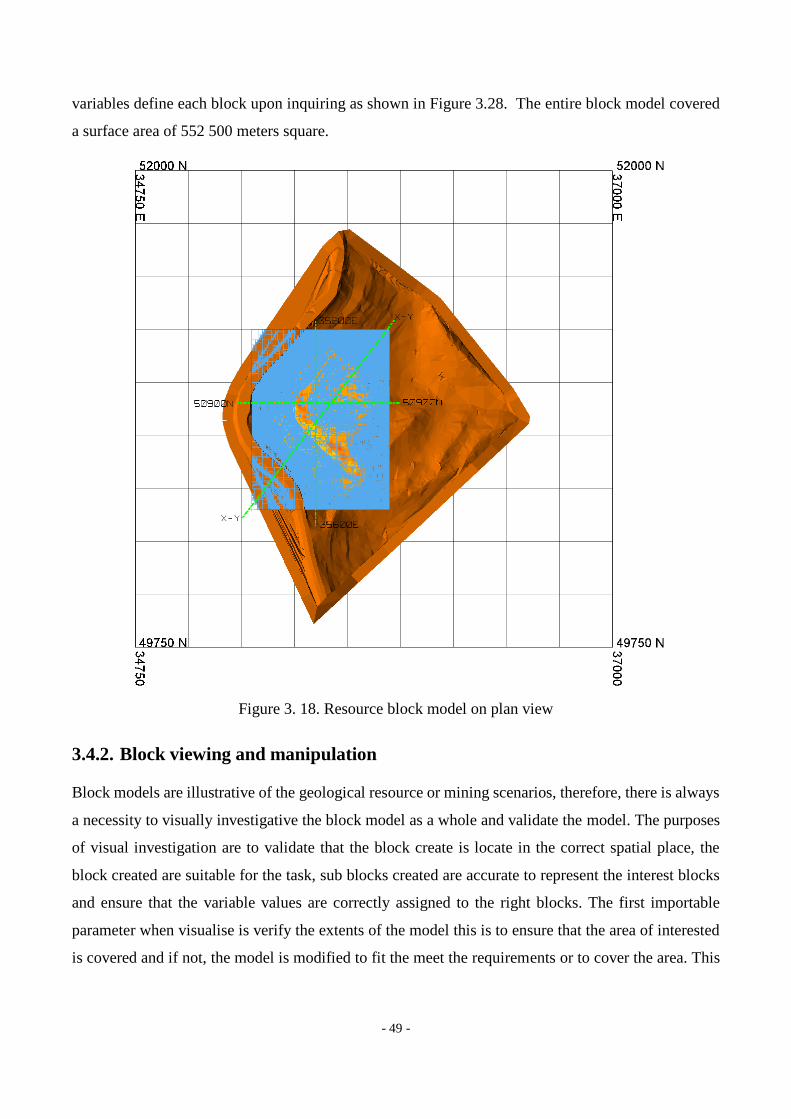
- 49 -
variables define each block upon inquiring as shown in Figure 3.28. The entire block model covered
a surface area of 552 500 meters square.
Figure 3. 18. Resource block model on plan view
3.4.2. Block viewing and manipulation
Block models are illustrative of the geological resource or mining scenarios, therefore, there is always
a necessity to visually investigative the block model as a whole and validate the model. The purposes
of visual investigation are to validate that the block create is locate in the correct spatial place, the
block created are suitable for the task, sub blocks created are accurate to represent the interest blocks
and ensure that the variable values are correctly assigned to the right blocks. The first importable
parameter when visualise is verify the extents of the model this is to ensure that the area of interested
is covered and if not, the model is modified to fit the meet the requirements or to cover the area. This

- 50 -
is verified by loading both the block model and the drillholes in the display then view the block in the
different orientation to make sure all the drillholes are inside the block boundaries.
Figure 3. 19. Resource block model on 3D view
To ensure that the block dimension is appropriate to the data several options are used in Vulcan to
viewing blocks in which one of them is by using load dynamic model option that was used in this
study. Vulcan provides the different frameworks to display the variable based on grade, resource,
geology and economic variables. In this study, the geology variables those were defined early in the
process of block construction where used to displayed in both horizontal and vertical cross section
view. Figure 3.18 and 3.19 present the resource block model on plan view and model on 3D view,
respectively.
Figure 3.21 – 3.24 are a representation of the horizontal cross section view of the block model at 340
m, 480 m and 540 m, respectively. Figure 3.21 shows the grid section classification of the materials at
340 meters level in which the three-quarter of the portion of the grid is rock which classified as bedrock
in brown colour expect the whitish portion which enters the aqua colour south-west and north-west
this the Zêzere river which the bedrock was not defined this is represented as air. Figure 3.21 at 340
meters is a bit differs from Figure 3.22 as it shows the deposited materials classified as tailing on this
case at the centre whitish colour at 460 meters.

- 51 -
Figure 3. 20. Typical block model header information
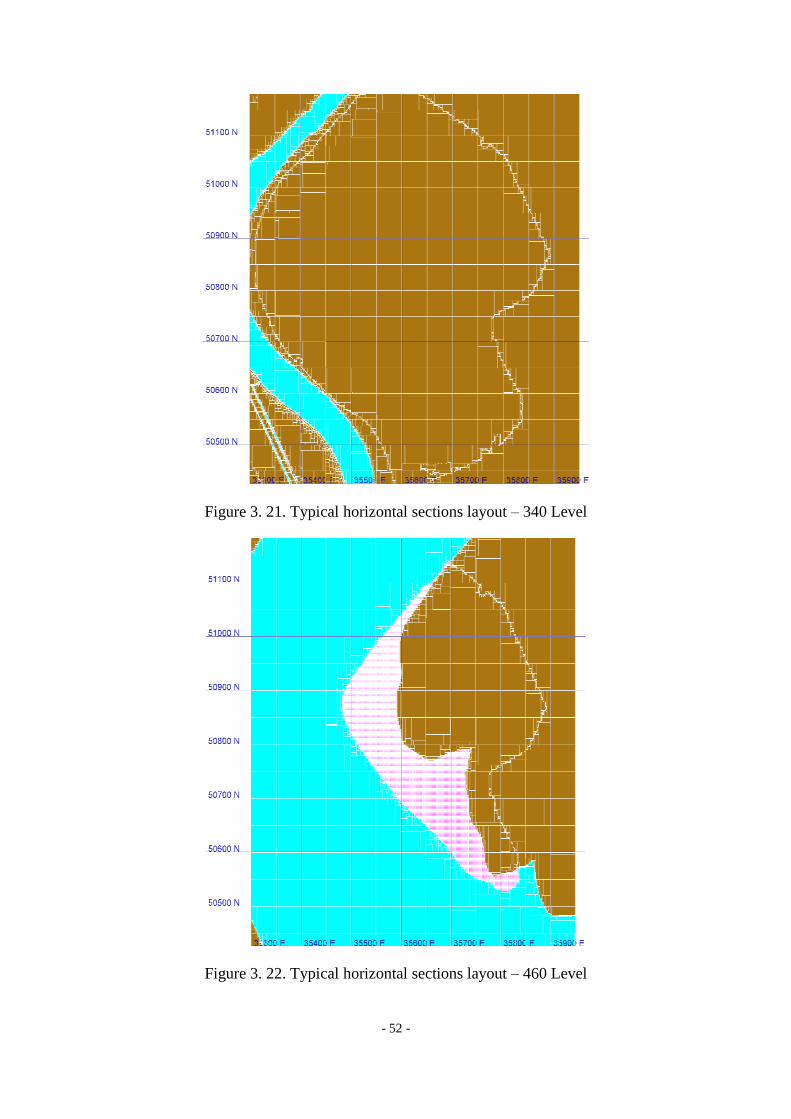
- 52 -
Figure 3. 21. Typical horizontal sections layout – 340 Level
Figure 3. 22. Typical horizontal sections layout – 460 Level
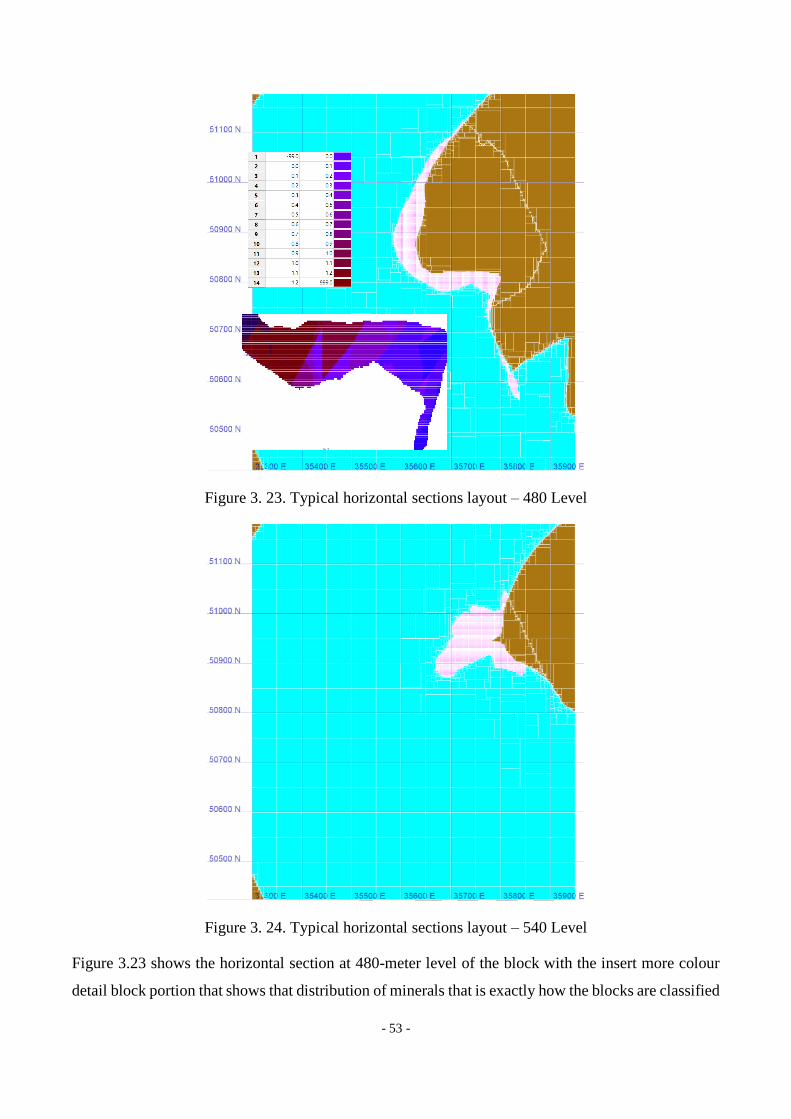
- 53 -
Figure 3. 23. Typical horizontal sections layout – 480 Level
Figure 3. 24. Typical horizontal sections layout – 540 Level
Figure 3.23 shows the horizontal section at 480-meter level of the block with the insert more colour
detail block portion that shows that distribution of minerals that is exactly how the blocks are classified
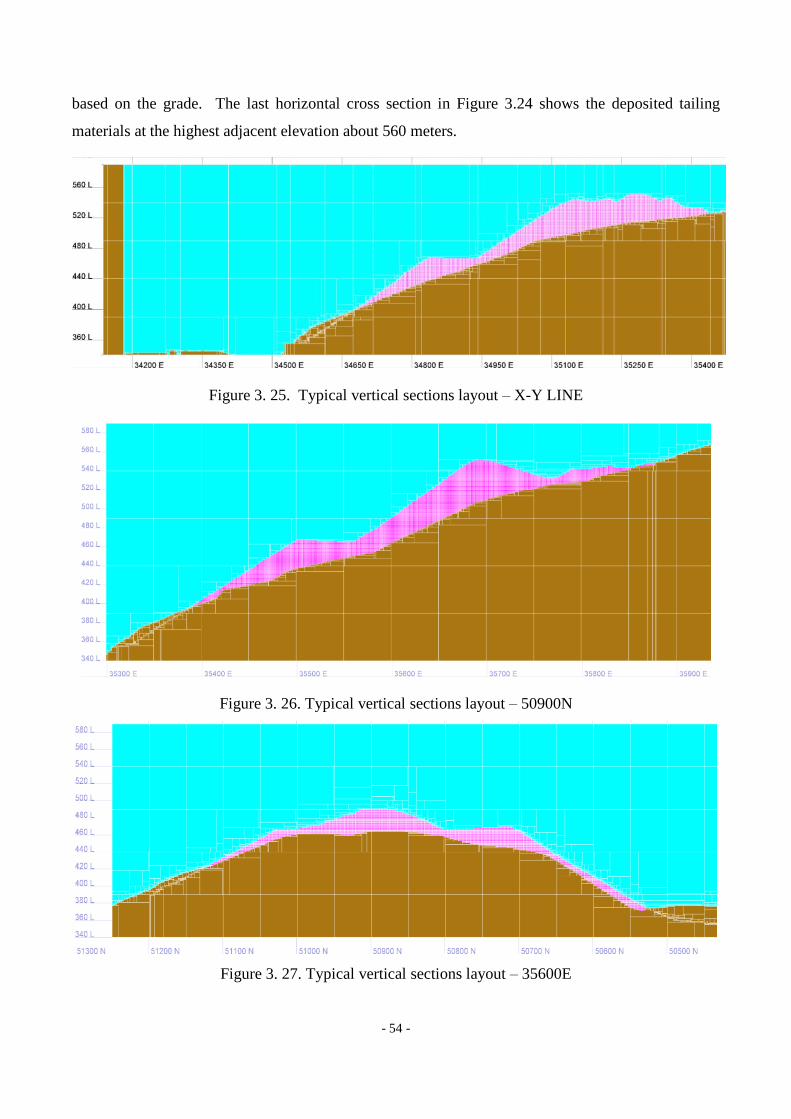
- 54 -
based on the grade. The last horizontal cross section in Figure 3.24 shows the deposited tailing
materials at the highest adjacent elevation about 560 meters.
Figure 3. 25. Typical vertical sections layout – X-Y LINE
Figure 3. 26. Typical vertical sections layout – 50900N
Figure 3. 27. Typical vertical sections layout – 35600E
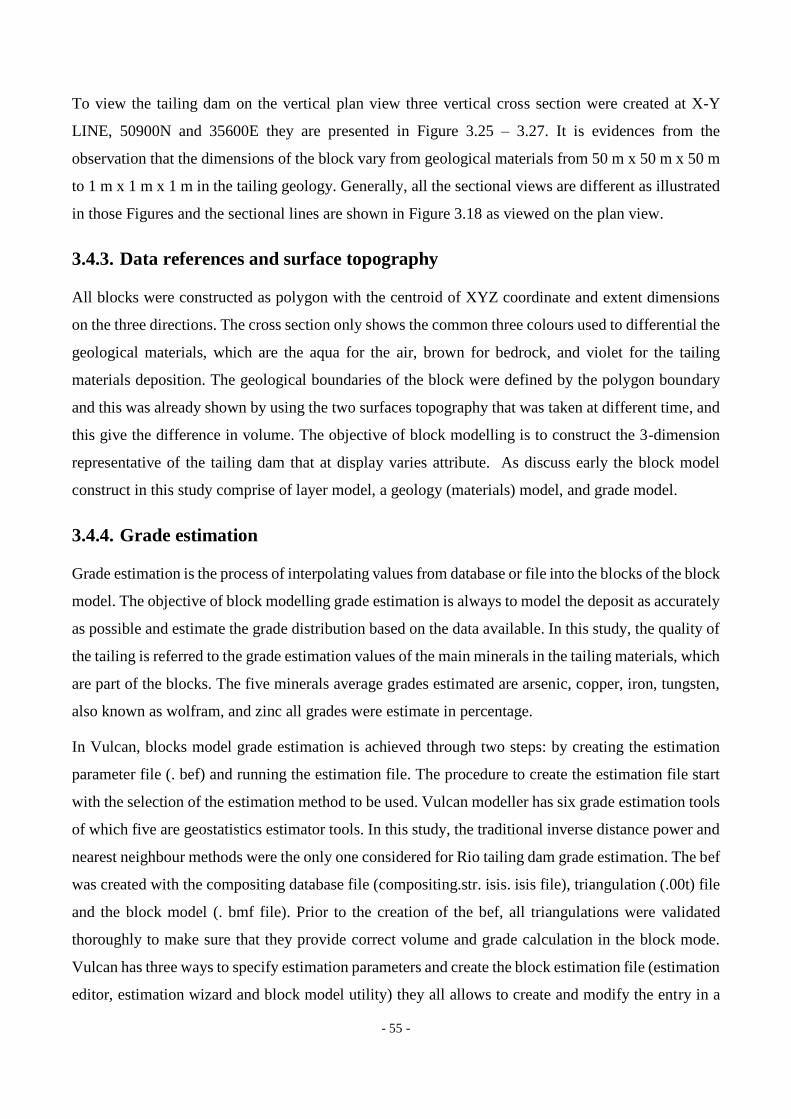
- 55 -
To view the tailing dam on the vertical plan view three vertical cross section were created at X-Y
LINE, 50900N and 35600E they are presented in Figure 3.25 – 3.27. It is evidences from the
observation that the dimensions of the block vary from geological materials from 50 m x 50 m x 50 m
to 1 m x 1 m x 1 m in the tailing geology. Generally, all the sectional views are different as illustrated
in those Figures and the sectional lines are shown in Figure 3.18 as viewed on the plan view.
3.4.3. Data references and surface topography
All blocks were constructed as polygon with the centroid of XYZ coordinate and extent dimensions
on the three directions. The cross section only shows the common three colours used to differential the
geological materials, which are the aqua for the air, brown for bedrock, and violet for the tailing
materials deposition. The geological boundaries of the block were defined by the polygon boundary
and this was already shown by using the two surfaces topography that was taken at different time, and
this give the difference in volume. The objective of block modelling is to construct the 3-dimension
representative of the tailing dam that at display varies attribute. As discuss early the block model
construct in this study comprise of layer model, a geology (materials) model, and grade model.
3.4.4. Grade estimation
Grade estimation is the process of interpolating values from database or file into the blocks of the block
model. The objective of block modelling grade estimation is always to model the deposit as accurately
as possible and estimate the grade distribution based on the data available. In this study, the quality of
the tailing is referred to the grade estimation values of the main minerals in the tailing materials, which
are part of the blocks. The five minerals average grades estimated are arsenic, copper, iron, tungsten,
also known as wolfram, and zinc all grades were estimate in percentage.
In Vulcan, blocks model grade estimation is achieved through two steps: by creating the estimation
parameter file (. bef) and running the estimation file. The procedure to create the estimation file start
with the selection of the estimation method to be used. Vulcan modeller has six grade estimation tools
of which five are geostatistics estimator tools. In this study, the traditional inverse distance power and
nearest neighbour methods were the only one considered for Rio tailing dam grade estimation. The bef
was created with the compositing database file (compositing.str. isis. isis file), triangulation (.00t) file
and the block model (. bmf file). Prior to the creation of the bef, all triangulations were validated
thoroughly to make sure that they provide correct volume and grade calculation in the block mode.
Vulcan has three ways to specify estimation parameters and create the block estimation file (estimation
editor, estimation wizard and block model utility) they all allows to create and modify the entry in a

- 56 -
parameter for use in the grade block estimation. In the following section, some of the major parameters
/options used for grade block modelling in this study are as follows:
1. The selection of the type of estimation method (inverse distance square and nearest neighbour
for to validate the results of other estimation methods)
2. Results estimation variables report this refer to the output variables (Figure 3.29)
3. Discretisation steps in X/Y/Z: these step sizes indicate how many grid points to use inside a
block or sub-block to estimate the block average. This is important to speed up the estimation
process and in this case the 4 x 4 x 1 was use. To increase the accuracy in estimation the sub-
blocks were estimate as parent block meaning that instead of using the extent of the sub blocks
the estimation procedure replace a blocks extent with the extent of the parent bock.
4. The distance to samples as inverse average distance this the distance from the bock centre
there are three options (standard Cartesian and anisotropic distance derived from the search
ellipsoid, and anisotropic distance that derived from anisotropic weights) with sub-option to
assign weighted to samples or not assign. In this study, the Cartesian option was used to
compute the distance using the Pythagorean formula and all samples given equal weighted.
Distance = sqrt (dx2 + dy2 + dz2)
Where: dx – distance differences in the easting
dy – distance differences in the northing
dz – distance differences in the elevation
5. The search region specifies - there are three parameters to be specified: the search shape, the
search orientation and the search distance. In this case, the ellipsoid shape was used with the
semi major axis of 60 m while the minor axis of 5 m and the search orientation (bearing, plunge
and dip) values were set to zero.
6. The samples counts are essential to define the minimum and maximum number of samples
that have to be found within a region in order to generate an estimation value while the other
hand octant-based search option is used to place a limit on the number of samples which can
come from the given octant. For this estimation, the minimum number samples were select as
3 and maximum number samples per estimate as 16 while the octant-based search limited to 2
per octant. This done to reduce the imbalance problems associated with samples lying the in
different direction.
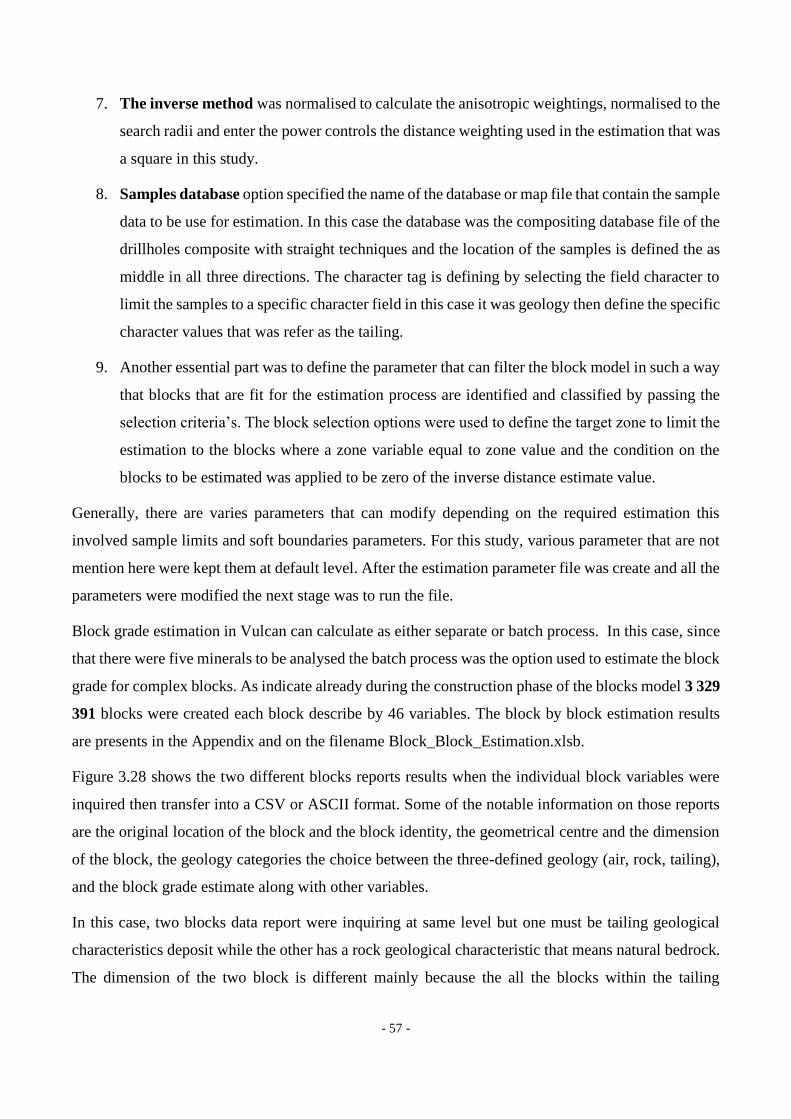
- 57 -
7. The inverse method was normalised to calculate the anisotropic weightings, normalised to the
search radii and enter the power controls the distance weighting used in the estimation that was
a square in this study.
8. Samples database option specified the name of the database or map file that contain the sample
data to be use for estimation. In this case the database was the compositing database file of the
drillholes composite with straight techniques and the location of the samples is defined the as
middle in all three directions. The character tag is defining by selecting the field character to
limit the samples to a specific character field in this case it was geology then define the specific
character values that was refer as the tailing.
9. Another essential part was to define the parameter that can filter the block model in such a way
that blocks that are fit for the estimation process are identified and classified by passing the
selection criteria’s. The block selection options were used to define the target zone to limit the
estimation to the blocks where a zone variable equal to zone value and the condition on the
blocks to be estimated was applied to be zero of the inverse distance estimate value.
Generally, there are varies parameters that can modify depending on the required estimation this
involved sample limits and soft boundaries parameters. For this study, various parameter that are not
mention here were kept them at default level. After the estimation parameter file was create and all the
parameters were modified the next stage was to run the file.
Block grade estimation in Vulcan can calculate as either separate or batch process. In this case, since
that there were five minerals to be analysed the batch process was the option used to estimate the block
grade for complex blocks. As indicate already during the construction phase of the blocks model 3 329
391 blocks were created each block describe by 46 variables. The block by block estimation results
are presents in the Appendix and on the filename Block_Block_Estimation.xlsb.
Figure 3.28 shows the two different blocks reports results when the individual block variables were
inquired then transfer into a CSV or ASCII format. Some of the notable information on those reports
are the original location of the block and the block identity, the geometrical centre and the dimension
of the block, the geology categories the choice between the three-defined geology (air, rock, tailing),
and the block grade estimate along with other variables.
In this case, two blocks data report were inquiring at same level but one must be tailing geological
characteristics deposit while the other has a rock geological characteristic that means natural bedrock.
The dimension of the two block is different mainly because the all the blocks within the tailing

- 58 -
geological were bid to 1 m x 1 m x 1m while the other vary up to 50 m x 50 m x 50 m. The value of -
99.00 in both the reports and block model display is an indication that the block did not meet the
requirement set up or it fall out of the boundaries. . Figure shows 3.29 and 3.30 average grade value
of copper displayed in the block model at 460 m level for each block.
Figure 3. 28. Blocks variables reports
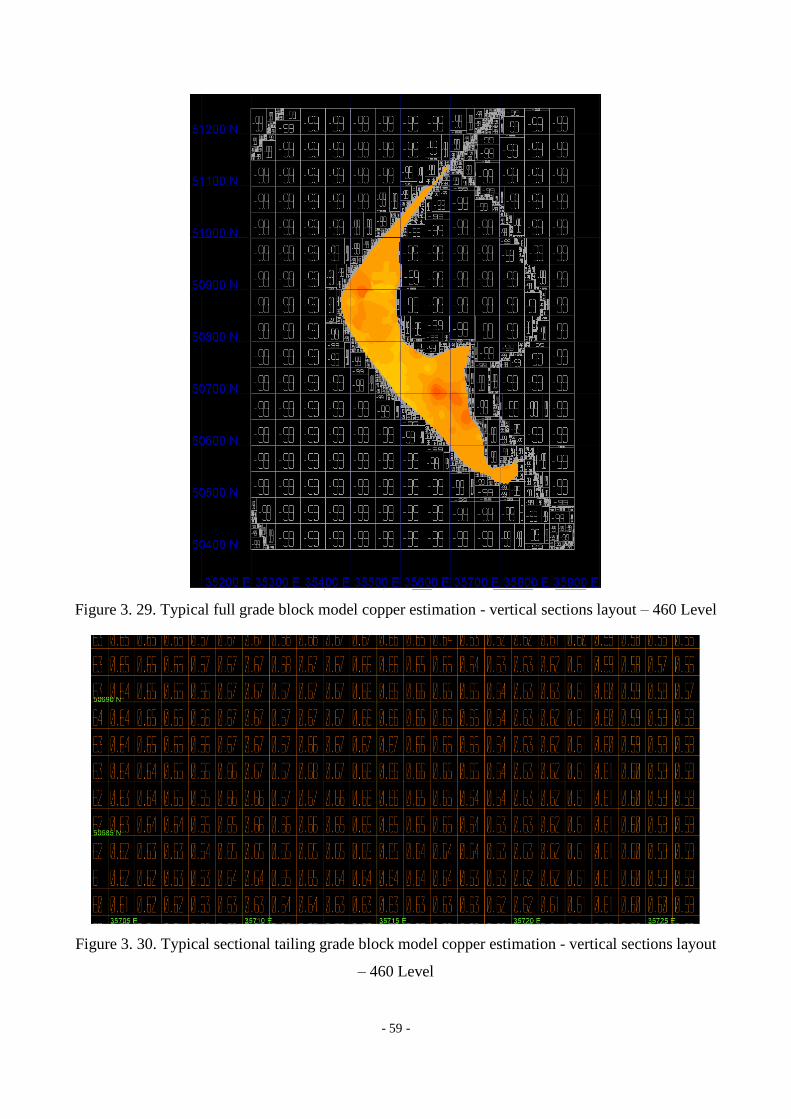
- 59 -
Figure 3. 29. Typical full grade block model copper estimation - vertical sections layout – 460 Level
Figure 3. 30. Typical sectional tailing grade block model copper estimation - vertical sections layout
– 460 Level
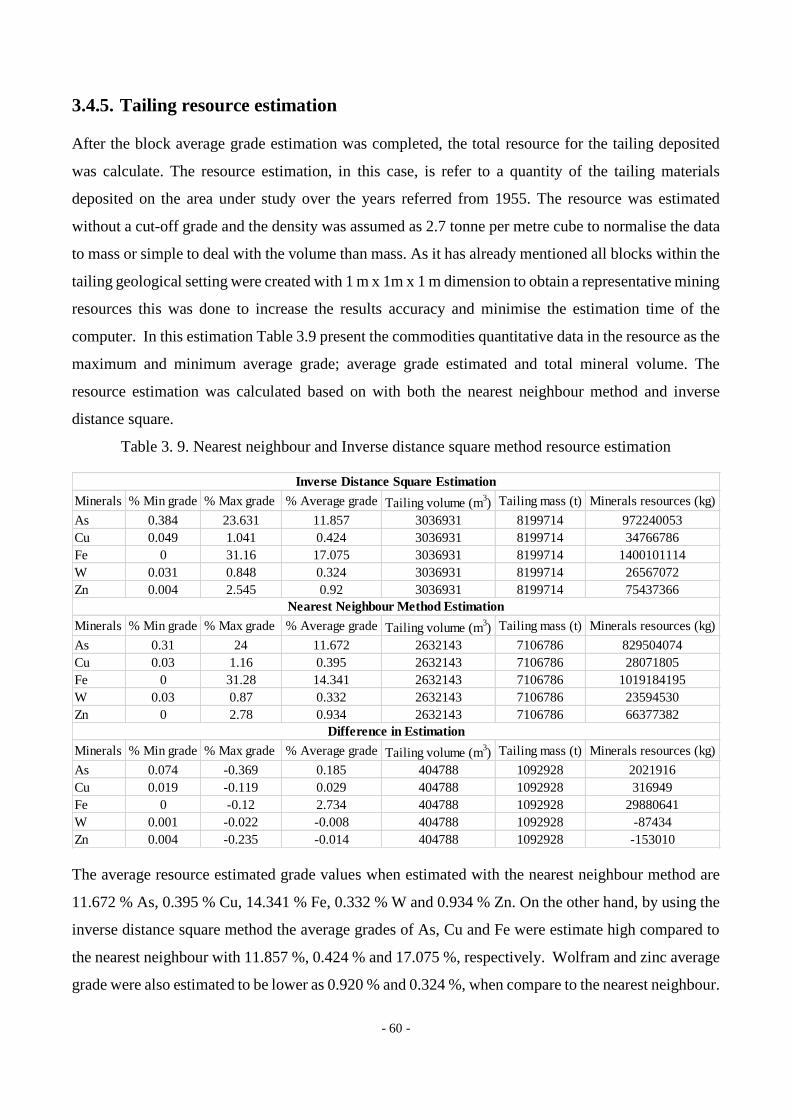
- 60 -
3.4.5. Tailing resource estimation
After the block average grade estimation was completed, the total resource for the tailing deposited
was calculate. The resource estimation, in this case, is refer to a quantity of the tailing materials
deposited on the area under study over the years referred from 1955. The resource was estimated
without a cut-off grade and the density was assumed as 2.7 tonne per metre cube to normalise the data
to mass or simple to deal with the volume than mass. As it has already mentioned all blocks within the
tailing geological setting were created with 1 m x 1m x 1 m dimension to obtain a representative mining
resources this was done to increase the results accuracy and minimise the estimation time of the
computer. In this estimation Table 3.9 present the commodities quantitative data in the resource as the
maximum and minimum average grade; average grade estimated and total mineral volume. The
resource estimation was calculated based on with both the nearest neighbour method and inverse
distance square.
Table 3. 9. Nearest neighbour and Inverse distance square method resource estimation
The average resource estimated grade values when estimated with the nearest neighbour method are
11.672 % As, 0.395 % Cu, 14.341 % Fe, 0.332 % W and 0.934 % Zn. On the other hand, by using the
inverse distance square method the average grades of As, Cu and Fe were estimate high compared to
the nearest neighbour with 11.857 %, 0.424 % and 17.075 %, respectively. Wolfram and zinc average
grade were also estimated to be lower as 0.920 % and 0.324 %, when compare to the nearest neighbour.
Minerals % Min grade % Max grade % Average grade Tailing volume (m3) Tailing mass (t) Minerals resources (kg)
As 0.384 23.631 11.857 3036931 8199714 972240053
Cu 0.049 1.041 0.424 3036931 8199714 34766786
Fe 0 31.16 17.075 3036931 8199714 1400101114
W 0.031 0.848 0.324 3036931 8199714 26567072
Zn 0.004 2.545 0.92 3036931 8199714 75437366
Minerals % Min grade % Max grade % Average grade Tailing volume (m3) Tailing mass (t) Minerals resources (kg)
As 0.31 24 11.672 2632143 7106786 829504074
Cu 0.03 1.16 0.395 2632143 7106786 28071805
Fe 0 31.28 14.341 2632143 7106786 1019184195
W 0.03 0.87 0.332 2632143 7106786 23594530
Zn 0 2.78 0.934 2632143 7106786 66377382
Minerals % Min grade % Max grade % Average grade Tailing volume (m3) Tailing mass (t) Minerals resources (kg)
As 0.074 -0.369 0.185 404788 1092928 2021916
Cu 0.019 -0.119 0.029 404788 1092928 316949
Fe 0 -0.12 2.734 404788 1092928 29880641
W 0.001 -0.022 -0.008 404788 1092928 -87434
Zn 0.004 -0.235 -0.014 404788 1092928 -153010
Inverse Distance Square Estimation
Nearest Neighbour Method Estimation
Difference in Estimation
- 61 -
The total in-situ resource of Rio tailing dam was estimated to be 3. 037931x 106 m3 by using the inverse
distance square while with the nearest neighbour method it is estimated to be lower as 2.632143 m3.
The difference between the estimated values was calculate as shown above in the Table 3.9.
Warning: 'Estimates are not reality; they are subject to error, the magnitude of which depends on the
nature and quantity of sample information, spatial pattern, area to be estimate and the estimation
method applied’’ (Diehl and David 1979)
3.5. Planning and Extraction Design for tailing
The second objective of this study was to develop and design a mining extraction plan for the tailing
resource for the deposited materials that should be transported to the processing plant. The planning
and design of the resource start with the block model preparation that defines the in-situ resource, pit
design and production scheduling using Vulcan Modeller and MineMondeller Open Pit to produced
designs and plans are as practical as possible.
3.5.1. Block Model Preparation
The construction and the preparation of the geological block model have been discussing in detail in
already in the previous section this is the base block model. The aim was to quantify the materials. The
three triangulations used constructed block model: 1955 surface topography triangulation (1955T)
merge with the 2017 surface topography triangulation (2017T) and solid triangulation (2017SPT).
To define the boundaries (partial) of the tailing materials within the block the boundaries options under
the block construction was applied attributes to blocks based on their position relative to triangulation.
In addition, this option allows the sub-blocking process to the block model. The process of allocating
the block the attribute achieved by defining the triangulation variable, values, and priority, inversion
and projection axes. The variables are attributes that the block must define this include grade, geology
and directions. The value names are used to assign the area to solve area of conflict between
triangulation. Once the materials defined with values names they are given priority level based on of
the triangulation and inversion. The boundaries priorities level and inversion are an instruction to the
blocking process of the correct geological relation between the various entities made up the resources.
In this case, the 1955 surface topography triangulation (original_topo_fix_04.00t aka 2017SPDT,
1955T) was given the value air with priorities 1 and inverse partial meaning to partial the block into
in such a way that area above the classified as air while the one below as rock. The 2017 surface
topography triangulation (topo_scan.00t shown in Figure 3.32 & 3.36 with model reddish colour) was
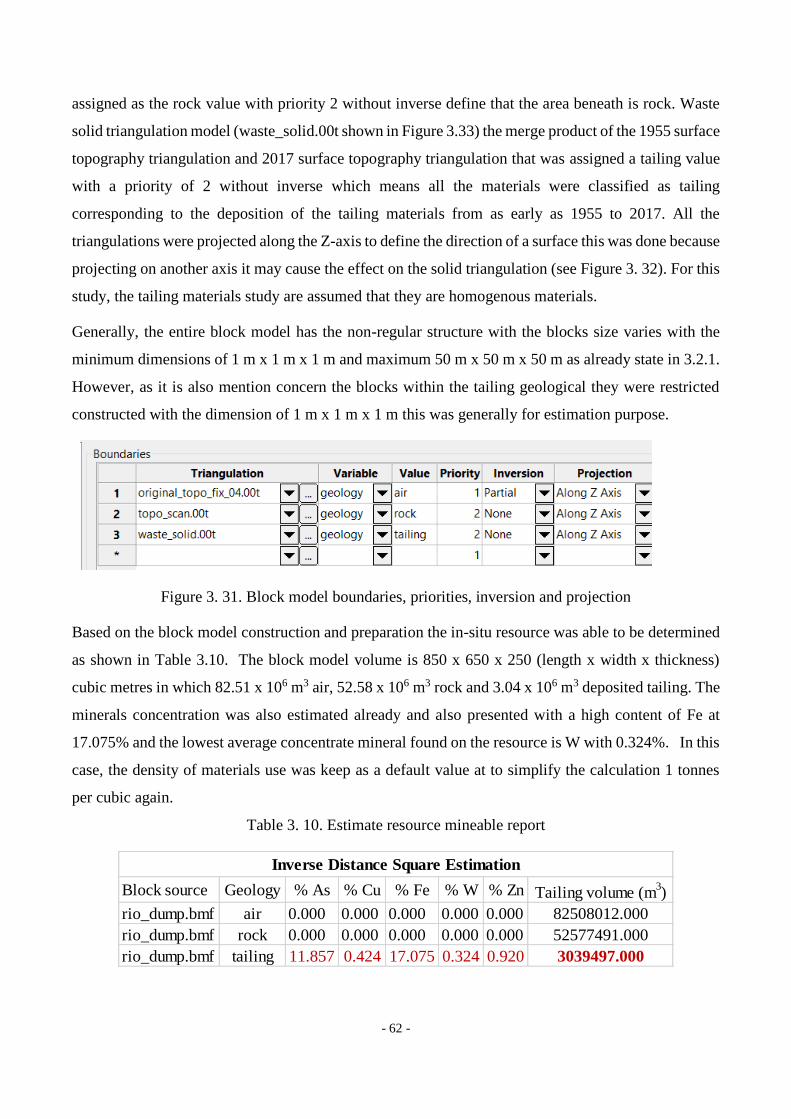
- 62 -
assigned as the rock value with priority 2 without inverse define that the area beneath is rock. Waste
solid triangulation model (waste_solid.00t shown in Figure 3.33) the merge product of the 1955 surface
topography triangulation and 2017 surface topography triangulation that was assigned a tailing value
with a priority of 2 without inverse which means all the materials were classified as tailing
corresponding to the deposition of the tailing materials from as early as 1955 to 2017. All the
triangulations were projected along the Z-axis to define the direction of a surface this was done because
projecting on another axis it may cause the effect on the solid triangulation (see Figure 3. 32). For this
study, the tailing materials study are assumed that they are homogenous materials.
Generally, the entire block model has the non-regular structure with the blocks size varies with the
minimum dimensions of 1 m x 1 m x 1 m and maximum 50 m x 50 m x 50 m as already state in 3.2.1.
However, as it is also mention concern the blocks within the tailing geological they were restricted
constructed with the dimension of 1 m x 1 m x 1 m this was generally for estimation purpose.
Figure 3. 31. Block model boundaries, priorities, inversion and projection
Based on the block model construction and preparation the in-situ resource was able to be determined
as shown in Table 3.10. The block model volume is 850 x 650 x 250 (length x width x thickness)
cubic metres in which 82.51 x 10⁶ m3 air, 52.58 x 10⁶ m3 rock and 3.04 x 10⁶ m3 deposited tailing. The
minerals concentration was also estimated already and also presented with a high content of Fe at
17.075% and the lowest average concentrate mineral found on the resource is W with 0.324%. In this
case, the density of materials use was keep as a default value at to simplify the calculation 1 tonnes
per cubic again.
Table 3. 10. Estimate resource mineable report
Block source Geology % As % Cu % Fe % W % Zn Tailing volume (m3)
rio_dump.bmf air 0.000 0.000 0.000 0.000 0.000 82508012.000
rio_dump.bmf rock 0.000 0.000 0.000 0.000 0.000 52577491.000
rio_dump.bmf tailing 11.857 0.424 17.075 0.324 0.920 3039497.000
Inverse Distance Square Estimation

- 63 -
Figure 3. 32. Rio topography with tailing deposition model
Figure 3. 33. Tailing deposit resources model
3.5.2. Extraction design
3.5.2.1. Dam structure
The in-situ resource of the tailing dam was determined as 3 039 x 106 m3 and it covered top surface
area of about 120 000 m2 and the based floor area (previous area) was about 269 000 m2.
The dam has an average strike of 350°, average dip 35° Left, average dip direction 250°, plunge
average 1.061, average pitch 1.925° with the average slope length of 160 m and average height 90 m
as well as the longest surface length about 435 m. The dimension of the dam is shown in Figure 3.34
and Table 3.11. The materials deposited were assumed to be homogenous and this consist of 3 039
4997 blocks each with 1 m x 1 m x 1 m.
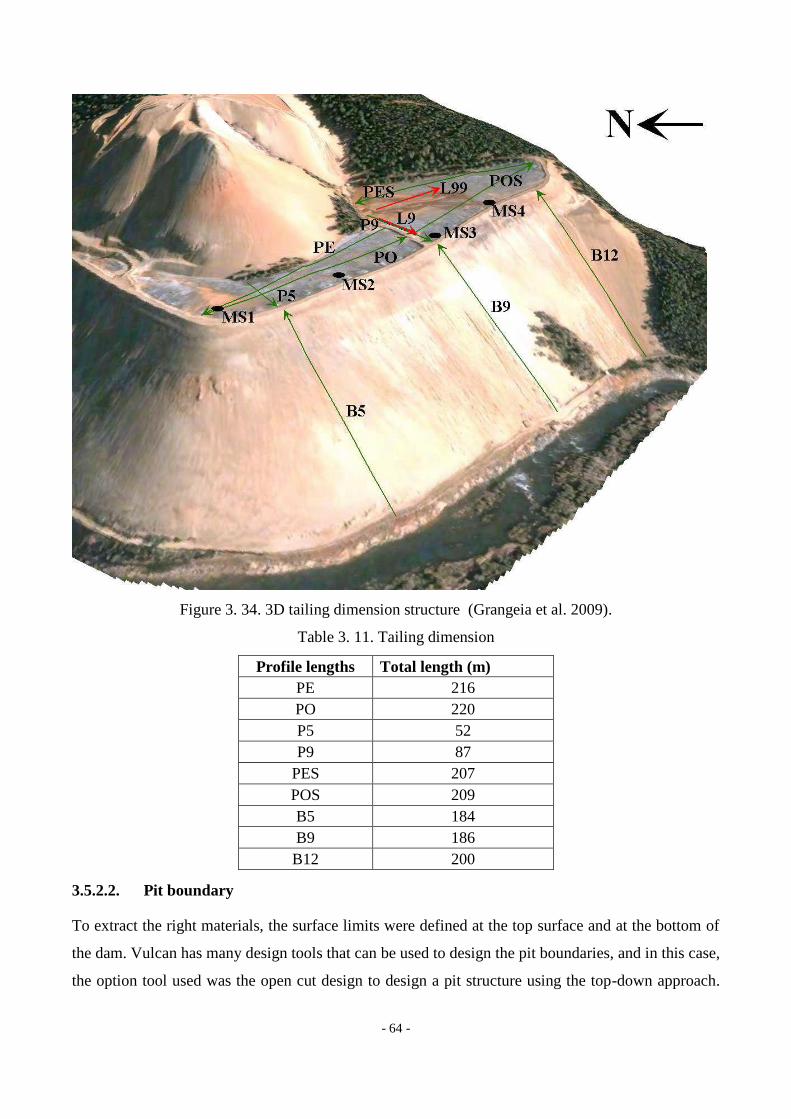
- 64 -
Figure 3. 34. 3D tailing dimension structure (Grangeia et al. 2009).
Table 3. 11. Tailing dimension
Profile lengths Total length (m)
PE 216
PO 220
P5 52
P9 87
PES 207
POS 209
B5 184
B9 186
B12 200
3.5.2.2. Pit boundary
To extract the right materials, the surface limits were defined at the top surface and at the bottom of
the dam. Vulcan has many design tools that can be used to design the pit boundaries, and in this case,
the option tool used was the open cut design to design a pit structure using the top-down approach.
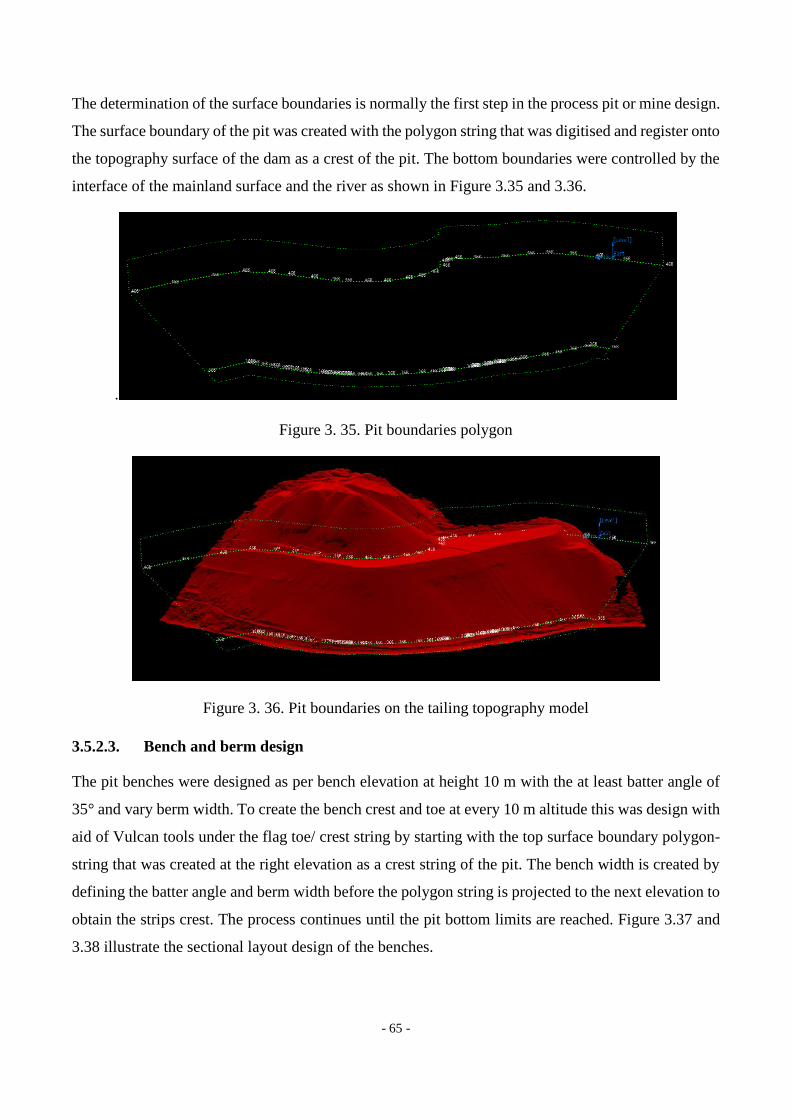
- 65 -
The determination of the surface boundaries is normally the first step in the process pit or mine design.
The surface boundary of the pit was created with the polygon string that was digitised and register onto
the topography surface of the dam as a crest of the pit. The bottom boundaries were controlled by the
interface of the mainland surface and the river as shown in Figure 3.35 and 3.36.
.
Figure 3. 35. Pit boundaries polygon
Figure 3. 36. Pit boundaries on the tailing topography model
3.5.2.3. Bench and berm design
The pit benches were designed as per bench elevation at height 10 m with the at least batter angle of
35° and vary berm width. To create the bench crest and toe at every 10 m altitude this was design with
aid of Vulcan tools under the flag toe/ crest string by starting with the top surface boundary polygon-
string that was created at the right elevation as a crest string of the pit. The bench width is created by
defining the batter angle and berm width before the polygon string is projected to the next elevation to
obtain the strips crest. The process continues until the pit bottom limits are reached. Figure 3.37 and
3.38 illustrate the sectional layout design of the benches.

- 66 -
Figure 3. 37. The cross sectional showing bench layout (Pit resource)
Figure 3. 38. The cross sectional showing bench layout (Entire tailing resource)
3.5.2.4. Strip Design
In total 21 polygon strings of crest and toe were created on the topography in strike direction of the
dam at the interval height of 10 m with the slope angle about 35° and strip berm at least 2.5 m projected
on each following bench grid. Figure 3.39 shows the polygon projected design of the benches while
Figure 3.40 present the model of the strip after the strip was converted to create the surface
triangulation model that was used in the next stage as the bench.

- 67 -
Figure 3. 39. Strip polygon of the pit design
Figure 3. 40. Pit strip design triangulation model
3.5.2.5. Pit Design - Boolean
To design the pit or cut on the topography with the objective to extract the mineable materials target it
is illustrated in Figure 3.40 and 3.41. The operation illustrates in that figure is known as Boolean in
Vulcan. This is actually the option that cut/creates a solid by intersecting the two solid triangulation or
surface triangulation. The triangulations model used in this process were the 2017SPDT, 1955T and
2017T. The procedure to create the pit cut by Boolean start with the validity of the triangulations then
use the Exclude option on the Boolean to select the triangulation portion that must be retained than the
one aimed to be reject. Secondly, the Invert Boolean option is used to invert to form a solid and reject
other parts that have to be excluded. In this case, the reject part is the mined resourced that is shown
in Figure 3.42.
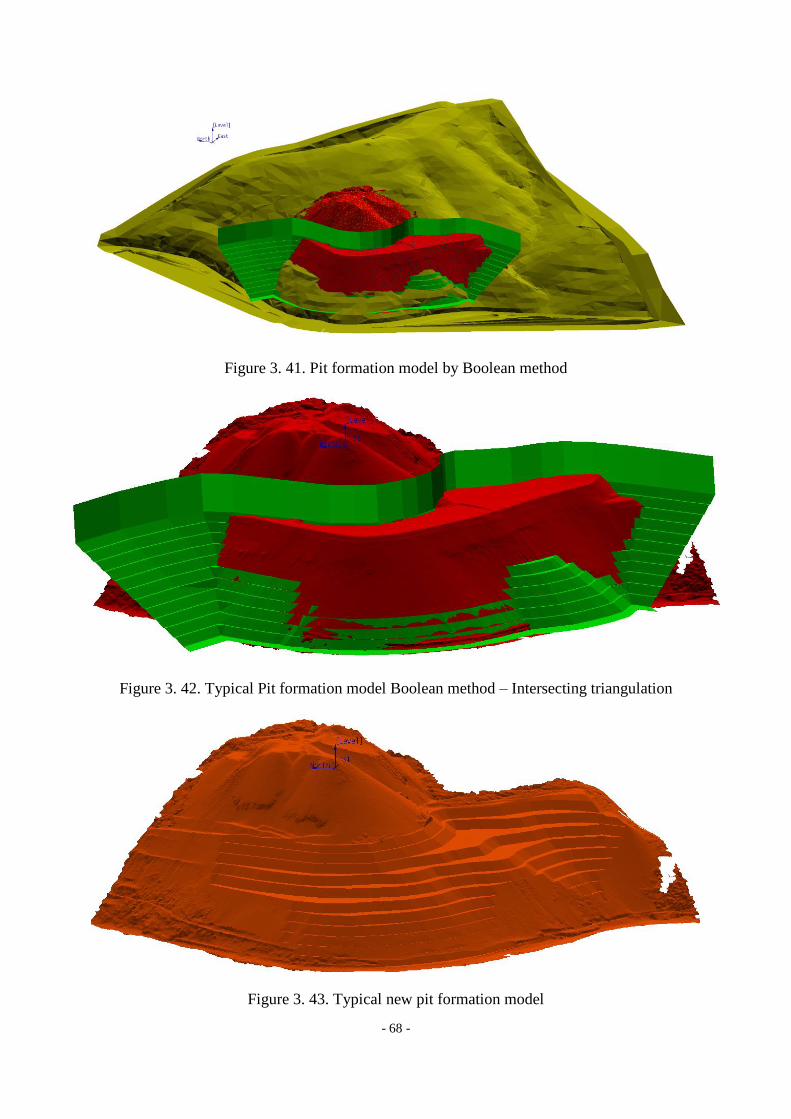
- 68 -
Figure 3. 41. Pit formation model by Boolean method
Figure 3. 42. Typical Pit formation model Boolean method – Intersecting triangulation
Figure 3. 43. Typical new pit formation model
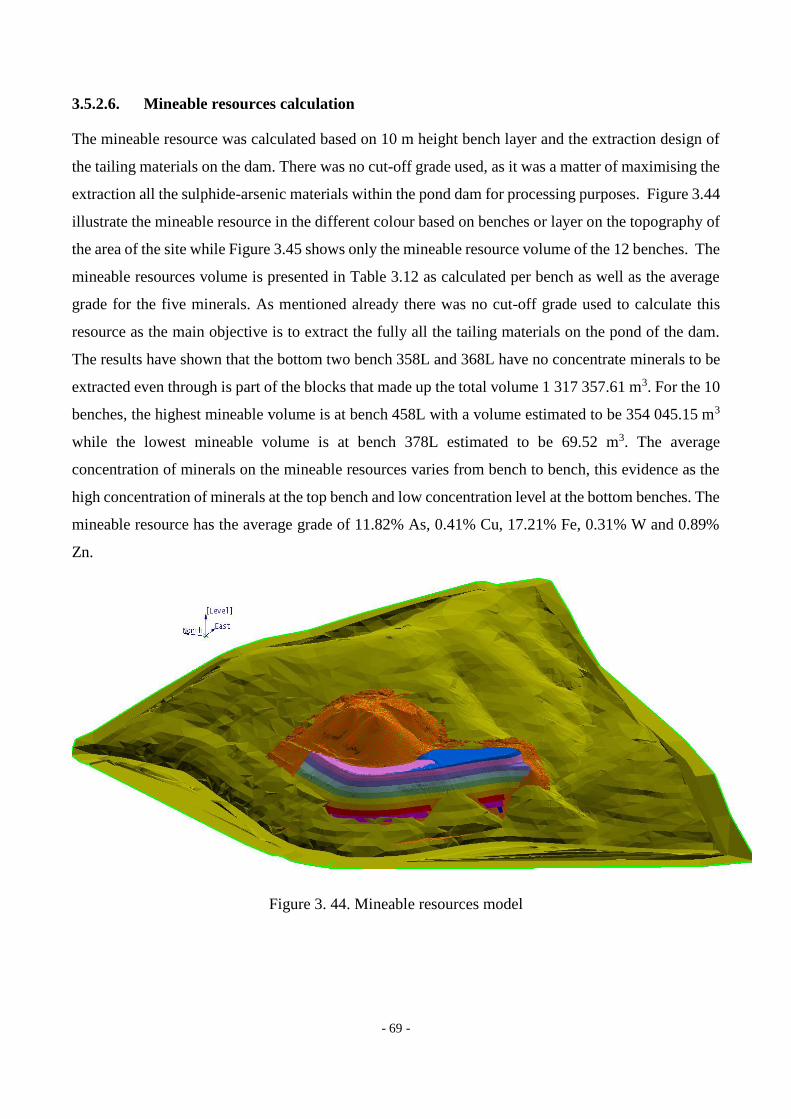
- 69 -
3.5.2.6. Mineable resources calculation
The mineable resource was calculated based on 10 m height bench layer and the extraction design of
the tailing materials on the dam. There was no cut-off grade used, as it was a matter of maximising the
extraction all the sulphide-arsenic materials within the pond dam for processing purposes. Figure 3.44
illustrate the mineable resource in the different colour based on benches or layer on the topography of
the area of the site while Figure 3.45 shows only the mineable resource volume of the 12 benches. The
mineable resources volume is presented in Table 3.12 as calculated per bench as well as the average
grade for the five minerals. As mentioned already there was no cut-off grade used to calculate this
resource as the main objective is to extract the fully all the tailing materials on the pond of the dam.
The results have shown that the bottom two bench 358L and 368L have no concentrate minerals to be
extracted even through is part of the blocks that made up the total volume 1 317 357.61 m3. For the 10
benches, the highest mineable volume is at bench 458L with a volume estimated to be 354 045.15 m3
while the lowest mineable volume is at bench 378L estimated to be 69.52 m3. The average
concentration of minerals on the mineable resources varies from bench to bench, this evidence as the
high concentration of minerals at the top bench and low concentration level at the bottom benches. The
mineable resource has the average grade of 11.82% As, 0.41% Cu, 17.21% Fe, 0.31% W and 0.89%
Zn.
Figure 3. 44. Mineable resources model

- 70 -
Figure 3. 45. Mineable resources model
Table 3. 12. Mining resource calculation of optimum per bench report
3.5.2.7. Final pit shape
Once the mineable resource of 1 317 357.61 m3 is extracted it is estimated that about 1 722 139.39 m3
of coarse tailing materials will remain unexploited for the processing and this is shown in Figure 3.43
and 3.46 models. While Figure 3.47 present the contour map of the site as it assumed to be visual prior
the habitation and the reshaping of the entire tailing dam slopes.
Bench Geology % As % Cu % Fe % W % Zn Tailing volume per bench (m3)
358L tailing 0.00 0.00 0.00 0.00 0.00 0.00
368L tailing 0.00 0.00 0.00 0.00 0.00 0.00
378L tailing 10.56 0.31 8.13 0.35 0.67 69.52
388L tailing 9.49 0.31 9.86 0.33 0.68 1696.15
398L tailing 9.82 0.35 13.65 0.32 0.74 12507.57
408L tailing 10.08 0.36 14.03 0.32 0.76 39439.87
418L tailing 10.68 0.38 15.33 0.32 0.80 106553.38
428L tailing 10.84 0.38 15.30 0.31 0.81 166306.38
438L tailing 10.74 0.37 14.96 0.31 0.80 241923.72
448L tailing 11.29 0.39 16.40 0.30 0.83 340179.25
458L tailing 13.59 0.46 20.45 0.33 1.05 354045.15
468L tailing 15.37 0.46 23.97 0.27 1.12 54636.62
Rio_dum tailing 11.82 0.41 17.21 0.31 0.89 1317357.61
Mineable resources/reserve per bench
Total mineable resources/reserve

- 71 -
Figure 3. 46. Final model of the pit with coarse tailing unmined
Figure 3. 47. General aspect of the contour map of Rio tailing

- 72 -
3.5.2.8. Extraction method
It is envisage that the conventional approach of direct excavate-loading-haulage and dumping truck
will the best option to mine of the Rio tailing resource. The trucks will transport from the tailing dam
to the old processing plant that is locates at Rio processing plant as shown in Figure 3.51.
3.6. Remediation Planning of the Rio Tailing
Mining is a primary industry that based on the extraction of the valuable minerals parts on the earth’s
crust and majorities of the minerals are found in them non-native form this led to the need for further
downstream processing such as flotation and dense medium separation. The separation of valuable
mines from gauge leave millions of tonnes to know as tailing deposited near mining sites all over the
world. The negative impacts of the deposited tailing both in term of environmental and social are some
of the major threat to the ecosystem, especially to the water sources this is evidence as it has been
discussed over the years by various authors and shit in mineral waste management policy all over the
world. These negative impact often are due to the mining companies abandoning mining site due to
the reason such as deposit depletion, relocation to new sites or economical reseasons. This impact is
mostly observed only once the site is abandoned and no environmental control is carried out on the
site.
Figure 3. 48. Release levels of concentrate from an untreated tailings deposition
Figure 3.48 the illustration the general release of concentrate from tailing deposition and background
over time into the river when the control is assumed applied. It shows that the acceptable and
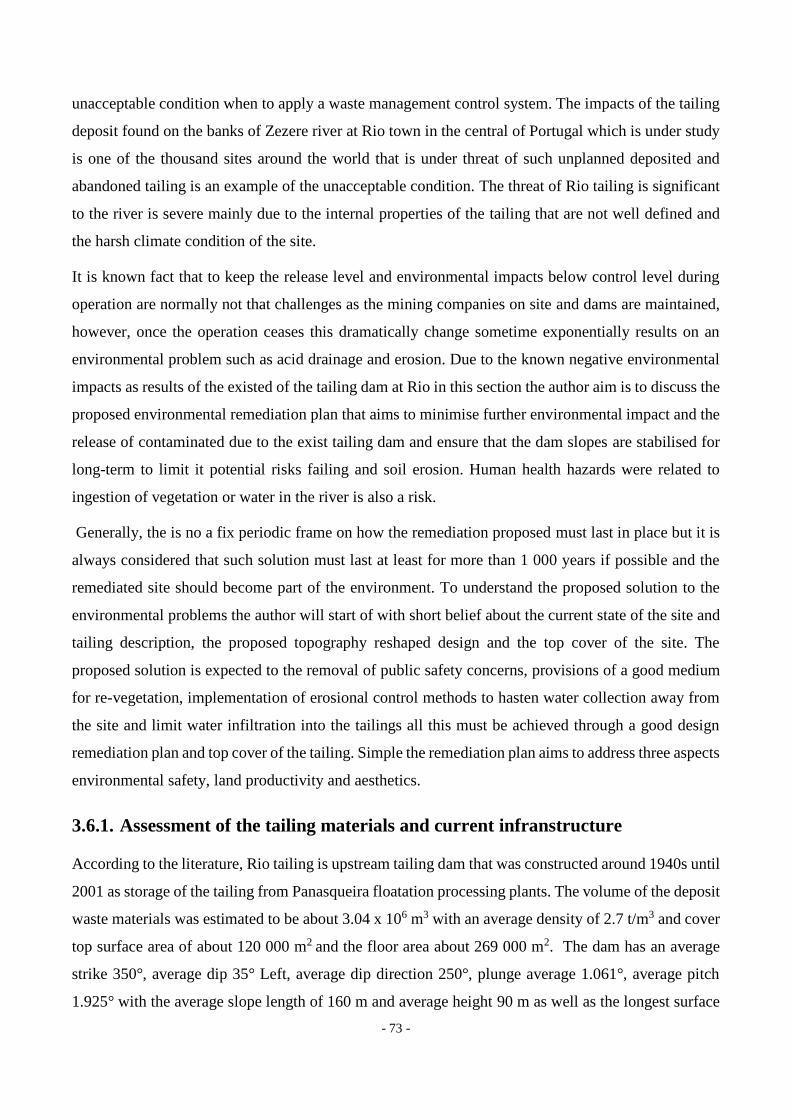
- 73 -
unacceptable condition when to apply a waste management control system. The impacts of the tailing
deposit found on the banks of Zezere river at Rio town in the central of Portugal which is under study
is one of the thousand sites around the world that is under threat of such unplanned deposited and
abandoned tailing is an example of the unacceptable condition. The threat of Rio tailing is significant
to the river is severe mainly due to the internal properties of the tailing that are not well defined and
the harsh climate condition of the site.
It is known fact that to keep the release level and environmental impacts below control level during
operation are normally not that challenges as the mining companies on site and dams are maintained,
however, once the operation ceases this dramatically change sometime exponentially results on an
environmental problem such as acid drainage and erosion. Due to the known negative environmental
impacts as results of the existed of the tailing dam at Rio in this section the author aim is to discuss the
proposed environmental remediation plan that aims to minimise further environmental impact and the
release of contaminated due to the exist tailing dam and ensure that the dam slopes are stabilised for
long-term to limit it potential risks failing and soil erosion. Human health hazards were related to
ingestion of vegetation or water in the river is also a risk.
Generally, the is no a fix periodic frame on how the remediation proposed must last in place but it is
always considered that such solution must last at least for more than 1 000 years if possible and the
remediated site should become part of the environment. To understand the proposed solution to the
environmental problems the author will start of with short belief about the current state of the site and
tailing description, the proposed topography reshaped design and the top cover of the site. The
proposed solution is expected to the removal of public safety concerns, provisions of a good medium
for re-vegetation, implementation of erosional control methods to hasten water collection away from
the site and limit water infiltration into the tailings all this must be achieved through a good design
remediation plan and top cover of the tailing. Simple the remediation plan aims to address three aspects
environmental safety, land productivity and aesthetics.
3.6.1. Assessment of the tailing materials and current infranstructure
According to the literature, Rio tailing is upstream tailing dam that was constructed around 1940s until
2001 as storage of the tailing from Panasqueira floatation processing plants. The volume of the deposit
waste materials was estimated to be about 3.04 x 10⁶ m3 with an average density of 2.7 t/m3 and cover
top surface area of about 120 000 m2 and the floor area about 269 000 m2. The dam has an average
strike 350°, average dip 35° Left, average dip direction 250°, plunge average 1.061°, average pitch
1.925° with the average slope length of 160 m and average height 90 m as well as the longest surface

- 74 -
length about 435 m. The climate condition at the site that is a crucial factor on the dam stabilisation
for Panasqueira region is very aggressive with hot and dry conditions during summer, and very cold,
rainy and windy in the winter.
Based on the geochemical site investigation that was undertaken by Ávila, Da Silva, and Farinha
(2007) the tailing dam has a varied grain distribution due to the successive finer grinding procedures
and site climate condition. Figure 3.49 shows the topography image of the site and the tailing dam as
well as the town of Rio were the processing plant was those years. The materials were usually
classifieds as coarse sterile from the mine used for construction, the coarse tailing from the heavy
media separation, sand, mud, and slush. The Rio tailing is known to contained abundant amounts of
cordite, sphalerite, wolframite, quartz, nitrobarite, montmorillonite, ilitevermiculite, some silicates like
kaolinite, and sulphate minerals. Rio tailing was also estimated to be have a high concentrate of heavy
mineral they ranges are as follow: As (3 094 –240 000 mg kg-1), Cd (28 – 4 028 mg kg-1), Cu (78 –7
200 mg kg-1), Fe (5.3 – 28.8 %), and Zn (142 – 27 000 mg kg-1)). Those values are based on the
chemical analysis that was conducted on the six drill core materials from Dinis da Gama (2002)
investigation report on Geotechnical and laboratory study of the tailings in the River Zêzere waste
heap. The pond materials were described to have an average permeability about 3.6 x10⁻⁹ cm/s, the
coefficient of consolidation also about 5.9 x 10⁻⁴ cm2/s.
Figure 3. 49. Cabeço do Pião district and Rio tailings deposit image (Source: Google Earth image)
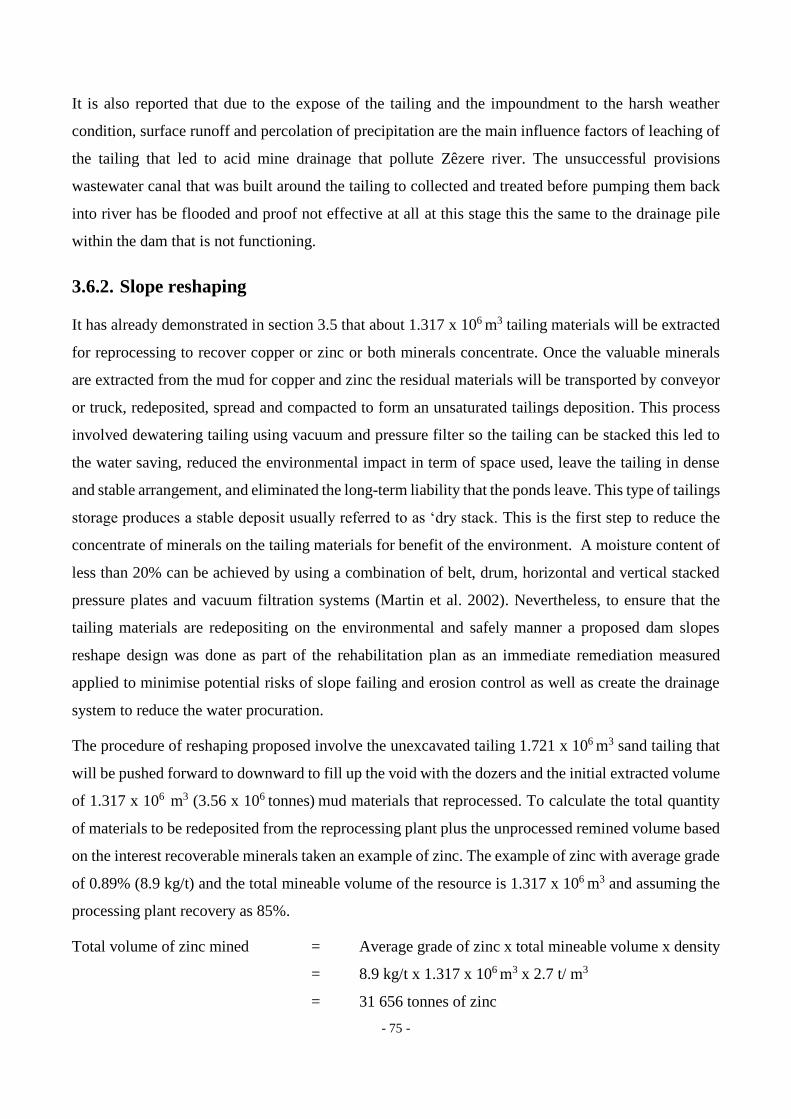
- 75 -
It is also reported that due to the expose of the tailing and the impoundment to the harsh weather
condition, surface runoff and percolation of precipitation are the main influence factors of leaching of
the tailing that led to acid mine drainage that pollute Zêzere river. The unsuccessful provisions
wastewater canal that was built around the tailing to collected and treated before pumping them back
into river has be flooded and proof not effective at all at this stage this the same to the drainage pile
within the dam that is not functioning.
3.6.2. Slope reshaping
It has already demonstrated in section 3.5 that about 1.317 x 10⁶ m3 tailing materials will be extracted
for reprocessing to recover copper or zinc or both minerals concentrate. Once the valuable minerals
are extracted from the mud for copper and zinc the residual materials will be transported by conveyor
or truck, redeposited, spread and compacted to form an unsaturated tailings deposition. This process
involved dewatering tailing using vacuum and pressure filter so the tailing can be stacked this led to
the water saving, reduced the environmental impact in term of space used, leave the tailing in dense
and stable arrangement, and eliminated the long-term liability that the ponds leave. This type of tailings
storage produces a stable deposit usually referred to as ‘dry stack. This is the first step to reduce the
concentrate of minerals on the tailing materials for benefit of the environment. A moisture content of
less than 20% can be achieved by using a combination of belt, drum, horizontal and vertical stacked
pressure plates and vacuum filtration systems (Martin et al. 2002). Nevertheless, to ensure that the
tailing materials are redepositing on the environmental and safely manner a proposed dam slopes
reshape design was done as part of the rehabilitation plan as an immediate remediation measured
applied to minimise potential risks of slope failing and erosion control as well as create the drainage
system to reduce the water procuration.
The procedure of reshaping proposed involve the unexcavated tailing 1.721 x 10⁶ m3 sand tailing that
will be pushed forward to downward to fill up the void with the dozers and the initial extracted volume
of 1.317 x 10⁶ m3 (3.56 x 10⁶ tonnes) mud materials that reprocessed. To calculate the total quantity
of materials to be redeposited from the reprocessing plant plus the unprocessed remined volume based
on the interest recoverable minerals taken an example of zinc. The example of zinc with average grade
of 0.89% (8.9 kg/t) and the total mineable volume of the resource is 1.317 x 10⁶ m3 and assuming the
processing plant recovery as 85%.
Total volume of zinc mined = Average grade of zinc x total mineable volume x density
= 8.9 kg/t x 1.317 x 10⁶ m3 x 2.7 t/ m3
= 31 656 tonnes of zinc
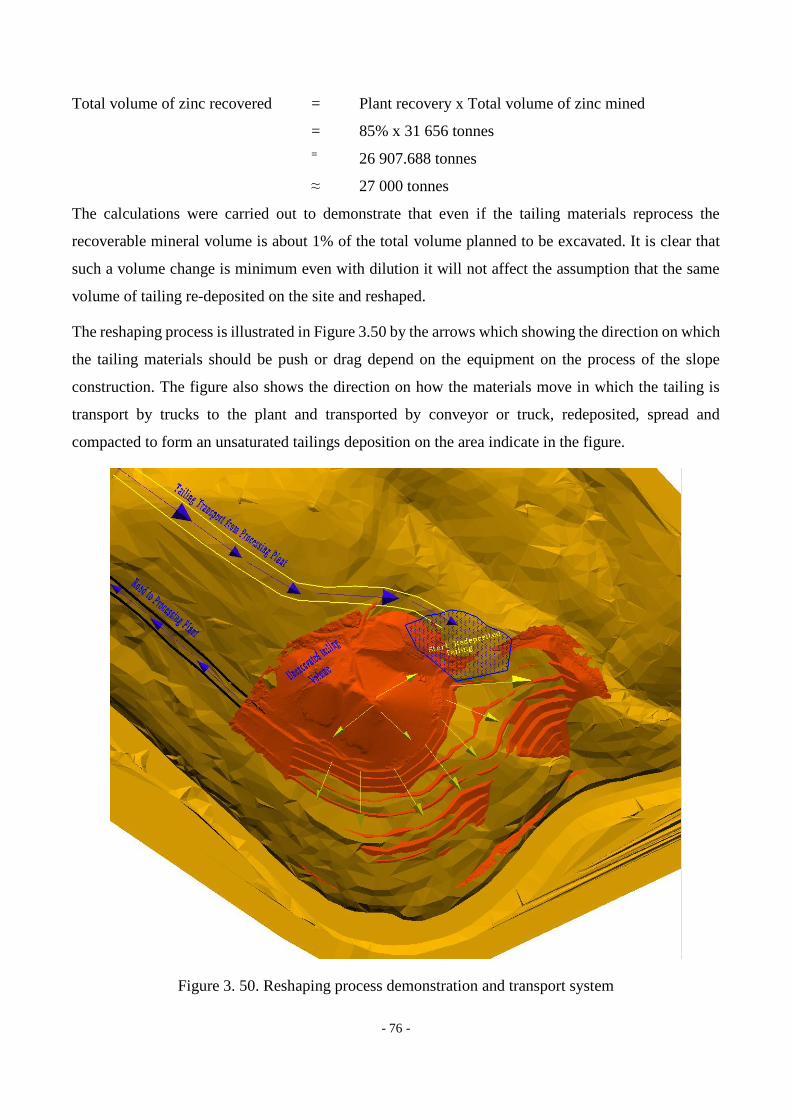
- 76 -
Total volume of zinc recovered = Plant recovery x Total volume of zinc mined
= 85% x 31 656 tonnes
= 26 907.688 tonnes
≈ 27 000 tonnes
The calculations were carried out to demonstrate that even if the tailing materials reprocess the
recoverable mineral volume is about 1% of the total volume planned to be excavated. It is clear that
such a volume change is minimum even with dilution it will not affect the assumption that the same
volume of tailing re-deposited on the site and reshaped.
The reshaping process is illustrated in Figure 3.50 by the arrows which showing the direction on which
the tailing materials should be push or drag depend on the equipment on the process of the slope
construction. The figure also shows the direction on how the materials move in which the tailing is
transport by trucks to the plant and transported by conveyor or truck, redeposited, spread and
compacted to form an unsaturated tailings deposition on the area indicate in the figure.
Figure 3. 50. Reshaping process demonstration and transport system
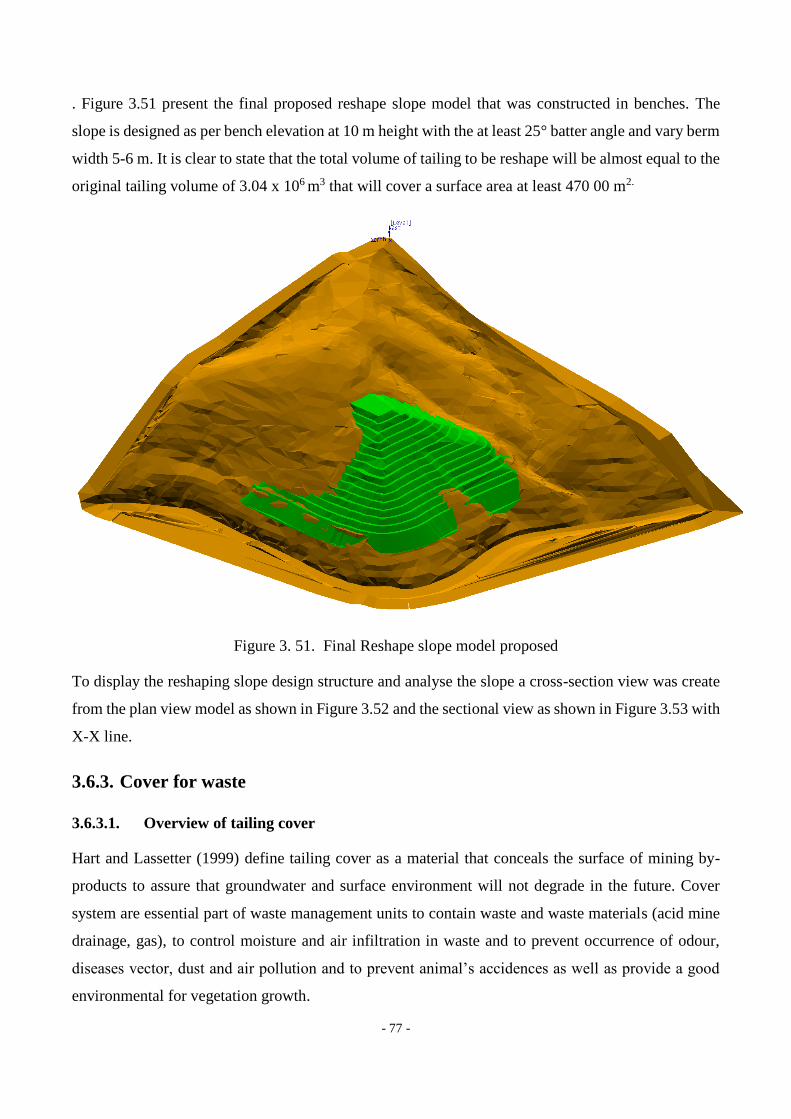
- 77 -
. Figure 3.51 present the final proposed reshape slope model that was constructed in benches. The
slope is designed as per bench elevation at 10 m height with the at least 25° batter angle and vary berm
width 5-6 m. It is clear to state that the total volume of tailing to be reshape will be almost equal to the
original tailing volume of 3.04 x 10⁶ m3 that will cover a surface area at least 470 00 m2.
Figure 3. 51. Final Reshape slope model proposed
To display the reshaping slope design structure and analyse the slope a cross-section view was create
from the plan view model as shown in Figure 3.52 and the sectional view as shown in Figure 3.53 with
X-X line.
3.6.3. Cover for waste
3.6.3.1. Overview of tailing cover
Hart and Lassetter (1999) define tailing cover as a material that conceals the surface of mining by-
products to assure that groundwater and surface environment will not degrade in the future. Cover
system are essential part of waste management units to contain waste and waste materials (acid mine
drainage, gas), to control moisture and air infiltration in waste and to prevent occurrence of odour,
diseases vector, dust and air pollution and to prevent animal’s accidences as well as provide a good
environmental for vegetation growth.
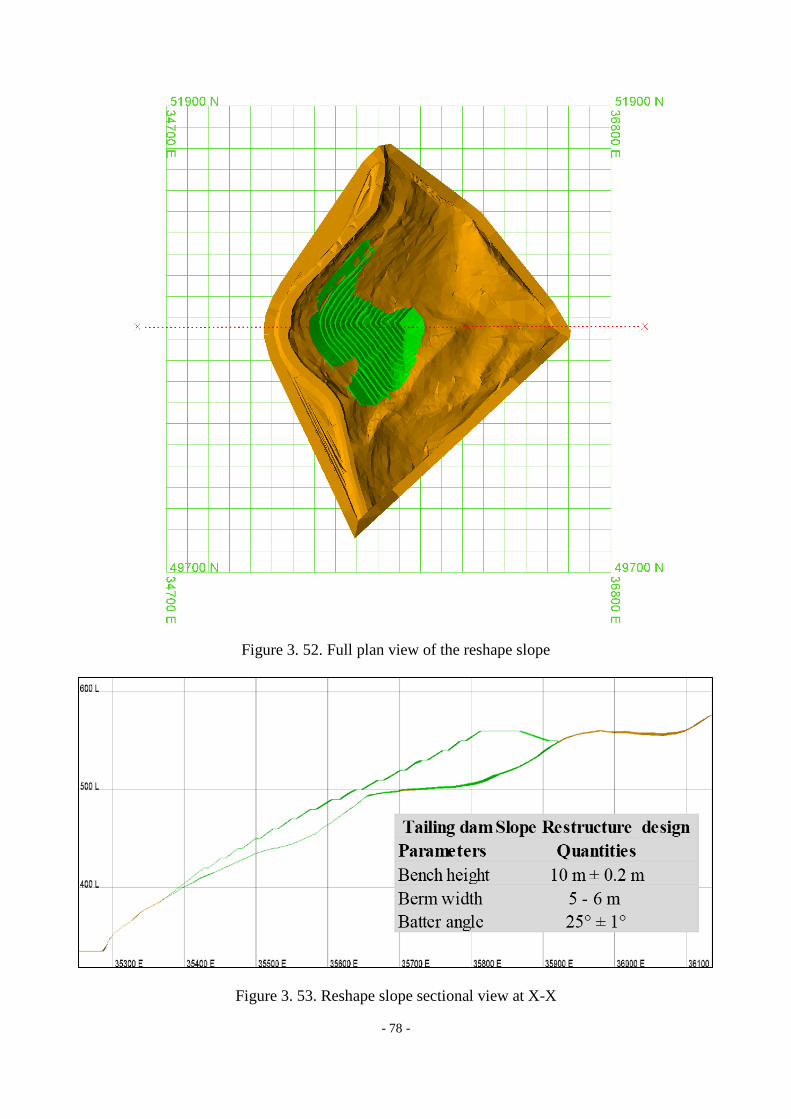
- 78 -
Figure 3. 52. Full plan view of the reshape slope
Figure 3. 53. Reshape slope sectional view at X-X

- 79 -
Generally, there are four common types of waste cover systems or barriers used in mining and
environment with the objective to minimise the percolation of water in the soil. They are hydraulic
(water shedding), oxygen (capillary) evapotranspirative, submerge and aesthetic cover.
The hydraulic cover is used a low permeability physical barrier to impede the downward migration of
water into the acidic upper oxidised part of the tailings and into the groundwater. The common
materials used are compacted clay layers, geosynthetic clay liners, and geomembranes. In some
instance, a sand layer is placed below the clay layers to act as a capillary break.
The capillary cover normally is the system that consists of one or more layer of fines grained soil
overlying one or more layer of coarse-grained soil. They determination is to limit the amount of oxygen
going into the tailing either through water or multi-layer soil covers while the lower part of the layer
still is unsaturated to support high suction at soil interface. If the tailing is cover with water this system
is understood to reduce the acid generation potential by more than 95 % this is done on the wet location.
In arid or semi-arid site multi-layers soil, the cover is normally use made up of the lower capillary
break, overlain by clay or silt and an erosion protection layer.
The evapotranspiration option is used usually at the arid and semi-arid environment. This cover
consists of a thick layer of fine-grained soil capable of supporting vegetation. They should special
characteristics of fine-grained the storage capacity as they store a massive amount of water and low
hydraulic conductivity even at a high-saturated site. The design of the evapotranspiration is depended
on the frequency and intensity of rainfall, unsaturated hydraulic properties, of the soil and the
vegetation. Silty sandy, silty and clayey silts are the most common materials used in this kind of this
kind of system.
On the other hand, the aesthetic cover purpose is used to improve tailing surface appearance, limit
tailing and surface runoff contact and prevent surface erosion. Normally used where there is a limited
acid generation.
3.6.3.2. Closure option at Rio tailing dam
To decide the cover the option a site-site specific risk assessment and expected requirements for a
remediate site were evaluated to define the best option. In this case, the recommended option was the
hydraulic cover system. This option includes the design of the soil cover system and re-vegetation of
the site to encourage the creation of the new bionetwork. Some of the advantages of this option are the
provision of the growth medium for plant life, limit water ingress and oxygen diffusion into tailing,
erosion prevention and it further reduce heavy metal leaching. Nevertheless, this option has also some

- 80 -
drawbacks such as periodic maintenance after remediation, a large amount of borrowed materials for
cover and high capital cost associated. Other options such as the capillary cover with water and
synthetic liner only were discard due to the high capital cost and complexity to monitor at Rio site.
3.6.3.3. Cover measures
Based on the objective mentioned early the hydraulic cover option will be constructed to maximise
moisture retention and promote the growth and re-vegetation of the native species at the site. It was
also planned to promote surface runoff and drainage system then form part of the re-contoured design.
3.6.3.4. Proposed hydraulic barrier cover system
Based on the site climate condition, tailing materials chemical properties and re-contouring of the slope
the profile of the cover is selected to consist of a surface layer, drainage layer, hydraulic barrier layer
and foundation layer. The structures of the cover are designed to limit meteoric penetration by shedding
runoff flow and aid limit water entry and oxygen diffusion into tailings materials as well as for tailing
stabilisation. Figure 3.54 shows the proposed cover structure, and each section is discussed in detail to
offer more information below.
The surface layer will provide the counterattack erosion by wind and water, provide a growing medium
for vegetation and please the site aesthetic. This layer will also store water that infiltrated until its
return to the atmosphere by evapotranspiration, prevent intrusion by burrowing animals and human as
well as protect the underlying layer from climate changes. The recommended materials that can be
used for the surface cover can be as borrowed topsoil or amended topsoil, riprap, mixture gravel soil
or any locally available materials.
The drainage layer that is also known as internal drainage layer that will be responsible for limiting
the build-up of hydraulic head on the underlying barrier layer which reduces the infiltration of water
through the barrier and drains the overlying layer while it also helps to reduce erosion by controlling
the time which the surface cover can be saturated. It also prevents excessive seepage force in surface
layer materials to improve the slope stability.

- 81 -
Figure 3. 54. Schematic cross sections of cover system structure
Depended on the available materials but the suitable materials for this layer are such as sand, gravel
and geocomposite drainage materials. A geotextile cushion layer can then be installed between the
drainage layer of gravel and the underlying geomembrane layer as shown in Figure 3.54.
Geomembranes and geotextile are manufactured polymeric materials that are used due to their non-
porous structure, flexibility and ease of installation.
To further minimise the percolation of water and restrict migration of gases either from the atmosphere
into the tailing or another way through the cover system the hydraulic barrier is essential for that
purpose. Based on the experience gain in the USA it is recommended that both compacted clay and
geomembrane are the best option for the long-term remediation to maintain low compacted clay
permeability in a cover application to achieve prolong the life of the cover (Bonaparte and Yanful
2001). The life of geomembrane is normally affected by a factor such as a particle size distribution of
the soils and granular angularity, acidity/alkalinity, sodium, lime hydration, concrete, metal ions
present, the presence of oxygen, moisture content, organic content, temperature and microorganisms
(Rollin 2004). Therefore, the selection of this should be based on the BAT (Best Available Techniques)
Reference Document (BREF) entitled tailing waste.
Foundation layer is an essential section of the cover that provides the grade control for the cover system
constructed and sufficient bearing capacity for overlying layers as well as to provide a smooth surface

- 82 -
for installation of the geomembrane and geotextile. The suitable materials for the foundation are
normally any uncontaminated soil available close to the site.
3.6.3.5. Surface water management and monitoring system
Inter-bench drains built from riprap will be constructed at no more than 10 m intervals to collect surface
water and capillary water then treated before pumping into the river. To manage the water movement
and movement of chemicals the monitoring system is required. It is necessary to develop the plan
based on the be based on the BAT (Best Available Techniques) Reference Document (BREF) entitled
tailing monitoring and water management
3.6.3.6. Revegetation
After the reshaping, the benches and the construction of the cover system it is expected that native
grasses and shrubs seeds that must be collected during wintertime must be planned on the surface layer
to prepare the ground for the new life when local plants take over once planted. The plants must be
raised in the nursery and the seedlings transplanted on the benches. This way will control the spacing
and arrangement of the plants.
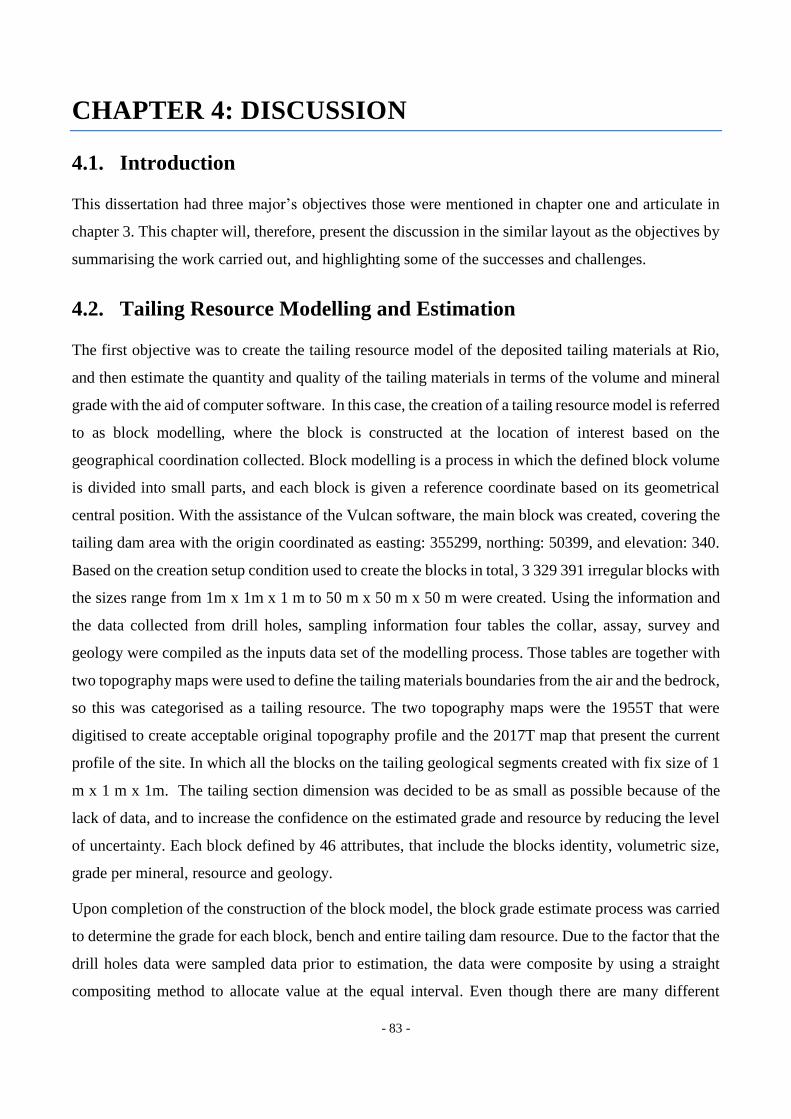
- 83 -
CHAPTER 4: DISCUSSION
4.1. Introduction
This dissertation had three major’s objectives those were mentioned in chapter one and articulate in
chapter 3. This chapter will, therefore, present the discussion in the similar layout as the objectives by
summarising the work carried out, and highlighting some of the successes and challenges.
4.2. Tailing Resource Modelling and Estimation
The first objective was to create the tailing resource model of the deposited tailing materials at Rio,
and then estimate the quantity and quality of the tailing materials in terms of the volume and mineral
grade with the aid of computer software. In this case, the creation of a tailing resource model is referred
to as block modelling, where the block is constructed at the location of interest based on the
geographical coordination collected. Block modelling is a process in which the defined block volume
is divided into small parts, and each block is given a reference coordinate based on its geometrical
central position. With the assistance of the Vulcan software, the main block was created, covering the
tailing dam area with the origin coordinated as easting: 355299, northing: 50399, and elevation: 340.
Based on the creation setup condition used to create the blocks in total, 3 329 391 irregular blocks with
the sizes range from 1m x 1m x 1 m to 50 m x 50 m x 50 m were created. Using the information and
the data collected from drill holes, sampling information four tables the collar, assay, survey and
geology were compiled as the inputs data set of the modelling process. Those tables are together with
two topography maps were used to define the tailing materials boundaries from the air and the bedrock,
so this was categorised as a tailing resource. The two topography maps were the 1955T that were
digitised to create acceptable original topography profile and the 2017T map that present the current
profile of the site. In which all the blocks on the tailing geological segments created with fix size of 1
m x 1 m x 1m. The tailing section dimension was decided to be as small as possible because of the
lack of data, and to increase the confidence on the estimated grade and resource by reducing the level
of uncertainty. Each block defined by 46 attributes, that include the blocks identity, volumetric size,
grade per mineral, resource and geology.
Upon completion of the construction of the block model, the block grade estimate process was carried
to determine the grade for each block, bench and entire tailing dam resource. Due to the factor that the
drill holes data were sampled data prior to estimation, the data were composite by using a straight
compositing method to allocate value at the equal interval. Even though there are many different
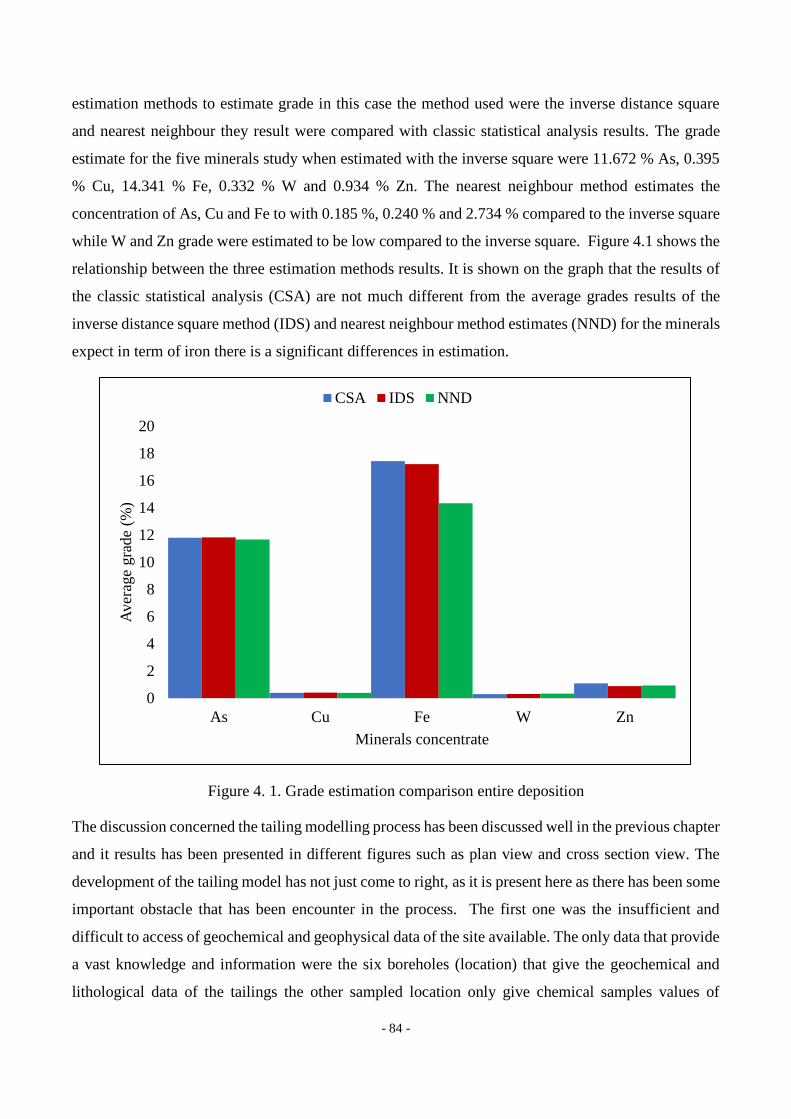
- 84 -
estimation methods to estimate grade in this case the method used were the inverse distance square
and nearest neighbour they result were compared with classic statistical analysis results. The grade
estimate for the five minerals study when estimated with the inverse square were 11.672 % As, 0.395
% Cu, 14.341 % Fe, 0.332 % W and 0.934 % Zn. The nearest neighbour method estimates the
concentration of As, Cu and Fe to with 0.185 %, 0.240 % and 2.734 % compared to the inverse square
while W and Zn grade were estimated to be low compared to the inverse square. Figure 4.1 shows the
relationship between the three estimation methods results. It is shown on the graph that the results of
the classic statistical analysis (CSA) are not much different from the average grades results of the
inverse distance square method (IDS) and nearest neighbour method estimates (NND) for the minerals
expect in term of iron there is a significant differences in estimation.
Figure 4. 1. Grade estimation comparison entire deposition
The discussion concerned the tailing modelling process has been discussed well in the previous chapter
and it results has been presented in different figures such as plan view and cross section view. The
development of the tailing model has not just come to right, as it is present here as there has been some
important obstacle that has been encounter in the process. The first one was the insufficient and
difficult to access of geochemical and geophysical data of the site available. The only data that provide
a vast knowledge and information were the six boreholes (location) that give the geochemical and
lithological data of the tailings the other sampled location only give chemical samples values of
0
2
4
6
8
10
12
14
16
18
20
As Cu Fe W Zn
Aver
age
gra
de
(%)
Minerals concentrate
CSA IDS NND
- 85 -
minerals per points. Due to the scarcity of the data as it has mentioned before it was decided that the
traditional estimation methods of grade estimate applied to the block then to use more advanced
geostatistics methods such as ordinal kriging or multi-variable kriging those may yield better
estimation results than the traditional methods. Therefore, this shortage of data affects the reliability
of resource model that must keep in mind when interpreting and applying the estimation or planning.
The second challenge encounter on the process of constructing the tailing model was the geographical
coordinate system convention. As it has already stated that this project was based on the secondary
data that were collected over the years during the geological construction, it comes to right that each
data set available was surveyed with the different geographic coordinate system. The difference in the
coordinate system imposes a challenge to locate the true locations of the boreholes on the blocks. Even
thought that all the coordinates were converted from various system to the ETRS 89-PPTM06: EPSG:
3763 by using the advance I-Site Studio software there was still some uncertainty and error to locate
the true location of the boreholes. Again, a precaution must be taken when interpreting and applying
the collar data to any calculation since that the true location of the six significant boreholes drilled
from the data set 2002 were located with certain error and they required to be verified and the system
that was given as they original was not displaying at the correct location.
The third difficulty on the tailing resource modelling and estimation of Rio Tailing dam was imposed
by the data of the original topography. In this dissertation, the topography that was used is the one that
was drawn in 1955 and that was some years after the tailing materials has been deposited at the site.
On the other hand, due to the technology that used at the time the accuracy of the map may not be as
it was supposes to be. As this map was in hard copy format, it digitised to obtain the contours that were
assumed as the topography of the site back in 1951. Even though that the map digitisation was carried
out using two application software and the results were compared to select the best topography map
the error magnitude both in the process and original data cannot be eliminated. This error was believed
to have an impact on resource estimation also to a certain extent even if it has not been defined.
Therefore, this model has resource estimation has to be used as a first approach only on the planning
place of any further activities. To increase the confident level on this resource value estimate it is
necessary to either carry out further investigation to determine the base profile of the site or obtain the
geophysical data from Grangeia et al. (2002) when they investigate the internal structure, supporting
structure and tailings thickness of the tailing dam.

- 86 -
4.3. Planning and Design
The second objective of this dissertation was to develop and design a mining extraction plan of the
tailing resource estimated for the extraction of the major commodities copper, zinc and Wolfram.
Based on the tailing model that was constructed and used to estimate the grade and the in-situ resource
of the tailing dam as 3 039 497 m3 the extraction strategic was developed. In total, there were 3 039
4997 blocks each with 1 m x 1 m x 1 m covered. The target area of exploration on this project was
determined to cover the top surface area of about 120 000 m2 and the floor area about 269 000 m2.
As this is a technical solution and not an economical solution no economic variables were used to this
mean that all the blocks which were within the tailing geological sector were assigned a grade value.
The extraction plan of the portion tailing that was classified as the major threat to the environment was
defined by setting up the surface boundaries. This surface boundary separates the coarse tailing and
the fine mud tailing as presented before mark a significant part as they were the benchmark of the pit.
In this case, it was decided that the top-bottom pit design method is applied to design the pit to extract
the tailing mud in the bench each with 10 m height with a batter angle not greater than 35 ° and the
berm width from 3 m to 8 m. Starting from the 468 m level designing downward the bench design
cover until level 358 m. Each bench grade and resource determined to estimate the mineable materials.
The results have demonstrated that bench grade varies in the entire commodity but what is noticed is
the high concentration of iron and arsenic throughout dam. The total mineable resource was estimated
to be about 1.317 x 10⁶ m3 that is approximately 43 % of the estimated deposited tailing materials over
the years. The mineable resource was estimated to have an average grade of 11.82 % As, 0.41 % Cu,
17.21 % Fe, 0.31 % W and 0.89 % Zn base on the inverse distance square estimation method.
The best option that can be proposed mining technique for this project is the mechanical method of
digging – loading – haulage that must start on the northern edge of the tailing dam at bench 358 m and
progress below until the entire proposed mineable resource section explodes. This the side where the
road is as shown in Figure 3.51.
As already mentioned in the previous section the concern about the accuracy of grade and the resource
estimation due to the error on surface topography map must keep in mind when interpreting or plan
any further step that the is certain degree error on the resource volumetric estimation and grade
estimation due to the insufficient geological data for estimation.
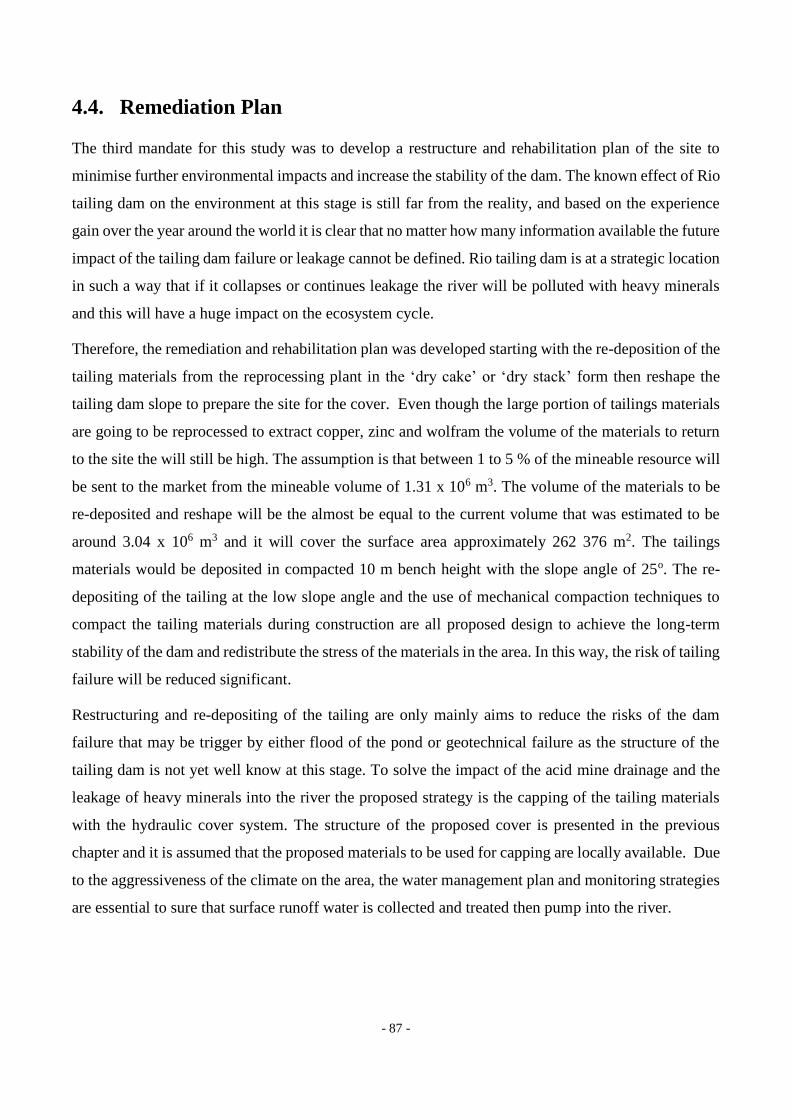
- 87 -
4.4. Remediation Plan
The third mandate for this study was to develop a restructure and rehabilitation plan of the site to
minimise further environmental impacts and increase the stability of the dam. The known effect of Rio
tailing dam on the environment at this stage is still far from the reality, and based on the experience
gain over the year around the world it is clear that no matter how many information available the future
impact of the tailing dam failure or leakage cannot be defined. Rio tailing dam is at a strategic location
in such a way that if it collapses or continues leakage the river will be polluted with heavy minerals
and this will have a huge impact on the ecosystem cycle.
Therefore, the remediation and rehabilitation plan was developed starting with the re-deposition of the
tailing materials from the reprocessing plant in the ‘dry cake’ or ‘dry stack’ form then reshape the
tailing dam slope to prepare the site for the cover. Even though the large portion of tailings materials
are going to be reprocessed to extract copper, zinc and wolfram the volume of the materials to return
to the site the will still be high. The assumption is that between 1 to 5 % of the mineable resource will
be sent to the market from the mineable volume of 1.31 x 10⁶ m3. The volume of the materials to be
re-deposited and reshape will be the almost be equal to the current volume that was estimated to be
around 3.04 x 10⁶ m3 and it will cover the surface area approximately 262 376 m2. The tailings
materials would be deposited in compacted 10 m bench height with the slope angle of 25o. The re-
depositing of the tailing at the low slope angle and the use of mechanical compaction techniques to
compact the tailing materials during construction are all proposed design to achieve the long-term
stability of the dam and redistribute the stress of the materials in the area. In this way, the risk of tailing
failure will be reduced significant.
Restructuring and re-depositing of the tailing are only mainly aims to reduce the risks of the dam
failure that may be trigger by either flood of the pond or geotechnical failure as the structure of the
tailing dam is not yet well know at this stage. To solve the impact of the acid mine drainage and the
leakage of heavy minerals into the river the proposed strategy is the capping of the tailing materials
with the hydraulic cover system. The structure of the proposed cover is presented in the previous
chapter and it is assumed that the proposed materials to be used for capping are locally available. Due
to the aggressiveness of the climate on the area, the water management plan and monitoring strategies
are essential to sure that surface runoff water is collected and treated then pump into the river.
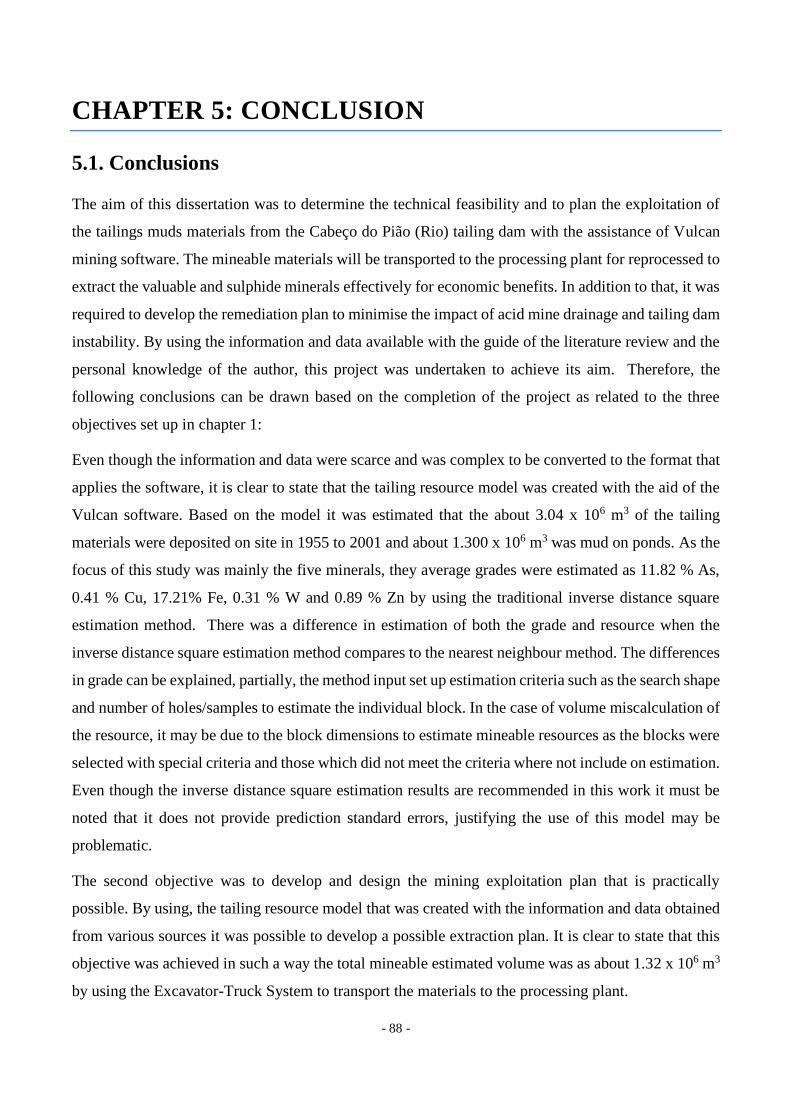
- 88 -
CHAPTER 5: CONCLUSION
5.1. Conclusions
The aim of this dissertation was to determine the technical feasibility and to plan the exploitation of
the tailings muds materials from the Cabeço do Pião (Rio) tailing dam with the assistance of Vulcan
mining software. The mineable materials will be transported to the processing plant for reprocessed to
extract the valuable and sulphide minerals effectively for economic benefits. In addition to that, it was
required to develop the remediation plan to minimise the impact of acid mine drainage and tailing dam
instability. By using the information and data available with the guide of the literature review and the
personal knowledge of the author, this project was undertaken to achieve its aim. Therefore, the
following conclusions can be drawn based on the completion of the project as related to the three
objectives set up in chapter 1:
Even though the information and data were scarce and was complex to be converted to the format that
applies the software, it is clear to state that the tailing resource model was created with the aid of the
Vulcan software. Based on the model it was estimated that the about 3.04 x 10⁶ m3 of the tailing
materials were deposited on site in 1955 to 2001 and about 1.300 x 10⁶ m3 was mud on ponds. As the
focus of this study was mainly the five minerals, they average grades were estimated as 11.82 % As,
0.41 % Cu, 17.21% Fe, 0.31 % W and 0.89 % Zn by using the traditional inverse distance square
estimation method. There was a difference in estimation of both the grade and resource when the
inverse distance square estimation method compares to the nearest neighbour method. The differences
in grade can be explained, partially, the method input set up estimation criteria such as the search shape
and number of holes/samples to estimate the individual block. In the case of volume miscalculation of
the resource, it may be due to the block dimensions to estimate mineable resources as the blocks were
selected with special criteria and those which did not meet the criteria where not include on estimation.
Even though the inverse distance square estimation results are recommended in this work it must be
noted that it does not provide prediction standard errors, justifying the use of this model may be
problematic.
The second objective was to develop and design the mining exploitation plan that is practically
possible. By using, the tailing resource model that was created with the information and data obtained
from various sources it was possible to develop a possible extraction plan. It is clear to state that this
objective was achieved in such a way the total mineable estimated volume was as about 1.32 x 10⁶ m3
by using the Excavator-Truck System to transport the materials to the processing plant.

- 89 -
The third objective was to find a best environmental solution to the currently tailing dam that is a huge
threat both in term of stability and environmental issues related to acid mine drainage and heavy metal
release onto the river. The remediation and rehabilitation plan was developed. This involves the re-
depositing of the dry stack tailing once the interest minerals are extracted: reshape of slope designed
as per bench elevation at 10 m height with the at least 25° batter angle and vary berm width 5 - 6 m
and applied the hydraulic barrier cover system, vegetation and develop and monitoring plan to
minimise further environmental impacts and increase stability of the dam of the long-term.
Finally, it must restate that this project was carried out to determine the technical solution to the tailing
dam that presents a major threat to the river and the ecosystem at large with the aid of the Vulcan
software. It can conclude that Vulcan software is an application that can be used throughout the life of
the mine in planning and designing. This can speed up the planning and design process and it also
reduces the use of paperwork as all the information can be organised on the single system and shared
with other computer application such as AutoCAD and Excel CSV. The only major requirement is to
organise the input data and verify before entered the software to avoid miscalculation and wrong
display of data.
5.2. Recommendations
One of the main challenges in this project was when constructing the tailing resource model of the site,
as there was a shortage geological information and data as at some location there was no sample
undertake. Therefore, the earliest recommendation is to carry out a geochemical and geophysical
survey to increase the volume of the information available and fill up the areas that are not sample. On
the other hand, since that there was a geophysical investigation carried out by Grangeia et al. (2002) it
is essential to obtain those results and includes them in the model.
The second recommendation is related to the geographical coordinate system. As it has already
mentioned that, there has been a challenge to locate the true location of the six boreholes it is essential
that site is visited and locate the location of those boreholes.
The accuracy of the original topography that was used to create the base surface has been highlighted
as a major issue on estimating the correct resource. Therefore, it is significantly important that the
corrected map search and used in this process to estimate the resources.

- 90 -
The fourth recommendation is that since this dissertation has been the focus on the technical solution
to extract the materials on the ponds that observe as the major threat to the ecosystem it is important
also to analysis the economic viability of this project. The economic analysis and production analyses
will be able to determine how much capital is needed to remediate the site.
Even though the remediation planned was developed, it is important to state that there is a need to
study the materials physical properties. The capping plan is proposed to be done with the local
materials therefore, it is also important that is needed to search for such materials in the area nearby.
Finally, the Vulcan software is dynamic and complete software that fully recommend being used in
this kind of projects.
- 91 -
REFERENCES
Ávila, Paula F, E Ferreira Da Silva, and JA Farinha. 2007. "Geochemical signature of mining industry
in the surrounding environment of panasqueira mine (Portugal)." Proc. of the IMWA
Symposium.
Ávila, Paula F, Eduardo Ferreira da Silva, and Carla Candeias. 2016. "Health risk assessment through
consumption of vegetables rich in heavy metals: the case study of the surrounding villages
from Panasqueira mine, Central Portugal." Environmental geochemistry and health:1-25.
Ávila, Paula F., Eduardo Ferreira da Silva, Ana R. Salgueiro, and J. A. Farinha. 2008. "Geochemistry
and Mineralogy of Mill Tailings Impoundments from the Panasqueira Mine (Portugal):
Implications for the Surrounding Environment." Mine Water and the Environment 27 (4):210.
doi: 10.1007/s10230-008-0046-4.
Ávila, Paula Freire, Adelaide Ferreira, Ana Rita Salgueiro, Carla Candeias, Rita Melo, and Eduardo
Ferreira da Silva. 2011. "Avaliação do impacte da drenagem de água ácida na hidrogeoquímica
do rio Zêzere: o caso de estudo da mina da Panasqueira, Portugal." Livro de Actas do VIII
Congresso Ibérico de Geoquímica, XVII Seminário de Geoquímica.
Bloot, C, and LCM Wolf. 1953. Geological features of the Panasqueira tin-tungsten ore-occurrence
(Portugal).
Bonaparte, R, and EK Yanful. 2001. "Covers for waste." In Geotechnical and geoenvironmental
engineering handbook, 825-877. Springer.
Boulet, Michelle P, and Adrienne CL Larocque. 1998. "A comparative mineralogical and geochemical
study of sulfide mine tailings at two sites in New Mexico, USA." Environmental geology 33
(2):130-142.
Bowker, Lindsay Newland, and David M Chambers. 2015. "The risk, public liability, & economics of
tailings storage facility failures." Research Paper. Stonington, ME.
Breiter, K. 2001. "Report about laboratory investigations of rock samples from the Panasqueira mine
and recommendations for future exploration." Internal Panasqueira Mine report, not
published.
BRGM. 2001. "Management of mining, quarrying and ore-processing waste in the European Union."
Study made For DG Environment, European Commission Co-Ordination By P. Charbonnie.
Brgm/Rp-50319-FR.
Campbell, David L, and David V Fitterman. 2000. "Geoelectrical methods for investigating mine
dumps." Proceedings of the 5th International Conference on Acid Rock Drainage (ICARD
2000), Denver, Colo.
Candeias, C. 2013. "Modelling the impact of the of the Panasqueira mine in ecosystems and human
health: a multidisciplinary approach."PhD Thesis, Aveiro University/Porto University.
Candeias, Carla, Paula F Ávila, Eduardo Ferreira Da Silva, and João Paulo Teixeira. 2015. "Integrated
approach to assess the environmental impact of mining activities: estimation of the spatial
distribution of soil contamination (Panasqueira mining area, Central Portugal)."
Environmental monitoring and assessment 187 (3):135.
Candeias, Carla, Eduardo Ferreira da Silva, Paula F Ávila, and João Paulo Teixeira. 2014. "Identifying
sources and assessing potential risk of exposure to heavy metals and hazardous materials in

- 92 -
mining areas: The case study of Panasqueira mine (Central Portugal) as an example."
Geosciences 4 (4):240-268.
Candeias, Carla, Rita Melo, Paula Freire Ávila, Eduardo Ferreira da Silva, Ana Rita Salgueiro, and
João Paulo Teixeira. 2014. "Heavy metal pollution in mine–soil–plant system in S. Francisco
de Assis–Panasqueira mine (Portugal)." Applied Geochemistry 44:12-26.
Cavey, G, and D Gunning. 2006a. "Panasqueira Mine–Distrito de Castelo Branco, Portugal." Updated
Telmical Report. Castelo Branco: Primary Metals Inc. Orequest.
Cavey, G, and D Gunning. 2006b. "Updated technical report on the Panasqueira mine, Distrito de
Castelo Branco." Portugal. OREQUEST.
Conde, LE Nabais, and Congresso Hispano-Luso-Americano de Geologia Económica. 1971. Jazigos
hipogénicos de estanho e volfrâmio.
Corrêa de Sá Sá, A, R.A Naique, and E Nobre. 1999. "Minas da Panasqueira: 100 Anos de História
Mineira." Boletim de Minas 36 (1):3-22.
Crosby, T.W. 2001. "Facility Environmental Review." Beralt Tin and Wolfram Portugal SA, by
SECOR International Incorporation.
Diehl, P, and M David. 1979. "Geostatistical Concepts and Algorithms for Ore Reserve Calculations."
17th APCOM Symoosium Proceedinas, Golden, Colorado.
Dinis da Gama, C. 2002. "Geotechnical and laboratory study of the tailings in the River Zêzere waste
heap." Beralt tin and wolfram report, Lisbon, Portugal:9.
Directive, Mining Waste. 2006. Directive 2006/21/EC of the European Parliament and of the Council
of 15 March 2006 on the management of waste from extractive industries and amending
Directive 2004/35. EC.
e-EcoRisk. 2007. A Regional Enterprise Network Decision-SupportSystem for Environmental Risk
and Disaster Management of Large-Scale Industrial Soils. In Contract n. EGV1-CT-2002-
00068; WP3– Case Study Site Characterization, Project Management Report for the Reporting
Period, Deliverable 3.1, edited by EU Project Co-ordinated by C. Banninger. Joanneum
Research Porschungsgeselfschaft—GMBH: Frohnleiten, Austria, relatório não publicado.
Eurostat, the statistical office of the European Union. 2014. "Waste generation and treatment
(env_wasgt)." Last Modified June 2017, accessed 04 June.
http://appsso.eurostat.ec.europa.eu/nui/show.do?dataset=env_wastrt&lang=en.
Ferreira da Silva, Eduardo, Paula Freire Ávila, Ana Rita Salgueiro, Carla Candeias, and Henrique
Garcia Pereira. 2013. "Quantitative–spatial assessment of soil contamination in S. Francisco
de Assis due to mining activity of the Panasqueira mine (Portugal)." Environmental Science
and Pollution Research 20 (11):7534-7549. doi: 10.1007/s11356-013-1495-2.
Garcia, Letícia Couto, Danilo Bandini Ribeiro, Fabio Oliveira Roque, Jose Manuel Ochoa‐Quintero,
and William F Laurance. 2017. "Brazil's worst mining disaster: corporations must be compelled
to pay the actual environmental costs." Ecological applications 27 (1):5-9.
Gilchrist, H.G, and M Mahmoud. 1999. A Subjective Evaluation of Tailings Deposits Stability at
Panasqueira Mine. Portugal: Golder & Associates.
Grangeia, C, Paula Freire Ávila, M Matias, and E Silva. 2009. "An integrated investigation of the Rio
tailings, Panasqueira mine, Centre Portugal."
Grangeia, C, and M Senos Matias. 2003. "A geophysical survey on the Panasqueira mine tailings." 9th
EAGE/EEGS Meeting.
- 93 -
Grangeia, C, MJ Senos Matias, F Almeida, C Gomes, and F Rocha. 2002. "GPR Surveying with a
Remote Controlled Pulling System." 64th EAGE Conference & Exhibition.
Grangeia, C., P. Ávila, M. Matias, and E. Ferreira da Silva. 2011. "Mine tailings integrated
investigations: The case of Rio tailings (Panasqueira Mine, Central Portugal)." Engineering
Geology 123 (4):359-372. doi: http://doi.org/10.1016/j.enggeo.2011.10.001.
Hammond, AA. 1988. "Mining and quarrying wastes: a critical review." Engineering Geology 25
(1):17-31.
Hart, Brad, and William Lassetter. 1999. Numerical Modeling of Heap Leach, Tailings and Waste
Rock Facility Cover Alternatives. Closure, Remediation and Management of Precious Metals
Heap Leach Facilities.
ICOLD, UNEP. 2001. "Tailings Dams–Risk of Dangerous Occurrences, Lessons Learnt From
Practical Experiences (Bulletin 121)." Commission Internationale des Grands Barrages,
Paris.
Julivert, M, JM Fontboté, A Ribeiro, and LE Conde. 1974. "Mapa Tectónico de la Península Ibérica y
Baleares (Tectonic map of the Iberian peninsula and Balearían Ilands)." IGME-SPI, Instituto
Geológico y Minero de España, Madrid 113.
Jung, Myung Chae. 2001. "Heavy metal contamination of soils and waters in and around the Imcheon
Au–Ag mine, Korea." Applied Geochemistry 16 (11):1369-1375.
Kelly, William Crowley, and Robert O Rye. 1979. "Geologic, fluid inclusion, and stable isotope
studies of the tin-tungsten deposits of Panasqueira, Portugal." Economic Geology 74 (8):1721-
1822.
Lane, Ken. 1999. "Optimization: is it the best." Optimizing with Whittle, strategic mine planning:1-7.
Leal, M. V. 1945. As Minas da Panasqueira: vida e história. Portugália Editora.
Lotze, Franz. 1945. "Zur gliederung der varisziden der Iberischen Meseta." Geotektonische
Forschungen 6:78-92.
Maptek. 2012. Maptek Vulcan™ Introduction to Vulcan Version 8.1. United Kingdom: Maptek Pty
Ltd.
Maptek. 2016. Maptek Vulcan™ Taining - Composite Drillholes North America: Maptek Pty Ltd.
Martin, TE, MP Davies, S Rice, T Higgs, and PC Lighthall. 2002. "Tailings Facilities."
Milawarma. 1995. Computer Aided Design and Analysis of Sapan Dalam Open Pit Mine: A Case
Study: University of Wollongong.
Moore, Johnnie N, and Samuel N Luoma. 1990. "Hazardous wastes from large-scale metal extraction.
A case study." Environmental Science & Technology 24 (9):1278-1285.
Naicker, K, E Cukrowska, and TS McCarthy. 2003. "Acid mine drainage arising from gold mining
activity in Johannesburg, South Africa and environs." Environmental pollution 122 (1):29-40.
Noronha, F, A Doria, J Dubessy, and B Charoy. 1992. "Characterization and timing of the different
types of fluids present in the barren and ore-veins of the W-Sn deposit of Panasqueira, Central
Portugal." Mineralium Deposita 27 (1):72-79.
Panthulu, TV, C Krishnaiah, and JM Shirke. 2001. "Detection of seepage paths in earth dams using
self-potential and electrical resistivity methods." Engineering Geology 59 (3):281-295.

- 94 -
Poisson, Jérôme, Michel Chouteau, Michel Aubertin, and Daniel Campos. 2009. "Geophysical
experiments to image the shallow internal structure and the moisture distribution of a mine
waste rock pile." Journal of Applied Geophysics 67 (2):179-192.
Puura, Eric, Luca Marmo, and Marco Alessandro. 2002. "Mine and quarry waste—the burden from
the past." Directorate General Environment of the European Commission, Iatly.
Reis, A. C. 1971. As Minas da Panasqueira. Bol Minas.
Rollin, AL. 2004. "Long term performance of polymeric geomembranes." 57th Canadian Geotechnical
Conference/5th Joint CGS/IAH Conference, Quebec City, Quebec.
Sinclair, Alastair J, and Garston H Blackwell. 2002. Applied mineral inventory estimation: Cambridge
University Press.
Sjödahl, Pontus, Torleif Dahlin, and S Johansson. 2005. "Using resistivity measurements for dam
safety evaluation at Enemossen tailings dam in southern Sweden." Environmental geology 49
(2):267-273.
Smith, Mike. 2006. "Panasqueira the tungsten giant at 100+." Oper. Focus. Int. Min 33 (1014):34.
Van Dam, Remke L, Luiza A Gutierrez, Virginia T McLemore, G Ward Wilson, Jan MH Hendrickx,
and Bruce M Walker. 2005. "Near surface geophysics for the structural analysis of a mine rock
pile, northern New Mexico." 2005 National Meeting of the American Society of Mining and
Reclamation, Breckenridge, Colorado, June, CD-ROM.
Vanhala, Heikki, Marja Liisa Raisanen, Ilkka Suppala, Taija Huotari, Tuire Valjus, and Jukka
Lehtimaki. 2005. "Geophysical characterizing of tailings impoundment-a case from the closed
Hammaslahti Cu-Zn mine, eastern Finland." SPECIAL PAPER-GEOLOGICAL SURVEY OF
FINLAND 38:49.
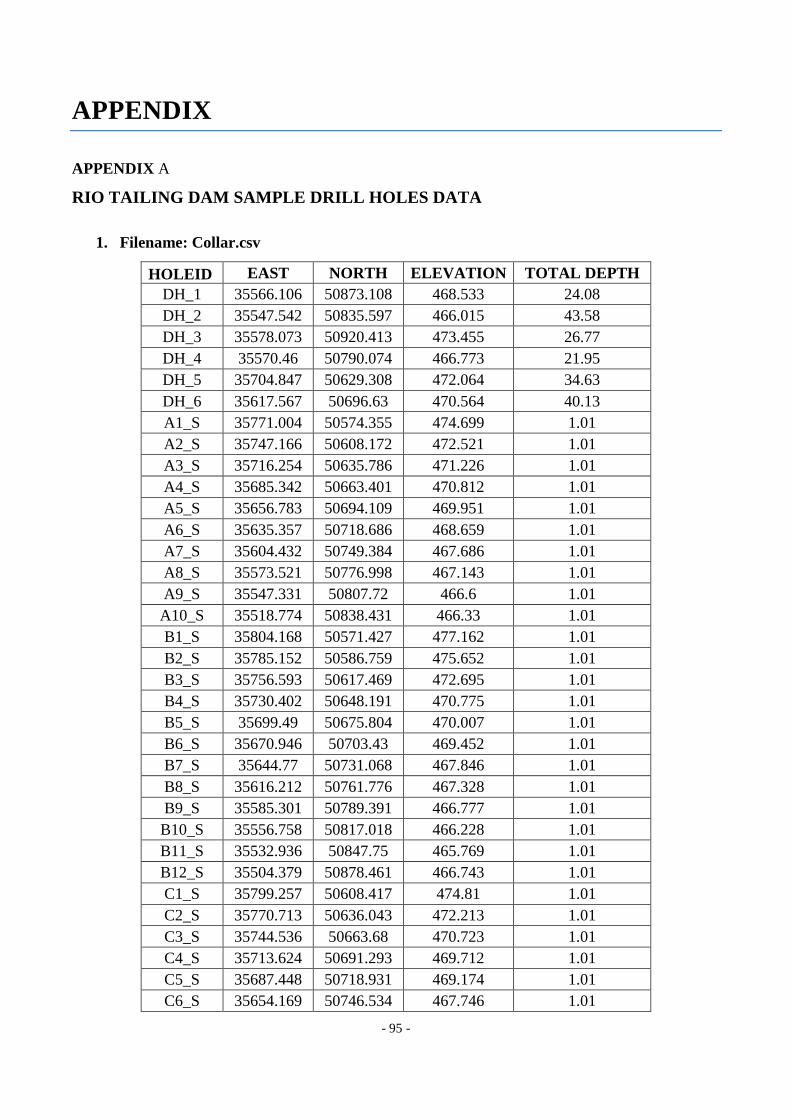
- 95 -
APPENDIX
APPENDIX A
RIO TAILING DAM SAMPLE DRILL HOLES DATA
1. Filename: Collar.csv
HOLEID EAST NORTH ELEVATION TOTAL DEPTH
DH_1 35566.106 50873.108 468.533 24.08
DH_2 35547.542 50835.597 466.015 43.58
DH_3 35578.073 50920.413 473.455 26.77
DH_4 35570.46 50790.074 466.773 21.95
DH_5 35704.847 50629.308 472.064 34.63
DH_6 35617.567 50696.63 470.564 40.13
A1_S 35771.004 50574.355 474.699 1.01
A2_S 35747.166 50608.172 472.521 1.01
A3_S 35716.254 50635.786 471.226 1.01
A4_S 35685.342 50663.401 470.812 1.01
A5_S 35656.783 50694.109 469.951 1.01
A6_S 35635.357 50718.686 468.659 1.01
A7_S 35604.432 50749.384 467.686 1.01
A8_S 35573.521 50776.998 467.143 1.01
A9_S 35547.331 50807.72 466.6 1.01
A10_S 35518.774 50838.431 466.33 1.01
B1_S 35804.168 50571.427 477.162 1.01
B2_S 35785.152 50586.759 475.652 1.01
B3_S 35756.593 50617.469 472.695 1.01
B4_S 35730.402 50648.191 470.775 1.01
B5_S 35699.49 50675.804 470.007 1.01
B6_S 35670.946 50703.43 469.452 1.01
B7_S 35644.77 50731.068 467.846 1.01
B8_S 35616.212 50761.776 467.328 1.01
B9_S 35585.301 50789.391 466.777 1.01
B10_S 35556.758 50817.018 466.228 1.01
B11_S 35532.936 50847.75 465.769 1.01
B12_S 35504.379 50878.461 466.743 1.01
C1_S 35799.257 50608.417 474.81 1.01
C2_S 35770.713 50636.043 472.213 1.01
C3_S 35744.536 50663.68 470.723 1.01
C4_S 35713.624 50691.293 469.712 1.01
C5_S 35687.448 50718.931 469.174 1.01
C6_S 35654.169 50746.534 467.746 1.01
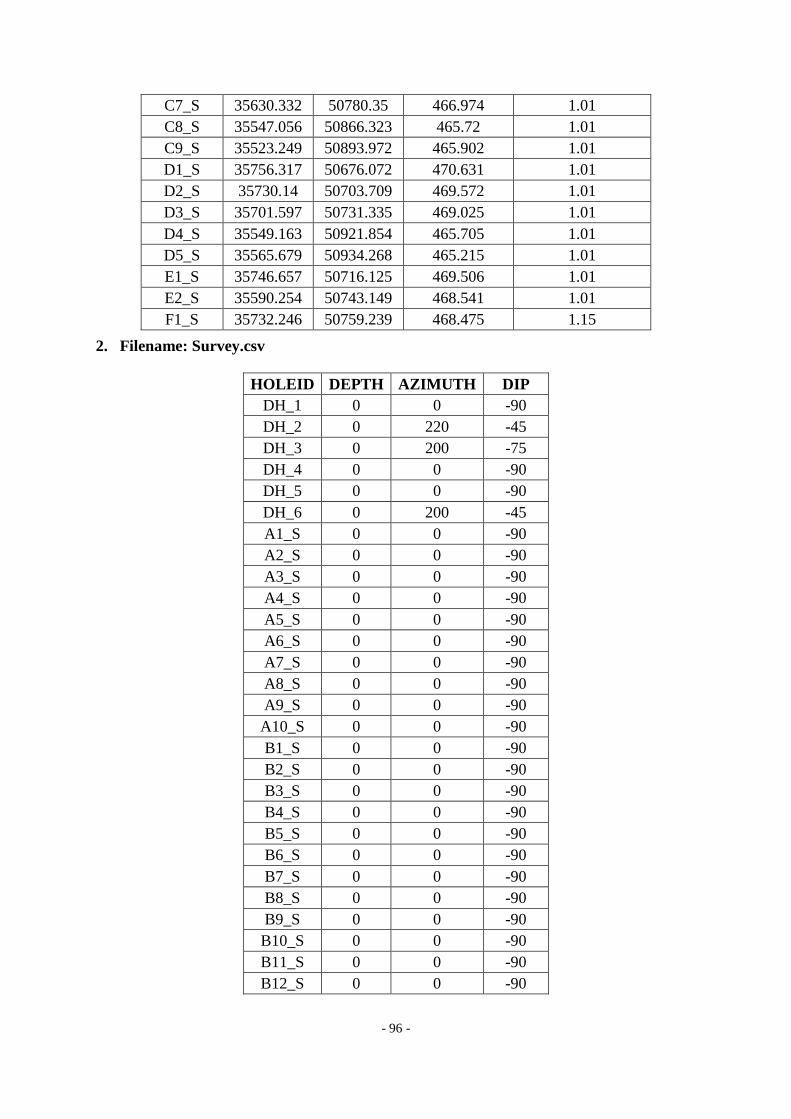
- 96 -
C7_S 35630.332 50780.35 466.974 1.01
C8_S 35547.056 50866.323 465.72 1.01
C9_S 35523.249 50893.972 465.902 1.01
D1_S 35756.317 50676.072 470.631 1.01
D2_S 35730.14 50703.709 469.572 1.01
D3_S 35701.597 50731.335 469.025 1.01
D4_S 35549.163 50921.854 465.705 1.01
D5_S 35565.679 50934.268 465.215 1.01
E1_S 35746.657 50716.125 469.506 1.01
E2_S 35590.254 50743.149 468.541 1.01
F1_S 35732.246 50759.239 468.475 1.15
2. Filename: Survey.csv
HOLEID DEPTH AZIMUTH DIP
DH_1 0 0 -90
DH_2 0 220 -45
DH_3 0 200 -75
DH_4 0 0 -90
DH_5 0 0 -90
DH_6 0 200 -45
A1_S 0 0 -90
A2_S 0 0 -90
A3_S 0 0 -90
A4_S 0 0 -90
A5_S 0 0 -90
A6_S 0 0 -90
A7_S 0 0 -90
A8_S 0 0 -90
A9_S 0 0 -90
A10_S 0 0 -90
B1_S 0 0 -90
B2_S 0 0 -90
B3_S 0 0 -90
B4_S 0 0 -90
B5_S 0 0 -90
B6_S 0 0 -90
B7_S 0 0 -90
B8_S 0 0 -90
B9_S 0 0 -90
B10_S 0 0 -90
B11_S 0 0 -90
B12_S 0 0 -90
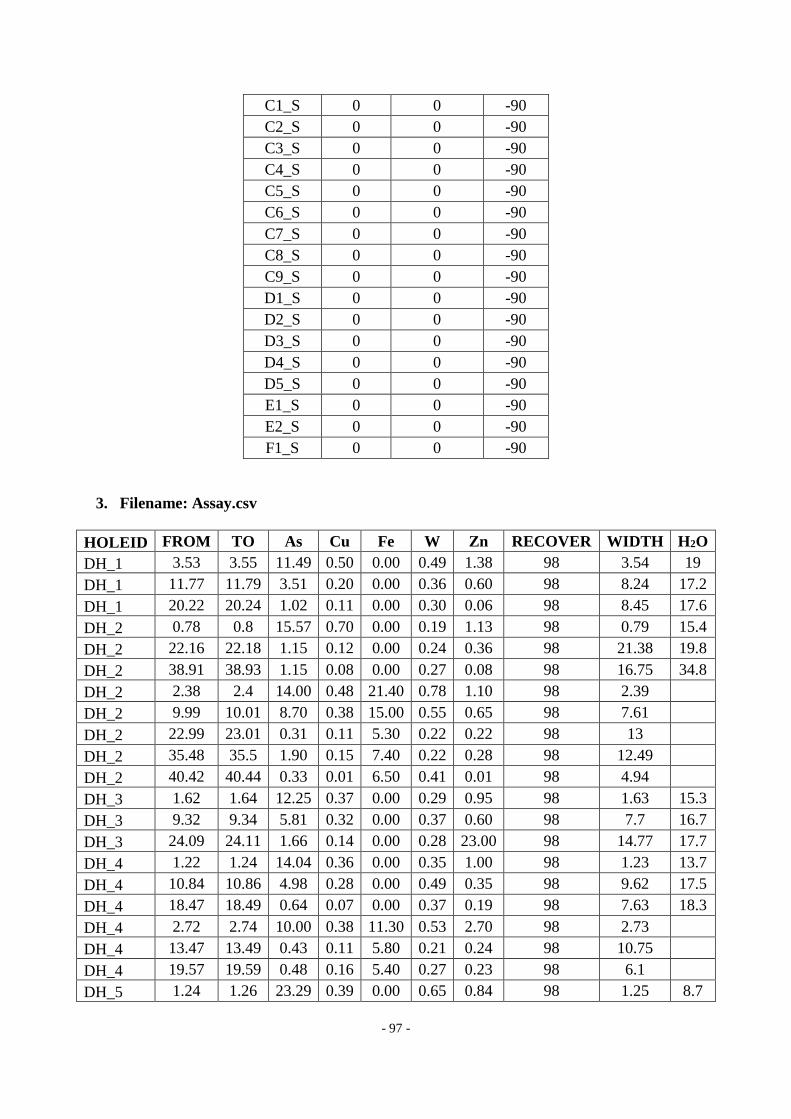
- 97 -
C1_S 0 0 -90
C2_S 0 0 -90
C3_S 0 0 -90
C4_S 0 0 -90
C5_S 0 0 -90
C6_S 0 0 -90
C7_S 0 0 -90
C8_S 0 0 -90
C9_S 0 0 -90
D1_S 0 0 -90
D2_S 0 0 -90
D3_S 0 0 -90
D4_S 0 0 -90
D5_S 0 0 -90
E1_S 0 0 -90
E2_S 0 0 -90
F1_S 0 0 -90
3. Filename: Assay.csv
HOLEID FROM TO As Cu Fe W Zn RECOVER WIDTH H2O
DH_1 3.53 3.55 11.49 0.50 0.00 0.49 1.38 98 3.54 19
DH_1 11.77 11.79 3.51 0.20 0.00 0.36 0.60 98 8.24 17.2
DH_1 20.22 20.24 1.02 0.11 0.00 0.30 0.06 98 8.45 17.6
DH_2 0.78 0.8 15.57 0.70 0.00 0.19 1.13 98 0.79 15.4
DH_2 22.16 22.18 1.15 0.12 0.00 0.24 0.36 98 21.38 19.8
DH_2 38.91 38.93 1.15 0.08 0.00 0.27 0.08 98 16.75 34.8
DH_2 2.38 2.4 14.00 0.48 21.40 0.78 1.10 98 2.39
DH_2 9.99 10.01 8.70 0.38 15.00 0.55 0.65 98 7.61
DH_2 22.99 23.01 0.31 0.11 5.30 0.22 0.22 98 13
DH_2 35.48 35.5 1.90 0.15 7.40 0.22 0.28 98 12.49
DH_2 40.42 40.44 0.33 0.01 6.50 0.41 0.01 98 4.94
DH_3 1.62 1.64 12.25 0.37 0.00 0.29 0.95 98 1.63 15.3
DH_3 9.32 9.34 5.81 0.32 0.00 0.37 0.60 98 7.7 16.7
DH_3 24.09 24.11 1.66 0.14 0.00 0.28 23.00 98 14.77 17.7
DH_4 1.22 1.24 14.04 0.36 0.00 0.35 1.00 98 1.23 13.7
DH_4 10.84 10.86 4.98 0.28 0.00 0.49 0.35 98 9.62 17.5
DH_4 18.47 18.49 0.64 0.07 0.00 0.37 0.19 98 7.63 18.3
DH_4 2.72 2.74 10.00 0.38 11.30 0.53 2.70 98 2.73
DH_4 13.47 13.49 0.43 0.11 5.80 0.21 0.24 98 10.75
DH_4 19.57 19.59 0.48 0.16 5.40 0.27 0.23 98 6.1
DH_5 1.24 1.26 23.29 0.39 0.00 0.65 0.84 98 1.25 8.7

- 98 -
DH_5 14.97 14.99 0.96 0.45 0.00 0.32 0.98 98 13.73 24.7
DH_5 29.62 29.64 2.49 0.15 0.00 0.37 0.21 98 14.65 39.4
DH_5 2.31 2.33 19.00 0.21 18.00 0.87 0.91 98 2.32
DH_5 7.99 8.01 24.00 0.72 28.50 0.61 2.10 98 5.68
DH_5 16.52 16.54 0.64 0.19 6.10 0.33 0.13 98 8.53
DH_5 31.99 32.01 0.68 0.20 5.40 0.26 0.11 98 15.47
DH_6 5.12 5.14 10.02 0.54 0.00 0.26 0.84 98 5.13 12.1
DH_6 13.24 13.26 7.15 0.21 0.00 0.12 0.66 98 8.12 8.1
DH_6 25.37 25.39 1.47 0.10 0.00 0.20 0.35 98 12.13 23.1
DH_6 0.09 0.11 22.00 0.09 0.00 0.37 0.42 98 0.1
DH_6 8.37 8.39 18.00 0.43 0.00 0.38 0.00 98 8.28
DH_6 21.99 22.01 0.64 0.19 0.00 0.35 0.14 98 13.62
DH_6 32.57 32.59 0.89 0.16 0.00 0.28 0.20 98 10.58
DH_6 35.99 36.01 3.20 0.21 0.00 0.30 0.39 98 3.42
A1_S 0.2 0.21 12.30 0.41 21.75 0.06 0.88 98 0.9
A2_S 0.2 0.21 13.22 0.39 22.30 0.05 0.89 98 0.9
A4_S 0.2 0.21 12.75 0.03 21.20 0.04 0.04 98 0.9
A5_S 0.2 0.21 10.16 0.12 22.31 0.06 0.97 98 0.9
A6_S 0.2 0.21 17.16 0.11 22.66 0.04 0.06 98 0.9
A7_S 0.2 0.21 11.74 0.05 14.05 0.06 0.07 98 0.9
A8_S 0.2 0.21 16.81 0.14 22.31 0.09 0.09 98 0.9
A9_S 0.2 0.21 7.76 0.10 9.41 0.10 0.11 98 0.9
A10_S 0.2 0.21 8.61 0.09 18.09 0.06 0.05 98 0.9
B1_S 0.2 0.21 13.10 0.36 24.11 0.06 0.82 98 0.9
B2_S 0.2 0.21 22.37 0.17 24.79 0.03 0.08 98 0.9
B3_S 0.2 0.21 12.64 0.05 23.42 0.06 0.65 98 0.9
B4_S 0.2 0.21 10.01 0.61 18.62 0.07 1.15 98 0.9
B5_S 0.2 0.21 10.20 0.56 22.08 0.03 1.16 98 0.9
B6_S 0.2 0.21 10.08 1.16 20.13 0.05 1.12 98 0.9
B7_S 0.2 0.21 9.00 0.05 11.51 0.21 0.03 98 0.9
B8_S 0.2 0.21 18.06 0.08 21.73 0.31 0.06 98 0.9
B9_S 0.2 0.21 14.85 0.04 15.37 0.20 0.05 98 0.9
B10_S 0.2 0.21 12.34 0.12 13.60 0.33 0.05 98 0.9
B11_S 0.2 0.21 14.25 0.35 19.27 0.36 0.19 98 0.9
B12_S 0.2 0.21 18.84 0.11 22.93 0.07 0.07 98 0.9
C1_S 0.2 0.21 17.65 0.21 25.70 0.04 0.40 98 0.9
C2_S 0.2 0.21 12.77 0.82 24.21 0.03 1.49 98 0.9
C3_S 0.2 0.21 10.86 0.47 18.91 0.08 1.41 98 0.9
C4_S 0.2 0.21 19.96 0.86 27.44 0.20 1.32 98 0.9
C6_S 0.2 0.21 13.94 0.13 21.26 0.41 0.08 98 0.9
C7_S 0.2 0.21 10.98 0.27 21.96 0.38 0.33 98 0.9
C8_S 0.2 0.21 12.81 0.70 21.22 0.23 0.64 98 0.9
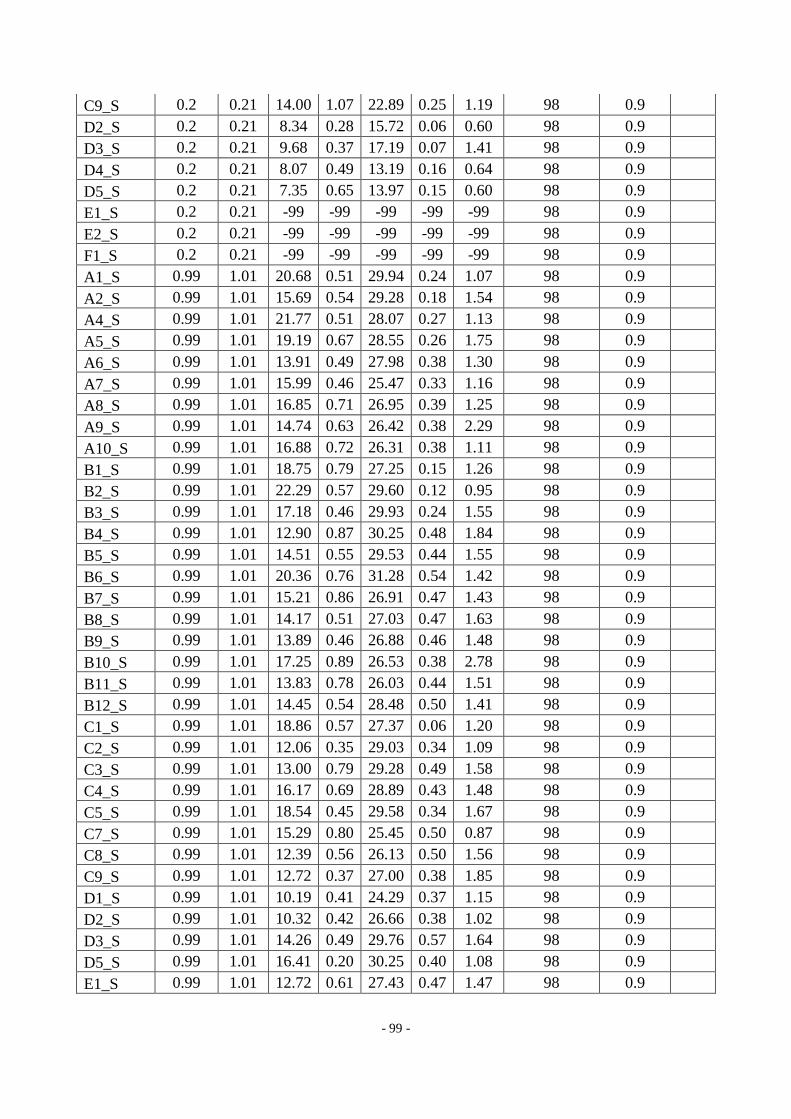
- 99 -
C9_S 0.2 0.21 14.00 1.07 22.89 0.25 1.19 98 0.9
D2_S 0.2 0.21 8.34 0.28 15.72 0.06 0.60 98 0.9
D3_S 0.2 0.21 9.68 0.37 17.19 0.07 1.41 98 0.9
D4_S 0.2 0.21 8.07 0.49 13.19 0.16 0.64 98 0.9
D5_S 0.2 0.21 7.35 0.65 13.97 0.15 0.60 98 0.9
E1_S 0.2 0.21 -99 -99 -99 -99 -99 98 0.9
E2_S 0.2 0.21 -99 -99 -99 -99 -99 98 0.9
F1_S 0.2 0.21 -99 -99 -99 -99 -99 98 0.9
A1_S 0.99 1.01 20.68 0.51 29.94 0.24 1.07 98 0.9
A2_S 0.99 1.01 15.69 0.54 29.28 0.18 1.54 98 0.9
A4_S 0.99 1.01 21.77 0.51 28.07 0.27 1.13 98 0.9
A5_S 0.99 1.01 19.19 0.67 28.55 0.26 1.75 98 0.9
A6_S 0.99 1.01 13.91 0.49 27.98 0.38 1.30 98 0.9
A7_S 0.99 1.01 15.99 0.46 25.47 0.33 1.16 98 0.9
A8_S 0.99 1.01 16.85 0.71 26.95 0.39 1.25 98 0.9
A9_S 0.99 1.01 14.74 0.63 26.42 0.38 2.29 98 0.9
A10_S 0.99 1.01 16.88 0.72 26.31 0.38 1.11 98 0.9
B1_S 0.99 1.01 18.75 0.79 27.25 0.15 1.26 98 0.9
B2_S 0.99 1.01 22.29 0.57 29.60 0.12 0.95 98 0.9
B3_S 0.99 1.01 17.18 0.46 29.93 0.24 1.55 98 0.9
B4_S 0.99 1.01 12.90 0.87 30.25 0.48 1.84 98 0.9
B5_S 0.99 1.01 14.51 0.55 29.53 0.44 1.55 98 0.9
B6_S 0.99 1.01 20.36 0.76 31.28 0.54 1.42 98 0.9
B7_S 0.99 1.01 15.21 0.86 26.91 0.47 1.43 98 0.9
B8_S 0.99 1.01 14.17 0.51 27.03 0.47 1.63 98 0.9
B9_S 0.99 1.01 13.89 0.46 26.88 0.46 1.48 98 0.9
B10_S 0.99 1.01 17.25 0.89 26.53 0.38 2.78 98 0.9
B11_S 0.99 1.01 13.83 0.78 26.03 0.44 1.51 98 0.9
B12_S 0.99 1.01 14.45 0.54 28.48 0.50 1.41 98 0.9
C1_S 0.99 1.01 18.86 0.57 27.37 0.06 1.20 98 0.9
C2_S 0.99 1.01 12.06 0.35 29.03 0.34 1.09 98 0.9
C3_S 0.99 1.01 13.00 0.79 29.28 0.49 1.58 98 0.9
C4_S 0.99 1.01 16.17 0.69 28.89 0.43 1.48 98 0.9
C5_S 0.99 1.01 18.54 0.45 29.58 0.34 1.67 98 0.9
C7_S 0.99 1.01 15.29 0.80 25.45 0.50 0.87 98 0.9
C8_S 0.99 1.01 12.39 0.56 26.13 0.50 1.56 98 0.9
C9_S 0.99 1.01 12.72 0.37 27.00 0.38 1.85 98 0.9
D1_S 0.99 1.01 10.19 0.41 24.29 0.37 1.15 98 0.9
D2_S 0.99 1.01 10.32 0.42 26.66 0.38 1.02 98 0.9
D3_S 0.99 1.01 14.26 0.49 29.76 0.57 1.64 98 0.9
D5_S 0.99 1.01 16.41 0.20 30.25 0.40 1.08 98 0.9
E1_S 0.99 1.01 12.72 0.61 27.43 0.47 1.47 98 0.9

- 100 -
E2_S 0.99 1.01 15.43 0.27 27.40 0.44 1.00 98 0.9
F1_S 0.99 1.01 11.73 0.41 27.40 0.41 1.29 98 0.9
4. Filename: Geology.csv
HOLEID FROM TO LITH WIDTH CORE DESCRIPTION
DH_1 0.0 3.4 GYMUD 3.4 GREY MUD
DH_1 3.4 3.75 FCYBR 0.35 FERRUGINOUS CRUST YELLOW. BROWN AND RED
DH_1 3.75 4.05 0.3
DH_1 4.05 4.2 FCYBR 0.15 FERRUGINOUS CRUST YELLOW. BROWN AND RED
DH_1 4.2 5.6 GYMUD 1.4 GREY MUD
DH_1 5.6 5.74 FCYBR 0.14 FERRUGINOUS CRUST YELLOW. BROWN AND RED
DH_1 5.74 7.1 1.36
DH_1 7.1 7.5 FCYBR 0.4 FERRUGINOUS CRUST YELLOW. BROWN AND RED
DH_1 7.5 8.5 1.00
DH_1 8.5 8.7 FCYBR 0.2 FERRUGINOUS CRUST YELLOW. BROWN AND RED
DH_1 8.7 10.00 GYMUD 1.3 GREY MUD
DH_1 10. 10.2 FCYBR 0.2 FERRUGINOUS CRUST YELLOW. BROWN AND RED
DH_1 10.2 11.6 1.4
DH_1 11.6 12.4 FCYBR 0.8 FERRUGINOUS CRUST YELLOW. BROWN AND RED
DH_1 12.4 12.88 0.48
DH_1 12.88 13.25 FCYBR 0.37 FERRUGINOUS CRUST YELLOW. BROWN AND RED
DH_1 13.25 13.55 0.3
DH_1 13.55 14.05 FCYBR 0.5 FERRUGINOUS CRUST YELLOW. BROWN AND RED
DH_1 14.05 15.1 GYBWM 1.05 GREY AND BROWNISH MUD
DH_1 15.1 15.55 FCYBR 0.45 FERRUGINOUS CRUST YELLOW. BROWN AND RED
DH_1 15.55 16.38 0.83
DH_1 16.38 16.78 FCYBR 0.4 FERRUGINOUS CRUST YELLOW. BROWN AND RED
DH_1 16.78 17.5 GYREM 0.72 GREY AND REDISH MUD
DH_1 17.5 17.7 FCYBR 0.2 FERRUGINOUS CRUST YELLOW. BROWN AND RED
DH_1 17.7 18.8 1.1
DH_1 18.8 19.1 FCYBR 0.3 FERRUGINOUS CRUST YELLOW. BROWN AND RED
DH_1 19.1 20.15 1.05
DH_1 20.15 20.45 FCYBR 0.3 FERRUGINOUS CRUST YELLOW. BROWN AND RED
DH_1 20.45 21.65 GYGRM 1.2 GREY AND GREENISH MUD
DH_1 21.65 22.28 RMDBB 0.63 RIO MUD DAM BASE BEDROCK
DH_1 22.28 22.58 BEDSC 0.3 BEDROCK SCHITSTS
DH_1 22.85 24.08 ASHST 1.23 ARILLACEOUS SCHISTS SCHISTOSITY
DH_2 0.00 0.79 0.79
DH_2 0.79 1.1 FCYBR 0.31 FERRUGINOUS CRUST YELLOW. BROWN AND RED
DH_2 1.1 4.7 GYMUD 3.6 GREY MUD
DH_2 4.7 5.05 FCYBR 0.35 FERRUGINOUS CRUST YELLOW. BROWN AND RED
DH_2 5.05 6.4 1.35
DH_2 6.4 6.72 FCYBR 0.32 FERRUGINOUS CRUST YELLOW. BROWN AND RED
DH_2 6.72 7.7 0.98
DH_2 7.7 7.95 FCYBR 0.25 FERRUGINOUS CRUST YELLOW. BROWN AND RED

- 101 -
DH_2 7.95 9.8 GYMUD 1.85 GREY MUD
DH_2 9.8 10.15 FCYBR 0.35 FERRUGINOUS CRUST YELLOW. BROWN AND RED
DH_2 10.15 10.9 0.75
DH_2 10.9 11.08 FCYBR 0.18 FERRUGINOUS CRUST YELLOW. BROWN AND RED
DH_2 11.08 15.6 GYMUD 4.52 GREY MUD
DH_2 15.6 17.00 PCFGM 1.4 PERCOLATION CHANNEL FERRUGINOUS CRUST IN GREY MUD
DH_2 17.00 17.35 FCYBR 0.35 FERRUGINOUS CRUST YELLOW. BROWN AND RED
DH_2 17.35 18.4 FCYBR 1.05 FERRUGINOUS CRUST YELLOW. BROWN AND RED
DH_2 18.4 21.4 3.00
DH_2 21.4 22.65 PCFGM 1.25 PERCOLATION CHANNEL FERRUGINOUS CRUST IN GREY MUD
DH_2 22.65 23.25 FCYBR 0.6 FERRUGINOUS CRUST YELLOW. BROWN AND RED
DH_2 23.25 23.9 0.65
DH_2 23.9 24.25 FCYGB 0.35 FERRUGINOUS CRUST IN GREY AND BROWNISH MUD
DH_2 24.25 25.23 GYMUD 0.98 GREY MUD
DH_2 25.23 26.45 1.22
DH_2 26.45 27.00 RSMUD 0.55 REDISH MUD
DH_2 27.00 29.48 GGMUD 2.48 GREY AND GREENISH MUD
DH_2 29.48 29.9 GGMUD 0.42 GREY AND GREENISH MUD
DH_2 29.9 31.00 GGMUD 1.1 GREY AND GREENISH MUD
DH_2 31.00 32.1 DBARM 1.1 DARK BROWN AND REDISH MUD
DH_2 32.1 33.8 1.7
DH_2 33.8 34.00 FCYGB 0.2 FERRUGINOUS CRUST IN GREY AND BROWNISH MUD
DH_2 34.00 36.1 2.1
DH_2 36.1 36.76 OXSAG 0.66 OXIDE SAND AND GRAVE
DH_2 36.76 37.43 0.67
DH_2 37.43 38.92 OXSAG 1.49 OXIDE SAND AND GRAVE
DH_2 38.92 40.28 GYBWM 1.36 GREY AND BROWNISH MUD
DH_2 40.28 43.58 OSGGM 3.3 OXIDE SAND AND GRAVE IN GREENISH MUD
DH_3 0. 0.22 FCYGB 0.22 FERRUGINOUS CRUST IN GREY AND BROWNISH MUD
DH_3 0.22 1.16 GYMUD 0.94 GREY MUD
DH_3 1.16 1.85 PCFGM 0.69 PERCOLATION CHANNEL FERRUGINOUS CRUST IN GREY MUD
DH_3 1.85 3.8 1.95
DH_3 3.8 4.55 0.75
DH_3 4.55 4.9 FCYGB 0.35 FERRUGINOUS CRUST IN GREY AND BROWNISH MUD
DH_3 4.9 6.2 GYMUD 1.3 GREY MUD
DH_3 6.2 7.65 GYMUD 1.45 GREY MUD
DH_3 7.65 7.91 GYMUD 0.26 GREY MUD
DH_3 7.91 9.00 GYMUD 1.09 GREY MUD
DH_3 9. 9.5 GYMUD 0.5 GREY MUD
DH_3 9.5 11.61 FCYBR 2.11 FERRUGINOUS CRUST YELLOW. BROWN AND RED
DH_3 11.61 12.8 GYMUD 1.19 GREY MUD
DH_3 12.8 13.99 GYMUD 1.19 GREY MUD
DH_3 13.99 15.75 GYMUD 1.76 GREY MUD
DH_3 15.75 20.45 BRGYM 4.7 BROWNISH AND GREY MUD
DH_3 20.45 21.4 BRGMC 0.95 BROWN AND GREY MUD WITH FERRURIFIOUS CRUSTS
DH_3 21.4 23.05 BRGYM 1.65 BROWNISH AND GREY MUD

- 102 -
DH_3 23.05 24.1 1.05
DH_3 24.1 24.3 FCYBR 0.2 FERRUGINOUS CRUST YELLOW. BROWN AND RED
DH_3 24.3 25.25 RMDBB 0.95 RIO MUD DAM BASE BEDROCK
DH_3 25.25 26.77 BEDSC 1.52 BEDROCK SCHITSTS
DH_4 0.00 1.4 1.4
DH_4 1.4 1.5 FCYBR 0.1 FERRUGINOUS CRUST YELLOW. BROWN AND RED
DH_4 1.5 2.73 GYMUD 1.23 GREY MUD
DH_4 2.73 2.9 FCYBR 0.17 FERRUGINOUS CRUST YELLOW. BROWN AND RED
DH_4 2.9 4.13 GYMUD 1.23 GREY MUD
DH_4 4.13 4.4 FCYBR 0.27 FERRUGINOUS CRUST YELLOW. BROWN AND RED
DH_4 4.4 5.7 PCFGM 1.3 PERCOLATION CHANNEL FERRUGINOUS CRUST IN GREY MUD
DH_4 5.7 7.6 FPGMU 1.9 FERRUGINOUS CRUST AND PERCOLATION CHANNEL ALSO FERRUGINOUS CRUST IN
GREY MUD
DH_4 7.6 11.7 GYMUD 4.1 GREY MUD
DH_4 11.7 12.25 GRABM 0.55 GREYISH AND BROWNISH MUD
DH_4 12.25 13.1 0.85
DH_4 13.1 13.4 FPGMU 0.3 FERRUGINOUS CRUST AND PERCOLATION CHANNEL ALSO FERRUGINOUS CRUST IN
GREY MUD
DH_4 13.4 17.93 GRABM 4.53 GREYISH AND BROWNISH MUD
DH_4 17.93 20.35 PCFGM 2.42 PERCOLATION CHANNEL FERRUGINOUS CRUST IN GREY MUD
DH_4 20.35 21.5 RMDBB 1.15 RIO MUD DAM BASE BEDROCK
DH_4 21.5 21.95 BEDSC 0.45 BEDROCK SCHITSTS
DH_5 0.00 0.1 0.1
DH_5 0.1 0.6 GYMHM 0.5 FERRUGINOUS CRUST YELLOW. BROWN AND RED IN HOMOGEOUS GREY MUD
DH_5 0.6 0.7 0.1
DH_5 0.7 3.2 FCYBR 2.5 FERRUGINOUS CRUST YELLOW. BROWN AND RED
DH_5 3.2 3.45 GYMHM 0.25 FERRUGINOUS CRUST YELLOW. BROWN AND RED IN HOMOGEOUS GREY MUD
DH_5 3.45 6.53 GYMUD 3.08 GREY MUD
DH_5 6.53 8.8 GYMHM 2.27 FERRUGINOUS CRUST YELLOW. BROWN AND RED IN HOMOGEOUS GREY MUD
DH_5 8.8 11.68 GYMUD 2.88 GREY MUD
DH_5 11.68 11.8 GYMHM 0.12 FERRUGINOUS CRUST YELLOW. BROWN AND RED IN HOMOGEOUS GREY MUD
DH_5 11.8 15.2 GYMUD 3.4 GREY MUD
DH_5 15.2 15.83 FCYBR 0.63 FERRUGINOUS CRUST YELLOW. BROWN AND RED
DH_5 15.83 20.65 BSAGM 4.82 BROWNISH AND GREYISH MUD
DH_5 20.65 20.8 GYMHM 0.15 FERRUGINOUS CRUST YELLOW. BROWN AND RED IN HOMOGEOUS GREY MUD
DH_5 20.8 21.4 PCFGM 0.6 PERCOLATION CHANNEL FERRUGINOUS CRUST IN GREY MUD
DH_5 21.4 24.08 GYMHM 2.68 FERRUGINOUS CRUST YELLOW. BROWN AND RED IN HOMOGEOUS GREY MUD
DH_5 24.08 24.39 GGMUD 0.31 GREY AND GREENISH MUD
DH_5 24.39 34.1 RMDBB 9.71 RIO MUD DAM BASE BEDROCK
DH_5 34.1 34.63 BEDSC 0.53 BEDROCK SCHITSTS
DH_6 0.00 0.75 GYMUD 0.75 GREY MUD
DH_6 0.75 1.08 FCYGB 0.33 FERRUGINOUS CRUST IN GREY AND BROWNISH MUD
DH_6 1.08 1.3 0.22
DH_6 1.3 1.45 GYMUD 0.15 GREY MUD
DH_6 1.45 3.15 1.7
DH_6 3.15 3.4 0.25
DH_6 3.4 3.78 0.38
DH_6 3.78 4.00 0.22

- 103 -
DH_6 4.00 4.55 0.55
DH_6 4.55 4.9 0.35
DH_6 4.9 6.7 FPGMU 1.8 FERRUGINOUS CRUST AND PERCOLATION CHANNEL ALSO FERRUGINOUS CRUST IN
GREY MUD
DH_6 6.7 8.38 1.68
DH_6 8.38 9.00 0.62
DH_6 9.00 9.95 0.95
DH_6 9.95 10.43 0.48
DH_6 10.43 12.1 FPGMA 1.67 FERRUGINOUS CRUST AND PERCOLATION CHANNEL ALSO. YELLOW BROWN AND RED
IN HOMOGENEOUS GREY MUD
DH_6 12.1 20.4 FPGMA 8.3 FERRUGINOUS CRUST AND PERCOLATION CHANNEL ALSO. YELLOW BROWN AND RED
IN HOMOGENEOUS GREY MUD
DH_6 20.4 21.3 FPCYR 0.9 FERRUGINOUS PERCOLATION CHANNEL YELLOW BROWN AND RED
DH_6 21.3 22.83 FPGMU 1.53 FERRUGINOUS CRUST AND PERCOLATION CHANNEL ALSO FERRUGINOUS CRUST IN
GREY MUD
DH_6 22.83 23.88 1.05
DH_6 23.88 25.38 GYMUD 1.5 FERRUGINOUS CRUST YELLOW. BROWN AND RED IN HOMOGEOUS GREY MUD
DH_6 25.38 28.33 2.95
DH_6 28.33 29.83 1.5
DH_6 29.83 32.65 GYMUD 2.82 GREY MUD
DH_6 32.65 33.63 GSOCM 0.98 GRAVEL AND SAND IN AN OXIDIZED CLAYEY MATRIX
DH_6 33.63 35.88 2.25
DH_6 35.88 37.63 GSOCM 1.75 GRAVEL AND SAND IN AN OXIDIZED CLAYEY MATRIX
DH_6 37.63 38.58 0.95
DH_6 38.58 38.6 RMDBB 0.02 RIO MUD DAM BASE BEDROCK
DH_6 38.6 40.13 BEDSC 1.53 BEDROCK SCHITSTS
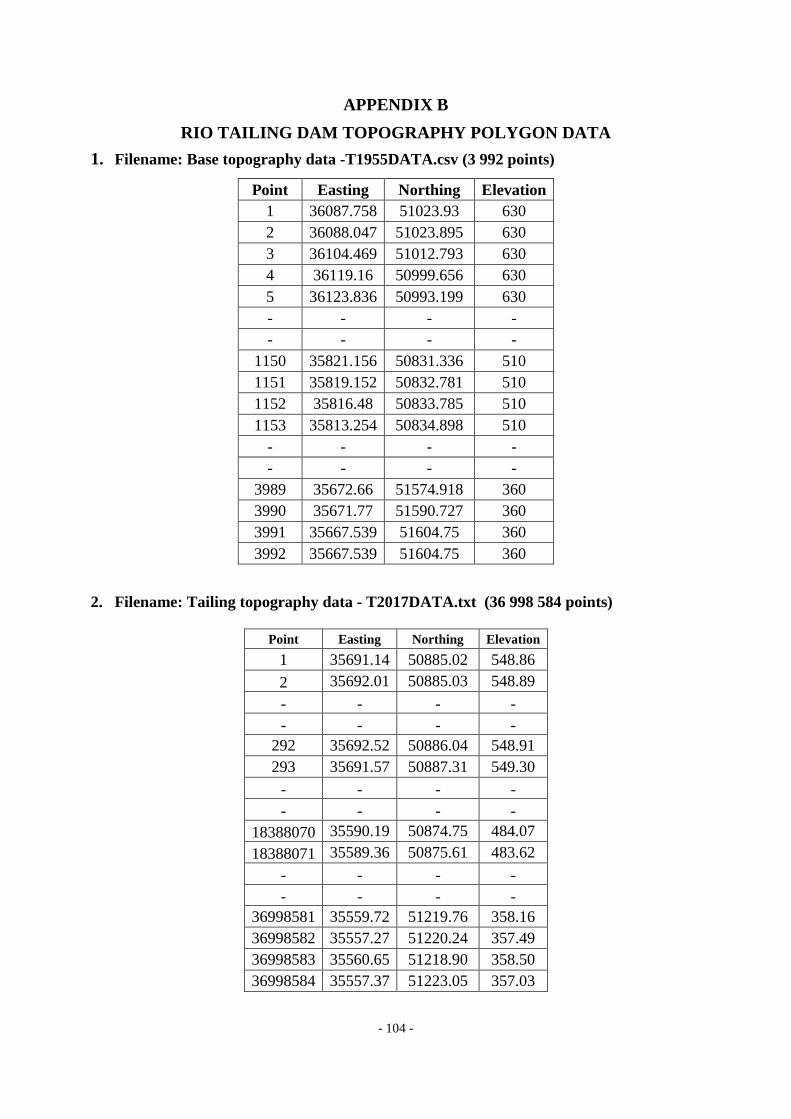
- 104 -
APPENDIX B
RIO TAILING DAM TOPOGRAPHY POLYGON DATA
1. Filename: Base topography data -T1955DATA.csv (3 992 points)
Point Easting Northing Elevation
1 36087.758 51023.93 630
2 36088.047 51023.895 630
3 36104.469 51012.793 630
4 36119.16 50999.656 630
5 36123.836 50993.199 630
- - - -
- - - -
1150 35821.156 50831.336 510
1151 35819.152 50832.781 510
1152 35816.48 50833.785 510
1153 35813.254 50834.898 510
- - - -
- - - -
3989 35672.66 51574.918 360
3990 35671.77 51590.727 360
3991 35667.539 51604.75 360
3992 35667.539 51604.75 360
2. Filename: Tailing topography data - T2017DATA.txt (36 998 584 points)
Point Easting Northing Elevation
1 35691.14 50885.02 548.86
2 35692.01 50885.03 548.89
- - - -
- - - -
292 35692.52 50886.04 548.91
293 35691.57 50887.31 549.30
- - - -
- - - -
18388070 35590.19 50874.75 484.07
18388071 35589.36 50875.61 483.62
- - - -
- - - -
36998581 35559.72 51219.76 358.16
36998582 35557.27 51220.24 357.49
36998583 35560.65 51218.90 358.50
36998584 35557.37 51223.05 357.03
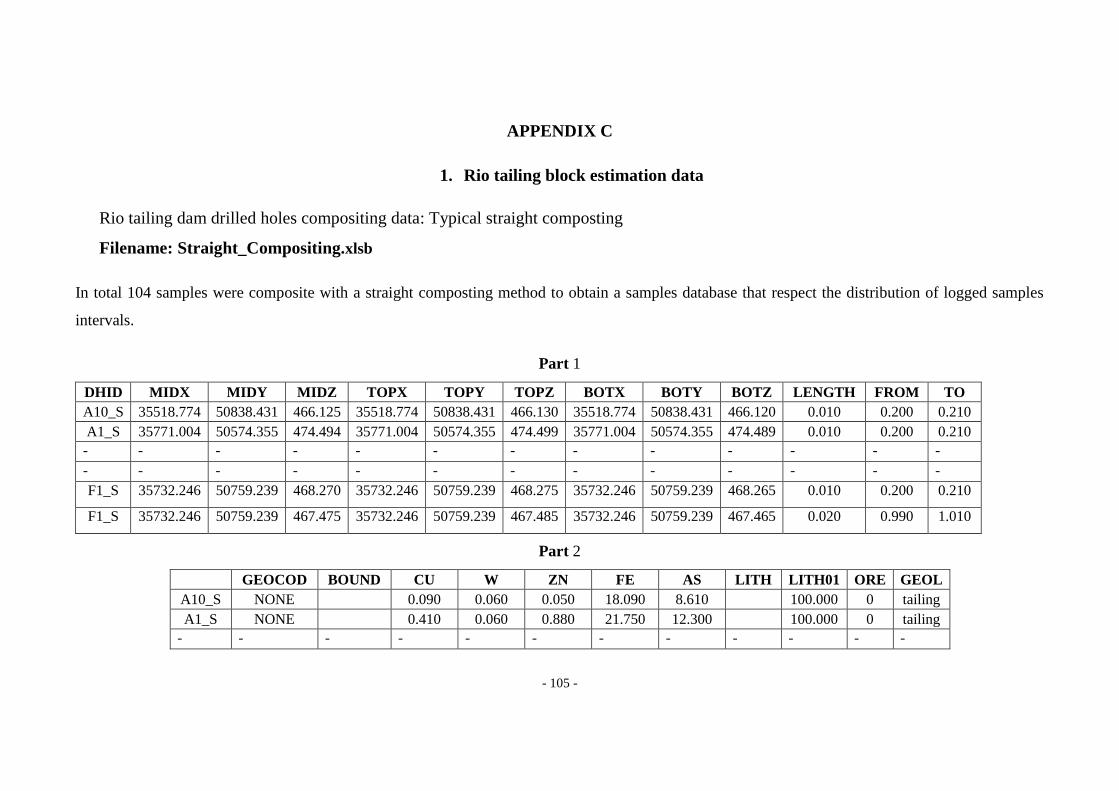
- 105 -
APPENDIX C
1. Rio tailing block estimation data
Rio tailing dam drilled holes compositing data: Typical straight composting
Filename: Straight_Compositing.xlsb
In total 104 samples were composite with a straight composting method to obtain a samples database that respect the distribution of logged samples
intervals.
Part 1
DHID MIDX MIDY MIDZ TOPX TOPY TOPZ BOTX BOTY BOTZ LENGTH FROM TO
A10_S 35518.774 50838.431 466.125 35518.774 50838.431 466.130 35518.774 50838.431 466.120 0.010 0.200 0.210
A1_S 35771.004 50574.355 474.494 35771.004 50574.355 474.499 35771.004 50574.355 474.489 0.010 0.200 0.210
- - - - - - - - - - - - -
- - - - - - - - - - - - -
F1_S 35732.246 50759.239 468.270 35732.246 50759.239 468.275 35732.246 50759.239 468.265 0.010 0.200 0.210
F1_S 35732.246 50759.239 467.475 35732.246 50759.239 467.485 35732.246 50759.239 467.465 0.020 0.990 1.010
Part 2
GEOCOD BOUND CU W ZN FE AS LITH LITH01 ORE GEOL
A10_S NONE 0.090 0.060 0.050 18.090 8.610 100.000 0 tailing
A1_S NONE 0.410 0.060 0.880 21.750 12.300 100.000 0 tailing
- - - - - - - - - - - -
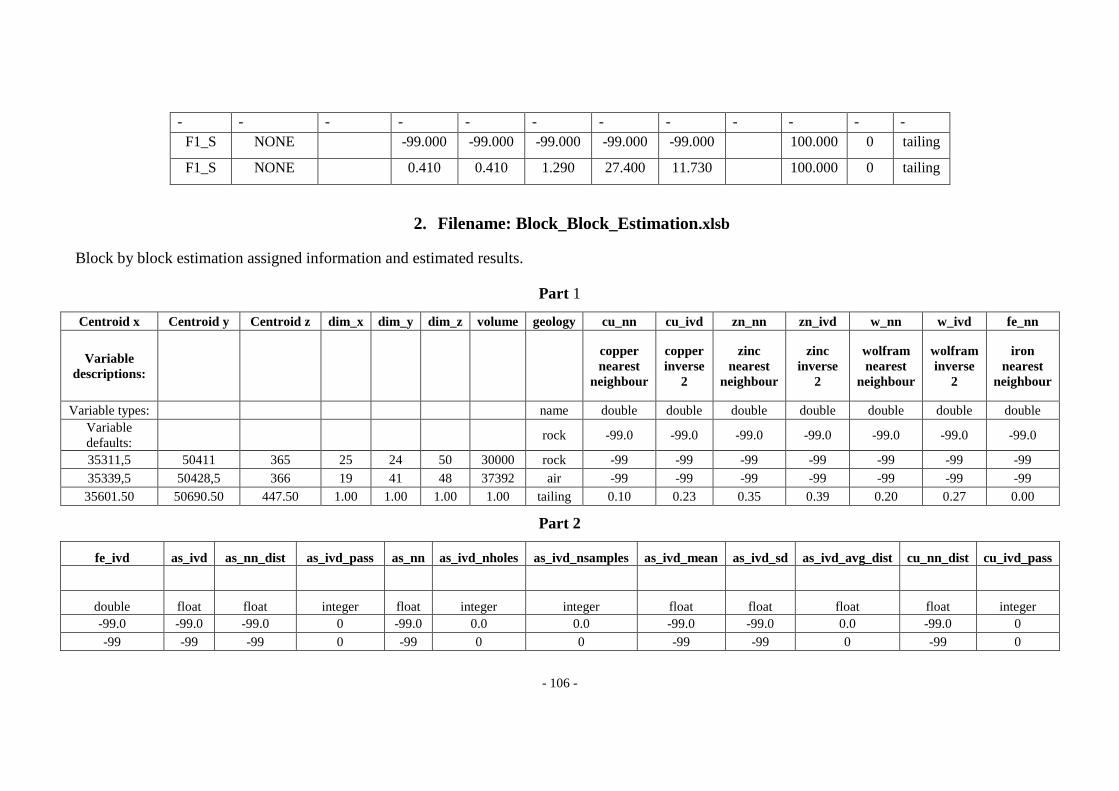
- 106 -
- - - - - - - - - - - -
F1_S NONE -99.000 -99.000 -99.000 -99.000 -99.000 100.000 0 tailing
F1_S NONE 0.410 0.410 1.290 27.400 11.730 100.000 0 tailing
2. Filename: Block_Block_Estimation.xlsb
Block by block estimation assigned information and estimated results.
Part 1
Centroid x Centroid y Centroid z dim_x dim_y dim_z volume geology cu_nn cu_ivd zn_nn zn_ivd w_nn w_ivd fe_nn
Variable
descriptions:
copper
nearest
neighbour
copper
inverse
2
zinc
nearest
neighbour
zinc
inverse
2
wolfram
nearest
neighbour
wolfram
inverse
2
iron
nearest
neighbour
Variable types: name double double double double double double double
Variable
defaults: rock -99.0 -99.0 -99.0 -99.0 -99.0 -99.0 -99.0
35311,5 50411 365 25 24 50 30000 rock -99 -99 -99 -99 -99 -99 -99
35339,5 50428,5 366 19 41 48 37392 air -99 -99 -99 -99 -99 -99 -99
35601.50 50690.50 447.50 1.00 1.00 1.00 1.00 tailing 0.10 0.23 0.35 0.39 0.20 0.27 0.00
Part 2
fe_ivd as_ivd as_nn_dist as_ivd_pass as_nn as_ivd_nholes as_ivd_nsamples as_ivd_mean as_ivd_sd as_ivd_avg_dist cu_nn_dist cu_ivd_pass
double float float integer float integer integer float float float float integer
-99.0 -99.0 -99.0 0 -99.0 0.0 0.0 -99.0 -99.0 0.0 -99.0 0
-99 -99 -99 0 -99 0 0 -99 -99 0 -99 0

- 107 -
-99 -99 -99 0 -99 0 0 -99 -99 0 -99 0
2.26 6.36 15.49 2.00 1.47 5.00 16.00 4.25 27.47 38.64 15.49 2.00
Part 3
cu_ivd_nholes cu_ivd_nsamples cu_ivd_mean cu_ivd_sd cu_ivd_avg_dist fe_nn_dist fe_ivd_pass fe_ivd_nholes fe_ivd_nsamples fe_ivd_mean fe_ivd_sd
integer integer float float float float integer integer integer float float
0.0 0.0 -99.0 -99.0 0.0 -99.0 0 0.0 0.0 -99.0 -99.0
0 0 -99 -99 0 -99 0 0 0 -99 -99
0 0 -99 -99 0 -99 0 0 0 -99 -99
5.00 16.00 -5.93 24.03 38.64 15.49 2.00 5.00 16.00 4.34 29.27
Part 4
fe_ivd_avg_dist w_nn_dist w_ivd_pass w_ivd_nholes w_ivd_nsamples w_ivd_mean w_ivd_sd w_ivd_avg_dist zn_nn_dist zn_ivd_pass zn_ivd_nholes
float float integer integer integer float float float float integer integer
0.0 -99.0 0 0.0 0.0 -99.0 -99.0 0.0 -99.0 0 0.0
0 -99 0 0 0 -99 -99 0 -99 0 0
0 -99 0 0 0 -99 -99 0 -99 0 0
38.64 15.49 2.00 5.00 16.00 -5.95 24.026203 38.640163 15.491766 2.00 5.00
Part 5
zn_ivd_nsamples zn_ivd_mean zn_ivd_sd zn_ivd_avg_dist
integer float float float
0.0 -99.0 -99.0 0.0
0 -99 -99 0
0 -99 -99 0
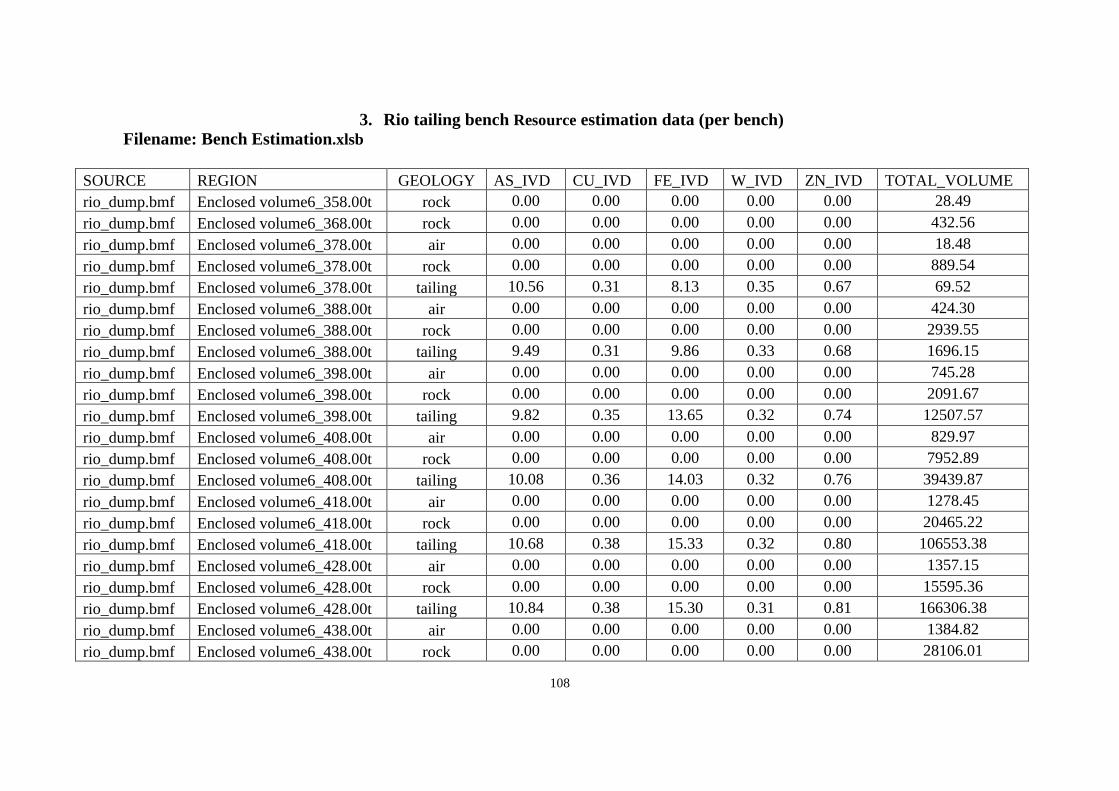
108
3. Rio tailing bench Resource estimation data (per bench)
Filename: Bench Estimation.xlsb
SOURCE REGION GEOLOGY AS_IVD CU_IVD FE_IVD W_IVD ZN_IVD TOTAL_VOLUME
rio_dump.bmf Enclosed volume6_358.00t rock 0.00 0.00 0.00 0.00 0.00 28.49
rio_dump.bmf Enclosed volume6_368.00t rock 0.00 0.00 0.00 0.00 0.00 432.56
rio_dump.bmf Enclosed volume6_378.00t air 0.00 0.00 0.00 0.00 0.00 18.48
rio_dump.bmf Enclosed volume6_378.00t rock 0.00 0.00 0.00 0.00 0.00 889.54
rio_dump.bmf Enclosed volume6_378.00t tailing 10.56 0.31 8.13 0.35 0.67 69.52
rio_dump.bmf Enclosed volume6_388.00t air 0.00 0.00 0.00 0.00 0.00 424.30
rio_dump.bmf Enclosed volume6_388.00t rock 0.00 0.00 0.00 0.00 0.00 2939.55
rio_dump.bmf Enclosed volume6_388.00t tailing 9.49 0.31 9.86 0.33 0.68 1696.15
rio_dump.bmf Enclosed volume6_398.00t air 0.00 0.00 0.00 0.00 0.00 745.28
rio_dump.bmf Enclosed volume6_398.00t rock 0.00 0.00 0.00 0.00 0.00 2091.67
rio_dump.bmf Enclosed volume6_398.00t tailing 9.82 0.35 13.65 0.32 0.74 12507.57
rio_dump.bmf Enclosed volume6_408.00t air 0.00 0.00 0.00 0.00 0.00 829.97
rio_dump.bmf Enclosed volume6_408.00t rock 0.00 0.00 0.00 0.00 0.00 7952.89
rio_dump.bmf Enclosed volume6_408.00t tailing 10.08 0.36 14.03 0.32 0.76 39439.87
rio_dump.bmf Enclosed volume6_418.00t air 0.00 0.00 0.00 0.00 0.00 1278.45
rio_dump.bmf Enclosed volume6_418.00t rock 0.00 0.00 0.00 0.00 0.00 20465.22
rio_dump.bmf Enclosed volume6_418.00t tailing 10.68 0.38 15.33 0.32 0.80 106553.38
rio_dump.bmf Enclosed volume6_428.00t air 0.00 0.00 0.00 0.00 0.00 1357.15
rio_dump.bmf Enclosed volume6_428.00t rock 0.00 0.00 0.00 0.00 0.00 15595.36
rio_dump.bmf Enclosed volume6_428.00t tailing 10.84 0.38 15.30 0.31 0.81 166306.38
rio_dump.bmf Enclosed volume6_438.00t air 0.00 0.00 0.00 0.00 0.00 1384.82
rio_dump.bmf Enclosed volume6_438.00t rock 0.00 0.00 0.00 0.00 0.00 28106.01

109
rio_dump.bmf Enclosed volume6_438.00t tailing 10.74 0.37 14.96 0.31 0.80 241923.72
rio_dump.bmf Enclosed volume6_448.00t air 0.00 0.00 0.00 0.00 0.00 1529.35
rio_dump.bmf Enclosed volume6_448.00t rock 0.00 0.00 0.00 0.00 0.00 22855.91
rio_dump.bmf Enclosed volume6_448.00t tailing 11.29 0.39 16.40 0.30 0.83 340179.25
rio_dump.bmf Enclosed volume6_458.00t air 0.00 0.00 0.00 0.00 0.00 3148.27
rio_dump.bmf Enclosed volume6_458.00t rock 0.00 0.00 0.00 0.00 0.00 17851.60
rio_dump.bmf Enclosed volume6_458.00t tailing 13.59 0.46 20.45 0.33 1.05 354045.15
rio_dump.bmf Enclosed volume6_468.00t air 0.00 0.00 0.00 0.00 0.00 2923.04
rio_dump.bmf Enclosed volume6_468.00t rock 0.00 0.00 0.00 0.00 0.00 1051.84
rio_dump.bmf Enclosed volume6_468.00t tailing 15.37 0.46 23.97 0.27 1.12 54636.62
4. Rio tailing dam block (under Bench Estimation.xlsb)
SOURCE REGION GEOLOGY AS_IVD CU_IVD FE_IVD W_IVD ZN_IVD TOTAL_VOLUME
rio_dump.bmf Enclosed volume6.00t air 0.00 0.00 0.00 0.00 0.00 82508012.00
rio_dump.bmf Enclosed volume6.00t rock 0.00 0.00 0.00 0.00 0.00 52577491.00
rio_dump.bmf Enclosed volume6.00t tailing 11.86 0.42 17.08 0.32 0.92 3039497.00
Total Volume of the Block 138125000

110
5. Definition
Inferred, Indicated and Measured Mineral Resource according to NI43-101
“In this Instrument, the terms "mineral resource", "inferred mineral resource", "indicate
mineral resource" and "measured mineral resource" have the meanings ascribed to those
terms by the Canadian Institute of Mining, Metallurgy and Petroleum, as the CIM
Definition Standards on Mineral Resources and Mineral Reserves adopted by CIM
Council, as those definitions may be amended.”
The terms Measured, Indicated and Inferred are defined by CIM (2005) as follows:
“A Mineral Resource is a concentration or occuaaarrence of diamonds, natural solid
inorganic material, or natural solid fossilized organic material including base and precious
metals, coal and industrial minerals in or on the Earth’s crust in such form and quantity
and of such a grade or quality that it has reasonable prospects for economic extraction.
The location, quantity, grade, geological characteristics and continuity of a Mineral
Resource are known, estimated or interpreted from specific geological evidence and
knowledge.”
“The term Mineral Resource covers mineralization and natural material of intrinsic
economic interest which has been identified and estimated through exploration and
sampling and within which Mineral Reserves may subsequently be defined by the
consideration and application of technical, economic, legal, environmental, socio-
economic and governmental factors. The phrase ‘reasonable prospects for economic
extraction’ implies a judgment by the Qualified Person in respect of the technical and
economic factors likely to influence the prospect of economic extraction. A Mineral
Resource is an inventory of mineralization that under realistically assumed and justifiable
technical and economic conditions might become economically extractable. These
assumptions must be presented explicitly in both public and technical reports.”
Inferred Mineral Resource
“An ‘Inferred Mineral Resource’ is that part of a Mineral Resource for which quantity
and grade or quality can be estimated on the basis of geological evidence and limited
sampling and reasonably assumed, but not verified, geological and grade continuity. The
estimate is limited information and sampling gathered through appropriate techniques
from locations such as outcrops, trenches, workings and drill holes.”
111
“Due to the uncertainty that may be attached to Inferred Mineral Resources, it cannot be
assumed that all or any part of an Inferred Mineral Resource will be upgraded to an
Indicated or Measured Mineral Resource as a result of continued exploration. Confidence
in the estimate is insufficient to allow the meaningful application of technical and
economic parameters or to enable an evaluation of economic viability worthy of public
disclosure. Inferred Mineral Resources must be excluded from estimates forming the
basis of feasibility or other economic studies.”
Indicated Mineral Resource
“An ‘Indicated Mineral Resource’ is that part of a Mineral Resource for which quantity,
grade or quality, densities, shape and physical characteristics can be estimated with a level
of confidence sufficient to allow the appropriate application of technical and economic
parameters, to support mine planning and evaluation of the economic viability of the
deposit. The estimate is based on detailed and reliable exploration and testing information
gathered through appropriate techniques from locations such as outcrops, trenches, pits,
workings and drill holes that are spaced closely enough for geological and grade
continuity to be reasonably assumed.”
“Mineralization may be classified as an Indicated Mineral Resource by the Qualified
Person when the nature, quality, quantity and distribution of data are such as to allow
confident interpretation of the geological framework and to reasonably assume the
continuity of Mineralization. The Qualified Person must recognize the importance of the
Indicated Mineral Resource category to the advancement of the feasibility of the project.
An Indicated Mineral Resource estimate is of sufficient quality to support a Preliminary
Feasibility Study which can serve as the basis for major development decisions.”
Measured Mineral Resource
“A ‘Measured Mineral Resource’ is that part of a Mineral Resource for which quantity,
grade or quality, densities, shape, and physical characteristics are so well established that
they can be estimated with confidence sufficient to allow the appropriate application of
technical and economic parameters, to support production planning and evaluation of the
economic viability of the deposit. The estimate is based on detailed and reliable
exploration, sampling and testing information gathered through appropriate techniques
from locations such as outcrops, trenches, pits, workings and drill holes that are spaced
closely enough to confirm both geological and grade continuity.”

112
“Mineralization or other natural material of economic interest may be classified as a
Measured Mineral Resource by the Qualified Person when the nature, quality, quantity
and distribution of data are such that the tonnage and grade of the mineralization can be
estimated to within close limits and that variation from the estimate would not
significantly affect potential economic viability. This category requires a high level of
confidence in, and understanding of, the geology and controls of the mineral deposit.”