remedial action selection report for param petroleum (pi 024594)
TRANSCRIPT

REMEDIAL ACTION SELECTION REPORT
P P t l Sit
Remedial Investigation andRemedial Action Selection
Param Petroleum SiteBurlington, New Jersey
Remedial Action Selection
Term Contract No.A-60243
Submitted to:
STATE OF NEW JERSEYDepartment of
Environmental ProtectionSite Remediation Program
and Construction401 East State Street,
Submitted by:
Trenton, New Jersey 08625
The Louis Berger Group, Inc.412 Mount Kemble Avenue
Morristown, New Jersey 07962
April 2010

TOC-1
The Louis Berger Group, Inc. Remedial Action Selection Report – Param Petroleum, Burlington, NJ
TABLE OF CONTENTS
1.0 INTRODUCTION.......................................................................................................... 1-1
2.0 PHYSICAL SETTING .................................................................................................. 2-1
2.1 Topography .......................................................................................................... 2-1
2.2 Climate ................................................................................................................. 2-1
2.3 Geology and Soils ................................................................................................ 2-1
2.4 Hydrogeology ....................................................................................................... 2-2
2.5 Surface Water ....................................................................................................... 2-2
3.0 REMEDIAL ACTION GOALS AND OBJECTIVES ............................................... 3-1
3.1 Media of Concern ................................................................................................ 3-1
3.2 Conceptual Model ................................................................................................ 3-2
3.2.1 Sources ..................................................................................................... 3-2
3.2.2 Migration Pathways ................................................................................. 3-3
3.2.3 Potential Receptors .................................................................................. 3-3
3.3 Applicable Remediation Standards ...................................................................... 3-4
4.0 REMEDIAL ALTERNATIVES ................................................................................... 4-1
4.1 No Further Action ................................................................................................ 4-1
4.2 Monitored Natural Attenuation ............................................................................ 4-1
4.3 Enhanced Monitored Natural Attenuation ........................................................... 4-2
4.4 In-Situ Chemical Oxidation ................................................................................. 4-4
4.5 Air Sparging/Soil Vapor Extraction ..................................................................... 4-5
5.0 EVALUATION OF REMEDIAL ALTERNATIVES ................................................ 5-1
5.1 Effectiveness and Reliability of Attaining the Applicable
Remediation Standards ........................................................................................ 5-1
5.2 Reduction of Toxicity, Mobility, or Volume ....................................................... 5-1
5.3 Risk Minimization ............................................................................................... 5-2
5.4 Implementability .................................................................................................. 5-2
5.5 Compliance with Applicable Laws and Regulations ........................................... 5-3
5.6 Potential Impacts on the Local Community ......................................................... 5-3
5.7 Potential for Natural Resource Injury .................................................................. 5-4
5.8 Cost ...................................................................................................................... 5-4
6.0 REFERENCES ............................................................................................................... 6-1

TOC-2
The Louis Berger Group, Inc. Remedial Action Selection Report – Param Petroleum, Burlington, NJ
TABLE OF CONTENTS
(Continued)
TABLES
Table 1 Evaluation of Groundwater Remedial Alternatives
Table 2 Comparative Analysis of Groundwater Remedial Alternatives
Table 3 Comparison of Total Estimated Cost among Groundwater Remedial Alternatives
FIGURES
Figure 1 Site Location Map
Figure 2 Site Plan
Figure 3 Groundwater Exceedance Map – 2004 and 2006
Figure 4 Proposed ORC Advanced® Injection Locations
Figure 5 Proposed RegenOx Injection Locations
Figure 6 Proposed Air Sparging/Soil Vapor Extraction System
APPENDICES
Appendix A 2004 and 2006 Groundwater Analytical Results
Appendix B 2004 and 2006 Groundwater Elevation Contour Map
Appendix C Detailed Cost Breakdown of Groundwater Remedial Alternatives

Page 1-1
The Louis Berger Group, Inc. Remedial Action Selection Report – Param Petroleum, Burlington, NJ
1.0 INTRODUCTION
The Louis Berger Group, Inc. (Berger) has prepared this Remedial Action Selection (RAS) report on
behalf of the New Jersey Department of Environmental Protection (NJDEP) to evaluate remedial
alternatives for the Param Petroleum Service Station (the “Site”). The Site is located at the
intersection of Route 130 South and Wood Street in the City of Burlington, Burlington County, New
Jersey (Figure 1). This RAS Report was completed by Berger as part of a statewide contract with the
NJDEP to perform site-specific Remedial Investigations (RI) and Remedial Action Selections (RAS)
at multiple sites throughout the state (RI/RAS Term Contract A-60243).
The Param Petroleum Service Station has reportedly been operating as a retail gasoline/diesel service
station since at least 1979, and currently remains active. The Site is approximately 1-acre in size,
and is almost entirely paved with asphalt or concrete. There are two structures on the Site: one small
building near the center of the Site, which houses the office and restroom; and a larger building that
is leased to a car wash located on the eastern portion of the Site. A site plan showing the existing
Site layout and neighboring facilities is provided (Figure 2).
In December 1991 and January 1992, the NJDEP received several notifications of odors indicating
possible gasoline discharges, following the delivery of gasoline to the Param facility. Free phase
product was observed in November 1994 during underground storage tank (UST) replacement
activities. During June 2000 and March 2001, the NJDEP completed two field efforts at the Site.
Soil sampling and analysis indicated the presence of Methyl Tert Butyl Ether (MTBE), Xylenes, and
other gasoline-related constituents occurring in subsurface soils at levels in excess of the most
stringent NJDEP Soil Cleanup Criteria (SCC) (NJDEP, 1999). Groundwater contamination was also
identified at the Site above the New Jersey Ground Water Quality Standards (GWQS) (NJDEP,
2005a). Subsequently, NJDEP contracted Berger to conduct remedial investigations in 2004 and
2006 to determine the nature and extent of site contamination. Findings of the remedial investigation
activities were discussed in the Remedial Investigation Report (RIR) submitted to the NJDEP in
August 2008 (Berger, 2008).
This RAS Report has been developed based on the findings of previous remedial investigation
activities to identify and evaluate appropriate remedial strategies to address the contamination, with
focus on the best ways to reduce the risk associated with current and future uses of the Site and its
surroundings. The RAS was developed according to the following four major steps:
• Identification of the remedial action goals and objectives;
• Identification of Remedial Action Alternatives (RAAs);

Page 1-2
The Louis Berger Group, Inc. Remedial Action Selection Report – Param Petroleum, Burlington, NJ
• Evaluation of the RAAs against applicable selection criteria; and
• Determination of remediation scenarios that consider the effect of combining alternatives for
the media of concern for a site-wide approach.
This RAS has been prepared in accordance with the Technical Requirements for Site Remediation,
N.J.A.C. 7:26E (NJDEP, 2005b) and associated requirements under NJDEP Term Contract No. A-
60243.

Page 2-1
The Louis Berger Group, Inc. Remedial Action Selection Report – Param Petroleum, Burlington, NJ
2.0 PHYSICAL SETTING
The Site is an approximately 1-acre lot located in an urban area of the City of Burlington, Burlington
County (Figures 1 and 2). Since at least 1979, the Site has been operating as a retail gasoline station.
Route 130 South forms the northern border, Wood Street borders the site to the west, retail business
properties form the eastern border and an empty field is located immediately south of the Site.
Additionally, just south of the empty field is a drainage canal that flows towards the northwest.
Land uses in the surrounding area include commercial, educational, recreational, and residential.
Recreational fields currently under construction are located north of Route 130. Wilbur Watts High
School is located adjacent to the fields. West of Wood Street, a small stream drains to the northwest
into the lake located in John F. Kennedy Park. A small strip of commercial properties are located to
the immediate northwest of the Site. Single-family residences are located south and southeast of the
Site, on the south side of Route 130. Several commercial properties are located immediately to the
east of the Site.
The following subsections provide a description of the physical setting of the Site, including details
regarding site topography, regional climate, geology, groundwater, and nearby surface water.
2.1 Topography
Situated in the Coastal Plain Physiographic Province, the topography of the surrounding area is
gently sloping towards the north and west, with elevations ranging from 5 to 85 feet above mean sea
level (amsl). The Site is generally flat with elevations below 20 feet amsl.
2.2 Climate
This region is characterized by a humid and temperate climate. Typical monthly air temperatures
range from a low of 22°F in January to a high of 87°F in July; the annual mean temperature is 63°F.
Typically, precipitation in the area is nearly equally distributed throughout the year. July and
August, however, average the heaviest rainfall amounts due to frequent shower and thunderstorm
activity; October, December, and February are usually slightly drier months. The annual average
precipitation amount is 44 inches (Markley, 1971).
2.3 Geology and Soils
The upper two geological formations that underlie the Site are the undifferentiated Raritan and
Magothy Formation and the younger, overlying Cape May Formation. The Raritan and Magothy

Page 2-2
The Louis Berger Group, Inc. Remedial Action Selection Report – Param Petroleum, Burlington, NJ
Formation is described as a "light gray to white, cross-stratified, medium to course grained sand,
arkosic in part and interbeded with discontinuous white to red and white variegated clays" (Rush
1968). Two distinct clay units have been identified: the more common whitish-yellow stiff clay and
gray lignitic clay. The Cape May Formation unconformably overlies the Raritan Formation in this
area of Burlington County. This formation is described as "quartz sand, light colored,
heterogeneous, clayey, pebbly formation" (Rush, 1968). Beds generally strike north 55 degrees east
and dip 0.1 to 1.0 degrees to the southeast.
2.4 Hydrogeology
The Cape May, a shallow unconfined aquifer, and Raritan–Magothy, a deeper semi-confined aquifer,
underlie the Burlington County region. The aquifers in this area of Burlington County have been
extensively developed with the undifferentiated Raritan and Magothy Formations being the primary
source for groundwater. Between the two aquifers are discontinuous clay layers consisting of either
stiff whitish-yellow clay or gray lignitic clay. Because the clay layer is discontinuous, it is expected
that the unconfined and semi-confined aquifers are hydraulically connected. The shallow
groundwater table beneath the Site is encountered at approximately ten feet below ground surface
(bgs). During the remedial investigation, groundwater was found to flow northwest in the eastern
portion of the site and southwest in the western portion of the Site, toward an unnamed tributary of
the Delaware River.
The Raritan-Magothy aquifer is a part of the New Jersey Coastal Plain Aquifer System. This system
is included in the United States Environmental Protection Agency’s (USEPA) Sole-Source Aquifer
(SSA) Protection Program. As a SSA, more than 50% of the drinking water to a specific area must
be contributed from that aquifer.
2.5 Surface Water
The surface water bodies in the immediate area of the Site include the drainage channel that is
immediately adjacent to the Site to the west, across Wood Street. Downstream the drainage channel,
and approximately 0.25 miles to the northwest of the Site is the John F. Kennedy Park and Lake.
The lake drains westerly and presumably discharges into the Delaware River. Delaware River (0.66
miles from the Site) and its tributaries (0.5 miles from the Site), as depicted on the 7.5-minute
Bristol, New Jersey Quadrangle topographic map (USGS, 1976) are shown in Figure 1. The
tributaries within this watershed are classified by the NJDEP as general fresh water/non-trout-
producing water bodies (FW2-NT) (N.J.A.C. 7:9B).

Page 3-1
The Louis Berger Group, Inc. Remedial Action Selection Report – Param Petroleum, Burlington, NJ
3.0 REMEDIAL ACTION GOALS AND OBJECTIVES
This section describes media of concern; presents a conceptual model developed for the Site with
regard to the media of concern and contaminant migration; and documents the establishment of
remediation standards that serve as remedial action endpoints. The remediation standards described
in this section form the basis for the proposed remedial alternatives to address the contamination in
the media of concern (Section 4.0).
3.1 Media of Concern
The media of concern are defined as those that contain contamination above Federal or State of New
Jersey standards or criteria. Based on the results of previous investigations including the 2004 and
2006 remedial investigations conducted by Berger (Berger, 2008), contaminants of concern (COCs)
were detected in groundwater above the GWQS. No soil contamination was detected above the SCC
during July 2004 soil sampling event. Since then, the NJDEP introduced new Soil Remediation
Standards (SRS) in June 2008 (NJDEP, 2008). The soil sampling results have been compared to the
new SRS and there are no exceedances of the new criteria. During the 2006 remedial investigation,
surface water and sediment samples collected at depositional locations along the unnamed tributary
of the Delaware River located southwest of the Site indicated some exceedances above the NJDEP
Surface Water Quality Standards (SWQS) and NJDEP Lowest Effects Level (LEL), respectively.
In this RAS, however, groundwater is the only considered medium of concern since no soil
exceedances were detected at the Site. The surface water and sediment samples were collected
outside of the Site boundary in order to identify the extent of contamination and its migration
pathway. No direct contamination migration pathway from the Site to the channel was observed.
Additionally, based on the conclusion of the Baseline Ecological Evaluation (BEE), the unnamed
tributary is not considered a sensitive ecological receptor. Therefore, surface water and sediment are
not considered as the media of concern for this Site and will not be pursued as part of this RAS
Report.
Groundwater samples were collected and analyzed for Target Compound List Volatile Organic
Compounds (TCL VO+10) with Tertiary Butyl Alcohol (TBA) and MTBE, Total Petroleum
Hydrocarbons (TPHC), Target Compound List (TAL) Semi-Volatile Organic Compounds
(SVOC)+20, and Target Analyte List (TAL) Metals. As presented on Figure 3, results of
groundwater sampling in December 2006, which is the most recent groundwater results for this Site,
indicated the presence of benzene, TBA, and lead above the GWQS. Benzene concentrations were
detected at MW-2 and MW-4 at the levels of 483 µg/L and 151 µg/L, which were above the GWQS

Page 3-2
The Louis Berger Group, Inc. Remedial Action Selection Report – Param Petroleum, Burlington, NJ
for benzene of 1 µg/L. TBA concentrations detected at MW-1 (screened at approximate depth
interval of 1 to 11 feet bgs) and MW-7 (screened at approximate depth interval of 42 to 52 feet bgs)
were at 6,870 µg/L and 261 µg/L, respectively, compared to its GWQS of 100 µg/L. Compared to
October 2004 and September 2006 groundwater results (Appendix A), it appears that concentrations
of benzene and TBA have been decreasing over time. Further, the relatively low concentrations of
TBA at depth (MW-7), coupled with a slight upward gradient and clean samples collected in
associated with Hydropunch® screening activities, indicate that TBA at depth is not a primary
concern for remediation.
Lead was also detected at MW-8 at the concentration of 5.4 µg/L, which was slightly above the
GWQS of 5 µg/L. However, lead was never detected in any of the previous groundwater sampling
events conducted at the Site. MW-8 is also located off-Site. Therefore, lead contamination detected
at MW-8 is not considered as site-related.
In summary, the primary contaminants of concern that will be addressed as part of this RAS Report
are gasoline-related contaminants in groundwater (e.g., benzene and TBA). These contaminants are
related to historical site operations as discussed earlier in this document.
3.2 Conceptual Model
This section presents an overall conceptual model of the Site focusing on the sources of
contamination, interpreted contaminant pathways, and potential receptors, as documented in the 2008
RIR (Berger, 2008).
3.2.1 Sources
In 1994, ten (10) gasoline and three (3) diesel USTs, totaling 52,000 gallons in capacity, were
removed from the Site. Many of the tanks were found to be in poor condition, with groundwater
entering at least one of the tanks and free product was observed in one of the tank excavations.
Investigation conducted by the NJDEP in 2000 and 2001 confirmed the presence of soil
contamination at the Site. Limited soil sampling conducted at select locations during this RI did not
exhibit exceedances of the SCC.
Based on the groundwater elevation and analytical data from the monitoring wells, it is apparent that
the groundwater contamination originates within the Site. TBA was found to be more prevalent in
the western portion of the Site (and at depth), and benzene was found to be more prevalent in the
eastern portion of the Site, indicating that there may be multiple sources (which would be a
reasonable assumption considering the numerous USTs that were historically present at the Site

Page 3-3
The Louis Berger Group, Inc. Remedial Action Selection Report – Param Petroleum, Burlington, NJ
3.2.2 Migration Pathways
Groundwater beneath the Site was generally found to flow northwest in the eastern portion of the
site, and southwest in the western portion of the Site, towards an unnamed tributary of the Delaware
River. Despite a minor exceedance of the lead GWQS in MW-8, the groundwater analytical results
indicate that the contamination is mainly confined to the Site, as no exceedances of the GWQS were
identified in upgradient wells MW-3 and MW-5, the sidegradient well MW-9, or the downgradient
well MW-6. Groundwater samples collected from the deep well (MW-7) only showed exceedances
of TBA, which was detected at concentrations one order of magnitude lower than the corresponding
shallow well, MW-1. The screen interval of MW-7 is approximately 40 feet lower in elevation than
that of MW-1; a slight upward vertical gradient was found in the well pair.
There does appear to be a migration of contaminants from the groundwater onsite to the unnamed
tributary across Wood Street. This is indicated by the groundwater flow direction (Appendix B) and
the fact that there are minor exceedances of the applicable criteria for surface water and sediment
samples collected from the unnamed tributary.
3.2.3 Potential Receptors
The potential receptors of site contamination are expected to be humans that may be exposed to
groundwater from supply wells, humans that may be exposed to indoor air vapor associated with
groundwater vapor intrusion, and biota associated with the nearby stream. The review of a well
search obtained by the NJDEP Bureau of Water allocation indicated that there are no domestic wells
present within 0.5 miles of the Site, and no supply wells within 1 mile of the Site. As public potable
water is supplied in this area, there are no potential human receptors that would be impacted by
ingestion of groundwater impacted by site contaminants. An assessment of the potential for vapor
intrusion in Site and nearby structures using the Johnson-Ettinger modeling indicates that there is
potentially an unacceptable risk associated with vapor intrusion resulting from Site groundwater
contamination. However, since assumptions used in the model were extremely conservative, it is
expected that the risks are overstated at this time that there is no need for further vapor intrusion
investigations at this Site. These assumptions include:
• The highest documented detections are used;
• The highest detections are assumed to be directly beneath the structure in question;
• There is no dissipation, diffusion, attenuation or horizontal migration of contaminants; and

Page 3-4
The Louis Berger Group, Inc. Remedial Action Selection Report – Param Petroleum, Burlington, NJ
• The structure has a basement with existing pathways, such as cracked foundations.
Finally, based on the results of the surface water and sediment sampling analysis, the biota associated
with surface waters and wetlands of the unnamed tributary are potential receptors of contamination
associated with the Site. It was concluded as a result of the BEE, however, that the unnamed
tributary is not considered a sensitive ecological receptor. Therefore, no further ecological
investigation or remediation is required. Based on the potential receptor evaluation described
including well search; vapor intrusion evaluation; and BEE, it is concluded that there is no real
receptor of Site contamination.
3.3 Applicable Remediation Standards
The Technical Requirements for Site Remediation, N.J.A.C. 7:26E (NJDEP, 2005b) define the
applicable remediation standard as “the standard to which contaminants must be remediated for soil,
groundwater or surface water, or other environmental media, to allow for a specified site use.” This
section discusses the development of applicable remediation standards for groundwater, which is the
only medium of concern for the Site.
Groundwater at the Site is subject to NJDEP Class IIA Ground Water Quality Standards (GWQS),
which will serve as applicable remediation standards for groundwater. The GWQS includes the
Interim Groundwater Quality Criteria (IGWQC), including both Interim Specific and Interim
Generic Criteria (NJDEP, 2005a).

Page 4-1
The Louis Berger Group, Inc. Remedial Action Selection Report – Param Petroleum, Burlington, NJ
4.0 REMEDIAL ALTERNATIVES
This section presents the remedial alternatives selected for evaluation to address groundwater
contamination at the Site. A brief description of each alternative is first presented and then followed
by a discussion of the major strengths and weaknesses of each with respect to the remedial action
criteria set forth in the Technical Requirements for Site Remediation, N.J.A.C. 7:26E (NJDEP,
2005b). The components of each alternative are then presented at a conceptual level only for
estimating cost and comparing with appropriate criteria in Section 5; the development of more
detailed designs for the selected remedial alternatives will be addressed in the next phase of the
project.
As stated earlier, groundwater is the only medium of concern at the Site. Based on the findings of
remedial investigations, benzene, lead, and TBA were detected above the GWQS. The horizontal
extent of groundwater contamination is limited within the site boundary except for minor exceedance
of lead in MW-8. Vertical flow exchange between deep and shallow groundwater in MW-1 and
MW-7 was determined to be minimal as indicated by a slight upward vertical gradient.
The potential remedial alternatives selected to address the gasoline-related contaminants in
groundwater at the Site are: No Further Action, Monitored Natural Attenuation (MNA), Enhanced
Monitored Natural Attenuation (EMNA), In-Situ Chemical Oxidation (ISCO), and Air Sparging/Soil
Vapor Extraction (AS/SVE), as detailed in the following subsections.
4.1 No Further Action
The “No Further Action” alternative involves leaving the Site in its current condition with no
remedial action considered. This remedial alternative does not entail any measures to control
exposure to the contaminants of concern at the Site. The contaminants may continue to pose risks to
human health and the environment. Additionally, the alternative may be perceived as unprotective
by the community. Therefore, this remedial alternative is not pursued further in this evaluation
process.
4.2 Monitored Natural Attenuation
The Monitored Natural Attenuation (MNA) remedial alternative uses institutional controls to limit
exposure, and long-term monitoring to track contaminant migration and exposure to potential
receptors. The institutional controls for the Site would consist of establishment of a Classification
Exception Area (CEA).

Page 4-2
The Louis Berger Group, Inc. Remedial Action Selection Report – Param Petroleum, Burlington, NJ
Accompanying the institutional control are natural processes which can reduce groundwater
contamination levels over time through degradation, volatilization, adsorption/desorption,
solubility/dilution, chemical transformation, advection, and dispersion. Review of groundwater
monitoring results from 2004 and 2006 remedial investigations indicate that natural processes have
begun to attenuate contamination in groundwater at the Site. Contaminant concentrations previously
detected above the GWQS at MW-2 and MW-4 in 2004 continued to degrade overtime as
demonstrated by the 2006 sampling results (Figure 3).
A CEA at the Site would be implemented in accordance with the NJDEP Final Guidance on
Designation of Classification Exception Areas (NJDEP, 1998) and the Technical Requirements for
Site Remediation, N.J.A.C. 7:26E-8.4 (NJDEP, 2005b). As such, a biennial certification is required
to be submitted for the duration of the CEA. The biennial certification report is required to ensure
the remediation of the Site remains protective to human health and the environment. The reporting
obligation ends when contaminants attenuate to concentrations that are below the GWQS.
Proposed monitoring activities for the MNA alternative include sampling of groundwater at
monitoring wells MW-1 through MW-9 semi-annually for the first 8 years and quarterly thereafter
for 2 years to track the effectiveness of contaminant degradation by natural processes at the Site.
Additionally, the Mann-Whitney U test will be conducted after the last eight (8) quarters of
groundwater monitoring to evaluate the trend of groundwater contaminant degradation (Weidemeier
et al., 1999).
The total estimated cost for this alternative is $350,000, which assumes a 10-year groundwater
monitoring period. A more detailed discussion of cost is provided in Section 5.1.8, and a full cost
breakdown for this alternative is provided in Appendix C.
4.3 Enhanced Monitored Natural Attenuation
The Enhanced Monitored Natural Attenuation (EMNA) remedial technology entails the injection of
materials enhancing biodegradation activities of subsurface microorganisms to degrade Site
contamination such as Oxygen Release Compound Advanced (ORC Advanced®) by Regenesis Inc,
EHC-OTM by Adventus Americas, Inc., etc. These products entail similar mechanisms to enhance
biodegradation; however, a bench scale treatability study would need to be conducted to evaluate for
the most appropriate product for the Site. In this report, a conceptual design of ORC Advanced® is
discussed for technology evaluation and selection purpose as follow:
ORC Advanced® is a proprietary formulation of calcium oxy-hydroxide that releases oxygen for
approximately 12 months to stimulate indigenous aerobic microbes to significantly accelerate rates

Page 4-3
The Louis Berger Group, Inc. Remedial Action Selection Report – Param Petroleum, Burlington, NJ
of biodegradation. It is anticipated that ORC Advanced® would be injected at a total of
approximately 40 locations to the target depth interval of 5 to 15 feet bgs with a couple of deep
injections located around monitoring well MW-7 for the injection of ORC Advanced® to the target
depth interval of 5 to 55 feet bgs.
ORC Advanced® would be applied based on a 20-foot grid injection pattern using direct-push
technology as shown on Figure 4. It is assumed that one (1) mandatory injection event plus an
optional injection event (approximately one year later) would be implemented at the Site. The
injection locations for each of the following injection event would be shifted by 10 feet from the
original locations to optimize the contact between ORC Advanced® solution and contaminants in soil
pores. An equal dosage of 10 lbs/foot would be used for both injections. Therefore, a total of
approximately 9,000 pounds of ORC Advanced® would be injected (approximately 4,500 lbs of
ORC Advanced® for each injection event).
The Geoprobe® would be advanced to the bottom of contaminated zone and then pulled up to the top
of contaminated zone while delivering ORC Advanced® throughout the vertical length of the
impacted aquifer. Proposed ORC Advanced® injection locations are presented on Figure 4. A field
pilot study would need to be conducted to increase effectiveness and applicability of this technology
to the Site conditions.
To track the effectiveness of the remedial action, a groundwater monitoring program consisting of
quarterly groundwater monitoring for two (2) years, semi-annual groundwater monitoring for the
next three (3) years, and quarterly thereafter for two (2) years to track the effectiveness of
contaminant degradation at the Site. Additionally, the Mann-Whitney U test will be conducted after
the last eight (8) quarters of groundwater monitoring to evaluate the trend of groundwater
contaminant degradation (Weidemeier et al., 1999) is proposed. Groundwater samples would be
collected from monitoring wells MW-1 through MW-9. A CEA would also be established to protect
human health and the environment until contaminant concentrations are reduced to applicable
standards.
This groundwater remedial technology offers a more active approach than the MNA approach by
actively degrading the contaminants via enhanced bioremediation. The total estimated cost
development of this approach is $600,000, which assumes a 5-year groundwater monitoring period.
A more detailed discussion of cost is provided in Section 5.1.8, and a full cost breakdown for this
approach is provided in Appendix C.

Page 4-4
The Louis Berger Group, Inc. Remedial Action Selection Report – Param Petroleum, Burlington, NJ
4.4 In-Situ Chemical Oxidation
The In-situ Chemical Oxidation (ISCO) remedial technology entails the use of chemical oxidizing
agent such as RegenOx® (by Regenesis Inc.) and Modified Fenton’s Reagent (by In-Situ Oxidative
Technologies, Inc). Similar to EMNA, a bench scale treatability study would need to be conducted
to evaluate for the most compatible chemicals for the Site. A conceptual design of RegenOx® is
discussed below for technology evaluation and selection purpose.
RegenOx® promotes in-situ oxidation via the use of a solid alkaline oxidant that employs a sodium
percarbonate complex with a multi-part catalytic formula. The chemical consists of two parts (i.e.,
an oxidizer and activator) that are combined and injected into the subsurface. Once in the
subsurface, RegenOx® produces oxidation reactions via a number of mechanisms including: surface
mediated oxidation, direct oxidation and free radical oxidation. However, compared to the EMNA
alternative, RegenOx® has a short “life span”, about 30 days in-situ; thus this alternative depends on
the distribution of RegenOx® in the subsurface; so that it contacts the contamination soon after
injection.
An approximate total of 30,000 lbs of RegenOx® is proposed to be applied to the subsurface at
approximately 5 to 15 feet bgs and at multiple locations using direct push method (e.g., Geoprobe®).
A total of 150 injection points with a spacing to allow approximately 10 feet radius of influence are
proposed based on the Site’s hydrogeological characteristics, groundwater elevations and
contamination conditions; similar to EMNA, a few deep injections would be located around MW-7
for the injection of RegenOx® to the target depth interval of 5 to 55 feet bgs.
The ISCO alternative would entail a total of two (2) applications (one mandatory injection event plus
one optional injection event) of equal amount of RegenOx® injection.(i.e., approximately 10 lbs/foot
or 15,000 lbs for each application). Injection locations of the second application would be shifted
from the original locations by 5 feet to optimize the contact between RegenOx solution and
contaminants in soil pores. The Geoprobe® would be advanced to the bottom of contaminated zone
and then pulled up to the top of contaminated zone while delivering RegenOx® throughout the
vertical length of the impacted aquifer. Proposed RegenOx® injection locations are presented on
Figure 5. A field pilot study would need to be conducted to increase effectiveness and applicability
of this technology to the Site conditions.
To track the effectiveness of the remedial action, a groundwater monitoring program consisting of
quarterly groundwater monitoring for one (1) year, semi-annual groundwater monitoring for the
following three (3) years, and quarterly sampling thereafter for two (2) years to track the
effectiveness of contaminant degradation at the Site. Additionally, the Mann-Whitney U test will be

Page 4-5
The Louis Berger Group, Inc. Remedial Action Selection Report – Param Petroleum, Burlington, NJ
conducted after the last eight (8) quarters of groundwater monitoring to evaluate the trend of
groundwater contaminant degradation (Weidemeier et al., 1999) is proposed. Groundwater samples
would be collected from monitoring wells MW-1 through MW-9. A CEA would also be established
to protect human health and the environment until contaminant concentrations are reduced to
applicable standards.
The total estimated cost development of this approach is $550,000, which assumes a 5-year
groundwater monitoring period. A more detailed discussion of cost is provided in Section 5.1.8, and
a full cost breakdown for this approach is provided in Appendix C.
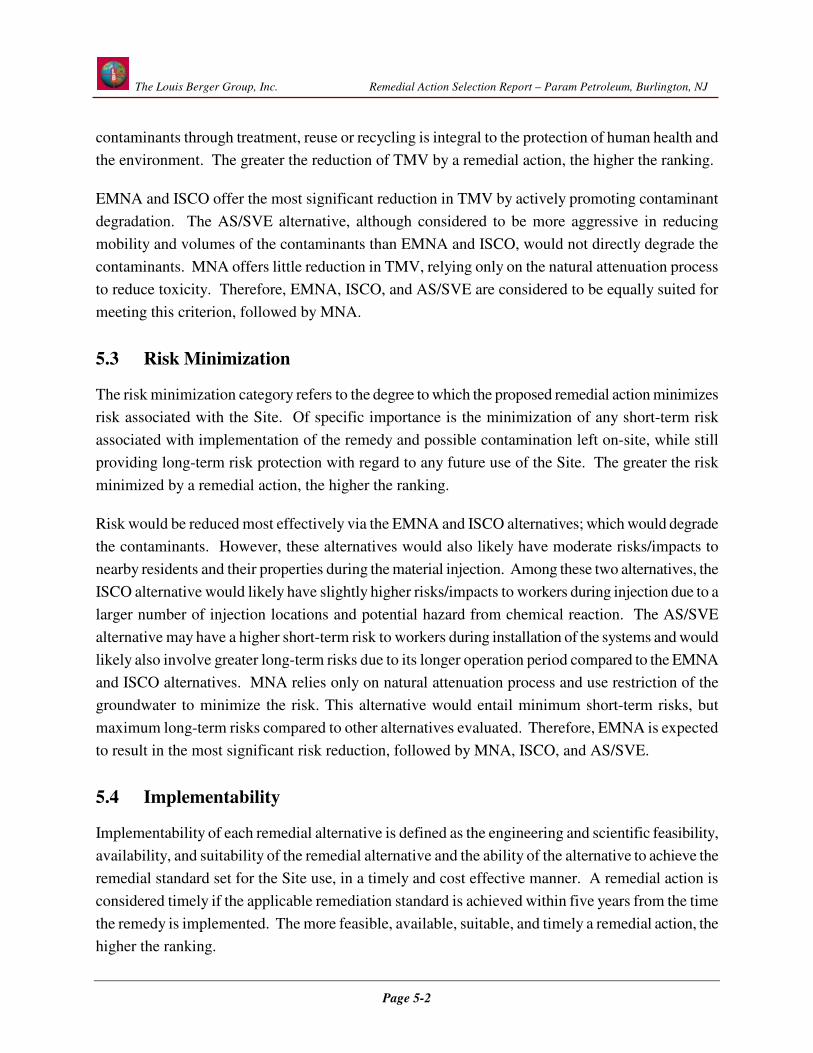
4.5 Air Sparging/Soil Vapor Extraction
Air Sparging/Soil Vapor Extraction (AS/SVE) is a proven in-situ remediation technology for the
saturated and unsaturated (vadose) zones. This alternative involves the injection of air into the
groundwater source zone, volatilizing volatile and semi-volatile organic contaminants into the
unsaturated zone. The application of SVE concurrently in the unsaturated soil removes the generated
vapor-phase contaminants from the vadose zone. The extracted contaminated vapor would then be
treated by GAC adsorption or other processes prior to discharge into the atmosphere.
The AS/SVE alternative is a favorable technique for the minimization and control of risk to human
health. It is a proven and widely used technology that can effectively reduce contaminant
concentrations in both the saturated and unsaturated zones. However, this alternative requires the
installation and potentially long-term O&M of an ex-situ treatment system, and thus, would likely
incur higher costs; and the relative shallow groundwater table would limit the effectiveness of the
AS/SVE alternative due to 1) the potential local air short circuiting of the SVE system, and 2) uptake
of groundwater by the system in the trenches. The technology may also not be effective to address
TBA at depth in the vicinity of monitoring well MW-7 because the existence of clay layer at
approximately from 24 to 30 feet bgs may block the vapor-phase contaminant sparged by the deep
AS well. Finally, this alternative has the potential limitation of introducing uncontrolled movement
of potentially dangerous vapors in the subsurface.
As presented on Figure 6, it is proposed that nine (9) AS wells to be installed to the depth of
approximately 15 feet bgs and one (1) AS wells located close to monitoring well MW-7 to be
installed to the depth of 55 feet bgs. Based on the preliminary site information (e.g., hydrogeological
conditions), a radius of influence of 15 to 20 feet (approximately 40 feet well spacing) is estimated
for the AS wells assuming an air flow rate of 5 cubic feet per minute (cfm). Horizontal extraction
trenches would be installed to collect extracted vapor due to shallow groundwater table at the Site.

Page 4-6
The Louis Berger Group, Inc. Remedial Action Selection Report – Param Petroleum, Burlington, NJ
The flow rate of the AS wells is estimated to be 50 cfm. The extracted vapor is assumed to be
treated ex-situ by GAC adsorption for this alternative. A field pilot study would be conducted to
ensure effectiveness of the design specifications (e.g., flow rate and radius of influence).
In order to determine the effectiveness of the AS/SVE system, four (4) soil gas monitoring points
would be installed in the treatment area for monitoring and sampling. Groundwater samples would
be collected from a total of nine (9) groundwater monitoring wells (MW-1 through MW-9) as shown
on Figure 3. It is estimated that this alternative would require approximately five (5) years of
operation to accomplish remedial goal. Groundwater sampling would be conducted quarterly for the
first five (5) years and semi-annually for the next three (3) years to track the effectiveness of the
remedial action. Additional two (2) years of groundwater monitoring along with the Mann-Whitney
U test would be conducted thereafter to evaluate the trend of groundwater contaminant degradation
(Weidemeier et al., 1999). Weekly vapor pressure and/or flow rate readings would also be recorded
at the AS/SVE wells and the monitoring points to monitor the system performance. The SVE wells
and the GAC system influent/effluent would be sampled and tested monthly to determine the need
for carbon replacement and monitor the air discharge, respectively.
The total estimated cost development of this approach is $1,700,000, which assumes a 8-year
groundwater monitoring period. A more detailed discussion of cost is provided in Section 5.1.8, and
a full cost breakdown for this approach is provided in Appendix C.

Page 5-1
The Louis Berger Group, Inc. Remedial Action Selection Report – Param Petroleum, Burlington, NJ
5.0 EVALUATION OF REMEDIAL ALTERNATIVES
A critical component of the remedial action selection is comparative analysis of each alternative
among the remedial action criteria set forth in the Technical Requirements for Site Remediation.
This section compares the strengths and weaknesses of the groundwater remedial alternatives relative
to one another with respect to the specified criteria, and how reasonable variations of key
uncertainties could change the expectations of their relative performance. The following subsections
present the evaluation of the proposed remedial alternatives against each evaluation criterion. The
results of the evaluation are summarized in Table 1. A qualitative ranking system has also been
developed to aid in the remedial selection process using levels defined as good, fair, and poor. The
rankings (Table 2) reflect the relative effectiveness of each remedial alternative to meet the
conditions of a particular criterion.
5.1 Effectiveness and Reliability of Attaining the Applicable Remediation
Standards
This criterion considers the technical performance of each remedial alternative evaluated to
effectively attain compliance with the applicable remediation standard for the Site and maintain it in
the long term. The applicable remediation standards are indirect measures of potential risk to human
health and the environment. The more effective and reliable a remedial alternative, the higher the
ranking.
Contaminants would effectively be degraded by chemical reaction of the ISCO alternative; however,
its effectiveness may depend highly on the contact between the reducing/oxidizing materials and the
contaminants. EMNA offers less aggressive contaminant degradation, but would allow longer-
lifespan ORC Advanced® to contact with contaminants for a longer time. Generally, the AS/SVE
alternative is expected to have relatively high effectiveness for this site due to high permeability of
the impact aquifer. Also, the AS process would increase the amount of air flow rate in the aquifer
and could enhanced natural degradation processes of the contaminants. However, the technology
may not be effective to address TBA concentration at depth around MW-7. MNA is only intended to
monitor and restrict use of the groundwater; however, historic and recent groundwater results
indicated that contaminants have been degraded by natural processes. Therefore, ISCO and EMNA
are considered to be best suited for meeting this criterion, equally followed by AS/SVE and MNA.
5.2 Reduction of Toxicity, Mobility, or Volume
The degree to which each remedial alternative reduces the toxicity, mobility, or volume (TMV) of
Page 5-2
The Louis Berger Group, Inc. Remedial Action Selection Report – Param Petroleum, Burlington, NJ
contaminants through treatment, reuse or recycling is integral to the protection of human health and
the environment. The greater the reduction of TMV by a remedial action, the higher the ranking.
EMNA and ISCO offer the most significant reduction in TMV by actively promoting contaminant
degradation. The AS/SVE alternative, although considered to be more aggressive in reducing
mobility and volumes of the contaminants than EMNA and ISCO, would not directly degrade the
contaminants. MNA offers little reduction in TMV, relying only on the natural attenuation process
to reduce toxicity. Therefore, EMNA, ISCO, and AS/SVE are considered to be equally suited for
meeting this criterion, followed by MNA.
5.3 Risk Minimization
The risk minimization category refers to the degree to which the proposed remedial action minimizes
risk associated with the Site. Of specific importance is the minimization of any short-term risk
associated with implementation of the remedy and possible contamination left on-site, while still
providing long-term risk protection with regard to any future use of the Site. The greater the risk
minimized by a remedial action, the higher the ranking.
Risk would be reduced most effectively via the EMNA and ISCO alternatives; which would degrade
the contaminants. However, these alternatives would also likely have moderate risks/impacts to
nearby residents and their properties during the material injection. Among these two alternatives, the
ISCO alternative would likely have slightly higher risks/impacts to workers during injection due to a
larger number of injection locations and potential hazard from chemical reaction. The AS/SVE
alternative may have a higher short-term risk to workers during installation of the systems and would
likely also involve greater long-term risks due to its longer operation period compared to the EMNA
and ISCO alternatives. MNA relies only on natural attenuation process and use restriction of the
groundwater to minimize the risk. This alternative would entail minimum short-term risks, but
maximum long-term risks compared to other alternatives evaluated. Therefore, EMNA is expected
to result in the most significant risk reduction, followed by MNA, ISCO, and AS/SVE.
5.4 Implementability
Implementability of each remedial alternative is defined as the engineering and scientific feasibility,
availability, and suitability of the remedial alternative and the ability of the alternative to achieve the
remedial standard set for the Site use, in a timely and cost effective manner. A remedial action is
considered timely if the applicable remediation standard is achieved within five years from the time
the remedy is implemented. The more feasible, available, suitable, and timely a remedial action, the
higher the ranking.

Page 5-3
The Louis Berger Group, Inc. Remedial Action Selection Report – Param Petroleum, Burlington, NJ
All of the alternatives proposed are considered readily implementable. However, only the ISCO
alternative is considered timely because it is expected to achieve the applicable remediation
standards within 5 years. Implementation of EMNA and ISCO would involve some injection
activities. AS/SVE would require considerable system installation and system maintenance efforts.
Applicable remediation standards are unlikely to be achieved by EMNA or AS/SVE within 5 years.
Although MNA would require very little effort to implement, it may take longest period to achieve
the standards. In summary, ISCO is considered to be best suited to meet this criterion, followed by
EMNA and AS/SVE, with MNA considered the least favorable.
5.5 Compliance with Applicable Laws and Regulations
This criterion considers the relative performance of each remedial action evaluated to achieve
compliance with Federal, State, and local laws and regulations, and was designed to draw particular
attention to more specialized provisions such as those of the Pinelands Protection Act and the
National Parks and Recreation Act. In this case, the Technical Requirements for Site Remediation
govern the majority of the work, as well as specialized provisions specific to the remedial action
evaluated, which are discussed in each section for the media of concern. If a remedial alternative is
not in compliance with any applicable laws and/or regulations, it will receive a low ranking in this
measure.
All of the groundwater remedial alternatives are consistent with all applicable laws and regulations,
including the Federal Safe Drinking Water Act (40 CFR parts 141, 142, and 143) and State Safe
Drinking Water Act (N.J.A.C. 7:10-1) that regulate levels of contaminants in drinking water. In
summary, MNA, EMNA, ISCO, and AS/SVE are considered equally compliant.
5.6 Potential Impacts on the Local Community
Potential impacts on the local community of each remedial action alternative are defined by the
balance between adverse short-term impacts to the community due to implementation, and the degree
to which the remedial action promotes the ability of the local community to use the Site for the local
land use master plan. The greater the long-term ability of the local community to use the Site
compared to short-term impacts due to implementation, the higher the ranking.
Implementation of ISCO and EMNA would have moderate short-term impacts to the community due
to multiple injection applications. Compared to ISCO, the EMNA alternative provides slightly lower
short-term impacts due to its smaller number of injection points, but the alternative may provide
higher long-term impacts due to its longer required period to reach the cleanup standards. Even
though the MNA alternative would have little disturbance to the local community, it may be

Page 5-4
The Louis Berger Group, Inc. Remedial Action Selection Report – Param Petroleum, Burlington, NJ
perceived by the community as unprotective with the potential for long-term maintenance of CEA.
Installation of AS/SVE system may provide some ongoing disturbance to the community due to
noise, exhaust and other operational activities. In summary, ISCO and EMNA are considered to
subject the community the least potential impacts, followed by MNA and finally AS/SVE.
5.7 Potential for Natural Resource Injury
This criterion considers the potential for injury to natural resources, defined as “all land, biota, fish,
shellfish, and other wildlife, and waters among other such resources,” from implementation of the
remedial action. The more a remedial alternative reduces the potential for natural resources injury,
the higher the ranking.
MNA, EMNA, and ISCO are considered equal and subject natural resources to minimal potential for
injury due to their implementation. AS/SVE requires excavation during construction and could
result in sediment runoff to downgradient streams/waterways, etc; thus considered the least favorable
in this criterion. In summary, MNA, EMNA, and ISCO are considered equal to satisfy this criterion,
followed by AS/SVE.
5.8 Cost
The cost of the remedial alternative is a measure of its economic feasibility and is integral to the
cost-benefit analysis. The cost estimates for the RAS were developed, in part, using the parametric
cost modeling software Remedial Action Cost Engineering and Requirements (RACER) (Earth
Tech, Ltd., Long Beach, CA). RACER’s costs were adopted from the 2006 Environmental Cost
Handling Options and Solutions (ECHOS) cost database published by RS Means. Berger adjusted
the estimated costs by applying an escalation factor assuming the proposed remedial alternatives
would take place in January 2010. Berger supplemented the database, where appropriate, with costs
for items not included in ECHOS. The final cost estimates were developed as Net Present Value
(NPV) before taxes and after inflation (i = 5%) and also include markups.
For the Param Petroluem Site, modifiers reflecting local adjustments for the New Jersey State
average area have been applied to the direct costs (i.e., costs of materials, labor, and equipment).
The modifications applied represent industry standards defined by Means and account for overhead,
profit, contingency, administrative, management, and oversight costs.
The unit costs that have the greatest impact on the cost estimates for the remedial alternatives
detailed within this RAS were verified with contractor quotes from similar projects and deemed to be
accurate and acceptable. These line items include transportation and disposal, lab analysis, material

Page 5-5
The Louis Berger Group, Inc. Remedial Action Selection Report – Param Petroleum, Burlington, NJ
cost, drilling, excavation and backfilling. The costs for the alternatives are believed to be within
20% of the actual cost.
The MNA alternative is the least expensive at approximately $350,000, followed by EMNA at
$600,000, ISCO at $550,000, and AS/SVE at $1,700,000. A summary of the costs for each
alternative addressing groundwater contamination is provided in Table 3, and raw cost data are
provided in Appendix C.

Page 6-1
The Louis Berger Group, Inc. Remedial Action Selection Report – Param Petroleum, Burlington, NJ
6.0 REFERENCES
Berger (The Louis Berger Group, Inc.), 2008. Remedial Investigation Report, Submitted to NJDEP,
August 2008.
Markley, M.L., 1971. Soil Survey of Burlington County, New Jersey, U.S. Department of
Agriculture Soil Conservation Service, Somerset, N.J.
NJDEP, 1998. Final Guidance on Designation of Classification Exception Areas, November 1998.
NJDEP, 1999. Soil Cleanup Criteria, N.J.A.C. 7:26D, May 1999.
NJDEP, 2005a. Groundwater Quality Standards, N.J.A.C. 7:9C, November 2005.
NJDEP, 2005b. New Jersey Technical Requirements for Site Remediation, N.J.A.C. 7:26E, July
2005.
NJDEP, 2008. Soil Remediation Standards, N.J.A.C. 7:26D, June 2008.
Rush, F.E., 1968, Geology and Groundwater Resources of Burlington County, New Jersey. U.S.
Geological Survey, Special Report No. 26
USGS (U.S> Geological Survey), 1976, 7.5-minute Bristol, New Jersey Quadrangle, U.S.
Geological Survey, Reston, VA.
Weidemeier, T. H., Rifai, H. S., Newell, C. J., and Wilson, J. T., 1999, Natural Attenuation of Fuels
and Chlorinated Solvents in the Subsurface, John Wiley and Sons, 1999.

TABLES

Table 1 Param Petroleum Site
Burlington., NJ Evaluation of Remedial Action Alternatives
(Groundwater)
Remedial Alternative
Protection of Human Health and the Environment
Implementability Consistency With Applicable Laws and Regulations
Potential Impacts on the Local Community
Potential for Natural Resource Injury
Estimated Costs
(Net Present Value) Effectiveness and Reliability
in Attaining Applicable Remediation Standard
Reduction of Toxicity, Mobility or Volume Risk Minimization
Monitored Natural Attenuation (MNA)
MNA is only intended to monitor and restrict use of the groundwater; however historic and recent groundwater results indicated that contaminants have been effectively attenuated by natural processes.
The MNA alternative offers relatively little reduction in toxicity, mobility, or volume. It relies only on natural attenuation to reduce toxicity by eventually degrading the compounds.
MNA relies only on natural attenuation process and use restriction of the groundwater to minimize the risk. This alternative would entail minimum short-term risks, but increased long-term risks compared to other alternatives evaluated.
The MNA alternative is readily implementable as it is a common, well-established approach. It would require very little effort to implement.
The MNA alternative is consistent with the New Jersey Technical Requirements for Remediation.
Even though the MNA alternative would have little disturbance to the local community, it may be perceived by the community as unprotective.
MNA, EMNA, and ISCO are considered to equally offer minimum potential for natural resource injury due to their implementation.
Capital Costs ≅ $10,000 O&M Costs ≅ $340,000 TOTAL =$350,000
Enhanced Monitored Natural Attenuation (EMNA)
EMNA, although offers less aggressive contaminant degradation than ISCO, would allow Advanced ORC to contact with contaminants for up to 12 months.
The EMNA offers the greatest reduction in the toxicity, mobility, or volume of the contaminants through natural degradation enhanced with ORC Advanced injection.
The EMNA alternative will reduce the risk most effectively by degrading and reducing the contaminant concentrations on site. The alternative may have moderate risks/impacts to nearby residents due to injection activities.
The EMNA alternative is readily implementable, as it is an easily applied treatment with demonstrated effectiveness. Its implementation would involve some injection activities.
The EMNA alternative is consistent with the New Jersey Technical Requirements for Remediation.
Compared to ISCO, the EMNA alternative provides slightly lower short-term impacts due to its smaller number of injection points, but the alternative may provide higher long-term impacts due to its longer required period to reach the cleanup standards.
MNA, EMNA, and ISCO are considered to equally offer minimum potential for natural resource injury due to their implementation.
Capital Costs ≅ $250,000 O&M Costs ≅ $400,000 TOTAL = $600,000
In-Situ Chemical Oxidation (ISCO)
Contaminants would effectively be degraded by chemical reaction of the ISCO alternative; however, its effectiveness will depend on the contact between the reducing/oxidizing materials and the contaminants.
The ISCO offers the greatest reduction in the toxicity, mobility, or volume by actively pursuing contaminant degradation through injection of RegenOx.
The ISCO alternative may entail slightly higher risks/impacts to workers, compared to EMNA due to a larger number of injection locations and potential hazard from chemical reaction.
The ISCO alternative is readily implementable. The alternative is expected to achieve the applicable remediation standards most quickly, but would likely require higher effort for injection activities compared to EMNA.
The ISCO alternative is consistent with the New Jersey Technical Requirements for Remediation.
The ISCO alternative is expected to have slightly higher short-term impacts to the community, compared to EMNA, due to its larger number of injection locations. The alternative, however, would greatly reduce long-term impacts to the community because its short period required to achieve the cleanup standards
MNA, EMNA, and ISCO are considered to equally offer minimum potential for natural resource injury due to their implementation.
Capital Costs ≅ $300,000 O&M Costs ≅ $250,000 TOTAL = $550,000
Air Sparging /Soil Vapor Extraction (AS/SVE)
Relatively high effectiveness of extraction system as part of the AS/SVE alternative is expected for this site due to high permeability of the impact aquifer. However, it may not be effective to address TBA at depth.
The AS/SVE alternative, although considered to be more aggressive in reducing mobility and volumes of the contaminants than EMNA and ‘ISCO, would not directly degrade the contaminants.
The AS/SVE alternative may have a higher short-term risk to workers during installation of the systems and would likely also involve greater long-term risks due to its longer operation period compared to the EMNA and ISCO alternatives.
AS/SVE is readily implementable; however, it is considered slightly less favorable than other alternatives because it would require considerable system installation and system maintenance efforts.
The AS/SVE alternative is consistent with the New Jersey Technical Requirements for Remediation.
Installation of AS/SVE system may provide some disturbance to the community due to noise, exhaust and other operational activities
AS/SVE would result in potential for water runoff to downgradient streams/waterways, etc; thus considered as the least favorable in meeting this criterion.
Capital Costs ≅ $500,000 O&M Costs ≅ $1,200,000 TOTAL = $1,700,000

Table 2 Param Petroleum Site
Burlington, NJ Comparative Analysis of Remedial Alternatives
(Groundwater)
Criteria
Monitored Natural
Attenuation
Enhanced Monitored
Natural Attenuation
In-Situ Chemical Oxidation
Air Sparging/Soil Vapor Extraction
Effectiveness and Reliability of Attaining Remediation Standard
Reduction in Toxicity, Mobility, or Volume
Risk Minimization
Implementability
Consistency with Applicable Laws and Regulations
Potential Impacts on Local Community
Potential for Natural Resource Injury
Estimated Costs
The legend below refers to the ability of the remedial alternatives relative to one another to effectively meet the specified criteria defined by the New Jersey Technical Requirements for Site Remediation (NJAC 7:26E) and the NJDEP RI/RASE Statement of Work (SOW).
Good
Fair
Poor

Table 3 Param Petroleum Site
Burlington, NJ Comparison of Total Estimated Cost among Remedial Alternatives
Media of Concern Remedial Action Alternative Cost
Groundwater
Monitored Natural Attenuation $350,000
Enhanced Monitored Natural Attenuation $600,000
In-Situ Chemical Oxidation $550,000
Air Sparging/Soil Vapor Extraction $1,700,000

FIGURES


APPENDICES

APPENDIX A 2004 and 2006 Groundwater Analytical Results

Table 6New Jersey Department of Environmental Protection
Param PetroleumBurlington, New Jersey
Groundwater Results July 2004
MW-1 MW-2 MW-3 MW-5 FB-01MW-1 MW-2 MW-3 MW-4 DUPE-01 MW-5 FB-01
N73626-1 N73626-2 N73626-3 N73626-4 N73626-6 Not Sampled N73626-57/28/2004 7/28/2004 7/28/2004 7/28/2004 7/28/2004 - 7/28/2004
ANALYTE NJGWQS Interim NJGWQS
Volatile Organic Compounds +10Acetone 700 NC 3.9 U 48 3.9 U 3.9 U 17.8 3.9 UBenzene 1 NC 0.65 J 1,290 0.33 U 268 194 0.33 UEthylbenzene 700 NC 0.22 U 403 0.22 U 172 131 0.22 UMethyl Tert Butyl Ether NC 70 59.7 208 1.8 13 13.5 0.41 UTertiary Butyl Alcohol NC 100 284 10 U 10 U 10 U 10 U 10 UToluene 1,000 NC 0.23 J 315 0.11 U 803 635 0.11 UXylenes (Total) 40 1000 0.26 U 1,760 0.26 U 1,090 867 0.26 U
Semivolatile Organic Compounds +202,4-Dimethylphenol 100 NC 1.0 U 3.0 J 1.0 U 1.0 U 9.0 1.0 U2-Methylnaphthalene NC 100 10.4 7 0.72 U 3 4.7 0.72 U2-Methylphenol NC NC 0.72 U 0.72 U 0.72 U 2.8 4.9 0.72 U3&4-Methylphenol NC NC 0.70 U 0.70 U 0.70 U 1.2 J 1.8 J 0.70 Ubis(2-Ethylhexyl)phthalate 30 NC 0.74 U 0.74 U 0.74 U 2.1 1.8 J 0.74 UFluorene 300 NC 2 0.89 U 0.89 U 0.89 U 0.89 U 0.89 UNaphthalene NC 300 1.0 U 35.3 1.0 U 16.3 24 1.0 U
Total TICs (VOC+SVOC)Total TICs NC 500 351.2 4161.8 J 43.3 J 1507.5 J 1677.4 J NS 0
Inorganic CompoundsAluminum 200 NC 2,500 1,560 1,010 1,050 496 200 UArsenic 8 NC 30 14.8 5 U 5 U 5 U 5 UCalcium NC NC 13,100 11,300 21,200 6,890 6,550 5,000 UChromium 100 NC 16 10 U 10 U 10 U 10 U 10 UIron 300 NC 99,800 51,800 3,030 62,800 64,300 100 ULead 10 NC 3.8 3 U 3 U 3 U 3 U 3 UMagnesium NC NC 10,200 9,240 21,400 5,640 5,700 5,000 UManganese 50 NC 1,560 2,530 971 1,040 1,060 15 UPotassium NC NC 5,000 U 13,400 8,130 5,000 U 5,000 U 5,000 USodium 50,000 NC 33,600 26,200 17,400 36,600 37,900 5,000 UZinc 5,000 NC 29.8 29.7 37.5 50.1 43.3 20 U
Total Petroleum HydrocarbonsTPHC* NC NC ND 1.9 ND 0.77 0.86 NS ND
Notes:All results reported in parts per billion (ug/L). U - Not detected above the Sample Quantification Limit (SQL).* - Results reported in parts per million (mg/L). J - Estimated concentration.NJGWQS - New Jersey Ground Water Quality Standards (N.J.A.C. 7:9-6). Bold values indicate positive detections.NS - Not sampled Bold and shaded values meet or exceed NJGWQS (N.J.A.C. 7:9-6).ND - Not DetectedNC - No criteria established.
MW-4
Not Sampled Well
Inaccessible
SAMPLE LOCATIONFIELD SAMPLE ID
LAB IDDATE COLLECTED
Not Sampled Well
Inaccessible
Not Sampled Well
Inaccessible

Table 7New Jersey Department of Environmental Protection
Param PetroleumBurlington, New Jersey
Groundwater Results October 2004
MW-1 MW-2 MW-3 MW-4 FB-02MW-1 - MW-3 - MW-5 DUPE02 FB-02
N81784-2 - N81784-3 - N81784-1 N81784-4 N81784-510/27/2004 Not Sampled 10/27/2004 Not Sampled 10/27/2004 10/27/2004 10/27/2004
ANALYTE NJGWQS Interim NJGWQS
Volatile Organic Compounds +10Ethylbenzene 700 NC 0.22 U 1 U 0.77 J 0.54 J 0.22 UMethyl Tert Butyl Ether NC 70 29.2 1 U 1.1 1.1 0.41 UTertiary Butyl Alcohol NC 100 102 10 U 10 U 10 U 10 U
Semivolatile Organic Compounds +20Acenaphthene 400 NC 0.67 J 0.30 U 0.30 U 0.30 U 0.30 UDibenzofuran NC 100 0.78 J 0.51 U 0.51 U 0.51 U 0.51 U2-Methylnaphthalene NC 100 3.3 0.74 U 0.74 U 0.74 U 0.74 Ubis(2-Ethylhexyl)phthalate 30 NC 0.76 U 2.4 0.76 U 0.76 U 0.76 UFluorene 300 NC 1.8 J 0.92 U 0.92 U 0.92 U 0.92 UPhenanthrene NC 100 1.8 J 0.24 U 0.24 0.24 0.24 U
Total TICs (VOC+SVOC)Total TICs NC 500 143.7 J NS 0 NS 38.8 J 39 J 0
Inorganic CompoundsAluminum 200 NC 200 U 1,290 3,930 1,760 200 UArsenic 8 NC 28 5 U 22.8 26.3 5 UCalcium NC NC 13,500 21,800 21,800 23,700 5000 UChromium 100 NC 10 U 10 U 37.4 17.7 10 UCopper 1,000 NC 25 U 25 U 27 25 U 25 UIron 300 NC 113,000 4,680 58,700 55400 100 ULead 10 NC 3 U 3 U 4 3 U 3 UMagnesium NC NC 11,300 22,100 19,300 20,000 5000 UManganese 50 NC 2,030 1,030 2,380 2,660 15 UPotassium NC NC 5000 U 8,340 11,200 10,300 5000 USodium 50,000 NC 43300 1,600 26,100 27,800 5000 UZinc 5,000 NC 20 U 25.5 75 35 20 U
Total Petroleum HydrocarbonsTPHC* NC NC 0.55 U NS 0.51 U NS 0.54 U 0.54 U 0.55 U
Notes:All results reported in parts per billion (ug/L).* - Results reported in parts per million (mg/L).NJGWQS - New Jersey Ground Water Quality Standards (N.J.A.C. 7:9-6).NS - Not sampledND - Not DetectedNC - No criteria established.U - Not detected above the Sample Quantification Limit (SQL).J - Estimated concentration.Bold values indicate positive detections.Bold and shaded values meet or exceed NJGWQS (N.J.A.C. 7:9-6).
SAMPLE LOCATIONFIELD SAMPLE ID
LAB IDDATE COLLECTED
MW-5
Not Sampled Product Present
Not Sampled Product Present
Not Sampled Product Present
Not Sampled Product Present
Not Sampled Product Present
Not Sampled Product Present

Table 8New Jersey Department of Environmental Protection
Param PetroleumBurlington, NJ
Hydropunch Results
Sample ID HP 13-14' HP 18-19' HP 23-24' HP 28-29' HP 33-34' HP 38-39' HP 43-44' HP 46.5-47.5' HP 51.5-52.5'Lab Sample ID J37792-1 J37792-2 J37792-3 J37792-4 J37792-5 J37792-6 J37792-7 J37792-8 J37792-9
Sample Date 8/7/2006 8/7/2006 8/7/2006 8/7/2006 8/7/2006 8/7/2006 8/7/2006 8/7/2006 8/7/2006Analyte 2005 NJDEP GWQSAcetone 6000 5 U 5 U 5 U 5 U 5 U 5 U 10 5.2 5 UBenzene 1 1 U 0.25 J 0.33 J 1 U 1 U 1 U 1 U 1 U 1 UCarbon Disulfide 700 1 U 0.54 J 0.35 J 0.33 J 0.89 J 0.63 J 1 U 1 U 1 UTotal VOC TICs 500 42 J 28.8 J 9.5 J 10.5 J 0 0 12.6 J 37.6 J 22.4 J
Notes:- Results dry weight- All results reported in parts per million (mg\kg)- U = Not detected above the quantitation limit; the value presented is the sample quantitation limit- J = estimated concentration- NC = No Criteria established- NJDEP GWQS = New Jersey Groundwater Quality Standards N.J.A.C. 7: 9-6- Bolded values indicate positive detections- Bolded and shaded values indicate that one or more Criteria have been exceeded

Table 9New Jersey Department of Environmental Protection
Param PetroleumBurlington, NJ
Groundwater Results September 2006
Location ID MW-1 MW-2 MW-3 MW-4 MW-5 MW-7 MW-8 MW-9 FB01 FB02 TB TBSample ID MW-1 MW-2 MW-3 MW-4 MW-5 MW-6 DUP01 MW-7D MW-8 MW-9 FB01 FB02 TB TB
Lab Sample ID J40756-3 J40913-5 J40913-2 J40913-7 J40756-6 J40756-4 J40756-5 J40756-1 J40913-6 J40913-3 J40756-2 J40913-1 J40756-7 J40913-4Sample Date 9/11/2006 9/12/2006 9/12/2006 9/12/2006 9/11/2006 9/11/2006 9/11/2006 9/11/2006 9/12/2006 9/12/2006 9/11/2006 9/12/2006 9/11/2006 9/12/2006
VOCs 2005 NJDEP GWQSAcetone 6000 25 U N/A N/A N/A 5 U 5 U 5 U 5 U N/A N/A 5 U 5 U 5 U 5 UBenzene 1 23.3 642 1 U 122 1 U 1 U 1 U 1 U 1 U 1 U 1 U 1 U 1 U 1 UCarbon Disulfide 700 5 U N/A N/A N/A 1 U 1 U 1 U 2.0 N/A N/A 1 U 1 U 1 U 1 UEthylbenzene 700 5 U 106 1 U 66.8 1 U 1 U 1 U 1 U 1 U 1 U 1 U 1 U 1 U 1 UMethyl Tert Butyl Ether 70 2140 137 1.1 17.8 1.1 0.61 J 0.60 J 20.8 10.7 1.9 1 U 1 U 1 U 1 UTert-Butyl Alcohol 100 9050 130 U 25 U 25 U 25 U 25 U 25 U 211 25 U 25 U 25 U 25 U 25 U 25 UToluene 1000 5 U 25.7 1 U 16.5 1 U 1 U 1 U 1 U 1 U 1 U 1 U 1 U 1 U 1 UXylene (Total) 1000 5 U 51.4 1 U 41.8 1 U 1 U 1 U 1 U 1 U 1 U 1 U 1 U 1 U 1 USVOCsAcenaphthene 400 0.46 J 2 U 2 U 2 U 2 U 2 U 2 U 2 U 2 U 2 U 2 U 2 U NA NAbis(2-Ethylhexyl)Phthalate 3 2 U 2 U 2 U 1.3 J 2 U 1.3 J 2 U 2 U 1.0 J 2 U 2 U 2 U NA NAFluorene 300 0.80 J 2 U 2 U 2 U 2 U 2 U 2 U 2 U 2 U 2 U 2 U 2 U NA NANaphthalene 300 2 U 6.0 2 U 5.9 2 U 2 U 2 U 2 U 2 U 2 U 2 U 2 U NA NAPhenol 2000 2 U 1.7 J 2 U 2 U 2 U 2 U 2 U 2 U 2 U 2 U 2 U 2 U NA NATotal TICs (VOC+SVOC)Total TICs 500 100 J 1523.4 J 0 1948 J 21.3 J 0 0 10 J 0 0 140 J 0 0 0MetalsLead 5 3 U 3 U 3 U 3 U 3 U 3 U 3 U 4.3 3 U 3 U 3 U 3 U NA NA
Notes:
- All results reported in parts per million (ug/L)
- U = Not detected above the quantitation limit; the value presented is the sample quantitation limit
- J = estimated concentration
- NC = No Criteria established
- NA = sample not tested for this analyte
- NJDEP GWQS = New Jersey Groundwater Quality Standards N.J.A.C. 7: 9-6
- Bolded values indicate positive detections- Bolded and shaded values indicate that one or more Criteria have been exceeded
MW-6

Table 10New Jersey Department of Environmental Protection
Param PetroleumBurlington, NJ
Groundwater Results December 2006
Location ID MW-1 MW-2 MW-3 MW-4 MW-5 MW-6 MW-8 MW-9 FB01 FB02 TB TBSample ID MW1 MW2 MW3 MW4 MW5 MW6 MW7 DUP01 MW8 MW9 FB01 FB02 TB TB
Lab Sample ID J48480-1 J48480-8 J48480-6 J48480-9 J48386-1 J48480-5 J48480-3 J48480-2 J48386-3 J48386-2 J48386-4 J48480-7 J48386-5 J48480-4Sample Date 12/6/2006 12/6/2006 12/6/2006 12/6/2006 12/5/2006 12/6/2006 12/6/2006 12/6/2006 12/5/2006 12/5/2006 12/5/2006 12/6/2006 12/5/2006 12/6/2006
VOC 2005 NJDEP GWQCBenzene 1 1 U 483 1 U 151 1 U 1 U 1 U 1 U 1 U 1 U 1 U 1 U 1 U 1 UEthylbenzene 700 1 U 80.9 1 U 69.9 1 U 1 U 1 U 1 U 1 U 1 U 1 U 1 U 1 U 1 UMethyl Tert Butyl Ether 70 28.3 65.0 1.3 10.4 0.75 J 0.39 J 14.4 14.9 1.7 0.86 J 1 U 1 U 1 U 1 UTertiary Butyl Alcohol 100 6870 50 U 25 U 25 U 25 U 25 U 261 276 25 U 25 U 25 U 25 U 25 U 25 UToluene 1000 1 U 24.8 1 U 33.1 1 U 1 U 1 U 1 U 1 U 1 U 1 U 1 U 1 U 1 UXylenes (total) 1000 1 U 84.1 1 U 110 1 U 1 U 1 U 1 U 1 U 1 U 1 U 1 U 1 U 1 USVOC2-Methylnaphthalene NC 2 U 0.84 J 2 U 1.2 J N/A 2 U 2 U 2 U N/A N/A 2 U 2 U NA NAbis(2-Ethylhexyl)phthalate 3 2 U 2 U 1.9 J 2 U 1.1 J 2 U 2 U 2 U 2.1 U 2.1 U 1.2 J 2 U NA NADibenzofuran NC 0.46 J 5 U 5 U 5 U N/A 5 U 5 U 5 U N/A N/A 5 U 5 U NA NAFluorene 300 0.94 J 2 U 2 U 2 U 2 U 2 U 2 U 2 U 2.1 U 2.1 U 2 U 2 U NA NANaphthalene 300 2 U 2.5 2 U 5.1 2 U 2 U 2 U 2 U 2.1 U 2.1 U 2 U 2 U NA NATotal TICs (VOC+SVOC)Total TICs 500 60 J 2401.2 J 82.1 J 1850.2 157.9 J 0 17.5 J 13 J 0 0 4.2 J 0 0 0OtherLead 5 3 U 3 U 3 U 3 U 3 U 3 U 3 U 4.2 5.4 3 U 3 U 3 U NA NAPetroleum Hydrocarbons NC 0.51 U 1.0 0.51 U 1.5 0.51 U 0.51 U 0.51 U 0.51 U 0.52 U 0.52 U 0.51 U 0.52 U NA NA
Notes:
- All results reported in parts per million (ug/L)
- U = Not detected above the quantitation limit; the value presented is the sample quantitation limit
- J = estimated concentration
- NC = No Criteria established
- NA = sample not tested for this analyte
- NJDEP GWQS = New Jersey Groundwater Quality Standards N.J.A.C. 7: 9-6
- Bolded values indicate positive detections- Bolded and shaded values indicate that one or more Criteria have been exceeded
MW-7

APPENDIX B 2004 and 2006 Groundwater Elevation Contour Map


GROUND WATER CONTOURS - SEPTEMBER 2006 FIGURE 7N.J. Departmentof Environmental
ProtectionNJDEP CONTRACT No. A-47449
The Louis Berger Group, Inc.412 Mt Kemble Ave.Morristown, NJ
Param Site, Burlington County, New Jersey
FILE
_PAT
H&N
AM
E\10
JUN
05
!A !A
!A
!A
"
"
!A
!A
!A
!A
!A
!
!
CM/1
CM/2
CO
3.75
3.99
4.68
4.82
4.85
4.85
4.88
4.77
3.76
3.55
3.75
3.84
3.91
3.85
5.44
5.00
5.25
5.08
4.68
4.66
5.39
5.33
5.23
4.95 4.86
5.665.59
5.73
5.66
5.50
5.36
UP/55B
UP/2116
WV
RIM=4.89
HYD
DE
P C
UR
B
CANOPYOVERHEAD
DEP CURB
3.61
3.59
3.74
3.823.80
3.72
3.04
2.60
2.18
2.77
2.09
UP/1440
3.57
3.552.90
2.36
1.72
3.04
GV
UP
UP
UP
UP/133
UP/1925
UP/61946
UP/BM2316
UP/319
UP/2653
UP/557
UP/1441
WV
WV
WV
DEP CURB
DEP CURB
DEP CURB
1 STORY
BUILDING
1 STORY BLOCKCAR WASH
2 STORYBUILDING
4.48
3.94
3.69
3.43
3.13
4.95
4.36
4.55
4.794.50
4.44 4.41 4.35 4.38 4.394.32
4.28
4.254.40
4.57
co
4.584.54
4.454.39
4.18
4.43
4.43 4.233.97
3.93
4.16
4.204.29
4.37
4.19
4.36
4.464.34
4.76
4.364.06
4.964.44
4.34
4.44 4.48
4.61
4.33
3.96
4.23
4.19
4.59
4.88
4.80
4.624.41
4.22
4.93
1.94
1.76
1.47
1.57
2.40
0.35
6.12
5.10
4.46
2.20
5.74
2.74
4.01
1.71
1.13
0.68
1.51
1.07
GV
UP
UP/1699
UP/e6160 BC
UP/1442
UP/1438
UP/2113
3.83
6.22
36'' CMPINV -4.07
36'' CMPINV -3.84
FREEZER
3.71
0' 30'
-3
-2
-2
-2
-1
-1
-1
0
0
0
1
1
1
1
1
1
1
2
2
2
2
2
2
2
2
2
2
2
2
2
3
3
3
3
3
3
3
3
3
3
3
3 3
3
3
3
4
4
4
4
4
4
4
4
4
4
4
4
4
4
4
4
4
4
4
5
5
5
5
5
5
5
5
5
5
-4
5
5 5
5
DETENTIONPOND
CHAIN LINK FENCE
CHAIN LINK FENCE
0
3.49
4.30
4.38
4
4
4
4
4
4
44
4
4
4
3
#
#
(-0.62)
(-0.87)
(-0.50)(-0.38)
(-0.41)
(-0.12)
(-0.81)
(-1.07)
(-2.86)
-0.25
-0.75-1.25
-2.50
-0.50
-2.25
-2.0-1.50
-1.0-1.75-2.75SED/SW102
SED/SW101
MW-09
MW-08
MW-07MW-06
SG-1
SG-2
SB-03
SB-02
MW-02
MW-05
MW-01
SB-01/MW-03
MW-04/SB-04
³
0 50 10025 Feet
c
c
cc
c
Legend
! Soil Boring
!A Monitoring Well Locations
" Stream Gauge
Site Boundary
Groundwater Elevation Contour (ft)
(-0.25) Groundwater Elevation (ft)
Groundwater Flow Direction
Existing UST Locations
Former UST Locations
# Sediment/Surface Water Sample Locations
c

GROUND WATER CONTOURS - DECEMBER 2006 FIGURE 8N.J. Departmentof Environmental
ProtectionNJDEP CONTRACT No. A-47449
The Louis Berger Group, Inc.412 Mt Kemble Ave.Morristown, NJ
Param Site, Burlington County, New Jersey
FILE
_PA
TH&
NA
ME
\10J
UN
05
!A !A
!A
!A
"
"
!A
!A
!A
!A
!A
!
!
CM/1
CM/2
CO
3.75
3.99
4.68
4.82
4.85
4.85
4.88
4.77
3.76
3.55
3.75
3.84
3.91
3.85
5.44
5.00
5.25
5.08
4.68
4.66
5.39
5.33
5.23
4.95 4.86
5.665.59
5.73
5.66
5.50
5.36
UP/55B
UP/2116
WV
RIM=4.89
HYD
DE
P C
UR
B
CANOPYOVERHEAD
DEP CURB
3.61
3.59
3.74
3.823.80
3.72
3.04
2.60
2.18
2.77
2.09
UP/1440
3.57
3.552.90
2.36
1.72
3.04
GV
UP
UP
UP
UP/133
UP/1925
UP/61946
UP/BM2316
UP/319
UP/2653
UP/557
UP/1441
WV
WV
WV
DEP CURB
DEP CURB
DEP CURB
1 STORY
BUILDING
1 STORY BLOCKCAR WASH
2 STORYBUILDING
4.48
3.94
3.69
3.43
3.13
4.95
4.36
4.55
4.794.50
4.44 4.41 4.35 4.38 4.394.32
4.28
4.254.40
4.57
co
4.584.54
4.454.39
4.18
4.43
4.43 4.233.97
3.93
4.16
4.204.29
4.37
4.19
4.36
4.464.34
4.76
4.364.06
4.964.44
4.34
4.44 4.48
4.61
4.33
3.96
4.23
4.19
4.59
4.88
4.80
4.624.41
4.22
4.93
1.94
1.76
1.47
1.57
2.40
0.35
6.12
5.10
4.46
2.20
5.74
4.90
2.74
4.01
1.71
1.13
0.68
1.51
5.144.52
1.07
GV
UP
UP/1699
UP/e6160 BC
UP/1442
UP/1438
UP/2113
3.83
6.22
36'' CMPINV -4.07
36'' CMPINV -3.84
FREEZER
3.71
0' 30'
-3
-2
-2
-2
-1
-1
-1
0
0
0
1
1
1
1
1
1
1
2
2
2
2
2
2
2
2
2
2
2
2
2
3
3
3
3
3
3
3
3
3
3
3
3 3
3
3
3
4
4
4
4
4
4
4
4
4
4
4
4
4
4
4
4
4
4
4
4
4
5
5
5
5
5
5
5
5
5
5
5
-4
5
5 5
5
DETENTIONPOND
CHAIN LINK FENCE
CHAIN LINK FENCE
0
3.49
4.30
4.38
4
4
4
4
4
44
4
4
4
3
#
#
(-0.22)
(-0.46)
(-0.07)(-0.06)
(0.00)
(0.30)
(-0.53)
(-0.46)
(-8.69)
(-2.83)
0.0-0.50
-1.0
-1.25
-2.00.25
-1.75-2.25
-2.50
-0.25
-0.75
-1.50
SED/SW102
SED/SW101
MW-09
MW-08
MW-07
MW-06
SG-2
SG-1
SB-03
SB-02
MW-02
MW-05
MW-01
SB-01/MW-03
MW-04/SB-04
³
0 50 10025 Feet
cc
c
c
c
cc
Legend
! Soil Boring
!A Monitoring Well Locations
" Stream Gauge
Site Boundary
Groundwater Elevation Contour (ft)
(-0.25) Groundwater Elevation (ft)
Groundwater Flow Direction
Existing UST Locations
Former UST Locations
# Sediment/Surface Water Sample Locations
c

APPENDIX C Detailed Cost Breakdown of Groundwater Remedial
Alternatives

Monitored Natural Attenuation

Cost1 Cost with Markups2
Monitoring & Maintenance
Remedial Action Reevaluation (1/5 years)Classification Exception Area
$147,356 $334,818$147,000 $335,000
$332,260$350,000
1Refer to Phase Element Technology Cost Detail Report. 2Refer to Phase Element Cost Overtime Detail Report.3Net Present Value includes Cost Overtime with inflation and markups, where applicable.
Assumptions:- Groundwater samples would be collected from nine (9) monitoring wells (MW-1 through MW-9)
$147,356 $334,818
TotalTotal (Rounded)
Total Net Present Value 3
Total Net Present Value (Rounded)3
Groundwater Monitoring (semiannually 1st 8 years and quarterly for the following 2 years)
Activity
Groundwater Remediation Alternative - MNA
Table C1
Burlington, New JerseyEstimated Cost Breakdown
Param Petroleum

Technology Year 1 Year 2 Year 3 Year 4 Year 5 Year 6 Year 7 Year 8 Year 9 Year 10 Year 11Capital Costs 6,608.00$ -$ -$ -$ -$ -$ -$ -$ -$ -$ -$ O & M Cost $22,296 $22,296 $22,296 $22,296 $22,296 $54,565 $22,296 $22,296 $42,652 $42,652 $32,269Total Phase Element Cost $28,904 $22,296 $22,296 $22,296 $22,296 $54,565 $22,296 $22,296 $42,652 $42,652 $32,269Escalation Factor 1.1465 1.1717 1.1975 1.2238 1.2508 1.2783 1.3064 1.3352 1.3645 1.3945 1.4252Escalated Phase Element Cost $33,138 $26,125 $26,699 $27,287 $27,887 $69,750 $29,128 $29,769 $58,200 $59,480 $45,991n = No. of Years 1 2 3 4 5 6 7 8 9 10Net Present Value (NPV) Assuming i - 5% $33,138 $24,881 $24,217 $23,571 $22,943 $54,651 $21,736 $21,156 $39,392 $38,341 $28,234
Technology Year 12 Year 13 Year 14 Year 15 Year 16 Year 17 Year 18 Year 19 Year 20 Year 21Capital Costs -$ -$ -$ -$ -$ -$ -$ -$ -$ -$ O & M CostTotal Phase Element Cost $0 $0 $0 $0 $0 $0 $0 $0 $0 $0Escalation Factor 1.4566 1.4886 1.5214 1.5548 1.5890 1.6240 1.6597 1.6963 1.7336 1.7717Escalated Phase Element Cost $0 $0 $0 $0 $0 $0 $0 $0 $0 $0n = No. of Years 11 12 13 14 15 16 17 18 19 20Net Present Value (NPV)
Param Petroleum SiteBurlington, New Jersey
NET PRESENT VALUE CALCULATIONGroundwater
Remediation Alternative - MNA
Net Present Value (NPV) Assuming i - 5% $0 $0 $0 $0 $0 $0 $0 $0 $0 $0
Technology Year 22 Year 23 Year 24 Year 25 Year 26 Year 27 Year 28 Year 29 Year 30 TotalCapital Costs -$ -$ -$ -$ -$ -$ -$ -$ -$ $6,608O & M Cost $328,210Total Phase Element Cost $0 $0 $0 $0 $0 $0 $0 $0 $0 $334,818Escalation Factor 1.8107 1.8505 1.8912 1.9328 1.9754 2.0188 2.0632 2.1086 2.1550Escalated Phase Element Cost $0 $0 $0 $0 $0 $0 $0 $0 $0 $433,453n = No. of Years 21 22 23 24 25 26 27 28 29Net Present Value (NPV) Assuming i - 5% $0 $0 $0 $0 $0 $0 $0 $0 $0 $332,260

Phase Technology Cost Detail Report
(with Markups)
Folder:
RACER Version: 8.1.2 Database Location: G:\RTiyarattanachai\Racer\LBG RACER.mdb
System:
Param Feb 09_Final DraftFolder Name:
NEW JERSEY
Param Petroleum - GWParam PetroleumProject ID:
State / Country:
Location Modifiers
Project:
Project Name:
Material:
Labor:
Equipment:
1.0351.5581.054
Description GW RemediationContaminants - TBA and BenzeneAlternatives: MNA, EMNA (ORC-Adv), ISCO, SVE-AS
Project Category: None
Report Option: Calendar
Cost Database Date: 2006
Database: Modified System
NEW JERSEY STATE AVERAGECity:
Location
1.0351.5581.054
Default User
Options
Print Date: 3/6/2009 11:24:09 AM Page: 1 of 11

Phase Technology Cost Detail Report
(with Markups)
Groundwater - MNANone
Groundwater - MNASite Name:
Site Type:
Site ID:
Description:
Ronnachai Tiyarattanachai
The Louis Berger Group, Inc
Estimator Name:
Telephone Number:
Agency/Org./Office:
Business Address: Morristown, NJ
Estimator Information
[email protected] Address:
973-407-1409
EngineerEstimator Title:
02/12/2009Estimate Prepared Date:
Site:
Estimator Signature: Date:
Phase Names
Support Team: References:
Pre-Study:
Study:
Removal/Interim Action:
Remedial Action:
Operations & Maintenance:
Long Term Monitoring:
Site Closeout:
Design:
Documentation
Print Date: 3/6/2009 11:24:09 AM Page: 2 of 11

Phase Technology Cost Detail Report
(with Markups)
Reviewer Name:
Telephone Number:
Agency/Org./Office:
Business Address:
Reviewer Information
Email Address:
Reviewer Title:
Date Reviewed:
Reviewer Signature: Date:
Print Date: 3/6/2009 11:24:09 AM Page: 3 of 11

Phase Type:
Phase Name: MNARemedial Action
Description:
Phase:
Primary:
Secondary:
Approach:
Groundwater
None
Ex Situ
Secondary: Soil
Primary: Volatile Organic Compounds (VOCs)
Labor: System Labor RateAnalysis: System Analysis Rate
Start Date: January, 2010
Media/Waste Type
Contaminant
Rate Groups
Phase Markups: System Defaults
Technology Markups
Five-Year ReviewINSTITUTIONAL CONTROLMonitoringMonitoring
Markup % Prime % Sub.
YesYesYesYes
100100100100
0000
Phase Technology Cost Detail Report
(with Markups)
Print Date: 3/6/2009 11:24:09 AM Page: 4 of 11

Technology: Five-Year Review
Assembly Description QuantityUnit of
MeasureMaterial
Unit CostEquipment
Unit CostExtended
CostCost
OverrideLabor
Unit Cost
Element: Document Review
MarkupsApplied
33220102 Project Manager 8.00 HR 0.00 218.78 0.00 $1,750.22
33220105 Project Engineer 11.00 HR 0.00 212.15 0.00 $2,333.68
33220108 Project Scientist 8.00 HR 0.00 245.58 0.00 $1,964.60
33220109 Staff Scientist 16.00 HR 0.00 182.01 0.00 $2,912.15
Total Element Cost $8,960.64
Assembly Description QuantityUnit of
MeasureMaterial
Unit CostEquipment
Unit CostExtended
CostCost
OverrideLabor
Unit Cost
Element: Site Inspection
MarkupsApplied
33220102 Project Manager 9.00 HR 0.00 218.78 0.00 $1,968.99
33220105 Project Engineer 16.00 HR 0.00 212.15 0.00 $3,394.44
33220108 Project Scientist 12.00 HR 0.00 245.58 0.00 $2,946.90
33220109 Staff Scientist 13.00 HR 0.00 182.01 0.00 $2,366.12
Total Element Cost $10,676.46
Assembly Description QuantityUnit of
MeasureMaterial
Unit CostEquipment
Unit CostExtended
CostCost
OverrideLabor
Unit Cost
Element: Report
MarkupsApplied
33220102 Project Manager 6.00 HR 0.00 218.78 0.00 $1,312.66
33220105 Project Engineer 16.00 HR 0.00 212.15 0.00 $3,394.44
33220108 Project Scientist 13.00 HR 0.00 245.58 0.00 $3,192.48
33220109 Staff Scientist 26.00 HR 0.00 182.01 0.00 $4,732.24
Phase Technology Cost Detail Report
(with Markups)
Print Date: 3/6/2009 11:24:09 AM Page: 5 of 11

Total Element Cost $12,631.82
Total 1st Year Technology Cost $32,268.92
Phase Technology Cost Detail Report
(with Markups)
Print Date: 3/6/2009 11:24:09 AM Page: 6 of 11

Technology: INSTITUTIONAL CONTROL
Assembly Description QuantityUnit of
MeasureMaterial
Unit CostEquipment
Unit CostExtended
CostCost
OverrideLabor
Unit CostMarkupsApplied
95010203 Classification Exception Area 1.00 LS 6,721.58 0.00 0.00 $6,721.58
Total Element Cost $6,721.58
Total 1st Year Technology Cost $6,721.58
Phase Technology Cost Detail Report
(with Markups)
Print Date: 3/6/2009 11:24:09 AM Page: 7 of 11

Technology: Monitoring
Assembly Description QuantityUnit of
MeasureMaterial
Unit CostEquipment
Unit CostExtended
CostCost
OverrideLabor
Unit Cost
Element: Groundwater
MarkupsApplied
33020401 Disposable Materials perSample
20.00 EA 11.59 0.00 0.00 $231.80
33020402 Decontamination Materials perSample
20.00 EA 10.32 0.00 0.00 $206.48
33020561 Lysimeter accessories, nylontubing, 1/4" OD
295.00 LF 0.70 0.00 0.00 $205.23
33021509 Monitor well samplingequipment, rental, water qualitytesting parameter device rental
1.00 WK 324.52 0.00 0.00 $324.52
33021618 Testing, purgeable organics(624, 8260)
20.00 EA 232.26 0.00 0.00 $4,645.27
33230509 4" Submersible Pump Rental,Day
2.00 DAY 105.43 0.00 0.00 $210.87
33231186 Well Development EquipmentRental (weekly)
1.00 WK 601.00 122.59 0.00 $723.58
Total Element Cost $6,547.75
Assembly Description QuantityUnit of
MeasureMaterial
Unit CostEquipment
Unit CostExtended
CostCost
OverrideLabor
Unit Cost
Element: General Monitoring
MarkupsApplied
33010104 Sample collection, vehiclemileage charge, car or van
460.00 MI 0.17 0.00 0.00 $76.18
33010202 Sample collection, samplingpersonnel travel, per diem
4.00 DAY 99.00 0.00 0.00 $396.00
33220102 Project Manager 4.00 HR 0.00 218.78 0.00 $875.11
Phase Technology Cost Detail Report
(with Markups)
Print Date: 3/6/2009 11:24:09 AM Page: 8 of 11

Assembly Description QuantityUnit of
MeasureMaterial
Unit CostEquipment
Unit CostExtended
CostCost
OverrideLabor
Unit Cost
Element: General Monitoring
MarkupsApplied
33220105 Project Engineer 8.00 HR 0.00 212.15 0.00 $1,697.22
33220109 Staff Scientist 40.00 HR 0.00 182.01 0.00 $7,280.38
33220112 Field Technician 40.00 HR 0.00 135.60 0.00 $5,423.87
Total Element Cost $15,748.75
Total 1st Year Technology Cost $22,296.49
Phase Technology Cost Detail Report
(with Markups)
Print Date: 3/6/2009 11:24:09 AM Page: 9 of 11

Technology: Monitoring
Assembly Description QuantityUnit of
MeasureMaterial
Unit CostEquipment
Unit CostExtended
CostCost
OverrideLabor
Unit Cost
Element: Groundwater
MarkupsApplied
33020401 Disposable Materials perSample
40.00 EA 11.59 0.00 0.00 $463.60
33020402 Decontamination Materials perSample
40.00 EA 10.32 0.00 0.00 $412.96
33020561 Lysimeter accessories, nylontubing, 1/4" OD
565.00 LF 0.70 0.00 0.00 $393.07
33021509 Monitor well samplingequipment, rental, water qualitytesting parameter device rental
1.00 WK 324.52 0.00 0.00 $324.52
33021618 Testing, purgeable organics(624, 8260)
40.00 EA 232.26 0.00 0.00 $9,290.54
33230509 4" Submersible Pump Rental,Day
4.00 DAY 105.43 0.00 0.00 $421.73
33231186 Well Development EquipmentRental (weekly)
1.00 WK 601.00 122.59 0.00 $723.58
Total Element Cost $12,030.00
Assembly Description QuantityUnit of
MeasureMaterial
Unit CostEquipment
Unit CostExtended
CostCost
OverrideLabor
Unit Cost
Element: General Monitoring
MarkupsApplied
33010104 Sample collection, vehiclemileage charge, car or van
920.00 MI 0.17 0.00 0.00 $152.35
33010202 Sample collection, samplingpersonnel travel, per diem
8.00 DAY 99.00 0.00 0.00 $792.00
33220102 Project Manager 4.00 HR 0.00 218.78 0.00 $875.11
Phase Technology Cost Detail Report
(with Markups)
Print Date: 3/6/2009 11:24:09 AM Page: 10 of 11

Assembly Description QuantityUnit of
MeasureMaterial
Unit CostEquipment
Unit CostExtended
CostCost
OverrideLabor
Unit Cost
Element: General Monitoring
MarkupsApplied
33220105 Project Engineer 16.00 HR 0.00 212.15 0.00 $3,394.44
33220109 Staff Scientist 80.00 HR 0.00 182.01 0.00 $14,560.75
33220112 Field Technician 80.00 HR 0.00 135.60 0.00 $10,847.74
Total Element Cost $30,622.39
Total 1st Year Technology Cost $42,652.38
$103,939.37Total Phase Cost
Phase Technology Cost Detail Report
(with Markups)
Print Date: 3/6/2009 11:24:09 AM Page: 11 of 11

Phase Cost Over Time Report
(with Markups)
Folder:
RACER Version: 8.1.2 Database Location: G:\RTiyarattanachai\Racer\LBG RACER.mdb
System:
Param Feb 09_Final DraftFolder Name:
NEW JERSEY
Param Petroleum - GWParam PetroleumProject ID:
State / Country:
Location Modifiers
Project:
Project Name:
Material:
Labor:
Equipment:
1.0351.5581.054
Description GW RemediationContaminants - TBA and BenzeneAlternatives: MNA, EMNA (ORC-Adv), ISCO, SVE-AS
Project Category: None
Report Option: Calendar
Cost Database Date: 2006
Database: Modified System
NEW JERSEY STATE AVERAGECity:
Location
1.0351.5581.054
Default User
Options
Print Date: 3/6/2009 11:23:49 AM Page: 1 of 6

Phase Cost Over Time Report
(with Markups)
Groundwater - MNANone
Groundwater - MNASite Name:
Site Type:
Site ID:
Description:
Ronnachai Tiyarattanachai
The Louis Berger Group, Inc
Estimator Name:
Telephone Number:
Agency/Org./Office:
Business Address: Morristown, NJ
Estimator Information
[email protected] Address:
973-407-1409
EngineerEstimator Title:
02/12/2009Estimate Prepared Date:
Site:
Estimator Signature: Date:
Phase Names
Support Team: References:
Pre-Study:
Study:
Removal/Interim Action:
Remedial Action:
Operations & Maintenance:
Long Term Monitoring:
Site Closeout:
Design:
Documentation
Print Date: 3/6/2009 11:23:49 AM Page: 2 of 6

Phase Cost Over Time Report
(with Markups)
Reviewer Name:
Telephone Number:
Agency/Org./Office:
Business Address:
Reviewer Information
Email Address:
Reviewer Title:
Date Reviewed:
Reviewer Signature: Date:
Print Date: 3/6/2009 11:23:49 AM Page: 3 of 6

Phase Cost Over Time Report
(with Markups)
Phase Type:
Phase Name: MNARemedial Action
Description:
Phase:
Primary:
Secondary:
Approach:
Groundwater
None
Ex Situ
Secondary: Soil
Primary: Volatile Organic Compounds (VOCs)
Labor: System Labor RateAnalysis: System Analysis Rate
Start Date: January, 2010
Media/Waste Type
Contaminant
Rate Groups
Phase Markups: System Defaults
Technology Markups
Five-Year ReviewINSTITUTIONAL CONTROLMonitoringMonitoring
Markup % Prime % Sub.
YesYesYesYes
100100100100
0000
Print Date: 3/6/2009 11:23:49 AM Page: 4 of 6

Technology 2010 2011 2012 2013 2014 2015
Five-Year Review $0 $0 $0 $0 $0 $32,269
INSTITUTIONAL CONTROL $6,722 $0 $0 $0 $0 $0
Monitoring $22,296 $22,296 $22,296 $22,296 $22,296 $22,296
Monitoring $0 $0 $0 $0 $0 $0
Total Phase Cost $29,018 $22,296 $22,296 $22,296 $22,296 $54,565
Phase Cost Over Time Report
(with Markups)
Print Date: 3/6/2009 11:23:49 AM Page: 5 of 6

Technology 2016 2017 2018 2019 2020 Total
Five-Year Review $0 $0 $0 $0 $32,269 $64,538
INSTITUTIONAL CONTROL $0 $0 $0 $0 $0 $6,722
Monitoring $22,296 $22,296 $0 $0 $0 $178,372
Monitoring $0 $0 $42,652 $42,652 $0 $85,305
Total Phase Cost $22,296 $22,296 $42,652 $42,652 $32,269 $334,936
Phase Cost Over Time Report
(with Markups)
Print Date: 3/6/2009 11:23:49 AM Page: 6 of 6

Phase Cost Summary Report
(with Markups)
Folder:
RACER Version: 8.1.2 Database Location: G:\RTiyarattanachai\Racer\LBG RACER.mdb
System:
Param Feb 09_Final DraftFolder Name:
NEW JERSEY
Param Petroleum - GWParam PetroleumProject ID:
State / Country:
Location Modifiers
Project:
Project Name:
Material:
Labor:
Equipment:
1.0351.5581.054
Description GW RemediationContaminants - TBA and BenzeneAlternatives: MNA, EMNA (ORC-Adv), ISCO, SVE-AS
Project Category: None
Report Option: Calendar
Cost Database Date: 2006
Database: Modified System
NEW JERSEY STATE AVERAGECity:
Location
1.0351.5581.054
Default User
Options
3/6/2009 11:21:15 AM Page: 1Print Date: of 4

Phase Cost Summary Report
(with Markups)
Groundwater - MNANone
Groundwater - MNASite Name:
Site Type:
Site ID:
Description:
Ronnachai Tiyarattanachai
The Louis Berger Group, Inc
Estimator Name:
Telephone Number:
Agency/Org./Office:
Business Address: Morristown, NJ
Estimator Information
[email protected] Address:
Reviewer Name:
Telephone Number:
Agency/Org./Office:
Business Address:
Reviewer Information
Email Address:
973-407-1409
EngineerEstimator Title:
Reviewer Title:
02/12/2009Estimate Prepared Date:
Date Reviewed:
Site:
Estimator Signature:
Reviewer Signature:
Date:
Date:
Phase Names
Support Team: References:
Pre-Study:
Study:
Removal/Interim Action:
Remedial Action:
Operations & Maintenance:
Long Term Monitoring:
Site Closeout:
Design:
Documentation
3/6/2009 11:21:15 AM Page: 2Print Date: of 4

Phase Type:
Phase Name: MNARemedial Action
Description:
Phase:
Primary:
Secondary:
Approach:
Groundwater
None
Ex Situ
Secondary: Soil
Primary: Volatile Organic Compounds (VOCs)
Labor: System Labor RateAnalysis: System Analysis Rate
Start Date: January, 2010
Media/Waste Type
Contaminant
Rate Groups
Phase Markups: System Defaults
Technology Markups
Five-Year ReviewINSTITUTIONAL CONTROLMonitoringMonitoring
Markup % Prime % Sub.
YesYesYesYes
100100100100
0000
Phase Cost Summary Report
(with Markups)
3/6/2009 11:21:15 AM Page: 3Print Date: of 4

Technology Direct Cost Total CostMarkups
$20,981Five-Year Review $64,538$43,557
$5,000INSTITUTIONAL CONTROL $6,722$1,722
$82,328Monitoring $178,372$96,044
$39,046Monitoring $85,305$46,259
$147,356Total Capital Cost $334,936$187,580
Total Phase Cost $147,356 $334,936
Direct Cost Total Cost
$187,580
Markups
Phase Cost Summary Report
(with Markups)
3/6/2009 11:21:15 AM Page: 4Print Date: of 4

Enhanced Monitored Natural Attenuation

Cost1 Cost with Markups2
ORC-Advanced Injection $160,825 $228,621Monitoring & Maintenance
Remedial Action Reevaluation (1/5 years)Classification Exception Area
$301,841 $549,245$302,000 $549,000
$596,939$600,000
1Refer to Phase Element Technology Cost Detail Report. 2Refer to Phase Element Cost Overtime Detail Report.3Net Present Value includes Cost Overtime with inflation and markups, where applicable.
Assumptions:
$141,016 $320,624
Activity
Table C2
Burlington, New JerseyEstimated Cost Breakdown
Param Petroleum
Groundwater Remediation Alternative - EMNA
Groundwater Monitoring (quarterly for 1st 2 years, semi-annually for the following 3 years, and quarterly thereafter for the next 2 years)
- An approximate total of 9,000 lbs of ORC Advanced® would be injected (4,500 lbs for each injection event)
- Groundwater samples would be collected from nine (9) monitoring wells (MW-1 through MW-9)
Total Net Present Value (Rounded)3
TotalTotal (Rounded)
Total Net Present Value 3
- ORC Advanced® would be injected through 2 injection events (1 mandatory event and 1 optional event); target depth interval of 5 to 15 feet bgs; 20-ft grid injection pattern; 40 injection locations; 10 lbs/foot.

Technology Year 1 Year 2 Year 3 Year 4 Year 5 Year 6 Year 7 Year 8 Year 9 Year 10 Year 11Capital Costs 235,143$ -$ -$ -$ -$ -$ -$ -$ -$ -$ -$ O & M Cost $45,077 $45,077 $23,484 $23,484 $23,484 $76,748 $45,077 $31,671Total Phase Element Cost $280,220 $45,077 $23,484 $23,484 $23,484 $76,748 $45,077 $31,671 $0 $0 $0Escalation Factor 1.1465 1.1717 1.1975 1.2238 1.2508 1.2783 1.3064 1.3352 1.3645 1.3945 1.4252Escalated Phase Element Cost $321,272 $52,818 $28,122 $28,741 $29,373 $98,106 $58,889 $42,286 $0 $0 $0n = No. of Years 1 2 3 4 5 6 7 8 9 10Net Present Value (NPV) Assuming i - 5% $321,272 $50,303 $25,508 $24,827 $24,165 $76,869 $43,944 $30,052 $0 $0 $0
Technology Year 12 Year 13 Year 14 Year 15 Year 16 Year 17 Year 18 Year 19 Year 20 Year 21Capital Costs -$ -$ -$ -$ -$ -$ -$ -$ -$ -$ O & M CostTotal Phase Element Cost $0 $0 $0 $0 $0 $0 $0 $0 $0 $0Escalation Factor 1.4566 1.4886 1.5214 1.5548 1.5890 1.6240 1.6597 1.6963 1.7336 1.7717Escalated Phase Element Cost $0 $0 $0 $0 $0 $0 $0 $0 $0 $0n = No. of Years 11 12 13 14 15 16 17 18 19 20Net Present Value (NPV)
Param Petroleum SiteBurlington, New Jersey
NET PRESENT VALUE CALCULATIONGroundwater
Remediation Alternative - EMNA
Net Present Value (NPV) Assuming i - 5% $0 $0 $0 $0 $0 $0 $0 $0 $0 $0
Technology Year 22 Year 23 Year 24 Year 25 Year 26 Year 27 Year 28 Year 29 Year 30 TotalCapital Costs -$ -$ -$ -$ -$ -$ -$ -$ -$ $235,143O & M Cost $314,102Total Phase Element Cost $0 $0 $0 $0 $0 $0 $0 $0 $0 $549,245Escalation Factor 1.8107 1.8505 1.8912 1.9328 1.9754 2.0188 2.0632 2.1086 2.1550Escalated Phase Element Cost $0 $0 $0 $0 $0 $0 $0 $0 $0 $659,607n = No. of Years 21 22 23 24 25 26 27 28 29Net Present Value (NPV) Assuming i - 5% $0 $0 $0 $0 $0 $0 $0 $0 $0 $596,939

Phase Technology Cost Detail Report
(with Markups)
Folder:
RACER Version: 8.1.2 Database Location: G:\RTiyarattanachai\Racer\LBG RACER.mdb
System:
Param Feb 09_Final DraftFolder Name:
NEW JERSEY
Param Petroleum - GWParam PetroleumProject ID:
State / Country:
Location Modifiers
Project:
Project Name:
Material:
Labor:
Equipment:
1.0351.5581.054
Description GW RemediationContaminants - TBA and BenzeneAlternatives: MNA, EMNA (ORC-Adv), ISCO, SVE-AS
Project Category: None
Report Option: Calendar
Cost Database Date: 2006
Database: Modified System
NEW JERSEY STATE AVERAGECity:
Location
1.0351.5581.054
Default User
Options
Print Date: 3/6/2009 11:25:25 AM Page: 1 of 16

Phase Technology Cost Detail Report
(with Markups)
Groundwater - EMNA (ORC-Adv)None
Groundwater - EMNA (ORC-Adv)Site Name:
Site Type:
Site ID:
Description:
Ronnachai Tiyarattanachai
The Louis Berger Group, Inc
Estimator Name:
Telephone Number:
Agency/Org./Office:
Business Address: Morristown, NJ
Estimator Information
[email protected] Address:
973-407-1409
EngineerEstimator Title:
02/12/2009Estimate Prepared Date:
Site:
Estimator Signature: Date:
Phase Names
Support Team: References:
Pre-Study:
Study:
Removal/Interim Action:
Remedial Action:
Operations & Maintenance:
Long Term Monitoring:
Site Closeout:
Design:
Documentation
Print Date: 3/6/2009 11:25:25 AM Page: 2 of 16

Phase Technology Cost Detail Report
(with Markups)
Reviewer Name:
Telephone Number:
Agency/Org./Office:
Business Address:
Reviewer Information
Email Address:
Reviewer Title:
Date Reviewed:
Reviewer Signature: Date:
Print Date: 3/6/2009 11:25:25 AM Page: 3 of 16

Phase Type:
Phase Name: EMNA - ORC-AdvRemedial Action
Description:
Phase:
Primary:
Secondary:
Approach:
Groundwater
None
In Situ
Secondary: Soil
Primary: Volatile Organic Compounds (VOCs)
Labor: System Labor RateAnalysis: System Analysis Rate
Start Date: January, 2010
Media/Waste Type
Contaminant
Rate Groups
Phase Markups: System Defaults
Technology Markups
In Situ Biodegradation (Saturated Zone)Five-Year ReviewINSTITUTIONAL CONTROLMonitoringFive-Year ReviewMonitoringMonitoring
Markup % Prime % Sub.
YesYesYesYesYesYesYes
100100100100100100100
0000000
Phase Technology Cost Detail Report
(with Markups)
Print Date: 3/6/2009 11:25:25 AM Page: 4 of 16

Technology: In Situ Biodegradation (Saturated Zone)
Assembly Description QuantityUnit of
MeasureMaterial
Unit CostEquipment
Unit CostExtended
CostCost
OverrideLabor
Unit CostMarkupsApplied
32039005 Remedial Design - User DefinedCost
1.00 EA 0.00 16,177.35 0.00 $16,177.35
33020667 Direct Push Rig, Truck Mounted,Non Hydraulic, Includes Labor,Sampling, Decontamination
8.00 DAY 232.19 0.00 0.00 $1,857.53
33020668 Mobilize Direct Push Rig andCrew
8.00 DAY 773.97 0.00 0.00 $6,191.78
33020669 Demobilize Direct Push Rig andCrew
8.00 DAY 773.97 0.00 0.00 $6,191.78
33021509 Monitor well samplingequipment, rental, water qualitytesting parameter device rental
2.00 WK 314.90 0.00 0.00 $629.79
33021913 Testing, biomonitoring &bioassay, laboratory bench-scalestudies
3.00 EA 996.79 0.00 0.00 $2,990.37
33220105 Project Engineer 80.00 HR 0.00 208.22 0.00 $16,657.90
33220112 Field Technician 80.00 HR 0.00 133.09 0.00 $10,646.85
33231187 Load Supplies/Equipment 1.00 LS 195.95 928.35 488.87 $1,613.17
33240102 Bench Scale Test 1.00 LS 6,522.21 0.00 0.00 $6,522.21
33240103 Pilot Scale Test 1.00 LS 65,222.06 0.00 0.00 $65,222.06
95010803 ORC-Adv Material Cost 9,000.00 LBS 10.44 0.00 0.00 $93,919.50
Total Element Cost $228,620.30
Total 1st Year Technology Cost $228,620.30
Phase Technology Cost Detail Report
(with Markups)
Print Date: 3/6/2009 11:25:25 AM Page: 5 of 16

Technology: Five-Year Review
Assembly Description QuantityUnit of
MeasureMaterial
Unit CostEquipment
Unit CostExtended
CostCost
OverrideLabor
Unit Cost
Element: Document Review
MarkupsApplied
33220102 Project Manager 8.00 HR 0.00 214.73 0.00 $1,717.80
33220105 Project Engineer 11.00 HR 0.00 208.22 0.00 $2,290.46
33220108 Project Scientist 8.00 HR 0.00 241.03 0.00 $1,928.22
33220109 Staff Scientist 16.00 HR 0.00 178.64 0.00 $2,858.22
Total Element Cost $8,794.71
Assembly Description QuantityUnit of
MeasureMaterial
Unit CostEquipment
Unit CostExtended
CostCost
OverrideLabor
Unit Cost
Element: Site Inspection
MarkupsApplied
33220102 Project Manager 9.00 HR 0.00 214.73 0.00 $1,932.53
33220105 Project Engineer 16.00 HR 0.00 208.22 0.00 $3,331.58
33220108 Project Scientist 12.00 HR 0.00 241.03 0.00 $2,892.33
33220109 Staff Scientist 13.00 HR 0.00 178.64 0.00 $2,322.31
Total Element Cost $10,478.74
Assembly Description QuantityUnit of
MeasureMaterial
Unit CostEquipment
Unit CostExtended
CostCost
OverrideLabor
Unit Cost
Element: Report
MarkupsApplied
33220102 Project Manager 6.00 HR 0.00 214.73 0.00 $1,288.35
33220105 Project Engineer 16.00 HR 0.00 208.22 0.00 $3,331.58
33220108 Project Scientist 13.00 HR 0.00 241.03 0.00 $3,133.36
33220109 Staff Scientist 26.00 HR 0.00 178.64 0.00 $4,644.61
Phase Technology Cost Detail Report
(with Markups)
Print Date: 3/6/2009 11:25:25 AM Page: 6 of 16

Total Element Cost $12,397.90
Total 1st Year Technology Cost $31,671.35
Phase Technology Cost Detail Report
(with Markups)
Print Date: 3/6/2009 11:25:25 AM Page: 7 of 16

Technology: INSTITUTIONAL CONTROL
Assembly Description QuantityUnit of
MeasureMaterial
Unit CostEquipment
Unit CostExtended
CostCost
OverrideLabor
Unit CostMarkupsApplied
95010203 Classification Exception Area 1.00 LS 6,522.21 0.00 0.00 $6,522.21
Total Element Cost $6,522.21
Total 1st Year Technology Cost $6,522.21
Phase Technology Cost Detail Report
(with Markups)
Print Date: 3/6/2009 11:25:25 AM Page: 8 of 16
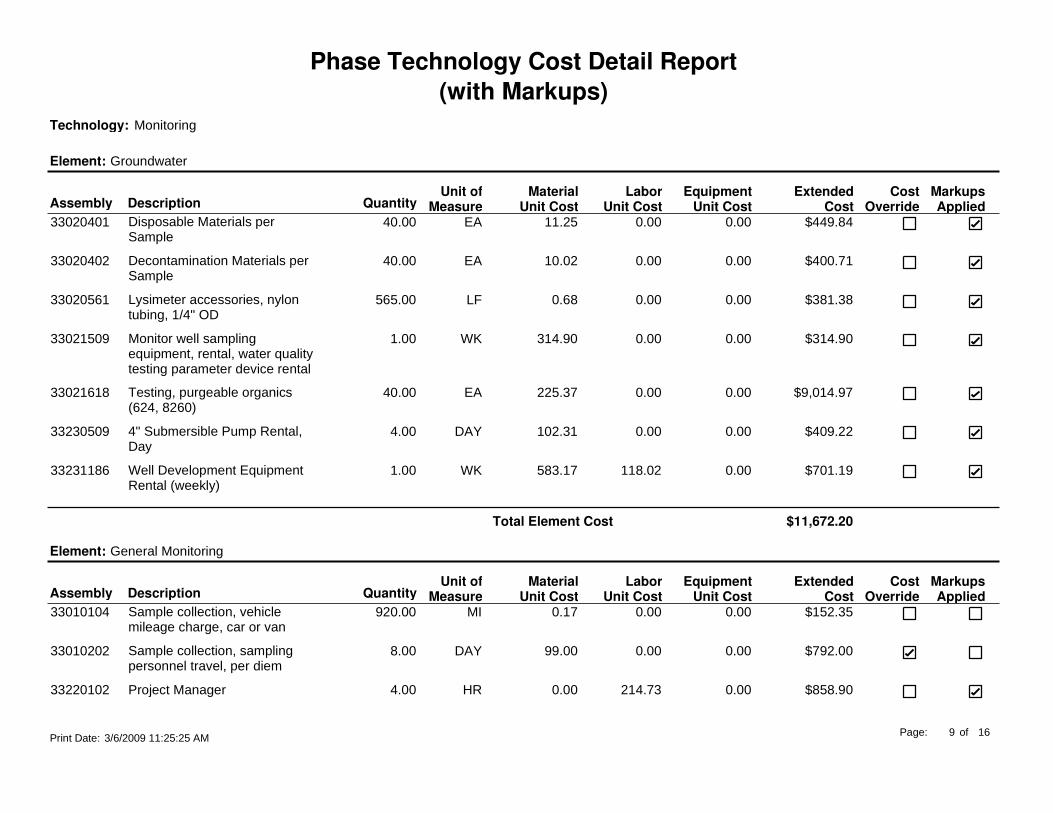
Technology: Monitoring
Assembly Description QuantityUnit of
MeasureMaterial
Unit CostEquipment
Unit CostExtended
CostCost
OverrideLabor
Unit Cost
Element: Groundwater
MarkupsApplied
33020401 Disposable Materials perSample
40.00 EA 11.25 0.00 0.00 $449.84
33020402 Decontamination Materials perSample
40.00 EA 10.02 0.00 0.00 $400.71
33020561 Lysimeter accessories, nylontubing, 1/4" OD
565.00 LF 0.68 0.00 0.00 $381.38
33021509 Monitor well samplingequipment, rental, water qualitytesting parameter device rental
1.00 WK 314.90 0.00 0.00 $314.90
33021618 Testing, purgeable organics(624, 8260)
40.00 EA 225.37 0.00 0.00 $9,014.97
33230509 4" Submersible Pump Rental,Day
4.00 DAY 102.31 0.00 0.00 $409.22
33231186 Well Development EquipmentRental (weekly)
1.00 WK 583.17 118.02 0.00 $701.19
Total Element Cost $11,672.20
Assembly Description QuantityUnit of
MeasureMaterial
Unit CostEquipment
Unit CostExtended
CostCost
OverrideLabor
Unit Cost
Element: General Monitoring
MarkupsApplied
33010104 Sample collection, vehiclemileage charge, car or van
920.00 MI 0.17 0.00 0.00 $152.35
33010202 Sample collection, samplingpersonnel travel, per diem
8.00 DAY 99.00 0.00 0.00 $792.00
33220102 Project Manager 4.00 HR 0.00 214.73 0.00 $858.90
Phase Technology Cost Detail Report
(with Markups)
Print Date: 3/6/2009 11:25:25 AM Page: 9 of 16

Assembly Description QuantityUnit of
MeasureMaterial
Unit CostEquipment
Unit CostExtended
CostCost
OverrideLabor
Unit Cost
Element: General Monitoring
MarkupsApplied
33220105 Project Engineer 32.00 HR 0.00 208.22 0.00 $6,663.16
33220109 Staff Scientist 80.00 HR 0.00 178.64 0.00 $14,291.11
33220112 Field Technician 80.00 HR 0.00 133.09 0.00 $10,646.85
Total Element Cost $33,404.37
Total 1st Year Technology Cost $45,076.57
Phase Technology Cost Detail Report
(with Markups)
Print Date: 3/6/2009 11:25:25 AM Page: 10 of 16

Technology: Five-Year Review
Assembly Description QuantityUnit of
MeasureMaterial
Unit CostEquipment
Unit CostExtended
CostCost
OverrideLabor
Unit Cost
Element: Document Review
MarkupsApplied
33220102 Project Manager 8.00 HR 0.00 214.73 0.00 $1,717.80
33220105 Project Engineer 11.00 HR 0.00 208.22 0.00 $2,290.46
33220108 Project Scientist 8.00 HR 0.00 241.03 0.00 $1,928.22
33220109 Staff Scientist 16.00 HR 0.00 178.64 0.00 $2,858.22
Total Element Cost $8,794.71
Assembly Description QuantityUnit of
MeasureMaterial
Unit CostEquipment
Unit CostExtended
CostCost
OverrideLabor
Unit Cost
Element: Site Inspection
MarkupsApplied
33220102 Project Manager 9.00 HR 0.00 214.73 0.00 $1,932.53
33220105 Project Engineer 16.00 HR 0.00 208.22 0.00 $3,331.58
33220108 Project Scientist 12.00 HR 0.00 241.03 0.00 $2,892.33
33220109 Staff Scientist 13.00 HR 0.00 178.64 0.00 $2,322.31
Total Element Cost $10,478.74
Assembly Description QuantityUnit of
MeasureMaterial
Unit CostEquipment
Unit CostExtended
CostCost
OverrideLabor
Unit Cost
Element: Report
MarkupsApplied
33220102 Project Manager 6.00 HR 0.00 214.73 0.00 $1,288.35
33220105 Project Engineer 16.00 HR 0.00 208.22 0.00 $3,331.58
33220108 Project Scientist 13.00 HR 0.00 241.03 0.00 $3,133.36
33220109 Staff Scientist 26.00 HR 0.00 178.64 0.00 $4,644.61
Phase Technology Cost Detail Report
(with Markups)
Print Date: 3/6/2009 11:25:25 AM Page: 11 of 16

Total Element Cost $12,397.90
Total 1st Year Technology Cost $31,671.35
Phase Technology Cost Detail Report
(with Markups)
Print Date: 3/6/2009 11:25:25 AM Page: 12 of 16

Technology: Monitoring
Assembly Description QuantityUnit of
MeasureMaterial
Unit CostEquipment
Unit CostExtended
CostCost
OverrideLabor
Unit Cost
Element: Groundwater
MarkupsApplied
33020401 Disposable Materials perSample
20.00 EA 11.25 0.00 0.00 $224.92
33020402 Decontamination Materials perSample
20.00 EA 10.02 0.00 0.00 $200.35
33020561 Lysimeter accessories, nylontubing, 1/4" OD
295.00 LF 0.68 0.00 0.00 $199.13
33021509 Monitor well samplingequipment, rental, water qualitytesting parameter device rental
1.00 WK 314.90 0.00 0.00 $314.90
33021618 Testing, purgeable organics(624, 8260)
20.00 EA 225.37 0.00 0.00 $4,507.49
33230509 4" Submersible Pump Rental,Day
2.00 DAY 102.31 0.00 0.00 $204.61
33231186 Well Development EquipmentRental (weekly)
1.00 WK 583.17 118.02 0.00 $701.19
Total Element Cost $6,352.58
Assembly Description QuantityUnit of
MeasureMaterial
Unit CostEquipment
Unit CostExtended
CostCost
OverrideLabor
Unit Cost
Element: General Monitoring
MarkupsApplied
33010104 Sample collection, vehiclemileage charge, car or van
460.00 MI 0.17 0.00 0.00 $76.18
33010202 Sample collection, samplingpersonnel travel, per diem
4.00 DAY 99.00 0.00 0.00 $396.00
33220102 Project Manager 4.00 HR 0.00 214.73 0.00 $858.90
Phase Technology Cost Detail Report
(with Markups)
Print Date: 3/6/2009 11:25:25 AM Page: 13 of 16

Assembly Description QuantityUnit of
MeasureMaterial
Unit CostEquipment
Unit CostExtended
CostCost
OverrideLabor
Unit Cost
Element: General Monitoring
MarkupsApplied
33220105 Project Engineer 16.00 HR 0.00 208.22 0.00 $3,331.58
33220109 Staff Scientist 40.00 HR 0.00 178.64 0.00 $7,145.56
33220112 Field Technician 40.00 HR 0.00 133.09 0.00 $5,323.42
Total Element Cost $17,131.64
Total 1st Year Technology Cost $23,484.22
Phase Technology Cost Detail Report
(with Markups)
Print Date: 3/6/2009 11:25:25 AM Page: 14 of 16

Technology: Monitoring
Assembly Description QuantityUnit of
MeasureMaterial
Unit CostEquipment
Unit CostExtended
CostCost
OverrideLabor
Unit Cost
Element: Groundwater
MarkupsApplied
33020401 Disposable Materials perSample
40.00 EA 11.25 0.00 0.00 $449.84
33020402 Decontamination Materials perSample
40.00 EA 10.02 0.00 0.00 $400.71
33020561 Lysimeter accessories, nylontubing, 1/4" OD
565.00 LF 0.68 0.00 0.00 $381.38
33021509 Monitor well samplingequipment, rental, water qualitytesting parameter device rental
1.00 WK 314.90 0.00 0.00 $314.90
33021618 Testing, purgeable organics(624, 8260)
40.00 EA 225.37 0.00 0.00 $9,014.97
33230509 4" Submersible Pump Rental,Day
4.00 DAY 102.31 0.00 0.00 $409.22
33231186 Well Development EquipmentRental (weekly)
1.00 WK 583.17 118.02 0.00 $701.19
Total Element Cost $11,672.20
Assembly Description QuantityUnit of
MeasureMaterial
Unit CostEquipment
Unit CostExtended
CostCost
OverrideLabor
Unit Cost
Element: General Monitoring
MarkupsApplied
33010104 Sample collection, vehiclemileage charge, car or van
920.00 MI 0.17 0.00 0.00 $152.35
33010202 Sample collection, samplingpersonnel travel, per diem
8.00 DAY 99.00 0.00 0.00 $792.00
33220102 Project Manager 4.00 HR 0.00 214.73 0.00 $858.90
Phase Technology Cost Detail Report
(with Markups)
Print Date: 3/6/2009 11:25:25 AM Page: 15 of 16

Assembly Description QuantityUnit of
MeasureMaterial
Unit CostEquipment
Unit CostExtended
CostCost
OverrideLabor
Unit Cost
Element: General Monitoring
MarkupsApplied
33220105 Project Engineer 32.00 HR 0.00 208.22 0.00 $6,663.16
33220109 Staff Scientist 80.00 HR 0.00 178.64 0.00 $14,291.11
33220112 Field Technician 80.00 HR 0.00 133.09 0.00 $10,646.85
Total Element Cost $33,404.37
Total 1st Year Technology Cost $45,076.57
$412,122.57Total Phase Cost
Phase Technology Cost Detail Report
(with Markups)
Print Date: 3/6/2009 11:25:25 AM Page: 16 of 16

Phase Cost Over Time Report
(with Markups)
Folder:
RACER Version: 8.1.2 Database Location: G:\RTiyarattanachai\Racer\LBG RACER.mdb
System:
Param Feb 09_Final DraftFolder Name:
NEW JERSEY
Param Petroleum - GWParam PetroleumProject ID:
State / Country:
Location Modifiers
Project:
Project Name:
Material:
Labor:
Equipment:
1.0351.5581.054
Description GW RemediationContaminants - TBA and BenzeneAlternatives: MNA, EMNA (ORC-Adv), ISCO, SVE-AS
Project Category: None
Report Option: Calendar
Cost Database Date: 2006
Database: Modified System
NEW JERSEY STATE AVERAGECity:
Location
1.0351.5581.054
Default User
Options
Print Date: 3/6/2009 11:25:04 AM Page: 1 of 6

Phase Cost Over Time Report
(with Markups)
Groundwater - EMNA (ORC-Adv)None
Groundwater - EMNA (ORC-Adv)Site Name:
Site Type:
Site ID:
Description:
Ronnachai Tiyarattanachai
The Louis Berger Group, Inc
Estimator Name:
Telephone Number:
Agency/Org./Office:
Business Address: Morristown, NJ
Estimator Information
[email protected] Address:
973-407-1409
EngineerEstimator Title:
02/12/2009Estimate Prepared Date:
Site:
Estimator Signature: Date:
Phase Names
Support Team: References:
Pre-Study:
Study:
Removal/Interim Action:
Remedial Action:
Operations & Maintenance:
Long Term Monitoring:
Site Closeout:
Design:
Documentation
Print Date: 3/6/2009 11:25:04 AM Page: 2 of 6

Phase Cost Over Time Report
(with Markups)
Reviewer Name:
Telephone Number:
Agency/Org./Office:
Business Address:
Reviewer Information
Email Address:
Reviewer Title:
Date Reviewed:
Reviewer Signature: Date:
Print Date: 3/6/2009 11:25:04 AM Page: 3 of 6

Phase Cost Over Time Report
(with Markups)
Phase Type:
Phase Name: EMNA - ORC-AdvRemedial Action
Description:
Phase:
Primary:
Secondary:
Approach:
Groundwater
None
In Situ
Secondary: Soil
Primary: Volatile Organic Compounds (VOCs)
Labor: System Labor RateAnalysis: System Analysis Rate
Start Date: January, 2010
Media/Waste Type
Contaminant
Rate Groups
Phase Markups: System Defaults
Technology Markups
In Situ Biodegradation (Saturated Zone)Five-Year ReviewINSTITUTIONAL CONTROLMonitoringFive-Year ReviewMonitoringMonitoring
Markup % Prime % Sub.
YesYesYesYesYesYesYes
100100100100100100100
0000000
Print Date: 3/6/2009 11:25:04 AM Page: 4 of 6

Technology 2010 2011 2012 2013 2014 2015
In Situ Biodegradation (SaturatedZone)
$228,621 $0 $0 $0 $0 $0
Five-Year Review $0 $0 $0 $0 $0 $31,671
INSTITUTIONAL CONTROL $6,522 $0 $0 $0 $0 $0
Monitoring $45,077 $45,077 $0 $0 $0 $0
Five-Year Review $0 $0 $0 $0 $0 $0
Monitoring $0 $0 $23,484 $23,484 $23,484 $0
Monitoring $0 $0 $0 $0 $0 $45,077
Total Phase Cost $280,219 $45,077 $23,484 $23,484 $23,484 $76,748
Phase Cost Over Time Report
(with Markups)
Print Date: 3/6/2009 11:25:04 AM Page: 5 of 6

Technology 2016 2017 Total
In Situ Biodegradation (SaturatedZone)
$0 $0 $228,621
Five-Year Review $0 $0 $31,671
INSTITUTIONAL CONTROL $0 $0 $6,522
Monitoring $0 $0 $90,153
Five-Year Review $0 $31,671 $31,671
Monitoring $0 $0 $70,453
Monitoring $45,077 $0 $90,153
Total Phase Cost $45,077 $31,671 $549,245
Phase Cost Over Time Report
(with Markups)
Print Date: 3/6/2009 11:25:04 AM Page: 6 of 6

Phase Cost Summary Report
(with Markups)
Folder:
RACER Version: 8.1.2 Database Location: G:\RTiyarattanachai\Racer\LBG RACER.mdb
System:
Param Feb 09_Final DraftFolder Name:
NEW JERSEY
Param Petroleum - GWParam PetroleumProject ID:
State / Country:
Location Modifiers
Project:
Project Name:
Material:
Labor:
Equipment:
1.0351.5581.054
Description GW RemediationContaminants - TBA and BenzeneAlternatives: MNA, EMNA (ORC-Adv), ISCO, SVE-AS
Project Category: None
Report Option: Calendar
Cost Database Date: 2006
Database: Modified System
NEW JERSEY STATE AVERAGECity:
Location
1.0351.5581.054
Default User
Options
3/6/2009 11:24:43 AM Page: 1Print Date: of 4

Phase Cost Summary Report
(with Markups)
Groundwater - EMNA (ORC-Adv)None
Groundwater - EMNA (ORC-Adv)Site Name:
Site Type:
Site ID:
Description:
Ronnachai Tiyarattanachai
The Louis Berger Group, Inc
Estimator Name:
Telephone Number:
Agency/Org./Office:
Business Address: Morristown, NJ
Estimator Information
[email protected] Address:
Reviewer Name:
Telephone Number:
Agency/Org./Office:
Business Address:
Reviewer Information
Email Address:
973-407-1409
EngineerEstimator Title:
Reviewer Title:
02/12/2009Estimate Prepared Date:
Date Reviewed:
Site:
Estimator Signature:
Reviewer Signature:
Date:
Date:
Phase Names
Support Team: References:
Pre-Study:
Study:
Removal/Interim Action:
Remedial Action:
Operations & Maintenance:
Long Term Monitoring:
Site Closeout:
Design:
Documentation
3/6/2009 11:24:43 AM Page: 2Print Date: of 4

Phase Type:
Phase Name: EMNA - ORC-AdvRemedial Action
Description:
Phase:
Primary:
Secondary:
Approach:
Groundwater
None
In Situ
Secondary: Soil
Primary: Volatile Organic Compounds (VOCs)
Labor: System Labor RateAnalysis: System Analysis Rate
Start Date: January, 2010
Media/Waste Type
Contaminant
Rate Groups
Phase Markups: System Defaults
Technology Markups
In Situ Biodegradation (Saturated Zone)Five-Year ReviewINSTITUTIONAL CONTROLMonitoringFive-Year ReviewMonitoringMonitoring
Markup % Prime % Sub.
YesYesYesYesYesYesYes
100100100100100100100
0000000
Phase Cost Summary Report
(with Markups)
3/6/2009 11:24:43 AM Page: 3Print Date: of 4

Technology Direct Cost Total CostMarkups
$160,825In Situ Biodegradation (Saturated Zone) $228,621$67,796
$10,491Five-Year Review $31,671$21,180
$5,000INSTITUTIONAL CONTROL $6,522$1,522
$41,254Monitoring $90,153$48,899
$10,491Five-Year Review $31,671$21,180
$32,528Monitoring $70,453$37,925
$41,254Monitoring $90,153$48,899
$301,841Total Capital Cost $549,245$247,404
Total Phase Cost $301,841 $549,245
Direct Cost Total Cost
$247,404
Markups
Phase Cost Summary Report
(with Markups)
3/6/2009 11:24:43 AM Page: 4Print Date: of 4

In-Situ Chemical Oxidation
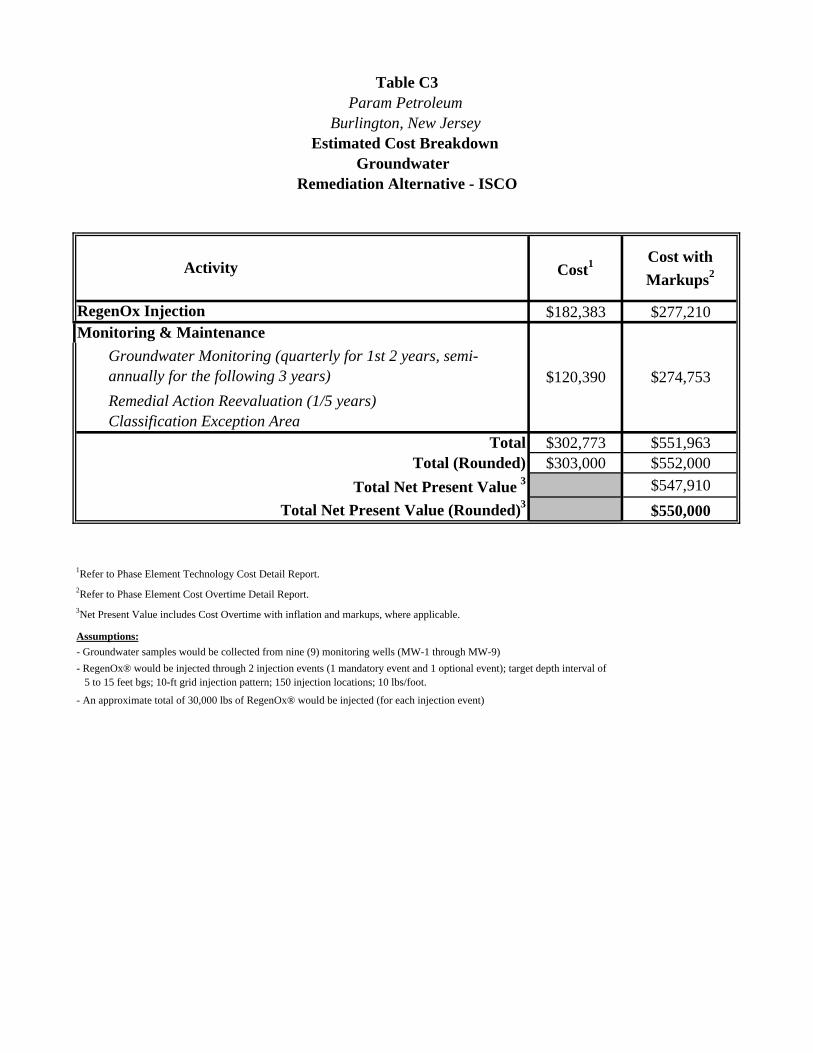
Cost1 Cost with Markups2
RegenOx Injection $182,383 $277,210Monitoring & Maintenance
Remedial Action Reevaluation (1/5 years)Classification Exception Area
$302,773 $551,963$303,000 $552,000
$547,910$550,000
1Refer to Phase Element Technology Cost Detail Report. 2Refer to Phase Element Cost Overtime Detail Report.3Net Present Value includes Cost Overtime with inflation and markups, where applicable.
Assumptions:
Activity
Table C3
Burlington, New JerseyEstimated Cost Breakdown
Param Petroleum
Groundwater Remediation Alternative - ISCO
- RegenOx® would be injected through 2 injection events (1 mandatory event and 1 optional event); target depth interval of 5 to 15 feet bgs; 10-ft grid injection pattern; 150 injection locations; 10 lbs/foot.
- An approximate total of 30,000 lbs of RegenOx® would be injected (for each injection event)
$120,390 $274,753
Total Net Present Value (Rounded)3
Groundwater Monitoring (quarterly for 1st 2 years, semi-annually for the following 3 years)
TotalTotal (Rounded)
Total Net Present Value 3
- Groundwater samples would be collected from nine (9) monitoring wells (MW-1 through MW-9)

Technology Year 1 Year 2 Year 3 Year 4 Year 5 Year 6 Year 7 Year 8 Year 9 Year 10 Year 11Capital Costs 232,286$ -$ -$ -$ -$ -$ -$ -$ -$ -$ -$ O & M Cost $44,924 $23,401 $23,401 $23,401 $44,924 $76,595 $31,671Total Phase Element Cost $277,210 $23,401 $23,401 $23,401 $44,924 $76,595 $31,671 $0 $0 $0 $0Escalation Factor 1.1465 1.1717 1.1975 1.2238 1.2508 1.2783 1.3064 1.3352 1.3645 1.3945 1.4252Escalated Phase Element Cost $317,821 $27,419 $28,023 $28,639 $56,190 $97,910 $41,375 $0 $0 $0 $0n = No. of Years 1 2 3 4 5 6 7 8 9 10Net Present Value (NPV) Assuming i - 5% $317,821 $26,114 $25,417 $24,740 $46,227 $76,715 $30,875 $0 $0 $0 $0
Technology Year 12 Year 13 Year 14 Year 15 Year 16 Year 17 Year 18 Year 19 Year 20 Year 21Capital Costs -$ -$ -$ -$ -$ -$ -$ -$ -$ -$ O & M CostTotal Phase Element Cost $0 $0 $0 $0 $0 $0 $0 $0 $0 $0Escalation Factor 1.4566 1.4886 1.5214 1.5548 1.5890 1.6240 1.6597 1.6963 1.7336 1.7717Escalated Phase Element Cost $0 $0 $0 $0 $0 $0 $0 $0 $0 $0n = No. of Years 11 12 13 14 15 16 17 18 19 20Net Present Value (NPV)
Param Petroleum SiteBurlington, New Jersey
NET PRESENT VALUE CALCULATIONGroundwater
Remediation Alternative - ISCO
Net Present Value (NPV) Assuming i - 5% $0 $0 $0 $0 $0 $0 $0 $0 $0 $0
Technology Year 22 Year 23 Year 24 Year 25 Year 26 Year 27 Year 28 Year 29 Year 30 TotalCapital Costs -$ -$ -$ -$ -$ -$ -$ -$ -$ $232,286O & M Cost $268,317Total Phase Element Cost $0 $0 $0 $0 $0 $0 $0 $0 $0 $500,603Escalation Factor 1.8107 1.8505 1.8912 1.9328 1.9754 2.0188 2.0632 2.1086 2.1550Escalated Phase Element Cost $0 $0 $0 $0 $0 $0 $0 $0 $0 $597,378n = No. of Years 21 22 23 24 25 26 27 28 29Net Present Value (NPV) Assuming i - 5% $0 $0 $0 $0 $0 $0 $0 $0 $0 $547,910
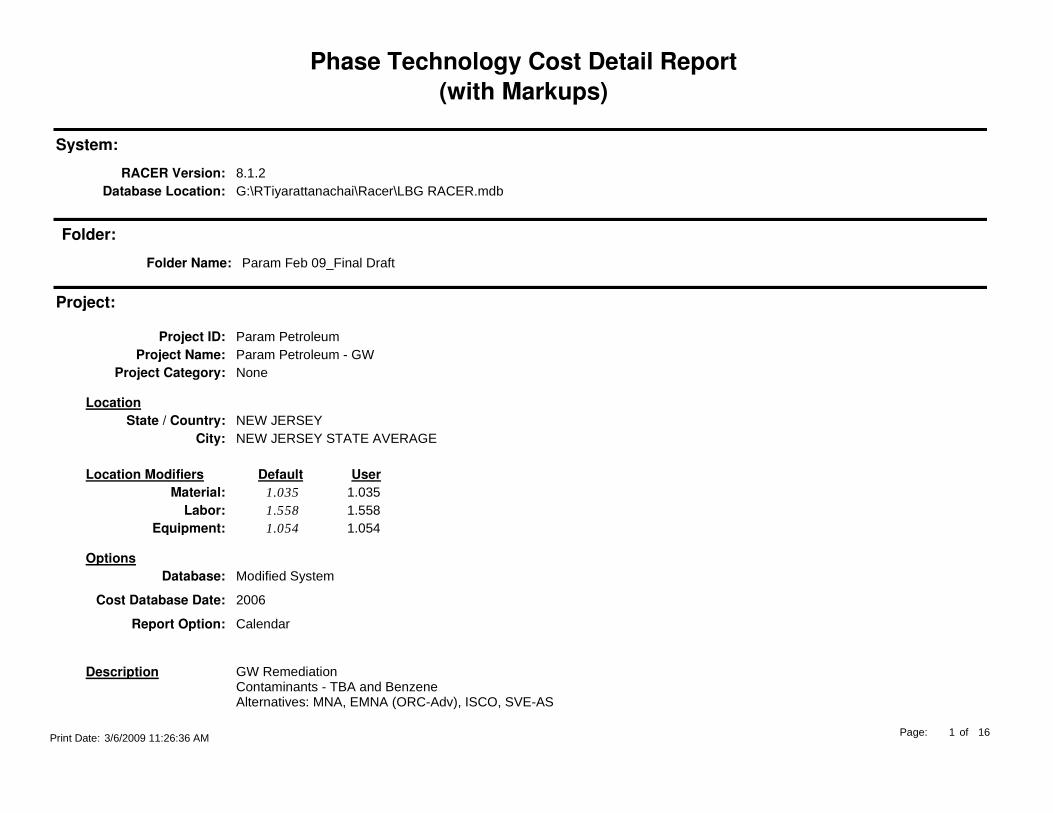
Phase Technology Cost Detail Report
(with Markups)
Folder:
RACER Version: 8.1.2 Database Location: G:\RTiyarattanachai\Racer\LBG RACER.mdb
System:
Param Feb 09_Final DraftFolder Name:
NEW JERSEY
Param Petroleum - GWParam PetroleumProject ID:
State / Country:
Location Modifiers
Project:
Project Name:
Material:
Labor:
Equipment:
1.0351.5581.054
Description GW RemediationContaminants - TBA and BenzeneAlternatives: MNA, EMNA (ORC-Adv), ISCO, SVE-AS
Project Category: None
Report Option: Calendar
Cost Database Date: 2006
Database: Modified System
NEW JERSEY STATE AVERAGECity:
Location
1.0351.5581.054
Default User
Options
Print Date: 3/6/2009 11:26:36 AM Page: 1 of 16

Phase Technology Cost Detail Report
(with Markups)
Groundwater - CHEM OX (REGENOX)None
Groundwater - CHEM OX (REGENOX)Site Name:
Site Type:
Site ID:
Description:
Ronnachai Tiyarattanachai
The Louis Berger Group, Inc
Estimator Name:
Telephone Number:
Agency/Org./Office:
Business Address: Morristown, NJ
Estimator Information
[email protected] Address:
973-407-1409
EngineerEstimator Title:
10/04/2007Estimate Prepared Date:
Site:
Estimator Signature: Date:
Phase Names
Support Team: References:
Pre-Study:
Study:
Removal/Interim Action:
Remedial Action:
Operations & Maintenance:
Long Term Monitoring:
Site Closeout:
Design:
Documentation
Print Date: 3/6/2009 11:26:36 AM Page: 2 of 16

Phase Technology Cost Detail Report
(with Markups)
Reviewer Name:
Telephone Number:
Agency/Org./Office:
Business Address:
Reviewer Information
Email Address:
Reviewer Title:
Date Reviewed:
Reviewer Signature: Date:
Print Date: 3/6/2009 11:26:36 AM Page: 3 of 16

Phase Type:
Phase Name: REGENOXRemedial Action
Description:
Phase:
Primary:
Secondary:
Approach:
Groundwater
None
In Situ
Secondary: Soil
Primary: Volatile Organic Compounds (VOCs)
Labor: System Labor RateAnalysis: System Analysis Rate
Start Date: January, 2010
Media/Waste Type
Contaminant
Rate Groups
Phase Markups: System Defaults
Technology Markups
Five-Year ReviewINSTITUTIONAL CONTROLMonitoringINSITU CHEMICAL OXIDATIONFive-Year ReviewMonitoringMonitoring
Markup % Prime % Sub.
YesYesYesYesYesYesYes
100100100100100100100
0000000
Phase Technology Cost Detail Report
(with Markups)
Print Date: 3/6/2009 11:26:36 AM Page: 4 of 16

Technology: Five-Year Review
Assembly Description QuantityUnit of
MeasureMaterial
Unit CostEquipment
Unit CostExtended
CostCost
OverrideLabor
Unit Cost
Element: Document Review
MarkupsApplied
33220102 Project Manager 8.00 HR 0.00 214.73 0.00 $1,717.80
33220105 Project Engineer 11.00 HR 0.00 208.22 0.00 $2,290.46
33220108 Project Scientist 8.00 HR 0.00 241.03 0.00 $1,928.22
33220109 Staff Scientist 16.00 HR 0.00 178.64 0.00 $2,858.22
Total Element Cost $8,794.71
Assembly Description QuantityUnit of
MeasureMaterial
Unit CostEquipment
Unit CostExtended
CostCost
OverrideLabor
Unit Cost
Element: Site Inspection
MarkupsApplied
33220102 Project Manager 9.00 HR 0.00 214.73 0.00 $1,932.53
33220105 Project Engineer 16.00 HR 0.00 208.22 0.00 $3,331.58
33220108 Project Scientist 12.00 HR 0.00 241.03 0.00 $2,892.33
33220109 Staff Scientist 13.00 HR 0.00 178.64 0.00 $2,322.31
Total Element Cost $10,478.74
Assembly Description QuantityUnit of
MeasureMaterial
Unit CostEquipment
Unit CostExtended
CostCost
OverrideLabor
Unit Cost
Element: Report
MarkupsApplied
33220102 Project Manager 6.00 HR 0.00 214.73 0.00 $1,288.35
33220105 Project Engineer 16.00 HR 0.00 208.22 0.00 $3,331.58
33220108 Project Scientist 13.00 HR 0.00 241.03 0.00 $3,133.36
33220109 Staff Scientist 26.00 HR 0.00 178.64 0.00 $4,644.61
Phase Technology Cost Detail Report
(with Markups)
Print Date: 3/6/2009 11:26:36 AM Page: 5 of 16

Total Element Cost $12,397.90
Total 1st Year Technology Cost $31,671.35
Phase Technology Cost Detail Report
(with Markups)
Print Date: 3/6/2009 11:26:36 AM Page: 6 of 16

Technology: INSTITUTIONAL CONTROL
Assembly Description QuantityUnit of
MeasureMaterial
Unit CostEquipment
Unit CostExtended
CostCost
OverrideLabor
Unit CostMarkupsApplied
95010203 Classification Exception Area 1.00 LS 6,436.76 0.00 0.00 $6,436.76
Total Element Cost $6,436.76
Total 1st Year Technology Cost $6,436.76
Phase Technology Cost Detail Report
(with Markups)
Print Date: 3/6/2009 11:26:36 AM Page: 7 of 16

Technology: Monitoring
Assembly Description QuantityUnit of
MeasureMaterial
Unit CostEquipment
Unit CostExtended
CostCost
OverrideLabor
Unit Cost
Element: Groundwater
MarkupsApplied
33020401 Disposable Materials perSample
40.00 EA 11.10 0.00 0.00 $443.95
33020402 Decontamination Materials perSample
40.00 EA 9.89 0.00 0.00 $395.46
33020561 Lysimeter accessories, nylontubing, 1/4" OD
565.00 LF 0.67 0.00 0.00 $376.40
33021509 Monitor well samplingequipment, rental, water qualitytesting parameter device rental
1.00 WK 310.77 0.00 0.00 $310.77
33021618 Testing, purgeable organics(624, 8260)
40.00 EA 222.42 0.00 0.00 $8,896.87
33230509 4" Submersible Pump Rental,Day
4.00 DAY 100.97 0.00 0.00 $403.86
33231186 Well Development EquipmentRental (weekly)
1.00 WK 575.53 116.35 0.00 $691.88
Total Element Cost $11,519.20
Assembly Description QuantityUnit of
MeasureMaterial
Unit CostEquipment
Unit CostExtended
CostCost
OverrideLabor
Unit Cost
Element: General Monitoring
MarkupsApplied
33010104 Sample collection, vehiclemileage charge, car or van
920.00 MI 0.17 0.00 0.00 $152.35
33010202 Sample collection, samplingpersonnel travel, per diem
8.00 DAY 99.00 0.00 0.00 $792.00
33220102 Project Manager 4.00 HR 0.00 214.73 0.00 $858.90
Phase Technology Cost Detail Report
(with Markups)
Print Date: 3/6/2009 11:26:36 AM Page: 8 of 16

Assembly Description QuantityUnit of
MeasureMaterial
Unit CostEquipment
Unit CostExtended
CostCost
OverrideLabor
Unit Cost
Element: General Monitoring
MarkupsApplied
33220105 Project Engineer 32.00 HR 0.00 208.22 0.00 $6,663.16
33220109 Staff Scientist 80.00 HR 0.00 178.64 0.00 $14,291.11
33220112 Field Technician 80.00 HR 0.00 133.09 0.00 $10,646.85
Total Element Cost $33,404.37
Total 1st Year Technology Cost $44,923.57
Phase Technology Cost Detail Report
(with Markups)
Print Date: 3/6/2009 11:26:36 AM Page: 9 of 16

Technology: INSITU CHEMICAL OXIDATION
Assembly Description QuantityUnit of
MeasureMaterial
Unit CostEquipment
Unit CostExtended
CostCost
OverrideLabor
Unit CostMarkupsApplied
32039005 Remedial Design - User DefinedCost
1.00 EA 0.00 15,949.50 0.00 $15,949.50
33020667 Direct Push Rig, Truck Mounted,Non Hydraulic, Includes Labor,Sampling, Decontamination
20.00 DAY 229.15 0.00 0.00 $4,582.97
33020668 Mobilize Direct Push Rig andCrew
20.00 DAY 763.83 0.00 0.00 $15,276.67
33021509 Monitor well samplingequipment, rental, water qualitytesting parameter device rental
4.00 WK 310.77 0.00 0.00 $1,243.09
33021913 Testing, biomonitoring &bioassay, laboratory bench-scalestudies
3.00 EA 983.73 0.00 0.00 $2,951.19
33220105 Project Engineer 200.00 HR 0.00 208.22 0.00 $41,644.68
33220112 Field Technician 200.00 HR 0.00 133.09 0.00 $26,617.06
33231187 Load Supplies/Equipment 1.00 LS 193.39 915.27 480.59 $1,589.24
33240102 Bench Scale Test 1.00 LS 6,436.76 0.00 0.00 $6,436.76
33240103 Pilot Scale Test 1.00 LS 64,367.62 0.00 0.00 $64,367.62
95012602 RegenOx 30,000.00 LB 3.22 0.00 0.00 $96,552.00
Total Element Cost $277,210.80
Total 1st Year Technology Cost $277,210.80
Phase Technology Cost Detail Report
(with Markups)
Print Date: 3/6/2009 11:26:36 AM Page: 10 of 16

Technology: Five-Year Review
Assembly Description QuantityUnit of
MeasureMaterial
Unit CostEquipment
Unit CostExtended
CostCost
OverrideLabor
Unit Cost
Element: Document Review
MarkupsApplied
33220102 Project Manager 8.00 HR 0.00 214.73 0.00 $1,717.80
33220105 Project Engineer 11.00 HR 0.00 208.22 0.00 $2,290.46
33220108 Project Scientist 8.00 HR 0.00 241.03 0.00 $1,928.22
33220109 Staff Scientist 16.00 HR 0.00 178.64 0.00 $2,858.22
Total Element Cost $8,794.71
Assembly Description QuantityUnit of
MeasureMaterial
Unit CostEquipment
Unit CostExtended
CostCost
OverrideLabor
Unit Cost
Element: Site Inspection
MarkupsApplied
33220102 Project Manager 9.00 HR 0.00 214.73 0.00 $1,932.53
33220105 Project Engineer 16.00 HR 0.00 208.22 0.00 $3,331.58
33220108 Project Scientist 12.00 HR 0.00 241.03 0.00 $2,892.33
33220109 Staff Scientist 13.00 HR 0.00 178.64 0.00 $2,322.31
Total Element Cost $10,478.74
Assembly Description QuantityUnit of
MeasureMaterial
Unit CostEquipment
Unit CostExtended
CostCost
OverrideLabor
Unit Cost
Element: Report
MarkupsApplied
33220102 Project Manager 6.00 HR 0.00 214.73 0.00 $1,288.35
33220105 Project Engineer 16.00 HR 0.00 208.22 0.00 $3,331.58
33220108 Project Scientist 13.00 HR 0.00 241.03 0.00 $3,133.36
33220109 Staff Scientist 26.00 HR 0.00 178.64 0.00 $4,644.61
Phase Technology Cost Detail Report
(with Markups)
Print Date: 3/6/2009 11:26:36 AM Page: 11 of 16

Total Element Cost $12,397.90
Total 1st Year Technology Cost $31,671.35
Phase Technology Cost Detail Report
(with Markups)
Print Date: 3/6/2009 11:26:36 AM Page: 12 of 16

Technology: Monitoring
Assembly Description QuantityUnit of
MeasureMaterial
Unit CostEquipment
Unit CostExtended
CostCost
OverrideLabor
Unit Cost
Element: Groundwater
MarkupsApplied
33020401 Disposable Materials perSample
20.00 EA 11.10 0.00 0.00 $221.98
33020402 Decontamination Materials perSample
20.00 EA 9.89 0.00 0.00 $197.73
33020561 Lysimeter accessories, nylontubing, 1/4" OD
295.00 LF 0.67 0.00 0.00 $196.53
33021509 Monitor well samplingequipment, rental, water qualitytesting parameter device rental
1.00 WK 310.77 0.00 0.00 $310.77
33021618 Testing, purgeable organics(624, 8260)
20.00 EA 222.42 0.00 0.00 $4,448.44
33230509 4" Submersible Pump Rental,Day
2.00 DAY 100.97 0.00 0.00 $201.93
33231186 Well Development EquipmentRental (weekly)
1.00 WK 575.53 116.35 0.00 $691.88
Total Element Cost $6,269.26
Assembly Description QuantityUnit of
MeasureMaterial
Unit CostEquipment
Unit CostExtended
CostCost
OverrideLabor
Unit Cost
Element: General Monitoring
MarkupsApplied
33010104 Sample collection, vehiclemileage charge, car or van
460.00 MI 0.17 0.00 0.00 $76.18
33010202 Sample collection, samplingpersonnel travel, per diem
4.00 DAY 99.00 0.00 0.00 $396.00
33220102 Project Manager 4.00 HR 0.00 214.73 0.00 $858.90
Phase Technology Cost Detail Report
(with Markups)
Print Date: 3/6/2009 11:26:36 AM Page: 13 of 16
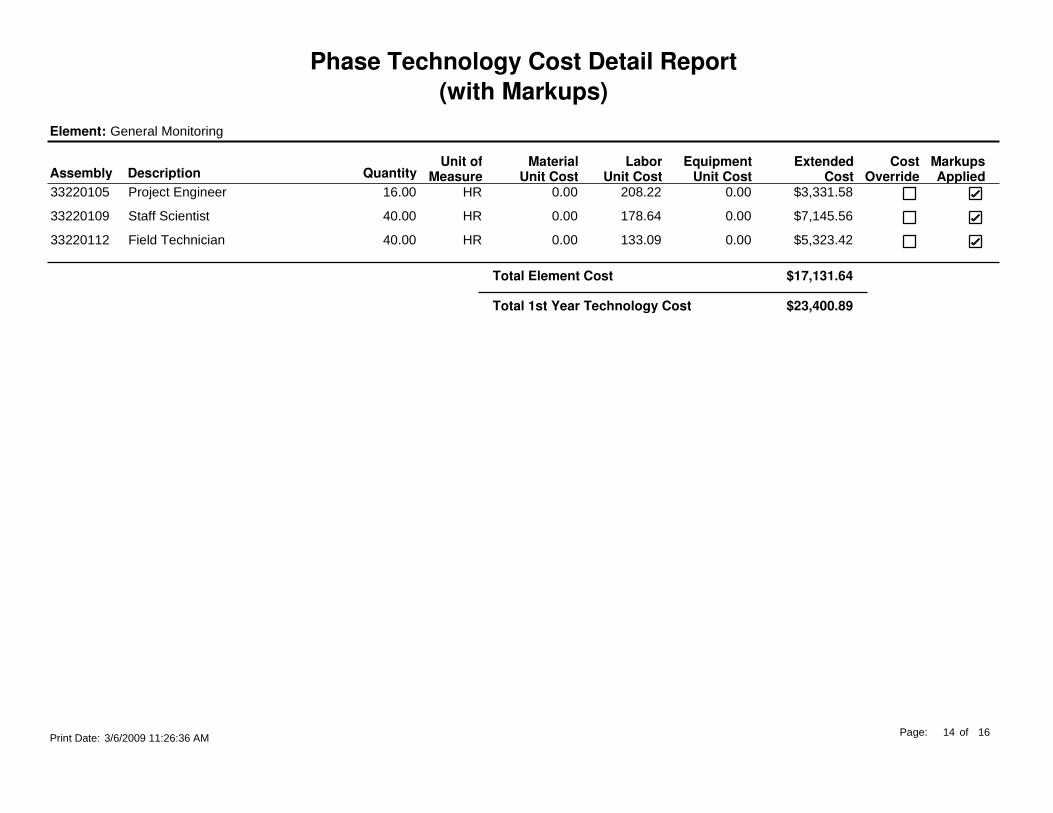
Assembly Description QuantityUnit of
MeasureMaterial
Unit CostEquipment
Unit CostExtended
CostCost
OverrideLabor
Unit Cost
Element: General Monitoring
MarkupsApplied
33220105 Project Engineer 16.00 HR 0.00 208.22 0.00 $3,331.58
33220109 Staff Scientist 40.00 HR 0.00 178.64 0.00 $7,145.56
33220112 Field Technician 40.00 HR 0.00 133.09 0.00 $5,323.42
Total Element Cost $17,131.64
Total 1st Year Technology Cost $23,400.89
Phase Technology Cost Detail Report
(with Markups)
Print Date: 3/6/2009 11:26:36 AM Page: 14 of 16

Technology: Monitoring
Assembly Description QuantityUnit of
MeasureMaterial
Unit CostEquipment
Unit CostExtended
CostCost
OverrideLabor
Unit Cost
Element: Groundwater
MarkupsApplied
33020401 Disposable Materials perSample
40.00 EA 11.10 0.00 0.00 $443.95
33020402 Decontamination Materials perSample
40.00 EA 9.89 0.00 0.00 $395.46
33020561 Lysimeter accessories, nylontubing, 1/4" OD
565.00 LF 0.67 0.00 0.00 $376.40
33021509 Monitor well samplingequipment, rental, water qualitytesting parameter device rental
1.00 WK 310.77 0.00 0.00 $310.77
33021618 Testing, purgeable organics(624, 8260)
40.00 EA 222.42 0.00 0.00 $8,896.87
33230509 4" Submersible Pump Rental,Day
4.00 DAY 100.97 0.00 0.00 $403.86
33231186 Well Development EquipmentRental (weekly)
1.00 WK 575.53 116.35 0.00 $691.88
Total Element Cost $11,519.20
Assembly Description QuantityUnit of
MeasureMaterial
Unit CostEquipment
Unit CostExtended
CostCost
OverrideLabor
Unit Cost
Element: General Monitoring
MarkupsApplied
33010104 Sample collection, vehiclemileage charge, car or van
920.00 MI 0.17 0.00 0.00 $152.35
33010202 Sample collection, samplingpersonnel travel, per diem
8.00 DAY 99.00 0.00 0.00 $792.00
33220102 Project Manager 4.00 HR 0.00 214.73 0.00 $858.90
Phase Technology Cost Detail Report
(with Markups)
Print Date: 3/6/2009 11:26:36 AM Page: 15 of 16

Assembly Description QuantityUnit of
MeasureMaterial
Unit CostEquipment
Unit CostExtended
CostCost
OverrideLabor
Unit Cost
Element: General Monitoring
MarkupsApplied
33220105 Project Engineer 32.00 HR 0.00 208.22 0.00 $6,663.16
33220109 Staff Scientist 80.00 HR 0.00 178.64 0.00 $14,291.11
33220112 Field Technician 80.00 HR 0.00 133.09 0.00 $10,646.85
Total Element Cost $33,404.37
Total 1st Year Technology Cost $44,923.57
$460,238.29Total Phase Cost
Phase Technology Cost Detail Report
(with Markups)
Print Date: 3/6/2009 11:26:36 AM Page: 16 of 16

Phase Cost Over Time Report
(with Markups)
Folder:
RACER Version: 8.1.2 Database Location: G:\RTiyarattanachai\Racer\LBG RACER.mdb
System:
Param Feb 09_Final DraftFolder Name:
NEW JERSEY
Param Petroleum - GWParam PetroleumProject ID:
State / Country:
Location Modifiers
Project:
Project Name:
Material:
Labor:
Equipment:
1.0351.5581.054
Description GW RemediationContaminants - TBA and BenzeneAlternatives: MNA, EMNA (ORC-Adv), ISCO, SVE-AS
Project Category: None
Report Option: Calendar
Cost Database Date: 2006
Database: Modified System
NEW JERSEY STATE AVERAGECity:
Location
1.0351.5581.054
Default User
Options
Print Date: 3/6/2009 11:26:18 AM Page: 1 of 6

Phase Cost Over Time Report
(with Markups)
Groundwater - CHEM OX (REGENOX)None
Groundwater - CHEM OX (REGENOX)Site Name:
Site Type:
Site ID:
Description:
Ronnachai Tiyarattanachai
The Louis Berger Group, Inc
Estimator Name:
Telephone Number:
Agency/Org./Office:
Business Address: Morristown, NJ
Estimator Information
[email protected] Address:
973-407-1409
EngineerEstimator Title:
10/04/2007Estimate Prepared Date:
Site:
Estimator Signature: Date:
Phase Names
Support Team: References:
Pre-Study:
Study:
Removal/Interim Action:
Remedial Action:
Operations & Maintenance:
Long Term Monitoring:
Site Closeout:
Design:
Documentation
Print Date: 3/6/2009 11:26:18 AM Page: 2 of 6

Phase Cost Over Time Report
(with Markups)
Reviewer Name:
Telephone Number:
Agency/Org./Office:
Business Address:
Reviewer Information
Email Address:
Reviewer Title:
Date Reviewed:
Reviewer Signature: Date:
Print Date: 3/6/2009 11:26:18 AM Page: 3 of 6
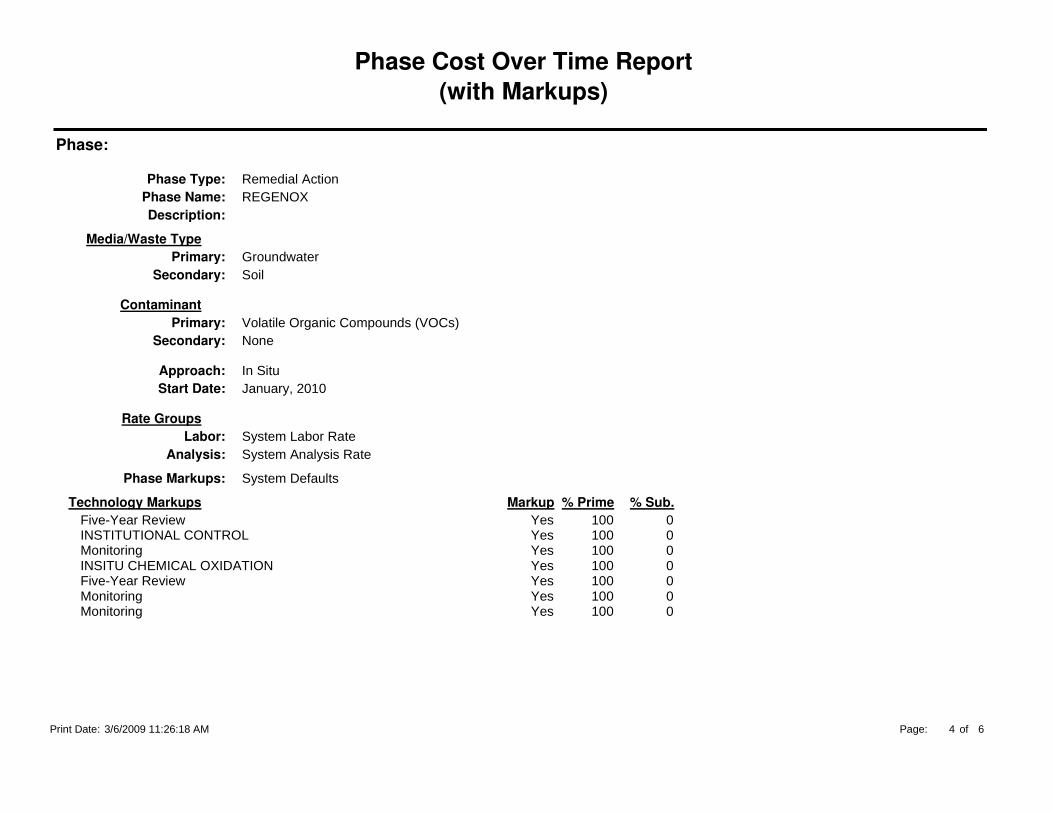
Phase Cost Over Time Report
(with Markups)
Phase Type:
Phase Name: REGENOXRemedial Action
Description:
Phase:
Primary:
Secondary:
Approach:
Groundwater
None
In Situ
Secondary: Soil
Primary: Volatile Organic Compounds (VOCs)
Labor: System Labor RateAnalysis: System Analysis Rate
Start Date: January, 2010
Media/Waste Type
Contaminant
Rate Groups
Phase Markups: System Defaults
Technology Markups
Five-Year ReviewINSTITUTIONAL CONTROLMonitoringINSITU CHEMICAL OXIDATIONFive-Year ReviewMonitoringMonitoring
Markup % Prime % Sub.
YesYesYesYesYesYesYes
100100100100100100100
0000000
Print Date: 3/6/2009 11:26:18 AM Page: 4 of 6

Technology 2010 2011 2012 2013 2014 2015
Five-Year Review $0 $0 $0 $0 $0 $31,671
INSTITUTIONAL CONTROL $6,437 $0 $0 $0 $0 $0
Monitoring $44,924 $0 $0 $0 $0 $0
INSITU CHEMICAL OXIDATION $277,210 $0 $0 $0 $0 $0
Five-Year Review $0 $0 $0 $0 $0 $0
Monitoring $0 $23,401 $23,401 $23,401 $0 $0
Monitoring $0 $0 $0 $0 $44,924 $44,924
Total Phase Cost $328,571 $23,401 $23,401 $23,401 $44,924 $76,595
Phase Cost Over Time Report
(with Markups)
Print Date: 3/6/2009 11:26:18 AM Page: 5 of 6

Technology 2016 Total
Five-Year Review $0 $31,671
INSTITUTIONAL CONTROL $0 $6,437
Monitoring $0 $44,924
INSITU CHEMICAL OXIDATION $0 $277,210
Five-Year Review $31,671 $31,671
Monitoring $0 $70,203
Monitoring $0 $89,847
Total Phase Cost $31,671 $551,963
Phase Cost Over Time Report
(with Markups)
Print Date: 3/6/2009 11:26:18 AM Page: 6 of 6

Phase Cost Summary Report
(with Markups)
Folder:
RACER Version: 8.1.2 Database Location: G:\RTiyarattanachai\Racer\LBG RACER.mdb
System:
Param Feb 09_Final DraftFolder Name:
NEW JERSEY
Param Petroleum - GWParam PetroleumProject ID:
State / Country:
Location Modifiers
Project:
Project Name:
Material:
Labor:
Equipment:
1.0351.5581.054
Description GW RemediationContaminants - TBA and BenzeneAlternatives: MNA, EMNA (ORC-Adv), ISCO, SVE-AS
Project Category: None
Report Option: Calendar
Cost Database Date: 2006
Database: Modified System
NEW JERSEY STATE AVERAGECity:
Location
1.0351.5581.054
Default User
Options
3/6/2009 11:25:53 AM Page: 1Print Date: of 4

Phase Cost Summary Report
(with Markups)
Groundwater - CHEM OX (REGENOX)None
Groundwater - CHEM OX (REGENOX)Site Name:
Site Type:
Site ID:
Description:
Ronnachai Tiyarattanachai
The Louis Berger Group, Inc
Estimator Name:
Telephone Number:
Agency/Org./Office:
Business Address: Morristown, NJ
Estimator Information
[email protected] Address:
Reviewer Name:
Telephone Number:
Agency/Org./Office:
Business Address:
Reviewer Information
Email Address:
973-407-1409
EngineerEstimator Title:
Reviewer Title:
10/04/2007Estimate Prepared Date:
Date Reviewed:
Site:
Estimator Signature:
Reviewer Signature:
Date:
Date:
Phase Names
Support Team: References:
Pre-Study:
Study:
Removal/Interim Action:
Remedial Action:
Operations & Maintenance:
Long Term Monitoring:
Site Closeout:
Design:
Documentation
3/6/2009 11:25:53 AM Page: 2Print Date: of 4

Phase Type:
Phase Name: REGENOXRemedial Action
Description:
Phase:
Primary:
Secondary:
Approach:
Groundwater
None
In Situ
Secondary: Soil
Primary: Volatile Organic Compounds (VOCs)
Labor: System Labor RateAnalysis: System Analysis Rate
Start Date: January, 2010
Media/Waste Type
Contaminant
Rate Groups
Phase Markups: System Defaults
Technology Markups
Five-Year ReviewINSTITUTIONAL CONTROLMonitoringINSITU CHEMICAL OXIDATIONFive-Year ReviewMonitoringMonitoring
Markup % Prime % Sub.
YesYesYesYesYesYesYes
100100100100100100100
0000000
Phase Cost Summary Report
(with Markups)
3/6/2009 11:25:53 AM Page: 3Print Date: of 4
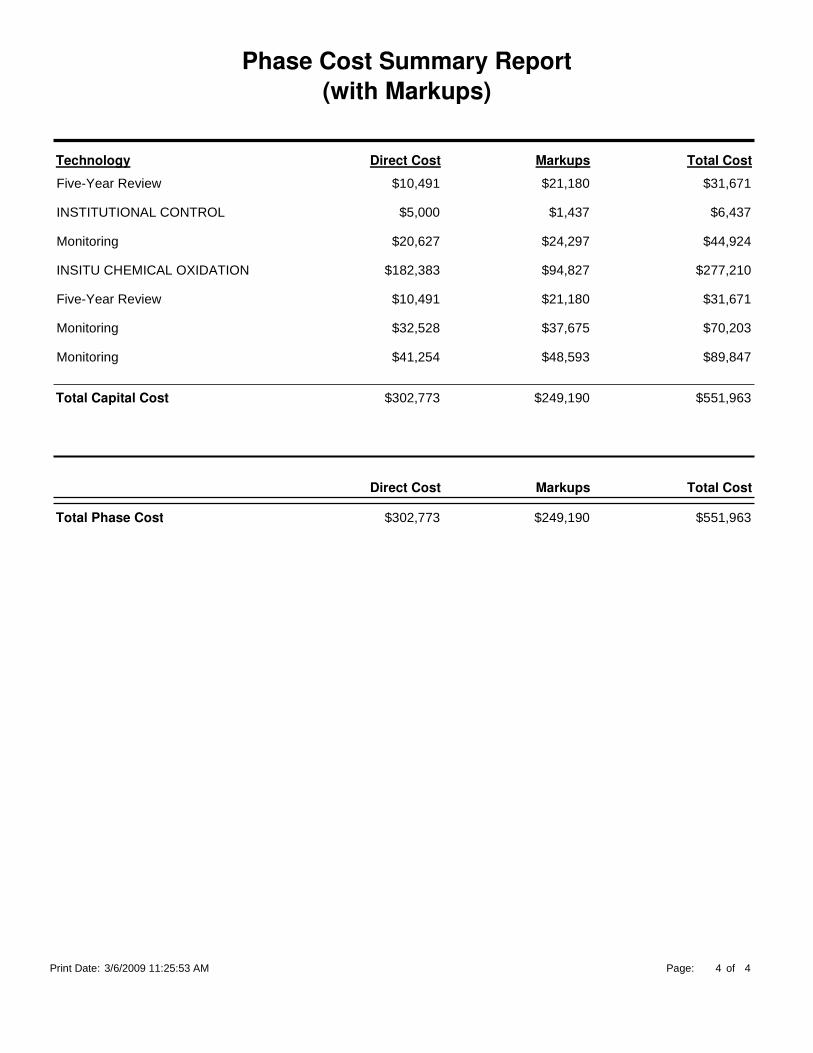
Technology Direct Cost Total CostMarkups
$10,491Five-Year Review $31,671$21,180
$5,000INSTITUTIONAL CONTROL $6,437$1,437
$20,627Monitoring $44,924$24,297
$182,383INSITU CHEMICAL OXIDATION $277,210$94,827
$10,491Five-Year Review $31,671$21,180
$32,528Monitoring $70,203$37,675
$41,254Monitoring $89,847$48,593
$302,773Total Capital Cost $551,963$249,190
Total Phase Cost $302,773 $551,963
Direct Cost Total Cost
$249,190
Markups
Phase Cost Summary Report
(with Markups)
3/6/2009 11:25:53 AM Page: 4Print Date: of 4

Air Sparging/Soil Vapor Extraction

Cost1 Cost with Markups2
ImplementationSoil vapor Extraction/Air SpargingCarbon Adsorption (Gas and Liquid)Air Sparging
$835,896 $1,549,172$836,000 $1,549,000
$1,680,228$1,700,000
1Refer to Phase Element Technology Cost Detail Report. 2Refer to Phase Element Cost Overtime Detail Report.3Net Present Value includes Cost Overtime with inflation and markups, where applicable.
Assumptions:
- Groundwater samples would be collected from nine (9) monitoring wells (MW-1 through MW-9)- Four (4) soil gas monitoring points to be installed.
Monitoring & Maintenance
$463,775
Soil Gas Monitoring (quarterly for 1st two years, semi-annually for the following 6 years)Groundwater Monitoring (quarterly for 1st two years, semi-annually for the following 6 years)Treatment System Monitoring (monthly for 5 years)
Remedial Action Reevaluation (1/5 years)Classification Exception Area
- Ten (10) air sparging wells with flow rate of 5 cubic feet per minute; approximately 40 feet well spacing
Activity
Table C4
Groundwater Estimated Cost Breakdown
Burlington, New JerseyParam Petroleum
Remediation Alternative - AS/SVE
- Two (2) horizontal extraction trenches
Total Net Present Value (Rounded)3
$372,121
TotalTotal (Rounded)
Total Net Present Value 3
$498,077
$1,051,095
Operation and Maintenance (for 5 years)

Technology Year 1 Year 2 Year 3 Year 4 Year 5 Year 6 Year 7 Year 8 Year 9 Year 10 Year 11Capital Costs 504,514$ -$ -$ -$ -$ -$ -$ -$ -$ -$ -$ O & M Cost $165,429 $161,487 $159,486 $161,307 $166,882 $61,745 $23,401 $23,401 $44,924 $44,924 $31,671Total Phase Element Cost $669,943 $161,487 $159,486 $161,307 $166,882 $61,745 $23,401 $23,401 $44,924 $44,924 $31,671Escalation Factor 1.1465 1.1717 1.1975 1.2238 1.2508 1.2783 1.3064 1.3352 1.3645 1.3945 1.4252Escalated Phase Element Cost $768,090 $189,218 $190,985 $197,415 $208,731 $78,928 $30,571 $31,244 $61,300 $62,648 $45,138n = No. of Years 1 2 3 4 5 6 7 8 9 10Net Present Value (NPV) Assuming i - 5% $768,090 $180,208 $173,229 $170,534 $171,724 $61,842 $22,813 $22,204 $41,490 $40,384 $27,711
Technology Year 12 Year 13 Year 14 Year 15 Year 16 Year 17 Year 18 Year 19 Year 20 Year 21Capital Costs -$ -$ -$ -$ -$ -$ -$ -$ -$ -$ O & M CostTotal Phase Element Cost $0 $0 $0 $0 $0 $0 $0 $0 $0 $0Escalation Factor 1.4566 1.4886 1.5214 1.5548 1.5890 1.6240 1.6597 1.6963 1.7336 1.7717Escalated Phase Element Cost $0 $0 $0 $0 $0 $0 $0 $0 $0 $0n = No. of Years 11 12 13 14 15 16 17 18 19 20Net Present Value (NPV)
Param Petroleum SiteBurlington, New Jersey
NET PRESENT VALUE CALCULATIONGroundwater
Remediation Alternative - AS/SVE
Net Present Value (NPV) Assuming i - 5% $0 $0 $0 $0 $0 $0 $0 $0 $0 $0
Technology Year 22 Year 23 Year 24 Year 25 Year 26 Year 27 Year 28 Year 29 Year 30 TotalCapital Costs -$ -$ -$ -$ -$ -$ -$ -$ -$ $504,514O & M Cost $1,044,657Total Phase Element Cost $0 $0 $0 $0 $0 $0 $0 $0 $0 $1,549,171Escalation Factor 1.8107 1.8505 1.8912 1.9328 1.9754 2.0188 2.0632 2.1086 2.1550Escalated Phase Element Cost $0 $0 $0 $0 $0 $0 $0 $0 $0 $1,864,268n = No. of Years 21 22 23 24 25 26 27 28 29Net Present Value (NPV) Assuming i - 5% $0 $0 $0 $0 $0 $0 $0 $0 $0 $1,680,228

Phase Technology Cost Detail Report
(with Markups)
Folder:
RACER Version: 8.1.2 Database Location: G:\RTiyarattanachai\Racer\LBG RACER.mdb
System:
Param Feb 09_Final DraftFolder Name:
NEW JERSEY
Param Petroleum - GWParam PetroleumProject ID:
State / Country:
Location Modifiers
Project:
Project Name:
Material:
Labor:
Equipment:
1.0351.5581.054
Description GW RemediationContaminants - TBA and BenzeneAlternatives: MNA, EMNA (ORC-Adv), ISCO, SVE-AS
Project Category: None
Report Option: Calendar
Cost Database Date: 2006
Database: Modified System
NEW JERSEY STATE AVERAGECity:
Location
1.0351.5581.054
Default User
Options
Print Date: 3/6/2009 11:29:51 AM Page: 1 of 21

Phase Technology Cost Detail Report
(with Markups)
Groundwater - AS/SVENone
Groundwater - AS/SVESite Name:
Site Type:
Site ID:
Description:
Ronnachai Tiyarattanachai
The Louis Berger Group, Inc
Estimator Name:
Telephone Number:
Agency/Org./Office:
Business Address: Morristown, NJ
Estimator Information
[email protected] Address:
973-407-1409
EngineerEstimator Title:
10/22/2007Estimate Prepared Date:
Site:
Estimator Signature: Date:
Phase Names
Support Team: References:
Pre-Study:
Study:
Removal/Interim Action:
Remedial Action:
Operations & Maintenance:
Long Term Monitoring:
Site Closeout:
Design:
Documentation
Print Date: 3/6/2009 11:29:51 AM Page: 2 of 21

Phase Technology Cost Detail Report
(with Markups)
Reviewer Name:
Telephone Number:
Agency/Org./Office:
Business Address:
Reviewer Information
Email Address:
Reviewer Title:
Date Reviewed:
Reviewer Signature: Date:
Print Date: 3/6/2009 11:29:51 AM Page: 3 of 21

Phase Type:
Phase Name: AS/SVERemedial Action
Description:
Phase:
Primary:
Secondary:
Approach:
Groundwater
None
Ex Situ
Secondary: Soil
Primary: Volatile Organic Compounds (VOCs)
Labor: System Labor RateAnalysis: System Analysis Rate
Start Date: January, 2010
Media/Waste Type
Contaminant
Rate Groups
Phase Markups: System Defaults
Technology Markups
Soil Vapor ExtractionAir SpargingCarbon Adsorption (Gas)Carbon Adsorption (Liquid)SVE VAPOR MONITORING POINTResidual Waste ManagementINSTITUTIONAL CONTROLFive-Year ReviewMonitoringMonitoringMonitoring
Markup % Prime % Sub.
YesYesYesYesYesYesYesYesYesYesYes
100100100100100100100100100100100
00000000000
Phase Technology Cost Detail Report
(with Markups)
Print Date: 3/6/2009 11:29:51 AM Page: 4 of 21

Technology: Soil Vapor Extraction
Assembly Description QuantityUnit of
MeasureMaterial
Unit CostEquipment
Unit CostExtended
CostCost
OverrideLabor
Unit CostMarkupsApplied
17020201 Demolish Bituminous Road withPower Equipment
14.81 CY 0.00 35.59 8.02 $645.98
17030201 Backfill, waste excess excavatedmaterials on site
102.22 LCY 0.00 1.11 0.26 $140.33
17030257 Excavating, trench, medium soil,4'''''''' to 6'''''''' deep, 1 C.Y.bucket, gradall, excludessheeting or dewatering
88.89 BCY 0.00 1.37 0.36 $153.92
17030423 Unclassified Fill, 6" Lifts,Off-Site, Includes Delivery,Spreading, and Compaction
109.50 CY 7.89 3.59 2.53 $1,534.84
18020301 Asphalt Pavement - 10"Subgrade, 9" Base, 1 1/2"Topping
88.89 SY 7.20 3.32 1.42 $1,061.76
32039005 Remedial Design - User DefinedCost
1.00 EA 0.00 15,949.50 0.00 $15,949.50
33132360 500 SCFM, Vapor RecoverySystem
1.00 EA 26,007.60 0.00 0.00 $26,007.60
33132377 Equipment Enclosure, 8'''''''' x15'''''''', Portable Building/Shed;lined, insulated, skid mounted,w/exhaust fan
1.00 EA 3,313.56 0.00 0.00 $3,313.56
33220112 Field Technician 40.00 HR 0.00 133.09 0.00 $5,323.42
33230101 2" PVC, Schedule 40, WellCasing
12.00 LF 1.50 6.85 9.43 $213.38
33230112 4" PVC, Schedule 80, WellCasing
40.00 LF 6.01 10.27 14.15 $1,217.12
Phase Technology Cost Detail Report
(with Markups)
Print Date: 3/6/2009 11:29:51 AM Page: 5 of 21

Assembly Description QuantityUnit of
MeasureMaterial
Unit CostEquipment
Unit CostExtended
CostCost
OverrideLabor
Unit CostMarkupsApplied
33230212 4" PVC, Schedule 80, WellScreen
360.00 LF 8.32 10.27 14.15 $11,785.21
33230302 4" PVC, Well Plug 4.00 EA 30.61 15.07 20.75 $265.69
33231407 Gravel Pack for Horizontal WellInstallation
30.00 CF 32.00 20.71 10.01 $1,881.57
33240103 Pilot Scale Test 1.00 LS 128,735.25 0.00 0.00 $128,735.25
33260428 2" PVC, Schedule 80,Connection Piping
200.00 LF 1.11 7.45 0.00 $1,711.26
33260460 4" PVC, Schedule 80, ManifoldPiping
100.00 LF 3.32 16.04 0.00 $1,935.58
33270124 2" PVC, Schedule 80, Tee 4.00 EA 15.95 0.00 0.00 $63.82
33270134 2" PVC, Schedule 80, 90Degree, Elbow
4.00 EA 4.34 0.00 0.00 $17.35
33270136 4" PVC, Schedule 80, 90Degree, Elbow
4.00 EA 17.93 0.00 0.00 $71.74
33270167 4" x 2" Reducer, PVC Schedule80
4.00 EA 46.75 0.00 0.00 $186.99
33310209 Pressure Gauge 4.00 EA 82.04 118.53 0.00 $802.26
95013001 Technology Mobilization andDemobilization
1.00 LS 25,747.05 0.00 0.00 $25,747.05
99040104 Temporary Office 50'''''''' x 12'''''''' 60.00 MO 569.21 0.00 0.00 $34,152.53
Total Element Cost $262,917.71
Total 1st Year Technology Cost $262,917.71
Phase Technology Cost Detail Report
(with Markups)
Print Date: 3/6/2009 11:29:51 AM Page: 6 of 21

Technology: Air Sparging
Assembly Description QuantityUnit of
MeasureMaterial
Unit CostEquipment
Unit CostExtended
CostCost
OverrideLabor
Unit CostMarkupsApplied
33010101 Mobilize/DeMobilize Drilling Rig& Crew
1.00 LS 0.00 2,440.73 1,281.56 $3,722.29
33020303 Organic Vapor Analyzer Rental,per Day
2.00 DAY 152.77 0.00 0.00 $305.53
33139005 Air Sparge System, Blower 98SCFM, 3.2 HP, 5 PSI, base,intake filter, silencer, pulleys,belt, belt guard.
1.00 EA 11,593.79 0.00 0.00 $11,593.79
33170808 Decontaminate Rig, Augers,Screen (Rental Equipment)
2.00 DAY 22.25 952.46 0.00 $1,949.43
33220112 Field Technician 32.00 HR 0.00 133.09 0.00 $4,258.74
33230102 4" PVC, Schedule 40, WellCasing
130.00 LF 3.53 10.27 14.15 $3,632.95
33230202 4" PVC, Schedule 40, WellScreen
20.00 LF 7.90 13.77 18.95 $812.51
33231103 Hollow Stem Auger, 11" DiaBorehole, Depth <= 100 ft
160.00 LF 0.00 29.35 40.41 $11,160.86
33231178 Move Rig/Equipment AroundSite
9.00 EA 74.13 350.85 184.22 $5,482.89
33231402 4" Screen, Filter Pack 40.00 LF 6.88 10.27 14.15 $1,251.91
33231812 4" Well, Portland Cement Grout 100.00 LF 2.18 0.00 0.00 $217.72
33232102 4" Well, Bentonite Seal 10.00 EA 28.96 57.80 79.58 $1,663.50
33260428 2" PVC, Schedule 80,Connection Piping
150.00 LF 1.11 7.45 0.00 $1,283.45
Phase Technology Cost Detail Report
(with Markups)
Print Date: 3/6/2009 11:29:51 AM Page: 7 of 21

Assembly Description QuantityUnit of
MeasureMaterial
Unit CostEquipment
Unit CostExtended
CostCost
OverrideLabor
Unit CostMarkupsApplied
33260460 4" PVC, Schedule 80, ManifoldPiping
100.00 LF 3.32 16.04 0.00 $1,935.58
33270124 2" PVC, Schedule 80, Tee 10.00 EA 15.95 0.00 0.00 $159.54
33270134 2" PVC, Schedule 80, 90Degree, Elbow
10.00 EA 4.34 0.00 0.00 $43.39
33270167 4" x 2" Reducer, PVC Schedule80
10.00 EA 46.75 0.00 0.00 $467.47
33270440 2" PVC, Sch 80, Ball Valve 10.00 EA 111.54 0.00 0.00 $1,115.35
33310209 Pressure Gauge 10.00 EA 82.04 118.53 0.00 $2,005.65
Total Element Cost $53,062.54
Total 1st Year Technology Cost $53,062.54
Phase Technology Cost Detail Report
(with Markups)
Print Date: 3/6/2009 11:29:51 AM Page: 8 of 21

Technology: Carbon Adsorption (Gas)
Assembly Description QuantityUnit of
MeasureMaterial
Unit CostEquipment
Unit CostExtended
CostCost
OverrideLabor
Unit CostMarkupsApplied
18020322 8" Structural Slab on Grade 40.00 SF 4.92 7.82 0.17 $516.64
33021501 Air & process gas purification,carbon adsorption, vapor phase,modular carbon adsorbers
1.00 EA 63.24 0.00 0.00 $63.24
33021502 Thermostat & Humidity ControlDevices
1.00 EA 119.48 210.12 0.00 $329.60
33021506 Plug, steel, malleable iron, black,threaded, 300 lb., 1/4"
2.00 EA 2.35 29.77 0.00 $64.24
33131910 Air & process gas purification,carbon adsorption, vapor phase,modular carbon adsorbers, 500CFM, 1400 lb fill, closed upflow,11.5" pressure drop
4.00 EA 8,873.64 2,138.61 73.48 $44,342.90
33131950 25'''''''' x 6" Flexible StainlessSteel High-pressure Hose
1.00 EA 103.47 227.57 0.00 $331.05
33131971 1 KW Hazardous Air Heater 1.00 EA 2,890.00 0.00 0.00 $2,890.00
33310108 Air & process gas purification,packaged high pressure carbonadsorption blower, belt drive,750 CFM, 12" pressure, 5 HP,3920 RPM
1.00 EA 1,868.15 1,290.07 0.00 $3,158.21
33310209 Pressure Gauge 2.00 EA 82.04 118.53 0.00 $401.13
Total Element Cost $52,097.01
Total 1st Year Technology Cost $52,097.01
Phase Technology Cost Detail Report
(with Markups)
Print Date: 3/6/2009 11:29:51 AM Page: 9 of 21

Technology: Carbon Adsorption (Liquid)
Assembly Description QuantityUnit of
MeasureMaterial
Unit CostEquipment
Unit CostExtended
CostCost
OverrideLabor
Unit CostMarkupsApplied
18020322 8" Structural Slab on Grade 45.00 SF 4.92 7.82 0.17 $581.22
33132019 Aqueous organic & highly toxicwastes, carbon adsorption, liquidphase, modular carbonadsorbers, 75 GPM, 1650 lb fill,HDPE lined steel, permanent
1.00 EA 11,371.48 1,745.33 122.46 $13,239.27
33290122 75 GPM, 3 HP, Transfer Pumpwith Motor, Valves, Piping
1.00 EA 4,668.86 3,370.84 0.00 $8,039.70
Total Element Cost $21,860.20
Total 1st Year Technology Cost $21,860.20
Phase Technology Cost Detail Report
(with Markups)
Print Date: 3/6/2009 11:29:51 AM Page: 10 of 21

Technology: SVE VAPOR MONITORING POINT
Assembly Description QuantityUnit of
MeasureMaterial
Unit CostEquipment
Unit CostExtended
CostCost
OverrideLabor
Unit CostMarkupsApplied
33010101 Mobilize/DeMobilize Drilling Rig& Crew
1.00 LS 0.00 2,440.73 1,281.56 $3,722.29
33020303 Organic Vapor Analyzer Rental,per Day
1.00 DAY 152.77 0.00 0.00 $152.77
33230101 2" PVC, Schedule 40, WellCasing
40.00 LF 1.50 6.85 9.43 $711.28
33230201 2" PVC, Schedule 40, WellScreen
40.00 LF 3.47 8.84 12.17 $978.75
33230301 2" PVC, Well Plug 4.00 EA 7.30 10.27 14.15 $126.90
33231101 Hollow Stem Auger, 8" DiaBorehole, Depth <= 100 ft
60.00 LF 0.00 18.78 25.86 $2,678.60
33231178 Move Rig/Equipment AroundSite
4.00 EA 74.13 350.85 184.22 $2,436.84
33231401 2" Screen, Filter Pack 10.00 LF 3.90 5.82 8.02 $177.35
33231504 Surface Pad, Concrete, 2'''''''' x2'''''''' x 4"
4.00 EA 48.37 32.11 2.33 $331.22
33231811 2" Well, Portland Cement Grout 4.00 LF 1.45 0.00 0.00 $5.81
33232101 2" Well, Bentonite Seal 4.00 EA 11.58 23.12 31.83 $266.11
Total Element Cost $11,587.92
Total 1st Year Technology Cost $11,587.92
Phase Technology Cost Detail Report
(with Markups)
Print Date: 3/6/2009 11:29:51 AM Page: 11 of 21

Technology: Residual Waste Management
Assembly Description QuantityUnit of
MeasureMaterial
Unit CostEquipment
Unit CostExtended
CostCost
OverrideLabor
Unit CostMarkupsApplied
95012901 Residual Waste ManagementPer Truck
50.00 EA 1,931.03 0.00 0.00 $96,551.44
Total Element Cost $96,551.44
Total 1st Year Technology Cost $96,551.44
Phase Technology Cost Detail Report
(with Markups)
Print Date: 3/6/2009 11:29:51 AM Page: 12 of 21

Technology: INSTITUTIONAL CONTROL
Assembly Description QuantityUnit of
MeasureMaterial
Unit CostEquipment
Unit CostExtended
CostCost
OverrideLabor
Unit CostMarkupsApplied
95010203 Classification Exception Area 1.00 LS 6,436.76 0.00 0.00 $6,436.76
Total Element Cost $6,436.76
Total 1st Year Technology Cost $6,436.76
Phase Technology Cost Detail Report
(with Markups)
Print Date: 3/6/2009 11:29:51 AM Page: 13 of 21

Technology: Five-Year Review
Assembly Description QuantityUnit of
MeasureMaterial
Unit CostEquipment
Unit CostExtended
CostCost
OverrideLabor
Unit Cost
Element: Document Review
MarkupsApplied
33220102 Project Manager 8.00 HR 0.00 214.73 0.00 $1,717.80
33220105 Project Engineer 11.00 HR 0.00 208.22 0.00 $2,290.46
33220108 Project Scientist 8.00 HR 0.00 241.03 0.00 $1,928.22
33220109 Staff Scientist 16.00 HR 0.00 178.64 0.00 $2,858.22
Total Element Cost $8,794.71
Assembly Description QuantityUnit of
MeasureMaterial
Unit CostEquipment
Unit CostExtended
CostCost
OverrideLabor
Unit Cost
Element: Site Inspection
MarkupsApplied
33220102 Project Manager 9.00 HR 0.00 214.73 0.00 $1,932.53
33220105 Project Engineer 16.00 HR 0.00 208.22 0.00 $3,331.58
33220108 Project Scientist 12.00 HR 0.00 241.03 0.00 $2,892.33
33220109 Staff Scientist 13.00 HR 0.00 178.64 0.00 $2,322.31
Total Element Cost $10,478.74
Assembly Description QuantityUnit of
MeasureMaterial
Unit CostEquipment
Unit CostExtended
CostCost
OverrideLabor
Unit Cost
Element: Report
MarkupsApplied
33220102 Project Manager 6.00 HR 0.00 214.73 0.00 $1,288.35
33220105 Project Engineer 16.00 HR 0.00 208.22 0.00 $3,331.58
33220108 Project Scientist 13.00 HR 0.00 241.03 0.00 $3,133.36
33220109 Staff Scientist 26.00 HR 0.00 178.64 0.00 $4,644.61
Phase Technology Cost Detail Report
(with Markups)
Print Date: 3/6/2009 11:29:51 AM Page: 14 of 21

Total Element Cost $12,397.90
Total 1st Year Technology Cost $31,671.35
Phase Technology Cost Detail Report
(with Markups)
Print Date: 3/6/2009 11:29:51 AM Page: 15 of 21

Technology: Monitoring
Assembly Description QuantityUnit of
MeasureMaterial
Unit CostEquipment
Unit CostExtended
CostCost
OverrideLabor
Unit Cost
Element: Groundwater
MarkupsApplied
33020401 Disposable Materials perSample
40.00 EA 11.10 0.00 0.00 $443.95
33020402 Decontamination Materials perSample
40.00 EA 9.89 0.00 0.00 $395.46
33020561 Lysimeter accessories, nylontubing, 1/4" OD
565.00 LF 0.67 0.00 0.00 $376.40
33021509 Monitor well samplingequipment, rental, water qualitytesting parameter device rental
1.00 WK 310.77 0.00 0.00 $310.77
33021618 Testing, purgeable organics(624, 8260)
40.00 EA 222.42 0.00 0.00 $8,896.87
33230509 4" Submersible Pump Rental,Day
4.00 DAY 100.97 0.00 0.00 $403.86
33231186 Well Development EquipmentRental (weekly)
1.00 WK 575.53 116.35 0.00 $691.88
Total Element Cost $11,519.20
Assembly Description QuantityUnit of
MeasureMaterial
Unit CostEquipment
Unit CostExtended
CostCost
OverrideLabor
Unit Cost
Element: Soil Gas
MarkupsApplied
33020306 Monitoring Gas Vents 16.00 EA 0.00 27.78 0.00 $444.42
33029505 Volatile Organic Carbon (TO-15) 18.00 LS 386.21 0.00 0.00 $6,951.70
Total Element Cost $7,396.12
Phase Technology Cost Detail Report
(with Markups)
Print Date: 3/6/2009 11:29:51 AM Page: 16 of 21

Assembly Description QuantityUnit of
MeasureMaterial
Unit CostEquipment
Unit CostExtended
CostCost
OverrideLabor
Unit Cost
Element: Air
MarkupsApplied
33020346 Portable Air Sampler,Continuous, Weekly Rental
1.00 WK 114.58 0.00 0.00 $114.58
33029505 Volatile Organic Carbon (TO-15) 27.00 LS 386.21 0.00 0.00 $10,427.55
Total Element Cost $10,542.13
Assembly Description QuantityUnit of
MeasureMaterial
Unit CostEquipment
Unit CostExtended
CostCost
OverrideLabor
Unit Cost
Element: General Monitoring
MarkupsApplied
33010104 Sample collection, vehiclemileage charge, car or van
2,580.00 MI 0.17 0.00 0.00 $427.25
33010202 Sample collection, samplingpersonnel travel, per diem
12.00 DAY 99.00 0.00 0.00 $1,188.00
33220102 Project Manager 4.00 HR 0.00 214.73 0.00 $858.90
33220105 Project Engineer 48.00 HR 0.00 208.22 0.00 $9,994.74
33220109 Staff Scientist 120.00 HR 0.00 178.64 0.00 $21,436.67
33220112 Field Technician 120.00 HR 0.00 133.09 0.00 $15,970.27
Total Element Cost $49,875.83
Total 1st Year Technology Cost $79,333.28
Phase Technology Cost Detail Report
(with Markups)
Print Date: 3/6/2009 11:29:51 AM Page: 17 of 21

Technology: Monitoring
Assembly Description QuantityUnit of
MeasureMaterial
Unit CostEquipment
Unit CostExtended
CostCost
OverrideLabor
Unit Cost
Element: Groundwater
MarkupsApplied
33020401 Disposable Materials perSample
20.00 EA 11.10 0.00 0.00 $221.98
33020402 Decontamination Materials perSample
20.00 EA 9.89 0.00 0.00 $197.73
33020561 Lysimeter accessories, nylontubing, 1/4" OD
295.00 LF 0.67 0.00 0.00 $196.53
33021509 Monitor well samplingequipment, rental, water qualitytesting parameter device rental
1.00 WK 310.77 0.00 0.00 $310.77
33021618 Testing, purgeable organics(624, 8260)
20.00 EA 222.42 0.00 0.00 $4,448.44
33230509 4" Submersible Pump Rental,Day
2.00 DAY 100.97 0.00 0.00 $201.93
33231186 Well Development EquipmentRental (weekly)
1.00 WK 575.53 116.35 0.00 $691.88
Total Element Cost $6,269.26
Assembly Description QuantityUnit of
MeasureMaterial
Unit CostEquipment
Unit CostExtended
CostCost
OverrideLabor
Unit Cost
Element: General Monitoring
MarkupsApplied
33010104 Sample collection, vehiclemileage charge, car or van
460.00 MI 0.17 0.00 0.00 $76.18
33010202 Sample collection, samplingpersonnel travel, per diem
4.00 DAY 99.00 0.00 0.00 $396.00
33220102 Project Manager 4.00 HR 0.00 214.73 0.00 $858.90
Phase Technology Cost Detail Report
(with Markups)
Print Date: 3/6/2009 11:29:51 AM Page: 18 of 21

Assembly Description QuantityUnit of
MeasureMaterial
Unit CostEquipment
Unit CostExtended
CostCost
OverrideLabor
Unit Cost
Element: General Monitoring
MarkupsApplied
33220105 Project Engineer 16.00 HR 0.00 208.22 0.00 $3,331.58
33220109 Staff Scientist 40.00 HR 0.00 178.64 0.00 $7,145.56
33220112 Field Technician 40.00 HR 0.00 133.09 0.00 $5,323.42
Total Element Cost $17,131.64
Total 1st Year Technology Cost $23,400.89
Phase Technology Cost Detail Report
(with Markups)
Print Date: 3/6/2009 11:29:51 AM Page: 19 of 21

Technology: Monitoring
Assembly Description QuantityUnit of
MeasureMaterial
Unit CostEquipment
Unit CostExtended
CostCost
OverrideLabor
Unit Cost
Element: Groundwater
MarkupsApplied
33020401 Disposable Materials perSample
40.00 EA 11.10 0.00 0.00 $443.95
33020402 Decontamination Materials perSample
40.00 EA 9.89 0.00 0.00 $395.46
33020561 Lysimeter accessories, nylontubing, 1/4" OD
565.00 LF 0.67 0.00 0.00 $376.40
33021509 Monitor well samplingequipment, rental, water qualitytesting parameter device rental
1.00 WK 310.77 0.00 0.00 $310.77
33021618 Testing, purgeable organics(624, 8260)
40.00 EA 222.42 0.00 0.00 $8,896.87
33230509 4" Submersible Pump Rental,Day
4.00 DAY 100.97 0.00 0.00 $403.86
33231186 Well Development EquipmentRental (weekly)
1.00 WK 575.53 116.35 0.00 $691.88
Total Element Cost $11,519.20
Assembly Description QuantityUnit of
MeasureMaterial
Unit CostEquipment
Unit CostExtended
CostCost
OverrideLabor
Unit Cost
Element: General Monitoring
MarkupsApplied
33010104 Sample collection, vehiclemileage charge, car or van
920.00 MI 0.17 0.00 0.00 $152.35
33010202 Sample collection, samplingpersonnel travel, per diem
8.00 DAY 99.00 0.00 0.00 $792.00
33220102 Project Manager 4.00 HR 0.00 214.73 0.00 $858.90
Phase Technology Cost Detail Report
(with Markups)
Print Date: 3/6/2009 11:29:51 AM Page: 20 of 21

Assembly Description QuantityUnit of
MeasureMaterial
Unit CostEquipment
Unit CostExtended
CostCost
OverrideLabor
Unit Cost
Element: General Monitoring
MarkupsApplied
33220105 Project Engineer 32.00 HR 0.00 208.22 0.00 $6,663.16
33220109 Staff Scientist 80.00 HR 0.00 178.64 0.00 $14,291.11
33220112 Field Technician 80.00 HR 0.00 133.09 0.00 $10,646.85
Total Element Cost $33,404.37
Total 1st Year Technology Cost $44,923.57
$683,842.67Total Phase Cost
Phase Technology Cost Detail Report
(with Markups)
Print Date: 3/6/2009 11:29:51 AM Page: 21 of 21

Phase Cost Over Time Report
(with Markups)
Folder:
RACER Version: 8.1.2 Database Location: G:\RTiyarattanachai\Racer\LBG RACER.mdb
System:
Param Feb 09_Final DraftFolder Name:
NEW JERSEY
Param Petroleum - GWParam PetroleumProject ID:
State / Country:
Location Modifiers
Project:
Project Name:
Material:
Labor:
Equipment:
1.0351.5581.054
Description GW RemediationContaminants - TBA and BenzeneAlternatives: MNA, EMNA (ORC-Adv), ISCO, SVE-AS
Project Category: None
Report Option: Calendar
Cost Database Date: 2006
Database: Modified System
NEW JERSEY STATE AVERAGECity:
Location
1.0351.5581.054
Default User
Options
Print Date: 3/6/2009 11:29:34 AM Page: 1 of 6

Phase Cost Over Time Report
(with Markups)
Groundwater - AS/SVENone
Groundwater - AS/SVESite Name:
Site Type:
Site ID:
Description:
Ronnachai Tiyarattanachai
The Louis Berger Group, Inc
Estimator Name:
Telephone Number:
Agency/Org./Office:
Business Address: Morristown, NJ
Estimator Information
[email protected] Address:
973-407-1409
EngineerEstimator Title:
10/22/2007Estimate Prepared Date:
Site:
Estimator Signature: Date:
Phase Names
Support Team: References:
Pre-Study:
Study:
Removal/Interim Action:
Remedial Action:
Operations & Maintenance:
Long Term Monitoring:
Site Closeout:
Design:
Documentation
Print Date: 3/6/2009 11:29:34 AM Page: 2 of 6

Phase Cost Over Time Report
(with Markups)
Reviewer Name:
Telephone Number:
Agency/Org./Office:
Business Address:
Reviewer Information
Email Address:
Reviewer Title:
Date Reviewed:
Reviewer Signature: Date:
Print Date: 3/6/2009 11:29:34 AM Page: 3 of 6

Phase Cost Over Time Report
(with Markups)
Phase Type:
Phase Name: AS/SVERemedial Action
Description:
Phase:
Primary:
Secondary:
Approach:
Groundwater
None
Ex Situ
Secondary: Soil
Primary: Volatile Organic Compounds (VOCs)
Labor: System Labor RateAnalysis: System Analysis Rate
Start Date: January, 2010
Media/Waste Type
Contaminant
Rate Groups
Phase Markups: System Defaults
Technology Markups
Soil Vapor ExtractionAir SpargingCarbon Adsorption (Gas)Carbon Adsorption (Liquid)SVE VAPOR MONITORING POINTResidual Waste ManagementINSTITUTIONAL CONTROLFive-Year ReviewMonitoringMonitoringMonitoring
Markup % Prime % Sub.
YesYesYesYesYesYesYesYesYesYesYes
100100100100100100100100100100100
00000000000
Print Date: 3/6/2009 11:29:34 AM Page: 4 of 6

Technology 2010 2011 2012 2013 2014 2015
Soil Vapor Extraction $262,918 $0 $0 $0 $0 $0
Air Sparging $53,063 $0 $0 $0 $0 $0
Carbon Adsorption (Gas) $52,097 $0 $0 $0 $0 $0
Carbon Adsorption (Liquid) $21,860 $0 $0 $0 $0 $0
SVE VAPOR MONITORING POINT $11,588 $0 $0 $0 $0 $0
Residual Waste Management $96,551 $0 $0 $0 $0 $0
INSTITUTIONAL CONTROL $6,437 $0 $0 $0 $0 $0
Five-Year Review $0 $0 $0 $0 $0 $31,671
Monitoring $79,333 $79,333 $79,333 $79,333 $79,333 $0
Monitoring $0 $0 $0 $0 $0 $23,401
Monitoring $0 $0 $0 $0 $0 $0
Total Phase Cost $583,847 $79,333 $79,333 $79,333 $79,333 $55,072
Phase Cost Over Time Report
(with Markups)
Print Date: 3/6/2009 11:29:34 AM Page: 5 of 6

Technology 2016 2017 2018 2019 2020 Total
Soil Vapor Extraction $0 $0 $0 $0 $0 $262,918
Air Sparging $0 $0 $0 $0 $0 $53,063
Carbon Adsorption (Gas) $0 $0 $0 $0 $0 $52,097
Carbon Adsorption (Liquid) $0 $0 $0 $0 $0 $21,860
SVE VAPOR MONITORING POINT $0 $0 $0 $0 $0 $11,588
Residual Waste Management $0 $0 $0 $0 $0 $96,551
INSTITUTIONAL CONTROL $0 $0 $0 $0 $0 $6,437
Five-Year Review $0 $0 $0 $0 $31,671 $63,343
Monitoring $0 $0 $0 $0 $0 $396,666
Monitoring $23,401 $23,401 $0 $0 $0 $70,203
Monitoring $0 $0 $44,924 $44,924 $0 $89,847
Total Phase Cost $23,401 $23,401 $44,924 $44,924 $31,671 $1,124,573
Phase Cost Over Time Report
(with Markups)
Print Date: 3/6/2009 11:29:34 AM Page: 6 of 6

Phase Cost Summary Report
(with Markups)
Folder:
RACER Version: 8.1.2 Database Location: G:\RTiyarattanachai\Racer\LBG RACER.mdb
System:
Param Feb 09_Final DraftFolder Name:
NEW JERSEY
Param Petroleum - GWParam PetroleumProject ID:
State / Country:
Location Modifiers
Project:
Project Name:
Material:
Labor:
Equipment:
1.0351.5581.054
Description GW RemediationContaminants - TBA and BenzeneAlternatives: MNA, EMNA (ORC-Adv), ISCO, SVE-AS
Project Category: None
Report Option: Calendar
Cost Database Date: 2006
Database: Modified System
NEW JERSEY STATE AVERAGECity:
Location
1.0351.5581.054
Default User
Options
3/6/2009 11:28:26 AM Page: 1Print Date: of 4

Phase Cost Summary Report
(with Markups)
Groundwater - AS/SVENone
Groundwater - AS/SVESite Name:
Site Type:
Site ID:
Description:
Ronnachai Tiyarattanachai
The Louis Berger Group, Inc
Estimator Name:
Telephone Number:
Agency/Org./Office:
Business Address: Morristown, NJ
Estimator Information
[email protected] Address:
Reviewer Name:
Telephone Number:
Agency/Org./Office:
Business Address:
Reviewer Information
Email Address:
973-407-1409
EngineerEstimator Title:
Reviewer Title:
10/22/2007Estimate Prepared Date:
Date Reviewed:
Site:
Estimator Signature:
Reviewer Signature:
Date:
Date:
Phase Names
Support Team: References:
Pre-Study:
Study:
Removal/Interim Action:
Remedial Action:
Operations & Maintenance:
Long Term Monitoring:
Site Closeout:
Design:
Documentation
3/6/2009 11:28:26 AM Page: 2Print Date: of 4

Phase Type:
Phase Name: AS/SVERemedial Action
Description:
Phase:
Primary:
Secondary:
Approach:
Groundwater
None
Ex Situ
Secondary: Soil
Primary: Volatile Organic Compounds (VOCs)
Labor: System Labor RateAnalysis: System Analysis Rate
Start Date: January, 2010
Media/Waste Type
Contaminant
Rate Groups
Phase Markups: System Defaults
Technology Markups
Soil Vapor ExtractionAir SpargingCarbon Adsorption (Gas)Carbon Adsorption (Liquid)SVE VAPOR MONITORING POINTResidual Waste ManagementINSTITUTIONAL CONTROLFive-Year ReviewMonitoringMonitoringMonitoring
Markup % Prime % Sub.
YesYesYesYesYesYesYesYesYesYesYes
100100100100100100100100100100100
00000000000
Phase Cost Summary Report
(with Markups)
3/6/2009 11:28:26 AM Page: 3Print Date: of 4

Technology Direct Cost Total CostMarkups
$197,853Soil Vapor Extraction $262,918$65,065
$36,258Air Sparging $53,063$16,805
$38,831Carbon Adsorption (Gas) $52,097$13,266
$16,159Carbon Adsorption (Liquid) $21,860$5,701
$8,020SVE VAPOR MONITORING POINT $11,588$3,568
$75,000Residual Waste Management $96,551$21,551
$5,000INSTITUTIONAL CONTROL $6,437$1,437
$20,981Five-Year Review $63,343$42,362
$201,995Monitoring $396,666$194,671
$32,528Monitoring $70,203$37,675
$41,254Monitoring $89,847$48,593
$673,879Total Capital Cost $1,124,573$450,694
Total Phase Cost $673,879 $1,124,573
Direct Cost Total Cost
$450,694
Markups
Phase Cost Summary Report
(with Markups)
3/6/2009 11:28:26 AM Page: 4Print Date: of 4

Submitted by:
The Louis Berger Group, Inc.412 Mount Kemble Avenue
Morristown, New Jersey 07962
April 2010