reliabilityy analysis of prestressed concrete …
TRANSCRIPT
RELIABILITYY ANALYSIS OF PRESTRESSED CONCRETE BRIDGE
GIRDER BEAM
GUNA KUMAR
A dissertation submitted in partial fulfillment for the requirements for the award of
Master of Engineering (Structures)
Faculty of Civil Engineering
Universiti Teknologi Malaysia
NOVEMBER, 2005

iii
To Chechi the one and only.

iv
ACKNOWLEDGEMENT
This endeavor without a doubt has been time consuming, mentally taxing and
inevitably expensive, however, towards the end of this journey the pieces began to
fall in its place and the feeling of the saw has been sharpened after all, has sunk in.
For this my deepest gratitude goes to Assoc.Prof. Dr. Nordin Yahaya, my
dissertation supervisor, for all the guidance, knowledge and making the time cross
300 miles to extend help. My special thanks to my fellow colleague Mr. Yugabalan
for the help extended in the MATLAB script. To the special people around me (Mr.
Jim Balan) my gratitude for the patience and support which, was an impetus to
sustain me during this dissertation.
My appreciation to En. Khairul at SPS UTM City Campus for his unreserved
diligence in allowing me to use the computer lab especially at odd hours. Finally my
warm thanks to all my fellow master students for their friendship and support.
Thank you
Guna Kumar
December 2005.

v
ABSTRACT
Recent studies undertaken in the United States and Europe have shown that
there are many highway bridges rated as structurally deficient requiring
rehabilitation or replacement due to the increase traffic flow and modern
truck loads. The objective of this dissertation is to compare the reliability
based load factor for prestressed bridge girders against the deterministic load
factor given in six (6) codes namely; BS5400 Pt.2, AASHTO, Canadian
Code (OHBDC), Eurocode, Australian Code (Austroads) and JKR
specifications. ‘Y5’ prestressed bridge girder with a resistance of 4192kNm
assumed to be a constant are considered. The load parameters and the bridge
spans are treated as random variables. The statistical parameters are based on
available literature and test data. The reliability indices for load factor are
calculated by iteration utilizing Monte Carlo simulation. Based upon the
results obtained it can be concluded with confidence that in the design of
primary highway loads, the load factor given in the codes can be reduced by
approximately 10 to 13%. The results also indicate that AASHTO is the most
conservative code while BS5400 Pt.2 and Eurocode are the most permissive.
This would mean that using BS5400 Pt.2 or Eurocode will result in a cost
effective bridge girder beam.

vi
ABSTRAK
Objektif dissertasi ini adalah untuk memperbandingkan prinsip
keboleharapan rasuk jambatan prategangan berdasarkan kepada faktor beban
hidup keboleharapan dengan faktor beban hidup konvensional
(deterministik) yang diberikan dalam enam (6) piawai-piawai rekabentuk
iaitu; BS5400 Pt.2, AASHTO, Piawaian Kanada (OHBDC), Eurocode,
Piawaian Australia (Austroads) dan spesifikasi JKR. Rasuk jambatan
prategasan ‘Y5’ dengan nilai keupayaan masimum 4192kNm adalah
dianggap tetap ataupun sebagai satu konstan. Parameter beban dan panjang
rasuk jambatan adalah dianggap sebagai pembolehubah rawak. Parameter
statistik beban dengan panjang rasuk jambatan adalah berdasarkan kepada
kajian literatur sediada serta kajian makmal. Prinsip keboleharapan rasuk
jambatan berdasarkan kepada faktor beban hidup adalah dijalankan dengan
kaedah simulasi Monte Carlo secara berulang. Melalui kajian keboleharapan
dengan simulasi Monte Carlo, keputusan yang didapati menunjukan bahawa
faktor beban hidup yang diberikan dalam piawaian rekabentuk boleh
dikurangkan sebanyak 10% hingga 13%. Keputusan kajian ini mendapati
bahawa piawan ASSHTO merupakan satu piawan yang paling konservatif
manakala piawaian BS5400 Pt.2 dan Eurocode adalah piawaian-piawaian
yang paling permisif. Ini bermakna dengan menggunakan piawaian BS5400
Pt.2 atau Eurocode akan memberikan satu rekabentuk rasuk jambatan yang
kos effektif.

vii
LIST OF CONTENTS
CHAPTER TITLE PAGE
DECLARATION ii
DEDICATION iii
ACKNOWLEDGEMENTS iv
ABSTRACT v
ABSTRAK vi
CONTENT vii
LIST OF TABLES xii
LIST OF FIGURES xiv
NOMENCLATURE xvii
CHAPTER 1 INTRODUCTION 1
1.1 General Introduction 1
1.2 Background Of The Problem 2
1.3 Objectives Of Study 7
1.4 Scope Of Study 8
1.5 Importance Of Study 9

viii
1.6 Limitation Of Study 10
1.7 Thesis Organization 10
CHAPTER 2 LITERATURE REVIEW 12
2.1 Introduction 12
2.2 Definition Of Reliability 17
2.3 Reliability Based Design Concepts 18
2.4 Limit States In Deterministic Based Design 20
2.5 Load Safety Factor In Limit States Design 21
2.6 Concept Of Reliability Evaluation 23
2.6.1 Continuous Probability Distribution 24
2.7 Reliability With a Single Loading 26
2.8 Reliability Computation Of Moments 29
2.9 Monte Carlo Simulation 31
2.9.1 Simulation Procedures 31
2.10 Reliability Index 32
2.11 Previous Researches 35
2.11.1 System Reliability Models For Bridge 36
Structures
2.11.2 Probabilistic Limit State Analysis 38
Of Framed Structures
2.11.3 Reliability Based Design Of Steel 40
Bridges Under Fatigue Loading
ix
2.11.4 Reliability Analysis Of Bridge Girders, 41
A Comparison Of Code Of Practice
CHAPTER 3 METHODOLOGY 43
3.1 Introduction 43
3.2 Primary Highway Bridge Loadings 44
3.3 Assumptions On Arbitrary Bridge 47
3.4 Ultimate Limit State Analysis (Deterministic) 49
3.5 Reliability Analysis Of Bridge Girders 52
3.6 Monte Carlo Simulation 53
3.6.1 Application Of Monte Carlo Simulation 53
3.7 Steps To Derive Matlab Script For Monte Carlo 58
Simulation
3.8 Summary Of Methodology 60
CHAPTER 4 RESULTS 61
4.1 Introduction 61
4.2 Load Model 63
4.3 Results 64
4.3.1 Code Of Practice – BS5400 Pt.2 64
4.3.2 Code Of Practice – AASHTO 65
4.3.3 Code Of Practice – Canadian Code 66
4.3.4 Code Of Practice – Eurocode 67

x
4.3.5 Code Of Practice – Australian Code 68
4.3.6 JKR Specifications 69
CHAPTER 5 DISCUSSION ON RESULTS 71
5.1 Introduction 71
5.2 General Overview On The Results 73
5.3 Discussion On Case Study No.1 – BS5400 76
5.4 Discussion On Case Study No.2 – AASHTO 78
5.5 Discussion On Case Study No.3 – Canadian 79
Code (OHBDC)
5.6 Discussion On Case Study No.4 – Eurocode 80
5.7 Discussion On Case Study No.5 – Australian 82
Code (Austroads)
5.8 Discussion On Case Study No.6 – JKR 83
Specification
5.9 Discussion On 35m Bridge Span With Various 85
Codes
5.10 Discussion On 40m Bridge Span With Various 86
Codes
5.11 Discussion On 45m Bridge Span With Various 88
Codes
5.12 Discussion On 50m Bridge Span With Various 90
Codes
xi
5.13 Discussion On 55m Bridge Span With Various 92
Codes
5.14 Discussion On 60m Bridge Span With Various 94
Codes
CHAPTER 6 CONCLUSIONS AND RECOMMENDATIONS 98
6.1 Introduction 98
6.2 Recommendation For Further Work 100
REFERENCES 102
xii
LIST OF TABLES
LIST TITLE PAGE
Table 2.1 Parameters In The Functions Of R and S 17
Table 2.2 Load Factor at ULS For Various Codes 22
Table 2.3 Quantitative Values between Pf and Β 35
Table 2.4 Bias Factor λ & V For Bridge Structures 36
Table 3.1 Load Factor For Various Codes 51
Table 3.2 Statistical Parameters For MC Computations 54
(Nowak & Yamani, 1994).
Table 4.1 Code Of Practice: BS 5400 Part 2 64
Table 4.2 Code Of Practice: AASHTO 1994 65
Table 4.3 Code Of Practice: Canadian Code (OHBDC) 66
Table 4.4 Code of Practice : Eurocode 67
Table 4.5
Code of Practice : Austroads 68
Table 4.6
JKR Specifications 69
Table 5.1 Comparison Of Data For 35m Bridge Span 85
Table 5.2 Comparison Of Data For 40m Bridge Span. 87
Table 5.3 Comparison Of Data For 45m Bridge Span. 88
xiii
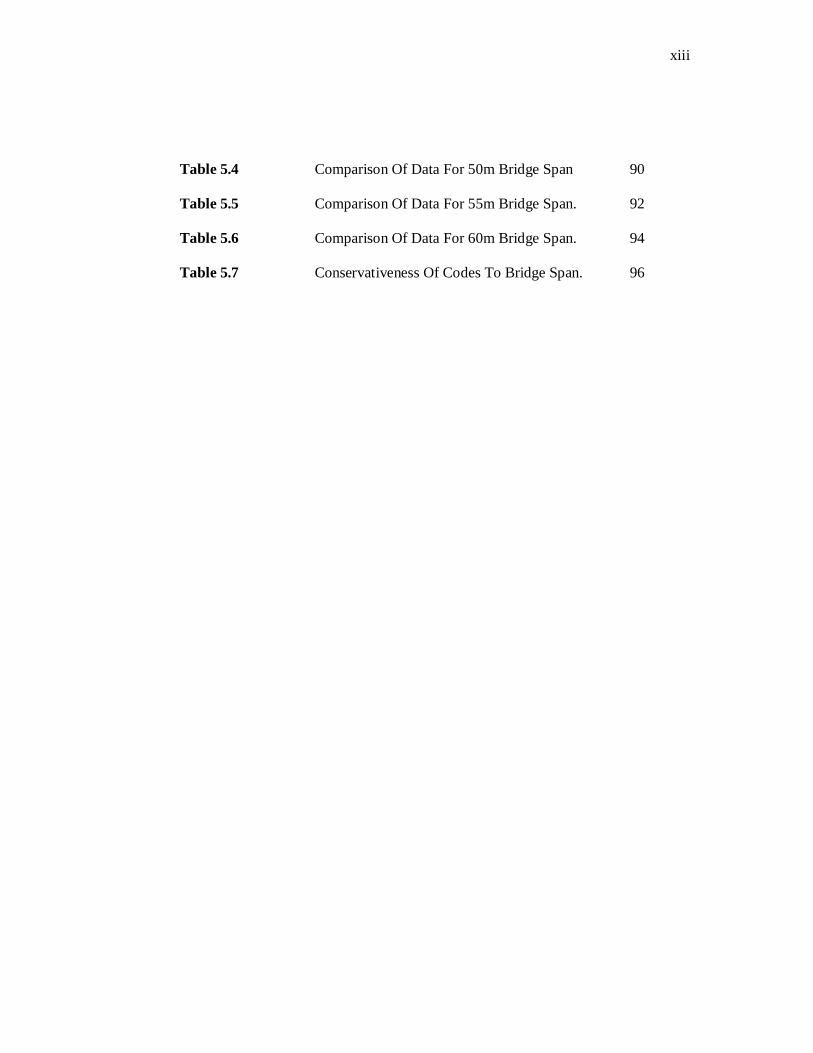
Table 5.4 Comparison Of Data For 50m Bridge Span 90
Table 5.5 Comparison Of Data For 55m Bridge Span. 92
Table 5.6 Comparison Of Data For 60m Bridge Span. 94
Table 5.7 Conservativeness Of Codes To Bridge Span. 96

xiv
LIST OF FIGURES
LIST FIGURE TITLE PAGE
Figure 2.1 Service Life Model of RC Bridge Decks 14
Exposed To Various Risks
Figure 2.2 Basic Concept of Structural Reliability 18
Figure 2.3 System Reliability Index Vs. Girder Reliability 37
Index.
Figure 2.4 Density Function Of Load fλ After N= 105 38
Simulations.
Figure 2.5 Cumulative Density Function Of Load Fλ 39
With N=105
Figure 2.6 Fatigue Reliability Of Bridges In 50 years 40
Figure 2.7 Reliability Indexes For Various Code Of Practice 41
Figure 3.1 Location Of Distributed and Knife Edge Loads 44
To Produce Maximum Mid Span Moment.
Figure 3.2 Uniformly Distributed Loads On Notional Lanes 45
To Produce Maximum Mid Span Moment.
Figure 3.3 HA UDL & KEL With Loaded Length 46

xv
Figure 3.4 Footway Distributed Load 47
Figure 3.5 Typical Load Diagram For Arbitrary Bridge 48
Figure 3.6 Distribution Functions 55
Figure 3.7 Histogram Frequency Distribution For 35m Bridge 56
Span With Loads And Load Factor To AASHTO.
Figure 3.8 Probability Curve For 35m Bridge Span With 57
Loads And Load Factor To AASHTO.
Figure 4.1 Comparison Of Bridge Span To Load Factor 64
: (BS5400 Pt.2)
Figure 4.2 Comparison Of Bridge Span To Load Factor 65
: AASHTO
Figure 4.3 Comparison Of Bridge Span To Load Factor 66
: OHBDC
Figure 4.4 Comparison Of Bridge Span To Load Factor 67
: Eurocode
Figure 4.5 Comparison Of Bridge Span To Load Factor 68
: Austroads
Figure 4.6 Comparison Of Bridge Span To Load Factor 69
: JKR
Figure 5.1 Comparison Of Reliability Based Live Load 73
Factor For Various Codes.
Figure 5.2 Reliability Based Reduction Factor In Live Loads 75
Figure 5.3 Comparison Of Bridge Span To Load Factor 77
: BS5400 Pt.2

xvi
Figure 5.4 Comparison Of Bridge Span To Load Factor 78
: AASHTO
Figure 5.5 Comparison Of Bridge Span To Load Factor 79
:OHBDC
Figure 5.6 Comparison Of Bridge Span To Load Factor 81
: Eurocode
Figure 5.7 Comparison Of Bridge Span To Load Factor 82
: Austroads
Figure 5.8 Comparison Of Bridge Span To Load Factor 84
: JKR
Figure 5.9 Load Factor Variance (%) For 35m Bridge Span 86
Figure 5.10 Load Factor Variance (%) For 40m Bridge Span 87
Figure 5.11 Load Factor Variance (%) For 45m Bridge Span 89
Figure 5.12 Load Factor Variance (%) For 50m Bridge Span 91
Figure 5.13 Load Factor Variance (%) For 55m Bridge Span 93
Figure 5.14 Load Factor Variance (%) For 60m Bridge Span 95

NOMENCLATURES
(S) - loads
(R) - resistance
Pf - probability of failure
φ - resistance factor
γi - load factor
Rn - nominal design resistance
Sn - nominal load effects
G ( ) - limit state function
xi - random variable
μx - mean value
n - number of observation
Var (x) - variance
σx - standard deviation
COV - coefficient of variation
∞ - infinity
mx - random variable of moment
β - reliability index
Φ-1 - inverse standard normal distribution function
∂ - partial differential
fcu - concrete strength
fy - steel strength
λ - bias factor
γf3 - live load factor
Mav - average moment

xviii
l - length
b - breath/width
d - effective depth
fcn - complementary function
ULS - ultimate limit state
SLS - serviceability limit state
f ( ) - probability density function
∑ - summation equation
E (x) - expected value of X
PDF - probability density function
CDF - cumulative density function
(N) - number of iterations
w - loads
KEL - knife edge load
M - moment
M (x) - mid span moment distribution
% - percentage
e - exponent
Z - safety margin
mR - mean of resistance
mS - mean of loads
ln - lognormal
UDL - uniformly distributed loads
xix
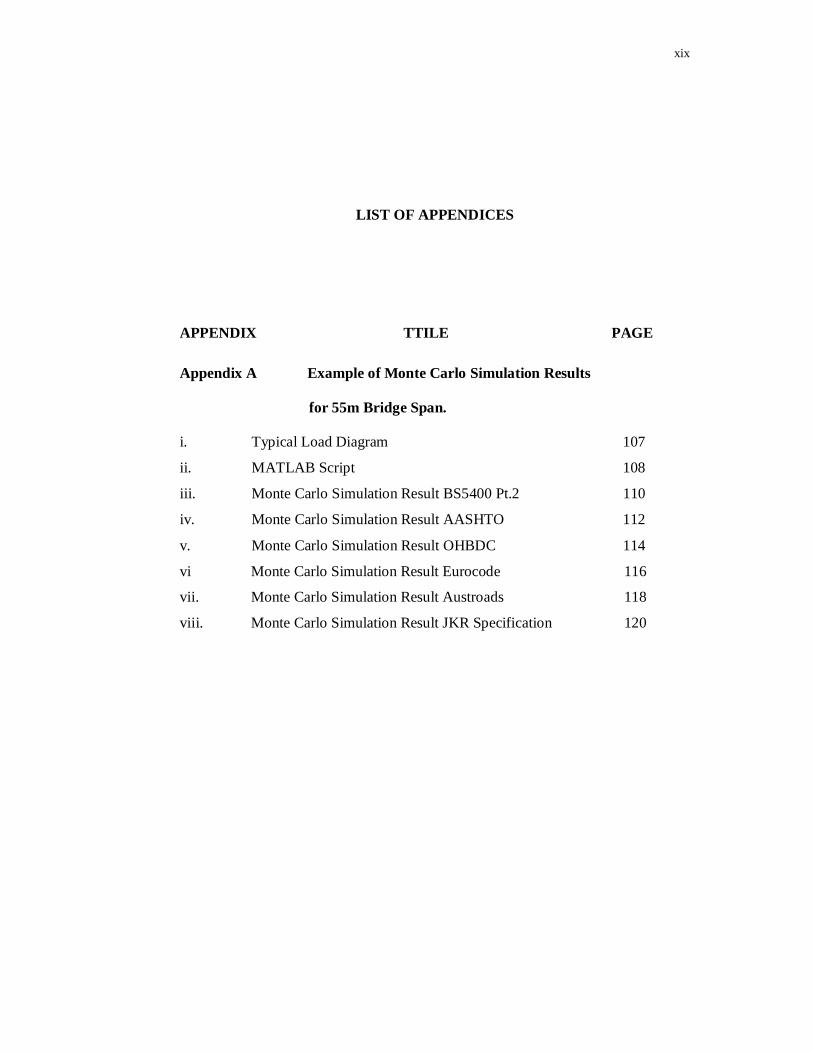
LIST OF APPENDICES
APPENDIX TTILE PAGE Appendix A Example of Monte Carlo Simulation Results
for 55m Bridge Span.
i. Typical Load Diagram 107
ii. MATLAB Script 108
iii. Monte Carlo Simulation Result BS5400 Pt.2 110
iv. Monte Carlo Simulation Result AASHTO 112
v. Monte Carlo Simulation Result OHBDC 114
vi Monte Carlo Simulation Result Eurocode 116
vii. Monte Carlo Simulation Result Austroads 118
viii. Monte Carlo Simulation Result JKR Specification 120

CHAPTER 1
INTRODUCTION
1.1 General Introduction
Highway bridges and associated structures in some ways influence the visual
quality of our surroundings with their sophisticated appearance and they are in fact
highly functional artifacts with long service life which, is regularly used and seen by
the masses. Highway bridges are critical link and form a considerable investment in
infrastructure that should be kept safe and serviceable. The design aspects of
highway bridges on the other hand are influenced by the application of loads and
these form the fundamental data in designing the bridge. The basic philosophy of the
application of loads is that the worst case scenario of the loads is taken as the basis
of the bridge design.
The last ten (10) years has seen the rapid development of reliability based
assessment methods to help engineers tackle the analysis, quantification, monitoring
and assessment of structural risks, undertake sensitivity analysis of inherent
uncertainties and make the appropriate decisions about the performance of a
structure.
2
The structure maybe at the design stage, under construction or in actual use.
Highway bridge damage or failure especially those involving the loss of life, are
very rare and usually have causes outside the realm of typical design specifications.
The primary emphasis in bride design is the application on live loading effects and
in this instance the reliability with respects to live loadings due to HA and HB loads
(Frangopol, 1999). Highway bridges assessed with the reliability methods have been
found to be structurally deficient and required replacement to allow them to carry
modern truck traffic and the increase in annual traffic (Ibid). The cost to the relevant
infrastructure agencies to rehabilitate these bridges is enormous. In short, reliability
methods used in highway bridge design can be an effective method in producing a
high degree of performance structure which is cost effective. This forms the
quintessential requirement of awareness in using the reliability methodology to
highway bridge design.
1.2 Background of The Problem
Recent studies undertaken in the United States and Europe have shown that
there are many highway bridges rated as structurally deficient requiring
rehabilitation or replacement to allow them to carry increased traffic flow and
modern trucks loads (Nowak, 2000). The deficiency of these highway bridges are
primarily from the live loading effect and not from the threats like corrosion,
collision, wind and scouring. There is now an underlying realization that the
analytical techniques developed for the bridge design are in many cases unable to
accurately model the structural behavior of highway bridges.

3
This has resulted in underestimating the actual load capacity of bridge girders in the
design assessments. In the design of highway bridges the designer must have an
understanding of the types and magnitude of the loads that are expected to act on the
bridge during its lifetime. It has been expounded earlier that the basis of bridge
design relies on the worst case loading scenario or in other words, load combinations
giving the worst bending moments and stresses. The HA and HB loads used in
combinations are derived from the British Standard 5400 (Part 2) or from local
specification such as JKR which uses LTAL and SV loadings in lieu of HA and HB
loads although both uses the same methodology to derive the ultimate and
serviceability limits. There are five (5) load combinations and combinations one (1)
to three (3) are called the principle combinations while combinations four (4) and
five (5) are called the secondary combination. These formed the basic data to assess
the bridge comparing it to the ultimate or the serviceability limit state. This method
of analysis can be described as deterministic, resulting in bridges that are an
underestimation of the actual load carrying capacity. The fact that the loading
combinations are random variables and thus absolute safety or zero probability of
failure cannot be achieved. Vehicle comes in various shapes and sizes, traffic
passing over a bridge fluctuates with time and at any given time it is impossible to
quantify the number of vehicles and its specifications passing over a bridge. This
makes the load a random variable.
The loading on a highway bridge is further compounded by the issue of
heavy vehicles being modified to carry heavier loads either legally or illegally (lorry
hantu, overloading of lorries etc.).

4
The HB or SV loads are thus constantly changing compared to what is given in the
codes and specifications. This uncertainty in the context of codes and specification is
taken care by the “safety factor” however; the accuracy of using this safety factor is
subjective and cannot be taken as the absolute although engineers design with the
later in mind.
In many cases, the bridges will exhibit no outward signs of distress.
Although this does not, in itself, imply that failure may not be imminent; it is likely
that some form of damage or significant deformation will precede collapse in cases
of ductile failures of concrete bridge girders. This brings into question the
appropriateness of using elastic analysis for the determination of ultimate strength
for many types of bridges; and in particular short span concrete bridge girders which
have been found to be deficient in flexure (Thoft-Christensen, 1999).
Clearly there is a need to review and refine the existing methods and to
develop improved techniques which can more realistically model the ultimate load
capacity of bridges. Current codes of practice are written with the implicit
assumption that the design and assessment of bridges will usually be undertaken
using linear elastic analysis techniques. Elastic theory is well established and is
supported by many computer software packages, and has been found most
satisfactory for the design of bridges. As a lower bound method the engineer can be
confident that the analysis method should be conservative and hence safe.

5
The questions that are glaringly unanswered are what does “failure” actually mean
in an elastic analysis and what are the consequences of such failure in terms of both
risks to life and economic terms? The conventional approach to the assessment of
concrete bridge deck is to initially perform a simple elastic beam analysis using a
representative strip of the bridge girder.
If this “quick” check shows that the structure to be inadequate, a more
detailed linear elastic analysis allowing for transverse distribution of loads would
probably be performed using either a grillage or finite-element analysis. These
results are then examined to identify individual locations at which the maximum
calculated moments or shears exceed the estimated ultimate capacity of the section.
The decision to strengthen or replace a structure is commonly made on the basis of
these results. Transverse steel bars, shear bars are added to the bridge girder to
supplement this deficiency.
In reality concrete structures will crack under heavy loads resulting in a
change in stiffness of the bridge girder. Even when the ultimate moment capacity of
a section of the bridge girder is exceeded, loads will be redistributed elsewhere in
the deck slab provided that the deck possesses sufficient ductility and it does not fail
prematurely in shear. As a result, linear elastic analysis will not accurately model the
distribution of stresses or the actual behavior in the post-elastic range where non-
linear effects dominate. Elastic methods can be very conservative since failure of
one element in the structure is typically used to define failure of the structure as a
whole. In the cases of flexural failure, the consequences are likely to be small and
only may affect the serviceability of the structure.

6
If one accepts the that serviceability criteria does not govern and collapse is a
criterion on which to base the assessment, such conservativeness is not warranted for
concrete bridge girder for which ductile flexural failure is the critical mechanism of
failure. Once an individual section has reached ultimate or yield capacity, the failure
must develop into full collapse mechanism before the structure will actually fall
down (Melchers, 1987). Elastic models are still relied upon as the primary analyses
tool for assessing concrete bridge girder and full scale loads tests conducted shows
that concrete bridges are often able to carry loads well in excess of the “theoretical”
capacity calculated using this technique (Ibid).
It is thus important to investigate the options available to an engineer if some
form of alternative assessment can be carried out in tandem with his elastic models.
Reliability modeling and assessment is an appropriate solution to the problem of
quantifying the variables (loading in this case) and providing an accurate range of
limit states based on primary highway loadings. The probability of failure of bridge
decks can be predicted with high accuracy using the reliability based assessment.
The research problems can be summarized as follows;
i) The primary highway loadings (HA loads) given in the relevant codes
are random variables and thus cannot be quantified in a deterministic
manner. What is the best approach in modeling this variable?
ii) How do we evaluate the load models that has been developed in (i)
above?

7
iii) How do we measure the probability of failure of the bridge girder
arising from primary highway loadings (HA loads)?
iv) Are there any difference between the various codified approach to
bridge girder analysis (ULS and SLS methods) and the reliability
based approach to analyze a bridge girder? If there are, what are the
major differences?
v) How the implementation of reliability based modeling and evaluation
of bridge girder based on primary highway loading can enhance the
overall safety level of a bridge girder?
vi) Are there any imminent cost saving arising from using reliability
based assessment in bridge girder analysis?
1.3 Objectives of Study
The objectives of this study are to;
i) Conduct an investigation approach to formulate the various load
factor models from various codes which can be used to analyze
maximum mid span moment effects on a standard prestressed bridge
girder beam.
ii) Assess the reliability of the standard bridge girder based upon the
load models and load factors given by various codes and
specifications namely JKR, BS 5400 Part 2, AASHTO, Eurocode,
Austroads (Australian Highway Code) and Canadian Code
(OHBDC).

8
1.4 Scope of Study
The scope of study covered literature review from various sources and codes
of practice namely BS 5400 Part 2, JKR specifications, AASHTO, Eurocode,
Austroads (Australian Highway Code) and Canadian Codes specification on primary
loadings (HA loads) and their respective load factors. This study carried out a
statistical approach to model primary loadings (HA loadings) to highway bridge
girders and evaluate the result with the conventional elastic analysis approach to
bridge girder designs. The data for the conventional and reliability based method of
analysis are based on an arbitrary data as follows;
1) Bridge Span = 42 meters.
2) Carriageway Width = 12 meters
3) Footway width at both shoulders = 2 meters.
4) Bridge Girder = Standard Prestressed Girder Beam.
Computer software namely MATLAB Ver. 6.5.1 was utilized to run statistical
process (probabilities) approach to model the maximum moments at mid span
arising from primary highway loadings (HA & KEL loads). The results from
utilizing various load factors from the codes will then be compared to the
conventional elastic model analysis of the bridge girder. This would result in some
difference which then can be used to evaluate which codes gives rise to a
conservative design and which codes give rise to a permissible design.

9
The reliability based assessment of bridge girder data would be crossed referenced
with the most permissive code to check if there are can be any significant reduction
in member size and subsequent cost savings.
Finally the scope of study demonstrated that by using the reliability based
assessment of highway bridge decks, can supplement if not enhance the final
analysis for any bridge girder.
1.5 Importance of Study
This study basically showed on how to model primary highway loads (HA
loadings) to bridge girder using reliability approach (probability approach) and how
to evaluate the models based on the load factors given in various codes mentioned
above. The data from reliability analysis could perhaps be used to develop reliability
based design codes or it can be used to supplement the load factors used in the
various codes.
The result data from the reliability analysis can be used by design engineers to
enhance their decision making in analyzing highway bridge girders. This would in
some parameters benefit engineers to improve their accuracy and reduce some
uncertainties in the design of highway bridges. Lastly on the whole the design would
be envisaged to be safe for its lifetime and cost effective.
10
1.6 Limitations of Study
The limitation of this study is that other loads such as transient highway
loadings such as wind loads, collision loads, dynamic effects, scouring, braking and
centrifugal loads, shrinkage and thermal effects are not considered in this study. This
is primarily due to the fact that modeling these loads would be too large an endeavor
to undertake. Therefore only primary highway loading namely HA, KEL and
Footway Loading are taken into account to demonstrate highway bridge load
modeling.
1.7 Thesis Organization
This thesis is organized into six (6) chapters. Chapter one (1) will consist of
the problem background, research objectives, scope and importance of the study and
the limitations. Chapter two (2) covers literature review which, discusses the topic of
reliability assessment methods, primary bridge loadings , elastic analysis of bridge
deck using ULS (Ultimate Limit State) and SLS (Serviceability Limit State) and the
current practice of reliability analysis on bridge decks. Chapter three (3) presents the
methodology in basic theory of reliability engineering on modeling of primary loads
(HA loads) for an arbitrary bridge. Chapter four (4) would present the comparison
data from reliability assessment derived from the load factor from various codes on
bridge girders. The data would be tabulated and the major differences identified. The
differences in result would then be related to the design aspects to ascertain which
codes are permissible and which are deemed conservative.

11
Chapter five (5) would consist of the discussion of the results. Chapter six (6) will
consist of the conclusions and appropriate recommendations.

REFERENCES
Aktan, A.E, “ Conditional Assessment For Bridge Management”, American Society
Of Civil Engineers (ACSE) Publication, 1996, Vol 2, No.3, 108-117.
Allen, C.Estes, “Bridge Lifetime System Reliability Under Multiple Limit States”
Journal Of Bridge Engineering, November/December 2001, Vol 6, 523-528.
AASHTO LFRD Bridge Design Specifications, Washington D.C., 2004.
Barker, R.M and Puckett, J.J. “Design Of Highway Bridges”. Wiley. New
York.1997, 504-562.
Biondini, F. “Probabilistic Limit States Analysis Of Framed Structures” American
Society Of Civil Engineers (ACSE) Publication, 2003, Vol 2, 132-145.
Bryan, F.J. “Randomization And Monte Carlo Methods In Biology”. London
Chapman and Hall. 1991.
103
Casas, J.R. “Are Prestressed Highway Bridges Safe” IABSE Structural Engineer
International. 1997, in print.
Chan Hee Park, Casas, J.R and Nowak, A.S “Reliability Analysis of Bridge Girders,
A Comparison Of Code of Practice” 8th ACSE Conference On Probabilistic
Mechanics And Structural Reliability. 2000.
Colin, O.C and Peter A.S. “Bridge Loads, An International Perspective”. SPON
Press, London. 2000.
CHBDC, Canadian Highway Bridge Design Code, Canadian Standard Association,
Toronto, 2003.
ENV 1991-3 Eurocode 1: Basis of Design and Actions on Structures. Part 3: Traffic
Loads on Bridges. Final draft –August 1994.
Frangopol, Dan.M, “Bridge Safety and Reliability” American Society Of Civil
Engineers (ACSE) Publication, 1999.
Frangopol, Dan.M, “Condition Assessment Of Bridges” American Society Of Civil
Engineers (ACSE) Publication, 1999.
Goel, “Monte Carlo Simulation Based Customer Service Reliability Assessment”
Electric Power Systems Research. 1999, Vol 4, 253-256.

104
Haldar, A and Mahadevan, S. “Probability, Reliability And Statistical Methods In
Engineering Design”. New York. John Wiley & Sons. 2000.
Hamilton, W.C, “Statistics In Physical Science Estimation, Hypothesis, Testing And
Least Square” New York. The Ronald Press Company. 1964.
Hsu Yang Chang, Lance Manuel et.al “Reliability Based Design Of Steel Bridges
Under Fatigue Loading”. Journal Of Bridge Engineering. 2004, Vol 3, 321-
342.
Jabatan Kerja Raya (JKR), “Standard Specification For Road Works”, Arahan
Teknik Jalan, Kuala Lumpur. 2001.
Karoumi,R and James,G. “ Modelling And Reliability Assessment Of Traffic Loads
On Railway Bridges” Institute Of Technology, Stockholm. 1999.
Konig,G. and Nowak, A.S, “Bridge Rehabilitation”, Ernst & Sohn, Berlin,
Germany. 1992.
Lewis, E.E. “Introduction To Reliability Engineering”. 2nd Ed. John Wiley & Sons.
1994. 12-18
Lounis, Z. “A Stochastic and Multiobjective Decision Model For Bridges” Infra99
International Convention, Montreal. 1999, 1-12.
105
Melchers, R, “Structural Reliability Analysis and Prediction”, Chichester:Ellis
Hoswood Ltd. John Wiley & Sons. 1987.
Melchers, R, “Discussion On The Strategies And Value Of Risk Based Structural
Safety Analysis”, Structural Safety. 2000, Vol 2, 281-286.
Moses, F, “Bridge Evaluation” American Society Of Civil Engineers (ACSE)
Publication, 1999 in press.
Nowak, A.S and Yamani. “Probabilistic Models For Resistance Of Concrete Bridge
Girders” ACI Structural Journal, 1994, Vol.91.
Nowak, A.S, “Calibration Of LFRD Bridge Code” Journal Of Structural
Engineering, August 1995, 121(8):1245-1251.
Nowak, A.S. “System Reliability Model For Bridge Structures” Bulletin Of The
Polish Academy Of Sciences, Technical Science. November 2004, Vol 54
No.4.
OHBDC, Ontario Highway Bridge Design Code, Canadian Standard Association,
Toronto, 2003.
Robert, B.A, “The New Weibull Handbook”, 2nd Ed. North Plain Beach. 1996.

106
Rosowsky, D.V. “Structural Reliability” Structural Engineering Handbook.CRC
Press. 1999.
Ross, S.M, “Introduction To Probability Models” 7th Ed. USA. A Harcourt Science
And Technology Comp. 2000.
Rubinsten, R.Y, “Simulation And The Monte Carlo Method” 2nd Ed. New York.
John Wiley & Sons. 1981.
Saraf, V. and Nowak, A.S. “ Proof Load Testing Of Deteriorated Steel Girder
Bridges” American Society Of Civil Engineers (ACSE) Publication, 1998,
3(2), 82-89.
Susan E. Hilda. “Highway Bridge Loads And Load Distribution”. ” Structural
Engineering Handbook.CRC Press. 1999.
Standards Australia, Bridge Design – Part 2; Design Loads, 2000.
Thoft Christensen, P, “On Reliability Based Optimal Design of Concrete Bridges”,
Structures Congress, Philadelphia, May 1999, Vol 61, 387-402.