reliability of tantalum polymer capacitors - kemet · ©2004 component technology institute, inc.,...
TRANSCRIPT
©2004 Component Technology Institute, Inc., CARTS 2004 Conference, San Antonio, TXPage 1 of 8
Reliability of Tantalum Polymer Capacitors
Jonathan L. Paulsen, Erik K. Reed, Jeffrey N. KellyKEMET Electronics Corporation
PO Box 5928Greenville, SC 29606
Tel:864-963-6300Fax: 864-228-4333
[email protected], [email protected], [email protected]
Abstract
The demand for Low-ESR tantalum capacitors haspopularized the use of high conductivity conductivepolymer counter electrode designs over moreestablished manganese dioxide (MnO2) tantalums.While the reliability of MnO2 tantalums has beenwell studied, the expected performance of conductivepolymer tantalums is less understood. Tocharacterize the reliability of polymer tantalums,accelerated lifetesting utilizing high electric fieldstress and temperature is performed on multiple testsamples. The time-to-failure data is fit to a failuremodel and the model is then used to predict devicereliability under less strenuous conditions.Considering all the data, median life for the testsample at maximum rated conditions was found toexceed 300 years.
Introduction
Tantalum chip capacitors have been successfullymanufactured with manganese dioxide (MnO2) solidelectrolyte for decades and much has been learnedand published regarding their reliability in a widerange of applications. The push for lower equivalentseries resistance (ESR) in tantalum chip capacitorshas lead to the use of conductive polymers in place ofMnO2. Because the conductive polymers employedare significantly more electrically conductive thanMnO2, capacitors with equivalent series resistancebelow 10mΩ are possible.
Unfortunately, because of their recent introduction,not much is known about the inherent reliability oftantalum polymer capacitors. Moreover, theapplications in which low-ESR tantalum polymercapacitors are used are among the most demandingfrom a reliability perspective. So, just how reliableare tantalum polymer capacitors?
Manufacturers’ in-house reliability test results andearly field experiences with polymer capacitors arevery good, in most cases superior to similarly valuedcapacitors manufactured with MnO2. The purpose ofthis paper is to present reliability data from tantalumpolymer capacitors. Similarities in reliability toMnO2 are expected because of the dominantinfluence of the Ta2O5 dielectric which is largelyunaffected by the choice of solid electrolyte. Butdifferences do exist. By developing a framework foraccelerated lifetest analysis, this work aims tohighlight any differences from traditional tantalumcapacitors that may affect reliability.
System Description
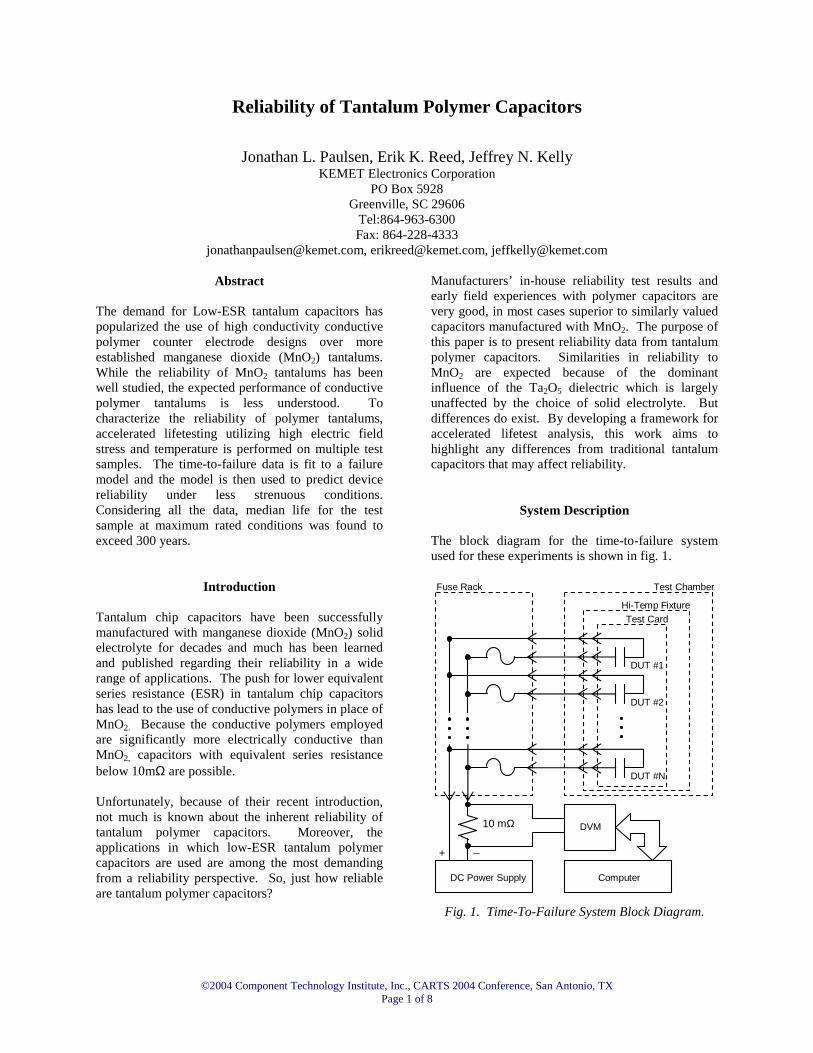
The block diagram for the time-to-failure systemused for these experiments is shown in fig. 1.
DVM
ComputerDC Power Supply
10 mΩ
Fuse Rack Test Chamber
Hi-Temp Fixture
DUT #1
DUT #2
DUT #N
+ _
Test Card
Fig. 1. Time-To-Failure System Block Diagram.

©2004 Component Technology Institute, Inc., CARTS 2004 Conference, San Antonio, TXPage 2 of 8
This test system comprises seven basic elements.The test parts are mounted onto test cards which areplaced into connectors mounted to a fixture withinthe test chamber. The test card fixture has multiple22 position connectors rated for use at hightemperatures (up to 200°C). The number ofconnectors within the system depends upon the sizeof the test chamber and the desired sample size forthe test. Fixtures used for these experiments rangefrom 5 to 12 connectors. The test chamber itself is ageneral purpose environmental chamber capable ofoperation at temperatures from -55°C to 250°C.Wires soldered to the high-temp connectors arerouted through a port in the test chamber to a rackoutside the test environment which holds 1 amp fusesconnected in series with each part under test. Eachtest part circuit has a resistance below 600mΩ. Theentire fuse rack is wired to the output of a DC powersupply. A 10mΩ current measurement resistor isplaced in series with the negative power supply lead.A high speed digital voltmeter is connected acrossthe 10mΩ resistor to measure any voltage caused bycurrent passing through the test system. Thevoltmeter communicates with a computer runningsoftware which detects failures as they occur andrecords their time relative to the start of the test.
System Operation
All devices arrived for testing sealed in an airtightbag and packed with desiccant. Once samplemounting on test boards was complete, unused partswere placed back in the sealed bag with desiccant tominimize moisture absorption during the experiment.Following mounting, all test samples were loadedinto the test fixture and the temperature in thechamber was bought up to test conditions (85° -165°C). After temperature stabilization, the output ofthe DC power supply was switched on and the digitalvoltmeter (DVM) began monitoring the voltageacross the current measurement resistor severalthousand times per second. Once the initial chargingtransient had faded, only a small amount of leakagecurrent would flow through the test circuit (typically100’s of microamps, depending on sample size). Asfailures occurred, the fuses blew open and currentspikes were detected by the DVM. The magnitude ofthese failure surges was far greater than thebackground leakage current. Fig. 2 shows a plot oftypical current history for one part during testing.Because of low sampling rate, the true peak currentof several amperes does not appear in the figure.
Current spikes from 3-4 amps for 120 millisecondswere common failure indicators.
0
20
40
60
80
100
120
140
0 1 2 3 4 5 6 7 8 9 10 11
Sampling Rate: Approx. 1 sec/sample
Time (hrs)
Cur
rent
(mA
)
Fig. 2. Failure Current versus Time.
When inserted into the oven fixture, all test cardswere arranged vertically, with 1” spacing betweenadjacent cards. All boards were arranged in paralleland then positioned with respect to airflow within thechamber for minimal temperature variation across thelength of the fixture. Results of this experimentindicate the temperature of the test samples does havea significant impact on their time-to-failure inaccelerated testing. Therefore, a temperaturevariation of less than 3°C across the entire fixturewas verified prior to testing.
80
90
100
110
120
130
140
150
160
170
180
0 1 2 3 4 5 6 7 8 9 10 11
Time (hrs)
Par
tTem
pera
ture
(°C
)
Fig. 3. Device-under-Test Temperature DuringFailure.
As shown in fig. 2, current through the test sampleswas observed to rise for several hours prior to failure.During this period, component self-heating due tohigh leakage current contributed to elevatedtemperatures within the parts themselves. Fig. 3

©2004 Component Technology Institute, Inc., CARTS 2004 Conference, San Antonio, TXPage 3 of 8
shows a plot of device temperature during its failureperiod.
Airflow in the chamber and self-heating introducetwo complicating factors into the data analysis of thisexperiment. First, self-heating clearly elevates thepart temperature above the intended test temperature.Although this effect certainly occurs in conventionaldevice applications during failure, it makes theprocess of predicting performance at differentconditions more difficult. Ultimately, this selfheating causes an interaction between temperatureand voltage that is shown to affect test results.Secondly, the carefully controlled airflow in the testchamber may also contribute to experimental error.An argument could be made that most tantalumcapacitors do not benefit from such efficient aircooling during normal use. While this airflow helpsmaintain the proper temperature during the initialphases of the accelerated testing, it may serve to coolthe part during its self-heating phase and artificiallyprolong its life.
Occasionally, a test part would begin to pullexcessive current during its failure phase, but internalheating would quickly cause the conductive materialswithin the part to change and detach from the outercontacts before the series fuse could blow. This “failopen” condition would produce visible damage to thefuse wire and indicate a failure on the tester. Fig. 4displays a fuse damaged in this way as well as fuseappearance during other phases of testing. Despitefuse survival in these cases, the parts were stillregarded as failures due to their initial internalshorting and resulting open condition.
Fig. 4. Fuse Appearance for Normal, Blown andDamaged Conditions.
Failure Modeling
Accelerated lifetest analysis of tantalum capacitorswith MnO2 counter electrodes has traditionally beenaccomplished using Weibull failure rate grading asoutlined in military performance specification39003J. The capacitors were exposed to a multipleof rated voltage, typically 1.1 to 1.5 times ratedvoltage, and tested at 85°C until a sufficient numberof failures were observed for calculations. Theacceleration of time-to-failure for each test batch wasobtained using equation (1). This equation, devisedby the Crane Laboratory of the Naval WeaponsSupport Center in the late 1970’s, utilizes valuesderived by combining the results of acceleratedlifetest results from many tantalum capacitor samplesfrom multiple manufacturers.
r
a
V
V
eA×
−×=77249321.18
91003412025.7 (1)
Experimental data collected over the years has raisedquestions regarding the validity of this formula.Subsequent investigations have demonstrated that theacceleration factor can vary widely from batch tobatch among similar parts; even from the samesupplier. The attempt to combine the results of manybatches from many manufacturers resulted in anequation that did not apply particularly well to anytraditional tantalum part type with the amount ofprecision suggested in the formula.
Even though the validity of the acceleration formulawas suspect, observed failure rates in MnO2
tantalums were typically low enough toaccommodate a large margin of error withoutconcern.
MnO2 counter electrode tantalums generallydemonstrate declining failure rates in Weibullgrading tests. In many of these cases, however, adistinct wearout phase was never observed, perhapsbecause the tests were not long enough at the givenconditions. In the absence of observed wearout, andin the presence of declining failure rate, characteristiclifetimes were projected to be incredibly long. But itis suspected that at some point wearout would beobserved. In this experiment, tantalum capacitorsmade with conductive polymer counter electrodeswere lifetested with enough acceleration to actuallyreach wearout within a reasonable timeframe.Observing all the failure modes in these devices,including wearout, suggested the use of a different,more accurate acceleration model.

©2004 Component Technology Institute, Inc., CARTS 2004 Conference, San Antonio, TXPage 4 of 8
An established formula for modeling acceleration intime for capacitor lifetest failures as a function ofvoltage and temperature is the equation proposed byProkopowicz and Vaskas, shown in equation (2).1
−
== 21
11
1
2
2
1 TTk
Ea
eV
V
t
tA
η
(2)
This model has been used successfully for years withmultilayer ceramic capacitors to interpret results fromaccelerated testing and to predict typical capacitorlifetimes.2 The formula relates the ratio of differenttimes-to-failure to the applied voltage and ambienttemperature of two different test conditions. Theformula can be broken into two parts. The power lawportion of equation (2) quantifies time-to-failureacceleration due to the ratio of two voltages. Thevoltage stress exponent in the power law equation, n,must be experimentally derived. The second half ofequation (2) accounts for time-to-failure accelerationdue to changes in absolute temperature. This portionof the relation is modeled by an Arrhenius equation.The activation energy in the Arrhenius equation, Ea,must also be derived experimentally before equation(2) can be used.
The constant, k, is Boltzmann’s constant. Theapproximate value for k is shown in equation (3).Absolute temperature in Kelvins is the temperature inCelsius degrees plus 273.
KeVk /106.8 5−×= (3)
The Prokopowicz and Vaskas equation offers severaladvantages over the older Weibull grading formula.While the older formula was intended only for testtemperature of 85°C, equation (2) accommodates anytemperature in its calculation. Also, unlike equation(1), the Prokopowicz and Vaskas model is not basedon a fixed level of performance measured only at onepoint in time, but rather has parameters that can beadjusted to reflect evolutionary changes in capacitordesign and performance. To use equation (2), thevoltage stress exponent and activation energy mustfirst be found from experiments. Although this maynecessitate more work initially, it produces moreaccurate acceleration factors and more realisticcomponent lifetime predictions.
The time-to-failure data produced in this experimentwas plotted on lognormal graphs rather than Weibull
plots. Previously, time-to-failure data for tantalumcapacitors was generally fit to a Weibull distributionfor analysis. For Weibull plots, the statistic t63.2, orcharacteristic life, is chosen rather than the medianlife, t50. The time-to-failure data collected in thisexperiment was initially fit to both Weibull andlognormal distributions. Upon review, the lognormaldistribution provided superior fit to the data. As aresult, the median life statistic, t50, was used tocalculate the voltage stress exponent as well as theactivation energy for use in equation (2).
Because median life is used for the times-to-failure, t1
and t2, in equation (2), calculations from equation (2)produce median life predictions at other levels oftemperature and voltage stress. A note of caution, thestatistic t50 should not be confused with the statisticmean-time-to-failure (MTTF) which is more properlyused to describe devices whose lifetimes have anexponential distribution and which display a constantfailure rate.3
Analysis of Time-To-Failure Data
Figure 5 contains all the time-to-failure data collectedfrom a batch of KEMET B-case, 100µF, 6Vconductive polymer tantalum capacitors. Althoughthe data shown in fig. 5 will be presented in smallergroups subsequently, all the data sets share certaincharacteristics which can be observed collectively.Each line represents a sample of parts tested at aparticular voltage and temperature. The parallelnature of all the data sets and the straight linesformed by the data points suggest that all failureswere due to the same failure mechanism. The onsettime of this failure mechanism varied due the totalstress applied to each test group.
Three failure mechanisms are of interest whenlifetesting tantalum capacitors: infant mortals, freaks,and wearout failures. Infant mortals contain majorconstruction defects and never function properly.Freak failures have minor construction defects thatwill eventually cause failure, but perhaps years afterinitial usage. Wearout failures, the focus of thisexperiment, only occur after the dielectric within thecapacitor changes as a result of applied electric fieldstress and temperature. All three mechanisms can beobserved in lognormal plots of the time-to-failuredata produced in accelerated testing. Once graphed,each failure mechanism will appear as asubpopulation requiring a different fit line.

©2004 Component Technology Institute, Inc., CARTS 2004 Conference, San Antonio, TXPage 5 of 8
0.01%
0.1%
1%
5%10%
20%30%
50%
70%80%
90%95%
99%
99.9%
99.99%
0.01 0.1 1 10 100 1000
Time (hours)
Nor
mal
Per
cent
ile
Fig. 5. Lognormal Plot of Failure Percentile versusTime-To-Failure for KEMET Polymer TantalumCapacitors.
Referring to the data presented in Fig. 5, a few of thedatasets appear to contain freak failures, theirpresence causing a slight curve at the bottom of thedistribution. Causes for these failures are importantfor overall reliability assessments, but have beenignored here to focus attention on the wearout failuremode.
0.01%
0.1%
1%
5%10%20%30%
50%
70%80%90%95%
99%
99.9%
99.99%
0.01 0.1 1 10 100 1000
9.6V, 105°C10.8V, 105°C11.4V, 105°C12.0V, 105°C12.6V, 105°C
9.6V10.8V
11.4V12.0V
12.6V
Time (hours)
Nor
mal
Per
cent
ile
Fig. 6. Lognormal Plot of Failure Percentile versusTime-To-Failure at 9.6V, 10.8V, 11.4V, 12.0V, and12.6V for Tests Done at 105°C.
The methodology of this accelerated testing is asfollows: (1) multiple failure distributions aregenerated at various combinations of voltage andtemperature (usually above rated values), (2) thedegree of acceleration caused by changes in voltageand absolute temperature (observed separately) isquantified as the ratio of the median lifetimes, and (3)values of n and Ea are determined so as to best fit theacceleration equation to the experimental data. Theobjective of this accelerated testing is to predict the
t50 of devices under normal, non-acceleratedoperating conditions by applying equation (2) withthe derived values of n and Ea and the known medianlife under accelerated conditions.
Data collected at 105°C and five voltages appear infig. 6. The similarity between the series is clear.Based on the well behaved nature of the data, itseems reasonable to project that further decreases intest voltage would produce failure distributionswhose only difference would be longer median life.
0.01%
0.1%
1%
5%10%20%30%
50%
70%80%90%95%
99%
99.9%
99.99%
0.01 0.1 1 10 100 1000
8.4V, 125°C9.6V, 125°C
10.8V, 125°C
8.4V9.6V10.8V
Time (hours)
Nor
mal
Per
cent
ile
Fig. 7. Lognormal Plot of Failure Percentile versusTime-To-Failure at 8.4V, 9.6V, and 10.8V for TestsDone at 125°C.
0.01%
0.1%
1%
5%10%20%30%
50%
70%80%90%95%
99%
99.9%
99.99%
0.01 0.1 1 10 100 1000
6.0V, 145°C7.2V, 145°C8.4V, 145°C9.6V, 145°C
10.8V, 145°C
6.0V7.2V8.4V9.6V
10.8V
Time (hours)
Nor
mal
Per
cent
ile
Fig. 8. Lognormal Plot of Failure Percentile versusTime-To-Failure at 6.0V, 7.2V, 8.4V, 9.6V, and 10.8Vfor Tests Done at 145°C.
Figs. 7 and 8 show additional data collected atconstant temperatures in which the voltage waschanged for each dataset. In each plot, the mediantime-to-failure for the groups changes proportionallyto the test voltage. The uniformity of the shiftssuggests predictable improvements from changes to

©2004 Component Technology Institute, Inc., CARTS 2004 Conference, San Antonio, TXPage 6 of 8
lower voltages as long as the percentage of thedownward shifts is chosen consistently.
Fig. 9 is a plot of median life, t50, versus test voltageat 85°C, 105°C, 125°C, 145°C, and 165°C. In thisfigure, each failure distribution discussed in figs. 6-8is represented by its t50 point. These points areplotted on “log-log” scale to allow the time-ordereddata points to fall into straight lines. Lines whoseslope represents the voltage stress exponent fromequation (2) can be estimated using these t50 points.
10-1
101
103
105
107
1.0 1.5 2.0 2.5 3.0
165°C, η =10.5145°C, η =12.5125°C, η =14.5105°C, η =16.585°C, η =19.0(85°C) y=9.00e6x-19
(105°C) y=2.00e5x-16.5
(125°C) y=1.20e4x-14.5
(145°C) y=6.50e2x-12.5
(165°C) y=7.95e1x-10.5
X X
8.0hr
650hr
1.4yr
23yr
1027yr
165°C
145°C
125°C
105°C
85°C
Multiple of Rated Voltage
Med
ian
Life
[t 50](
hrs)
Fig. 9. Plot of Median Life versus Test Voltage at85°C, 105°C, 125°C, 145°C, and 165°C on Log-LogScale.
The values for the voltage stress exponent range from10.5 to 19. This lack of consistency from group togroup represents an interaction between test voltageand temperature not considered in the accelerationformula. Recall from figs. 2 and 3 that devicetemperature rises above the ambient test temperaturedue to internal heating. This heating results fromhigh leakage current. The leakage, power dissipated,and the resulting temperature rise increase with risingtest temperature and test voltage. Thus testtemperature and test voltage are not truly independentstress factors since both act to increase the coretemperature of the capacitor above the ambient testtemperature, thus elevating the overall stress level.This interaction produces lower than expected life astemperature and voltage increase. Regardless, themedian life data points for tests conducted at aconstant temperature show consistent behavior whichcan be characterized and predicted.
The x-axis of fig. 9 extends down to rated voltage.This enables an estimate of life test performance atthe maximum rated conditions for the parts.Following the line of 85°C results back to the rated
voltage point, the fit line indicates these parts wouldreach their t50 after 1027 years at maximum ratedconditions. Going further, if half-rated voltage isused, the t50 estimate stretches into the millions ofyears.
Notice that the t50 point at 1.2Vr in the 125°C datadoes not fall on the line for that distribution.Likewise, the t50 point at 1.0Vr in the 145°C datafalls short of predictions based on data for thattemperature taken at other voltages. A follow-upinvestigation into this discrepancy has revealed themounting conditions for these two sample groups tobe slightly different from the rest of the test groups.Subsequent testing of capacitors from a related batchhas shown that results for these conditions shouldhave fallen closer to the values predicted by the testsdone at the same temperature, but higher voltages.The correct position for the 125°C and 145°C datapoints are approximately 850 hours and 690 hoursrespectively (marked by X’s on the graph).
We might also be curious about the expected timeuntil the onset of wearout at maximum ratedconditions in addition to median life. Judging fromfigs 6-8, the bulk of the failure distributions showngenerally occupy less than a decade of time. Bearingthis in mind, a safe estimate for the onset of wearoutis one-half decade prior to the projected median life(roughly a factor of 3). So, a conservative estimatefor the onset of failures would be t50/3. For thesecapacitors at maximum rated conditions, we canexpect to start seeing failures after 342 years of use.
0.01%
0.1%
1%
5%10%20%30%
50%
70%80%90%95%
99%
99.9%
99.99%
0.01 0.1 1 10 100 1000
8.4V, 125°C8.4V, 145°C8.4V, 165°C
125°C145°C165°C
Time (hours)
Nor
mal
Per
cent
ile
Fig. 10. Lognormal Plot of Failure Percentile versusTime-To-Failure at 125°C, 145°C, and 165°C forTests Done at 8.4V.
The next three figures will focus on temperatureacceleration rather than voltage acceleration. The

©2004 Component Technology Institute, Inc., CARTS 2004 Conference, San Antonio, TXPage 7 of 8
same time-to-failure information will be used, but thedata will be grouped by voltage rather thantemperature. The goal is to calculate the activationenergy for equation (2). Figure 10 shows all time-to-failure data collected at 8.4V (1.4 times ratedvoltage) with each data series representing a differenttemperature.
Figs. 11 and 12 contain data collected at 9.6V and10.8V, respectively. Again, it is clear to see that allthe distributions are similar as the temperature ischanged from 85°C to 145°C. Given the consistentnature of the data, it seems reasonable to project thatfurther decreases in temperature would producefailure distributions with longer median life.
0.01%
0.1%
1%
5%10%
20%30%
50%
70%80%
90%95%
99%
99.9%
99.99%
0.01 0.1 1 10 100 1000
9.6V, 85°C9.6V, 105°C9.6V, 125°C9.6V, 145°C
85°C
105°C125°C145°C
Time (hours)
Nor
mal
Per
cent
ile
Fig. 11. Lognormal Plot of Failure Percentile versusTime-To-Failure at 105°C, 125°C, and 145°C forTests Done at 9.6V.
0.01%
0.1%
1%
5%10%20%30%
50%
70%80%90%95%
99%
99.9%
99.99%
0.01 0.1 1 10 100 1000
10.8V, 85°C10.8V, 105°C10.8V, 125°C10.8V, 145°C
85°C105°C125°C
145°C
Time (hours)
Nor
mal
Per
cent
ile
Fig. 12. Lognormal Plot of Failure Percentile versusTime-To-Failure at 85°C, 105°C, 125°C, and 145°Cfor Tests Done at 10.8V.
Fig. 13 is a plot of median life versus inverseabsolute temperature at 1.0Vr, 1.2Vr, 1.4Vr, 1.6Vr,
1.8Vr, 1.9Vr, 2.0Vr, 2.1Vr, and 2.2Vr. As in fig. 9,each failure distribution discussed in figs. 10-12 hasbeen reduced to a single statistic, t50. The t50 pointsare plotted on a “semi-log” scale to linearize theArrhenius temperature factor in equation (2). Ninelines have been fitted to the data points. Since thereis only one data point for the 1.9Vr and 2.2Vr tests,these lines borrow their slope from adjacent datasets.Given the similar slope of the lines, this assumptionseems reasonable. Equations for all the lines in fig.13 appear in table I.
Table IACTIVATION ENERGY AND LINE EQUATIONS
FOR TEMPERATURE ACCELERATIONTest Bias Act. Energy Fit Line
1.0Vr Ea = 1.75eV y = 16.5*exp[(1.75/8.63)*(x-2.2)*100]1.2Vr Ea = 1.55eV y = 3.0*exp[(1.55/8.63)*(x-2.2)*100]1.4Vr Ea = 1.40eV y = 0.6*exp[(1.40/8.63)*(x-2.2)*100]1.6Vr Ea = 1.25eV y = 0.14*exp[(1.25/8.63)*(x-2.2)*100]1.8Vr Ea = 1.25eV y = 0.0225*exp[(1.25/8.63)*(x-2.2)*100]1.9Vr Ea = 1.25eV y = 0.008*exp[(1.25/8.63)*(x-2.2)*100]2.0Vr Ea = 1.25eV y = 0.00325*exp[(1.25/8.63)*(x-2.2)*100]2.1Vr Ea = 1.25eV y = 0.00125*exp[(1.25/8.63)*(x-2.2)*100]2.2Vr Ea = 1.25eV y = 0.00045*exp[(1.25/8.63)*(x-2.2)*100]
10-5
10-2
101
104
107
2.2 2.3 2.4 2.5 2.6 2.7 2.8
XX
Corrected Lines*See Text*
85°C105°C125°C145°C165°C
2.1Vr1.9Vr
1.4Vr
1.0Vr
1.2Vr
1.6Vr 2.2Vr2.0Vr1.8Vr
Inverse Absolute Temperature, 1/T (10-3, K-1)
Med
ian
Life
[t 50](
hrs)
Fig. 13. Plot of Median Life versus Inverse AbsoluteTemperature at 1.0Vr, 1.2Vr, 1.4Vr, 1.6Vr, 1.8Vr,1.9Vr, 2.0Vr, 2.1Vr, and 2.2Vr on Semi-Log Scale.
The lines for the 1.0Vr data and 1.2Vr data are basedon only five points, two of which are alreadyidentified as erroneous. Although these points occurat 360 and 490 hours, predictions based on the morereliable data taken at higher test voltages at 125°Cand 145°C (shown in figure 9) which are supportedby results from independent tests performed on arelated batch place the points at 690 and 850 hours.This changes the slope of the best-fit lines and thecalculated activation energy for tests done at 1.0Vrand 1.2Vr.

©2004 Component Technology Institute, Inc., CARTS 2004 Conference, San Antonio, TXPage 8 of 8
Once corrections have been made to the fit lines, theactivation energy for the test groups ranges from1.25eV to 1.75eV. Again, the voltage-temperatureinteraction, previously observed in the voltageacceleration investigation, has affected the results.While the activation energies are not consistent fromone test voltage to another, the values at each voltagestill enable reliability predictions at othertemperatures while using that voltage. Based on thelimited data at 1.0Vr presented here at temperaturesfar removed from 85°C, the projected t50 time forthese parts at maximum conditions becomes just over360 years. Based on this prediction, the first failuresfrom the group may occur after 100 years of use.Again, this prediction is based on only two datapoints whose temperatures are far removed from85°C. Thus it is not thought to be as reliable as thelife prediction based on the 85°C line of figure 9.Nevertheless, onset of failures at 100 years wouldstill be considered to be quite acceptable reliability.
Summary and Conclusions
Acceleration to the onset of wearout withoutactivating new or unusual failure mechanisms hasbeen demonstrated by exposing tantalum polymercapacitors to temperature and electric field stress inexcess of their rated maximums. The time-to-failuredistributions for these devices did not alter theirshape even under relatively severe test conditions.
Plots of median life versus test voltage andtemperature produce families of curves that areproportionately spaced and reasonably linear when
appropriately scaled with respect to the Prokopowiczand Vaskas acceleration equation. Based on theseobservations, time-to-failure under more normalconditions can be predicted with confidence byapplying the failure model and values for the voltagestress exponent and activation energy that are derivedfrom accelerated testing of samples from the devicepopulation.
For the devices tested in this study, projected medianlife at maximum rated conditions was more than 300hundred years. Onset of failures, considering thewell-behaved nature of the failure distributions, wascalculated to be at least 100 years of constant use atrated voltage and 85°C. These results indicate thatproperly constructed polymer tantalum capacitorspossess sufficient reliability to successfully replacetraditional MnO2 tantalums in modern applications.
Reference
1 T. Prokopowicz and A. Vaskas, “Research andDevelopment, Intrinsic Reliability, SubminiatureCeramic Capacitors,” Final Report, ECOM-90705-F,1969 NTIS AD-864068.
2 J. Paulsen and E. Reed, “Highly AcceleratedLifetesting (HALT) of KEMET Base-Metal-Electrode (BME) Ceramic Chip Capacitors,” CARTS’01 Proceedings of the 21st Capacitor and ResistorTechnology Symposium, p. 265 (2001).
3 F. Jenson, Electronic Component Reliability, JohnWiley & Sons, West Sussex, England, 1995, pp.8-11.