reliability-constrained optimal distribution system...
TRANSCRIPT
Reliability-Constrained OptimalDistribution System Reconfiguration
Salem Elsaiah, Mohammed Benidris and Joydeep Mitra
Abstract This work describes a method for reliability improvement of powerdistribution system via feeder reconfiguration. The work presented here is devel-oped based on a linearized network model in the form of DC power flow and linearprogramming model in which current carrying capacities of distribution feeders andreal power constraints have been considered. The optimal open/close status of thesectionalizing and tie-switches are identified using an intelligent binary particleswarm optimization based search method. The probabilistic reliability assessment isconducted using a method based on higher probability order approximation. Severalcase studies are carried out on a 33 bus radial distribution system and also on118 buses large-scale distribution system, which are extensively used as examplesin solving the distribution system reconfiguration problem. Further, the effect ofembedded generation on distribution system reconfiguration has been considered inone case scenario. The test results show that the amount of annual unnerved energyand customer’s interruptions can be significantly reduced using the proposedmethod. Further, the reliability assessment method and the search method proposedin this work have both shown to be computationally efficient and very suitable forreliability-constrained feeder reconfiguration problems.
Keywords Distribution system reconfiguration � Reliability assessment � Particleswarm optimization
S. Elsaiah (&) � M. Benidris � J. MitraElectrical and Computer Engineering Department, Michigan State University,East Lansing, MI, USAe-mail: [email protected]
M. Benidrise-mail: [email protected]
J. Mitrae-mail: [email protected]
© Springer International Publishing Switzerland 2015A.T. Azar and S. Vaidyanathan (eds.), Chaos Modeling and Control Systems Design,Studies in Computational Intelligence 581, DOI 10.1007/978-3-319-13132-0_11
265
1 Introduction
The vast majority of power distribution systems are characterized by radial topo-logical structure and poor voltage regulation. The radial topology is necessary inorder to facilitate the control and coordination of the protective devices used at thedistribution system level. However, with that radial structure, the failure of anysingle component between the load point and the source node would cause serviceinterruptions and may result in disconnecting several load points. Distributionsystem reconfiguration can be used to minimize the duration and frequency ofservice interruptions; and thereby improving the reliability of the system and thequality of service. Distribution system reconfiguration aims at changing the topo-logical structure of the distribution network by altering the open/close status ofsectionalizing and tie-switches to achieve certain objectives. The common objectivefunction used in distribution system reconfiguration is distribution system lossreduction and load balancing [2, 8, 9, 16, 21, 22].
In recent years, there has been an increasing interest in improving distributionsystem reliability using distribution system reconfiguration. The expected energynot supplied (EENS), expected demand not supplied (EDNS), and the expectedoutage cost (ECOST) are some examples of the reliability measures used in theliterature. In Bin et al. [25] reliability worth enhancement based distribution systemreconfiguration is proposed. Further, analytical and heuristic methods have beenproposed for reliability worth enhancement. A reliability cost-worth model of thedistribution system is built up and from which the ECOST and the EENS areobtained. In Bin et al. [25], the interrupted energy assessment rate (IEAR), which isproposed by Goel and Billinton [12] has also been used in Bin et al. [25] to relatethe interruption cost and the expected energy not supplied for every feasibleconfiguration.
A distribution system reconfiguration for reliability worth analysis based onsimulated annealing is proposed in Skoonpong and Sirisumrannukul [23]. The workreported in Skoonpong and Sirisumrannukul [23] used the same reliability indicesand the same customer damage function as in Bin et al. [25]. However, severalconclusions about the final system configuration are drawn as the ECOST and theEENS were both considered as objectives in the optimization problem. Reliabilityimprovement of power distribution systems using distributed generation has alsobeen proposed in the literature [18, 24].
Swarm intelligence optimization methods or meta-heuristic methods have beenwidely used in distribution system reconfiguration for reliability enhancement.Amongst these methods, particle swarm optimization (PSO) based methods arerecognized as viable tools in solving the distribution system reconfigurationproblem for reliability improvement. The advantages of using particle swarmoptimization in handling the distribution system reconfiguration problem aremanifold. For instance, the status of sectionalizing and tie-switches in the distri-bution system can be easily represented as binary numbers of (0, 1). Moreover,particle swarm optimization based methods have considerably fast convergence
266 S. Elsaiah et al.

characteristics and, generally speaking, have few parameters to tune up compared tosome other meta-heuristic approaches. Further, particle swarm optimization has twomain parameters, which are the personal best and the global best. Every particle inthe swarm remembers its own personal best and at the same time its global best.Consequently, PSO based methods have more memory capability than some otherswarm intelligence based methods.
Chakrabarti et al. presented a reliability based distribution system reconfigura-tion method in Chakrabarti et al. [6]. The objective in this study was to minimizethe loss of load expectation (LOLE) and the loss of energy expectation (LOEE).Monte Carlo simulation and particle swarm optimization have also been used assearching tools. Amanulla el al. [1] proposed a reconfiguration method for largesystems based on minimal cut set method. The problem of optimal switch place-ment in power distribution systems has been carried out using trinary PSO inMoradi and Firuzabad [19]. The use of ant colony optimization for placement ofsectionalizing switches in power distribution systems has also been proposed inFalaghi et al. [11].
It is worth mentioning here that Brown [5] has reported that distribution systemscontribute for up to 90% of overall consumer’s reliability problems. This can not onlybe attributed to the radial topological structure of distribution systems, but also to thefact that most of nowadays distribution systems are being stressed and operated atheavily loading conditions due to the rapid increase in electricity demand and someother economical and environmental constraints. Statistics have shown also that thevast majority of consumers’ outages and service interruptions have taken place atdistribution system level [3, 5]. These verities combined with the complexities oftoday’s distribution systems havemotivated us to revamp the service of consumers byconsidering the reliability while reconfiguring the distribution network.
This work proposes a method for distribution system reconfiguration with anobjective of reliability improvement. The work presented here is developed basedon a linearized network model in the form of DC power flow model and linearprogramming formulation in which current carrying capacities of distributionfeeders and real power constraints have been considered. The linearized networkmodel used in this work is appropriate to use for reliability studies as it is very fastand reliable. The optimal open/close status of the sectionalizing and tie-switches areidentified using an intelligent binary particle swarm optimization based searchmethod (BPSO). The probabilistic reliability assessment is conducted using amethod based on high probability order approximation. Numerous case studies aredemonstrated on a small 33 bus radial distribution system and 118 buses large-scaledistribution system, which have both been used as benchmark systems whilesolving the optimal distribution feeder reconfiguration problem. Distributedgenerators are constantly used in several of nowadays distribution systems. Theeffect of distribution generation units on the entire distribution system reliability isconsidered in one case study.
Reliability-Constrained Optimal Distribution … 267
2 Review of Mathematical Programming Based Methods
Nonlinear optimization methods and linear optimization methods can be used fordistribution system operation and planning studies. Each category has its ownadvantages and disadvantages. The common optimization methods applied topower distribution systems are discussed in Sect. 2.1.
2.1 Nonlinear Optimization Methods
Power systems are inherently nonlinear systems. Consequently, nonlinear optimi-zation techniques can be used to handle power system operation and planningproblems. Examples of the nonlinear optimization methods, which are widely usedin the literature include, nonlinear programming, quadratic programming, andmixed-integer programming.
In nonlinear programming based optimization, both the objective function andthe constraints are nonlinear. In order to handle a nonlinear programming problem,we usually start by choosing a search direction, which is obtained by finding thereduced gradient or the first derivative of the objective function. A key advantage ofusing nonlinear programming techniques in distribution system operation andplanning studies is partly attributed to their ability to achieve higher accuracy.However, the main disadvantage of nonlinear programming based methods is thatslow convergence rate may occur, which makes these methods computationallyexpensive, especially for applications in which repetitive solutions are requiredsuch as reliability assessment of power system, for instance. In addition, for aspecific type of engineering applications the objective function can be non-differ-entiable. This in turn could limit the use of the nonlinear programming basedmethods in handling certain objective functions.
Quadratic programming can in fact be considered as a special case of nonlinearprogramming based technique. That is, in quadratic programming the objectivefunction is a quadratic while the constraints are linear. A common objectivefunction used in power system operation and planning is to minimize the totalgeneration cost or total emission, which is inherently a quadratic function. Thequadratic programming handles this problem efficiently, however, at the same time,the computational burden is considerably large. More prominently, the standardsimple form of the quadratic programming is not quite often used because con-vergence is not always guaranteed.
Nonlinear optimization problems can also be formulated as a mixed-integerprogramming using certain integer control variables. Handling optimization prob-lems using mixed-integer programming based techniques are extremely computa-tional demanding, especially for large-scale systems.
268 S. Elsaiah et al.
2.2 Linear Optimization Methods
Linear methods are used to transform nonlinear optimization problems to linearproblems. In this context, linear programming (LP) is probably the most populartechnique, which has been widely used to handle engineering applications thatrequire repetitive, prompt, and multiple solutions. Unlike nonlinear programmingbased methods, both the objective function and constraints are linear functions inthe LP model. The advantages of using LP based methods in distribution systemoperation and planning include [27]:
1. Reliability of the optimization and flexibility of the solution.2. Rapid convergence characteristics and fast execution time.3. Nonlinear convex curves can be handled using piecewise linear models.4. Equality and inequality constraints can be equally handled in the basic LP
routine.
Now, suppose we have m constraints with n variables, the matrix of the coef-ficients of the constraints would be of the form [27].
A ¼a11 a11 . . . a1na11 a11 . . . a2n... ..
. ... ..
.
am1 am1 . . . amn
0BBB@
1CCCA ð1Þ
The right hand side vector b of the constraints consists of m constants,
b ¼ ðb1; b2; . . .; bmÞT ð2Þ
The row vector of the objective function c consists of n coefficients
c ¼ c1; c2; . . .; cnð ÞT ð3Þ
The standard maximum linear programming problem can be formulated asfollows,
maxðZÞ ¼Xnj¼1
cjxj ð4Þ
Subject to the following constraints,
Pnj¼1
aijxj � bi
xj � 0
8<: ð5Þ
Reliability-Constrained Optimal Distribution … 269
If the slack variables of Eq. (5) are imported, the standard linear programmingwill have the following form,
max Z ¼ CX ð6Þ
With the equality constraints,
AX ¼ bX� 0
�ð7Þ
The dual of this standard maximum problem is the standard minimum problem,that is,
MinðWÞ ¼Xmi¼1
biyi ð8Þ
Subject to the following constraints,
Pnj¼1
aijyj � cj
yi � 0
8<: ð9Þ
The optimal and feasible solution of Eq. (5), for instance, can be expressed as,
Xb ¼ B�1b ð10Þ
where B is the optimal basis at the optimal and feasible solution and Xb is the basicvariable subvector.
3 Review of Network Models
The structure of distribution systems has been recently changed due to certainenvironmental, economical, and political reasons. This change has come throughthe emergence of several real-time engineering applications in both operational andplanning stages. Examples of these applications include sizing and placement ofdistributed generators, economic power dispatch of active distribution systems,feeder reconfiguration for service restoration and reliability enhancement, and soforth. It is very well known that these applications require a power flow study at thefirst step of the solution. Nevertheless, and not surprisingly, the vast majority ofthese applications require repetitive and prompt power flow solutions. Performingnonlinear power flow, on one hand, gives high calculation precision but requires aquite extensive computational burden and storage requirements. On the other hand,
270 S. Elsaiah et al.

and more prominently, the largest part of the aforementioned applications isessentially nonlinear complex combinatorial constrained optimization problems.The formulation of the nonlinear problem, however, tends to be a tedious task andcomputationally cumbersome in terms of execution time, storage requirements, andprogramming. These verities combined with the large number of nodes, branches,and switches of distribution system will incontestably increase the complexity ofthe optimization problem.
The vast majority of power system optimization problems are essentially optimalpower flow problems with different objectives. The total load curtailment mini-mization problem, for instance, is an important objective function that is used forreliability evaluation of power systems. We would like to elaborate here on thisobjective function, which is concerned with reliability improvement of distributionsystem. For every task of reliability evaluation, a power flow study is constantlyperformed. Toward this end, three power flow models have generally been used forreliability evaluation of power systems. These models are the nonlinear power flowmodel, the capacity flow model, and the DC power flow model. Experience with thenonlinear power flow model has shown, however, that when this model is incor-porated in the reliability assessment framework, the task of reliability evaluationbecomes extremely complex and oftentimes computationally intractable. Also, therequired data and storage both become high. On the other hand, the capacity flowmodel only uses the capacity constraints of the tie-lines, and thereby; generallyspeaking, it is not applicable for every reliability study. In view of these reasons, inmany cases, it has been found to be more appropriate to utilize the DCPF model.
The DC power flow method, which was devised more than 35 years ago, hasbeen widely utilized in reliability assessment of power and distribution systems[17, 20]. It is denoted as DC power flow (DCPF), in analogy to a DC circuit fed bya DC voltage source. In fact, this model is a linearized version of the nonlinearpower flow model; however it ignores most of the aspects of the nonlinear powerflow model. The DCPF model is non-iterative, linear, and absolutely convergent,but with less accuracy than the nonlinear power flow model. The DCPF modelassumes flat voltage profiles at all buses and lossless transmission lines. It is usuallyused whenever fast power flow solutions are required as in optimal economic powerdispatch, contingency analysis, and reliability and security assessment. The DCPFmodel is unquestionably a powerful computational tool and was approximatelyinvolved in numerous power system operational and planning studies because of itssimplicity of formulation and implementation.
It is worth to point out here that the use of the DCPF model in certain reliabilityevaluation studies of distribution systems has been based on the assumption thatadequate information about reactive power flow are unavailable in advance. Suchan assumption is justified for several planning studies because reactive power isusually supplied in a form of capacitor banks, which can be treated as a separateoptimization problem.
Reliability-Constrained Optimal Distribution … 271
4 Problem Statement
Distribution systems are equipped with sectionalizing and tie-switches. The crucialpurpose of the tie-switches is to transfer loads from one feeder to another duringabnormal and emergency conditions. The problem being presented in this work canbe stated as follows: Given the distribution network with NT 2 NTN tie-switches,where NTN is the number of tie-switches in the distribution system, and NS 2 NSN
sectionalizing switches, where NSN is the number of sectionalizing switches in thedistribution system. The solution of the optimal distribution system reconfigurationproblem ðXÞ aims at finding the best combination of the tie-switches andsectionalizing switches X 2 ðNTN [ NSNÞ that minimizes the expected power notsupplied, and thereby, maximizes the overall reliability of the distribution system.
5 Development of Models and Methods
In this section, the state space of the problem is defined. Probabilistic reliabilitymodels for various distribution system components are reviewed. In addition, areliability evaluation method based on higher probability order is introduced anddiscussed.
5.1 The State Space of the Problem
The state space in this work represents the set of all possible combinations ofgenerators, distribution feeders, sectionalizing switches, tie-switches, buses, circuitbreakers, and distribution transformers. Consequently, the dimension of the statespace can be stated as the set of all the aforementioned components. As wasmentioned earlier, distribution systems are reconfigured radially for best control oftheir protective relays and instruments. Therefore, the substation bus is assumed tobe perfectly reliable due to the radial topological structure of the realistic powerdistribution systems. Modeling of these components is addressed in the subsequentsection.
5.2 Distribution System Modeling
For distribution system reliability studies, probabilistic modeling techniques areutilized to represent various system components. The availability of any componenti in the system can be represented as [3].
272 S. Elsaiah et al.

Pi ¼1=ki
1=ki þ 1=lið11Þ
where ki is the failure rate of component i and li is the repair rate of componenti, respectively.
In the work presented here, it is assumed that each component in the system canonly reside in an up-state or down-state. Therefore, the two-state Markovian modelshown in Fig. 1 is used to model various system components [3, 5]. For distributionfeeders, a discrete probability density function is constructed for every distributionline. If a distribution feeder is tripped off for certain system state, the line isremoved from the bus admittance matrix and its capacity is set equal to zero.
5.3 Reliability Indices
Reliability of distribution system can be defined as the ability of the distributionsystem to satisfy its consumers load demand under certain operating conditions.This work uses the expected power not supplied (EPNS), which is alternativelyknown as the expected demand not supplied (EDNS) is used to evaluate distributionsystem reliability. The loss of load probability (LOLP) is used to calculate the totalload curtailment ðCÞ. These indices are defined as,
Expected Energy Not Supplied (EPNS): The expected number of megawatt peryear that the system cannot supply to consumers. Alternatively, it is also known asthe expected demand not supplied (EDNS).
Loss of Load probability (LOLP): The probability that the system will not beable to supply the load demand under certain operating scenarios.
5.4 Reliability Evaluation
Enumeration all events to compute the exact values of probabilities can sometimes beunnecessary and impractical. In practice, probabilities of occurrence of various eventsare approximated up to certain level. This work uses a reliability assessment methodbased on higher probability order approximation [4, 7]. This concept is well repre-sented in Chen and McCalley [7] and is discussed here for the sake of completion.
Up
µ
Up Down
Fig. 1 Two-state Markovian model
Reliability-Constrained Optimal Distribution … 273

Suppose we have three events, which are represented as E1, E2, and E3 withindividual probabilities of P1, P2, and P3, respectively. The compound probabilityof the event ðE1 \ E2Þ [ E3, for instance, can be expressed as,
ðE1 \ E2Þ [ E3 ¼ P3 þ P1 � P2 � P1 � P2 � P3 ð12Þ
As can be seen from (12) this compound probability consists of first-orderprobability, second-order probability, and third-order probability. It is worthpointing out here that the probability of failure of most power system components isquite small. Having said that, the effect of higher-order contingencies could pos-sibly be limited using certain probability or frequency criterion. For instance, in (2)if the individual probabilities P1, P2, and P3 are quite small, then the event ðE1 \E2Þ [ E3 can be approximated with ðP3 þ P1 � P2Þ or with ðP3Þ [7]. The reliabilityevaluation method followed in this work is developed based on the high probabilityorder approximation so that the effect of any contingency level with a frequency ofoccurrence less than 10�10 has been neglected. This would in turn enhance thecomputational speed, without significant effect on the degree of accuracy of theestimated indices. We have shown through simulations that this method istremendously appropriate to use for reliability evaluation studies as it is flexible andcomputationally efficient.
6 Reliability Evaluation Using Linearized Network Modeland Linear Programming
This section formulates the optimal distribution system reconfiguration problem. Itfirst presents the objective function and constraints. Then, it introduces a method toimpose the radial topological structure of the distribution system. It also presents amethod to calculate the reliability index, which is used in this work.
6.1 Objective Function
A linear Programming formulation, which is similar to similar to that given byMitra and Singh [17], is used here to minimize total load curtailments. The equalityconstraints are the power flow injections at each bus, which are represented by thepower balance equations. The inequality constraints include the capacity limits ofgenerating units and power carrying capacities of distribution feeders.
274 S. Elsaiah et al.

The objective function used in this work can be posed as [17],
Loss of Load ¼ minXNB
i¼1
Ci ð13Þ
Subject to,
Bhþ Gþ C ¼ DG�Gmax
C�DbAh�Fmax
f
�bAh�Fmaxr
G� 0C� 0h is unrestricted
ð14Þ
Where,NB Number of busesNF Number of distribution feedersB ¼ ðNB � NBÞ Augmented-node susceptance matrixb ¼ ðNF � NFÞ Distribution feeders susceptance matrixA ¼ ðNF � NBÞ Element-node incidence matrixh ¼ NB Vector of node voltage anglesC ¼ NB Vector of bus load curtailmentsD ¼ NB Vector of bus demandGmax ¼ NB Vector of available generationFmaxf ¼ NF Vector of forward flow capacities of lines
Fmaxr ¼ NF Vector of reverse flow capacities of lines
G ¼ NB Vector of dispatched generation at buses
In (13) all generation availability and network constrains have been taken intoconsiderations. In addition, in order to get a feasible solution for this standardminimization problem given in (13), it was assumed that one of the bus angles in(14) is considered to be equal to zero.
6.2 Imposing of the Radial Topology Constraint
Distribution systems are reconfigured radially to facilitate the control and coordi-nation of their protective devices. The radial topological structure of the distributionsystem is taken as a necessary condition during the realization of the presentedwork. Therefore, this spanning tree structure shall be retained at all times and for all
Reliability-Constrained Optimal Distribution … 275

possible configurations. For this purpose, another constraint, which is developedbased on graph theory [10, 13] is introduced into the distribution system recon-figuration problem. Using graph theory and the element-node incidence matrix, thisconstraint can be imposed as,
detðAÞ ¼ �1; Radial Toplogy0; Weakly�Meshed
�ð15Þ
Therefore, for any optimal network configuration that results in presenting atleast one loop in the system this configuration is considered to be infeasible and isremoved from the search space.
To better understand the spanning tree algorithm developed herein, let us considerthe graph shown in Fig. 2 [10, 13]. This graph consists of 4 vertices and 5 edges.The incidence matrix described this graph has one column of each vertex and one rowfor each edge of the graph. Let us draw our attention to the loop forms by the vertices1, 2, and 3 and the edges 1, 2, and 3. Thematrix describes these vertices and edges canbe represented as,
A ¼�1 10 �1�1 0
0 01 01 0
24
35 ð16Þ
The determinant of the incidence matrix given in (16) is obviously equal to zero.This is evident from (16) as the summation of the first two rows yields to the thirdrow. This, in other words, indicates that the matrix described by (16) is linearlydependent. The number of loops in the graph shown below in Fig. 2 is in this caseequal to 2.
V1
E1
E2E5
E4
E3V2
V3
V4
Fig. 2 A graph with n = 4vertices and m = 5 edges
276 S. Elsaiah et al.

6.3 Calculation of the EPNS Reliability Index
The reliability index utilized in this paper is the expected power not supplied EPNS.It is evident that (14) is augmented by a fictitious generator that is equivalent to therequired curtailment since the problem aims at minimizing the total load curtail-ment. In this work, the EPNS is estimated as,
EPNS ¼XNc
x¼1
LOLðxÞ � ProbðxÞ
where LOLðxÞ is the loss of load of state x, which is equivalent to load curtailmentof state x, ProbðxÞ is the probability of state x, and Nc is the number ofcontingencies.
7 Formulation of the Distribution System ReconfigurationProblem
7.1 Particle Swarm Optimization
Particle swarm optimization is a population-based optimization technique inspiredby the social behavior of flocks of birds or schools of fish, which is described indetail in Kennedy and Eberhart [14, 15]. In p Particle swarm optimization, thepositions and velocities of the particles are initialized with a population of randomfeasible solutions and search for optima by updating generations. The advantages ofusing particle swarm optimization technique in distribution system reconfigurationstudies include the following:
1. Particle swarm based optimization only needs few parameters to tune up, unlikesome other swarm intelligence such as genetic algorithms, for instance.
2. Distribution systems are equipped with two kinds of switches. These switchesare sectionalizing switches and tie-switches. The sectionalizing switches arenormally closed and used to connect various distribution feeders segments. Onthe other hand, the tie-switches are normally opened and used to transfer loadsduring abnormal and emergency conditions. These switches can be better rep-resented by digital numbers 0 and 1, which are easy to implement using binaryparticle swarm optimization.
3. More prominently, as will be seen later, the PSO has two main parameters, whichare the personal or individual best and the group best. Every particle in the swarmremembers its own personal best and at the same time its global best. Conse-quently, PSO based methods have more memory capability than some otherswarm intelligence based methods such as genetic algorithms, for example.
Reliability-Constrained Optimal Distribution … 277

4. Particle swarm optimization can handle nonlinear and non-differentiable func-tions efficiently and effectively.
5. Particle swarm optimization could lead to optimal or semi-optimal globalsolution for wide range of practical problems.
In PSO, the movement of the particles, which represents the potential solutions,is governed by the individual best and the group best. Using these components, avector that determines the direction and magnitude of each particle in the swarm cantherefore be represented as,
vi ¼ vi�1 þ k1 � rand 0; 1ð Þ � Ppbesti � xi� �þ k2 � rand 0; 1ð Þ � Pgbest � xi
� �ð17Þ
where, rand 0; 1ð Þ is a uniformly distributed random number between (0, 1), Ppbesti
is the particle best position from the probability of a state prospective particle i hasever encountered, Pgbest is the group of particles best position from the probabilityof a state prospective the group has ever encountered. Further, k1 and are k2 areacceleration factors. The values of these acceleration factors are given in Table 1.The change in particles positions can be defined by a sigmoid limiting transfor-mation function and a uniformly distributed random number in (0, 1) as following,
xid ¼ 1; rand 0; 1ð Þ\S vidð Þ0; otherwise
�ð18Þ
where xid is the dth component of particle i, and S vidð Þ is the sigmoid function ofthe dth’s component of particle i, which can be expressed as,
S vidð Þ ¼ 11þ e �vidð Þ ð19Þ
Changes of probabilities are limited by the maximum velocity, which limits theultimate probability of a bit in particle i to have 0 or 1. Choosing very large or verysmall values for the maximum velocity can limit the chance of exploring newvectors. Therefore, a careful selection of vmax should be performed. In this work, fora flat start, we have chosen the maximum velocity to be 2.2, which makes S vidð Þvaries between 90 and 10 %.
Table 1 Reliability data
Component name Failure rate (failure/year) Repair rate (h)
Transformer 0.05882 144
Bus 0.0045 24
Circuit breaker 0.1 20
Distribution feeder 0.13 5
Sectionalizing Switches 0.2 5
278 S. Elsaiah et al.

7.2 Binary Particle Swarm Optimization Based an IntelligentSearch Method
The main steps of the reliability evaluation and finding the optimal configurationusing the BPSO based method are summarized as follows,
1. Initialize the positions and velocities of the particles, respectively. Particlespositions are initialized using uniformly distributed random numbers; switchesthat are in the closed state are represented by 1’s and switches that are in theopen state are represented by 0’s.
2. The length of a particle string equals the number of system switches. One of theparticles is chosen to represent the original configuration of the system, that is,all tie-switches are in open states.
3. Check if there are identical particles. If so, discard the identical ones and savethe rest of the particles in a temporary array vector by converting the binarynumbers to decimal numbers.
4. Check if there are particles already exist in the database, if so, set loadcurtailments of the existing particles to the system peak load to decrease thechance of visiting these configurations again. Then, save the rest in the databaseand go to the next step.
5. Check the radiality condition for each particle, if the radiality condition is met,go to next step, otherwise set load curtailments of the particles that representinvalid configuration to the system peak load to decrease the chance of visitingthese configurations again.
6. Set system parameters and update the status of the system components(sectionalizing, tie-switches, transformers, distribution feeders, circuit breakers,etc.), for every particle.
7. Perform reliability evaluation for each particle by solving the linear program-ming optimization problem for every system state to calculate the expected loadcurtailments for each particle.
8. Determine and update personal best and global best configuration based onminimum load curtailments.
9. Check for convergence. If the stopping criterion is met, stop; otherwise go tonext step. The stopping criteria followed here is that after little iteration, if nonew better configurations were discovered, terminate the algorithm.
10. Update particles velocities and update particles positions using and go to step 3.
The flowchart depicted in Fig. 3 shows the detailed solution procedures.
Reliability-Constrained Optimal Distribution … 279

Start
Initialize the positions and velocities of the particles
Identical Particles?
Discard the identical particles
Convert to Decimal
particle exists in the database?
Set load curtailment to the
peak load
Save in the database
Radiality met?
Update system status
Perform reliability evaluation and update the EDNS
Determine and update personnel and global best
Solution Converged?
Update positions and velocities
i = 0
i = i + 1
i < No. ofParticles?
Output Results
Yes
No
Yes
No
Yes
No
No
Yes
Yes
No
Fig. 3 Flowchart of the proposed method
280 S. Elsaiah et al.

8 Demonstration and Discussion
This section provides numerous case studies to validate the effectiveness of theproposed method of optimal distribution system reconfiguration for reliabilityimprovement. In addition, this section presents and thoroughly discusses the results.
8.1 The 33 Bus Radial Distribution System Test Case
The first distribution system used in this work is a modified 33 bus radial distri-bution system. The 33 bus distribution system is a 12.66 kV system, which iswidely used as an example in solving the distribution system reconfigurationproblem [2]. The single-line diagram of the 33 bus system is depicted in Fig. 4. Thetotal real and reactive power loads on the system are 3,715 KW and 2,300 KVAR,
2
3
4
5
6
7
8
91011
12
13 14
15
16
17
19
20
21
22
23
24
25
26
27 28 29
30
31
32
33
S1
S2
S3
S4
S5
S6
S7
S8
S9S10
S11
S12
S13
S14
S15
S16
S17
S18
S19
S20
S21
S22
S23
S24
S25
S26
S27 S28 S29
S30
S31
S32
S33
S34S35
S36
S37
18
1
Substation Bus
Tie Switches
Sectionalizing Switches
Fig. 4 33 bus distribution system
Reliability-Constrained Optimal Distribution … 281

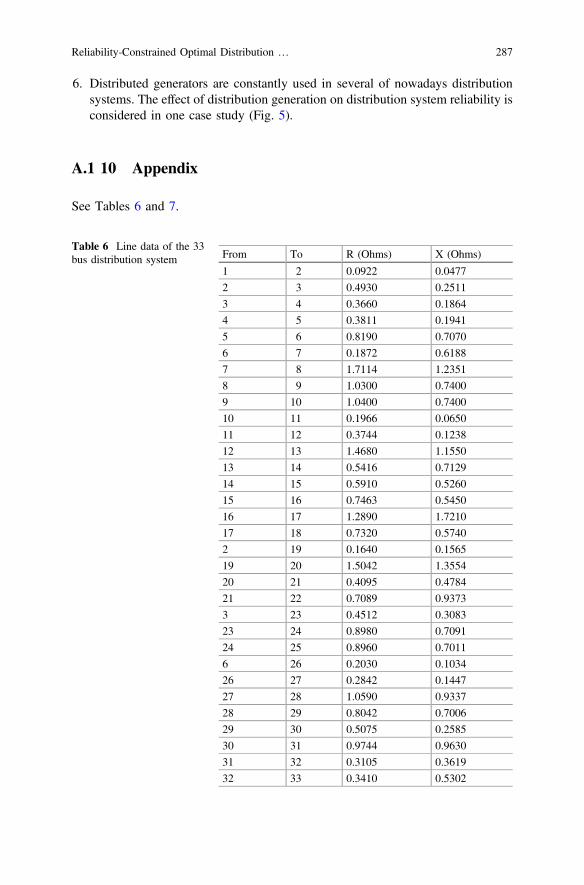
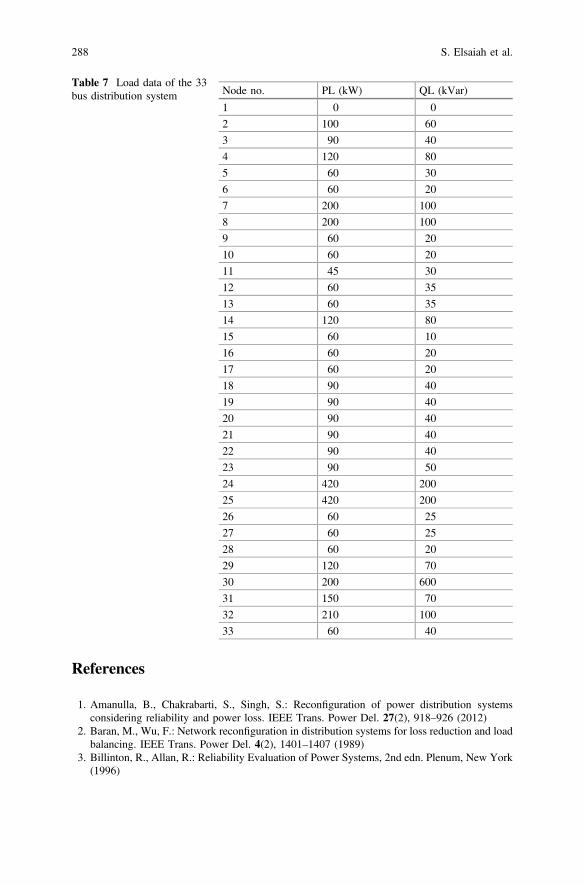
respectively. Load data and line data of the 33 bus radial distribution system aregiven in the appendix. The base values are chosen to be 12.66 kV and 100 KVA.As shown in Fig. 4, this system consists of 33 buses, 32 branches, 3 laterals, and 5tie lines. In addition, the 33 bus system has a distribution transformer, which isconnected to the substation bus. For the initial configuration, the normally openedswitches (tie-lines) are {S33, S34, S35, S36, S37}, which are represented by dottedlines. The normally closed switches are denoted as S1–S32 and are represented bysolid lines.
The reliability data used in this work are acquired fromAmanulla et al. [1], and aregiven in Table 1. The reliability index used in this paper is the EPNS. The parametersof the BPSO algorithm are given in Table 2. Several case studies have been conductedon the 33 bus distribution system shown in Fig. 4. We have also considered one casescenario for the 33 bus system in the presence of distributed generation units. Theresults of the different case scenario are presented in Table 3 through Table 5.
8.1.1 Case Study I
In this case study the failure rates of all distribution system components such astransformer; circuit breaker, etc. are considered. Further, it is assumed that everydistribution line has a sectionalizing switch. The optimal set of the sectionalizing andtie-switches that yield minimum load curtailment were {S6, S10, S13, S27, S32}.
The number of searched configuration for this case study was 4,857. Howeverthe number of the feasible configurations was 110. For comparison purposes, theproposed method of distribution system reconfiguration is first applied on the initialconfiguration shown in Fig. 4. The results of this case study are summarized belowin Table 3.
As can be seen from Table 2 the EPNS is reduced from 10.08 kW/year, for theinitial configuration to 8.49 kW/year, after reconfiguration. This is about 15.6 %reduction in the expected power not supplied.
Table 2 Parameters of the proposed BPSO search method
Parameter Value
Number of particles 50
Acceleration constant k1 2
Acceleration constant k2 2
Maximum number of iterations 1,500
Table 3 Reliability results of the 33 bus system-case study I
Loading conditions Network status Opened switches EPNS (kW/Year)
Peak load Initial topology S33, S34, S35, S36, S37 10.01
Final topology S6, S10, S13, S27, S32 8.49
282 S. Elsaiah et al.

8.1.2 Case Study II
This case study is similar to case study I except that the failure rates of section-alizing switches and distribution feeders are also increased by 20 %. The loadingconditions have also been increased by 40 %, to show the effect of the failure ratesof system components on its reliability.
The optimal set of the sectionalizing and tie-switches that yield minimum loadcurtailment were {S7, S11, S14, S17, S27}. The number of searched configurationfor this case study was 4,904. The number of the feasible configurations for thisparticular case was 122. The results of this case study are summarized below inTable 4.
As can be seen from Table 3, the EPNS is reduced from 15.14 kW/year for theinitial configuration to 12.94 kW/year after reconfiguration. This is almost 14.53 %reduction in the expected power not supplied.
8.1.3 Case Study III
This case study discusses the inclusion of distribution generation on the reliabilityof the distribution network. In fact, some of today’s distribution systems havecertain amount of embedded generation or distributed generation. The advantagesof distributed generation include total loss reduction, voltage profile improvement,peak load shaving, and reliability and security enhancement. In this case study, weassume that certain amount of power is injected to the system via distributedgeneration units in order to improve its overall reliability. The distributed generatorsused here are modeled as constant PQ nodes with negative injections. Thisassumption concurs with the IEEE standard 1547–2003 (IEEE standard for Inter-connecting Distributed Resources with Electric Power Systems 2003) for inter-connecting distributed resources with electric power systems, which emphasizesthat distributed generators are not recommended to regulate bus voltages, andthereby they should be modeled as PQ nodes not PV nodes. Further, distributedgenerators operated at unity power factor have been assumed in this work.
In order to accommodate the penetration of the wind turbine generators in theoptimization problem, the right-hand side of (14), which represents the powerbalance equation, is modified to include the real power injections of the distributedgeneration units.
Table 4 Reliability results of the 33 bus system-case study III
Loading conditions Networkstatus
Opened switches EPNS (kW/Year)
40 % Increase in peak load Initialtopology
S33, S34, S35, S36,S37
15.14
Final topology S7, S11, S14, S17, S27 12.94
Reliability-Constrained Optimal Distribution … 283

It is important to highlight here that we only consider the penetration level of thedistributed generation units in this work. The problem of determining the optimallocations and sizes of distributed generation units that minimizes the total loadcurtailment is not pertinent to the work being presented here. Further, in this casestudy, we have assumed a penetration level of 10 %, which is equivalent toapproximately 370 kW. Therefore, two distributed generation units, each one israted at 185 kW, are placed at bus 8 and bus 24 of the 33 bus system, respectively.
The optimal set of the sectionalizing and tie-switches that yield minimum loadcurtailment for this case study were {S6, S10, S13, S26, S36}. The number ofsearched configuration for this case study was 4,776. The number of the feasibleconfigurations was 111. For comparison purposes, we have placed the same dis-tributed generation units on the initial configuration shown in Fig. 4. The results ofthis case study are summarized in Table 5.
As can be seen from Table 5, the EPNS is reduced from 9.86 kW/year for theinitial configuration to 7.71 kW/year after reconfiguration. This is about 21.8 %reduction in the expected power not supplied. It is interesting to mention here thatthe present of the distributed generation units has assisted in decreasing the totalamount of the curtailed power as can be seen from Table 5.
8.2 The 118 Buses Large-Scale Distribution System Test Case
The proposed framework has been applied to a more complicated and realisticdistribution system to validate its feasibility in such conditions. The system underconsideration is an 11 kV, 118 buses large-scale radial distribution system [26].This system consists of 117 branches and has 15 tie-lines. The results of one casescenario performed on this system are presented. The failure rates of distributionfeeders are considered in this case. For the initial configuration, the EPNS has beencalculated using the proposed method and was found 313 kW/year. The EPNS hasbeen reduced to 211 kW/year after the network has been reconfigured.
9 Discussion and Concluding Remarks
Awas discussed earlier, it has been reported in the literature that distribution systemscontribute for up to 90 % of overall consumer’s reliability problems [5]. Statisticshave shown also that the vast majority of consumers’ outages and service inter-ruptions have taken place at distribution system level [3, 5]. In addition, most of
Table 5 Reliability results of the 33 bus system-case of distribution generation units
Loading conditions Network status Opened switches EPNS (kW/Year)
Peak load Initial topology S33, S34, S35, S36, S37 9.86
Final topology S6, S10, S13, S26, S36 7.71
284 S. Elsaiah et al.

nowadays distribution systems are being stressed and operated at heavily loadingconditions due to the rapid increase in electricity demand and some other economicaland environmental constraints. These verities combined with the complexities ofnowadays distribution systems have motivated us to revamp the service of con-sumers by considering the reliability while reconfiguring the distribution network.
Distribution systems are equipped with two types of switches; sectionalizing andtie-switches. The sectionalizing switches are normally closed and are used to connectvarious distribution line segments. The tie-switches, on the other hand, are normallyopened and can be used to transfer loads from one feeder to another during abnormaland emergency conditions. Feeder reconfiguration is among the several operationaltasks, which are performed frequently on distribution systems. Basically, it denotesto the process of changing the topological structure of the distribution network byaltering the open/close status of sectionalizing and tie-switches to achieve certainobjectives. Of these objectives reliability and security enhancement are of mostconcern.
This work has proposed a method for reliability maximization of distributionsystems through feeder reconfiguration. This method is developed based on a line-arized network model in which the current carrying capacities of distribution feedersand real power limits have been accounted for. From practical perspective, distri-bution systems are reconfigured radially for best control and coordination of theirprotective devices. We have therefore developed an algorithm based on the graphtheory of trees and forests to preserve the radial topology constraints. Since the timeand computational effort spent in evaluating reliability indices are of great concern inboth planning and operational stages, this paper uses a probabilistic reliabilityassessment method based on event tree analysis with higher-order contingencyapproximation. Consequently, the computational burden has been reduced whencompared to some other approaches such as Monte Carlo simulation, for instance,which sometimes tends to be computationally demanding even for planning studies.
In addition, we have proposed an intelligent binary particle swarm optimizationbased search method to seek the possible combinations of sectionalizing and tie-switches that improve system’s reliability. We have demonstrated the effectivenessof the proposed method on a 33-bus radial distribution system, which is extensivelyused as an example in solving the distribution system reconfiguration problem. Wehave considered the effect of embedded generation in one case scenario. The testresults have shown that amount of annual unnerved energy and customer’s inter-ruptions can be significantly decreased when reliability constraints are taken intoconsideration while reconfiguring the distribution network.
This work proposes a method for distribution system reconfiguration with anobjective of reliability improvement. The main features of the work presented inthis chapter include:
1. The work presented here is developed based on a linearized network model inthe form of DC power flow model and linear programming formulation in whichcurrent carrying capacities of distribution feeders and real power constraintshave been considered.
Reliability-Constrained Optimal Distribution … 285
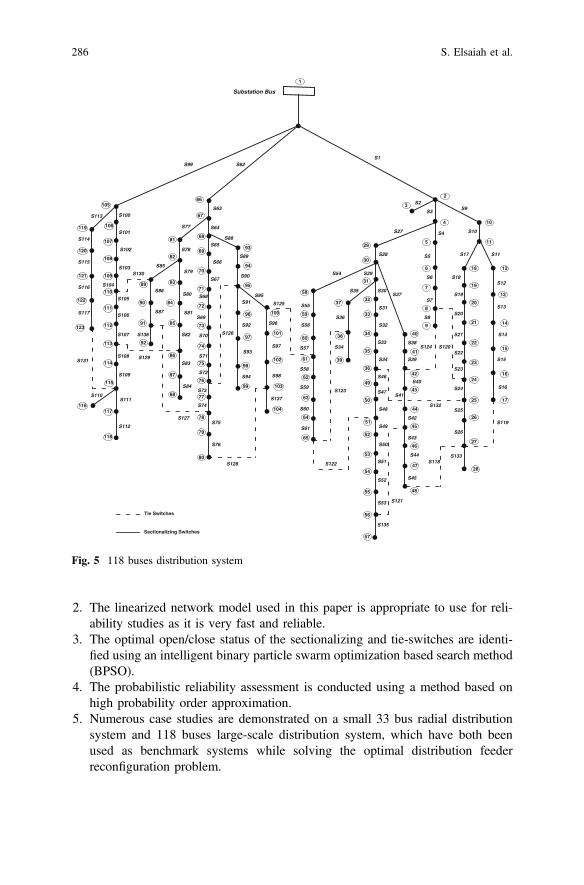
2. The linearized network model used in this paper is appropriate to use for reli-ability studies as it is very fast and reliable.
3. The optimal open/close status of the sectionalizing and tie-switches are identi-fied using an intelligent binary particle swarm optimization based search method(BPSO).
4. The probabilistic reliability assessment is conducted using a method based onhigh probability order approximation.
5. Numerous case studies are demonstrated on a small 33 bus radial distributionsystem and 118 buses large-scale distribution system, which have both beenused as benchmark systems while solving the optimal distribution feederreconfiguration problem.
Substation Bus
1
2
3
4
5
6
7
8
9
10
11
12
13
14
15
16
17
18
19
20
21
22
23
24
25
26
27
28
29
30
31
32
33
34
35
36
37
38
39
40
41
42
43
44
45
46
47
48
49
50
51
52
53
54
55
56
57
58
59
60
61
62
63
64
65
66
93
80
79
78
77
76
75
74
73
72
71
70
69
68
67
88
87
86
85
84
83
82
81
91
90
89
92
99
98
97
96
95
94
100
101
102
103
104
123
122
121
120
119
118
117
115
114
113
112
110
109
108
107
106
111
105
116
S119
S120
S121
S122
S123
S124
S125
S126
S127
S128
S129
S130
S131
S132
S118
Tie Switches
Sectionalizing Switches
S1
S20
S19
S18
S17
S10
S9S2
S13
S12
S11
S133
S26
S25
S24
S22
S21 S14
S15
S93
S47
S46
S34
S33
S32
S30
S31
S29
S37
S28
S27
S45
S44
S43
S42
S41
S40
S39
S38
S16
S92
S95S91
S137
S98
S97
S96
S61
S60
S59
S58
S56
S55
S34
S36
S35
S54
S135
S53
S52
S51
S50
S49
S48
S105
S106
S107
S108
S109
S111
S112
S136
S87
S86
S84
S83
S82
S81
S80
S79
S78
S76
S75
S74
S73
S72
S71
S70
S69
S68
S67
S66
S90
S89
S88S65
S94
S115
S114
S113
S85
S99 S62
S63
S64S77
S103
S102
S101
S100
S110
S117
S116 S104
S3
S57
S4
S5
S6
S8
S7
S23
Fig. 5 118 buses distribution system
286 S. Elsaiah et al.
6. Distributed generators are constantly used in several of nowadays distributionsystems. The effect of distribution generation on distribution system reliability isconsidered in one case study (Fig. 5).
A.1 10 Appendix
See Tables 6 and 7.
Table 6 Line data of the 33bus distribution system From To R (Ohms) X (Ohms)
1 2 0.0922 0.0477
2 3 0.4930 0.2511
3 4 0.3660 0.1864
4 5 0.3811 0.1941
5 6 0.8190 0.7070
6 7 0.1872 0.6188
7 8 1.7114 1.2351
8 9 1.0300 0.7400
9 10 1.0400 0.7400
10 11 0.1966 0.0650
11 12 0.3744 0.1238
12 13 1.4680 1.1550
13 14 0.5416 0.7129
14 15 0.5910 0.5260
15 16 0.7463 0.5450
16 17 1.2890 1.7210
17 18 0.7320 0.5740
2 19 0.1640 0.1565
19 20 1.5042 1.3554
20 21 0.4095 0.4784
21 22 0.7089 0.9373
3 23 0.4512 0.3083
23 24 0.8980 0.7091
24 25 0.8960 0.7011
6 26 0.2030 0.1034
26 27 0.2842 0.1447
27 28 1.0590 0.9337
28 29 0.8042 0.7006
29 30 0.5075 0.2585
30 31 0.9744 0.9630
31 32 0.3105 0.3619
32 33 0.3410 0.5302
Reliability-Constrained Optimal Distribution … 287
References
1. Amanulla, B., Chakrabarti, S., Singh, S.: Reconfiguration of power distribution systemsconsidering reliability and power loss. IEEE Trans. Power Del. 27(2), 918–926 (2012)
2. Baran, M., Wu, F.: Network reconfiguration in distribution systems for loss reduction and loadbalancing. IEEE Trans. Power Del. 4(2), 1401–1407 (1989)
3. Billinton, R., Allan, R.: Reliability Evaluation of Power Systems, 2nd edn. Plenum, New York(1996)
Table 7 Load data of the 33bus distribution system Node no. PL (kW) QL (kVar)
1 0 0
2 100 60
3 90 40
4 120 80
5 60 30
6 60 20
7 200 100
8 200 100
9 60 20
10 60 20
11 45 30
12 60 35
13 60 35
14 120 80
15 60 10
16 60 20
17 60 20
18 90 40
19 90 40
20 90 40
21 90 40
22 90 40
23 90 50
24 420 200
25 420 200
26 60 25
27 60 25
28 60 20
29 120 70
30 200 600
31 150 70
32 210 100
33 60 40
288 S. Elsaiah et al.

4. Billinton, R., Kumar, S.: Effect of higher-level independent generator outages in composite-system adequacy evaluation. IEEE Proc. 134(1), 17–26 (1987)
5. Brown, R.: Electric Power Distribution Reliability. Marcel Dekker Inc., New York City (2002)6. Chakrabarti, S., Ledwich, G., Ghosh, A.: Reliability driven reconfiguration of rural power
distribution systems. In: Proceedings of 3rd International Conference on Power Systems,pp.1–6, (2009)
7. Chen, Q., McCalley, J.: Identifying high risk N-k contingencies for online security assessment.IEEE Trans. Power Syst. 20(2), 823–834 (2005)
8. Chiang, H., Jean-Jumeau, R.: Optimal network reconfigurations in distribution systems. II.Solution algorithms and numerical results. IEEE Trans. Power Del. 5(3), 1568–1574 (1990)
9. Civanlar, S., Grainger, J., Yin, H., Lee, S.: Distribution feeder reconfiguration for lossreduction. IEEE Trans. Power Del. 3(3), 1217–1223 (1988)
10. Diestel, R.: Graph Theory. Elec. Ed. Springer, New York (2000)11. Falaghi, H., Haghifam, M., Singh, C.: Ant colony optimization based method for placement of
sectionalizing switches in distribution networks using a fuzzy multi–objective approach. IEEETrans. Power Del. 24(1), 268–276 (2009)
12. Goel, L., Billinton, R.: Determination of reliability worth for distribution system planning.IEEE Trans. Power Del. 9(3), 1577–1583 (1994)
13. Graph Matrices.: Available online at: http://www.compalg.inf.elte.hu/tony/Oktatas/TDK/FINAL/Chap,.PDF. IEEE Standard for Interconnecting Distributed Resources with ElectricPower systems, IEEE Std., 1547–2003, pp. 1–16 (2010)
14. Kennedy, J., Eberhart, R.: Particle swarm optimization. IEEE International Conference onNeural Networks, pp. 1942–1948 (1995)
15. Kennedy, J., Eberhart, R. (1997). A discrete binary version of the particle swarm algorithm.IEEE International Conference on Computational Cybernetics and Simulation, pp. 4104–4108
16. Merlin, A., Back, H.: Search for minimum loss operating spanning tree configuration in anurban power distribution system. In: Proceedings of 5th Power Systems ComputingConference Cambridge, U.K., pp. 1–18, (1975)
17. Mitra, J., Singh, C.: Incorporating the DC load flow model in the decomposition-simulationmethod of multi-area reliability evaluation. IEEE Trans. on Power Syst. 11(3), 1245–1254(1996)
18. Mitra, J.: Application of computational Intelligence in optimal expansion of distributionsystems. In: Proceedings of IEEE PES General Meeting, pp. 1–8, (2008)
19. Moradi, V., Firuzabad, M.: Optimal switch placement in distribution systems using trinaryparticle swarm optimization algorithm. IEEE Trans. Power Del. 23(1), 271–279 (2008)
20. Overbye, T., Cheng X., Yan S.: A comparison of AC and DC power flow models for LMPcalculations. In: Proceedings 37th Annual Hawaii International Conference on SystemsScience, pp. 1–9 (2004)
21. Rao, R., Ravindra, K., Satish, K., Narasimham, S.: Power loss minimization in distributionsystem using network reconfiguration in the presence of distributed generation. IEEE Trans.Power Syst., 1–9 (2012)
22. Shirmohammadi, D., Hong, H.: Reconfiguration of electric distribution networks for resistiveline losses reduction. IEEE Trans. Power Del. 4(2), 671–679 (1989)
23. Skoonpong, A., Sirisumrannukul, S.: Network reconfiguration for reliability worth enhancementin distribution systems by simulated annealing. Proceedings of ECTI-CON, (2008)
24. Vallem, M., Mitra, J.: Siting and sizing of distributed generation for optimal microgridarchitecture. In Proceedings of 37th theNorthAmerican Power Symposium, pp. 611–616 (2005)
25. Ye Bin, Xiu-li, W., Be Zhao-hong, Xi-fan, W.: Distribution network reconfiguration forreliability worth enhancement. IEEE Conf. (1990)
26. Zhang, D., Fu, Z., Zhang, L.: An improved TS algorithm for loss minimum reconfiguration inlarge-scale distribution systems. Elect. Power Syst. Res. 77, 685–694 (2007)
27. Zhu, J.: Optimization of Power System Operation. Wiley-IEEE Press (2009)
Reliability-Constrained Optimal Distribution … 289