reliability and validity of a biomechanically based
TRANSCRIPT

University of KentuckyUKnowledge
Rehabilitation Sciences Faculty Publications Rehabilitation Sciences
6-2017
Reliability and Validity of a Biomechanically BasedAnalysis Method for the Tennis ServeNatalie L. MyersUniversity of Kentucky, [email protected]
W. Ben KiblerShoulder Center of Kentucky
Leah LambornUniversity of Kentucky, [email protected]
Belinda J. SmithWomen’s Tennis Association
Tony EnglishUniversity of Kentucky, [email protected]
See next page for additional authors
Right click to open a feedback form in a new tab to let us know how this document benefits you.
Follow this and additional works at: https://uknowledge.uky.edu/rehabsci_facpub
Part of the Physical Therapy Commons, and the Sports Sciences Commons
This Article is brought to you for free and open access by the Rehabilitation Sciences at UKnowledge. It has been accepted for inclusion inRehabilitation Sciences Faculty Publications by an authorized administrator of UKnowledge. For more information, please [email protected].
Repository CitationMyers, Natalie L.; Kibler, W. Ben; Lamborn, Leah; Smith, Belinda J.; English, Tony; Jacobs, Cale A.; and Uhl, Timothy L., "Reliabilityand Validity of a Biomechanically Based Analysis Method for the Tennis Serve" (2017). Rehabilitation Sciences Faculty Publications. 67.https://uknowledge.uky.edu/rehabsci_facpub/67

AuthorsNatalie L. Myers, W. Ben Kibler, Leah Lamborn, Belinda J. Smith, Tony English, Cale A. Jacobs, and TimothyL. Uhl
Reliability and Validity of a Biomechanically Based Analysis Method for the Tennis Serve
Notes/Citation InformationPublished in The International Journal of Sports Physical Therapy, v. 12, no. 3, p. 437-449.
© 2017 by the Sports Physical Therapy Section
The copyright holder has granted the permission for posting the article here.
This article is available at UKnowledge: https://uknowledge.uky.edu/rehabsci_facpub/67

The International Journal of Sports Physical Therapy | Volume 12, Number 3 | June 2017 | Page 437
ABSTRACTBackground: An observational tennis serve analysis (OTSA) tool was developed using previously established body positions from three-dimensional kinematic motion analysis studies. These positions, defined as nodes, have been associated with efficient force production and minimal joint loading. However, the tool has yet to be examined scientifically.
Purpose: The primary purpose of this investigation was to determine the inter-observer reliability for each node between two health care professionals (HCPs) that developed the OTSA, and secondarily to investigate the validity of the OTSA.
Methods: Two separate studies were performed to meet these objectives. An inter-observer reliability study preceded the validity study by examining 28 videos of players serving. Two HCPs graded each video and scored the presence or absence of obtaining each node.
Discriminant validity was determined in 33 tennis players using video taped records of three first serves. Serve mechanics were graded using the OSTA and categorized players into those with good (≥ 5) and poor (≤ 4) mechanics. Participants performed a series of field tests to evaluate trunk flexibility, lower extremity and trunk power, and dynamic balance.
Results: The group with good mechanics demonstrated greater backward trunk flexibility (p=0.02), greater rota-tional power (p=0.02), and higher single leg countermovement jump (p=0.05). Reliability of the OTSA ranged from K=0.36-1.0, with the majority of all the nodes displaying substantial reliability (K>0.61).
Conclusion: This study provides HCPs with a valid and reliable field tool used to assess serve mechanics. Physical characteristics of trunk mobility and power appear to discriminate serve mechanics between players. Future inter-vention studies are needed to determine if improvement in physical function contribute to improved serve mechanics.
Level of Evidence: 3
Key words: Functional testing, kinematic analysis, tennis serve
IJSP
TORIGINAL RESEARCH
RELIABILITY AND VALIDITY OF A BIOMECHANICALLY
BASED ANALYSIS METHOD FOR THE TENNIS SERVE
Natalie L. Myers, PhD, ATC, PES1
W. Ben Kibler, MD, FACSM2
Leah Lamborn, MS, ATC1
Belinda J. Smith, MPhty3
Tony English, PhD, PT1
Cale Jacobs, PhD, ATC1
Tim L. Uhl, PhD, PT, ATC, FNATA1
1 University of Kentucky, Lexington, KY, USA2 Shoulder Center of Kentucky, Lexington Clinic Orthopedics
Sports Medicine Center, Lexington, KY, USA 3 Women’s Tennis Association, St Petersburg, FL, USA
The authors wish to thank Dennis Van der Meer, Bruce Elliott PhD, Mark Kovacs PhD, Kathleen Stroia MS, ATC, PT, Todd Ellenbecker DPT, Paul Lubbers PhD, Raphael Bahamonde PhD, Murphy Jensen, and the Women’s Tennis Association Sport Sciences & Medicine staff for their contributions to the development of the serve analysis tool.
CORRESPONDING AUTHORNatalie L. Myers210c Charles T Wethington Building900 South LimestoneLexington, KY 40506-0200E-mail: [email protected]

The International Journal of Sports Physical Therapy | Volume 12, Number 3 | June 2017 | Page 438
INTRODUCTIONAn effective serve is a key component and can be a major weapon for success in tennis. Many coaches and health care professionals (HCPs) would agree that primary outcomes when developing and teach-ing the serve are to improve performance (specifi-cally serve velocity) and to prevent injury.1 Since the serve is the shot that initiates the start of each point, and it accounts for 60% of all strokes it is arguably the most important and predominant shot of the ser-vice game.2 The complex sequence of movements involved in the serve along with its repetitive nature makes it one of the most commonly researched strokes in the game of tennis. A player showing true mastery of the stroke is able to utilize the kinetic chain through a sequence of motions that originate at the lower limbs. These lower limb actions are followed by trunk rotation that ultimately leads to upper limb rotation.3 However, alterations in the kinetic chain during the serve may have implica-tions on injury and performance.
Researchers investigating the biomechanical demands associated with the tennis serve have successfully tar-geted the threats to serve performance and upper limb loads that contribute to upper extremity injury.1,3-11 Each of these researchers utilized three-dimensional (3D) motion analysis to investigate the kinematics and kinetics that accompany the serve. 3D analysis has been widely accepted by researchers as the gold standard in movement analysis.12 However this tech-nique cannot be easily utilized on court (outside envi-ronment) and is costly and time-consuming for HCPs and coaches who implement screening programs to plan protocols.13-15 Consequently, a field-based obser-vational analysis may be more practical for HCPs and coaches to evaluate tennis serve mechanics.
A field-based observational analysis must be quick, easy to use, allow a HCP or coach to provide almost immediate feedback, and demonstrate reliability and validity. With an understanding of the biome-chanical demands required during the tennis serve, researchers created a clinically applicable observa-tional tennis serve analysis (OTSA) tool to evalu-ate the mechanics of the serve. The tool, initially described in 2008,16 and later updated in 201317 pro-vided a detailed framework of specific positions rep-resenting normal mechanics, abnormal mechanics,
and potential strategies to improve altered mechan-ics.17 The OTSA was refined in 2013 to be performed on the court and to include video, in order to help improve the effectiveness and applicability of the analysis. The analysis assesses key body positions and motions throughout the kinetic chain that have been found to be associated with optimal ball speed and efficient force production for creating maximal energy with minimal energy expenditure. Addition-ally, these body positions help to mitigate joint load-ing to protect against injury. These specific body positions and motions have been defined as “nodes” and have been compiled through 3D motion analy-sis studies.1,3-11,18 The framework can be used visu-ally to evaluate the presence or absence of the nodes during the service motion.
The investigations reported in this paper were accordingly designed to determine the reliability and validity of the OTSA tool. The primary purpose was to determine the inter-observer reliability for each node between two health care professionals that developed the OTSA. It was hypothesized that the reliability would be greater than 0.4119 for the major-ity of the nine nodes of the OTSA. The secondary purpose was to investigate the validity of the OTSA by determining if a series of field tests to evaluate trunk flexibility and power, lower extremity power, and dynamic balance would discriminate between play-ers with good and poor serve mechanics as assessed by the OTSA. The authors’ hypothesized that players demonstrating good serve mechanics would perform better on a series of musculoskeletal field tests com-pared to those with poor serve mechanics.
METHODSTwo separate studies were undertaken to meet the objectives of performing a validation and reliability study. In order to be transparent in the methods and for clarity, the studies methods and results sections have been subdivided into two components.
SubjectsTwo samples of participants were used to document the reliability and validity of the OTSA. To deter-mine the inter-observer reliability of the OTSA video data from 28 professional women’s tennis players were analyzed. All players were actively participat-ing on the professional tour. Players were excluded

The International Journal of Sports Physical Therapy | Volume 12, Number 3 | June 2017 | Page 439
if diagnosed with a neurological disorder, or had a history of fracture and/or surgeries within a year of the video collection. The research team received a waiver of consent from The Lexington Clinic Ortho-pedic Research Review Board.
To investigate the validity of the OTSA a cross-sec-tional study was implemented on 33 healthy non-professional tennis players. Player characteristics are detailed in Table 1. Players were considered eligible if they participated in tennis at least once a week (college, high school, or recreational), had a United States Tennis Association National Tennis Rating (USTA NTR), and were not under medical care for a musculoskeletal condition that affected tennis play. Players were excluded if any of the play-ers had been diagnosed with a neurological disorder, or had a history of fractures and/or surgery within the past year. Prior to participation, all players gave informed consent approved by the University of Kentucky Institutional Review Board.
ProceduresObservational Tennis Serve Analysis (OTSA) ToolThe Women’s Tennis Association (WTA) in conjunc-tion with the Shoulder Center of Kentucky (Lexing-ton, KY) developed the OTSA as a field-based tool that can be used to assess tennis serve mechanics. The OTSA is divided into nine components, the first eight components are called nodes, and the last com-ponent is as assessment of motion. The first eight nodes are evaluated at maximal knee flexion while the last component is assessed during the entire serve motion, and represents the composite motion
of the entire serve. Each of the eight nodes and the composite motion are graded separately as present or absent, using specific criteria that define efficient and inefficient mechanics (Table 2). If a node is graded as present a score of one is recorded for that particular node, whereas a node that is graded absent is recorded as zero. A composite score is totaled by taking the sum of the individual nodes, with a maxi-mum score of nine representing excellent mechan-ics, and a zero representing poor mechanics.
INTER-OBSERVER RELIABILITYA retrospective analysis was performed to determine the inter-observer reliability of the OTSA. Twenty-eight service videos were supplied independently to two observers, an orthopedic surgeon (WBK) and a licensed physiotherapist (BS). Each video contained one service trial from the deuce court during match play. The digital camera was placed at the back cor-ner of the court at approximately 45° angle to the player’s back. The observers were blinded to player name. Both observers were experienced in tennis sports medicine (combined experience of 40 years) and were instrumental in creating the OTSA tool. Each observer independently evaluated each serve, using a standardized scoring sheet. The observ-ers reviewed the videos as much as needed using slow motion and freeze-frame during maximal knee bend. The two observers recorded categorical data for each of the nine components on each player.
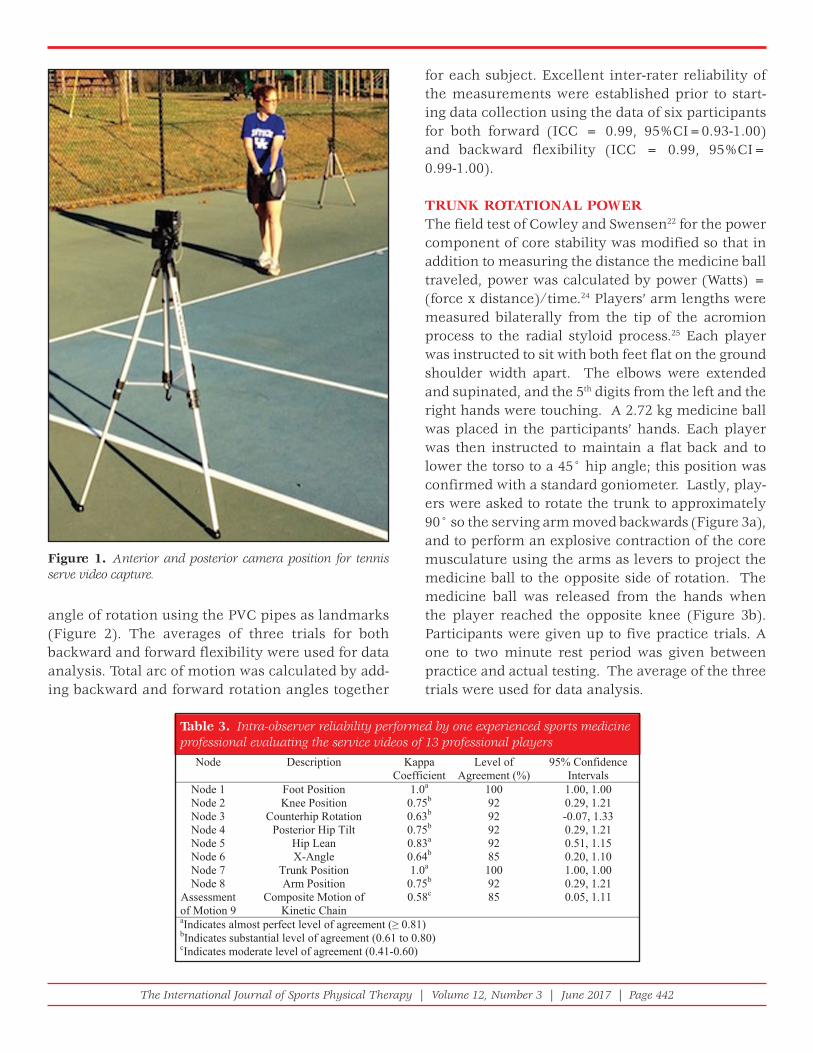
VALIDITYPrior to all data collection for the validity portion of this study each player underwent a standardized 10-minute warm-up period that included jogging, lower and upper extremity mobility drills, and no more than 10 practice serves from the deuce court. Following the warm-up, players were asked to per-form three of their best first serves. Each service trial was captured using two digital cameras (Pana-sonic HDC-HS60, Hamburg, Germany). One camera was positioned anteriorly to the participant, 20 feet from the baseline “T” of the court at a 20° angle. The second was positioned posterolaterally to the par-ticipant, 14 feet from the baseline “T” of the court at a 45° angle (Figure 1). These two camera positions were chosen as they elicited the best angles for view-ing all nine components associated with the OTSA.
Table 1. Demographic characteristics for players enrolled in validity study
evreSdooGMechanics
Poor Serve Mechanics
Sex 621elaM114elameF
61±839±32*egABody Mass Index* 23 ± 2 24 ± 3 Arm Length* 0.64 ± 0.08 m 0.57 ± 0.03 m USTA Ranking* 6 ± 0.6 4 ± 1.0 OTSA Composite Score*
6 ± 1 2 ± 1
*Represented with mean ± standard deviationm = meters USTA = United Stated Tennis Association OTSA = Observational Tennis Serve Analysis

The International Journal of Sports Physical Therapy | Volume 12, Number 3 | June 2017 | Page 440
Table 2. Observational Tennis Serve Analysis Tool Grading Scale
Efficient Mechanics Picture of Good
Mechanics
Inefficient Mechanics Picture of Bad Mechanics
Node 1: Foot Good: Back foot stays behind front foot
Bad: Back foot stays in front of front foot
Node 2: Knee
Good: Both knees to bend greater than 15°
Bad: Both knees bend less than or equal to 15°
Node 3: Counterhip Rotation
Good: The hip on back side is rotating away from the net
Bad: The hip on back side is not rotating away from the net
Node 4: Posterior hip tilt
Good: The hip on back side is dropping towards the ground
Bad: The hip on back side is not dropping towards the ground
Node 5: Hip Lean
Good: The hip on front side is not leaning forward towards the net
Bad: The hip on front side is leaning forward towards the net
Node 6: X-Angle
Good: x-angle describes the relationship between the shoulders and the hips and should be ≈ equal to 30°
Shoulders don’t rotate behind the hips
Bad: the x-angle is less than 30°
Shoulders rotate too far behind the hips Bad: the x-angle is greater than 30°
Node 7: Trunk
Good: Trunk rotation around a vertical axis
Bad: No trunk rotation, lateral trunk bending only, lumbar hyperextension, hyper-rotation, or hypo-rotation

The International Journal of Sports Physical Therapy | Volume 12, Number 3 | June 2017 | Page 441
chloride (PVC) pipes were used to create an angle to record trunk flexibility. One PVC pipe (1 meter long) was placed on the ground in between the foot and the knee in the coronal plane. Another PVC pipe was placed behind the players back and between the arms while the hands were placed on the hips. Trunk flexibility was expressed by the direction in which the serving shoulder was moving (backward or forward). For example, back-ward rotation for a right-handed server was performed by kneeling on the left knee while positioning the right foot in front of the kneeling leg and instructed to rotate the serving arm backwards. Forward flexibility was per-formed in an exact manner except players were kneel-ing on the right leg and instructed to rotate the serving arm forwards. Participants were asked to rotate as far as possible without losing balance and maintainingcorrect posture. The examiner stood behind and above the players and took a snapshot using a digital camera at the end range of motion.
ImageJ, an open source imaging processing sys-tem (https://imagej.net) was used to calculate the
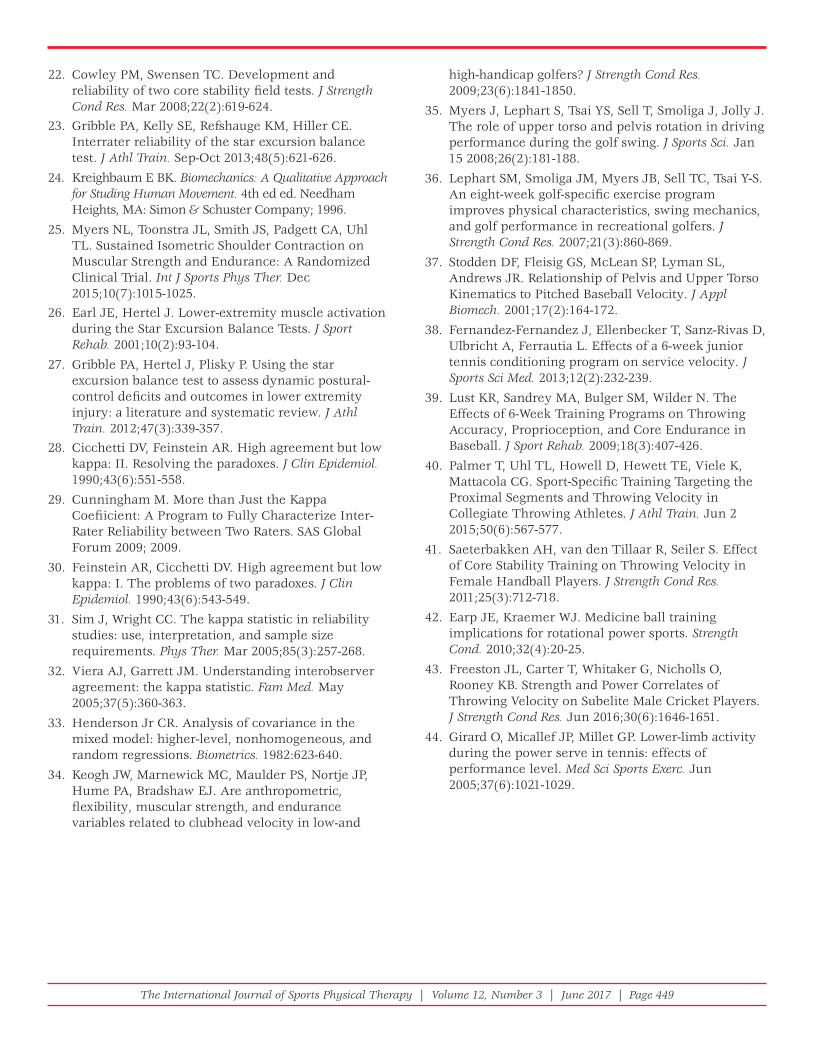
One member of the research team assessed serve mechanics of all participants’ using the OTSA. This member of the research team was familiar with the OTSA and had previously developed substantial intra-observer reliability (Table 3). Players were categorized into two groups based on their OTSA score; those with a composite score of ≥ 5/9 on the OTSA were considered to have good serve mechanics (n=16), whereas those with a score of ≤ 4/9 were considered to have poor serve mechanics (n=17). Serve videos were reviewed one week apart, and the intra-observer reliability for the composite score was excellent (ICC=0.95, 95% Confidence Interval: 0.84, 0.98). Following the record-ing of the serves each player underwent a series of field tests that measure aspects of kinetic chain func-tional capability: trunk flexibility,20 single and double leg countermovement vertical jump (CMJ),21 trunk rotational power,22 and dynamic balance.23
TRUNK FLEXIBILITYA variation of Aragon et al20 trunk rotation flexibility measure was adopted for this study. Two polyvinyl
Table 2. Observational Tennis Serve Analysis Tool Grading Scale (continued)
Efficient Mechanics Picture of Good
Mechanics
Inefficient Mechanics Picture of Bad Mechanics
Node 8: Arm Good: Shoulder in line with the plane of scapula
Bad: Hypercocking – shoulder behind plane of scapula
Hypococking – shoulder in front of plane of scapula
Assessment of Motion 9: Composite Motion of Kinetic Chain
Good: Use knee flexion and back leg drive to maximize ground reaction forces that push the body upward from the cocking position into ball impact
Picture represents end
stage of motion
(motion to be assessed
dynamically)
Copyright © WTA Tour Inc., The Shoulder Center of Kentucky. All Rights Reserved
Bad: Use trunk muscles to pull the trunk and arm from cocking into ball impact
Picture represents end stage of motion (motion to be
assessed dynamically)
*Note: Evaluate nodes 1-8 at maximum knee bend. Composite motion of kinetic chain
should be evaluated throughout entire motion.
The International Journal of Sports Physical Therapy | Volume 12, Number 3 | June 2017 | Page 442
angle of rotation using the PVC pipes as landmarks (Figure 2). The averages of three trials for both backward and forward flexibility were used for data analysis. Total arc of motion was calculated by add-ing backward and forward rotation angles together
for each subject. Excellent inter-rater reliability of the measurements were established prior to start-ing data collection using the data of six participants for both forward (ICC = 0.99, 95%CI=0.93-1.00) and backward flexibility (ICC = 0.99, 95%CI= 0.99-1.00).
TRUNK ROTATIONAL POWERThe field test of Cowley and Swensen22 for the power component of core stability was modified so that in addition to measuring the distance the medicine ball traveled, power was calculated by power (Watts) = (force x distance)/time.24 Players’ arm lengths were measured bilaterally from the tip of the acromion process to the radial styloid process.25 Each player was instructed to sit with both feet flat on the ground shoulder width apart. The elbows were extended and supinated, and the 5th digits from the left and the right hands were touching. A 2.72 kg medicine ball was placed in the participants’ hands. Each player was then instructed to maintain a flat back and to lower the torso to a 45° hip angle; this position was confirmed with a standard goniometer. Lastly, play-ers were asked to rotate the trunk to approximately 90° so the serving arm moved backwards (Figure 3a), and to perform an explosive contraction of the core musculature using the arms as levers to project the medicine ball to the opposite side of rotation. The medicine ball was released from the hands when the player reached the opposite knee (Figure 3b). Participants were given up to five practice trials. A one to two minute rest period was given between practice and actual testing. The average of the three trials were used for data analysis.
Figure 1. Anterior and posterior camera position for tennis serve video capture.
Table 3. Intra-observer reliability performed by one experienced sports medicine professional evaluating the service videos of 13 professional players
Node Description Kappa Coefficient
Level of Agreement (%)
95% Confidence Intervals
Node 1 Foot Position 1.0a 100 1.00, 1.00 Node 2 Knee Position 0.75b 92 0.29, 1.21 Node 3 Counterhip Rotation 0.63b 92 -0.07, 1.33 Node 4 Posterior Hip Tilt 0.75b 92 0.29, 1.21 Node 5 Hip Lean 0.83a 92 0.51, 1.15 Node 6 X-Angle 0.64b 85 0.20, 1.10Node 7 Trunk Position 1.0a 100 1.00, 1.00 Node 8 Arm Position 0.75b 92 0.29, 1.21
Assessment of Motion 9
Composite Motion of Kinetic Chain
0.58c 85 0.05, 1.11
aIndicates almost perfect level of agreement (≥ 0.81)bIndicates substantial level of agreement (0.61 to 0.80)cIndicates moderate level of agreement (0.41-0.60)

The International Journal of Sports Physical Therapy | Volume 12, Number 3 | June 2017 | Page 443
COUNTERMOVEMENT VERTICAL JUMPLower extremity power was assessed with double and single leg CMJ.21 All players were asked to maintain an upright position followed by a quick crouching action to propel the body into a maximal vertical jump. The participants were instructed to jump vertically as high as possible while keeping the legs straight in the air. The use of the arms to reach as high as possible was permitted as part of the movement. A familiarization period consisted of up to three practice jumps for both the double and single CMJ. A rest period of two minutes was given in between double and single legged jumps. The single leg jump was performed on the dominant leg (defined as the ipsilateral leg as serving arm).
A standard video camera was placed perpendicular to the plane of motion. All video motion-analysis data were analyzed using the same Dartfish soft-ware. To determine vertical jump height the follow-ing equation was used.21
A standard video camera was placed anteriorly to each player so the entire movement was filmed (medicine ball release to ground contact). All videos were uploaded and analyzed using video motion-analysis software (Dartfish 8 ProSuite; Dartfish, Fri-bourg, Switzerland) where distance in meters and time in seconds were calculated. The video cam-era was calibrated using a reference distance prior to the task. A meter stick was placed horizontally next to the player to calibrate the video recording of the ball toss. This step was essential in measuring distance within video motion-analysis as it provided a known distance in order to compute the distance each person threw. The start time of the movement was defined as the point in which the medicine ball crossed over the opposite leg just before release and ended at ball contact with the ground. The duration of the event was used to calculate power. A member of the research team used these same time points to measure the distance the medicine ball traveled in meters. The weight of the medicine ball was con-verted into 26.64 newtons, and represented force, the distance was represented in meters, and the time in seconds. Excellent inter-rater reliability of the measurements was established using the data of six participants for trunk rotational power (ICC = 0.98, 95%CI: 0.90-0.99).
Figure 2. Angle of rotation for backward trunk fl exibility on a right handed server.
Figure 3. a. Trunk rotational power starting position for a right handed server. b. Trunk rotational power ending position for a right handed server

The International Journal of Sports Physical Therapy | Volume 12, Number 3 | June 2017 | Page 444
In combination with the reliability statistics, several researchers have suggested the proportion of posi-tive agreement be calculated to provide readers with a clearer understanding of reliability. 28-32 Further-more, this proportion should be considered when a kappa paradox is present, in which a low kappa statistic accompanies a high level of observed agree-ment between observers.28,30 When this paradox is present, interpretation of the kappa on its own may not be meaningful, and calculation of the proportion of positive agreement should be generated to inter-pret the results.29 The following equation was used to calculate the proportion of positive agreement using the same data within the 2 x 2 contingency tables exported from SPSS when generating Kappa statistics.
Ppos = 2a / (N + a – d)
N = # of observations
a = true positive
d = true negative
The dependent measures from the field tests (trunk flexibility, rotational power/distance, CMJ, and dynamic balance) were analyzed separately using an analysis of covariance (ANCOVA) to determine if physical characteristics would demonstrate dif-ferences between those with good and poor serve mechanics. One player from the good serve mechan-ics group was unable to perform forward trunk flexibility; therefore this player was removed from flexibility analyses (forward, backward, and total motion) leaving 15 players data for statistical analy-sis in this group. All other analyses used data from all 17 players in the poor mechanics group and 16 players in the good mechanics group. An ANCOVA was utilized to remove bias that may contribute dif-ferences present within the two groups (Table 1).33 Chi square analysis was used for binomial data and independent T-test was used for continuous data. A chi-square revealed sex differences between the two groups (p=0.04), and independent t-test revealed a difference in age between the two groups (p<0.001). Arm length was found to be different between groups (p=0.006). All analyses incorporated sex and age as a covariate to account for group differences. Additionally, arm length was incorporated into trunk
TIA (time in air) jump height = ½ g (t/2)2
t = time in air, determined by time difference from the video recording from takeoff to landing as deter-mined by foot contact.
g = 9.8 m · sec−2
Excellent inter-rater reliability of the measurements was established using the data of six participants for both double leg (ICC =0.99, 95%CI= 0.98-1.00) and single leg (ICC = .97, 95%CI=0.80-0.99). The aver-age of the three double leg and single leg CMJs were used for data analysis.
DYNAMIC BALANCEDynamic balance was measured using the anterior direction of the Star Excursion Balance Test.26,27 Each player was given standardized verbal instructions along with a visual demonstration, followed by four practice trials.23,26 While barefoot, the participants then performed three test trails in the anterior direc-tion for each leg. A member of the research team measured leg length on each limb while the partici-pants lay supine. The distance in centimeters (cm) was recorded from the Anterior Superior Iliac Spine to the center of the ipsilateral medial malleolus. Reach distance was normalized to each participant’s limb length by dividing by the players’ leg length (cm) and multiplying by 100. The average normalized percent leg length score among the trials for each stance leg was used for data analysis. Excellent inter-rater reli-ability of the anterior reach Star Excursion Balance Test has been previously established (ICC = 0.92).23
Statistical Analysis Percentage of observed agreement and kappa (K) coefficients were used to investigate inter-observer reliability for each of the nine components of the OTSA. K was interpreted using the following scale: ≤ 0 = poor agreement, .01-.20 = slight agreement, .21-.40 = fair agreement, .41-.60 = moderate agree-ment, .61-.80 = substantial agreement, and .81-1 = almost perfect agreement.19 A final composite score was calculated for each of the 28 players by sum-ming together the individual scores of each of the nine components. To determine the inter-rater reli-ability of the total composite score, an Intraclass Correlation Coefficient (ICC) was utilized.

The International Journal of Sports Physical Therapy | Volume 12, Number 3 | June 2017 | Page 445
distance were greater in those with good mechan-ics compared to poor mechanics when adjusting for age, sex, and arm length. Dominant single leg CMJ was also greater in those with good mechan-ics by 10cm. There were no significant differences between groups for forward trunk flexibility, double leg CMJ, or dynamic balance (Table 5).
DISCUSSION The OTSA was developed using kinematic findings from 3D motion analysis studies. The developers of this tool suggested the analysis might be practical for coaches and HCPs to evaluate serve mechanics in the absence of costly 3D biomechanical equipment. However, the practicality of such a tool cannot be suggested without basic psychometric properties. Therefore, the current study investigated the validity and inter-observer reliability between the two HCPs that helped to create the OTSA. It was hypothesized that players demonstrating good serve mechanics would perform better on a series of musculoskel-etal field tests compared to those with poor serve mechanics. The hypothesis was partially supported as five measures were found to differentiate those with good and poor mechanics. Players with good mechanics demonstrated approximately 11° more backward trunk flexibility and 23° more total trunk rotational motion. Those with good serve mechanics generated 46 more watts of trunk rotational power,
rotational power and distance comparisons. All data were analyzed using Statistical Program for the Social Sciences (SPSS) version 21.0 (IBM Corp. Armonk, NY, USA). A α level of p ≤ 0.05 was considered significant.
RESULTS
ReliabilityThe percentage of observed agreement between the two observers varied by node and is presented in Table 4. The kappa scores ranged from 0.36 to 1.0, and the level of agreement ranged from 78 to 100% agreement. Five out of the nine nodes scored K>0.61. The average composite score for Rater 1 was 7 ± 2.1 and Rater 2 was 7 ± 2.2. There was excellent inter-observer reliability between the two raters using the composite score (ICC = 0.90, 95% CI: 0.847-0.985). The kappa paradox was present in the other four nodes (2, 5, 7, 8) with lower Kappa scores. The proportions of positive agreement for these four nodes range from 0.57 to .96 and are also presented in Table 4.
Validity Trunk flexibility and power measures discriminated between the two groups (Table 5). Backward trunk flexibility and total arc of motion were significantly greater in those with good mechanics compared to those with poor mechanics when adjusting for age and sex. Similarly, trunk rotational power and
Table 4. Inter-observer reliability between two experienced sports medicine professionals evaluating 28 tennis serve videos
Node Percentage of Observed
Agreement (%)
Kappa Coefficient 95% Confidence
Intervals
Proportion of Positive Agreement
Node 1: Foot Position 89 0.77b 0.53, 1.01 0.85 Node 2: Knee Position 78 0.43c 0.02, 0.84 0.57 Node 3: Counterhip Rotation
96 0.84a 0.53, 1.15 0.97
Node 4: Posterior Hip Tilt
100 1.0a 1.00, 1.00 1.00
Node 5: Hip Lean 89 0.36d -0.54, 1.26 0.94 Node 6: X-angle 96 0.78 b 0.20, 1.36 0.98 Node 7: Trunk Position 92 0.47 c -0.24, 1.18 0.96 Node 8: Arm Position 85 0.51c 0.07, 0.95 0.91 Assessment of Motion 9: Composite Motion of Kinetic Chain
96 0.86a 0.61, 1.11 0.97
aIndicates almost perfect level of agreement (≥ 0.81) bIndicates substantial level of agreement (0.61 to 0.80) cIndicates moderate level of agreement (0.41-0.60) dIndicates fair level of agreement (0.21-0.40)

The International Journal of Sports Physical Therapy | Volume 12, Number 3 | June 2017 | Page 446
agreement value reaching near one, (0.94 in this case) it can be interpreted that the decline in kappa is a result of the high prevalence of “yes” responses (24 responses) compared to “no” responses (one response) between the observers.29 The kappa value represent-ing nodes five, seven, and eight seems to be underes-timating the true agreement between these two raters as the proportion of positive agreement is large pro-viding an additional method to interpreting the data that may help to provide a clearer picture.29
Results of the present study suggest that trunk flex-ibility and power capacity of both the trunk and lower extremity are key contributions to good serve mechanics. Tennis researchers have investigated the relationship between rotational trunk kinemat-ics during the serve and serve velocity. Elite players displaying trunk rotation about the anteroposterior and transverse axis early in the service motion had improved serve speeds compared to those demonstrat-ing rotation later in the motion.1 Consistent with the findings of this study, lower handicapped golfers dem-onstrated 10° more torso flexibility than those with higher handicaps.34 Previous authors have indicated that poor torso flexibility may inhibit the mechanics of the golf swing, specifically the X factor (or x-angle), thus diminishing drive distance and decreasing veloc-ity.35,36 The role of torso rotation has also been demon-
had a greater throwing distance on average of two meters (m) during the trunk rotational power test, and jumped an average 10cm higher on the domi-nant single leg CMJ compared to players with poor mechanics. Additionally, it was hypothesized that the inter-observer reliability would be greater than 0.41 for the majority of the nine nodes. This study supported that hypothesis as 89% of the nodes gen-erated moderate to almost perfect agreement. How-ever, caution must be taken when interpreting the kappa values of the nodes generating fair to mod-erate agreement, as the kappa paradox was present within these four nodes.
The kappa is “affected by the prevalence of the finding under consideration much like prediction values are affected by the prevalence of the disease under con-sideration.”30 p.362,32 For example, the low kappa value (0.36) associated with node five presents with a per-centage of observed agreement of 89% (two observers in agreement 25 out of 28 observations). This occurred because 24 out of the 25 agreed responses were that players did exhibit forward hip lean, and only one time did the raters agree that the athlete did not exhibit forward hip lean during the serve. Therefore, there is much agreement among the observers, but there is an uneven distribution of observations within the contingency table. With the proportion of positive
Table 5. Means ± standard deviations for all dependent measures between groups
Good Serve Mechanics
Poor Serve Mechanics
p-Value Cohen D Effect Size
Trunk Flexibility Measuresa
(degrees)
Backward Trunk Flexibility 60.71 ± 10.82° 49.39 ± 14.85° 0.02 0.94Forward Trunk Flexibility 57.97 ± 14.28° 46.31 ± 18.25° 0.09 0.71
Total Arc of Motion 118.68 ± 23.39° 95.70 ± 28.36° 0.02 0.88 Power Measures
Trunk Rotational Power (Watts)a,b
165.20 ± 30.90 118.76 ± 22.25 0.02 1.73
Trunk Rotation for Distance (meters)a,b
5.02 ± 1.35 2.68 ± 0.70 0.002 2.20
Double Leg CMJ (meters)a 0.41 ± 0.11 0.26 ± 0.08 0.33 1.57 Single Leg CMJ (meters)a 0.22 ± 0.05 0.12 ± 0.05 0.05 2.00
Dynamic Balance a
Dominant Anterior Leg Reach (reach distance in cm/leg
length in cm*100)
66.17 ± 5.52% 63.32 ± 7.09% 0.30 0.45
Non-Dominant Anterior Leg Reach (reach distance in
cm/leg length in cm*100)
67.03 ± 5.02% 63.53 ± 6.87% 0.31 0.58
aANCOVA model corrected for age, and sex bANCOVA model corrected for age, sex, and arm-length

The International Journal of Sports Physical Therapy | Volume 12, Number 3 | June 2017 | Page 447
In this study, single leg CMJ height on the dominant leg revealed a 10-centimeter difference between the two groups while the double leg CMJ showed no dif-ference between the groups. While this study did not measure lower extremity forces, these findings may suggest that those with good mechanics are able to maximize back leg drive up and through the serve, as this is the basis for proper hip motion and subse-quent acceleration. This is consistent with the work of Girard et al,44 who showed elite tennis players acti-vate the dominant leg muscles earlier in the tennis motion than less skilled players, and of Whiteside et al11 who showed elite adult female tennis players to have greater dominant leg triple extension velocities and racquet velocities at impact compared to prepu-bescent elite players. The importance of this finding is that each leg should be independently evaluated when screening players for potential lower extrem-ity power deficits.
There are several advantages to this type of observa-tional analysis. First, it is portable to practice or tour-nament sites, and can be implemented by using a standard video camera. Second, it allows coaches and HCPs to easily identify mechanical flaws within the service motion to improve performance and diminish possible injury risk. Third, by specifically demonstrat-ing failures to achieve specific nodes, it can highlight areas for more comprehensive musculoskeletal eval-uation, treatment, and conditioning. In turn, coaches and HCPs may evaluate specific body regions that aid in the improvement of the serve technique. With the identification of node deficiencies it may be possible to develop programs to improve mechanics, perfor-mance, and ultimately reduce injury risk.
These investigations have limitations. First, serve mechanics and power were not assessed using 3D kinematic and kinetic analysis. However, the proto-col used to measure kinematics and power reflects practical field tests. Second, the outcomes of the ten-nis serves were not recorded. The authors did not document if the three service trials were considered playable points. Future studies should document the outcome of each service trial to combat this limita-tion. Third, two experienced sports medicine profes-sionals who were involved in the development of the method performed the analysis. Future research is underway to address this specific limitation by incor-
strated to contribute to enhanced throwing velocity in baseball players.37 Additionally, multi-modal training regimes incorporating the lumbopelvic hip complex and torso have shown to be effective for improving serve velocity,38 throwing accuracy,39 and ball veloc-ity in overhead athletes.40,41 The results of this study are consistent with literature pertaining to other rota-tional sports, and should encourage tennis profes-sionals to consider trunk flexibility as an important screening tool for the assessment of serve mechanics. If deficits are present, a training regimen concentrat-ing on trunk mobility should be considered, as trunk rotation movement appears to be a contributing factor in players exhibiting improved performance and as this study showed good serve mechanics.
Tennis is considered a rotational power sport requir-ing explosive movements in the transverse plane.42 Trunk rotation is an imperative motion necessary for generating power during all three of the major strokes to create velocity at ball impact. To the author’s knowledge, this is the first study to date that has calculated power output in Watts using a previ-ously established field based measure that assessed the power component of core stability.22 Previous research investigated the effects of a power stability training intervention integrating multi-planar rota-tional torso movement on ball velocity and muscu-lar power in collegiate throwing athletes.40 Palmer and colleagues40 found that power stability training improved throwing velocity by 5 km/h and muscu-lar power by 85W when compared to an endurance training protocol. Although the testing procedures for trunk power was different in the two studies, the power values of 165 ± 31 watts in good performers are comparable to the pre-intervention trunk power values of 248 ± 128 Watts. Differences between the actual averages in this study and the Palmer et al study may also be attributed to participant popu-lation and the differences in testing maneuvers.40 While the current study did not include an interven-tion component, a field test identifying significant trunk rotational power differences could be valu-able in future intervention and performance assess-ments. Therefore, assessing dynamic trunk power may be helpful in determining players that need future intervention as trunk rotational power is positively correlated with performance in rotational sports.40,43

The International Journal of Sports Physical Therapy | Volume 12, Number 3 | June 2017 | Page 448
8. Martin C, Kulpa R, Delamarche P, Bideau B. Professional tennis players’ serve: correlation between segmental angular momentums and ball velocity. Sports Biomech. 2013;12(1):2-14.
9. Martin C, Bideau B, Ropars M, Delamarche P, Kulpa R. Upper limb joint kinetic analysis during tennis serve: Assessment of competitive level on effi ciency and injury risks. Scand J Med Sci Sports. 2014;24(4):700-707.
10 . Martin C, Bideau B, Bideau N, Nicolas G, Delamarche P, Kulpa R. Energy Flow Analysis During the Tennis Serve: Comparison Between Injured and Noninjured Tennis Players. Am J Sports Med. Aug 28 2014.
11 . Whiteside D, Elliott B, Lay B, Reid M. The effect of age on discrete kinematics of the elite female tennis serve. J Appl Biomech. Oct 2013;29(5):573-582.
12 . Ford KR, Myer GD, Hewett TE. Reliability of landing 3D motion analysis: implications for longitudinal analyses. Med Sci Sports Exerc. Nov 2007;39(11):2021-2028.
13 . Ferrarello F, Bianchi VA, Baccini M, et al. Tools for observational gait analysis in patients with stroke: a systematic review. Phys Ther. Dec 2013;93(12):1673-1685.
14 . Krebs DE, Edelstein JE, Fishman S. Reliability of observational kinematic gait analysis. Phys Ther. 1985;65(7):1027-1033.
15 . Martin K, Hoover D, Wagoner E, et al. Development and reliability of an observational gait analysis tool for children with Down syndrome. Pediatr Phys Ther. Fall 2009;21(3):261-268.
16 . Lintner D, Noonan TJ, Kibler WB. Injury Patterns and Biomechanics of the Athlete’s Shoulder. Clin Sports Med. 2008;27(4):527-551.
17 . Kibler WB, Wilkes T, Sciascia A. Mechanics and Pathomechanics in the Overhead Athlete. Clin Sports Med. 2013;32(4):637-651.
18. Reid M, Elliott B, Alderson J. Shoulder joint loading in the high performance fl at and kick tennis serves. Br J Sports Med. Dec 2007;41(12):884-889; discussion 889.
19. Landis JR, Koch GG. The measurement of observer agreement for categorical data. Biometrics. 1977;33:159-174.
20. Aragon VJ, Oyama S, Oliaro SM, Padua DA, Myers JB. Trunk-rotation fl exibility in collegiate softball players with or without a history of shoulder or elbow injury. J Athl Train. Sep-Oct 2012;47(5):507-513.
21. Moir GL. Three Different Methods of Calculating Vertical Jump Height from Force Platform Data in Men and Women. Meas Phys Educ Exerc Sci. 2008;12(4):207-218.
porating more HCPs and tennis coaches that have not developed the OTSA tool into a larger reliability study. Lastly, future research should investigate if a standardized training intervention can improve the mechanics of the tennis serve. Based on the current results, an intervention should likely incorporate trunk flexibility and both trunk and lower extremity interventions as these components were able to dif-ferentiate those with good and poor serve mechanics.
CONCLUSIONThe OTSA has a high agreement between two expe-rienced observers, indicating good to excellent reli-ability. This system has the potential to help coaches, players, and HCPs better analyze the tennis serve motion. This study demonstrated that specific physi-cal characteristics can differentiate players with good and poor serve mechanics as defined by the OTSA scores. Specifically, trunk rotation and power capac-ity of the trunk and lower extremity are key areas that may contribute to poor serve mechanics and may be reasonable starting points to address in interventions that may enhance serve mechanics and performance.
REFERENCES 1. Martin C, Kulpa R, Ropars M, Delamarche P, Bideau
B. Identifi cation of temporal pathomechanical factors during the tennis serve. Med Sci Sports Exerc. 2013;45(11):2113-2119.
2. Johnson CD, McHugh MP. Performance demands of professional male tennis players. Br J Sports Med. 2006;40(8):696-699.
3. Elliott B, Fleisig G, Nicholls R, Escamilia R. Technique effects on upper limb loading in the tennis serve. Aust J Sci Med Sport. Mar 2003;6(1):76-87.
4. Campbell A, Straker L, O’Sullivan P, Elliott B, Reid M. Lumbar loading in the elite adolescent tennis serve: link to low back pain. Med Sci Sports Exerc. Aug 2013;45(8):1562-1568.
5. Chow JW, Park S-A, Tillman MD. Lower trunk kinematics and muscle activity during different types of tennis serves. Sports Med Arthrosc Rehabil Ther Technol. 2009;1(1):24-24.
6. Elliott B, Wood G. The biomechanics of the foot-up and foot-back tennis service techniques. Aust J Sports Sci. 1983;3(2):3-6.
7. Girard O, Micallef JP, Millet GP. Influence of restricted knee motion during the flat first serve in tennis. J Strength Cond Res. Aug 2007;21(3):950-957.
The International Journal of Sports Physical Therapy | Volume 12, Number 3 | June 2017 | Page 449
high-handicap golfers? J Strength Cond Res. 2009;23(6):1841-1850.
35. Myers J, Lephart S, Tsai YS, Sell T, Smoliga J, Jolly J. The role of upper torso and pelvis rotation in driving performance during the golf swing. J Sports Sci. Jan 15 2008;26(2):181-188.
36. Lephart SM, Smoliga JM, Myers JB, Sell TC, Tsai Y-S. An eight-week golf-specifi c exercise program improves physical characteristics, swing mechanics, and golf performance in recreational golfers. J Strength Cond Res. 2007;21(3):860-869.
37. Stodden DF, Fleisig GS, McLean SP, Lyman SL, Andrews JR. Relationship of Pelvis and Upper Torso Kinematics to Pitched Baseball Velocity. J Appl Biomech. 2001;17(2):164-172.
38. Fernandez-Fernandez J, Ellenbecker T, Sanz-Rivas D, Ulbricht A, Ferrautia L. Effects of a 6-week junior tennis conditioning program on service velocity. J Sports Sci Med. 2013;12(2):232-239.
39. Lust KR, Sandrey MA, Bulger SM, Wilder N. The Effects of 6-Week Training Programs on Throwing Accuracy, Proprioception, and Core Endurance in Baseball. J Sport Rehab. 2009;18(3):407-426.
40. Palmer T, Uhl TL, Howell D, Hewett TE, Viele K, Mattacola CG. Sport-Specifi c Training Targeting the Proximal Segments and Throwing Velocity in Collegiate Throwing Athletes. J Athl Train. Jun 2 2015;50(6):567-577.
41. Saeterbakken AH, van den Tillaar R, Seiler S. Effect of Core Stability Training on Throwing Velocity in Female Handball Players. J Strength Cond Res. 2011;25(3):712-718.
42. Earp JE, Kraemer WJ. Medicine ball training implications for rotational power sports. Strength Cond. 2010;32(4):20-25.
43. Freeston JL, Carter T, Whitaker G, Nicholls O, Rooney KB. Strength and Power Correlates of Throwing Velocity on Subelite Male Cricket Players. J Strength Cond Res. Jun 2016;30(6):1646-1651.
44. Girard O, Micallef JP, Millet GP. Lower-limb activity during the power serve in tennis: effects of performance level. Med Sci Sports Exerc. Jun 2005;37(6):1021-1029.
22. Cowley PM, Swensen TC. Development and reliability of two core stability fi eld tests. J Strength Cond Res. Mar 2008;22(2):619-624.
23. Gribble PA, Kelly SE, Refshauge KM, Hiller CE. Interrater reliability of the star excursion balance test. J Athl Train. Sep-Oct 2013;48(5):621-626.
24. Kreighbaum E BK. Biomechanics: A Qualitative Approach for Studing Human Movement. 4th ed ed. Needham Heights, MA: Simon & Schuster Company; 1996.
25. Myers NL, Toonstra JL, Smith JS, Padgett CA, Uhl TL. Sustained Isometric Shoulder Contraction on Muscular Strength and Endurance: A Randomized Clinical Trial. Int J Sports Phys Ther. Dec 2015;10(7):1015-1025.
26. Earl JE, Hertel J. Lower-extremity muscle activation during the Star Excursion Balance Tests. J Sport Rehab. 2001;10(2):93-104.
27. Gribble PA, Hertel J, Plisky P. Using the star excursion balance test to assess dynamic postural-control defi cits and outcomes in lower extremity injury: a literature and systematic review. J Athl Train. 2012;47(3):339-357.
28. Cicchetti DV, Feinstein AR. High agreement but low kappa: II. Resolving the paradoxes. J Clin Epidemiol. 1990;43(6):551-558.
29. Cunningham M. More than Just the Kappa Coefi icient: A Program to Fully Characterize Inter-Rater Reliability between Two Raters. SAS Global Forum 2009; 2009.
30. Feinstein AR, Cicchetti DV. High agreement but low kappa: I. The problems of two paradoxes. J Clin Epidemiol. 1990;43(6):543-549.
31. Sim J, Wright CC. The kappa statistic in reliability studies: use, interpretation, and sample size requirements. Phys Ther. Mar 2005;85(3):257-268.
32. Viera AJ, Garrett JM. Understanding interobserver agreement: the kappa statistic. Fam Med. May 2005;37(5):360-363.
33. Henderson Jr CR. Analysis of covariance in the mixed model: higher-level, nonhomogeneous, and random regressions. Biometrics. 1982:623-640.
34. Keogh JW, Marnewick MC, Maulder PS, Nortje JP, Hume PA, Bradshaw EJ. Are anthropometric, fl exibility, muscular strength, and endurance variables related to clubhead velocity in low-and