reliability and analytics - ringcentral
TRANSCRIPT

Reliability and Analytics
Curtis Peterson
SVP of Global Operations

COLLABORATIVECOMMUNICATIONS
Outbound/BlendedCustomer Engagement
DigitalCustomer
Engagement
ContactCenter
Video andMeetings
TeamMessaging
Cloud PBX

RingCentral’s core foundation
99.999% reliability
Secure & compliant
Quality of service
Global footprint
Modern cloud architecture

Carrier-grade core tenets
Multi-tenantMicroservices
Global
QUALITY SECURITYSCALABILITY REDUNDANCY
Network peeringStandards-based QoS
QoS dashboards
Secure voice Data encryption at rest
SSL data security
Geo-redundantDistributed
24/7/365 NOC

Global operations
Data centers(Private & multi-cloud)
28RingCentral
offices
12R&D centers
7Customer supportlocations
5Workforce
4,000+

RingCentral global delivery footprint
Global Office
Virtual Numbers
Gateway Solution

Enterprise connectivity options
Enterprise
Branch officeSmall/home office
Mobile user
DIRECT CONNECT
MPLS
CABLE/DSL
LTE BROADBAND
3G/4G/LTE
SD-WAN
5G

SD-WAN certification program
• Partnering program/certification
• Many options—many networks
• Enhance QoS
• Instant failover—no dropped media
• Single RingCentral profile
• Customer network visibility

RingCentral security and fraud prevention ecosystem
Network, VoIP, and application security
Cloud security infrastructure
Monitoring and analytics
Compliance and certifications

GLOBAL
RingCentral’s approach to analyticsMake it easy to discover the trends that an admin truly has control over—and monitor impact.
Customer environment
Network environment
Daily, weekly, or longer
COMPREHENSIVE UNIFIED EXPERIENCE
Hard phone, mobile
Desktop, web
WiFi, ethernet, roaming
Geolocation monitors
Early warning alerts
Filter false positives
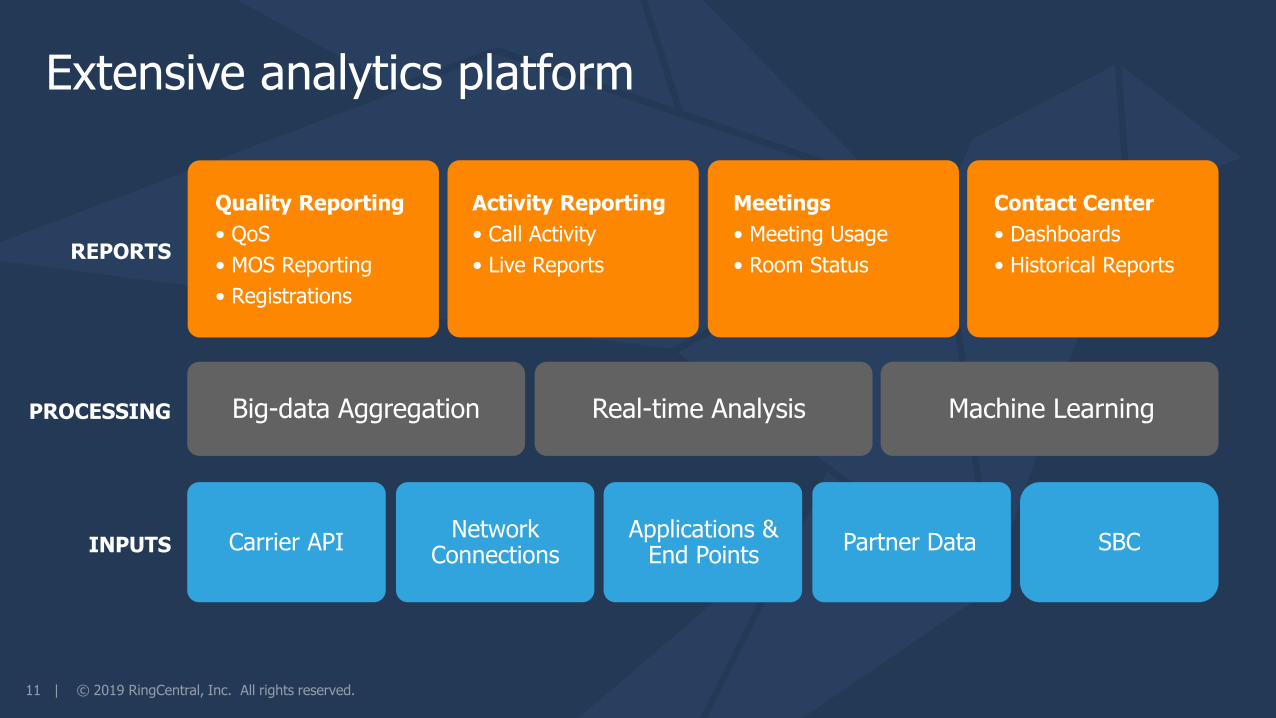
Extensive analytics platform
Big-data Aggregation
INPUTS
PROCESSING
REPORTS
Carrier APINetwork
ConnectionsApplications &
End PointsPartner Data SBC
Real-time Analysis Machine Learning
Quality Reporting
• QoS
• MOS Reporting
• Registrations
Activity Reporting
• Call Activity
• Live Reports
Meetings
• Meeting Usage
• Room Status
Contact Center
• Dashboards
• Historical Reports

Real time
Worldwide and location
Enterprise grade
Alerts
Automated monitoring
Proactive notifications
Fully customizable
Actionable insights for enterprise IT admin
Quality of service
At-a-glance insights
Call detail depth
Network troubleshooting
Device status

Actual RingCentral AI Example:Datasets for MOS

• Customers need a way to troubleshoot quality.
• MOS score: 1=poor, 5=perfect.
• Billions of calls.
• Millions of endpoints.
• Each “leg” of a call generates data.
• Need to present information within seconds.
• The devices, network, and infrastructure are global.
Measuring media quality at scale
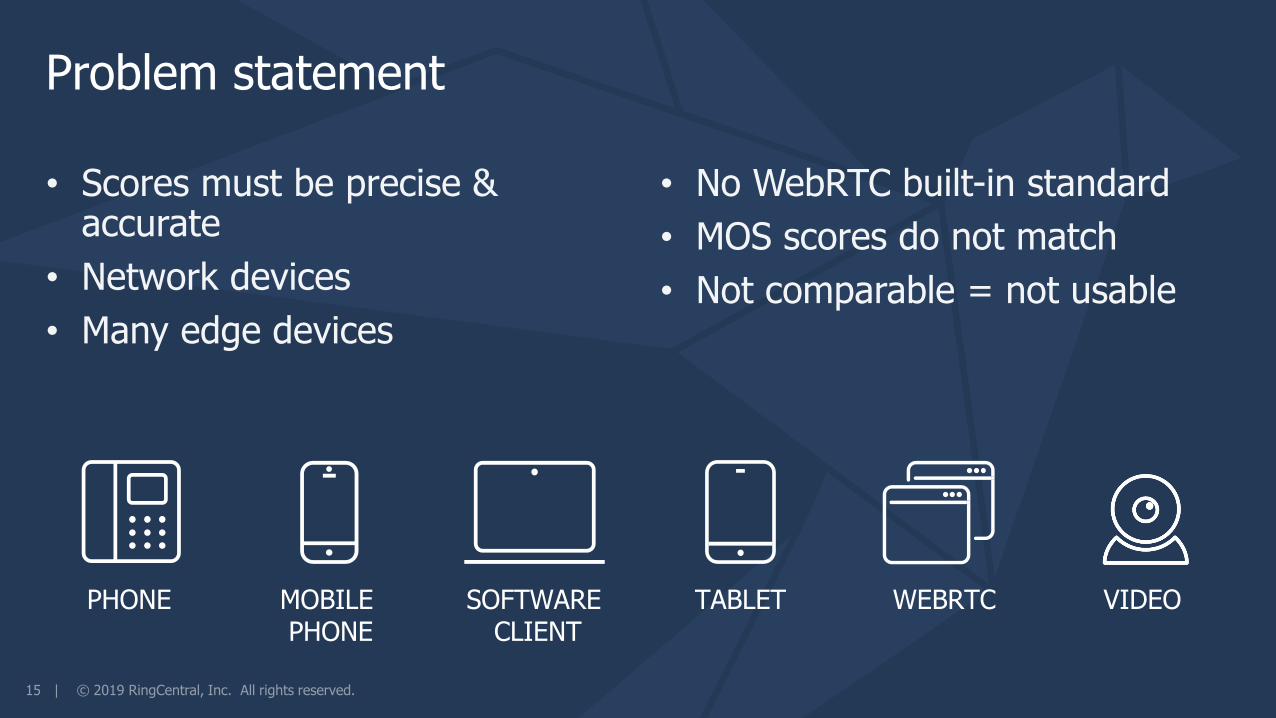
Problem statement
PHONE MOBILE PHONE
SOFTWARE CLIENT
TABLET WEBRTC VIDEO
• Scores must be precise & accurate
• Network devices
• Many edge devices
• No WebRTC built-in standard
• MOS scores do not match
• Not comparable = not usable

ACME
NA
Example: MOS score measurement
4.1 4.1 4.1
4.14.14.13.5
SBCMedia
server(HMP) User device Carrier
SBC
RTCPXR
HMP SBC
HMP SONUS
RingCentral data centers Carrier networkCustomer network, ISP

Training dataTakes approximately 1M records to achieve >96% accuracy
SOURCE EXAMPLES HOW USED
DeviceHMP, SBC, endpoint like phone or web browser
Input layer—higher weighting
CODEC g.711, opus, 9.729, etc.
Input layer
Packet loss 0-100
Jitter 0-any integer
Peak jitter 0-any integer
Latency 0-any integer
Burst loss Varies
Hidden layers
Packets out of order Varies, integer
Echo estimator Varies
Vendor proprietary info Varies
Nearly 10,000 unique Varies

Data architectureScale, speed, and high availability drive design.
HMP
Network probes
User devices
Source data
Kafka clusters
Data centers
Kafka clusters
Training
Processing
Data repository
Application & web
SBC
Autoscaling & containerized

Training model
• Deep neural network
• 10,000+ parameters
• 500 clusters (output neurons)
• Trained on 1M+ records
• Above 96% prediction rate
• Retrain on new devices
Input layer
QoS statistics, endpoint info, codec, firmware, net type, etc.
Hidden layers
4 hidden layers x 64 neurons
Output layer
MOS score from 001 to500
Packet loss
Jitter avg.
Latency
Codec
Discard rateBurst densityEndpoint typeFirmware

Results
• >96% accuracy on all data sources
• 460% more degree of precision (DOP) than required
(75th percentile human can only distinguish .46 difference in MOS)
• Unified and comparable results across data sets
• Simple user interface to distinguish data
Customer Portal with unified QOS
listed in top reasons enterprises
select RingCentral. Reduction in
customer support cases on QoS.

Quality of service User profile
Alerts Device status

Next Steps
• Stay and learn more about RingCentral’s products
• Get a personalized demo at the booth

Thank you