released august 19th, 2016 - fundamental research corp. has updated their research using exp world...
TRANSCRIPT

Siddharth Rajeev, B.Tech, MBA, CFA Analyst
August 19, 2016
2016 Fundamental Research Corp. “10+ Years of Bringing Undiscovered Investment Opportunities to the Forefront” www.researchfrc.com
PLEASE READ THE IMPORTANT DISCLOSURES AT THE BACK OF THIS REPORT
eXp World Holdings, Inc. (OTCQB: EXPI): Q2-2016 revenues blow past expectations
Sector/Industry: Real Estate / Brokerage expworldholdings.com
Market Data (as of August 19, 2016)
Current Price US$2.84
Fair Value US$4.06
Rating* BUY
Risk* 4
52 Week Range US$0.51 - US$3.15
Shares O/S 51.13 mm
Market Cap US$145.21 mm
Current Yield N/A
P/E (forward) N/A
P/B N/A
YoY Return 305.7%
YoY OTCQX 1.1% *See back of report for rating and risk definitions
* All of the figures are in US$ unless otherwise specified.
Highlights
� eXp World Holdings, Inc. (“company”, “eXp”) reported record revenues of $13.28 million in Q2-2016, up 138% YOY. In the six month period, revenues were $20.42 million, up by 126% YOY.
� eXp’s share price is up by 143% since we initiated coverage on April 5, 2016.
� The significant increase in share price prompted the company to report $6.60 million in stock based compensation in the quarter.
� Excluding stock based compensation, the company would have reported net profit of $0.59 million (EPS: $0.01) versus $0.06 million (EPS: $0.00) in Q2-2015.
� We are raising our revenue forecast for 2016 from $40.50 million to $48.94 million.
� The company maintains a reasonably healthy balance sheet, with no debt.
� In July 2016, the company appointed two high profile individuals to its board. The company also hired a Chief Strategy Officer/General Counsel.
� Since our previous report in May 2016, the company has expanded its membership count by 31%, from 1,204 to 1,580. Management has raised their target from 1,800+ to 2,100+ members by the end of 2016.
� We are raising our fair value estimate from $3.35 to $4.06 per share.
Key Financial Data
(in US$); YE - Dec 31 2011 2012 2013 2014 2015 2016E 2017E
Revenues 4,199,617 6,706,145 10,701,280 13,368,905 22,866,787 48,937,500 82,500,000
Gross Margin 18.7% 15.6% 16.8% 17.0% 14.9% 13.8% 14.0%
EBITDA 23,109 (64,740) (1,114,166) 47,925 (4,472,498) (5,252,119) 2,273,128
Net Income 13,496 (75,492) (1,118,861) 103,843 (4,581,449) (5,307,217) 1,411,208
EPS (basic) 0.00 (0.00) (0.00) 0.00 (0.09) (0.10) 0.03
Debt to Capital 143.9% -815.6% 81.0% 13.0% 0.0% 0.0% 0.0%

Page 2
2016 Fundamental Research Corp. “10+ Years of Bringing Undiscovered Investment Opportunities to the Forefront” www.researchfrc.com
PLEASE READ THE IMPORTANT DISCLOSURES AT THE BACK OF THIS REPORT
Membership
count rises to
1,580
In July 2016, the company announced that it has commenced operations in two additional states (New Jersey and Utah). The company had added four new states in May. eXp now operates in 40 states across the U.S. Since our previous report in May 2016, the company has expanded its membership count by 31%, from 1,204 to 1,580. The platform only had 665 real estate brokers and agents as members as of June 30, 2015. The following chart shows management`s guidance. Their goal is to have 2,100+
members by the end of 2016, 3,500+ by the end of 2017, and 10,000+ by 2020.
Source: Company
eXp’s cloud based platform allows brokers / agents to conduct their business and be a part of a larger brokerage at a significantly lower cost than traditional brokerages. The company
continues to expand and improve its offerings to its members. Here are two examples: � eXp maintains membership in over 100 multiple listing services (“MLS”) across North
America; management of eXp believes that they have the capability to offer a robust, high-quality lead generation program to its members at a significantly lower cost than leads sold by third-party data syndicators (database companies), such as REALTOR.com, Market Leader, Zillow (Nasdaq: Z), Trulia, etc. Lead generation is critical for brokers/agents and we believe eXp’s ability to provide strong lead generation at reasonable prices will determine their ability to retain agents over the long-term.
� In order to encourage brand loyalty, eXp offers equity incentive programs to agents and
brokers. The company also introduced a program wherein agents and brokers could elect

Page 3
2016 Fundamental Research Corp. “10+ Years of Bringing Undiscovered Investment Opportunities to the Forefront” www.researchfrc.com
PLEASE READ THE IMPORTANT DISCLOSURES AT THE BACK OF THIS REPORT
Developing
In-house
Enterprise
Application
First Cloud
Strengthens
Board and
Management
Team
to be paid 5% of their commissions in the form of restricted common shares. We believe such initiatives are an excellent strategy to improve brand loyalty and agent retention in an industry that otherwise has higher turnover and attrition rates.
eXp currently licenses its cloud campus technology from an unrelated private company. In our previous reports, we had mentioned that the company is evaluating options to insource all the critical aspects related to their platform, either through acquisitions or through other 3D immersive platforms. In their recent 10-Q statement, the company disclosed that they have commenced development of an enterprise application, which will offer them increased scalability without experiencing limitations on functionality. Revenues from First Cloud were $92k in Q2-2016. First Cloud started reporting revenues ($26,330) in Q1-2016. Management estimates First Cloud to broker $50 million to $75 million in loans in the next 12 months, and over $100 million in 2017. First Cloud is expected to generate gross profits of 1.5% - 3.0% of the transactions. First Cloud operates as a mortgage broker and does not lend its own funds. They are currently licensed to originate mortgages in California, Arizona, New Mexico, and Texas, with pending applications in Virginia and Georgia. As mentioned in our previous reports, eXp’s long-term strategy is to derive additional revenues from ancillary services related to real estate transactions. eXp owns a 89.4% interest in this entity. On July 29, 2016, eXp announced the appointment of Russ Cofano as Chief Strategy Officer and General Counsel.
Russ Cofano, CSO and General Counsel
Russ Cofano joined the Company as its Chief Strategy Officer and General Counsel on July 29, 2016. Prior to joining eXp, Russ was Senior Vice President of Industry Relations for Move, Inc., operator of realtor.com. At Move, Russ was instrumental in reinvigorating realtor.com’s relationship with MLSs and associations and was a key influencer in realtor.com product improvements. Prior to Move, Russ served as Chief Executive Officer for the Missouri REALTORS®. In just three short years, Russ super-charged the association with a re-energized staff, new strategic plan, innovative member focused governance structure, private member-only social network, and implementation of a new governmental affairs program for local markets. Prior to his stint in Missouri, Russ was Vice President and General Counsel to John L. Scott Real Estate, consistently ranked as one of the largest real estate brokerage companies in the nation, and helped JLS weather the great recession. Russ is a noted author, speaker and consultant in organized real estate, having worked at executive levels in nearly every segment of the industry. Russ was also a private practice attorney for many years where he advised on matters involving real estate brokerage, REALTOR associations, MLSs, technology and intellectual property, mergers and acquisitions, business transactions and franchising. On July 26, 2016, the company the addition of two high-profile independent board members. The company’s board currently consists of six members, of which three are

Page 4
2016 Fundamental Research Corp. “10+ Years of Bringing Undiscovered Investment Opportunities to the Forefront” www.researchfrc.com
PLEASE READ THE IMPORTANT DISCLOSURES AT THE BACK OF THIS REPORT
independent. When we initiated coverage on the company in May 2016, the company had a three member board, with one independent member. Brief biographies of the new members are presented below.
Randall Miles, Director
For over 25 years Mr. Miles has held senior leadership positions in global financial services, financial technology and investment banking companies. His extensive investment banking background at bulge bracket, regional and boutique firms advising financial services companies on strategic and financial needs has crossed many disciplines. Mr. Miles’ transactional and advisory experience is complemented by leadership of public and private equity backed financial technology, specialty finance and software companies including Chairman and CEO at LIONMTS where he was nominated for the Ernst & Young Entrepreneur of the Year award, CEO at Syngence Corporation, COO of AtlasBanc Holdings Corp. and CEO of Advantage Funding / NAFCO Holdings which grew to in excess of $1 billion. Mr. Miles is currently Managing Partner at SCM Capital Group, a global strategic and financial advisory firm and Senior Managing Director at Tigress Financial Partners, a full service institutional broker dealer where is he is head of Investment Banking. Most recently, Mr. Miles served as Senior Managing Director, Head of FIG and COO, Investment Banking at Cantor Fitzgerald & Co. Mr. Miles has held senior leadership roles at Oppenheimer & Co., D.A. Davidson and & Co., The First Boston Corporation (Credit Suisse) Meridian Capital and Greenwich Capital Markets. Mr. Miles has broad public, private and nonprofit board experience and has been active for many years in leadership roles with the Make-A-Wish Foundation. He presently serves on the boards of Kuity, Corp. and Posiba, Inc. as Vice Chairman and Chairman respectively. Mr. Miles holds a BBA from the University of Washington and holds FINRA licenses Series 7, 24, 63 and 79.
Rick Miller, Director
For over 25 years Mr. Miller has held senior leadership positions in companies ranging from a Fortune 10 to a startup. His extensive experience as a turnaround specialist and an expert in sustainable growth has been applied as an executive inside organizations and as a confidant advising from outside companies. Mr. Miller began his career as a sales trainee at Sperry/Unisys and left 15 years later as Divisional VP/GM of North America. Mr. Miller was recruited by AT&T where he served as President of Global Services. He later served as President, COO, and as a Board member at internet startup OPUS360 where he led the company’s successful IPO. Mr. Miller was later recruited by Lucent Technologies to lead their worldwide sales efforts. Later, he was named President, Lucent Government Solutions. Mr.Miller also served as CEO at the Balance & Stretch Center, a non-profit focused on supporting children with diabetes. Mr. Miller is currently Chief at Being Chief LLC where he serves as an advisor to a broad range of senior business leaders, across a diverse number of industries. He is also an author and public speaker. Mr. Miller’s success and unconventional approach has been highlighted in Harvard Business Review, Selling Power, USA Today, and MSN Business. Most recently, Mr. Miller was named to serve on the Executive Committee for the Strategic Innovation Lab at Case University’s Fowler Center

Page 5
2016 Fundamental Research Corp. “10+ Years of Bringing Undiscovered Investment Opportunities to the Forefront” www.researchfrc.com
PLEASE READ THE IMPORTANT DISCLOSURES AT THE BACK OF THIS REPORT
Financials
for Business as an Agent of World Benefit, focusing on sustainable growth. Mr. Miller has earned a Bachelor of Arts degree in Management from Bentley University and a Master’s degree in Business Administration from Columbia University. In Q2-2016, revenues grew by 138% YOY to $13.28 million. The company had reported 107% YOY growth in Q1. In the six month period, revenues were $20.42 million, up by 126% YOY. Our discussions with management indicated that they intend to start providing detailed breakdowns in the future, such as the total transactions in a quarter, the average transactions per member, and average commission received by members.
Q1-2015 Q1-2016 YOY Change Q2-2015 Q2-2016 YOY Change
Real Estate Brokerage Services 3,471,675 7,171,178 106.6% 5,610,614 13,277,350 136.6%
Mortgage Origination Services 26,330 91,997
Corporate and Other -22,434 -54,696 -25,651 -87,319
Total 3,449,241 7,142,812 107.1% 5,584,963 13,282,028 137.8%
2015 (6M) 2016 (6M) YOY Change
Real Estate Brokerage Services 9,082,289 20,448,528 125.1%
Mortgage Origination Services 118,327
Corporate and Other -48,085 -142,015
Total 9,034,204 20,424,840 126.1%
Revenues from the U.S. accounted for 98% of the total in Q2, and the first six months of 2016.
We are raising our revenue forecast for 2016 from $40.50 million to $48.94 million,
and for 2017 from $72.00 million to $82.50 million. We are also raising our long-term
forecasts. In our previous models, we had assumed growth to 10,000 members by
2020. We are now extending our models based on the assumption that membership
will increase to 15,000 by 2022.
Gross margins dropped from 14.6% to 13.7% and were lower than our expectations. Cost of revenues includes costs related to sales agent commissions and revenue sharing. We are lowering our gross margin estimate for the entire year from 15% to 13.8%, and maintaining our 2017 estimate at 14%. Gross margins dropped because of a higher rate of commission granted to many of the new high-volume agents.

Page 6
2016 Fundamental Research Corp. “10+ Years of Bringing Undiscovered Investment Opportunities to the Forefront” www.researchfrc.com
PLEASE READ THE IMPORTANT DISCLOSURES AT THE BACK OF THIS REPORT
Margins Q1-2015 Q1-2016 Q2-2015 Q2-2016 2015 (6M) 2016 (6M)
Gross 16.6% 14.4% 14.6% 13.7% 15.4% 14.0%
EBITDA 0.1% -8.4% -89.3% -45.1% -55.1% -32.3%
EBIT 0.0% -8.6% -89.4% -45.2% -55.3% -32.4%
Net -0.5% -8.7% -89.5% -45.2% -55.5% -32.4%
Net (adjusted) -2.6% 0.9% 1.1% 4.5% -0.3% 3.2%
Expense as a % of Revenues Q1-2015 Q1-2016 Q2-2015 Q2-2016 2015 (6M) 2016 (6M)
General and administrative 15.0% 10.2% 10.8% 7.2% 12.4% 8.2%
Stock based compensation -2.1% 9.6% 90.5% 49.7% 55.2% 35.7%
Professional fees 2.2% 2.0% 1.8% 1.0% 1.9% 1.3%
Sales and marketing 1.3% 1.1% 0.8% 0.9% 1.0% 1.0%
Total 16.5% 22.9% 103.9% 58.8% 70.5% 46.2%
Total operating expenses increased YOY by 35% to $7.81 million (59% of revenues). The company reported $6.60 million of stock based compensation in the quarter versus $5.06 million in Q2-2015. Excluding stock based compensation, operating expenses were
$1.20 million (9.1% of revenues) versus $0.95 million in Q1-2016 (13% of revenues) or
$0.75 million in Q2-2015 (13.4% of revenues). We have slightly raised our operating expense estimates for 2016 (9.7% of revenues) and 2017 (8.2% of revenues). eXp reported a net loss of $6.01 million (EPS: -$0.12) in Q2-2016 versus a net loss of $5.00 million (EPS: -$0.10) in Q2-2015. Excluding stock based compensation, the company would have reported net profit of $0.59 million (EPS: $0.01) versus $0.06 million (EPS: $0.00) in Q2-2015. For the six month period, net profit (excluding stock based compensation) was $0.66 million (EPS: $0.01) versus -$0.03 million (EPS: -$0.00) in the comparable period in the previous year. We are revising our 2016 forecast to a net loss of $5.31 million (EPS: -$0.10) from net income of $0.72 million (EPS: $0.01). We are raising our 2017 forecasts from $1.03 million (EPS: $0.02) to $1.41 million (EPS: $0.03). Excluding stock based compensation, our
forecasts for 2016, and 2017, are net profits of $1.98 million (EPS: $0.04) and $3.89
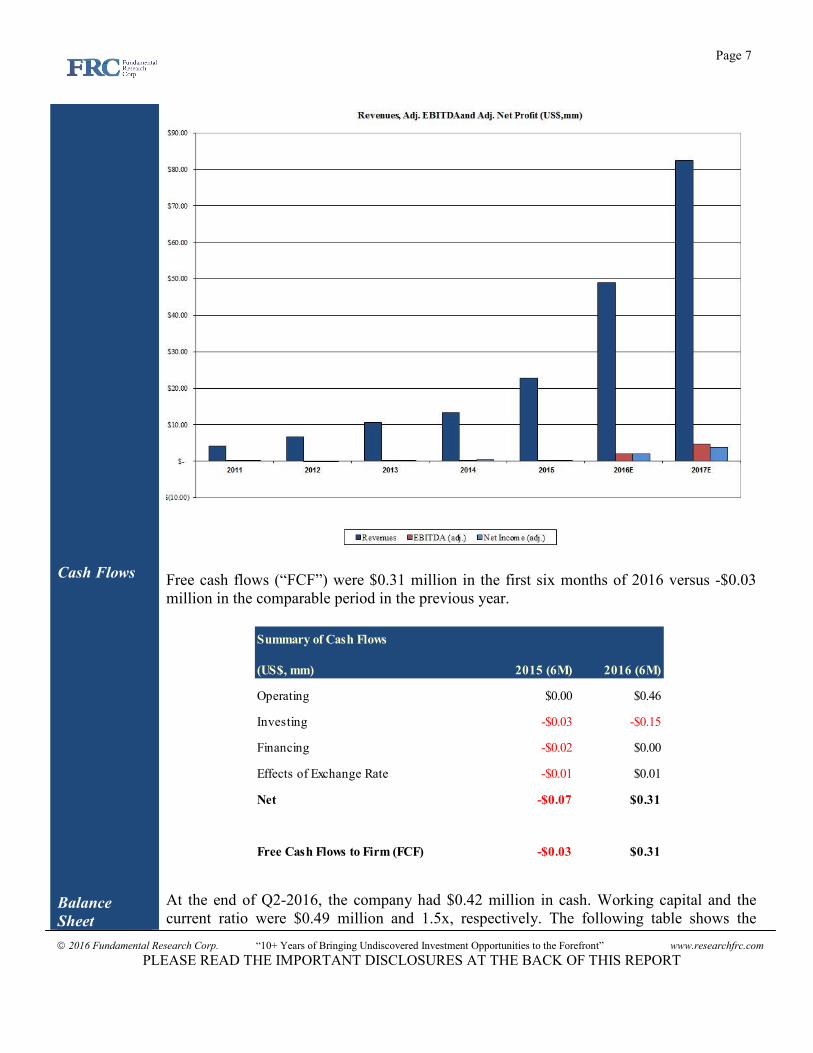
million (EPS: $0.08), respectively. The following chart shows our projections.
Page 7
2016 Fundamental Research Corp. “10+ Years of Bringing Undiscovered Investment Opportunities to the Forefront” www.researchfrc.com
PLEASE READ THE IMPORTANT DISCLOSURES AT THE BACK OF THIS REPORT
Cash Flows
Balance
Sheet
Free cash flows (“FCF”) were $0.31 million in the first six months of 2016 versus -$0.03 million in the comparable period in the previous year.
Summary of Cash Flows
(US$, mm) 2015 (6M) 2016 (6M)
Operating $0.00 $0.46
Investing -$0.03 -$0.15
Financing -$0.02 $0.00
Effects of Exchange Rate -$0.01 $0.01
Net -$0.07 $0.31
Free Cash Flows to Firm (FCF) -$0.03 $0.31
At the end of Q2-2016, the company had $0.42 million in cash. Working capital and the current ratio were $0.49 million and 1.5x, respectively. The following table shows the

Page 8
2016 Fundamental Research Corp. “10+ Years of Bringing Undiscovered Investment Opportunities to the Forefront” www.researchfrc.com
PLEASE READ THE IMPORTANT DISCLOSURES AT THE BACK OF THIS REPORT
Stock Options
and Warrants
Valuation
and Rating
Risks
company’s cash and liquidity position.
Liquidity & Capital Structure 2015 Q1-2016 Q2-2016
(US$)
Cash 571,814 424,501 886,193
Working Capital 482,311 493,725 1,007,302
Current Ratio 1.7 1.5 1.7
LT Debt - - -
Total Debt - - -
LT Debt / Capital 0.0% 0.0% 0.0%
Total Debt / Capital 0.0% 0.0% 0.0%
EBIT Interest Coverage (excl. stock comp) 258.9 N/A N/A eXp currently has 8.5 million options (weighted average exercise price – $0.29), and no warrants outstanding. All the options are currently in the money. The company can raise up to $2.43 million if all these options are exercised.
Our Discounted Cash Flow (“DCF”) valuation increased from $3.35 to $4.06 per
share as we raised our short-term and long-term forecasts. We are maintaining our
BUY rating and risk 4 rating.
DCF Valuation (US$) 2016E 2017E 2018E 2019E 2020E 2021E 2022E Terminal
Funds Flow from Operations $1,360,400 $3,988,247 $5,917,688 $9,281,181 $14,891,671 $19,521,005 $23,797,481
-increase in w/c -$427,075 -$277,351 -$870,606 -$666,601 -$903,726 -$948,912 -$903,726
Cash Flows from Operations $933,325 $3,710,896 $5,047,082 $8,614,579 $13,987,945 $18,572,092 $22,893,755
-capex -$49,672 -$500,000 -$500,000 -$500,000 -$500,000 -$500,000 -$500,000
Free Cash Flows $883,653 $3,210,896 $4,547,082 $8,114,579 $13,487,945 $18,072,092 $22,393,755 $352,202,778
Present Value $862,455 $2,843,802 $3,654,469 $5,918,012 $8,926,352 $10,853,131 $12,203,712 $191,936,606
Discount Rate 10.2%
Terminal Growth 3%
Present Value $237,198,538
Cash - Debt $1,235,310
Fair Value $238,433,848
Shares O/S (treasury stock method) 58,763,111
Value per share (US$) $4.06
The following risks may cause our estimates to differ from actual results (not exhaustive): � The real estate brokerage industry is highly competitive. � The company’s ability to adapt to technological advancements will play a vital role in
its long-term success. � The company’s profitability is highly dependent on the overall health of the real estate
market. � eXp is in a growth phase and has a relatively short track record. Long-term retention of
agents has yet to be proven.

Page 9
2016 Fundamental Research Corp. “10+ Years of Bringing Undiscovered Investment Opportunities to the Forefront” www.researchfrc.com
PLEASE READ THE IMPORTANT DISCLOSURES AT THE BACK OF THIS REPORT
� As with any real estate brokerage, the company is also susceptible to negative changes to the regulatory laws.

Page 10
2016 Fundamental Research Corp. “10+ Years of Bringing Undiscovered Investment Opportunities to the Forefront” www.researchfrc.com
PLEASE READ THE IMPORTANT DISCLOSURES AT THE BACK OF THIS REPORT
Appendix
STATEMENTS OF OPERATIONS
(in US$) - YE Dec 31st 2014 2015 2016E 2017E
Net Revenues 13,368,905 22,866,787 48,937,500 82,500,000
COGS 11,099,750 19,456,409 42,180,538 70,950,000
Gross Profit 2,269,155 3,410,378 6,756,962 11,550,000
EXPENSES
General and administrative 1,635,555 2,441,089 3,678,438 4,950,000
Stock based compensation 233,098 4,790,568 7,282,749 2,475,000
Professional fees 276,558 439,763 558,520 614,372
Sales and marketing 76,019 211,456 489,375 1,237,500
EBITDA 47,925 (4,472,498) (5,252,119) 2,273,128
Amortization 14,493 26,304 55,098 102,039
EBIT 33,432 (4,498,802) (5,307,217) 2,171,089
Other income 0 23 - -
Interest expense -942 -1,127
EBT 32,490 (4,499,906) (5,307,217) 2,171,089
Taxes -71,353 103,069 0 759,881
Net Profit (Loss) 103,843 (4,602,975) (5,307,217) 1,411,208
EPS 0.00 -0.09 -0.10 0.03
Non-controlling interests 21,526 - -
Net Profit (Loss) to common shareholders 103,843 -4,581,449 -5,307,217 1,411,208
EPS 0.00 -0.09 -0.10 0.03

Page 11
2016 Fundamental Research Corp. “10+ Years of Bringing Undiscovered Investment Opportunities to the Forefront” www.researchfrc.com
PLEASE READ THE IMPORTANT DISCLOSURES AT THE BACK OF THIS REPORT
BALANCE SHEETS
(in US$) - YE Dec 31st 2014 2015 2016E 2017E
ASSETS
CURRENT
Cash and cash equiv. 353,374 571,814 1,764,757 4,975,653
Restricted cash 141,508 148,613 148,613 148,613
A/R 189,026 341,643 1,419,614 2,393,220
Prepaid 74,673 84,451 170,272 287,048
Total Current Assets 758,581 1,146,521 3,503,256 7,804,534
Fixed assets 79,393 110,195 255,098 653,059
Deferred tax assets 75,196
Total Assets 913,170 1,256,716 3,758,353 8,457,592
LIABILITIES
CURRENT
A/P 79,389 89,984 183,596 308,819
Customer deposits 141,508 148,613 310,446 523,357
Accrued expenses / interest 216,720 425,613 696,273 1,171,170
Notes payable 61,887
Due to related party
Total Current Liabilities 499,504 664,210 1,190,315 2,003,346
Notes payable
SHAREHOLDERS EQUITY
Share capital 1,824,847 6,612,283 6,612,283 6,612,283
Accumulated deficit / comprehensive loss -1,411,181 -6,000,201 -4,024,669 -138,461
Non-controlling interests -19,576 -19,576 -19,576
Total shareholders’ equity (deficiency) 413,666 592,506 2,568,038 6,454,246
Total Liabilities and Shareholders Equity 913,170 1,256,716 3,758,353 8,457,592

Page 12
2016 Fundamental Research Corp. “10+ Years of Bringing Undiscovered Investment Opportunities to the Forefront” www.researchfrc.com
PLEASE READ THE IMPORTANT DISCLOSURES AT THE BACK OF THIS REPORT
STATEMENTS OF CASH FLOWS
(in US$) - YE Dec 31st 2014 2015 2016E 2017E
OPERATING ACTIVITIES
Net profit for the year 103,843 -4,602,975 -5,307,217 1,411,208
Adjusted for items not involving cash:
Depreciation 14,493 26,304 55,098 102,039
Stock compensation / option expense 233,098 4,790,568 7,282,749 2,475,000
Deferred tax asset -75,196 75,196
Funds From Operations 276,238 289,093 2,030,630 3,988,247
Change in working capital
A/R -81,186 -152,617 -1,077,971 -973,605
Prepaid -34,880 -9,778 -85,821 -116,776
A/P 23,563 10,595 93,612 125,223
Accrued expenses 78,939 208,893 432,493 687,808
Due to related parties -18,232
NET CASH USED IN OPERATING ACTIVITIES 244,442 346,186 1,392,943 3,710,896
INVESTING ACTIVITIES
PP&E -49,032 -57,116 -200,000 -500,000
NET CASH USED IN INVESTING ACTIVITIES -49,032 -57,116 -200,000 -500,000
FINANCING ACTIVITIES
Equity 59,450 -1,182
Debt -61,877
NET CASH FROM FINANCING ACTIVITIES 59,450 -63,059 0 0
Foreign Exchange / Others -1,542 -7,571
INCREASE IN CASH FOR THE YEAR 253,318 218,440 1,192,943 3,210,896
CASH, BEGINNING OF THE YEAR 100,056 353,374 571,814 1,764,757
CASH, END OF THE YEAR 353,374 571,814 1,764,757 4,975,653

Page 13
2016 Fundamental Research Corp. “10+ Years of Bringing Undiscovered Investment Opportunities to the Forefront” www.researchfrc.com
PLEASE READ THE IMPORTANT DISCLOSURES AT THE BACK OF THIS REPORT
Fundamental Research Corp. Equity Rating Scale:
Buy – Annual expected rate of return exceeds 12% or the expected return is commensurate with risk Hold – Annual expected rate of return is between 5% and 12% Sell – Annual expected rate of return is below 5% or the expected return is not commensurate with risk Suspended or Rating N/A— Coverage and ratings suspended until more information can be obtained from the company regarding recent events. Fundamental Research Corp. Risk Rating Scale:
1 (Low Risk) - The company operates in an industry where it has a strong position (for example a monopoly, high market share etc.) or operates in a regulated industry. The future outlook is stable or positive for the industry. The company generates positive free cash flow and has a history of profitability. The capital structure is conservative with little or no debt. 2 (Below Average Risk) - The company operates in an industry where the fundamentals and outlook are positive. The industry and company are relatively less sensitive to systematic risk than companies with a Risk Rating of 3. The company has a history of profitability and has demonstrated its ability to generate positive free cash flows (though current free cash flow may be negative due to capital investment). The company’s capital structure is conservative with little to modest use of debt. 3 (Average Risk) - The company operates in an industry that has average sensitivity to systematic risk. The industry may be cyclical. Profits and cash flow are sensitive to economic factors although the company has demonstrated its ability to generate positive earnings and cash flow. Debt use is in line with industry averages, and coverage ratios are sufficient. 4 (Speculative) - The company has little or no history of generating earnings or cash flow. Debt use is higher. These companies may be in start-up mode or in a turnaround situation. These companies should be considered speculative. 5 (Highly Speculative) - The company has no history of generating earnings or cash flow. They may operate in a new industry with new, and unproven products. Products may be at the development stage, testing, or seeking regulatory approval. These companies may run into liquidity issues, and may rely on external funding. These stocks are considered highly speculative.
Disclaimers and Disclosure
The opinions expressed in this report are the true opinions of the analyst about this company and industry. Any “forward looking statements” are our best estimates and opinions based upon information that is publicly available and that we believe to be correct, but we have not independently verified with respect to truth or correctness. There is no guarantee that our forecasts will materialize. Actual results will likely vary. The analyst and Fundamental Research Corp. “FRC” does not own any shares of the subject company, does not make a market or offer shares for sale of the subject company, and does not have any investment banking business with the subject company. Fees were paid by eXp to FRC. The purpose of the fee is to subsidize the high costs of research and monitoring. FRC takes steps to ensure independence including setting fees in advance and utilizing analysts who must abide by CFA Institute Code of Ethics and Standards of Professional Conduct. Additionally, analysts may not trade in any security under coverage. Our full editorial control of all research, timing of release of the reports, and release of liability for negative reports are protected contractually. To further ensure independence, eXp has agreed to a minimum coverage term including four updates. Coverage can not be unilaterally terminated. Distribution procedure: our reports are distributed first to our web-based subscribers on the date shown on this report then made available to delayed access users through various other channels for a limited time. The distribution of FRC’s ratings are as follows: BUY (70%), HOLD (8%), SELL (5%), SUSPEND (17%). To subscribe for real-time access to research, visit http://www.researchfrc.com/subscription.htm for subscription options. This report contains "forward looking" statements. Forward-looking statements regarding the Company and/or stock’s performance inherently involve risks and uncertainties that could cause actual results to differ from such forward-looking statements. Factors that would cause or contribute to such differences include, but are not limited to, continued acceptance of the Company's products/services in the marketplace; acceptance in the marketplace of the Company's new product lines/services; competitive factors; new product/service introductions by others; technological changes; dependence on suppliers; systematic market risks and other risks discussed in the Company's periodic report filings, including interim reports, annual reports, and annual information forms filed with the various securities regulators. By making these forward looking statements, Fundamental Research Corp. and the analyst/author of this report undertakes no obligation to update these statements for revisions or changes after the date of this report. A report initiating coverage will most often be updated quarterly while a report issuing a rating may have no further or less frequent updates because the subject company is likely to be in earlier stages where nothing material may occur quarter to quarter. Fundamental Research Corp DOES NOT MAKE ANY WARRANTIES, EXPRESSED OR IMPLIED, AS TO RESULTS TO BE OBTAINED FROM USING THIS INFORMATION AND MAKES NO EXPRESS OR IMPLIED WARRANTIES OR FITNESS FOR A PARTICULAR USE. ANYONE USING THIS REPORT ASSUMES FULL RESPONSIBILITY FOR WHATEVER RESULTS THEY OBTAIN FROM WHATEVER USE THE INFORMATION WAS PUT TO. ALWAYS TALK TO YOUR FINANCIAL ADVISOR BEFORE YOU INVEST. WHETHER A STOCK SHOULD BE INCLUDED IN A PORTFOLIO DEPENDS ON ONE’S RISK TOLERANCE, OBJECTIVES, SITUATION, RETURN ON OTHER ASSETS, ETC. ONLY YOUR INVESTMENT ADVISOR WHO KNOWS YOUR UNIQUE CIRCUMSTANCES CAN MAKE A PROPER RECOMMENDATION AS TO THE MERIT OF ANY PARTICULAR SECURITY FOR INCLUSION IN YOUR PORTFOLIO. This REPORT is solely for informative purposes and is not a solicitation or an offer to buy or sell any security. It is not intended as being a complete description of the company, industry, securities or developments referred to in the material. Any forecasts contained in this report were independently prepared unless otherwise stated, and HAVE NOT BEEN endorsed by the Management of the company which is the subject of this report. Additional information is available upon request. THIS REPORT IS COPYRIGHT. YOU MAY NOT REDISTRIBUTE THIS REPORT WITHOUT OUR PERMISSION. Please give proper credit, including citing Fundamental Research Corp and/or the analyst, when quoting information from this report. The information contained in this report is intended to be viewed only in jurisdictions where it may be legally viewed and is not intended for use by any person or entity in any jurisdiction where such use would be contrary to local regulations or which would require any registration requirement within such jurisdiction.