releaseabatement measurestatusreport #2 - · pdf file980 washington street ... contingency...
TRANSCRIPT
woodardcurran.comCOMMITMENT & INTEGRITY DRIVE RESULTS
980 Washington StreetSuite 325
Dedham, Massachusetts 02026800.446.5518
MASSACHUSETTSCONTINGENCYPLAN
ReleaseAbatementMeasureStatusReport#2
0&12-24FairmountCourtHydePark,MA 02136RTN: 3-1616
221375.01
City of BostonDepartment ofNeighborhoodDevelopment
November 2011

Boston DND (221375) i Woodard & Curran221375 RAM Status Report #2.DOC November 2011
TABLE OF CONTENTS
SECTION PAGE NO.
1. INTRODUCTION ................................................................................................................................ 1-1
1.1 Site Description ..............................................................................................................................1-11.2 Surrounding Receptors...................................................................................................................1-11.3 Release History ..............................................................................................................................1-1
2. RAM STATUS.................................................................................................................................... 2-1
2.1 Status of Ongoing RAM Activities...................................................................................................2-12.2 Significant or New Information........................................................................................................2-12.3 Subslab Vapor Removal Summary ................................................................................................2-12.4 Remediation Waste Management ..................................................................................................2-12.5 Schedule & RAM Reporting............................................................................................................2-22.6 Licensed Site Professional Opinion, Seal and Signature ...............................................................2-2
3. REMEDIAL MONITORING REPORT................................................................................................. 3-1
3.1 General .........................................................................................................................................3-13.2 SVE Routine Operation ..................................................................................................................3-13.3 Significant Operational Events .......................................................................................................3-1
3.3.1 Groundwater Collection within Condensate Knock-out Drum.........................................................3-2
4. LIMITATIONS..................................................................................................................................... 4-1
5. REFERENCES................................................................................................................................... 5-1
Boston DND (221375) ii Woodard & Curran221375 RAM Status Report #2.DOC November 2011
TABLES
Table 1: Process Air Sampling Results Summary
Table 2: TVOC Mass Removal Summary
Table 3: Remedial Activities Summary
FIGURES
Figure 1: Site Locus
Figure 2: Site Plan
Figure 3: Mass Removal Graph
APPENDICES
Appendix A: BWSC Forms 106, 106A, and 106B (Post-Submittal Report Copies)
Appendix B: SVE System Field Monitoring Reports
Appendix C: Laboratory Analytical Reports

Boston DND (221375) 1-1 Woodard & Curran221375 RAM Status Report #2.DOC November 2011
1. INTRODUCTION
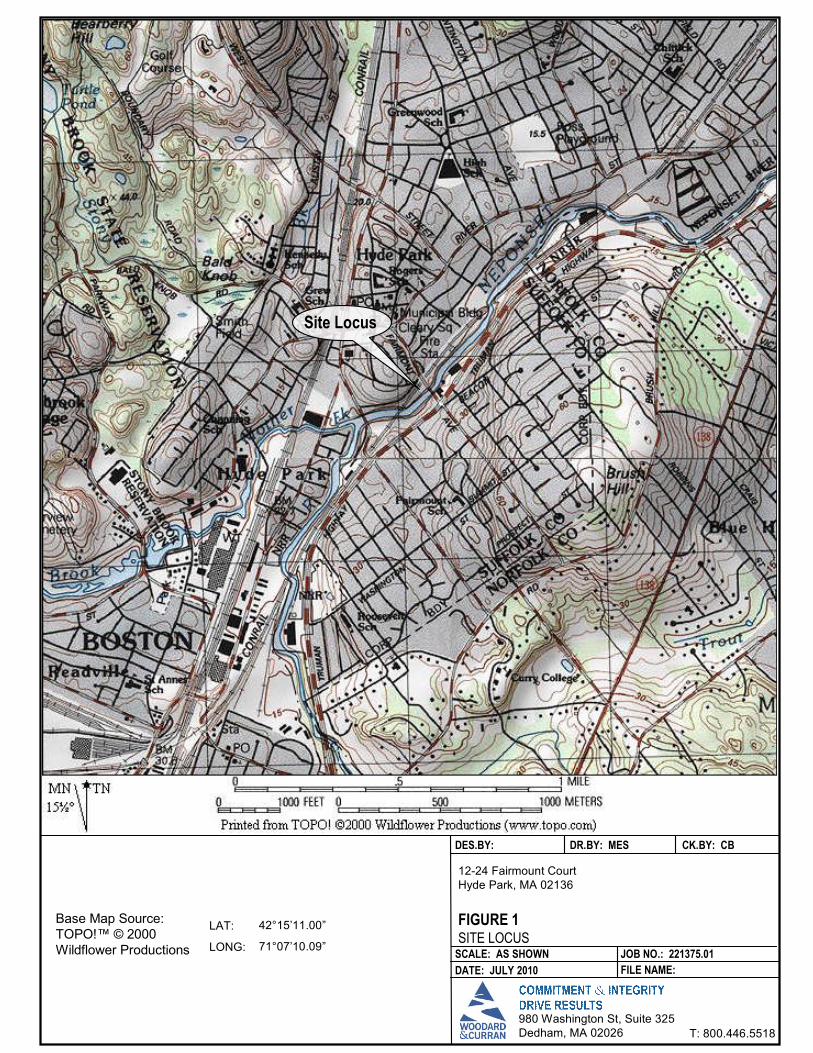
This Release Abatement Measure (RAM) Status Report has been prepared in accordance with theMassachusetts Contingency Plan (MCP), 310 CMR 40.0445, for the property located at 0 and 12-24Fairmount Court in Hyde Park, Massachusetts (the Site). A Site Locus is provided as Figure 1.
The City of Boston, Massachusetts has assumed the role as the potentially responsible party (PRP) for therelease, designated by Release Tracking Number (RTN) 3-1616 by the Massachusetts Department ofEnvironmental Protection (MassDEP). The City of Boston has implemented a RAM to address volatileorganic compounds (VOCs) in soil and soil vapor present at the Site below the Site building foundation.The RAM activities include the operation of a Soil Vapor Extraction (SVE) System at the Site. Theoriginal RAM Transmittal Forms (BWSC 106, 106A, and 106B) are being signed and submitted with thisreport via the eDEP filing system. Copies of the transmittal forms will be included as Appendix A inpost-submittal report copies.
1.1 SITE DESCRIPTION
The subject property, 30,592 square feet in size, is currently owned by the City of Boston and comprisedof two parcels laid out in a rectangular manner. The smaller of the two parcels, comprising 6,338 squarefeet, is not improved. The larger parcel, comprising 24,254 square feet, is improved with a currentlyvacant three-story, 8,800-square foot (building footprint), former industrial building. The coordinates ofthe property are 42° 15’ 10”N latitude, 71° 07’ 11”W longitude. The Universal Transverse Mercator(UTM) coordinates are 4680042 Northing and 325153 Easting in Zone 19. A Site Plan is included asFigure 2.
1.2 SURROUNDING RECEPTORS
The Site is located in a restricted manufacturing zoned area of Boston. Nearby properties are zonedcommercial, restricted manufacturing, and residential and are developed as such. The nearest humanreceptors are residents living within 500 feet north and east of the Site across MBTA railroad lines, whichrun along the northern Site boundary. The Neponset River, which runs along the southern Site boundary,and the land situated adjacently southwest of the Site is identified as protected open space.
1.3 RELEASE HISTORY
The Site has a history of industrial use and was formerly the location of the Lewis Chemical Company.Based on available information, the Site was utilized as a leather manufacturing company from 1940 tothe early 1960’s. Lewis Chemical operated the Site from 1963 until 1983 and collected, stored,transported, and processed hazardous waste. Lewis Chemical was forced to cease operations under aCourt Order issued by MassDEP in 1983. The MassDEP subsequently listed the Site as a State disposalsite in 1987 and issued release tracking number (RTN) 3-1616. The Site is currently listed as a Tier 1Bdisposal site. The City of Boston gained ownership of the property in October 2000 via tax foreclosure.
Several environmental investigations have been performed at the Site since 1986 and were detailed in theRAM Plan submitted to the MassDEP in July 2010 (W&C, 2010). The most recent was a supplementalsoil investigation conducted by Woodard & Curran for the City of Boston completed in 2008. The 2008investigation conducted at the Site identified significant volatile organic compound (VOC) concentrationsin soil below the building foundation. Notably, tetrachloroethene (PCE) and trichloroethene (TCE) weredetected in maximum concentrations of 8,000 mg/Kg and 1,900 mg/Kg, respectively, in soil samples

Boston DND (221375) 1-2 Woodard & Curran221375 RAM Status Report #2.DOC November 2011
collected beneath the concrete slab floor at the western portion of the Site building. The previous RAMStatus Report was submitted on June 2, 2011.

Boston DND (221375) 2-1 Woodard & Curran221375 RAM Status Report #2.DOC November 2011
2. RAM STATUS
2.1 STATUS OF ONGOING RAM ACTIVITIES
The SVE system construction was completed at the Site on September 24, 2010. SVE system start-up alsooccurred on this day. The RAM Plan submitted to the MassDEP in July 2010 detailed the construction ofthe SVE system (W&C, 2010). The SVE system was constructed in accordance with the RAM Plan andno significant changes in the system were made during construction. As documented in the RAM StatusReport #1 submitted to MassDEP on June 2, 2011, the SVE system was modified on October 20, 2010 toinclude a potassium permanganate filter to extract the vinyl chloride from the system effluent vapors priorto discharge to the atmosphere (W&C, 2011).
2.2 SIGNIFICANT OR NEW INFORMATION
RAM Status Report #1 summarized the new information since the submittal of the RAM Plan in July2010 to April 29, 2011. The reporting period for this Status Report is April 30, 2011 to October 27, 2011.
On June 28, 2011, the SVE system was shut down to monitor for potential system rebound conditions.The SVE system remained off for 87 days until the system was restarted on September 23, 2011.
2.3 SUBSLAB VAPOR REMOVAL SUMMARY
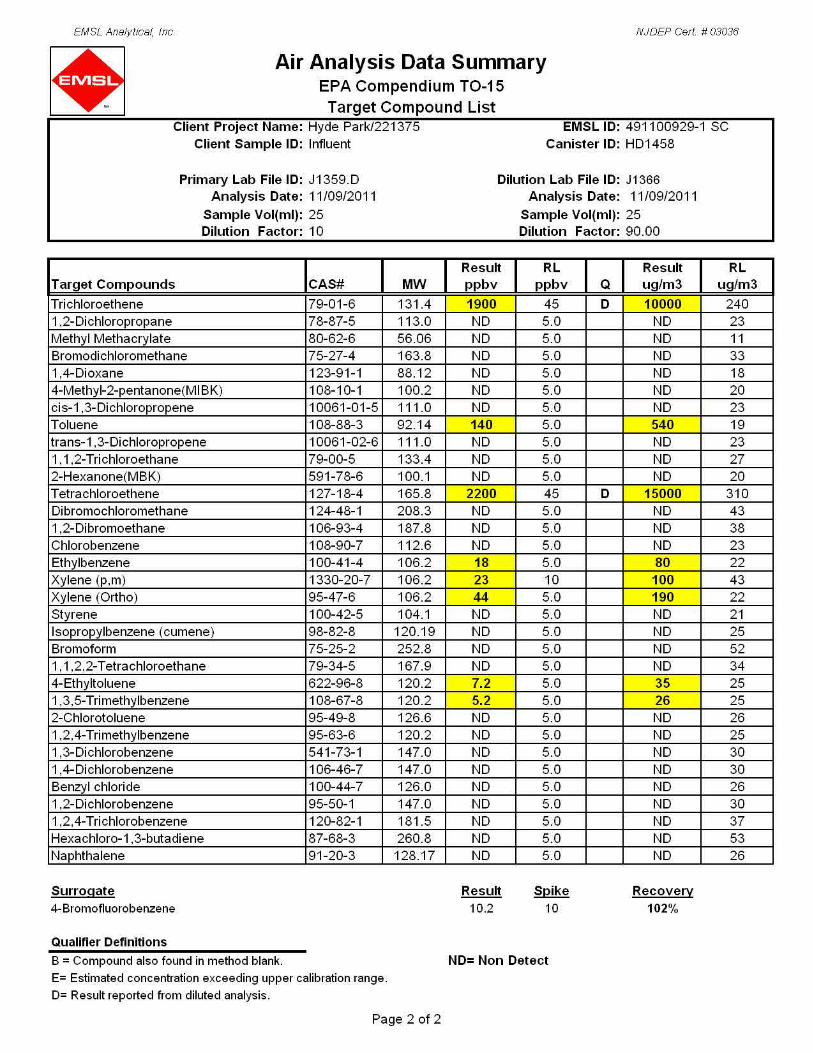
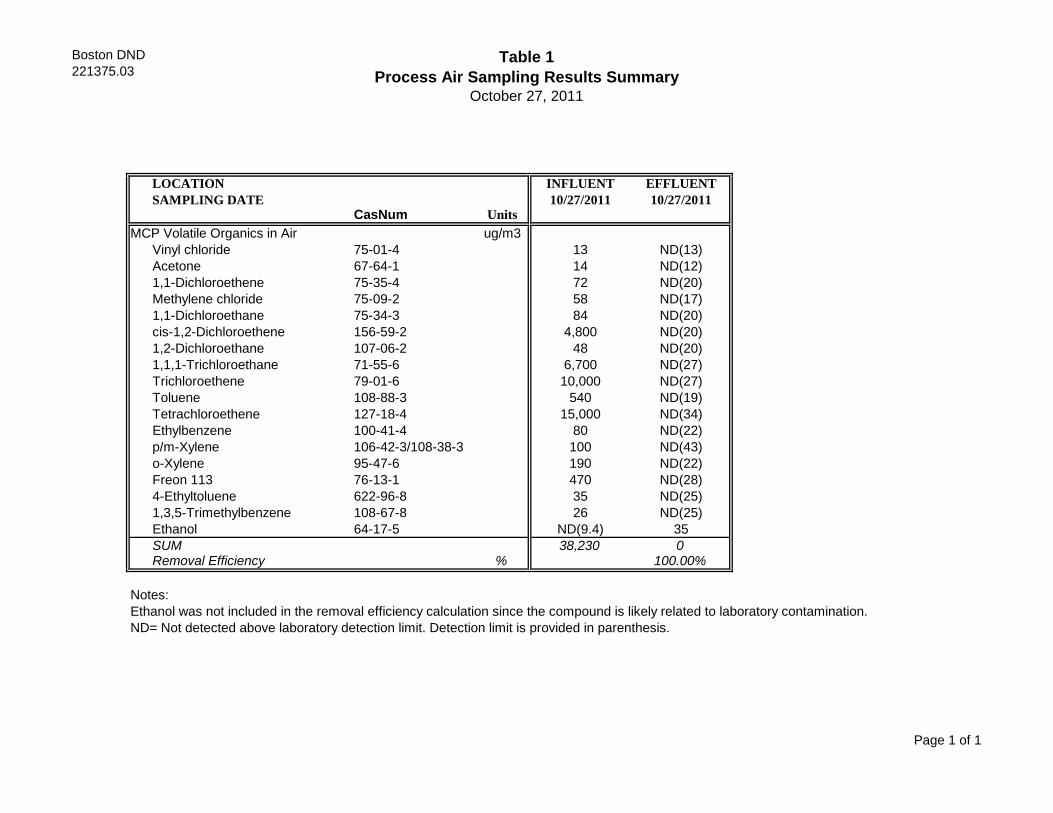
Cumulative total volatile organic compounds (TVOC) mass removal accomplished during the reportingperiod is shown in Table 2 and shown graphically in Figure 3. To date, 823 pounds of VOCs have beenremoved from the subsurface. In general, as the cumulative VOC removal amount has increased, the VOCconcentrations within the process air stream have decreased over this reporting period, as shown inFigure 3. The system efficiency for the removal of TVOCs based on the laboratory data obtained fromthe SVE system process air sampling events is shown on Table 1. The system efficiency for the removalof TVOCs based on the PID screening data obtained during the SVE system monitoring events isprovided on the field monitoring reports in Appendix B.
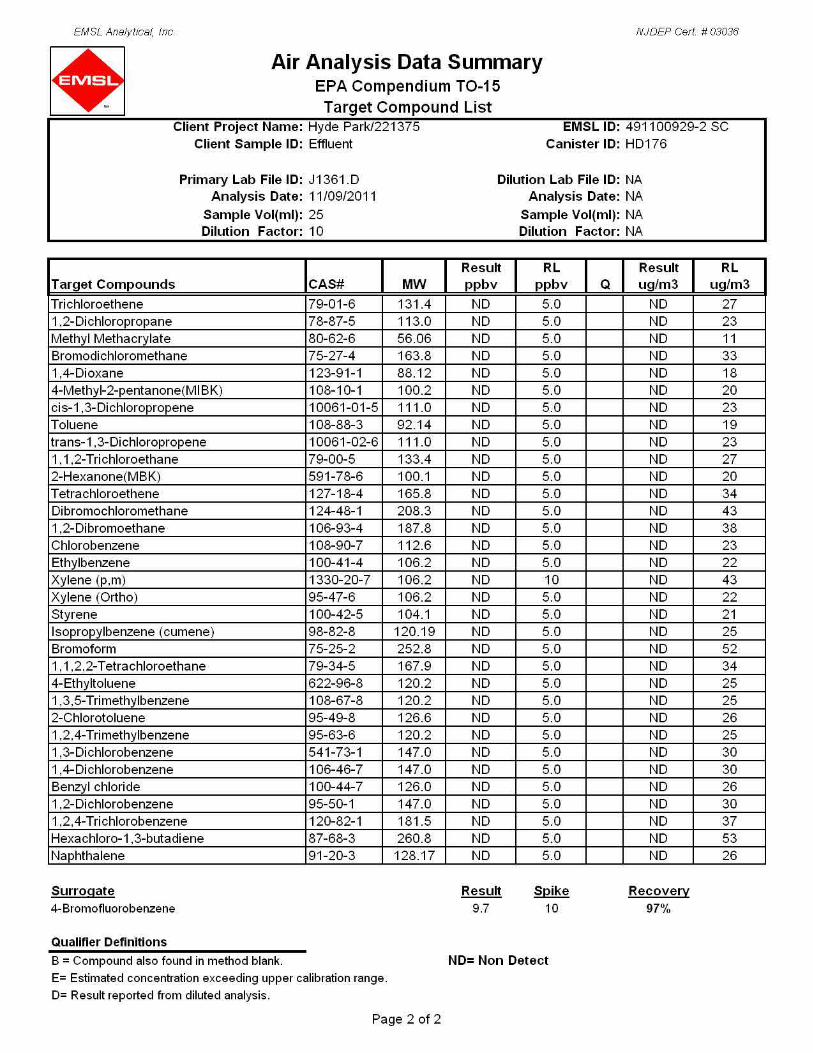
A 95% or greater TVOC removal efficiency was achieved during this reporting period as there were nodetectable concentrations of volatile organic compounds in the treated effluent air except for a detectedconcentration of ethanol. Ethanol was detected in the quarterly effluent process air sample collected onOctober 27, 2011 (35 ug/m3). However, ethanol was not detected above the laboratory detection limits inthe samples collected from the SVE system influent process air on this date. Therefore, it is currentlypostulated that the concentration of ethanol detected in the effluent process air samples was likelyintroduced into the sample as a laboratory contaminant, as ethanol is stored and used within the laboratorysetting. As previously noted, the TVOC removal efficiency continued to achieve greater than 95% percentremoval efficiency throughout the reporting period. Ethanol concentrations will continue to be monitoredand evaluated during future reporting periods and additions to the off-gas treatment will be made, ifnecessary.
2.4 REMEDIATION WASTE MANAGEMENT
Approximately 4,000 pounds of VGAC, which is being utilized as an off-gas control, has been replaced todate. A carbon sample was previously collected from the off-gas controls and submitted for toxicitycharacteristic leaching procedure (TCLP) analysis via method 1311 on November 15, 2010 in order toassess the waste for toxicity characteristics. Based upon the laboratory results, the carbon waste is not

Boston DND (221375) 2-2 Woodard & Curran221375 RAM Status Report #2.DOC November 2011
considered hazardous and is able to be transported as non-hazardous and regenerated. The most recentcarbon “change-out” occurred on September 29, 2011 and consisted of 2,000 pounds of VGAC. The spentcarbon was removed and transported to Carbon Activated in Blasdell, New York for regeneration byCarbon Filtrations Systems (CFS) of Johnston, Rhode Island. No remediation waste has been disposed ofto date. The laboratory report for the VGAC waste characterization sample was previously provided inRAM Status Report #1.
2.5 SCHEDULE & RAM REPORTING
It is anticipated that RAM Status Report #3 will be submitted in May 2012. The SVE system willcontinue to run over the next reporting period.
2.6 LICENSED SITE PROFESSIONAL OPINION, SEAL AND SIGNATURE
The activities described in this RAM Status Report are in general conformance with the tasks outlined inthe RAM Plan. The seal and signature of Craig Blake, the Licensed Site Professional who is overseeingRAM activities, is provided and a copy of the RAM Transmittal Form has been submitted via eDEPconcurrently with this report.

Boston DND (221375) 3-1 Woodard & Curran221375 RAM Status Report #2.DOC November 2011
3. REMEDIAL MONITORING REPORT
3.1 GENERAL
This is the second remedial monitoring report (RMR) to summarize the RAM activities conducted sincethe submission of the RAM Plan. A completed RMR BWSC form 106A and 106B is being submittedconcurrently with this report via eDEP. An SVE System layout is provided on the Site plan, which isprovided as Figure 2. The following sections provide the information requested on the RMR checklistand describe the start-up, testing, and operation of the SVE system.
3.2 SVE ROUTINE OPERATION
W&C conducted a total of four Site visits since the submission of the first RMR in May 2011 in order tocollect physical and chemical field measurements, such as air flowrate, vacuum, temperature, and TVOClevels using a photoionization detector (PID). Copies of the SVE field monitoring reports are provided inAppendix B.
W&C collected a quarterly process air sample from the SVE influent and effluent stream on October 27,2011. The process air samples were submitted for EPA TO-15 analysis to Absolute Resource Associatesof Portsmouth, New Hampshire. The purpose of these process air samples was to further characterize thesubslab soil gas in order to correlate PID readings to the laboratory data to assist in the mass removalestimation. The laboratory report from the process air sampling events are provided in Appendix C.
To date, three carbon changes have been conducted on the off-gas controls totaling 4,000 pounds of newvapor phase carbon that has replaced 4,000 pounds of spent vapor phase carbon. New carbon replacementand associated carbon change-outs are conducted by CFS under the oversight of W&C personnel, aspreviously discussed in Section 2.4 of this report. Table 3 summarizes the remedial activities conductedduring the reporting period.
3.3 SIGNIFICANT OPERATIONAL EVENTS
As previously discussed in Section 2.2, the SVE system was shut down on June 28, 2011 to monitorrebound conditions. The SVE system remained off for 87 days until it was restarted on September 23,2011. The system was temporarily shut down again on September 26, 2011 in order to facilitate a carbonchange due to VOC breakthrough encountered in the initial carbon filter vessel. However, a 95% removalefficiency was sustained. A carbon change was completed soon thereafter on September 29, 2011. The 87day shutdown has been determined to be significant since the 87 days represent >25% of the total daysfrom the first day of this reporting period, which was April 30, 2011.
The system was shut down from June 28, 2011 to September 23, 2011 to evaluate rebound conditionsupon restarting the system. The monitored TVOC concentration in the influent vapor, as monitored usinga PID, ranged from 36.9 ppmV to 47.5 ppmV during the two months prior to system shutdown. Theinfluent TVOC concentration increased to 121.0 ppmV when the system was restarted on September 23,2011 but had decreased to 12.0 ppmV when monitored on October 27, 2011. If the influent vapor TVOCconcentration continues to decrease, the SVE system operation will be revised to a pulsing (one month on– two months off) operation to improve mass removal from the sub-slab soils.

Boston DND (221375) 3-2 Woodard & Curran221375 RAM Status Report #2.DOC November 2011
3.3.1 Groundwater Collection within Condensate Knock-out Drum
Approximately eight gallons of water were removed from the knock-out drum during this reportingperiod. Based upon the volume of water collected in the knock-out drum, it is assumed that the collectedwater was extracted groundwater rather than condensate. This was previously discussed in RAM StatusReport #1. Elevated precipitation levels have been recorded during the months of September and Octoberwhen the water was collected within the knock-out drum, which may account for the infiltration ofgroundwater into the SVE system. The water is currently stored on-site in a 55-gallon drum. The drumwill be characterized and properly disposed of when filled.
Boston DND (221375) 4-1 Woodard & Curran221375 RAM Status Report #2.DOC November 2011
4. LIMITATIONS
The activities described in this report were performed consistent with generally accepted professionalconsulting principles and practices. No other warranty, express or limited is implied. These services wereperformed consistent with the agreement with our client. The conclusions presented in this Report werebased upon the services described and not on scientific tasks or procedures beyond the scope of describedservices or time or budgetary constraints. Any statement or opinion contained in this report prepared byWoodard & Curran shall not be construed to create any warranty or representation that the property is freeof pollution or complies with any or all applicable regulatory or statutory requirements; or that theproperty is fit for any particular purpose. Unless otherwise indicated in this Report, no attempt was madeto check on the compliance of present or past owners of the Site with federal, state, or local laws andregulations. Woodard & Curran Inc. shall not be responsible for conditions or consequences arising fromrelevant facts that were concealed, withheld, or not fully disclosed at the time the evaluation wasperformed.
Results of the activities contained in this report apply to conditions existing when services wereperformed and are intended only for the client, purposes, locations, time frames, and project parametersindicated. We are not responsible for the impacts of any changes in environmental standards, practices, orregulations subsequent to performance of services. We do not warrant the accuracy of informationsupplied by others or the use of segregated portions of this report.
This report is solely for the use and information of our client unless otherwise noted. Any reliance on thisreport by a third party is at such party’s sole risk.

Boston DND (221375) 5-1 Woodard & Curran221375 RAM Status Report #2.DOC November 2011
5. REFERENCES
Woodard & Curran, Inc. (W&C) 2010. Release Abatement Measure Plan, 0 & 12-24 Fairmount Court,Hyde Park, Massachusetts, RTN 3-1616, July.
Woodard & Curran, Inc. (W&C) 2011. Release Abatement Measure Status Report, 0 & 12-24 FairmountCourt, Hyde Park, Massachusetts, RTN 3-1616, May.

Boston DND (221375) Woodard & Curran221375 RAM Status Report #2.DOC November 2011
TABLES
Boston DND221375.03
Table 1
Process Air Sampling Results SummaryOctober 27, 2011
LOCATION INFLUENT EFFLUENTSAMPLING DATE 10/27/2011 10/27/2011
CasNum Units
MCP Volatile Organics in Air ug/m3Vinyl chloride 75-01-4 13 ND(13)Acetone 67-64-1 14 ND(12)1,1-Dichloroethene 75-35-4 72 ND(20)Methylene chloride 75-09-2 58 ND(17)1,1-Dichloroethane 75-34-3 84 ND(20)cis-1,2-Dichloroethene 156-59-2 4,800 ND(20)1,2-Dichloroethane 107-06-2 48 ND(20)1,1,1-Trichloroethane 71-55-6 6,700 ND(27)Trichloroethene 79-01-6 10,000 ND(27)Toluene 108-88-3 540 ND(19)Tetrachloroethene 127-18-4 15,000 ND(34)Ethylbenzene 100-41-4 80 ND(22)p/m-Xylene 106-42-3/108-38-3 100 ND(43)o-Xylene 95-47-6 190 ND(22)Freon 113 76-13-1 470 ND(28)4-Ethyltoluene 622-96-8 35 ND(25)1,3,5-Trimethylbenzene 108-67-8 26 ND(25)Ethanol 64-17-5 ND(9.4) 35SUM 38,230 0Removal Efficiency % 100.00%
Notes:Ethanol was not included in the removal efficiency calculation since the compound is likely related to laboratory contamination.ND= Not detected above laboratory detection limit. Detection limit is provided in parenthesis.
Page 1 of 1

TABLE 2
TVOC Mass Removal SummarySeptember 2010 to November 2011
DATE
FLOW
(scfm)
TVOC-
PID
(ppmV)
Run Time
(Days)
Mass
Removed
(Lbs)
Cum. Mass
Removed
(Lbs)
Cum. Run
Time
(Days)
9/24/10 81.0 410.5
10/1/10 124.0 166.1 6.70 101.38 101.38 6.70
10/8/10 175.0 91.5 7.00 69.34 170.72 13.70
1/1/00 264.0 57.5 12.00 100.7 271.42 25.70
11/12/10 282.0 12.1 13.60 66.08 337.5 39.30
12/22/10 172.0 48.9 10.30 36.55 374.05 49.60
1/7/11 159.0 16.7 15.92 44.13 418.18 65.52
2/3/11 98.0 24.2 10.80 14.49 432.67 76.32
2/18/11 194.0 16.0 4.71 7.07 439.74 81.03
3/4/11 165.0 6.2 14.08 14.32 454.06 95.11
4/1/11 110.0 47.5 16.11 30.37 484.43 111.22
4/29/11 35.0 36.9 27.82 43.46 527.89 139.04
5/27/11 151.0 45.7 27.95 54.9 582.79 166.99
6/19/11 118.0 42.3 21.00 63.56 646.35 187.99
9/23/11 147.0 121.0 11.11 61.37 707.72 199.10
10/27/11 72.0 12.0 31.01 115.3 823.02 230.11
Notes:
scfm= standard cubic feet per minute
ppmV= parts per million by volume
Lbs= pounds

Boston DND (221375) Woodard & Curran221375 RAM Status Report #2.DOC November 2011
Table 3: Remedial Activities Summary
Item Description
a.) Operating Status ofthe Active RemedialSystem IncludingShutdowns
The system is in operation. The SVE operated for a total of approximately 94days between April 30, 2011 and October 27, 2011. The SVE was shutdownfor a total of approximately 87 days during this reporting period which isconsidered significant (>25% of the total reporting period). The scheduledshutdown was to monitor system rebound conditions.
b.) Dates and Number ofMonitoring Events
A total of four full Site monitoring events were conducted on the followingdates: 5/27/2011, 6/19/2011, 9/23/2011, and 10/27/2011.
c.) EffluentConcentrations
The goal of the off-gas treatment controls is to maintain a removal efficiencyof 95%. Based upon both the PID measurements obtained from the influentand effluent process air streams during SVE system monitoring events andthe influent and effluent process air samples collected for TO-15 laboratoryanalysis, this goal has been achieved to date.
d.) Discharges AbovePermissible Levels Not applicable.
e.) Recovery Ratesand/or Volumes
Based on an average flowrate of 147 scfm and runtime of approximately 230days, approximately 295 pounds of VOCs were removed between April 29,2011 and October 27, 2011. Table 2 summarizes the system TVOC massremoval based on a runtime of 230 days from data collected over the 15 of17 total Site visits since startup where total SVE system run time wasrecorded. A graph showing the influent TVOC concentration over time andthe cumulative mass removal by the SVE is provided in Figure 3.
f.) Discharge Volumes
Approximately 8 gallons of groundwater were intermittently extractedthrough the SVE wells in September and October 2011. The majority of theextracted water was during the month of October 2011, as discussed inSection 3.3.1. The groundwater was captured and is appropriately stored on-site in a 55-gallon drum that is continuing to be used for collection of systemprocess air condensate that may be produced in the future.
It is estimated that 48,742,203 scf of air was discharged to the atmospheresince the SVE system was started on September 24, 2010.
g.) Remedial Additives No remedial additives were applied.
h.) Related Maps,Graphs or Diagrams
SVE design drawings including a piping and well layout, piping andinstrumentation diagram (P&ID), piping and well details were previouslyprovided in the July 2010 RAM Plan.
Boston DND (221375) Woodard & Curran221375 RAM Status Report #2.DOC November 2011
FIGURES
SCALE: AS SHOWN
DATE: JULY 2010
JOB NO.: 221375.01
FILE NAME:
DES.BY: DR.BY: MES CK.BY: CB
Base Map Source:TOPO!™ © 2000Wildflower Productions
FIGURE 1SITE LOCUS
12-24 Fairmount CourtHyde Park, MA 02136
LAT:
LONG:
42°15’11.00”
71°07’10.09”
980 Washington St, Suite 325Dedham, MA 02026 T: 800.446.5518
Site Locus

WO
OD
AR
DC
UR
RA
NC
OM
MIT
ME
NT
&IN
TEG
RIT
YD
RIV
ER
ES
ULT
S
|w
ww
.wo
odar
dcur
ran.
com
781.
251.
0200
DE
DH
AM
,MA
SS
AC
HU
SE
TTS
0202
698
0W
AS
HIN
GTO
NS
TRE
ET
2
S
ITE
PL
AN
ESM-16
SG-02
SG-03
SG-06
SVE DISCHARGE
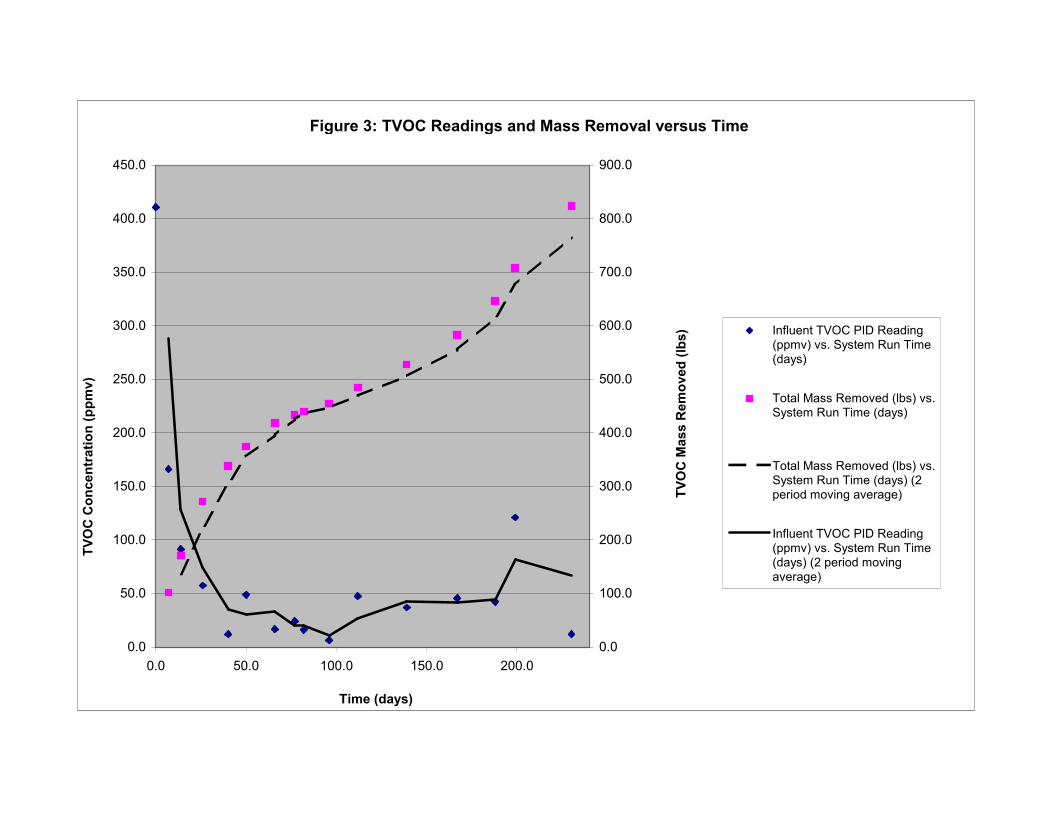
Figure 3: TVOC Readings and Mass Removal versus Time
0.0
50.0
100.0
150.0
200.0
250.0
300.0
350.0
400.0
450.0
0.0 50.0 100.0 150.0 200.0
Time (days)
TV
OC
Co
ncen
trati
on
(pp
mv)
0.0
100.0
200.0
300.0
400.0
500.0
600.0
700.0
800.0
900.0
TV
OC
Mass
Rem
oved
(lb
s) Influent TVOC PID Reading
(ppmv) vs. System Run Time(days)
Total Mass Removed (lbs) vs.System Run Time (days)
Total Mass Removed (lbs) vs.System Run Time (days) (2period moving average)
Influent TVOC PID Reading(ppmv) vs. System Run Time(days) (2 period movingaverage)
Boston DND (221375) Woodard & Curran221375 RAM Status Report #2.DOC November 2011
APPENDIX A: BWSC FORMS 106, 106A, AND 106B (POST-SUBMITTAL REPORT COPIES)
Note: Forms not included with report filed via e-DEP because forms are completed during e-DEPsubmittal. Forms included in post-submittal report copies.
Boston DND (221375) Woodard & Curran221375 RAM Status Report #2.DOC November 2011
APPENDIX B: SVE SYSTEM FIELD MONITORING REPORTS
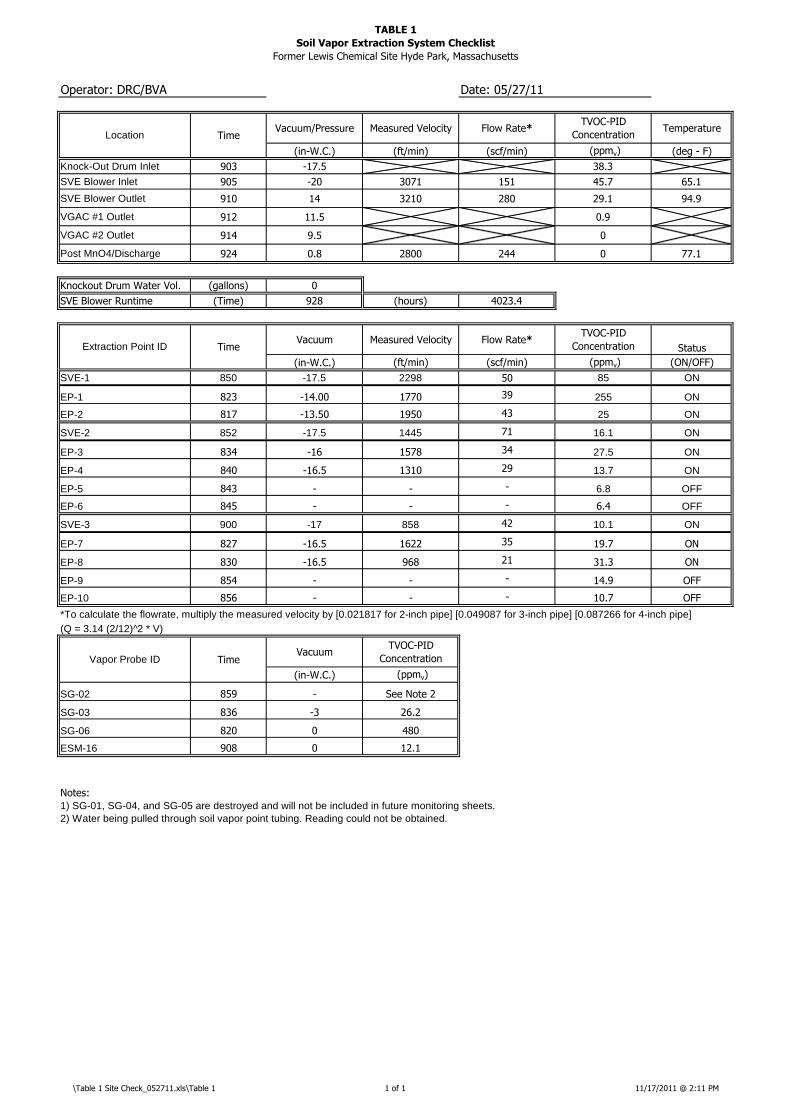
TABLE 1
Soil Vapor Extraction System Checklist
Former Lewis Chemical Site Hyde Park, Massachusetts
Vacuum/Pressure Measured Velocity Flow Rate*TVOC-PID
ConcentrationTemperature
(in-W.C.) (ft/min) (scf/min) (ppmv) (deg - F)
Knock-Out Drum Inlet 903 -17.5 38.3
SVE Blower Inlet 905 -20 3071 151 45.7 65.1
SVE Blower Outlet 910 14 3210 280 29.1 94.9
VGAC #1 Outlet 912 11.5 0.9
VGAC #2 Outlet 914 9.5 0
Post MnO4/Discharge 924 0.8 2800 244 0 77.1
Knockout Drum Water Vol. (gallons) 0
SVE Blower Runtime (Time) 928 (hours) 4023.4
Vacuum Measured Velocity Flow Rate*TVOC-PID
Concentration Status
(in-W.C.) (ft/min) (scf/min) (ppmv) (ON/OFF)
SVE-1 850 -17.5 2298 50 85 ON
EP-1 823 -14.00 1770 39 255 ON
EP-2 817 -13.50 1950 43 25 ON
SVE-2 852 -17.5 1445 71 16.1 ON
EP-3 834 -16 1578 34 27.5 ON
EP-4 840 -16.5 1310 29 13.7 ON
EP-5 843 - - - 6.8 OFF
EP-6 845 - - - 6.4 OFF
SVE-3 900 -17 858 42 10.1 ON
EP-7 827 -16.5 1622 35 19.7 ON
EP-8 830 -16.5 968 21 31.3 ON
EP-9 854 - - - 14.9 OFF
EP-10 856 - - - 10.7 OFF
*To calculate the flowrate, multiply the measured velocity by [0.021817 for 2-inch pipe] [0.049087 for 3-inch pipe] [0.087266 for 4-inch pipe]
(Q = 3.14 (2/12)^2 * V)
VacuumTVOC-PID
Concentration
(in-W.C.) (ppmv)
SG-02 859 - See Note 2
SG-03 836 -3 26.2
SG-06 820 0 480
ESM-16 908 0 12.1
Notes:
1) SG-01, SG-04, and SG-05 are destroyed and will not be included in future monitoring sheets.
2) Water being pulled through soil vapor point tubing. Reading could not be obtained.
Vapor Probe ID Time
Operator: DRC/BVA Date: 05/27/11
Location Time
Extraction Point ID Time
\Table 1 Site Check_052711.xls\Table 1 1 of 1 11/17/2011 @ 2:11 PM
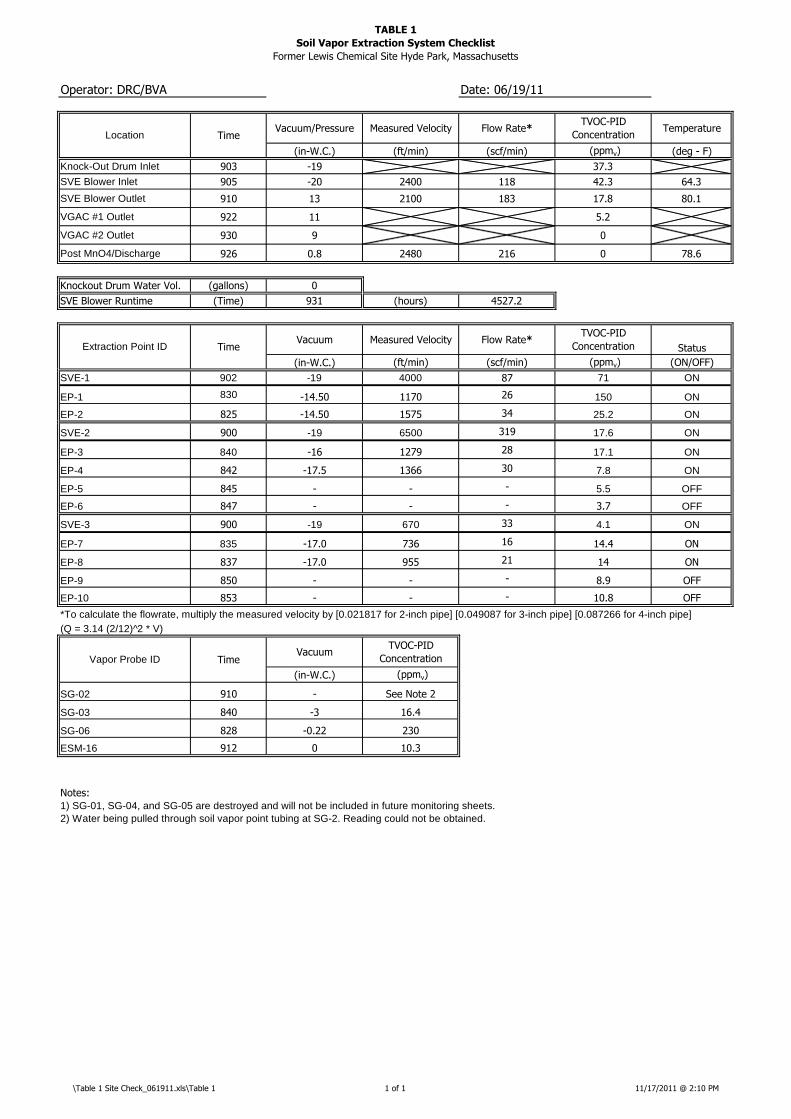
TABLE 1
Soil Vapor Extraction System Checklist
Former Lewis Chemical Site Hyde Park, Massachusetts
Vacuum/Pressure Measured Velocity Flow Rate*TVOC-PID
ConcentrationTemperature
(in-W.C.) (ft/min) (scf/min) (ppmv) (deg - F)
Knock-Out Drum Inlet 903 -19 37.3
SVE Blower Inlet 905 -20 2400 118 42.3 64.3
SVE Blower Outlet 910 13 2100 183 17.8 80.1
VGAC #1 Outlet 922 11 5.2
VGAC #2 Outlet 930 9 0
Post MnO4/Discharge 926 0.8 2480 216 0 78.6
Knockout Drum Water Vol. (gallons) 0
SVE Blower Runtime (Time) 931 (hours) 4527.2
Vacuum Measured Velocity Flow Rate*TVOC-PID
Concentration Status
(in-W.C.) (ft/min) (scf/min) (ppmv) (ON/OFF)
SVE-1 902 -19 4000 87 71 ON
EP-1 830 -14.50 1170 26 150 ON
EP-2 825 -14.50 1575 34 25.2 ON
SVE-2 900 -19 6500 319 17.6 ON
EP-3 840 -16 1279 28 17.1 ON
EP-4 842 -17.5 1366 30 7.8 ON
EP-5 845 - - - 5.5 OFF
EP-6 847 - - - 3.7 OFF
SVE-3 900 -19 670 33 4.1 ON
EP-7 835 -17.0 736 16 14.4 ON
EP-8 837 -17.0 955 21 14 ON
EP-9 850 - - - 8.9 OFF
EP-10 853 - - - 10.8 OFF
*To calculate the flowrate, multiply the measured velocity by [0.021817 for 2-inch pipe] [0.049087 for 3-inch pipe] [0.087266 for 4-inch pipe]
(Q = 3.14 (2/12)^2 * V)
VacuumTVOC-PID
Concentration
(in-W.C.) (ppmv)
SG-02 910 - See Note 2
SG-03 840 -3 16.4
SG-06 828 -0.22 230
ESM-16 912 0 10.3
Notes:
1) SG-01, SG-04, and SG-05 are destroyed and will not be included in future monitoring sheets.
2) Water being pulled through soil vapor point tubing at SG-2. Reading could not be obtained.
Vapor Probe ID Time
Operator: DRC/BVA Date: 06/19/11
Location Time
Extraction Point ID Time
\Table 1 Site Check_061911.xls\Table 1 1 of 1 11/17/2011 @ 2:10 PM

TABLE 1
Soil Vapor Extraction System Checklist
Former Lewis Chemical Site Hyde Park, Massachusetts
Vacuum/Pressure Measured Velocity Flow Rate*TVOC-PID
ConcentrationTemperature
(in-W.C.) (ft/min) (scf/min) (ppmv) (deg - F)
Knock-Out Drum Inlet 11:10 -13 128
SVE Blower Inlet 11:13 -16.5 3000 147 121 67.8
SVE Blower Outlet 11:15 14.0 3000 262 53.7 94.8
VGAC #1 Outlet 11:20 12.0 15.5
VGAC #2 Outlet 11:22 10.0 2.2
Post MnO4/Discharge 11:25 1 3000 0.2 78.9
Knockout Drum Water Vol. (gallons) 0.25
SVE Blower Runtime (Time) 11:40 (hours) 4793.9
Vacuum Measured Velocity Flow Rate*TVOC-PID
Concentration Status
(in-W.C.) (ft/min) (scf/min) (ppmv) (ON/OFF)
SVE-1 10:26 -12 2600 57 299 ON
EP-1 — — — — — ON
EP-2 — — — — — ON
SVE-2 10:30 -12 2600 128 40.5 ON
EP-3 9:40 -16 1600 35 41.9 ON
EP-4 10:05 -17 1500 33 50.2 ON
EP-5 10:10 — — — 6.6 OFF
EP-6 10:20 — — — 4.6 OFF
SVE-3 10:38 -12.5 700 34 67.2 ON
EP-7 9:46 -18 1400 31 70.2 ON
EP-8 9:43 — — — 17.3 OFF
EP-9 10:50 — — — 43.2 OFF
EP-10 10:55 — — — 26.6 OFF
*To calculate the flowrate, multiply the measured velocity by [0.021817 for 2-inch pipe] [0.049087 for 3-inch pipe] [0.087266 for 4-inch pipe]
(Q = 3.14 (2/12)^2 * V)
VacuumTVOC-PID
Concentration
(in-W.C.) (ppmv)
SG-02 10:50 - See Note 2
SG-03 10:00 -3 74.1
SG-06 — — —
ESM-16 10:57 0 15.4
Notes:
1) SG-01, SG-04, and SG-05 are destroyed and will not be included in future monitoring sheets.
2) Water being pulled through soil vapor point tubing at SG-2. Reading could not be obtained.
3) EP-1, EP-2, and SG-06 were not monitored on this date due to lack of lighting in the area of the vacant building these points are located.
4) Shut off EP-8 due to slurpping
Vapor Probe ID Time
Operator: DRC/BVA Date: 9/23/11
Location Time
Extraction Point ID Time
\Table 1 Site Check_092311.xls\Table 1 1 of 1 11/17/2011 @ 2:11 PM
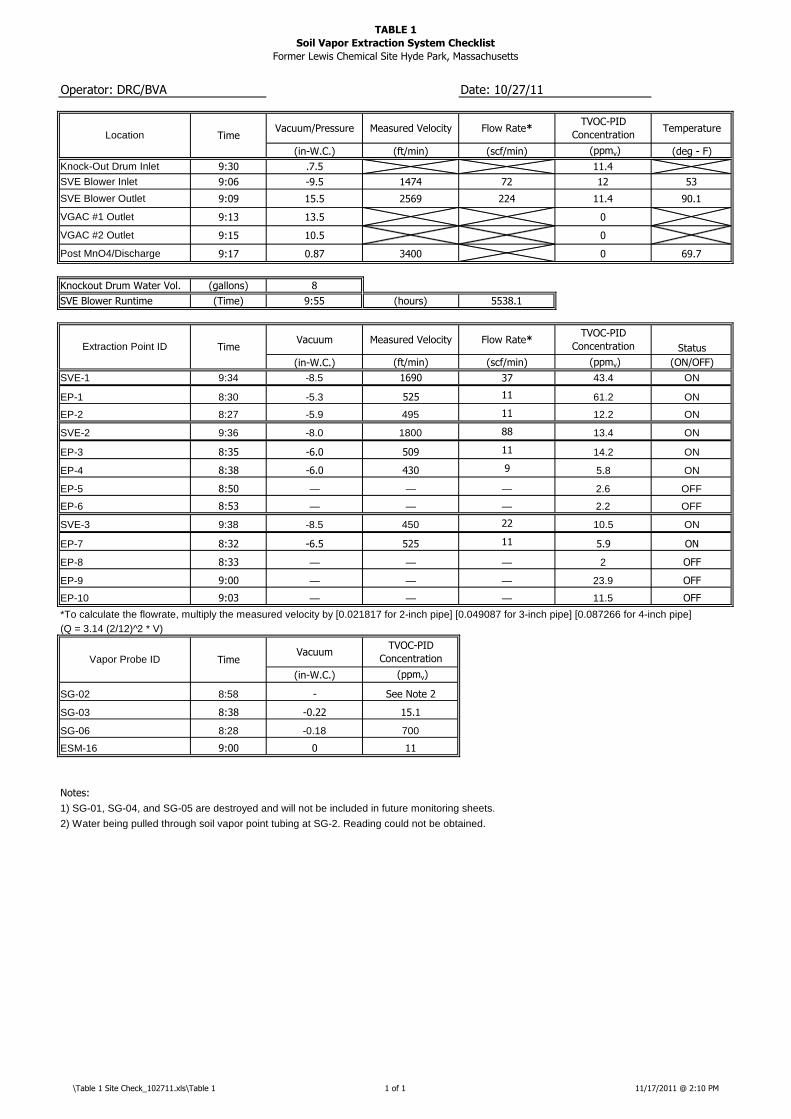
TABLE 1
Soil Vapor Extraction System Checklist
Former Lewis Chemical Site Hyde Park, Massachusetts
Vacuum/Pressure Measured Velocity Flow Rate*TVOC-PID
ConcentrationTemperature
(in-W.C.) (ft/min) (scf/min) (ppmv) (deg - F)
Knock-Out Drum Inlet 9:30 .7.5 11.4
SVE Blower Inlet 9:06 -9.5 1474 72 12 53
SVE Blower Outlet 9:09 15.5 2569 224 11.4 90.1
VGAC #1 Outlet 9:13 13.5 0
VGAC #2 Outlet 9:15 10.5 0
Post MnO4/Discharge 9:17 0.87 3400 0 69.7
Knockout Drum Water Vol. (gallons) 8
SVE Blower Runtime (Time) 9:55 (hours) 5538.1
Vacuum Measured Velocity Flow Rate*TVOC-PID
Concentration Status
(in-W.C.) (ft/min) (scf/min) (ppmv) (ON/OFF)
SVE-1 9:34 -8.5 1690 37 43.4 ON
EP-1 8:30 -5.3 525 11 61.2 ON
EP-2 8:27 -5.9 495 11 12.2 ON
SVE-2 9:36 -8.0 1800 88 13.4 ON
EP-3 8:35 -6.0 509 11 14.2 ON
EP-4 8:38 -6.0 430 9 5.8 ON
EP-5 8:50 — — — 2.6 OFF
EP-6 8:53 — — — 2.2 OFF
SVE-3 9:38 -8.5 450 22 10.5 ON
EP-7 8:32 -6.5 525 11 5.9 ON
EP-8 8:33 — — — 2 OFF
EP-9 9:00 — — — 23.9 OFF
EP-10 9:03 — — — 11.5 OFF
*To calculate the flowrate, multiply the measured velocity by [0.021817 for 2-inch pipe] [0.049087 for 3-inch pipe] [0.087266 for 4-inch pipe]
(Q = 3.14 (2/12)^2 * V)
VacuumTVOC-PID
Concentration
(in-W.C.) (ppmv)
SG-02 8:58 - See Note 2
SG-03 8:38 -0.22 15.1
SG-06 8:28 -0.18 700
ESM-16 9:00 0 11
Notes:
1) SG-01, SG-04, and SG-05 are destroyed and will not be included in future monitoring sheets.
2) Water being pulled through soil vapor point tubing at SG-2. Reading could not be obtained.
Vapor Probe ID Time
Operator: DRC/BVA Date: 10/27/11
Location Time
Extraction Point ID Time
\Table 1 Site Check_102711.xls\Table 1 1 of 1 11/17/2011 @ 2:10 PM

Boston DND (221375) Woodard & Curran221375 RAM Status Report #2.DOC November 2011
APPENDIX C: LABORATORY ANALYTICAL REPORTS