relative capture: quasi-experimental evidence from the
TRANSCRIPT
Relative Capture: Quasi-Experimental Evidence fromthe Chinese Judiciary
Yuhua Wang∗
May 2, 2017
Forthcoming at Comparative Political Studies
Abstract
There has been a long-held view since the Federalist Papers that the lower the level of gov-ernment, the greater is the extent of capture by vested interests. Relying on the analyticalframework of relative capture, I challenge this assumption by arguing that interest groupshave different incentives and capacities to capture different levels of government. I test thetheory by investigating how judges at different judicial levels adjudicate corporate lawsuitsin China. Exploiting a quasi-experiment in which the Supreme People’s Court dramaticallyraised the threshold for entering higher-level courts in 2008, I show that privately owned en-terprises are more likely to win in lower-level courts, and state-owned enterprises are morelikely to win in higher-level courts. I then employ qualitative interviews to explore the mech-anisms behind them. The findings challenge an underlying assumption in the decentralizationliterature and have important policy implications for countries that are trapped in centraliza-tion/decentralization cycles.
Keywords: relative capture, decentralization, authoritarian judiciary, China, quasi-experiment
∗Yuhua Wang, Assistant Professor, Department of Government, Harvard University, 1737 Cambridge Street,Cambridge, MA 02138, USA. Email: [email protected]. I want to thank Biying Zhang,Shuhao Fan, Mengxi Tan, Xing Li, and Yilun Ding for providing excellent research assistance. Matt Blackwell,Ryan Enos, Jennifer Gandhi, Lizhi Liu, Eddy Malesky, Dan Mattingly, Gwyneth McClendon, Jon Rogowski,Weiyi Shi, Dan Smith, Jeff Staton, Rachel Stern, Lynn White, John Yasuda, Xiang Zhou, panel participants atAPSA 2015, and workshops at Florida State University, Emory University, UC Berkeley, and Harvard Universityhave provided valuable feedback. The qualitative interviews were approved by the Institutional Review Board atthe University of Michigan (HUM00028263). All errors remain my own.
1

Going back to Alexander Hamilton, James Madison, and John Jay in the Federalist Papers
(No.10), a common view is that the lower the level of government, the greater is the extent of
capture by vested interests (Hamilton et al., 1961). Empirical work finds that granting auton-
omy to local governments facilitates elite capture and creates a “company town” atmosphere
(Reinikka & Svensson, 2004; Campos & Hellman, 2005; Malesky & Taussig, 2009; van der
Kamp et al., 2016). Some recent work shows that decentralized systems are more corrupt and
have weaker law enforcement than their centralized counterparts, and other studies find that
centralization can significantly help eliminate local elite corruption and generate better group
outcomes (Treisman, 2000; Cai & Treisman, 2004; Grossman & Baldassarri, 2012; Malesky et
al., 2014).
A sizable literature on local capture studies countries that decentralized their political and
fiscal systems during economic reforms, such as China and Vietnam. For example, Lorentzen
et al. (2014) show that large industrial firms in China prevent local governments from imple-
menting environmental transparency measures. Mattingly (2016) argues that village elites in
China use their influence to capture rents and confiscate property. Malesky et al. (2014) demon-
strate that centralization has reduced elite corruption in Vietnam and improved public service
delivery.
In response to local capture, China and Vietnam have recentralized their political systems in
order to correct “local protectionism.” For example, the Chinese Communist Party announced a
“rule-of-law” reform in 2014 to centralize the political and fiscal management of the judiciary,
which has been accused of protecting local vested interests.1 Similarly, the National Assem-
bly in Vietnam introduced the Ordinance on Judges and Jurors of People’s Courts in 2002 to
“centralize the management of the lower courts” to higher-level courts.2
Most studies on local capture, however, have focused on a single level of local government
and analyzed the set of actors that capture that level. But capture also takes place at higher
levels. Wang (2016) shows that in the last two decades, Chinese firms have increasingly built
connections with higher-level governments in order to exert influence across localities. Like-
wise, Eaton & Kostka (in press) demonstrate that central state-owned enterprises (SOEs) have
2
been shielded from the enforcement of environmental regulations in China. Therefore, we need
a general theory about who captures what level of government – and why.
I argue that capture exists at every level, and that the capturers are different at different
levels. I use the analytical framework of relative capture to contend that interest groups have
different incentives and capacities to influence different levels of government. Due to political
and economic constraints, different levels of government are susceptible to distinct interest
groups. For example, a higher-level government’s reliance on a certain type of interest group
for tax revenue strengthens that group’s incentive and capacity to engage in higher capture; a
lower-level government’s fiscal dependence on another type of interest group creates a tendency
for lower capture. The relative capture framework does not make the monotonic assumption
that the lower the level of government, the greater is the extent of capture. Rather, it claims that
various levels of government are relatively captured by various interest groups.
In contrast to previous studies that focus on only one level of government, I examine how
capture works at multiple levels. Empirically, I investigate how judges at different judicial
levels adjudicate corporate lawsuits in China. China has one of the world’s largest decentralized
political systems, and its judiciary represents a typical decentralized system in which local
authorities have been delegated considerable fiscal, administrative, and political power (Mertha,
2005; Landry, 2008a). By examining how judges at different tiers handle cases brought by
different firms, we can inspect both how a decentralized system functions and how various
interest groups operate.
China has a fragmented bureaucratic structure (Lieberthal, 1992; Mertha, 2009), in which
the judiciary answers to the territorial party-state (horizontal authority) rather than a higher-
level court (vertical authority). I study how the linkages between litigants and the party-state
influence judges’ decisions. Chinese judges’ incentive structure is shaped by the local gov-
ernment tax system. While a larger percentage of private firms’ tax payments goes to county
governments (which control basic courts), SOEs are the major revenue source for prefectural
governments (which control intermediate courts). This fragmentation between the horizon-
tal and vertical lines of authority creates different opportunities and incentives for judges and
3

firms at different levels. I expect that privately owned firms are more likely to win in lower-level
courts (basic courts), and that SOEs are more likely to win in higher-level courts (intermediate
courts).
Rigorously testing relative capture would require a counterfactual in which the same inter-
est group is treated at different levels in the judiciary. But this counterfactual does not exist, and
corporate lawsuits handled by lower-level courts are systematically different from those adjudi-
cated by higher-level courts. For example, higher-level courts are responsible for disputes with
higher financial stakes.
I exploit a quasi-experiment in which the Chinese Supreme People’s Court dramatically
raised the monetary threshold for cases heard by higher-level courts in 2008. For example,
before 2008, economic disputes with claims higher than 6 million yuan (roughly $920,000)
were under the jurisdiction of intermediate courts; cases less than this amount were under the
jurisdiction of basic courts. This cutoff was raised to 50 million yuan (roughly $7.7 million)
in 2008. The jurisdictional change shifted many cases between 6 million and 50 million yuan
(treatment group) that would have been adjudicated by intermediate courts before 2008 to basic
courts after 2008. This policy change therefore creates exogenous variations in firms’ exposure
to different judicial levels.
I compiled and analyzed an original dataset of over 4,000 court cases disclosed by publicly
traded firms from 1998 to 2013, in which I detect relative capture. For every four cases, SOEs
win one more in intermediate than in basic courts, while non-SOEs win one more in basic than
in intermediate courts.
Because it is difficult to collect systematic, quantitative evidence on covert firm operations,
I employ qualitative interviews to explore how firms influence governments and how govern-
ments and courts respond to corporate pressure. Drawing on my interviews with officials,
judges, firm managers, and lawyers, I show that firms use voice and exit to influence court
decisions, and that judges bow to the pressure of local fiscal imperatives.
The findings have implications for developing countries that struggle to balance their pri-
vate and public sectors. SOEs are a major interest group that obstructs economic reforms, bends
4
regulations, and causes developmental problems, such as pollution and corruption (Haggard,
1990; Hellman et al., 2003; Dasgupta et al., 2001). The World Bank champions privatization
as a remedy for the sins of SOEs, an approach that is encapsulated in the Washington Con-
sensus (Lieberman, 1993). This approach assumes that state capture will be reduced (or even
eliminated) when resources are transferred to the private sector. As I show, however, SOEs and
private firms can both capture the state, if certain incentive structures are present. Privatization
only shifts capture from one level to another.
I present, to my knowledge, the first quasi-experimental evidence on whether (and how)
interest groups capture governments at different levels. My findings challenge the long-held
assumption that the lower the level of government, the greater is the extent of capture by vested
interests.
This article also contributes to the literature on authoritarian institutions. My findings speak
to authoritarian rule of law and add to the scarce but growing literature on comparative judicial
politics (Ferejohn et al., 2009; Helmke, 2002; Gallagher, 2017; Ginsburg & Moustafa, 2008;
Moustafa, 2007). This is the first empirical study to quantitatively demonstrate that judges’ rul-
ings on business disputes are biased if a country lacks judicial independence. This conclusion
is nuanced by the finding that local authorities protect firms that contribute revenues to the local
coffers. In addition, this article complements the recent literature on institutions in autocracies.
While most scholars have focused on how autocrats use democratic institutions, such as legis-
latures and elections, to co-opt the opposition and extend their term in office (Magaloni, 2006;
Gandhi & Przeworski, 2007; Brownlee, 2007; Wright, 2008; Svolik, 2012), I show that interest
groups can exploit these institutions to benefit themselves.3
Relative Capture and the Chinese Judiciary
In this section, I elaborate on the theoretical framework of relative capture, introduce the Chi-
nese judicial structure, and apply the theory to the Chinese context.
5

Theoretical Framework
Following Hellman et al. (2003), I define capture as a situation in which firms use their in-
fluence to shape the rules of the game or how games are played. Previous work has assumed
that interest groups are more likely to capture lower- rather than higher-level governments,
because lobbying local governments is less costly. To influence higher-level governments,
interest groups need to overcome daunting collective action problems as the issue at stake be-
comes more complicated and bureaucratic layers multiply. This assumption of local capture is
reflected in classic principal–agent models in which the principal values general welfare, while
the agent caters to special interests (Fudenberg & Tirole, 1991).
Interest groups, however, can reap more benefits by capturing higher-level governments.
Higher-level governments make and enforce policies within a larger geographic area, and thus
can break local boundaries and grant interest groups preferential treatment to a greater extent.
By capturing higher-level bureaucracy, interest groups can expand their rent-seeking activities
to a larger administrative area or even the whole country. For many firms, the benefits of
lobbying higher-level governments outweigh the higher costs. So interest groups with different
capacities and incentives can capture different levels of politics.
Bardhan & Mookherjee (2000) develop a framework of relative capture based on a model
of electoral competition that is subject to the influence of special interest groups. In their
basic setup, two parties are competing, and their policy platforms are influenced by campaign
contributions from a lobby. The model generates the conditions under which capture is more
likely to occur at the local or higher levels. One condition relates to interest groups’ incentives
and capacity to influence elections at different levels. For example, under majoritarian electoral
systems, only the dominant party wins and gains representation in national policy-making,
politicians rely more on campaign contributions to win, and interest groups have higher stakes
in the election, which creates greater capture at the national level.
While Bardhan and Mookherjee’s model is not directly applicable to an authoritarian con-
text, its insight that politicians and interest groups have different incentives and capacities at
different levels has important implications for how relative capture operates in autocracies. For
6

example, if politicians at different levels depend on different interest groups for tax revenue
(equivalent to campaign funding in Bardhan & Mookherjee’s (2000) model), then this might
make politicians at different levels vulnerable to different interest groups. Below, I briefly de-
scribe China’s judicial system and discuss how relative capture can explain judges’ incentives.
The Chinese Context
The Chinese judiciary is embedded in a fragmented and decentralized political system in which
government organizations at different levels (and in different hierarchies) have conflicting pol-
icy goals (Lieberthal, 1992; Mertha, 2009). This “fragmented authoritarianism” controls the
judiciary, in which the court is the agent of dual principals. The first (vertical) principal is the
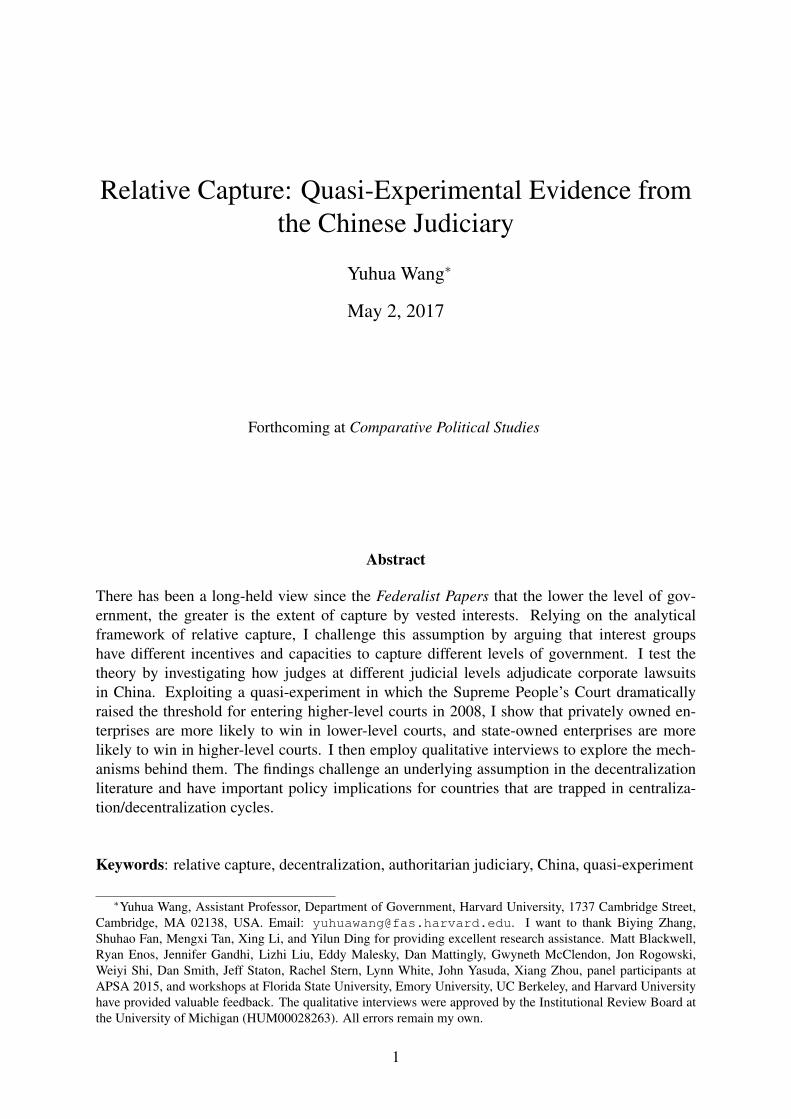
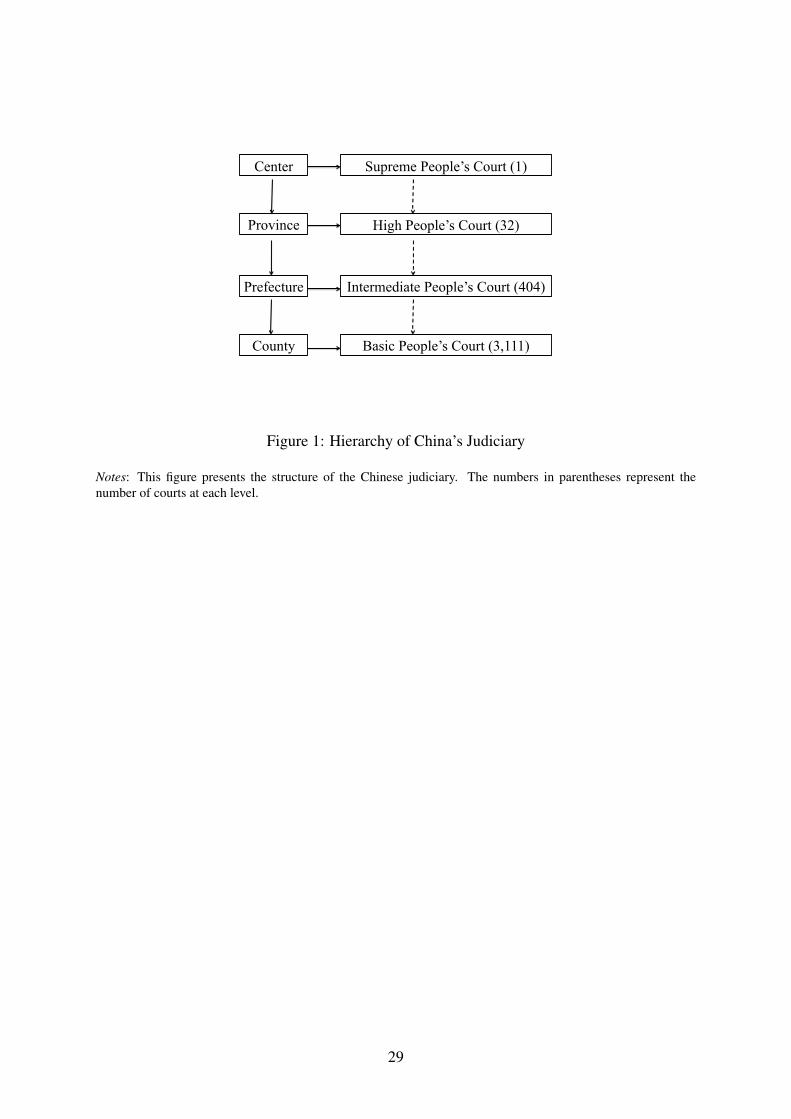
higher-level court. Although there is a four-level judicial hierarchy from the Supreme People’s
Court to basic people’s courts (see Figure 1), lower-level courts are not required to obey orders
from higher-level courts (Wang, 2015, 76-79). Higher-level courts do, however, have limited
power to evaluate lower-level courts and make personnel decisions.4 For example, the Supreme
Court cannot independently appoint presidents or other major court officials at the provincial
level; nor is the Supreme Court responsible for financing lower-level courts (Wang, 2015, 68-
70). While judges in the U.S. judicial system often reverse decisions made by lower-level
courts, which has a deterrent effect on lower-level courts’ behavior (Kastellec, 2011), higher-
level courts in China rarely amend lower-level courts’ decisions, although they have the power
to do so.5 As an intermediate court judge remarked, “We do our best to respect basic courts’
decisions. We do not correct if it is a borderline case unless there is a fatal mistake.”6
[INSERT FIGURE 1 HERE]
The second (horizontal) principal is the territorial party-state. The party-state at each level,
including the Communist Party committees and the executive branch, takes a leading role in
making personnel decisions and budgetary allocations for courts at that territorial level (Wang,
2015, 76-77). For example, the county party committee and government have the prerogative to
appoint presidents and other major officials at basic courts, and pay the majority of basic courts’
7
expenditures, including judges’ salaries and bonuses, office supplies, vehicles, and buildings.
Therefore courts’ policy preferences are more responsive to those of the corresponding party-
state than the higher-level court.
To understand judges’ policy preferences, we therefore need to examine the incentive struc-
ture of party-state officials. Local officials’ priority is to maximize tax revenues, which help
their promotions (Lu & Landry, 2014; Shih et al., 2012). In the current fiscal system, the
central government and local governments share tax revenues. While the center collects some
corporate and value-added tax (but not sales tax), various levels of local government collect
the rest.7 In the current tax-sharing system, after the center collects the central tax, most SOE
tax revenue is distributed to the prefectural governments (the principal of intermediate courts),
while most private company tax revenue belongs to the county-level governments (principal of
basic courts).8
As agents of their territorial party-state, intermediate courts favor SOEs, and basic courts
non-SOEs. Because higher-level courts usually defer to lower-level court decisions, it is diffi-
cult for SOEs to influence basic court decisions by pressuring intermediate courts. SOEs may
lobby prefectural governments or party committees to intervene in cases adjudicated by ba-
sic courts, but the costs are high (because of the extended layers of bureaucratic control) and
the benefits are low (winning a low-stake case at the county level). This indirect lobbying is
ineffective if the prefecture has other priorities, or if the county has some bargaining power vis-
a-vis the prefecture. For example, prefectural governments need to rely on county governments
to fulfill some central mandates, such as population control, social stability maintenance, and
economic development; prefectures sometimes concede on other issues to maintain counties’
cooperation.9 Hypothesis 1 summarizes my theoretical expectation:
Hypothesis 1: While SOEs are more likely to win in intermediate courts, non-SOEsare more likely to win in basic courts, ceteris paribus.
8

Empirics
I face two empirical challenges in exploring relative capture in an authoritarian judiciary. First,
unlike studies of the U.S. judicial system that can utilize widely published cases, the judiciary
in authoritarian regimes is opaque, so no systematic court data is available. Legal studies have
relied on subjective measures of litigants’ preferences for litigation (Gallagher, 2006; Landry,
2008b; Ang & Jia, 2014). Few empirical studies have been able to systematically examine
court outcomes in authoritarian regimes, especially at the local level.10 The second challenge is
that, due to the heterogeneity of cases across different levels, simply regressing case outcomes
on the judicial level produces biased estimates. A conventional regression framework fails to
control for unobservable firm- and court-level covariates, which produces omitted variable bias.
In addition, litigants can self-select into a sympathetic court, leading to selection bias.
Data
I use a manually coded dataset of litigations disclosed by Chinese publicly traded firms from
1998 to 2013. In 1998, the Shanghai and Shenzhen Stock Exchange issued a rule that required
listed companies to disclose their litigations.11 This mandatory disclosure requirement covers
all lawsuits involving publicly traded firms since 1998. I manually collected 4,275 court litiga-
tions from company reports (annual, semi-annual, quarterly, and special reports) to construct
the Database of Chinese Corporate Lawsuits (DCCL).12 The DCCL contains information on
each case’s legal issue, type, litigants, claim (in yuan), outcome, timing, court name, and level,
as well as additional details. Most cases in the dataset are economic disputes. I then merged the
DCCL with a dataset that contains firm-level variables – such as state share, registration loca-
tion, age, total assets, and industry – collected from the China Securities Market and Account
Research (CSMAR) database.13 Table 1.1 in the web appendix presents the main variables’
summary statistics.
Of the 4,275 observations, 39.12% are loan disputes, 47.33% contract disputes, and 13.55%
other types of disputes; 73.19% involved SOEs, and 26.81% non-SOEs.14 The average win rate
of SOEs is 45.00%, and that of non-SOEs is 40.66%. I cannot judge whether a firm should have
9
won or lost, which requires scrutinizing all the available evidence and applying relevant laws.
I am only interested in relative win rates. In a fair judicial system, a case should have the
same outcomes at different judicial levels; different win rates at different levels would indicate
different standards in the system.
Because only the discloser is listed and publicizes firm information, we know little about
its litigating opponent unless it is also listed. For 636 unique pairs, I find information on both
sides of the litigation: 36.64% of these pairs are SOEs versus non-SOEs, 49.37% are SOEs
versus SOEs, and 13.99% are non-SOEs versus non-SOEs. For the main analysis, I use all
4,275 observations to leverage statistical power, assuming that the quasi-experiment randomly
assigned opponents into treatment and control groups. I will show that when I focus on the
subset of 636 cases, the results are similar.
Basic courts adjudicated 1,034 cases (24.64%), intermediate courts 2,689 cases (64.08%),
high courts 467 cases (11.13%), and the Supreme Court six cases (0.14%). The distribution is
skewed because basic and intermediate courts serve as the first-instance courts for most cases,
and higher-level courts only handle appeals. The following sections present the results from
basic and intermediate courts; the results from higher-level courts are available in the web
appendix.
Identification Strategy
My identification strategy relies on a regulatory change that exogenously determines cases’
exposure to various court levels. In 2008, the Supreme People’s Court announced a regulatory
change that dramatically raised the monetary threshold for cases to enter higher-level courts.
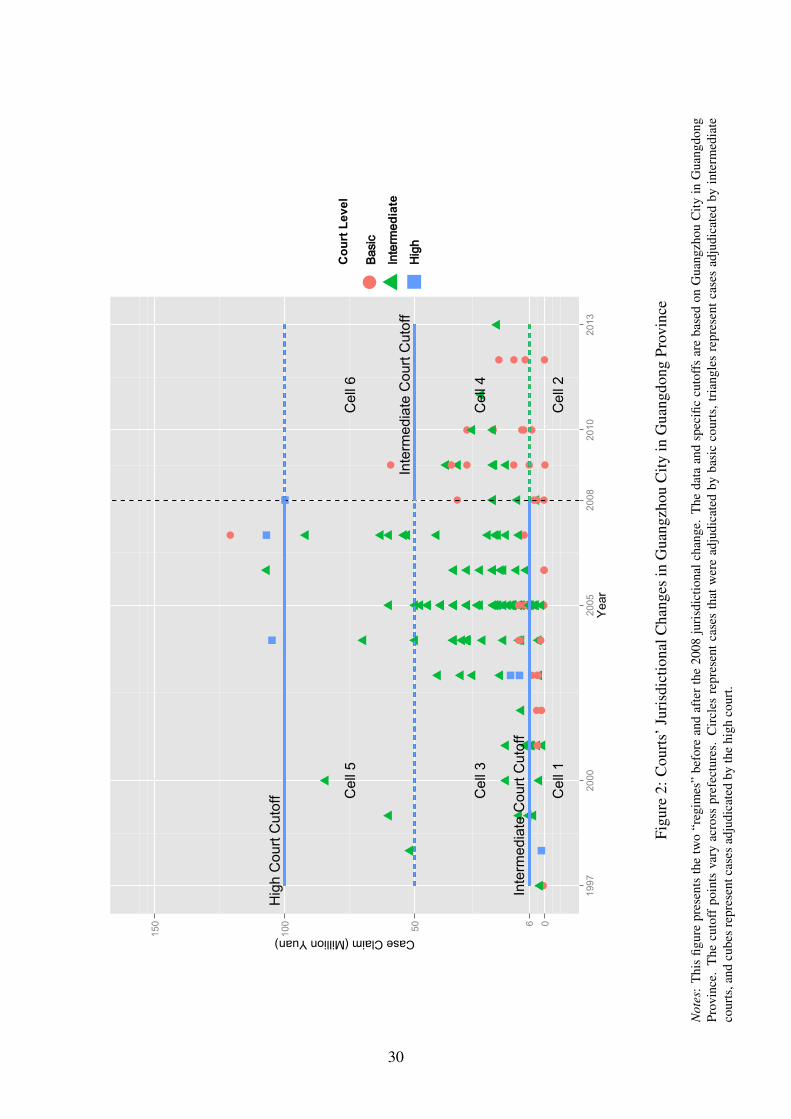
The thresholds vary across prefectures. I use Guangzhou City in Guangdong Province as an
example. Before 2008, economic disputes that had claims under 6 million yuan were under
the jurisdiction of basic courts, disputes between 6 million and 100 million yuan were under
the jurisdiction of the intermediate court, and disputes over 100 million yuan were under the
jurisdiction of the high court. As economic disputes increasingly had higher stakes, which
placed a heavier burden on higher-level courts, in 2008 the Supreme People’s Court announced
10

a jurisdictional change for each judicial level. After 2008, in Guangzhou, economic disputes
under 50 million yuan were under the jurisdiction of basic courts, disputes between 50 million
and 300 million yuan were under the jurisdiction of the intermediate court, and disputes above
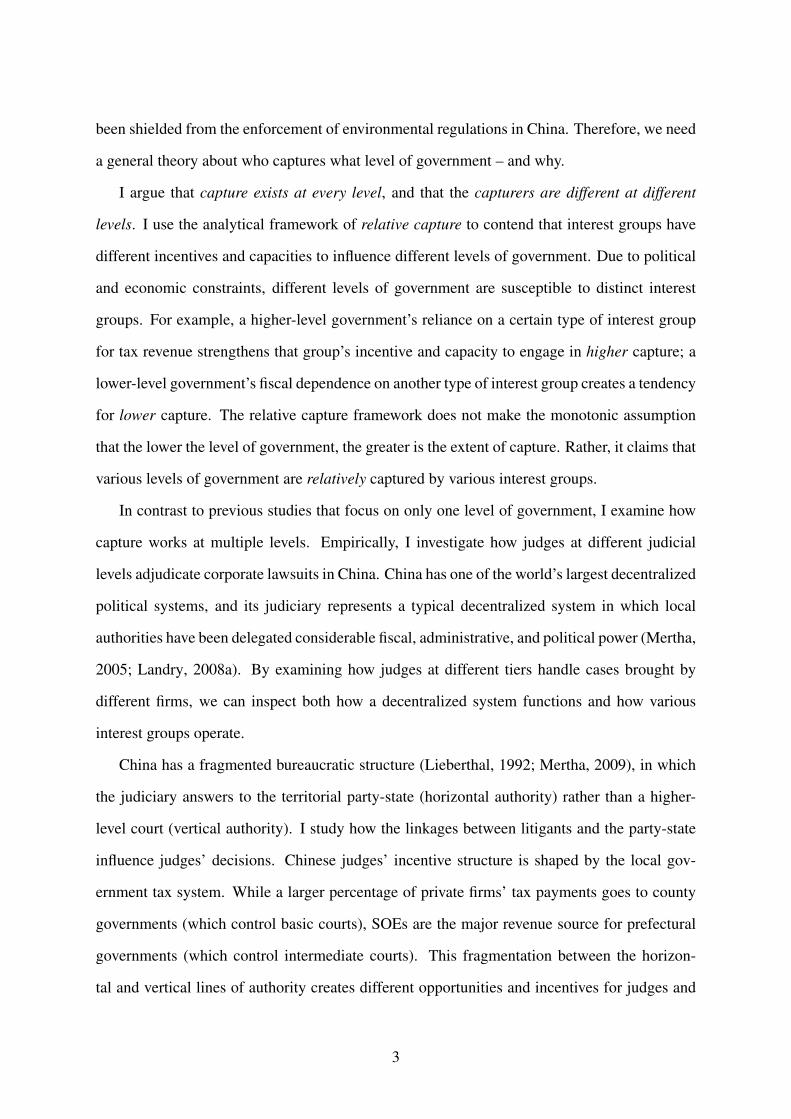
300 million yuan were directed to the high court. Figure 2 summarizes the changes illustrated
by real cases in the database.
[INSERT FIGURE 2 HERE]
As a result, economic disputes between 6 million and 50 million yuan that would have been
adjudicated by intermediate courts before 2008 (Cell 3 in Figure 2) were adjudicated by basic
courts after 2008 (Cell 4 in Figure 2). I call these cases Treatment Group I, because they were
exposed to the treatment of basic courts after 2008. This is reflected in Figure 2: there are very
few circles (basic court cases) in Cell 3 but more circles in Cell 4. The jurisdictional change
also created control groups. For example, disputes between 50 million and 100 million yuan
(Control Group I) have always been under the jurisdiction of intermediate courts, both before
(Cell 5 in Figure 2) and after 2008 (Cell 6 in Figure 2). Restricting my sample to the [6 million,
100 million] range, a case’s exposure to the treatment (basic court) was determined by both the
amount of its claim and the year it was accepted. After controlling for province and industry
fixed effects, an interaction term between dummy variables indicating post-2008 and Treatment
Group I is a plausible exogenous variable, and is used as an instrument in the win rate equation.
[INSERT TABLE 1 HERE]
Table 1 illustrates the identification strategy, showing exposure to basic and intermediate
courts before and after 2008. While basic courts adjudicated 11.25% of cases in Cell 3 (before
2008), this percentage increases to 53.71% in Cell 4 (after 2008). Likewise, while intermediate
courts heard 85.58% of cases in Cell 3, this percentage decreases to 45.14% in Cell 4. This
40.44% decrease is significant compared with the 3.26% decrease in the control group. The
difference-in-differences (DID) estimate is also statistically significant in a regression frame-
work with province and industry fixed effects (Table 2.2 in the web appendix).
11

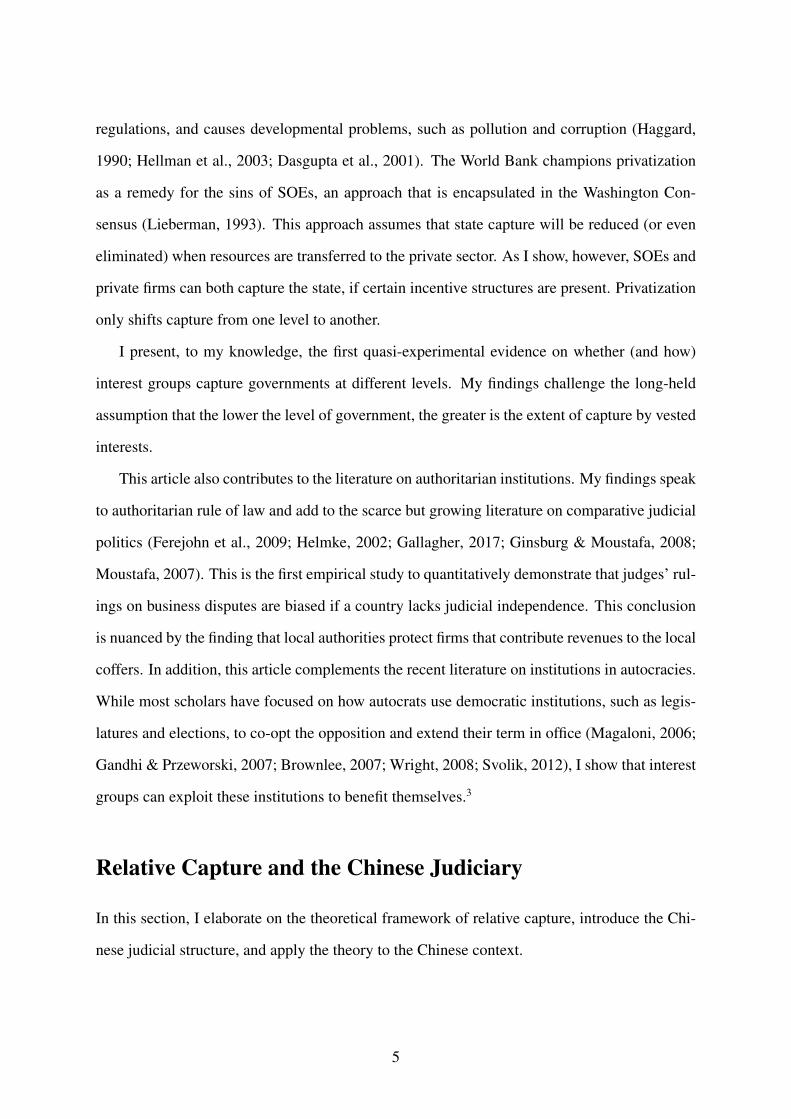
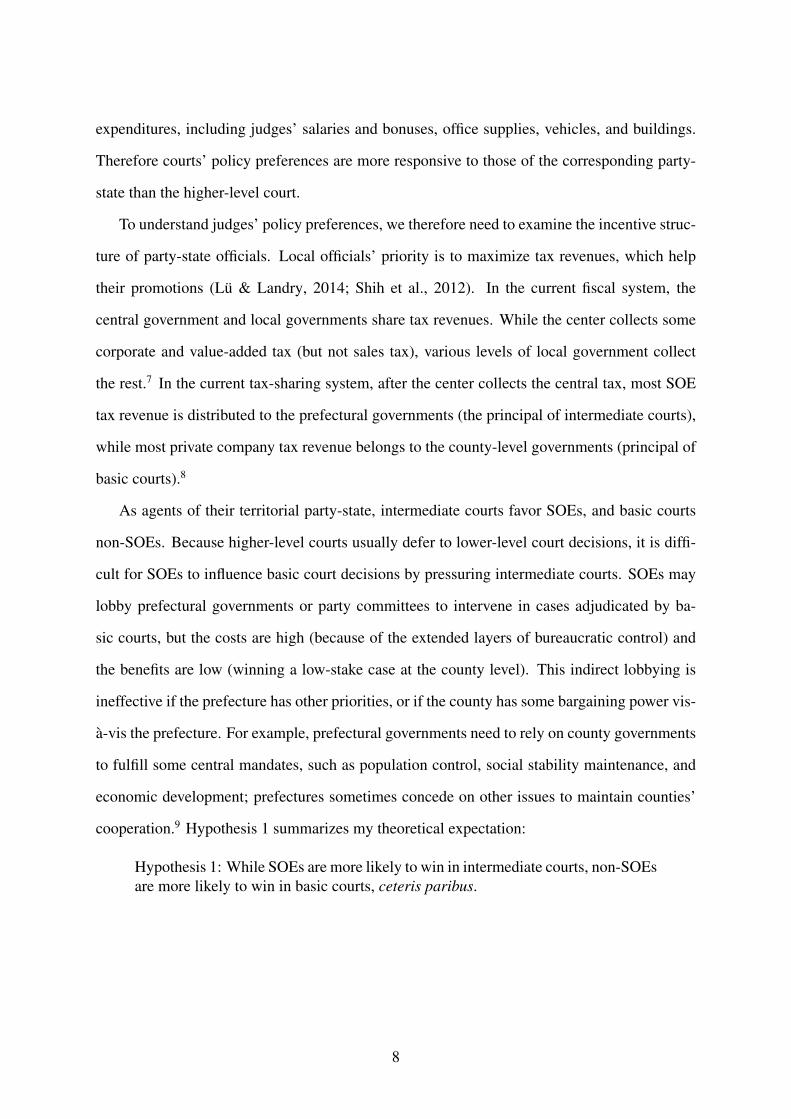
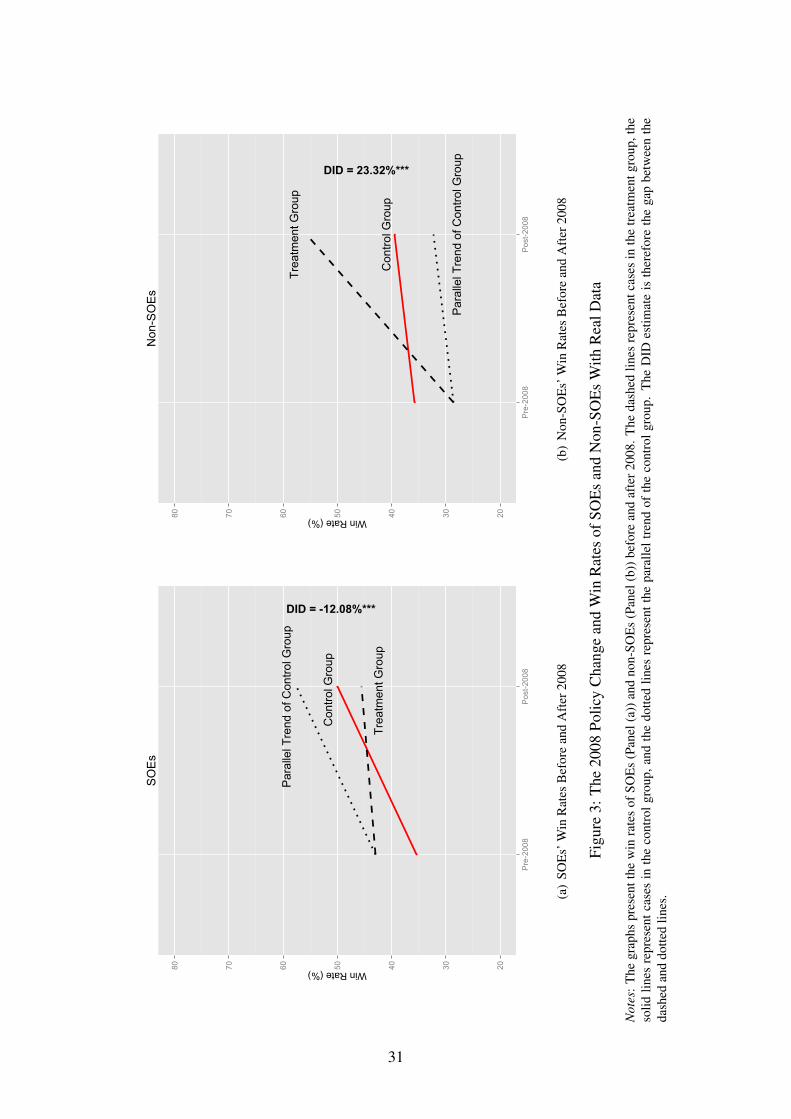
Similarly, as Figure 3 demonstrates, the win rates of SOEs and non-SOEs also experienced
significant changes after 2008. As Panel (a) shows, while the average win rate of SOEs in the
treatment group (dashed line) before 2008 is 42.95%, it increases to 45.50% after 2008, which
is a 2.55% (s.d. = 3.87) difference. Since the change in the control group (solid line) is 14.63%
(s.d. = 4.56), the DID is -12.08% (s.d. = 5.98) and significant at the 0.01 level. This implies that
SOEs are less likely to win in basic courts. Conversely, according to Panel (b), the average win
rate for non-SOEs in the treatment group (dashed line) before 2008 is 28.63%, and changes to
55.63% after 2008, which creates a difference of 27.00% (s.d. = 5.04). By contrast, the change
in the control group (solid line) is 3.68% (s.d. = 6.52), so the DID is 23.32% (s.d. = 8.24,
p < 0.01), indicating that non-SOEs are more likely to win in basic courts. The patterns are
similar when I plot year-by-year data (Figure 2.1 in the web appendix).
I use pre-treatment data to explicitly test the parallel trend assumption that is required for
DID. I find that before 2008, cases in the treatment and control groups generally follow a
common trend, but after 2008 SOEs are more likely to lose and non-SOEs are more likely to
win in the treatment group (see Table 2.1 in the web appendix).15 The remainder of this article
will elaborate on this strategy to produce more convincing results.16
[INSERT FIGURE 3 HERE]
Difference-in-Differences Estimates
I generalize the DID strategy to a regression framework. First, I conduct an intention-to-treat
(ITT) analysis to estimate the reduced-form relationship between being in the treatment group
after 2008 and a firm’s win rate. The ITT analysis focuses on the groups created by the ran-
domization introduced by the 2008 jurisdictional change, although the randomization was not
strictly enforced. This suggests running the following regression:
12
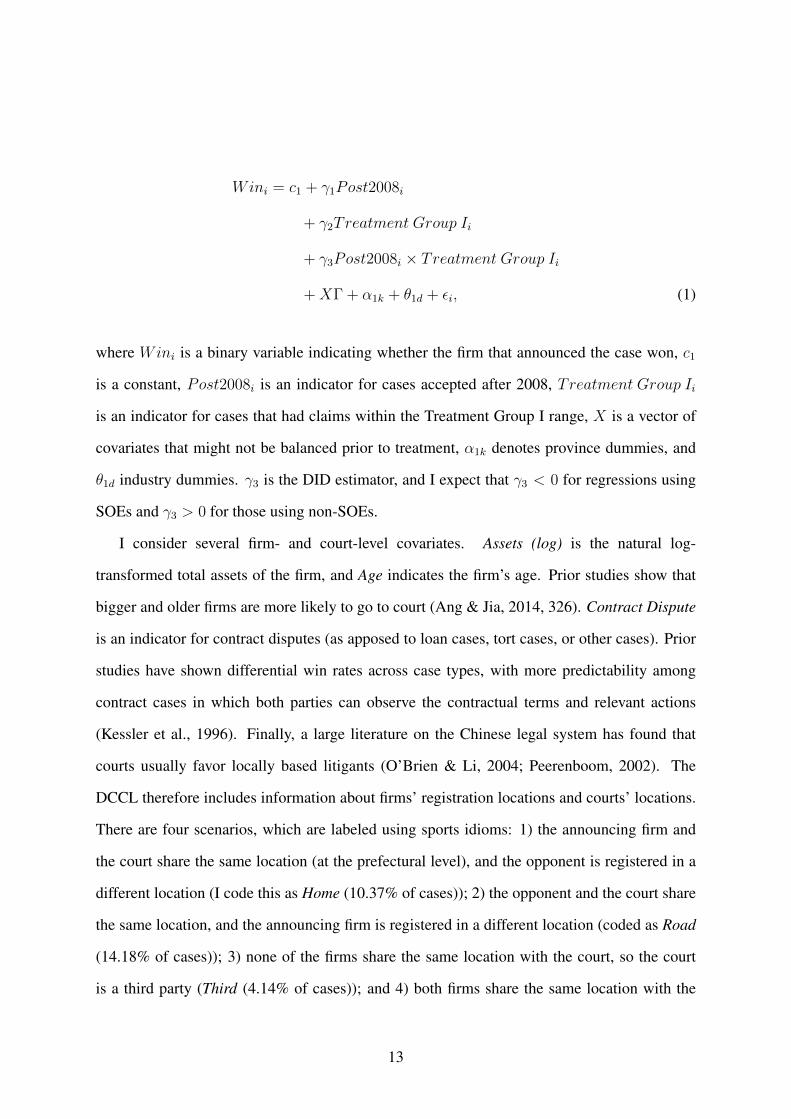
Wini = c1 + γ1Post2008i
+ γ2Treatment Group Ii
+ γ3Post2008i × Treatment Group Ii
+XΓ + α1k + θ1d + εi, (1)
where Wini is a binary variable indicating whether the firm that announced the case won, c1
is a constant, Post2008i is an indicator for cases accepted after 2008, Treatment Group Ii
is an indicator for cases that had claims within the Treatment Group I range, X is a vector of
covariates that might not be balanced prior to treatment, α1k denotes province dummies, and
θ1d industry dummies. γ3 is the DID estimator, and I expect that γ3 < 0 for regressions using
SOEs and γ3 > 0 for those using non-SOEs.
I consider several firm- and court-level covariates. Assets (log) is the natural log-
transformed total assets of the firm, and Age indicates the firm’s age. Prior studies show that
bigger and older firms are more likely to go to court (Ang & Jia, 2014, 326). Contract Dispute
is an indicator for contract disputes (as apposed to loan cases, tort cases, or other cases). Prior
studies have shown differential win rates across case types, with more predictability among
contract cases in which both parties can observe the contractual terms and relevant actions
(Kessler et al., 1996). Finally, a large literature on the Chinese legal system has found that
courts usually favor locally based litigants (O’Brien & Li, 2004; Peerenboom, 2002). The
DCCL therefore includes information about firms’ registration locations and courts’ locations.
There are four scenarios, which are labeled using sports idioms: 1) the announcing firm and
the court share the same location (at the prefectural level), and the opponent is registered in a
different location (I code this as Home (10.37% of cases)); 2) the opponent and the court share
the same location, and the announcing firm is registered in a different location (coded as Road
(14.18% of cases)); 3) none of the firms share the same location with the court, so the court
is a third party (Third (4.14% of cases)); and 4) both firms share the same location with the
13
court (Derby (71.30% of cases)). So the vast majority of disclosing firms (81.67%) litigate in
their local courts. I include Road, Third, and Derby in the regressions, leaving Home as the
reference group.
I first restrict my sample to cases in Treatment Group I or Control Group I.17 The estimate
is therefore the treatment effect of greater exposure to basic courts (as opposed to intermediate
courts) on the probability of winning. I then divide my sample into SOEs and non-SOEs based
on the announcing firm’s state share and estimate the regressions separately. Table 2 presents
the ordinary least squares (OLS) estimates with standard errors clustered at the prefectural
level.18
[INSERT TABLE 2 HERE]
In Table 2, I first present the DID estimates without any controls to avoid post-treatment bias
and then gradually add fixed effects and the controls. Columns (1)-(3) show estimates for SOEs,
and columns (4)-(6) display estimates for non-SOEs. For SOEs, being in Treatment Group I
after 2008, which increased cases’ exposure to basic courts (as opposed to intermediate courts),
significantly decreases the probability of winning. The model without any controls shows that
being in the treatment group decreases SOEs’ average win rate by 12.1%. Bigger or older firms
are more likely to win, which is consistent with prior findings. SOEs are more likely to win
contract disputes in which two parties have symmetric information. But I find no “home-field
advantage” for SOEs: they have roughly the same win rates in all four scenarios (Home, Road,
Third, and Derby). I interpret this as a result of SOEs’ broad political connections that are not
limited to one locality. Future research can examine how SOEs employ political connections
outside jurisdictional boundaries to gain judicial leverage.
For non-SOEs, however, more exposure to basic courts significantly increases their proba-
bility of winning. Estimates in column (4) indicate that non-SOEs are 23.7% more likely to win
in basic than in intermediate courts. Bigger and older firms have no advantages over smaller
and younger ones. Similar to SOEs, non-SOEs are more likely to win contract disputes. Lastly,
non-SOEs have a significant “home-field advantage:” they are less likely to win in “road” courts
than in “home” courts, because they usually have only local ties.
14
The ITT results support Hypothesis 1: SOEs are more likely to win in intermediate courts,
while non-SOEs are more likely to win in basic courts. An unbiased estimate of the local aver-
age treatment effect (LATE), however, requires full compliance. As Table 1 indicates, although
most cases ended up in the right court based on their claims, a small number of cases went
to the “wrong” courts. Unobservable case/firm/court characteristics (e.g., the case’s political
sensitivity or court burden) or simply mistakes may cause noncompliance. In addition, because
only listed firms’ information is publicly available, unlisted firms’ information is unobserv-
able to the researcher. To accurately estimate the LATE, I use an instrumental variable (IV)
approach.
Two-Stage Least-Squares Estimates
Because a case’s claim and timing jointly determine its probability of being adjudicated by
a basic court, I can use an interaction term between a case’s designated group (treatment or
control) and acceptance year to predict the probability that it will be accepted by a basic court,
and then use this probability to predict the win rate. If one assumes that the interaction term
has no effect on winning other than by changing the court level (exclusion restriction), one can
use the interaction term to conduct IV estimates. The treatment here (basic court) is compound,
because basic and intermediate courts vary along multiple dimensions, such as the competence
and training of judges, caseloads and funding, and power and prestige.
To satisfy the exclusion restriction, I assume that the 2008 regulatory change assigned cases
to treatment or control randomly or as-if random. Below, I demonstrate why the identification
strategy is valid.
First, if the regulatory change indeed randomized cases into basic (treatment) and interme-
diate (control) courts after 2008, we should observe a perfect balance of covariates between
these two groups. I find exactly that. As Table 3 presents, no covariates, including Assets (log),
Age, Contract Dispute, Home, Road, Third, and Derby, are significantly different in treatment
and control groups at the 95% confidence level.
[INSERT TABLE 3 HERE]
15
The exclusion restriction would also be violated if firms strategically self-selected into one
group or another, in anticipation of a sympathetic court or a jurisdictional change. In one
scenario, firms with certain types of political connections may select into a particular level,
expecting preferential treatment. Table 3, however, shows that firms’ political connections are
balanced between the treatment and control groups.19
In another scenario, imagine a privately owned firm that had a 10 million yuan dispute in
Guangzhou City, which would have been heard by an intermediate court in 2007. But after
learning that the cutoff would be raised in 2008, and that the case would instead end up in a
basic court – which would help it win – the firm might have decided to wait until after 2008 to
file the case. Or firms might have chosen to file under the new 2008 system when previously
they would not have filed at all (or vice versa).
This strategic sorting, however, is difficult. First, the timing of the Supreme Court ruling
was exogenously determined. The jurisdictional change was made in direct response to the
passage of the new Civil Procedural Law, which came into effect on April 1, 2008. The new
law changed its Article 178 to prohibit a party from applying to the court that originally tried
the case for retrial. After the law came into effect, all appeals were required to be filed in
a higher-level court. This change dramatically increased the burden of higher-level courts,
especially intermediate and high courts. The 2008 jurisdictional change was then made to
alleviate the burden of higher-level courts.20 Second, the thresholds for various levels vary
significantly across prefectures even within the same province. For example, while the new
threshold for entering intermediate courts in Guangzhou City is 50 million yuan, it is 30 million
in Zhongshan City, and 20 million in Chaozhou City. The lack of a nationally unified standard
made it hard for firms to strategically calculate when/if/where to file claims. Third, there is
no evidence that such strategic behavior occurred. There were 92 cases involving non-SOEs
entering courts in 2007 and 90 in 2008. Similarly, there were 289 cases involving SOEs in 2007
and 270 in 2008. I do not observe any irregularities around 2008.
If the interaction between cases’ designated group and timing has no direct effect on the
win rate, the interaction term is then available as a valid instrument. The lower panel in Table 4
16
shows that this instrument has good explanatory power in the first stage.21 The first stage yields
large F statistics ranging from 65.44 to 103.14, which far exceeds the critical value of 10
required to avoid weak instrument bias (Staiger & Stock, 1997). I use two-stage least-squares
(2SLS) estimates to fit the following equation:
Wini = c1 + γ1Basici(instrumented)
+XΓ + α1k + θ1d + εi, (2)
where Basici is a binary variable indicating whether the case was adjudicated by a
basic court (intermediate court as the reference group), instrumented by Post2008i ×
Treatment Group Ii. γ1 is the quantity of interest – the LATE of basic courts. I expect that
γ1 < 0 for regressions using SOEs and γ1 > 0 for those using non-SOEs.
[INSERT TABLE 4 HERE]
The upper panel of Table 4 shows the second-stage results, which are consistent with the
DID estimates. SOEs are (23.8%) less likely to win in basic courts than in intermediate courts.
Firm size and age have a positive effect on winning, and SOEs are more likely to win contract
disputes. Similarly, I do not find a “home-field advantage” for SOEs. Conversely, non-SOEs
are (27.8%) more likely to win in basic courts than in intermediate courts. But firm size and age
have no effects for non-SOEs. They are more likely to win contract disputes, and non-SOEs
are more likely to win at home than on the road.
So far, I have only included variables that measure one side of the litigation (the discloser); I
have not considered the opponents. Below, I provide direct evidence that even facing an SOE, a
private enterprise is more likely to win in lower-level courts. Unfortunately, not every opponent
is publicly traded and releases its ownership information. For 636 unique pairs of firms that are
both listed, I collected ownership information on both sides. Below, I restrict my analysis to
litigations between a non-SOE and an SOE. My theory predicts that non-SOEs are more likely
to win against SOEs in basic courts than in intermediate courts. Table 5 shows the IV estimates,
17

which provide that this is indeed the case.
[INSERT TABLE 5 HERE]
The point estimate of Basic (column (3)) is very similar to that in Table 4, indicating that the
2008 change indeed randomized opponents into control and treatment groups. This provides
the strongest direct evidence to support my theory.
In sum, both the DID and 2SLS results support Hypothesis 1 that there is relative capture
in the Chinese judiciary. I now check the robustness of my estimates.
Robustness Checks
I conduct five robustness checks. First, recent studies have examined firms’ political connec-
tions in their preference for litigation (Ang & Jia, 2014; Lu et al., 2015). If political connections
are correlated with both court level and judicial outcome, this would indicate that my estimates
suffer from omitted variable bias. Table 3 indicates that politically connected firms do not se-
lect into a certain level, but I need to show that controlling for connections does not change my
original results. To measure political connections, I collected the biographical information of
these firms’ board members (chairperson, president, vice-president, CEO, executive director,
non-executive director, and secretary).22 I then manually coded the career information of each
board member in each firm to determine whether a member was politically connected.23
I focus on the following three types of connections: 1) Government Connection – a firm is
connected to the government if at least one of its board members was a government official;
2) Parliament Connection – a firm is connected to parliament (people’s congress or people’s
consultative conference) if at least one of its board members was a member of parliament;
and 3) Legal Connection (a subset of Government Connection) – a firm is connected to legal
organizations if at least one of its board members was an official in a police department, court,
procuratorate, or legal bureau. Adding these variables does not change my original results
(Table 6.2 in the web appendix).
Four additional robustness checks include using matching to tackle potential selection bias,
removing centrally controlled SOEs, employing an RD-type strategy, and using a triple interac-
18

tion term between SOE share, Post2008, and Treatment Group I. None of these checks change
my original results (Tables 6.3–6.8 in the web appendix).
Mechanisms
Although quantitative data helps reveal general patterns, I cannot quantify the covert operations
of every firm to explore how they influence court decisions. Here I rely on the fieldwork that
I conducted in 2010 to investigate the mechanisms that connect firms and courts. My intervie-
wees include party/government officials, judges, lawyers, and firm managers. Interviews cited
below were conducted in Guangdong, Hainan, Jiangxi, and Shanghai. I relied on my personal
connections to select the sites and establish initial contact. I then used snowball methods to re-
cruit more interviewees. The goal of the qualitative fieldwork and interviews was not to make
any causal inferences, which was impossible because the cases and interviewees were not ran-
domly selected. Instead, I relied on my interviews to understand the quantitative analyses and
provide insight into how the legal system works in practice, how investors lobby courts, and
what government officials think they should do to keep investors.24
My interviews with firm managers and lawyers showed that firms use a combination of
voice and exit to influence the government. As for voice, firms usually convey their requests
directly or indirectly through business associations to major leaders.25 In addition, many firms
use the threat of exit to strengthen their bargaining power with the government. For example,
interviews conducted in Guangzhou City demonstrate that many Guangzhou firms threaten to
move to Shanghai if their voices are not heard by the government.26
My interviews with government and court officials indicate that they are largely responsive
to these business requests, especially when the businesses are important taxpayers. A judge ex-
plicitly told me, “You need to follow the money.”27 There are two ways in which the party-state,
under pressure from businesses, manipulates judicial decisions. One is through the political le-
gal committee (政法委) – a powerful party apparatus that controls the police, procuratorates,
and courts. For cases that involve important firms, the chairperson of the political legal com-
mittee will speak directly to the court president to convey the committee’s “official spirit.”28
19

The second way in which the party-state manipulates judicial decisions is the through the adju-
dication committee (审判委员会) – an ad hoc committee within a court that consists of major
officials of the court rather than a panel of judges. For these important cases, the adjudication
committee will step in and make a politicized decision.29
I encountered a case during this fieldwork that illustrates these dynamics.30 It involved
the firm Great Ocean in the City of Buddha, which is located in a southern Chinese province.
Great Ocean is an SOE owned and managed by the City of Buddha government. It has strong
bargaining power vis-a-vis the city government because its tax payment constitutes the lion’s
share of the city’s revenue. As lawyer Wang remarked, “Great Ocean has a strong voice in this
city. To a large extent, it can influence city policies and demand special treatment, otherwise
it can threaten to lay off people or hide revenue.”31 In 2009, Great Ocean was sued by its
stockholders for concealing information, and the case was accepted by the Intermediate Court
of the City of Buddha. The court considered this a “sensitive” case because the defendant
was a local SOE. Under pressure from the city government, the court delayed the process
and tried to convince the plaintiffs to settle the dispute outside the court through mediation.
The plaintiffs refused. The court finally had to hold court hearings, and court adjudication
committee delivered the final verdict. The court ruled that Great Ocean won, but to discourage
the stockholders from appealing, Great Ocean needed to pay a lump-sum compensation to the
plaintiffs, which was less than the plaintiffs originally requested. Lawyer Wang commented,
“Chinese local government only intervenes in individual cases if 1) one of the parties has a
special identity, for example if a government official or an influential firm is involved, or 2)
if the case outcome can impact social stability.”32 A judge said, “Here in this place, there is a
saying: ‘No matter if it is a black firm or a white firm; as long as it pays taxes, it is a good
firm.’”33
In sum, my qualitative interviews helped uncover the firm-government-court links in which
powerful businesses usually take deliberate actions to influence court decisions, and judges
often have to yield to local fiscal imperatives when adjudicating cases involving important
taxpayers.
20

Discussion and Conclusion
As Rodden (2006, 1-2) remarks, “decentralization and the spread of federalism are perhaps the
most important trends in governance around the world over the last 50 years.” By the end of
the 20th century, estimates of the number of decentralization reforms ranged from 80% of the
world’s countries to effectively all of them (Manor, 1999). Since then, further reforms have
been announced in several dozen countries as diverse as Bolivia, Cambodia, Ethiopia, France,
Indonesia, Japan, Peru, South Africa, South Korea, Uganda, and the UK (Faguet, 2014).
A large literature, however, argues that lower-level governments are more susceptible to
elite capture. If this presumption is correct, the advantages of decentralization – to bring gov-
ernments “closer to the people,” induce competition among local governments, and make it
easier for citizens to hold their representatives accountable – would be compromised by local
elite capture.34
Many countries, including Vietnam and China, that have experienced the disadvantages
of decentralization have begun to recentralize to distance politics from special interests. Both
decentralization and recentralization reforms have received financial support from international
donors, such as the World Bank, the United Nations Development Program, the European
Union, the U.S. Agency for International Development, and the Ford Foundation.35
Despite the enthusiasm and generosity on both sides, prior work has offered contradic-
tory conclusions. While some report that decentralization is associated with lower levels of
corruption (Fisman & Gatti, 2002), some find that decentralization facilitates elite capture and
creates more opportunities for corruption (Treisman, 2000; Mattingly, 2016). Many developing
countries lack a straightforward formula, and have thus become trapped in what Baum terms
“tightening/loosening cycles:” centralizing, decentralizing, and then going back to square one
(Baum, 1996).
My study helps reconcile this controversy. I argue that the framework of relative capture
is useful in examining politicians’ and interest groups’ incentives at different levels of gov-
ernment. The key insight is that a political hierarchy can be relatively captured by different
interest groups at different levels. I then use a novel dataset of real court cases disclosed by
21
Chinese publicly traded firms to show that cases brought by different firms win at different
rates at different court levels. The Chinese tax structure shapes judges’ preferences: courts
favor firms that pay taxes to the territorial party-state. Exploiting a quasi-experiment in which
the Supreme Court dramatically raised the monetary threshold for cases to enter higher-level
courts, which created exogenous variation in cases’ exposure to various levels of courts, I esti-
mate the treatment effect of judicial level on judicial outcomes. I demonstrate that while SOEs
are more likely to win in intermediate courts, non-SOEs are more likely to win in basic courts.
I employ qualitative interviews to substantiate my proposed mechanisms.
My findings generate a policy implication. Politicians and policy makers who want to re-
duce capture in their countries should carefully examine the relative strength of major interest
groups vis-a-vis different levels of government. In countries where the level of economic devel-
opment is low and most interest groups are small and local, centralization is often effective in
reducing local corruption and improving governance. Indeed, Gennaioli & Rainer (2007) find
that African countries that are more centralized have a better record of public goods provision,
such as education, health, and infrastructure. Conversely, in countries where the economy is
more developed and diverse with firms of different sizes, a balance between local autonomy
and central control is crucial to avoid capture. For example, many scholars, when compar-
ing the reform experiences of China and Russia, argue that China’s transition has been more
successful because the Chinese Communist Party has been in a strong position to control its
local agents while maintaining local autonomy, while in Russia old and inefficient firms benefit
from preferential treatment by regional politicians whose power is not constrained by central
authorities (Blanchard & Shleifer, 2001; Sonin, 2010). In these more diverse economies, em-
phasizing decentralization without central control often leads to “local protectionism,” while
too much centralization creates “central protectionism.” An important question for many de-
veloping countries that are facing this conundrum is to ask “captured by whom” and design
solutions to fit local conditions.
22

Notes
1Please see http://goo.gl/QmBk4m (Accessed February 23, 2015).
2Please see https://www.bhba.org/index.php/component/content/article/251 (Ac-
cessed February 23, 2015).
3For a similar dynamic in the legislature, please see Truex (2014) and Hou (2015).
4The decentralized legal system was designed to prevent politicians from using it for political purges, which
were prevalent in the early years of the Communist Party. Please see Tanner & Green (2007).
5Basic and intermediate courts serve as first-instance courts for most cases, and a litigant can appeal once to a
higher-level court. The decision by the higher-level court is the final verdict.
6Author’s interview with a judge, March 31, 2010.
7For details of the tax-sharing system, please see Wong & Bird (2008).
8While there is no uniform formula for sharing across localities, the rule of thumb is that prefectural govern-
ments collect local “critical” enterprises’ taxes (most of which are SOEs), while those of other entities (most are
non-SOEs) are collected by the county government. Please see https://goo.gl/iZZoEg (Accessed Febru-
ary 16, 2015). Also see examples in Harbin (https://goo.gl/UfC5oX), Anshan (https://goo.gl/
wDLPgS), and Xinxiang (https://goo.gl/3BY3EP).
9China’s multiple layers of governance grant autonomy to local governments. Please see Qian & Xu (1993).
10Helmke (2002) uses actual court outcomes, but at the national level.
11Please see Chapter 11.1 of Listing Rule of the Shanghai Stock Exchange (1998) (https://goo.gl/
QMUpaQ) and Listing Rule of the Shenzhen Stock Exchange (1998) (https://goo.gl/oWvTVF).
12Every case is double-coded by me and a group of trained research assistants.
13I accessed CSMAR through Wharton Research Data Services, a web-based business data research service
from the Wharton School at the University of Pennsylvania. http://wrds-web.wharton.upenn.edu
(Accessed August 9, 2013).
14The state share data are from CSMAR. To simplify presentation, I define SOEs as entities with a state share
greater than zero, and non-SOEs as having a zero state share. This classification is consistent with the situation
in China, where the state can exert de facto control over a company as long as it has at least a small share in it. I
later use a continuous measure (SOE share) for the main analysis and obtain similar results (Table 6.7 in the web
appendix).
15The results for the non-SOEs are statistically insignificant, probably due to the small number of observations,
but the signs are in the right direction.
16An alternative identification strategy is a regression discontinuity (RD) design to compare cases just above
and just below the cutoff. The success of an RD design relies on the assumption that there is no sorting around
the cutoff. If firms manipulated the claims in order to self-select into a sympathetic court, this would violate the
23
no-manipulation assumption of the RD design. I conduct a McCrary density test, which rejects the null hypothesis
of continuity of the density of dispute claims around the cutoff (Section III in the web appendix). Therefore I do
not use an RD design.
17I present the results using cases in higher-level courts – Treatment Group II or Control Group II – in Table
4.2 in the web appendix.
18I use OLS rather than logit because non-linear models like logit may have the incidental parameter problem
with many dummy variables, which is the case here. I conduct robustness checks using logit models in the web
appendix (Table 4.1) and obtain similar results.
19I discuss how I define and code political connections in the Robustness Check section.
20For more details, please see http://news.xinhuanet.com/legal/2008-01/28/content
7509567.htm (Accessed February 19, 2015).
21Table 5.1 in the web appendix presents the full results of the first stage.
22The data is from Wind Info, a leading integrated service provider of financial data based in Shanghai. Please
see http://www.wind.com.cn/En/ (Accessed August 2, 2013).
23Every board member was double-coded by a group of research assistants and me. Table 6.1 in the web
appendix shows two examples of board members’ biographies.
24More information about the interviews is available in Section VII of the web appendix.
25Author’s interview with a lawyer, March 29, 2010; author’s interview with a company deputy president, April
27, 2010.
26Author’s interview with a lawyer, March 29, 2010.
27Author’s interview with a judge in an intermediate court, March 23, 2010.
28Author’s interview with a political legal committee chairman, March 15, 2010.
29Author’s interview with a court president, March 15, 2010.
30The transcripts of these interviews are available upon request.
31Author’s interview with a lawyer, March 29, 2010.
32Author’s interview with a lawyer, March 29, 2010.
33Author’s interview with a judge, April 8, 2010.
34For a review of the pros and cons of decentralization, please see Wibbels (2006) and Treisman (2007).
35For programs supporting centralization reforms, please see https://www.bhba.org/index.php/
component/content/article/251 (Accessed February 23, 2015). For programs supporting de-
centralization, please see http://www1.worldbank.org/publicsector/decentralization/
operations.htm (Accessed January 19, 2016), http://goo.gl/d9oD2z (Accessed January 19,
2016), and http://eu-un.europa.eu/articles/en/article 3160 en.htm (Accessed January
19, 2016).
24

ReferencesAng, Y. Y., & Jia, N. (2014). Perverse complementarity: Political connections and the use of
courts among private firms in China. The Journal of Politics, 76(2), 318–332.
Bardhan, P., & Mookherjee, D. (2000). Capture and governance at local and national levels.American Economic Review, 90(2), 135–139.
Baum, R. (1996). Burying Mao: Chinese politics in the age of Deng Xiaoping. Princeton, NJ:Princeton University Press.
Blanchard, O., & Shleifer, A. (2001). Federalism with and without political centralization:China versus Russia. IMF Staff Papers, 48, 171–179.
Brownlee, J. (2007). Authoritarianism in an age of democratization. New York, NY: Cam-bridge University Press.
Cai, H., & Treisman, D. (2004). State corroding federalism. Journal of Public Economics,88(3), 819–843.
Campos, J. E., & Hellman, J. S. (2005). Governance gone local: Does decentralization improveaccountability? In White, Roland and Smoke, Paul (Ed.), East Asia decentralizes: Makinglocal government work (pp. 237–52). Washington, DC: World Bank Publications.
Dasgupta, S., Laplante, B., Mamingi, N., & Wang, H. (2001). Inspections, pollution prices, andenvironmental performance: Evidence from China. Ecological Economics, 36(3), 487–498.
Eaton, S., & Kostka, G. (in press). Central protectionism in China: The ‘central SOE problem’in environmental governance. China Quarterly.
Faguet, J.-P. (2014). Decentralization and governance. World Development, 53, 2–13.
Ferejohn, J., Rosenbluth, F., & Shipan, C. (2009). Comparative judicial politics. In Boix,Carles and Stokes, Susan C. (Ed.), The oxford handbook of comparative politics (pp. 727–751). New York, NY: Oxford University Press.
Fisman, R., & Gatti, R. (2002). Decentralization and corruption: Evidence across countries.Journal of Public Economics, 83(3), 325–345.
Fudenberg, D., & Tirole, J. (1991). Game theory. Cambridge, MA: MIT Press.
Gallagher, M. (2006). Mobilizing the law in China: “Informed disenchantment” and thedevelopment of legal consciousness. Law and Society Review, 40(4), 783–816.
Gallagher, M. E. (2017). Authoritarian legality: Workers, and the state in contemporary China.New York, NY: Cambridge University Press.
Gandhi, J., & Przeworski, A. (2007). Dictatorial institutions and the survival of autocrats.Comparative Political Studies, 40(11), 1279–1301.
Gennaioli, N., & Rainer, I. (2007). The modern impact of precolonial centralization in Africa.Journal of Economic Growth, 12(3), 185–234.
25
Ginsburg, T., & Moustafa, T. (2008). Rule by law: The politics of courts in authoritarianregimes. New York, NY: Cambridge University Press.
Grossman, G., & Baldassarri, D. (2012). The impact of elections on cooperation: Evidencefrom a lab-in-the-field experiment in Uganda. American Journal of Political Science, 56(4),964–985.
Haggard, S. (1990). Pathways from the periphery: The politics of growth in the newly indus-trializing countries. Ithaca, NY: Cornell University Press.
Hamilton, A., Madison, J., & Jay, J. (1961). The federalist papers. New York, NY: NewAmerican Library.
Hellman, J. S., Jones, G., & Kaufmann, D. (2003). Seize the state, seize the day: State captureand influence in transition economies. Journal of Comparative Economics, 31(4), 751–773.
Helmke, G. (2002). The Logic of Strategic Defection: Judicial Decision-Making in ArgentinaUnder Dictatorship and Democracy. American Political Science Review, 96(2), 291–303.
Hou, Y. (2015). Participatory autocracy: Private entrepreneurs, legislatures, and propertyprotection in China (Unpublished doctoral dissertation). Massachusetts Institute of Technol-ogy.
Kastellec, J. P. (2011). Hierarchical and collegial politics on the US courts of appeals. Journalof Politics, 73(2), 345–361.
Kessler, D., Meites, T., & Miller, G. (1996). Explaining deviations from the fifty-percent rule:A multimodal approach to the selection of cases for litigation. Journal of Legal Studies, 25,233–259.
Landry, P. (2008a). Decentralized authoritarianism in China. New York, NY: CambridgeUniversity Press.
Landry, P. (2008b). The institutional diffusion of courts in China: Evidence from survey data.In T. Ginsburg & T. Moustafa (Eds.), Rule by law: The politics of courts in authoritarianregimes (pp. 207–234). New York, NY: Cambridge University Press.
Lieberman, I. W. (1993). Privatization: The theme of the 1990s. The Columbia Journal ofWorld Business, 28(1), 8–17.
Lieberthal, K. G. (1992). Introduction: The ‘fragmented authoritarianism’ model and itslimitations. In K. G. Lieberthal & D. M. Lampton (Eds.), Bureaucracy, politics and decisionmaking in post-Mao China (pp. 1–22). Berkeley, CA: University of California Press.
Lorentzen, P., Landry, P., & Yasuda, J. (2014). Undermining authoritarian innovation: Thepower of China’s industrial giants. The Journal of Politics, 76(1), 182–194.
Lu, H., Pan, H., & Zhang, C. (2015). Political connectedness and judicial outcomes: Evidencefrom Chinese corporate lawsuits. Journal of Law and Economics, 58(4), 829–861.
Lu, X., & Landry, P. F. (2014). Show me the money: Interjurisdiction political competitionand fiscal extraction in China. American Political Science Review, 108(3), 706–722.
26
Magaloni, B. (2006). Voting for autocracy: Hegemonic party survival and its demise in Mexico.New York, NY: Cambridge University Press.
Malesky, E. J., Nguyen, C. V., & Tran, A. (2014). The impact of recentralization on publicservices: A difference-in-differences analysis of the abolition of elected councils in Vietnam.American Political Science Review, 108(1), 144–168.
Malesky, E. J., & Taussig, M. (2009). Where is credit due? legal institutions, connections, andthe efficiency of bank lending in Vietnam. Journal of Law, Economics, and Organization,25(2), 535–578.
Manor, J. (1999). The political economy of democratic decentralization. Washington, DC: TheInternational Bank for Reconstruction and Development/The World Bank.
Mattingly, D. C. (2016). Elite capture: How decentralization and informal institutions weakenproperty rights in China. World Politics, 68(3), 383–412.
Mertha, A. (2005). The politics of piracy: Intellectual property in contemporary China. Ithaca,NY: Cornell University Press.
Mertha, A. (2009). “Fragmented authoritarianism 2.0”: Political pluralization in the Chinesepolicy process. China Quarterly, 200, 995–1012.
Moustafa, T. (2007). The struggle for constitutional power: Law, politics, and economicdevelopment in Egypt. New York, NY: Cambridge University Press.
O’Brien, K., & Li, L. (2004). Suing the local state: Administrative litigation in rural China.The China Journal, 51, 75–96.
Peerenboom, R. (2002). China’s long march to the rule of law. New York, NY: CambridgeUniversity Press.
Qian, Y., & Xu, C. (1993). The M-form hierarchy and China’s economic reform. EuropeanEconomic Review, 37(2-3), 541–548.
Reinikka, R., & Svensson, J. (2004). Local capture: Evidence from a central governmenttransfer program in Uganda. The Quarterly Journal of Economics, 679–705.
Rodden, J. (2006). Hamilton’s paradox: The promise and peril of fiscal federalism. New York,NY: Cambridge University Press.
Shih, V., Adolph, C., & Liu, M. (2012). Getting ahead in the communist party: Explaining theadvancement of central committee members in China. American Political Science Review,106(1), 166–187.
Sonin, K. (2010). Provincial protectionism. Journal of Comparative Economics, 38(2), 111–122.
Staiger, D., & Stock, J. H. (1997). Instrumental variables regression with weak instruments.Econometrica, 65(3), 557–586.
Svolik, M. W. (2012). The politics of authoritarian rule. New York, NY: Cambridge UniversityPress.
27

Tanner, M. S., & Green, E. (2007). Principals and secret agents: Central versus local controlover policing and obstacles to “rule of law” in China. China Quarterly, 191, 644–670.
Treisman, D. (2000). The causes of corruption: A cross-national study. Journal of PublicEconomics, 76(3), 399–457.
Treisman, D. (2007). The architecture of government: Rethinking political decentralization.New York, NY: Cambridge University Press.
Truex, R. (2014). The returns to office in a “rubber stamp” parliament. American PoliticalScience Review, 108(2), 235–251.
van der Kamp, D., Lorentzen, P., & Mattingly, D. (2016). Racing to the bottom or to the top?Decentralization and governance reform in China. Association for Asian Studies AnnualMeeting Paper.
Wang, Y. (2015). Tying the autocrat’s hands: The rise of the rule of law in China. New York,NY: Cambridge University Press.
Wang, Y. (2016). Beyond local protectionism: China’s state–business relations in the last twodecades. China Quarterly, 226, 319–341.
Wibbels, E. (2006). Madison in baghdad?: Decentralization and federalism in comparativepolitics. Annual Review of Political Science, 9, 165–188.
Wong, C., & Bird, R. (2008). China’s fiscal system: A work in progress. In Brandt, Lorenand Rawski, Thomas G. (Ed.), China’s great economic transformation (pp. 429–466). NewYork, NY: Cambridge University Press.
Wright, J. (2008). Do authoritarian institutions constrain? How legislatures affect economicgrowth and investment. American Journal of Political Science, 52(2), 322–343.
28
Center!
Province!
Prefecture!
County!
Supreme People’s Court (1)!
High People’s Court (32)!
Intermediate People’s Court (404)!
Basic People’s Court (3,111)!
Figure 1: Hierarchy of China’s Judiciary
Notes: This figure presents the structure of the Chinese judiciary. The numbers in parentheses represent thenumber of courts at each level.
29
Inte
rmed
iate
Cou
rt C
utof
f
Hig
h C
ourt
Cut
off
Inte
rmed
iate
Cou
rt C
utof
f
Cel
l 3
Cel
l 1
Cel
l 5
Cel
l 4
Cel
l 2
Cel
l 6
0650100
150
1997
2000
2005
2008
2010
2013
Year
Case Claim (Million Yuan)
Cou
rt L
evel
Basic
Intermediate
High
Figu
re2:
Cou
rts’
Juri
sdic
tiona
lCha
nges
inG
uang
zhou
City
inG
uang
dong
Prov
ince
Not
es:
Thi
sfig
ure
pres
ents
the
two
“reg
imes
”be
fore
and
afte
rth
e20
08ju
risd
ictio
nalc
hang
e.T
heda
taan
dsp
ecifi
ccu
toff
sar
eba
sed
onG
uang
zhou
City
inG
uang
dong
Prov
ince
.T
hecu
toff
poin
tsva
ryac
ross
pref
ectu
res.
Cir
cles
repr
esen
tcas
esth
atw
ere
adju
dica
ted
byba
sic
cour
ts,t
rian
gles
repr
esen
tcas
esad
judi
cate
dby
inte
rmed
iate
cour
ts,a
ndcu
bes
repr
esen
tcas
esad
judi
cate
dby
the
high
cour
t.
30
Trea
tmen
t Gro
up
Con
trol G
roup
Par
alle
l Tre
nd o
f Con
trol G
roup
20304050607080
Pre-2008
Post-2008
Win Rate (%)SOEs
DID = -12.08%***
(a)
SOE
s’W
inR
ates
Bef
ore
and
Aft
er20
08
Trea
tmen
t Gro
up
Con
trol G
roup
Par
alle
l Tre
nd o
f Con
trol G
roup
20304050607080
Pre-2008
Post-2008
Win Rate (%)
Non-SOEs
DID = 23.32%***
(b)
Non
-SO
Es’
Win
Rat
esB
efor
ean
dA
fter
2008
Figu
re3:
The
2008
Polic
yC
hang
ean
dW
inR
ates
ofSO
Es
and
Non
-SO
Es
With
Rea
lDat
a
Not
es:
The
grap
hspr
esen
tthe
win
rate
sof
SOE
s(P
anel
(a))
and
non-
SOE
s(P
anel
(b))
befo
rean
daf
ter2
008.
The
dash
edlin
esre
pres
entc
ases
inth
etr
eatm
entg
roup
,the
solid
lines
repr
esen
tcas
esin
the
cont
rolg
roup
,and
the
dotte
dlin
esre
pres
entt
hepa
ralle
ltre
ndof
the
cont
rolg
roup
.T
heD
IDes
timat
eis
ther
efor
eth
ega
pbe
twee
nth
eda
shed
and
dotte
dlin
es.
31
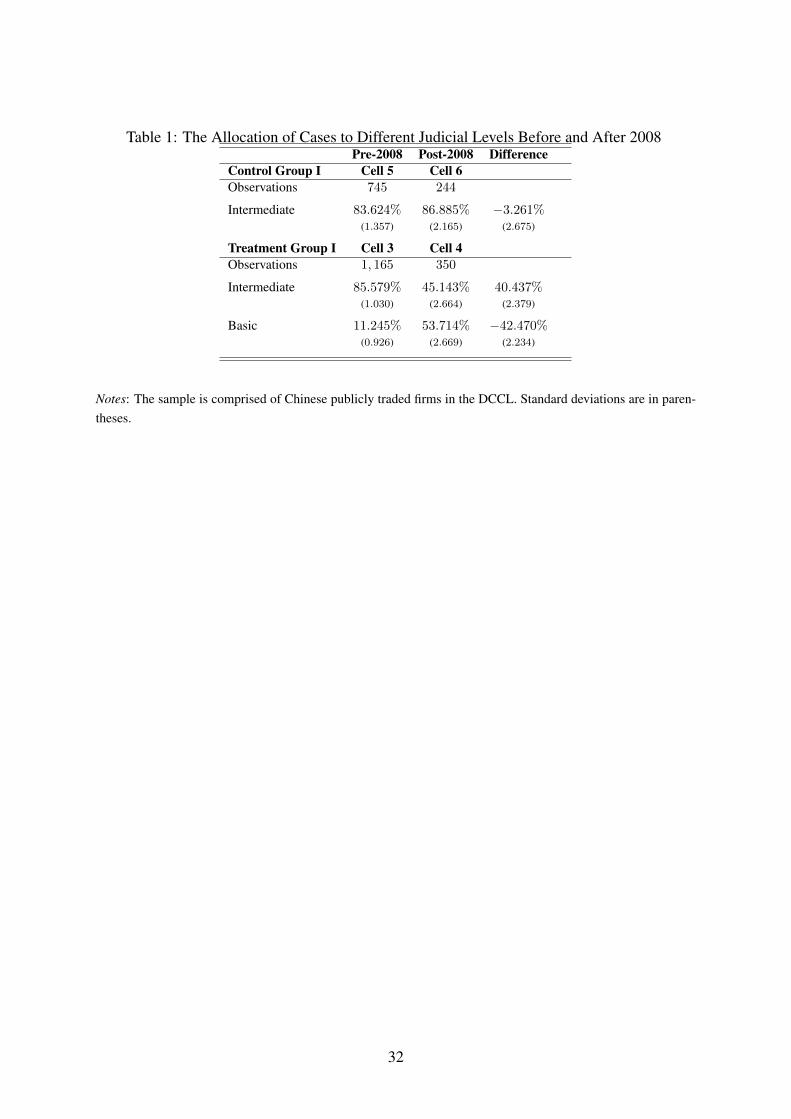
Table 1: The Allocation of Cases to Different Judicial Levels Before and After 2008Pre-2008 Post-2008 Difference
Control Group I Cell 5 Cell 6Observations 745 244
Intermediate 83.624% 86.885% −3.261%(1.357) (2.165) (2.675)
Treatment Group I Cell 3 Cell 4Observations 1, 165 350
Intermediate 85.579% 45.143% 40.437%(1.030) (2.664) (2.379)
Basic 11.245% 53.714% −42.470%(0.926) (2.669) (2.234)
Notes: The sample is comprised of Chinese publicly traded firms in the DCCL. Standard deviations are in paren-theses.
32

Table 2: Effect of Exposure to Basic Courts on Win Rate: DID EstimatesSOEs Non-SOEs
(1) (2) (3) (4) (5) (6)Coeff. Coeff. Coeff. Coeff. Coeff. Coeff.
(C.S.E.) (C.S.E.) (C.S.E.) (C.S.E.) (C.S.E.) (C.S.E.)Post2008 0.146∗∗ 0.121∗ 0.019 0.037 0.026 0.049
(0.063) (0.063) (0.073) (0.077) (0.090) (0.090)Treatment Group I 0.076 0.066 0.069∗ -0.071 -0.093 -0.108∗∗
(0.054) (0.041) (0.041) (0.092) (0.059) (0.054)Post2008×Treatment Group I -0.121∗ -0.152∗∗ -0.132∗ 0.237∗∗ 0.172∗ 0.171∗
(0.071) (0.065) (0.069) (0.098) (0.096) (0.097)Assets (log) - - 0.063∗∗∗ - - -0.008
(0.020) (0.018)Age - - 0.011∗∗∗ - - -0.003
(0.004) (0.009)Contract Dispute - - 0.092∗∗ - - 0.095∗∗
(0.039) (0.039)Road - - 0.013 - - -0.122∗
(0.065) (0.072)Third - - 0.052 - - -0.017
(0.056) (0.113)Derby - - 0.030 - - -0.040
(0.066) (0.078)Province F.E. X
√ √X
√ √
Industry F.E. X√ √
X√ √
Intercept√ √ √ √ √ √
N 1,865 1,535 1,493 593 593 572Number of Clusters 165 152 151 93 93 91R2 0.008 0.069 0.105 0.047 0.182 0.203
Notes: This table presents the OLS estimates of Equation (1). The dependent variable is Win – a binary variableindicating whether the announcing firm won the case. Post2008 is an indicator for cases accepted after 2008.Treatment Group I is an indicator for cases that fell into Cells 3 and 4 in Figure 2. Assets (log) indicates a firm’snatural log-transformed total assets. Age is the firm’s age. Contract Dispute indicates contract disputes. Roadis an indicator that equals 1 if the opponent and the court share the same location, and the announcing firm isregistered in a different location. Third is an indicator that equals 1 if none of the firms share the same locationwith the court, so the court is a third party. Derby is an indicator that equals 1 if both firms share the same locationwith the court. Standard errors clustered at the prefectural level are presented in parentheses. p-values are basedon a two-tailed test: ∗p < 10%,∗ ∗ p < 5%, ∗ ∗ ∗p < 1%.
33
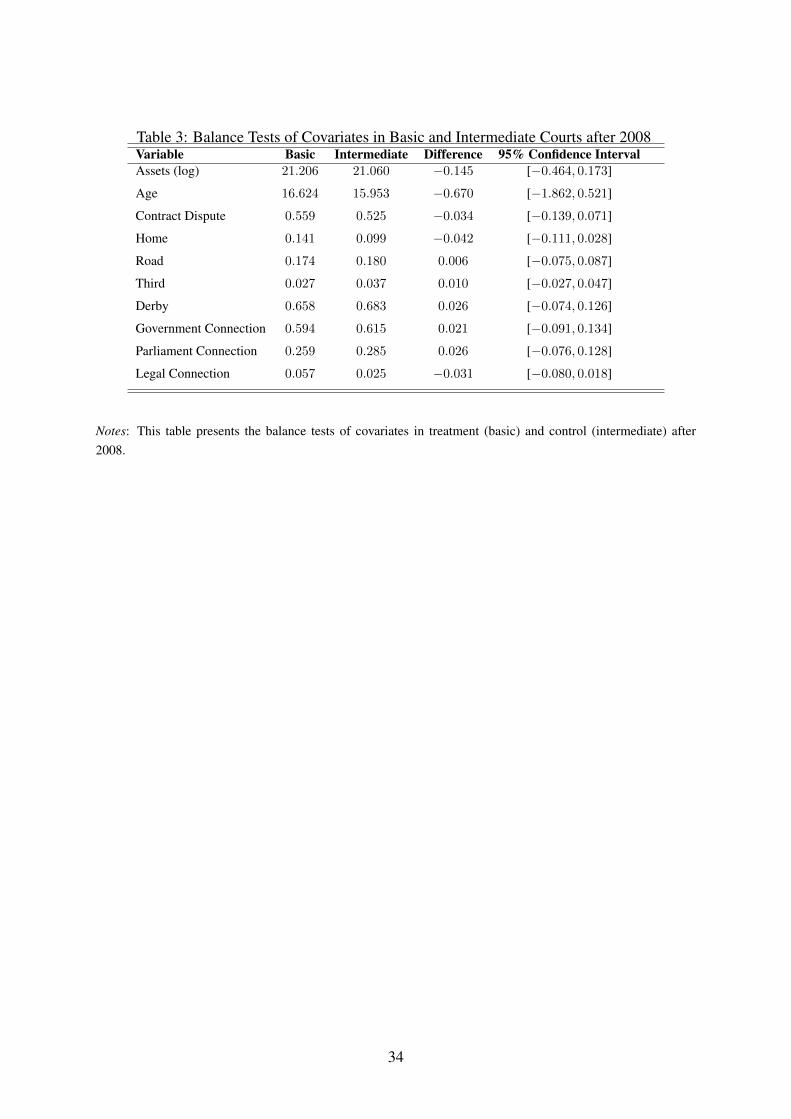
Table 3: Balance Tests of Covariates in Basic and Intermediate Courts after 2008Variable Basic Intermediate Difference 95% Confidence IntervalAssets (log) 21.206 21.060 −0.145 [−0.464, 0.173]
Age 16.624 15.953 −0.670 [−1.862, 0.521]
Contract Dispute 0.559 0.525 −0.034 [−0.139, 0.071]
Home 0.141 0.099 −0.042 [−0.111, 0.028]
Road 0.174 0.180 0.006 [−0.075, 0.087]
Third 0.027 0.037 0.010 [−0.027, 0.047]
Derby 0.658 0.683 0.026 [−0.074, 0.126]
Government Connection 0.594 0.615 0.021 [−0.091, 0.134]
Parliament Connection 0.259 0.285 0.026 [−0.076, 0.128]
Legal Connection 0.057 0.025 −0.031 [−0.080, 0.018]
Notes: This table presents the balance tests of covariates in treatment (basic) and control (intermediate) after2008.
34
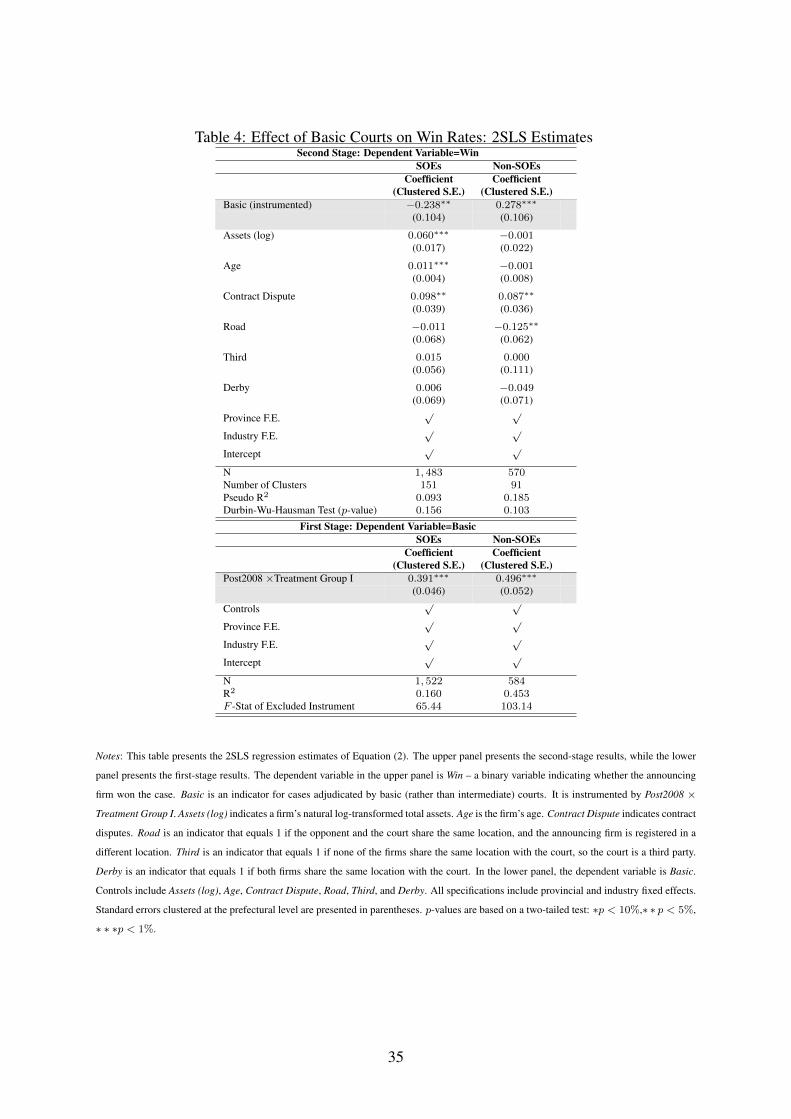
Table 4: Effect of Basic Courts on Win Rates: 2SLS EstimatesSecond Stage: Dependent Variable=Win
SOEs Non-SOEsCoefficient Coefficient
(Clustered S.E.) (Clustered S.E.)Basic (instrumented) −0.238∗∗ 0.278∗∗∗
(0.104) (0.106)
Assets (log) 0.060∗∗∗ −0.001(0.017) (0.022)
Age 0.011∗∗∗ −0.001(0.004) (0.008)
Contract Dispute 0.098∗∗ 0.087∗∗
(0.039) (0.036)
Road −0.011 −0.125∗∗(0.068) (0.062)
Third 0.015 0.000(0.056) (0.111)
Derby 0.006 −0.049(0.069) (0.071)
Province F.E.√ √
Industry F.E.√ √
Intercept√ √
N 1, 483 570Number of Clusters 151 91Pseudo R2 0.093 0.185Durbin-Wu-Hausman Test (p-value) 0.156 0.103
First Stage: Dependent Variable=BasicSOEs Non-SOEs
Coefficient Coefficient(Clustered S.E.) (Clustered S.E.)
Post2008 ×Treatment Group I 0.391∗∗∗ 0.496∗∗∗
(0.046) (0.052)
Controls√ √
Province F.E.√ √
Industry F.E.√ √
Intercept√ √
N 1, 522 584R2 0.160 0.453F -Stat of Excluded Instrument 65.44 103.14
Notes: This table presents the 2SLS regression estimates of Equation (2). The upper panel presents the second-stage results, while the lower
panel presents the first-stage results. The dependent variable in the upper panel is Win – a binary variable indicating whether the announcing
firm won the case. Basic is an indicator for cases adjudicated by basic (rather than intermediate) courts. It is instrumented by Post2008 ×
Treatment Group I. Assets (log) indicates a firm’s natural log-transformed total assets. Age is the firm’s age. Contract Dispute indicates contract
disputes. Road is an indicator that equals 1 if the opponent and the court share the same location, and the announcing firm is registered in a
different location. Third is an indicator that equals 1 if none of the firms share the same location with the court, so the court is a third party.
Derby is an indicator that equals 1 if both firms share the same location with the court. In the lower panel, the dependent variable is Basic.
Controls include Assets (log), Age, Contract Dispute, Road, Third, and Derby. All specifications include provincial and industry fixed effects.
Standard errors clustered at the prefectural level are presented in parentheses. p-values are based on a two-tailed test: ∗p < 10%,∗ ∗ p < 5%,
∗ ∗ ∗p < 1%.
35
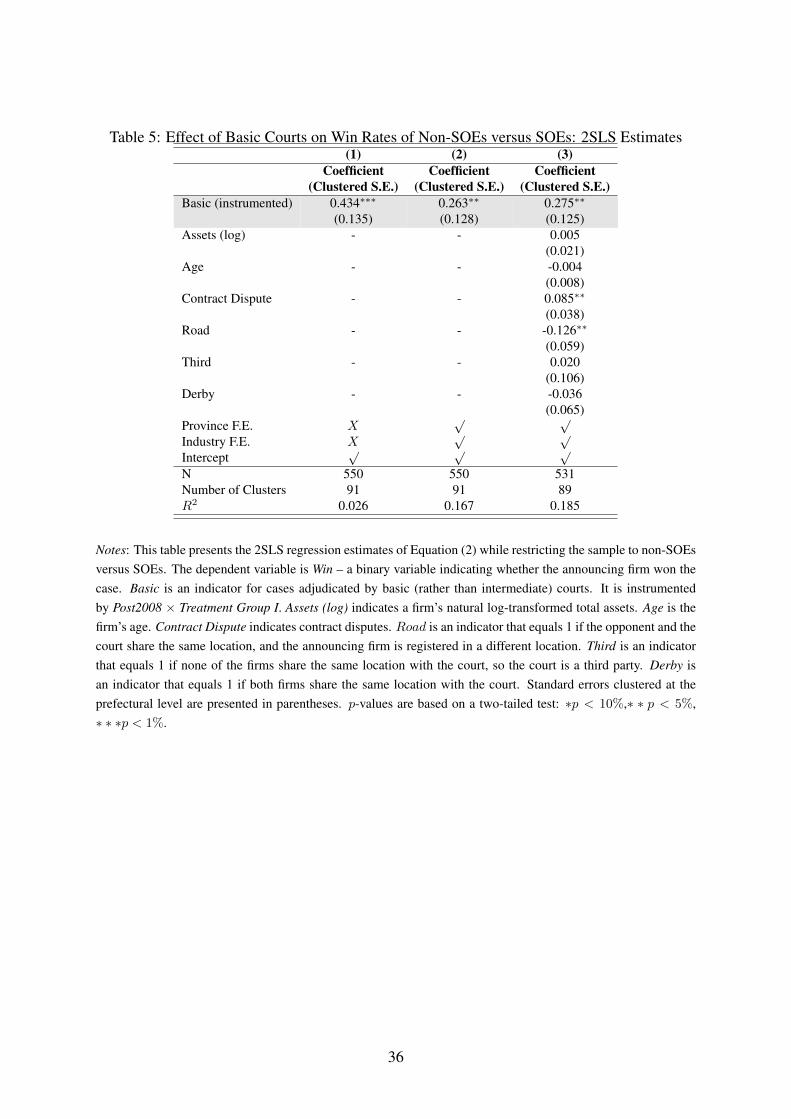
Table 5: Effect of Basic Courts on Win Rates of Non-SOEs versus SOEs: 2SLS Estimates(1) (2) (3)
Coefficient Coefficient Coefficient(Clustered S.E.) (Clustered S.E.) (Clustered S.E.)
Basic (instrumented) 0.434∗∗∗ 0.263∗∗ 0.275∗∗
(0.135) (0.128) (0.125)Assets (log) - - 0.005
(0.021)Age - - -0.004
(0.008)Contract Dispute - - 0.085∗∗
(0.038)Road - - -0.126∗∗
(0.059)Third - - 0.020
(0.106)Derby - - -0.036
(0.065)Province F.E. X
√ √
Industry F.E. X√ √
Intercept√ √ √
N 550 550 531Number of Clusters 91 91 89R2 0.026 0.167 0.185
Notes: This table presents the 2SLS regression estimates of Equation (2) while restricting the sample to non-SOEsversus SOEs. The dependent variable is Win – a binary variable indicating whether the announcing firm won thecase. Basic is an indicator for cases adjudicated by basic (rather than intermediate) courts. It is instrumentedby Post2008 × Treatment Group I. Assets (log) indicates a firm’s natural log-transformed total assets. Age is thefirm’s age. Contract Dispute indicates contract disputes. Road is an indicator that equals 1 if the opponent and thecourt share the same location, and the announcing firm is registered in a different location. Third is an indicatorthat equals 1 if none of the firms share the same location with the court, so the court is a third party. Derby isan indicator that equals 1 if both firms share the same location with the court. Standard errors clustered at theprefectural level are presented in parentheses. p-values are based on a two-tailed test: ∗p < 10%,∗ ∗ p < 5%,∗ ∗ ∗p < 1%.
36