relationships between agriculture, riparian vegetation ... · of eutrophication. water samples from...
TRANSCRIPT
ArticleRev Bras Cienc Solo 2017;41:e0160286
1https://doi.org/10.1590/18069657rbcs20160286
* Corresponding author: [email protected]
Received: June 14, 2016Approved: October 26, 2016
How to cite: Broetto T, Tornquist CG, Campos BC, Schneider JC. Relationships between agriculture, riparian vegetation, and surface water quality in watersheds. Rev Bras Cienc Solo. 2017;41:e0160248. https://doi.org/10.1590/18069657rbcs20160286
Copyright: This is an open-access article distributed under the terms of the Creative Commons Attribution License, which permits unrestricted use, distribution, and reproduction in any medium, provided that the original author and source are credited.
Relationships between Agriculture, Riparian Vegetation, and Surface Water Quality in WatershedsTiago Broetto(1), Carlos Gustavo Tornquist(2)*, Ben-Hur Costa de Campos(3) and Júlio Cézar Schneider(4)
(1) Universidade Federal de Santa Maria, Departamento de Ciência do Solo, Programa de Pós-graduação em Ciência do Solo, Santa Maria, Rio Grande do Sul, Brasil.
(2) Universidade Federal do Rio Grande do Sul, Departamento de Agronomia, Porto Alegre, Rio Grande do Sul, Brasil.
(3) Instituto Federal de Educação, Ciência e Tecnologia do Rio Grande do Sul, Campus Ibirubá, Ibirubá, Rio Grande do Sul, Brasil.
(4) Universidade Federal do Rio Grande do Sul, Curso de Agronomia, Porto Alegre, Rio Grande do Sul, Brasil.
ABSTRACT: Agricultural land use and degradation of natural vegetation in riparian zones can impair water quality. This study was conducted in seven agricultural watersheds in Ibirubá, RS, Brazil, with the following objectives: identify relationships between concentrations of soluble phosphorus (Psol) and nitrate (NO−
3) in surface water and agricultural use of soil and current vegetation in riparian zones, and assess the risk of eutrophication. Water samples from the main watercourses in each watershed were collected monthly from 10/2013 to 6/2014. Current land use was established by field surveys in the watersheds. The riparian zones of the watercourses were evaluated in terms of the condition of permanent preservation area (PPA) and access of the animals to the watercourses. The concentration of Psol and NO−
3 were correlated with land use indicators obtained from geoprocessing tools. Agricultural use of PPA increases the risk of surface water degradation, which increases through application of manure on crops and free access of livestock to PPAs and to these watercourses for drinking water. Surface water samples obtained showed water Psol concentrations that generate risk of eutrophication, whereas concentrations of NO−
3 were generally below critical levels.
Keywords: environmental pollution, dairy cattle, manure, riparian zone.
Division – Soil Use and Management | Commission – Soil and Water Management and Conservation

Broetto et al. Relationships between agriculture, riparian vegetation, and surface...
2Rev Bras Cienc Solo 2017;41:e0160286
INTRODUCTIONHuman population growth and the increased demand for food has led to expansion and intensification of agricultural production in Brazil, one of the few countries with large non-agricultural areas that could be converted to cropland (Conab, 2015; IBGE, 2015). In several cases, this context has encouraged farmers to expand into environmentally fragile areas, often with disregard for conservation of natural resources.
The dominant agricultural activities in southern Brazil are row crop agriculture, dairy production, and poultry and swine farming, all of which can directly or indirectly impact ecosystems through degradation of soil and water quality, generation of odors from waste, and greenhouse gas emissions. Grain production is mainly conducted under the no-tillage system (NT), which in its original definition precludes tillage operations. Soil surface leveling and forage/cover crop seed incorporation with disk harrows are sometimes conducted on small and medium farms. In addition, farmers that adopted no-tillage have removed terraces to facilitate farm equipment operations, ignoring that these auxiliary conservation practices are still required to avoid soil, water, and nutrient losses (Denardin et al., 1999; Gilles et al., 2009).
Dairy cattle can also degrade soil and water, where high stocking rates in pastures, especially when wet, can lead to soil compaction (Albuquerque et al., 2001). Compacted soils have decreased water infiltration rates and increased runoff that carries sediment, organic matter, and nutrients that can cause siltation and contaminate water bodies (Pietola et al., 2005).
Pig slurry (PS) spread on farmland (e.g., cropland and pastures) is a potential environmental impact from swine production. Repeated application of large volumes of PS may lead to accumulation of C, N, and P in soils (Angers et al., 2010; Lourenzi et al., 2013), posing an increased risk of contaminated runoff reaching watercourses or the water table (Anami et al., 2008). A potential consequence of contaminated surface waters is eutrophication, caused by high concentrations of P and N, which compromises drinking water sources required by both humans and livestock (Sharpley et al., 1995; 2003).
Phosphorus transfer by runoff from farmland occurs either in particulate form, associated with sediment or organic matter, or as soluble P (Psol), dissolved in runoff water (Sharpley et al., 2003). Soluble P can compose up to 80 % of soil P transfers to surface waters in no-till cropland, pastures, or forestry operations (Sharpley et al., 2003). A Psol concentration of 0.01 mg L-1 can be considered the threshold for surface water eutrophication (Jarvie et al., 2006; Gebler et al., 2012, 2014). For its part, N can be transferred from farmland by surface runoff or by leaching. NO−
3-N, the main form of inorganic N in aerated soils, can rapidly reach surface water near agricultural areas. Nitrate concentrations above 10 mg L-1 have been considered a health hazard (Brasil, 2011).
Degradation of waters resources by agricultural activities can be mitigated by the maintenance of natural vegetation in riparian zones, which fulfill the role of a buffer zone for sediments and contaminants transported by surface runoff (Lovell and Sullivan, 2006; Aguiar Jr et al., 2015). Lovell and Sullivan (2006) reported that 95 % of the sediments and nutrients carried by runoff can be retained by riparian areas downslope from cropland.
There are few studies assessing the mitigation potential of these buffer zones in the context of Brazilian agriculture. In a recent study, Ribeiro et al. (2014) observed decreased water quality in an agricultural watershed in Paraná where riparian zones were mostly under cultivation, with reduced cover of lowland woods that would constitute buffer strips in this context. In fact, the Brazilian Forestry Code (BFC) sets aside parts of riparian zones as permanent preservation areas (PPA) to protect the soil and water resources therein (Brasil, 2012). For example, a PPA extending 30 m from the stream banks with <10 m width should be preserved when land cover in this riparian zone is not degraded. In a recent revision of the BFC (Brasil, 2012), PPA that were degraded prior to 2008 (called consolidated areas) must undergo partial restoration with riparian vegetation, in this case at least 5 m from stream banks.

Broetto et al. Relationships between agriculture, riparian vegetation, and surface...
3Rev Bras Cienc Solo 2017;41:e0160286
Although the benefits of buffer zones set between farmland and watercourses are widely recognized and underscored in Brazil by the legal provision of riparian PPA (Brasil, 2012), substantial discrepancies exist between the written norm in the BFC and actual practices in farms throughout the country. Moreover, studies that examine farmer compliance with environmental legislation, and the accompanying impact assessments, are incipient. These studies would be crucial to assure gains in environmental quality expected by the revised BFC (Brasil, 2012).
Our study was based on the premise that grain crops and swine and dairy cattle production could potentially have a negative impact on surface water quality because of nutrient and sediment transfer to watercourses, especially when riparian buffers have been degraded. We aimed to establish relationships between key water contaminants (Psol and NO−
3) and land use and land cover in riparian zones in representative watersheds.
MATERIALS AND METHODSThe study was conducted in Quinze de Novembro, Ibirubá, and Fortaleza dos Valos (state of Rio Grande do Sul), hereafter referred to as the Ibirubá region, in accordance with the most important municipality in the area (Figure 1). The climate is subtropical humid, with mean annual temperature of 18 °C and annual rainfall of 1,750 mm. Soils are mostly Latossolos Vermelhos (Oxisols) (>80 % of the study area), whereas Neossolos (Inceptisols) and Chernossolos (Entisols) constitute the remaining area (Tornquist, 2007). The remaining original vegetation consists of patches of Brazilian pine forests (Mixed Ombrophylous Forest) in various degrees of conservation (Tornquist, 2007).
Figure 1. Location of the Ibirubá region in the state of Rio Grande do Sul, Brazil. W1, W2, W3, W4, W5, W6, and W7 are the select watersheds and sampling points.
W3
W2
W6
W1
0 400 800200
km
IBIRUBÁ
FORTALEZA DOS VALOS
Rio Grande do Sul
Watersheds
Passo Real Dam
Ibirubá Region
0 30 6015
km
0 2 84
km
Water sampling
Streams
Water body
Watersheds
Municipal Boundaries
N
NN
W4
W5
W7
QUINZE DENOVEMBRO

Broetto et al. Relationships between agriculture, riparian vegetation, and surface...
4Rev Bras Cienc Solo 2017;41:e0160286
More than 80 % of the Ibirubá region is under agricultural production (grain production, dairy cattle, and swine). Soybean (Glycine max) and corn (Zea mays) crops in the summer, and black oats (Avena strigosa) and wheat (Triticum aestivum) in winter are grown under no-tillage (NT). Swine production results in large quantities of PS, which are applied for their fertilizer value in the agricultural soils of the region at annual rates that often exceed agronomic recommendations (Broetto et al., 2014; 2015). Dairy cattle are managed in a semi-intensive system, with animals raised on pasture and receiving supplementation of protein concentrates.
Initially, a geospatial database was constructed using ArcGIS 10.2 software (ESRI, 2013): municipal boundaries (IBGE, 2010), drainage network (Hasenack and Weber, 2010), and digital elevation model (DEM) from the Shuttle Radar Topography Mission (SRTM), with spatial resolution of 30 m; and a georeferenced and orthorectified mosaic of high spatial resolution orbital imagery (acquired by QuickBird and GeoEye satellites) that was provided with the ArcGIS basic data collection (ESRI, 2013).
Watersheds were delimited in ArcGIS based on the DEM (using the Watershed tool in the Spatial Analyzer module). Features of the BFC, such as PPA, consolidated areas, and degraded areas that require restoration were outlined using ArcGIS with the Analysis toolset (Intersect and Symmetrical Difference functions). Using this geospatial database, seven watersheds deemed representative of the region were chosen, and additional field observations were conducted. The latter were based on protocols proposed by Callisto et al. (2002) and Minatti-Ferreira and Beuamord (2006). The morphometric characteristics of each of these study basins are shown in table 1.
A total of eight monthly water sampling campaigns were conducted in 2013 and 2014 at critical points in watercourses of the selected watersheds (Figure 1). Samples were collected in triplicate in the field and analyzed in duplicate for NO−
3 and Psol, according to widely accepted methods (APHA, 1995). The streamflow in each watershed at the time of sampling was determined by the simplified methods proposed by Carvalho (2008).
The water samples were collected at the chosen sampling points near the stream surface in all sampling campaigns. Water collection was carried out with a polypropylene container with a handle (1 L) and aliquots were obtained according to the type of analysis: Psol samples were stored in 100 mL polyethylene bottles and kept at low temperatures in a Styrofoam box with ice until analyses; NO−
3 samples were stored in 250 mL polyethylene containers that were cooled as above and acidified with 1 mL of concentrated H2SO4.
Statistical analyses were conducted on SAS (v.9.2) and SPSS (v.18). As data exhibited heterogeneity of variances, weighted least squares transformation was used. This method is based on the premise that there is variance among replicates; if this premise is not met, data are discarded and are not used in the Anova. In this study, these situations were duly
Table 1. Morphometric properties of the selected watersheds in Ibirubá region, RS, Brazil
WatershedDrainage
Kc Kf Drainage density Sinuosity Drainage
gradientWatershed
area1st order(1) 2nd order 3rd order Totalkm km-2 % ha
W1 3 1 0 4 1.20 0.45 1.50 1.18 2.22 348W2 12 3 1 16 1.15 0.43 1.40 1.26 1.62 1201W3 19 4 1 24 1.28 0.52 1.38 1.32 1.19 2731W4 2 1 0 3 1.11 0.76 1.48 1.12 4.70 130W5 1 0 0 1 1.10 0.75 1.25 1.07 4.57 68W6 4 1 0 5 1.20 0.57 1.24 1.22 1.62 709W7 2 0 0 2 1.07 0.59 1.02 1.17 2.14 328
(1) Strahler (1957); Kc: capacity coefficient; Kf: form factor. W1, W2, W3, W4, W5, W6, and W7 are the select watersheds and sampling points.

Broetto et al. Relationships between agriculture, riparian vegetation, and surface...
5Rev Bras Cienc Solo 2017;41:e0160286
identified in our presentation of data. Boxplots were used to summarize data (Figure 2). Analysis of variance was performed using repeated measure methods with the General Linear Model procedure in SAS using watersheds, dates, and sampling points as explanatory factors. Differences between means were compared by the Tukey test at the 5 % significance level. Additionally, a correlation analysis (with t test at 5 and 10 % significance) was conducted with Psol and NO−
3, along with agro-environmental attributes in the basins (total area, agricultural area, 5 m and 30 m PPA with remaining vegetation, consolidated areas, fraction (area) of watershed with PS application, population of bovine and swine in the watershed, bovine and pig density in the watershed, area of watershed with dairy cattle, and stream banks with bovine access).
RESULTS AND DISCUSSIONStatistical analysis of Psol and NO−
3 showed a triple interaction (Table 2). There was high variability in Psol and NO−
3 concentrations in the watersheds studied (Figure 2), but some trends could be observed. Nitrate concentrations were highest in W6 watershed, whereas Psol was highest in W1 and W5 watersheds on 50 % of the sampling dates. In other instances, Psol concentrations did not differ from those observed in other watersheds
Figure 2. Boxplot of Psol and NO−3 in surface waters from watersheds in Ibirubá region, RS, Brazil, pooled by watershed (a and d), by
sampling dates (b and e), and by sampling points (c and f). The blue bars indicate interquartile distance between de first and third quartile. The vertical black lines indicate the extreme values. The horizontal black line in blue bars indicate de median value. W1, W2, W3, W4, W5, W6, and W7 are the select watersheds and sampling points.
0.05
0.00
0.10
0.15
0.20
W6 W1 W4 W2 W3 W5 W7
(a)
Psol
0.5
0.0
1.01.52.0
3.0
W6 W1 W4 W2 W3 W5 W7
2.5
NO
(d)
0.50.0
1.01.52.0
3.02.5
(b) (e)
(c)
0.05
0.00
0.10
0.15
0.20
0.25
0.05
0.00
0.10
0.15
0.20
0.25
0.50.0
1.01.52.0
3.02.5
Outlet Midpoint Outlet MidpointSampling points
Sampling datesOct 0
1, 2013
Dec 04, 2013
Jan 04, 2014
Feb 04, 2014
Mar 11, 2014
Apr 11, 2014
May 02, 2014
Jun 04, 2014
Oct 01, 2013
Dec 04, 2013
Jan 04, 2014
Feb 04, 2014
Mar 11, 2014
Apr 11, 2014
May 02, 2014
Jun 04, 2014
Sampling watersheds
0.253
(f)

Broetto et al. Relationships between agriculture, riparian vegetation, and surface...
6Rev Bras Cienc Solo 2017;41:e0160286
(Table 3). Nitrate concentrations ranged from 0.32 to 2.94 mg L-1, always below 10 mg L-1 of NO−
3, the threshold for health risk (Brasil, 2011). The Psol concentrations had a large range, from below the detection limit to 0.199 mg L-1, and 77 % of the samples were above 0.010 mg L-1, which may be considered the threshold for eutrophication (Jarvie et al., 2006).
The correlation analyses between Psol and NO−3 and agro-environmental indicators (Table 4)
suggested that NO−3 in these watersheds was strongly affected by cattle access to
Table 2. Analysis of variance of water quality parameters soluble phosphorus (Psol) and nitrate (NO−3)
Source of variation DF Type III SS MS F p>F DF Type III SS MS F p>FPsol NO−
3
Watershed 6 1473.7 245.6 260.2 <0.0001 6 2170.7 361.8 381.7 <0.0001Sampling point 1 262.7 262.7 278.3 <0.0001 1 8.3 8.3 8.7 0.0036Watershed × sampling point 24 31.6 1.3 1.4 0.12 24 32.6 1.4 1.4 0.0995Sampling date 7 3439.6 491.4 520.6 <0.0001 7 900.9 128.7 135.8 <0.0001Watershed × point × date 14 1483.3 106.0 112.3 <0.0001 27 1129.0 41.8 44.1 <0.0001
DF: degrees of freedom; SS: sum of squares; MS: mean square.
Table 3. Comparison of nitrate (NO−3) and soluble phosphorus (Psol) among surface waters in agricultural watersheds and different
dates, in Ibirubá region, RS, BrazilWatershed Oct 28, 2013 Dec 4, 2013 Jan 4, 2014 Feb 4, 2014 Mar 7, 2014 Apr 11, 2014 May 2, 2014 Jun 4, 2014
NO−3 (mg L-1)
Midpoints
W1 0.88 ± 0.53 A 1.40 ± 0.11 AB 1.59 ± 0.22 A 1.57 ± 0.06 B 0.84 ± 0.04 B 1.43 ± 0.02 AB 1.42 ± 0.06 B 1.58 ± 0.01 B
W2 1.53 ± 0.34 A 1.47 ± 0.11 AB 2.20 ± 0.13 A 1.60 ± 0.04 B 0.93 ± 0.09 B 0.66 ± 0.03 BC 1.49 ± 0.02 B 2.04 ± 0.20 AB
W3 1.46 ± 0.53 A 0.75 ± 0.13 B 0.56 ± 0.04 B 0.49 ± 0.04 C MS 0.37 ± 0.04 C 0.32 ± 0.02 C 0.37 ± 0.04 C
W6 1.00 ± 0.15 A 1.84 ± 0.03 A 2.06 ± 0.05 A 2.85 ± 0.04 A 2.37 ± 0.18 A 2.37 ± 0.05 A 2.86 ± 0.07 A 2.94 ± 0.06 A
W7 1.33 ± 0.80 A 1.59 ± AB 1.44 ± 0.04 AB 1.17 ± 0.06 BC 0.55 ± 0.22 B 0.86 ± 0.13 BC 0.90 ± 0.06 BC 1.49 ± 0.07 B
Outlets
W1 0.77 ± 0.36 BCD 1.48 ± 0.09 AB 1.88 ± 0.06 AB 1.47 ± 0.09 AB 0.78 ± 0.02 A 1.07 ± 0.08 A 1.29 ± 0.11 ABC 2.10 ± 0.04 A
W2 1.78 ± 0.66 AB 1.48 ± 0.05 AB 2.17 ± 0.01 A 1.63 ± 0.01 A 0.99 ± 0.01 A 0.85 ± 0.08 A 1.63 ± 0.05 AB 1.94 ± 0.09 A
W3 0.42 ± 0.34 D 0.98 ± 0.06 B 1.11 ± 0.06 BC 0.94 ± 0.01 AB 0.34 ± 0.05 A 0.66 ± 0.04 A 0.64 ± 0.02 BC 0.91 ± 0.04 B
W4 2.24 ± 0.43 A 1.87 ± 0.03 AB 2.05 ± 0.12 AB 1.79 ± 0.09 A 1.14 ± 0.12 A 1.34 ± 0.08 A 1.57 ± 0.06 AB 2.13 ± 0.04 A
W5 0.70 ± 0.43 CD 1.09 ± 0.12 B 0.39 ± 0.05 C 0.50 ± 0.10 A MS 0.72 ± 0.56 A 0.54 ± 0.08 C 1.82 ± 0.08 AB
W6 1.86 ± 0.26 A 2.35 ± 0.04 A 1.80 ± 0.06 AB 1.89 ± 0.13 A 0.97 ± 0.34 A 1.64 ± 0.05 A 1.87 ± 0.06 A 2.27 ± 0.01 A
W7 1.53 ± 0.30 ABC 1.84 ± 0.10 AB 1.56 ± 0.03 AB 1.68 ± 0.04 A 1.18 ± 0.04 A 1.50 ± 0.17 A 1.85 ± 0.32 A 2.79 ± 0.44 A
Psol (mg L-1)
Midpoints
W1 0.002 ± 0.001 B 0.009 ± 0.002 B MS MS MS 0.015 ± 0.001 B 0.004 ± 0.000 C MS
W2 0.017 ± 0.001AB 0.030 ± 0.007 A 0.009 ± 0.001 B 0.025 ± 0.001 B 0.019 ± 0.001 AB 0.029 ± 0.001 B 0.045 ± 0.007 A 0.025 ± 0.002 A
W3 0.019 ± 0.000 0.032 ± 0.001A 0.010 ± 0.000 B 0.010 ± 0.003 B 0.013 ± 0.000 B 0.031 ± 0.000 B 0.021 ± 0.000 BC 0.004 ± 0.001 A
W6 0.026 ± 0.001 A 0.037 ± 0.001 A 0.032 ± 0.000 A 0.050 ± 0.005 A 0.036 ± 0.000 A 0.095 ± 0.000 A 0.038 ± 0.001 AB 0.013 ± 0.001 A
W7 0.007 ± 0.000AB 0.022 ± 0.000 MS MS 0.006 ± 0.001 B 0.023 ± 0.000 0.011 ± 0.000 MS
Outlets
W1 0.066 ± 0.006 A 0.051 ± 0.011 AB 0.199 ± 0.003 A 0.046 ± 0.018 B 0.015 ± 0.004 BC 0.033 ± 0.002 BC 0.026 ± 0.003 B 0.016 ± 0.001 A
W2 0.024 ± 0.006 B 0.035 ± 0.006 BC 0.013 ± 0.003 B 0.023 ± 0.001 C 0.023 ± 0.001 BC 0.033 ± 0.003 BC 0.054 ± 0.002 A 0.012 ± 0.003 A
W3 0.022 ± 0.005 B 0.028 ± 0.002 C 0.014 ± 0.001 B 0.010 ±0.002 CD 0.015 ± 0.002 BC 0.042 ± 0.001 BC 0.024 ± 0.002 B 0.003 ± 0.000 A
W4 0.013 ± 0.002 B 0.015 ± 0.009 C 0.000 ± 0.000 B 0.001 ± 0.001 D 0.005 ± 0.000 C 0.026 ± 0.005 C 0.010 ± 0.000 B MS
W5 0.016 ± 0.000 B 0.060 ± 0.020 A 0.001 ± 0.001 B 0.003 ± 0.002 CD 0.032 ± 0.003 AB 0.065 ± 0.002 A 0.013 ± 0.004 B 0.021 ± 0.004 A
W6 0.013 ± 0.000 0.020 ± 0.001 C 0.012 ± 0.001 B 0.007 ± 0.001 CD 0.014 ± 0.000 BC 0.053± 0.000 AB 0.023 ± 0.000 B MS
W7 0.013 ± 0.000 0.028 ± 0.008 C 0.005 ± 0.001 B 0.078 ± 0.005 A 0.053 ± 0.003 A 0.035 ± 0.000 BC 0.025 ± 0.001 B MS
Equal letters denote means compared by the Tukey test that were not statistically different at the 5 % of significance; no letter means samples not included in the analysis of variance because of lack of variance. Means highlighted in bold denote concentrations above the eutrophication threshold (0.01 mg L-1). MS: missing sample. W1, W2, W3, W4, W5, W6, and W7 are the selects watersheds and sampling points.
Broetto et al. Relationships between agriculture, riparian vegetation, and surface...
7Rev Bras Cienc Solo 2017;41:e0160286
watercourses. A negative correlation of cattle density per area, effectively occupied by dairy production in watersheds, indicated that intensifying this type of livestock production in confined areas may have positive environmental repercussions. Similar effects of cattle production in pastures on water quality were also observed by Kebede et al. (2014) and Poudel et al. (2013). Waters in W6 had the highest NO−
3 concentrations, probably because most of the riparian zones are unfenced and cattle have free access to the watercourses (Figure 3a). This contrasts with the lowest NO−
3 in waters of W3, which can be attributed to the low cattle density in this watershed.
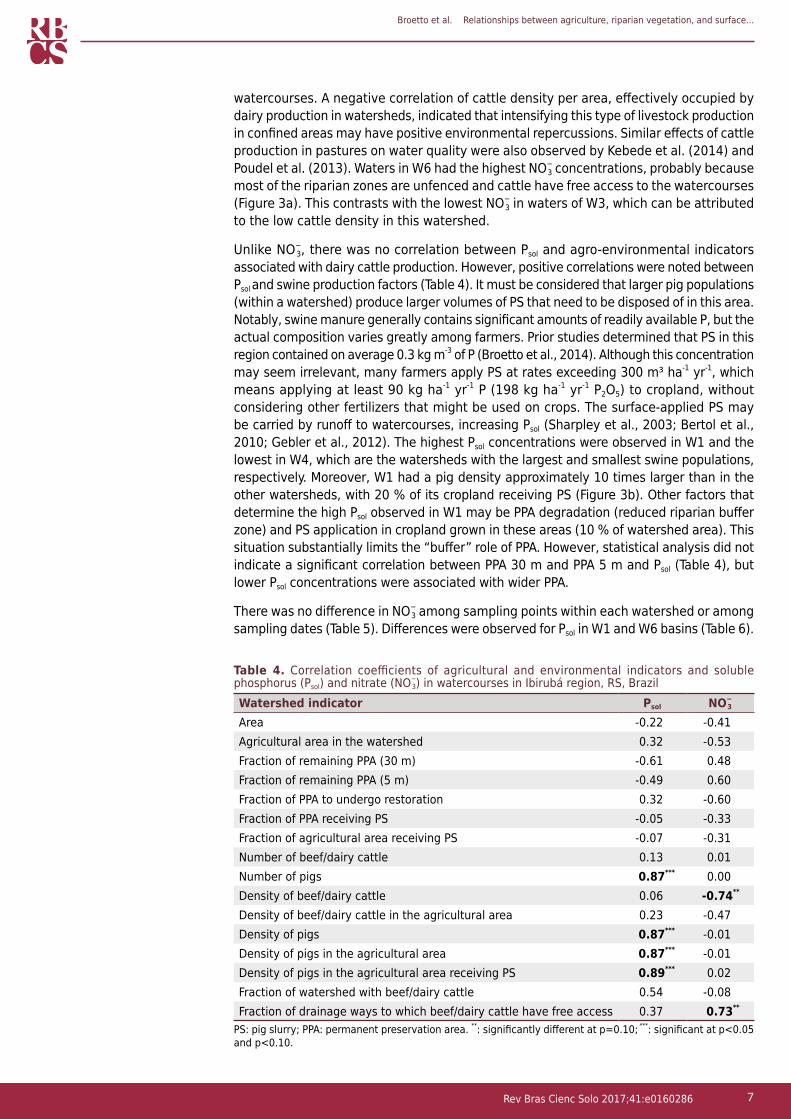
Unlike NO−3, there was no correlation between Psol and agro-environmental indicators
associated with dairy cattle production. However, positive correlations were noted between Psol and swine production factors (Table 4). It must be considered that larger pig populations (within a watershed) produce larger volumes of PS that need to be disposed of in this area. Notably, swine manure generally contains significant amounts of readily available P, but the actual composition varies greatly among farmers. Prior studies determined that PS in this region contained on average 0.3 kg m-3 of P (Broetto et al., 2014). Although this concentration may seem irrelevant, many farmers apply PS at rates exceeding 300 m³ ha-1 yr-1, which means applying at least 90 kg ha-1 yr-1 P (198 kg ha-1 yr-1 P2O5) to cropland, without considering other fertilizers that might be used on crops. The surface-applied PS may be carried by runoff to watercourses, increasing Psol (Sharpley et al., 2003; Bertol et al., 2010; Gebler et al., 2012). The highest Psol concentrations were observed in W1 and the lowest in W4, which are the watersheds with the largest and smallest swine populations, respectively. Moreover, W1 had a pig density approximately 10 times larger than in the other watersheds, with 20 % of its cropland receiving PS (Figure 3b). Other factors that determine the high Psol observed in W1 may be PPA degradation (reduced riparian buffer zone) and PS application in cropland grown in these areas (10 % of watershed area). This situation substantially limits the “buffer” role of PPA. However, statistical analysis did not indicate a significant correlation between PPA 30 m and PPA 5 m and Psol (Table 4), but lower Psol concentrations were associated with wider PPA.
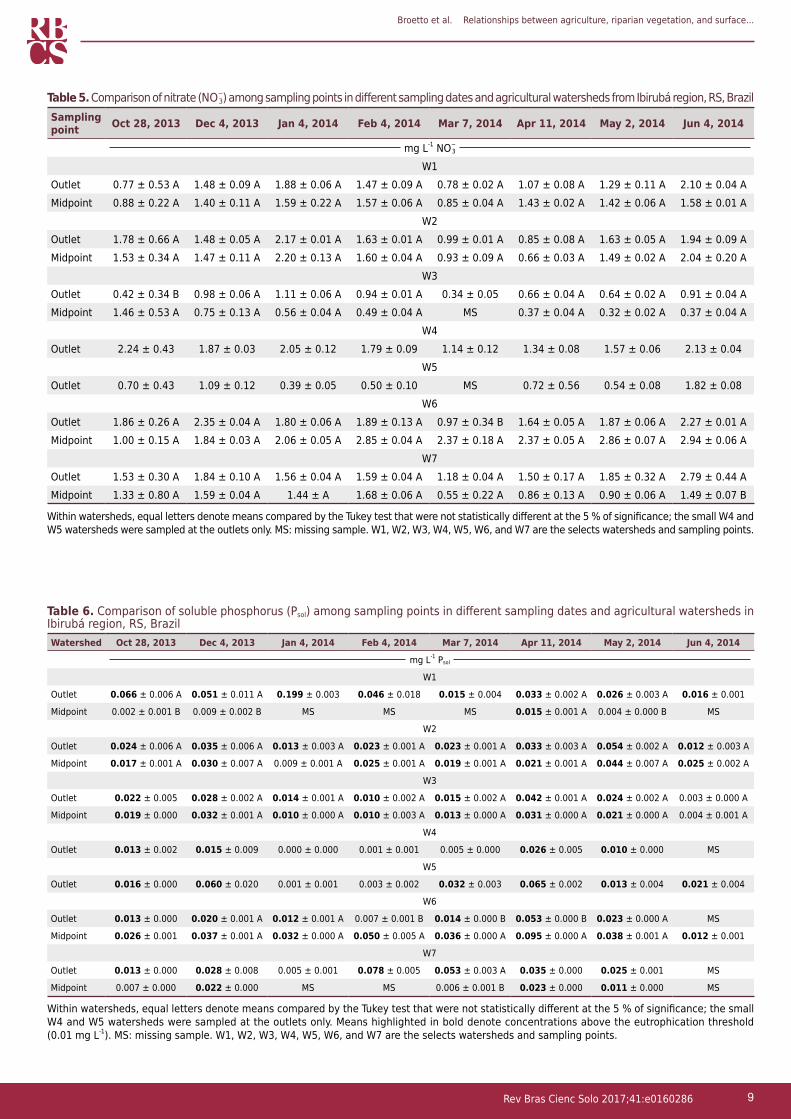
There was no difference in NO−3 among sampling points within each watershed or among
sampling dates (Table 5). Differences were observed for Psol in W1 and W6 basins (Table 6).
Table 4. Correlation coefficients of agricultural and environmental indicators and soluble phosphorus (Psol) and nitrate (NO−
3) in watercourses in Ibirubá region, RS, BrazilWatershed indicator Psol NO−
3
Area -0.22 -0.41Agricultural area in the watershed 0.32 -0.53Fraction of remaining PPA (30 m) -0.61 0.48Fraction of remaining PPA (5 m) -0.49 0.60Fraction of PPA to undergo restoration 0.32 -0.60Fraction of PPA receiving PS -0.05 -0.33Fraction of agricultural area receiving PS -0.07 -0.31Number of beef/dairy cattle 0.13 0.01Number of pigs 0.87*** 0.00Density of beef/dairy cattle 0.06 -0.74**
Density of beef/dairy cattle in the agricultural area 0.23 -0.47Density of pigs 0.87*** -0.01Density of pigs in the agricultural area 0.87*** -0.01Density of pigs in the agricultural area receiving PS 0.89*** 0.02Fraction of watershed with beef/dairy cattle 0.54 -0.08Fraction of drainage ways to which beef/dairy cattle have free access 0.37 0.73**
PS: pig slurry; PPA: permanent preservation area. **: significantly different at p=0.10; ***: significant at p<0.05 and p<0.10.

Broetto et al. Relationships between agriculture, riparian vegetation, and surface...
8Rev Bras Cienc Solo 2017;41:e0160286
In W1, Psol concentrations were lower at the midpoint sampling location than at the outlet on 75 % of the collection dates; in W6, concentrations were higher at the midpoint on 50 % of the sampling dates.
A decrease in water quality parameters assessed in the watershed outlet in comparison to upstream (midpoints in this study), as observed with Psol in W1, can be expected. Water flowing towards the outlet could potentially be affected by increasing amounts of nutrients and contaminants in runoff waters from adjacent areas (Tsegaye et al., 2006). Similar trends were found in three watersheds in Ethiopia by Kebede et al. (2014).
In W1, significant differences in Psol were found between the two sampling points, which could possibly be ascribed to the location of the midpoint, in this case much closer to the source of the watercourse, with decreased impact from agricultural production. Upstream from this point, there was no cropland with PS application, whereas downstream, near the outlet, most of the swine production and a large area of degraded PPA were concentrated, some of which allowed cattle access to the watercourses (Figure 3).
The W6 watershed contradicted the general trends observed because the sampling point upstream from the outlet had higher concentration of contaminants. Higher Psol probably occurred due to more intensive agricultural land use, with dairy and swine production (Figure 3a). While we sampled water at this point, cattle were often observed freely crossing stream banks and the water channel upstream. In addition, just below this midpoint, secondary drainage flowed into the main channel, increasing its flow and
Figure 3. Sample maps of the land cover/land use survey conducted in watersheds in Ibirubá, RS, Brazil [(a) W6, and (b) W1], highlighting critical environmental impact and restoration zones in watercourses.
0 20.5 1km
Water samplingCattle access to streamDrainage networkWoodlandCropland with pig slurry aplicationnWatershed boundarie
0 1 20.5
km
(a)
(b)
N
N
Broetto et al. Relationships between agriculture, riparian vegetation, and surface...
9Rev Bras Cienc Solo 2017;41:e0160286
Table 6. Comparison of soluble phosphorus (Psol) among sampling points in different sampling dates and agricultural watersheds in Ibirubá region, RS, BrazilWatershed Oct 28, 2013 Dec 4, 2013 Jan 4, 2014 Feb 4, 2014 Mar 7, 2014 Apr 11, 2014 May 2, 2014 Jun 4, 2014
mg L-1 Psol
W1
Outlet 0.066 ± 0.006 A 0.051 ± 0.011 A 0.199 ± 0.003 0.046 ± 0.018 0.015 ± 0.004 0.033 ± 0.002 A 0.026 ± 0.003 A 0.016 ± 0.001
Midpoint 0.002 ± 0.001 B 0.009 ± 0.002 B MS MS MS 0.015 ± 0.001 A 0.004 ± 0.000 B MS
W2
Outlet 0.024 ± 0.006 A 0.035 ± 0.006 A 0.013 ± 0.003 A 0.023 ± 0.001 A 0.023 ± 0.001 A 0.033 ± 0.003 A 0.054 ± 0.002 A 0.012 ± 0.003 A
Midpoint 0.017 ± 0.001 A 0.030 ± 0.007 A 0.009 ± 0.001 A 0.025 ± 0.001 A 0.019 ± 0.001 A 0.021 ± 0.001 A 0.044 ± 0.007 A 0.025 ± 0.002 A
W3
Outlet 0.022 ± 0.005 0.028 ± 0.002 A 0.014 ± 0.001 A 0.010 ± 0.002 A 0.015 ± 0.002 A 0.042 ± 0.001 A 0.024 ± 0.002 A 0.003 ± 0.000 A
Midpoint 0.019 ± 0.000 0.032 ± 0.001 A 0.010 ± 0.000 A 0.010 ± 0.003 A 0.013 ± 0.000 A 0.031 ± 0.000 A 0.021 ± 0.000 A 0.004 ± 0.001 A
W4
Outlet 0.013 ± 0.002 0.015 ± 0.009 0.000 ± 0.000 0.001 ± 0.001 0.005 ± 0.000 0.026 ± 0.005 0.010 ± 0.000 MS
W5
Outlet 0.016 ± 0.000 0.060 ± 0.020 0.001 ± 0.001 0.003 ± 0.002 0.032 ± 0.003 0.065 ± 0.002 0.013 ± 0.004 0.021 ± 0.004
W6
Outlet 0.013 ± 0.000 0.020 ± 0.001 A 0.012 ± 0.001 A 0.007 ± 0.001 B 0.014 ± 0.000 B 0.053 ± 0.000 B 0.023 ± 0.000 A MS
Midpoint 0.026 ± 0.001 0.037 ± 0.001 A 0.032 ± 0.000 A 0.050 ± 0.005 A 0.036 ± 0.000 A 0.095 ± 0.000 A 0.038 ± 0.001 A 0.012 ± 0.001
W7
Outlet 0.013 ± 0.000 0.028 ± 0.008 0.005 ± 0.001 0.078 ± 0.005 0.053 ± 0.003 A 0.035 ± 0.000 0.025 ± 0.001 MS
Midpoint 0.007 ± 0.000 0.022 ± 0.000 MS MS 0.006 ± 0.001 B 0.023 ± 0.000 0.011 ± 0.000 MS
Within watersheds, equal letters denote means compared by the Tukey test that were not statistically different at the 5 % of significance; the small W4 and W5 watersheds were sampled at the outlets only. Means highlighted in bold denote concentrations above the eutrophication threshold (0.01 mg L-1). MS: missing sample. W1, W2, W3, W4, W5, W6, and W7 are the selects watersheds and sampling points.
Table 5. Comparison of nitrate (NO−3) among sampling points in different sampling dates and agricultural watersheds from Ibirubá region, RS, Brazil
Sampling point Oct 28, 2013 Dec 4, 2013 Jan 4, 2014 Feb 4, 2014 Mar 7, 2014 Apr 11, 2014 May 2, 2014 Jun 4, 2014
mg L-1 NO−3
W1Outlet 0.77 ± 0.53 A 1.48 ± 0.09 A 1.88 ± 0.06 A 1.47 ± 0.09 A 0.78 ± 0.02 A 1.07 ± 0.08 A 1.29 ± 0.11 A 2.10 ± 0.04 AMidpoint 0.88 ± 0.22 A 1.40 ± 0.11 A 1.59 ± 0.22 A 1.57 ± 0.06 A 0.85 ± 0.04 A 1.43 ± 0.02 A 1.42 ± 0.06 A 1.58 ± 0.01 A
W2Outlet 1.78 ± 0.66 A 1.48 ± 0.05 A 2.17 ± 0.01 A 1.63 ± 0.01 A 0.99 ± 0.01 A 0.85 ± 0.08 A 1.63 ± 0.05 A 1.94 ± 0.09 AMidpoint 1.53 ± 0.34 A 1.47 ± 0.11 A 2.20 ± 0.13 A 1.60 ± 0.04 A 0.93 ± 0.09 A 0.66 ± 0.03 A 1.49 ± 0.02 A 2.04 ± 0.20 A
W3Outlet 0.42 ± 0.34 B 0.98 ± 0.06 A 1.11 ± 0.06 A 0.94 ± 0.01 A 0.34 ± 0.05 0.66 ± 0.04 A 0.64 ± 0.02 A 0.91 ± 0.04 AMidpoint 1.46 ± 0.53 A 0.75 ± 0.13 A 0.56 ± 0.04 A 0.49 ± 0.04 A MS 0.37 ± 0.04 A 0.32 ± 0.02 A 0.37 ± 0.04 A
W4Outlet 2.24 ± 0.43 1.87 ± 0.03 2.05 ± 0.12 1.79 ± 0.09 1.14 ± 0.12 1.34 ± 0.08 1.57 ± 0.06 2.13 ± 0.04
W5Outlet 0.70 ± 0.43 1.09 ± 0.12 0.39 ± 0.05 0.50 ± 0.10 MS 0.72 ± 0.56 0.54 ± 0.08 1.82 ± 0.08
W6Outlet 1.86 ± 0.26 A 2.35 ± 0.04 A 1.80 ± 0.06 A 1.89 ± 0.13 A 0.97 ± 0.34 B 1.64 ± 0.05 A 1.87 ± 0.06 A 2.27 ± 0.01 AMidpoint 1.00 ± 0.15 A 1.84 ± 0.03 A 2.06 ± 0.05 A 2.85 ± 0.04 A 2.37 ± 0.18 A 2.37 ± 0.05 A 2.86 ± 0.07 A 2.94 ± 0.06 A
W7Outlet 1.53 ± 0.30 A 1.84 ± 0.10 A 1.56 ± 0.04 A 1.59 ± 0.04 A 1.18 ± 0.04 A 1.50 ± 0.17 A 1.85 ± 0.32 A 2.79 ± 0.44 AMidpoint 1.33 ± 0.80 A 1.59 ± 0.04 A 1.44 ± A 1.68 ± 0.06 A 0.55 ± 0.22 A 0.86 ± 0.13 A 0.90 ± 0.06 A 1.49 ± 0.07 B
Within watersheds, equal letters denote means compared by the Tukey test that were not statistically different at the 5 % of significance; the small W4 and W5 watersheds were sampled at the outlets only. MS: missing sample. W1, W2, W3, W4, W5, W6, and W7 are the selects watersheds and sampling points.

Broetto et al. Relationships between agriculture, riparian vegetation, and surface...
10Rev Bras Cienc Solo 2017;41:e0160286
Figure 4. Daily rainfall and streamflow rates (on sampling dates) in watersheds at Ibirubá region, RS, Brazil, from October 2013 to June 2014. W1, W2, W3, W4, W5, W6, and W7 are the selects watersheds and sampling points.
Sampling dates
Stre
am fl
ow (m
³ h-1)
0
1500
3000
4500
6000
7500
22000
23000
Recorded Daily Rainfall
Rainfall (mm
)
0
20
40
60
80
100
120
150
200
W4 - OutletW5 - OutletW6 - MidpointW6 - OutletW7 - MidpointRainfall
W1 - SourceW1 - OutletW2 - MidpointW2 - OutletW3 - MidpointW3 - Outlet
Oct 01
, 201
3
Nov 01
, 201
3
Jan 01
, 201
4
Dec 01
, 201
3
Feb 0
1, 20
14
Mar 01
, 201
4
Apr 0
1, 20
14
May 01
, 201
4
Jun 01
, 201
4
Jul 01
, 201
4
Oct 01
, 201
3
Nov 01
, 201
3
Jan 01
, 201
4
Dec 01
, 201
3
Feb 0
1, 20
14
Mar 01
, 201
4
Apr 0
1, 20
14
May 01
, 201
4
Jun 01
, 201
4
Jul 01
, 201
4
Table 7. Comparison of nitrate (NO−3) among sampling dates in sampling points of agricultural watersheds in Ibirubá region, RS, Brazil
Date W1 W2 W3 W4 W5 W6 W7mg L-1 NO−
3
MidpointsOct 28, 2013 0.88 ± 0.53 A 1.53 ± 0.34 AB 1.46 ± 0.53 A - - 1.00 ± 0.15 C 1.33 ± 0.80 ABDec 4, 2013 1.40 ± 0.11 A 1.47 ± 0.11 AB 0.75 ± 0.13 AB - - 1.84 ± 0.03 BC 1.59 ± 0.04 AJan 4, 2014 1.59 ± 0.22 A 2.20 ± 0.13 A 0.56 ± 0.04 AB - - 2.06 ± 0.05 AB 1.44 ± 0.04 ABFeb 4, 2014 1.57 ± 0.06 A 1.60 ± 0.04 AB 0.49 ± 0.04 AB - - 2.85 ± 0.04 A 1.17 ± 0.06 ABMar 7, 2014 0.84 ± 0.04 A 0.93 ± 0.09 B MS - - 2.37 ± 0.18 AB 0.55 ± 0.22 BApr 11, 2014 1.43 ± 0.02 A 0.66 ± 0.03 B 0.37 ± 0.04 B - - 2.37 ± 0.05 AB 0.86 ± 0.13 ABMay 2, 2014 1.42 ± 0.06 A 1.49 ± 0.02 AB 0.32 ± 0.02 B - - 2.86 ± 0.07 A 0.90 ± 0.06 ABJun 4, 2014 1.58 ± 0.01 A 2.04 ± 0.20 A 0.37 ± 0.04 B - - 2.94 ± 0.06 A 1.49 ± 0.07 AB
OutletOct 28, 2013 0.77 ± 0.36 C 1.78 ± 0.66 ABC 0.42 ± 0.34 A 2.24 ± 0.43 A 0.70 ± 0.43 B 1.86 ± 0.26 AB 1.53 ± 0.30 BDec 4, 2013 1.48 ± 0.09 ABC 1.48 ± 0.05 ABC 0.98 ± 0.06 A 1.87 ± 0.03 AB 1.09 ± 0.12 AB 2.35 ± 0.04 A 1.84 ± 0.10 ABJan 4, 2014 1.88 ± 0.06 AB 2.17 ± 0.01 A 1.11 ± 0.06 A 2.05 ± 0.12 AB 0.39 ± 0.05 B 1.80 ± 0.06 AB 1.56 ± 0.03 BFeb 4, 2014 1.47 ± 0.09 ABC 1.63 ± ABC 0.94 ± 0.01 A 1.79 ± 0.09 AB 0.50 ± 0.10 B 1.89 ± 0.13 AB 1.68 ± 0.04 BMar 7, 2014 0.78 ± 0.02 C 0.99 ± 0.01 BC 0.34 ± 0.05 A 1.14 ± 0.12 B MS 0.97 ± 0.34 B 1.18 ± 0.04 BApr 11, 2014 1.07 ± 0.08 BC 0.85 ± 0.08 C 0.66 ± 0.04 A 1.34 ± 0.08 AB 0.72 ± 0.56 B 1.64 ± 0.05 AB 1.50 ± 0.17 BMay 2, 2014 1.29 ± 0.11 ABC 1.63 ± 0.05 ABC 0.64 ± 0.02 A 1.57 ± 0.06 AB 0.54 ± 0.08 B 1.87 ± 0.06 AB 1.85 ± 0.32 ABJun 4, 2014 2.10 ± 0.04 A 1.94 ± 0.09 AB 0.91 ± 0.04 A 2.13 ± 0.04 A 1.82 ± 0.08 A 2.27 ± 0.01 A 2.79 ± 0.44 A
Equal letters denote means compared by the Tukey test that were not statistically different at the 5 % level of significance; the small W4 and W5 watersheds were sampled at the outlets only. MS: missing sample. W1, W2, W3, W4, W5, W6, and W7 are the selects watersheds and sampling points.

Broetto et al. Relationships between agriculture, riparian vegetation, and surface...
11Rev Bras Cienc Solo 2017;41:e0160286
possibly diluting Psol concentrations. The mean flow rate during this study was three times larger in the outlet in comparison to the midpoint (Figure 4).
Large temporal variation in NO−3 and Psol concentrations are common in this type of
study according to Sliva and Williams (2001), and are mainly determined by rainfall, temperature, and soil management practices (Tables 7 and 8). High Psol concentrations were detected in most of the watersheds in the fall (April 2014), possibly associated with a drought period. In contrast, NO−
3 concentrations were highest in winter (June 2014). This may have occurred because of high rainfall in the days prior to sampling (Figure 4), which coincided with limited soil cover in that period - post-harvest of the summer crops, sowing of the winter crops. In particular, high NO−
3 concentrations in watercourses may have originated from the application of chemical fertilizers and PS to cropland.
These results, especially in relation to Psol concentrations that were greater than 0.010 mg L-1 on the majority of the sampling dates across watersheds, with the extreme value of 0.199 mg L-1 in the W1 basin, suggest that there is high risk of the occurrence of eutrophication (Jarvie et al., 2006, Gebler et al., 2012, 2014).
CONCLUSIONSSurface water quality in selected watersheds of the Ibirubá region were degraded by Psol, measured above the risk threshold for eutrophication in several sampling dates, but not by nitrates.
Degradation of water quality by Psol was mainly related to agricultural activities conducted in riparian zones, as assessed by agricultural and environmental indicators proposed in this study.
Table 8. Comparison of soluble phosphorus (Psol) among sampling dates in different sampling points and watersheds, in Ibirubá region, RS, BrazilDate W1 W2 W3 W4 W5 W6 W7
mg L-1 Psol
Midpoints
Oct 28, 2013 0.002 ± 0.001 A 0.017 ± 0.001 BC 0.019 ± 0.000 MS MS 0.026 ± 0.001 CD 0.007 ± 0.000 A
Dec 4, 2013 0.009 ± 0.002 A 0.030 ± 0.007 AB 0.032 ± 0.001 A MS MS 0.037 ± 0.001 BC 0.022 ± 0.000
Jan 4, 2014 MS 0.009 ± 0.001 C 0.010 ± 0.000 BC MS MS 0.032 ± 0.000 BCD MS
Feb 4, 2014 MS 0.025 ± 0.001 ABC 0.010 ± 0.003 BC MS MS 0.050 ± 0.005 B MS
Mar 7, 2014 MS 0.019 ± 0.001 BC 0.013 ± 0.000 ABC MS MS 0.036 ± 0.000 BC 0.006 ± 0.001 A
Apr 11, 2014 0.015 ± 0.001 A 0.029 ± 0.001 ABC 0.031 ± 0.000 AB MS MS 0.095 ± 0.000 A 0.023 ± 0.000
May 2, 2014 0.004 ± 0.000 A 0.045 ± 0.007 A 0.021 ± 0.000 ABC MS MS 0.038 ± 0.001 BC 0.011 ± 0.000
Jun 4, 2014 MS 0.025 ± 0.002 ABC 0.004 ± 0.001 C MS MS 0.013 ± 0.001 D MS
Outlet
Oct 28, 2013 0.066 ± 0.006 B 0.024 ± 0.006 BCD 0.022 ± 0.005 ABC 0.013 ± 0.002 AB 0.016 ± 0.000 BC 0.013 ± 0.000 0.013 ± 0.000
Dec 4, 2013 0.051 ± 0.011 BC 0.035 ± 0.006 AB 0.028 ± 0.002 AB 0.015 ± 0.009 AB 0.060 ± 0.020 A 0.020 ± 0.001 B 0.028 ± 0.008 C
Jan 4, 2014 0.199 ± 0.003 A 0.013 ± 0.003 CD 0.014 ± 0.001 BC 0.000 ± 0.000 B 0.001 ± 0.001 C 0.012 ± 0.001 B 0.005 ± 0.001 D
Feb 4, 2014 0.046 ± 0.018 BCD
0.023 ± 0.001 BCD 0.010 ± 0.002 BC 0.001 ± 0.001 B 0.003 ± 0.002 C 0.007 ± 0.001 B 0.078 ± 0.005 A
Mar 7, 2014 0.015 ± 0.004 E 0.023 ± 0.001 BCD 0.015 ± 0.002 BC 0.005 ± 0.000 B 0.032 ± 0.003 B 0.014 ± 0.000 B 0.053 ± 0.003 B
Apr 11, 2014 0.033 ± 0.002 CDE 0.033 ± 0.003 ABC 0.042 ± 0.001 A 0.026 ± 0.005 A 0.065 ± 0.002 A 0.053 ± 0.000 A 0.035 ± 0.000 BC
May 2, 2014 0.026 ± 0.003 DE 0.054 ± 0.002 A 0.024 ± 0.002 ABC 0.010 ± 0.000 AB 0.013 ± 0.004 BC 0.023 ± 0.000 B 0.025 ± 0.001 CD
Jun 4, 2014 0.016 ± 0.001 E 0.012 ± 0.003 D 0.003 ± 0.000 D MS 0.021 ± 0.004 BC MS MS
Equal letters denote means compared by the Tukey test that were not statistically different at the 5 % of significance; the small W4 and W5 watersheds were sampled at the outlets only; means highlighted in bold denote concentrations above the eutrophication threshold (0.01 mg L-1). MS: missing sample. W1, W2, W3, W4, W5, W6, and W7 are the selects watersheds and sampling points.

Broetto et al. Relationships between agriculture, riparian vegetation, and surface...
12Rev Bras Cienc Solo 2017;41:e0160286
REFERENCESAguiar Jr TR, Rasera K, Parron LM, Brito AG, Ferreira MT. Nutrient removal effectiveness by riparian buffer zones in rural temperate watersheds: the impact of no-till crops practices. Agric Water Manage. 2015;149:74-80. https://doi.org/10.1016/j.agwat.2014.10.031
Albuquerque JA, Sangoi L, Ender M. Efeitos da integração lavoura-pecuária nas propriedades físicas do solo e características da cultura do milho. Rev Bras Cienc Solo. 2001;25:717-23. https://doi.org/10.1590/S0100-06832001000300021
American Public Health Association - APHA. Standard methods for the examination of water and wastewater. 20th ed. Washington, DC: American Public Health Association; 1995.
Anami MH, Sampaio SC, Suszek M, Gomes SD, Queiroz MMF. Deslocamento miscível de nitrato e fosfato proveniente de água residuária da suinocultura em colunas de solo. Rev Bras Eng Agric Amb. 2008;12:75-80. https://doi.org/10.1590/S1415-43662008000100011
Angers DA, Chantigny MH, Macdonald JD, Rochette P, Côte D. Differential retention of carbon, nitrogen and phosphorus in grassland soil profiles with long-term manure application. Nutr Cycl Agroecosyst. 2010;86:225-9. https://doi.org/10.1007/s10705-009-9286-3
Bertol OJ, Rizzi NE, Favaretto N, Lana MC. Phosphorus loss by surface runoff in no-till system under mineral and organic fertilization. Sci Agric. 2010;67:71-7. https://doi.org/10.1590/S0103-90162010000100010
Brasil. Ministério da Saúde. Portaria no 2.914, de 12 de dezembro de 2011 [internet]. Brasília, DF. Ministério da Saúde; 2011 [acesso em 28 fev 2015]. Disponível em: https://bvsms.saude.gov.br/bvs/saudelegis/gm/2011/prt2914_12_12_2011.html.
Brasil. Ministério da Casa Civil. Lei no12.651, de 25 de maio de 2012 [internet]. Brasília, DF: Casa Civil; 2012 [acesso em 28 fev 2015]. Disponível em: https://www.planalto.gov.br/ccivil_03/_Ato2011-2014/2012/Lei/L12651.htm.
Broetto T, Torquist CG, Bayer C, Campos BC, Merten CG, Wottrich B. Soils and surface waters as affected by long-term swine slurry application in Oxisols of southern Brazil. Pedosphere. 2014;24:585-94. https://doi.org/10.1016/S1002-0160(14)60044-8
Broetto T, Tornquist CG, Weber EJ, Campos BC, Merten CG, Schneider JC. Indicadores geoespaciais para avaliação do impacto ambiental da suinocultura no licenciamento em âmbito municipal. Pesq Agropec Bras. 2015;50:1177-85. https://doi.org/10.1590/S0100-204X2015001200007
Callisto M, Ferreira WR, Moreno P, Goulart M, Petrucio M. Aplicação de um protocolo de avaliação rápida da diversidade de hábitats em atividades de ensino e pesquisa (MG-RJ). Acta Limnol Bras. 2002;14:91-8.
Carvalho TM. Técnicas de medição de vazão por meios convencionais e não convencionais. Rev Bras Geogr Fís. 2008;1:73-85.
Companhia Nacional de Abastecimento - Conab. Séries históricas 1976-2014 [internet]. Brasília, DF: 2015 [acesso em 2 abr 2015]. Disponível em: https://www.conab.gov.br/detalhe.php?c=5054&t=2#this.
Denardin JE, Kochhann RA, Berton A, Trombetta A, Falcão H. Terraceamento em Plantio Direto. Passo Fundo: Embrapa Trigo; 1999. (Comunicado Técnico Online, 8).
Environmental Systems Research Institute - ESRI. ArcGIS Professional GIS for the desktop [computer program]. Version 10.2. Redlands: 2013.
Gebler L, Bertol I, Ramos RR, Louzada JAS, Miquelluti, DJ. Fósforo reativo: arraste superficial sob chuvas simuladas para diferentes coberturas vegetais. Rev Bras Eng Agríc Amb. 2012;16:99-107. https://doi.org/10.1590/S1415-43662012000100013
Gebler L, Bertol I, Biasi LR, Ramos RR, Louzada JAS. Transferência superficial de fósforo reativo potencialmente contaminante por chuvas simuladas intensas. Eng Sanit Amb. 2014;19:393-9. https://doi.org/10.1590/S1413-41522014019000000564
Gilles L, Cogo NP, Bissani CA, Bagatini T; Portela JC. Perdas de água, solo, matéria orgânica e nutriente por erosão hídrica na cultura do milho implantada em área de campo nativo, influenciadas por métodos de preparo do solo e tipos de adubação. Rev Bras Cienc Solo. 2009;33:1427-40. https://doi.org/10.1590/S0100-06832009000500033

Broetto et al. Relationships between agriculture, riparian vegetation, and surface...
13Rev Bras Cienc Solo 2017;41:e0160286
Hasenack H, Weber E, organizadores. Base cartográfica vetorial contínua do Rio Grande do Sul - escala 1:50.000 [internet]. Porto Alegre: UFRGS-IB - Centro de Ecologia; 2010 [acesso em 18 fev 2014]. Disponível em: https://www.ecologia.ufrgs.br/labgeo/index.php?option=com_content&view=article&id=75&Itemid=29.
Instituto Brasileiro de Geografia e Estatística - IBGE. Malha municipal digital do Brasil, situação em 2010; 2010 [acesso em 18 fev 2016]. Disponível em: https://mapas.ibge.gov.br/bases-e-referenciais/bases-cartograficas/mapas-municipais.
Instituto Brasileiro de Geografia e Estatística - IBGE. Séries históricas e estatísticas: efetivo do rebanho de 1974-2009; 2015 [acesso em 5 out 2016]. Disponível em: https://seriesestatisticas.ibge.gov.br/series.aspx?vcodigo=PPM01.
Jarvie HP, Neal C, Whiters PJA. Sewage-effluent phosphorus: A greater risk to river eutrophication than agricultural phosphorus? Sci Total Environ. 2006;360:246-53. https://doi.org/10.1016/j.scitotenv.2005.08.038
Kebede W, Tefera M, Habitamu T, Alemayehu T. Impact of land cover change on water quality and stream flow in Lake Hawassa watershed of Ethiopia. Agron Sci. 2014;5:647-59. https://doi.org/10.4236/as.2014.58068
Lourenzi CR, Ceretta CA, Silva LS, Girotto E, Lorensini F, Tiecher TL, Conti L, Trentin G, Brunetto G. Nutrients in soil layers under no-tillage after successive pig slurry applications. Rev Bras Cienc Solo. 2013;37:157-67. https://doi.org/10.1590/S0100-06832013000100016
Lovell ST, Sullivan WC. Environmental benefits of conservation buffers in the United States: Evidence, promise, and open questions. Agric Ecosyst Environ. 2006;112:249-60. https://doi.org/10.1016/j.agee.2005.08.002
Minatti-Ferreira DD, Beaumord AC. Adequação de um protocolo de avaliação rápida de integridade ambiental para ecossistemas de rios e riachos: aspectos físicos. Rev Saúde Amb. 2006;7:39-47.
Pietola L, Horn R, Yli-Halla M. Effects of trampling by cattle on the hydraulic and mechanical properties of soil. Soil Till Res. 2005;82:99-108. https://doi.org/10.1016/j.still.2004.08.004
Poudel DD, Lee T, Srinivasan R, Abbaspour K, Jeong CY. Assessment of seasonal and spatial variation of surface water quality, identification of factors associated with water quality variability, and the modeling of critical nonpoint source pollution areas in an agricultural watershed. J Soil Water Conserv. 2013;68:155-71. https://doi.org/10.2489/jswc.68.3.155
Ribeiro KH, Favaretto N, Dieckow J, Souza LCP, Minella JPG, Almeida L, Ramos MR. Quality of surface water related to land use: a case study in a catchment with small farms and intensive vegetable crop production in southern Brazil. Rev Bras Cienc Solo. 2014;38:656-68. https://doi.org/10.1590/S0100-06832014000200030
Sharpley AN, Hedley MJ, Sibbesen E, Hillbricht-Ilkowska A, House WA, Ryszkowski L. Phosphorus transfers from terrestrial to aquatic ecosystems. In: Tiessen H, editor. Phosphorus in the global environment. Chichester: John Wiley & Sons; 1995. p. 171-200.
Sharpley AN, Daniel T, Sims T, Lemunyon J, Stevens R, Parry R. Agricultural phosphorus and eutrophication. 2nd ed. United States: Agricultural Research Service; 2003.
Sliva L, Williams DD. Buffer zone versus whole catchment approaches to studying land use impact on river water quality. Water Res. 2001;35:3462-72. https://doi.org/10.1016/S0043-1354(01)00062-8
Strahler AN. Quantitative analysis of watershed geomorphology. Trans Am Geophys Union. 1957;38:913-20.
Tornquist CG. Simulação da dinâmica do carbono orgânico do solo em escala regional: aplicação do modelo Century e sistemas de informações geográfica [tese]. Porto Alegre: Universidade Federal do Rio Grande do Sul; 2007.
Tsegaye T, Sheppard D, Islam KR, Johnson A, Tadesse W, Atalay A, Marzen L. Development of chemical index as a measure of in-stream water quality in response to land-use and land cover changes. Water Air Soil Pollut. 2006;174:161-79. https://doi.org/10.1007/s11270-006-9090-5