relationship between student achievement and use of power
TRANSCRIPT

Seton Hall UniversityeRepository @ Seton HallSeton Hall University Dissertations and Theses(ETDs) Seton Hall University Dissertations and Theses
2009
Relationship Between Student Achievement andUse of Power Videos Digital Educational VideosRick SorrellsSeton Hall University
Follow this and additional works at: https://scholarship.shu.edu/dissertations
Part of the Other Education Commons
Recommended CitationSorrells, Rick, "Relationship Between Student Achievement and Use of Power Videos Digital Educational Videos" (2009). Seton HallUniversity Dissertations and Theses (ETDs). 1374.https://scholarship.shu.edu/dissertations/1374

Relationships between Student Achievement and Use of Power Videos Digital
Educational Videos
by
Rick D. Sorrells
Dissertation Committee
Charles Achilles, Ed.D., Mentor Barbara Strobert, Ed.D.
Christopher Tienken, Ed.D. Joseph Martinelli
Submitted in Partial Fulfillment Of the Requirements for the Degree
Doctor of Education Seton Hall University
2009

ABSTRACT
In classrooms with limited instructional time and many resources, teachers must
decide which resources positively affect student achievement. Power Videos (PV),
produced by DCS, is one such product used at the 373 elementary campuses in the
greater Dallas, Texas, area.
This research examined the relationship between teachers' usage of the DCS PV
product on a campus and the performance of students on that campus on the Texas
Assessment of Knowledge and Skills (TAKS) test in the areas of reading, math, science,
and all tests. A random sample of 61 campuses was included in the study.
This research was a nonexperimental, correlational, quantitative, and evaluative
study. The methods included collection of quantitative data for the 2006-2007 school
year regarding TAKS performance from the TEA Web site. Data for PV usage were
collected from standard reports generated by DCS. Pearson r values were generated for
the following comparisons: Power Video usage vs. elementary TAKS score-reading,
Power Video usage vs. elementary TAKS scores-math, Power Video usage vs.
elementary TAKS scores-science, and Power Video usage vs. elementary TAKS
scores-all tests.
There were statistically significant correlations between the use of PV and student
performance on the reading, math, and all-tests sections of the TAKS test. There were no
statistically significant correlations between the use of PV and student achievement on
the science portion of the TAKS test.

ACKNOWLEDGMENTS
I wish to thank my mentor, Dr. Charles Achilles, for the time, guidance, candor,
and APA notations. I always enjoyed the humor and even the notes and suggestions on
the drafts of this paper, especially the last word, cheers!
Thanks to Dr. Barbara Strobert, Dr. C h s Tienken, and Joseph Martinelli for
words of encouragement and taking time fiom your busy schedules to provide advice and
feedback.
I could have never imagined the journey without a group like my Cohort X
friends. What an amazing group of people! Jeff was the perfect roommate. Ben, Mary Jo,
Patrice, Sue, and Jean were always there for support and became new lifelong friends.
I also want to especially thank Dr. Dick Hughes. Without Dick's constant support,
advice, counsel, and friendship, this journey would have taken a lot longer! I will be
forever grateful for the time he set aside on multiple Fridays to provide advice. I am so
thankful that I had Dick in Dallas to push me while Chuck was pushing from SHU.
Finally, thanks to my wonderful wife (who underwent two surgeries while I was
in New Jersey) and my loving family, who always supports me and provides
encouragement.

DEDICATION
This is dedicated to my mom, dad, grandmother, and father-in-law, who always
inspired me to believe I could achieve anything I tried. My grandmother got to see me
start the program and was looking forward to calling me Dr. Rick. They all are watching
from above still helping me meet my goals.

TABLE OF CONTENTS
... Acknowledgments ............................................................................. 111
Dedication ...................................................................................... iv
... List of Figures ................................................................................. VIII
List of Tables ................................................................................... ix
Chapter 1 : Introduction .............................................................................................. 1
Background .................................................................................................... 2
Problem Statement ......................................................................................... 13
Purpose of the Study ...................................................................................... 13
Research Questions ........................................................................................ 14
Significance of the Study ............................................................................... 14
Design and Methods of the Study .................................................................. 15
Delimitations of the Study ............................................................................. 17
Limitations of the Study ................................................................................ 18
Assumptions Made for the Study ................................................................... 19
. . Defin~t~on of Terms ....................................................................................... 19
Summary of Chapter 1 and Organization of the Study .................................. 23
Chapter 2: Review of Research, Theory, and Literature ........................................... 24
Introduction .................................................................................................... 24
Theoretical Framework .................................................................................. 46
Summary of Chapter 2 and Description of Chapter 3 ................................... 51
Chapter 3: Design and Methodology ......................................................................... 53
Introduction .................................................................................................... 53

............................................................................................ Research Design 54
........................................................................................ Research Questions 55
Hypothesis ..................................................................................................... 56
Research Methods .......................................................................................... 56
Discussion of Controls ................................................................................... 57
Step-by-step Procedures ................................................................................ 61
Summary of Chapter 3 and Description of Chapter 4 ................................... 62
Chapter 4: Data Analysis ........................................................................................... 63
Research Question 1 ...................................................................................... 64
Research Question 2 ...................................................................................... 66
Research Question 3 ...................................................................................... 68
Research Question 4 ...................................................................................... 70
Summary of Results ....................................................................................... 72
Summary of Chapter 4 and Description of Chapter 5 ................................... 73
Chapter 5: Summary of Findings, Conclusions. Discussion.
and Recommendations ................................................................................... 74
Introduction and Research Questions ............................................................ 74
Summary of Findings ..................................................................................... 75
Conclusions and Discussion .......................................................................... 76
Recommendations .......................................................................................... 78
References .................................................................................................................. 85
Appendix A: Power Videos Web site and Product Description ................................ 100
Appendix B: IRB Forms ............................................................................................ 101

vii
Appendix C: Campuses Selected for Study ............................................................... 103
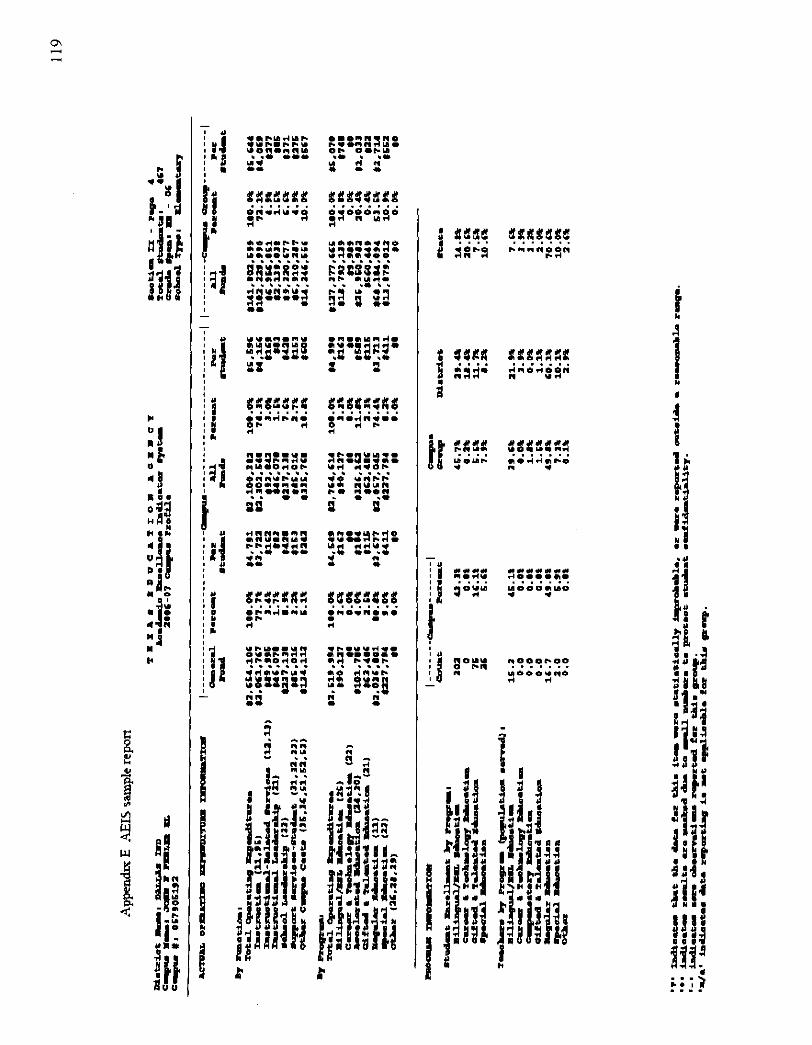
.............................................................. Appendix D: Power Video Sample Reports 105
........................................................................... Appendix E: AEIS Sample Reports 107

viii
List of Figures
Figure 1 Rodney's interdependence of educational technology ......................... 7
Figure 2 Typical media streaming arrangement ............................................. 11
Figure 3 MedCalc sample size calculation ......................................................... 16
Figure 4 Baddeley's working memory model ........................................................... 48
Figure 5 Cognitive theory of multimedia learning (Mayer. 2001) ............................ 49
Figure 6 Theoretical framework for Power Videos study ........................................ 52
Figure 7 Scatter plot of Power Video usage vs . elementary TAKS scores-Reading .............................................................................. 66
Figure 8 Scatter plot of Power Video usage vs . elementary TAKS scores-Math .................................................................................. 68
Figure 9 Scatter plot of Power Video usage vs . elementary TAKS scores-Science ................................................................................ 70
Figure 10 Scatter plot of Power Video usage vs . elementary TAKS scores-All tests ........................................................................................................ 72

List of Tables
.............................................. Table 1 TAKS Test Subjects by Grade Level 4
Table 2 A Brief Description of the AEIS System ........................................... 6
Table 3 A Typology of the Use of Educational Media ................................... 8
............................. Table 4 Findings from Eleven Meta-analyses (1978-1985) 27
Table 5 Kulik's Findings from Twelve Meta-analyses .................................. 30
Table 6 Mean Effect Sizes and Percentile Gains for Nine Study Feature .............................................................. Variables and Other Variables 33
Table 7 Responses Indicating Perceived Usefulness of Sources in Relation ........................................................... to Aspects of Language Learning 39
Table 8 Power Video Usage vs . Elementary TAKS Scores-Reading ................ 65
.................... Table 9 Power Video Usage vs . Elementary TAKS Scores-Math 67
Table 10 Power Video Usage vs . Elementary TAKS Scores- Science ................ 69
Table 11 Power Video Usage vs . Elementary TAKS Scores-All Tests .................. 71

Chapter 1 : Introduction
In Texas, high-stakes testing has recently risen to a new level, as the Texas
Legislature enacted legislation to influence the finances of districts and individual
teachers based on student achievement. Individual and campus-level district scores on the
Texas Assessment of Knowledge and Skills (TAKS) test are now a mechanism to provide
bonus incentive pay for teachers whose students' scores improve or whose students meet
predetermined levels of achievement. Additionally, individual schools and districts
receive annual accountability ratings based on students' TAKS scores. The accountability
ratings also have financial ramifications.
In classrooms with limited instructional time and many resources, teachers must
decide which resources positively affect student achievement. Resources are costly, and
administrators want to maximize dollars spent for student achievement. Dallas County
Schools (DCS) provide digital educational videos to support teacher instruction and
student achievement. Local school districts supported by DCS are asking for additional
dollars to be spent to increase bandwidth and expand the library of digital titles to be
downloaded or streamed. Understanding that the quality of a decision can be no better
than the datdinformation upon which the decision is based, DCS leadership seeks to
determine the relationship between the DCS digital educational video program and
student achievement.
A leadership and management issue, then, becomes which instructional products
funded by tax dollars improve student performance. Power Videos (PV), produced by
DCS, is one such product used at the 373 elementary campuses in the greater Dallas,
Texas, area. The issue confronted by DCS leadership is, "Are the dollars being spent on

PV having a positive, measurable influence on student achievement?" DCS
administrators are seeking information that will inform the leadership about this question.
Background
Texas has had some form of statewide student assessment for more than 29 years.
High-stakes testing in Texas began in 1979 when the Texas State Legislature passed a bill
amending the Texas Education Code to require the Texas Education Agency (TEA) to
adopt a series of criterion-referenced assessments. These assessments were designed to
assess basic skill competencies in mathematics, reading, and writing for students in
Grades 3,5, and 9. The formal assessment that linked student assessment results to the
statewide cuniculum in Texas was the Texas Assessment of Basic Skills (TABS).
Learning objectives for the TABS test were developed by the TEA. The objectives were
designed to represent a portion of the skills students were expected to learn in Texas
public schools. The TABS objectives were reviewed and revised by committees of
educators as a checkpoint to ensure that the objectives accurately reflected the
curriculum.
The state then changed the requirements from basic skill competencies to
minimum skills. This change was the basis to change the test from the TABS test to the
Texas Educational Assessment of Minimum Skills (TEAMS) test in 1984. TEAMS was
administered to students in Grades 1, 3, 5, 7, 9, and 11, with the Grade 11 test an exit-
level assessment.
In 1988, the legislature decided to make changes to the standardized TEAMS test.
The changes were designed to expand the subject content being measured. A prime focus

was to place a greater emphasis on the assessment of problem-solving skills and
exceeding the minimum skill levels. This new program, TAAS, was implemented in
1990. The TAAS testing program required that students attain higher levels of academic
achievement. TAAS assessed higher-order thinking skills and problem-solving in math,
reading, and writing for Grades 3,5, 7, and 9 and the Grade 11 exit-level assessment. In
1993, the legislature created a new statewide accountability system that included the
rating of campuses and districts.
Then in 1999, under another new law, students in Grades 3 (reading), 5, and 8
(reading and math) were required to demonstrate proficiency on a new state assessment
test, and achieve passing grades to advance to the next grade level. This new test was
called the Texas Assessment of Knowledge and Skills (TAKS). At the 1 lth-grade level,
students were required to pass the TAKS to receive a high school diploma upon
graduation. The test required passing scores in reading, writing, math, science, and social
studies.
The current standardized test is the TAKS test that is used in Texas primary and
secondary public schools to assess student skills in multiple subject areas (Table 1). The
Texas Education Agency (TEA), Pearson Education Inc., and Texas educators
collaboratively create the TAKS test, which is based on the state-mandated cumculum,
the Texas Essential Knowledge and Skills (TEKS). High school seniors must pass the
exit-level TAKS tests in English language arts, social studies, math, and science to be
eligible to graduate. Students are given five chances to pass the test. Some of the tests,
such as high-school-level reading and language arts, contain short-answer questions in

addition to the standard multiple-choice questions. For each test, a scaled score of 2100 is
required to pass. To earn commended status, a score of 2400 is required.
In the spring of 2007, Texas legislators repealed TAKS in favor of End of Course
(EOC) exams in high school to be phased in over time. The first class to take the EOC
exams will be the freshman class of 201 1-2012.
The report mechanism that collects the TAKS data also collects a significant

amount of other information useful in determining students' performance. This system,
known as the Academic Excellence Indicator System (AEIS), is annually updated with
new information based on TAKS results, the alternative assessment, progress of students
who previously failed the TAKS, and many more performance indicators. The AEIS
system was a product of Texas House Bill 72 in 1984. The Texas Legislature looked for a
system to emphasize student achievement as a means for accountability of the Texas
education system. Table 2 highlights the information collected in the AEIS.
Many different tools have been introduced and implemented in an effort to
improve education achievement. A number of these tools have involved what is described
as educational technology. Roblyer and Edwards (2000) defined educational technology
as "a combination of the processes and tools involved in addressing educational needs
and problems, with an emphasis on applying the most current tools: computers and their
related technologies" (p. 6).
Rodney (2002) reported that educational technology was a conduit between the
learner and the teacher to help meet the stated educational goals and needs of all parties
in the educational process. Rodney stated that educational technology could create an
interdependent relationship that would result in improved learning and performance.
Figure 1 depicts this researcher's adaptation of Rodney's perception of the
interdependence on educational technology. This interdependent relationship was also
echoed by Fullan and Hargraves (1996) as the researchers argued that relationships were
critical in creating and maintaining a learning environment for the future.

Table 2 4 BriefDescription of the AEIS System The Academic Excellence Indicator System (AEIS) pulls together a wide range of information on the performance of students in each school and district in Texas every year. This information is put into the annual AEIS reports, which are available each year in the fall. The performance indicators are as follows:
Results of Texas Assessment of Knowledge and Skills (TAKS*); by grade, by subject, and by all grades tested;
Results of State-Developed Alternative Assessment II (SDAA 11); Participation in the statewide assessment programs (TAKS/SDAA II/TAKS-I/TAKS-Alt); Exit-level TAKS Cumulative Passing Rates; Progress of Prior Year TAKS Failers; Results of Student Success Initiative; Results of Texas Assessment of Knowledge and Skills-Inclusive (TAKS-I); by subject; Progress of English Language Learners (ELL); Performance-Based Monitoring (PBM) Special Education Monitoring Results Status; Attendance Rates; Annual Dropout Rates (grades 7-8, grades 7-12, and grades 9-12); Completion Rates (Cyear longitudinal); College Readiness Indicators;
o Completion of Advanced /Dual Enrollment Courses; o Completion of the Recommended High School Program or Distinguished
Achievement Program; o Participation and Performance on Advanced Placement (AP) and
International Baccalaureate (IB) Examinations; o College-Ready Graduates; o Texas Success Initiative (TSI) - Higher Education Readiness Component; and o Participation and Performance on the College Admissions Tests (SAT I and
ACT).
'erformance on each of these indicators is shown disaggregated by ethnicity, sex, special education, ow-income status, limited English proficient status (since 2002-03), and, beginning in 2003-04, at- ,isk status (district only). The reports also provide extensive information on school and district staff, inances, programs, and student demographics.
' The TAKS (Texas Assessment of Knowledge and Skills) replaced the TAAS (Texas Assessment of Icademic Skills) in the 2002-03 school year as the state-administered assessment. AEIS reDorts ,efore 2002-03 show performance on the TAAS test. iource Information: TEA Web site

Figure I. Rodney's interdependence of educational technology.
One such educational technology that has been involved in schools for more than
a century is the use of film and multimedia in the classroom. Film was first introduced in
schools nearly a century ago as a means to inspire students and add reality to the
curriculum. In the early 1900s, Rochester, New York (home of the Eastman Kodak film
and camera company), led the utilization of film in public schools. Technological
innovations have rapidly changed the use of video in the educational sector from film to
videotape and videodisk to digital desktop video to multimedia to CD-ROM and even
Web-based media.
Educators frequently use educational media in instructional settings. Educators
considering the use of educational media must consider the various characteristics of the
media and instructional goals. The typology of the media being used also helped
researchers develop a framework for analyzing the use of media. Table 3 presents a
typology of the use of educational media. The typology includes major features
associated with the use of the media in the classroom.
In 1977, DCS began program development of numerous tools designed to support

instruction in the classroom. Initially, reel-to-reel films and videos were available to local
schools and delivered via van transport.
Table 3 A Typology of the Use ofEducational Media
1 Audience 2 Location
3 Time
4 Information display
5 Information extension
6 Information updating
7 Content structure
8 Content Flexibility
9 Interactivity with instructional content or with 'virtual' instructor in the media
Interactivity with other 10 learners
11 Production cost
12 Cost ofuse
13 Teacher's training
14 Student's training
Learners are in the same location or different location Synchronous/asynchronous
Text, audio, graphic, 3D animation
Does the information in the media allow future extension?
Does the information in the media keep updating?
Does the content in the media display clear structure about the knowledge being taught?
Does the content in the media allow teachers' or learners' flexibility about the knowledge being taught?
Do the media allow content-learner interaction?
Do the media allow learner-learner interaction?
Highllow
Highllow
Does the use of the media require teacher's relevant training in advance?
Does the use of the media require student's relevant training in advance?
Vote. Chin-Chung Tsai (2000), Educational Media International.
DCS next added an interactive virtual expedition (IVE). An IVE enables learners

of all ages to experience and interact with a virtual field trip, in real or near real time
from a distant location. IVE provides a unique insight into the very nature of discovery.
Students are linked via technology to the field trip, where they have the ability to ask
questions, interact, and become more engaged in the discovery process without ever
leaving the school building. Participants include students and other educators from
multiple classes across the United States. Questions submitted by the students range in
theme from specific questions about the IVE to questions requiring higher-level thinking
skills.
Since 2002, DCS personnel have taken advantage of technological advancements
and now deliver requested media products to local campuses via Power Videos (PV), a
copyright-protected product designed by DCS programmers. The product is composed of
more than 1,200 educational videos, all of which have been aligned to the state-mandated
TEKS curriculum. The videos are delivered digitally to classrooms throughout Dallas
County. DCS offers two types of technologies to access the media. Videos can be either
streamed or downloaded for viewing. The terms film, media, and video are used
interchangeably throughout this study.
Video streaming is delivered via a sequence of moving images that are sent from
compressed files over the Internet. The streaming takes place without the need to wait for
the entire file to be transmitted to the desktop. Instead, the file is sent in a continuous
stream to the desktop and played as the file is streamed. The end user must have a media
player that decompresses the data.
To play correctly, the video needs to run uninterrupted or without significant
pauses. Streaming technologies buffer in the computer's memory the files to be played.

As soon as the computer has a sufficient amount of the file buffered, the computer begins
to stream the media. The video file is not permanently stored in the computer files.
Poorly performing networks or a lack of sufficient bandwidth provides a poor learning
experience. Figure 2 denotes a typical streaming arrangement as noted by Vanbuel,
Bijnens, and Bijnens (2004).
Since bandwidth can become an issue with streaming, some teachers download
the media. Downloading the PV allows teachers to store the video permanently on the
computer's hard drive in accordance with a digital rights management system to ensure
compliance with copyright laws. Many videos have also been subdivided into 3- to 5-
minute clips for teachers to use in their classrooms for better time management. Some
schools have electronically linked PV to online cuniculums.
Learning strategies for video-based instruction have been categorized into three
types: (a) passive watching, (b) learnindpracticing while watching, and (c)
leamindpracticing after watching (DeMartino, 2001). In the passive-watching strategy,
students were not involved in any discussion or hands-on learning activities. According
to Schluger, Hayes, Turino, Fishman, and Fox (1987), the passive watching strategy
generally resulted in poor long-term learning outcomes. The learnindpracticing-while-
watching strategy occurred when students paused, stopped, forwarded, or rewound video
with the requirement of some form of discussion or hands-on activities with other
students. DeMartino's learning/practicing-after-watching strategy involved a discussion
or hands-on activity first, followed by a video that provided an opportunity to reinforce
the concept learned.
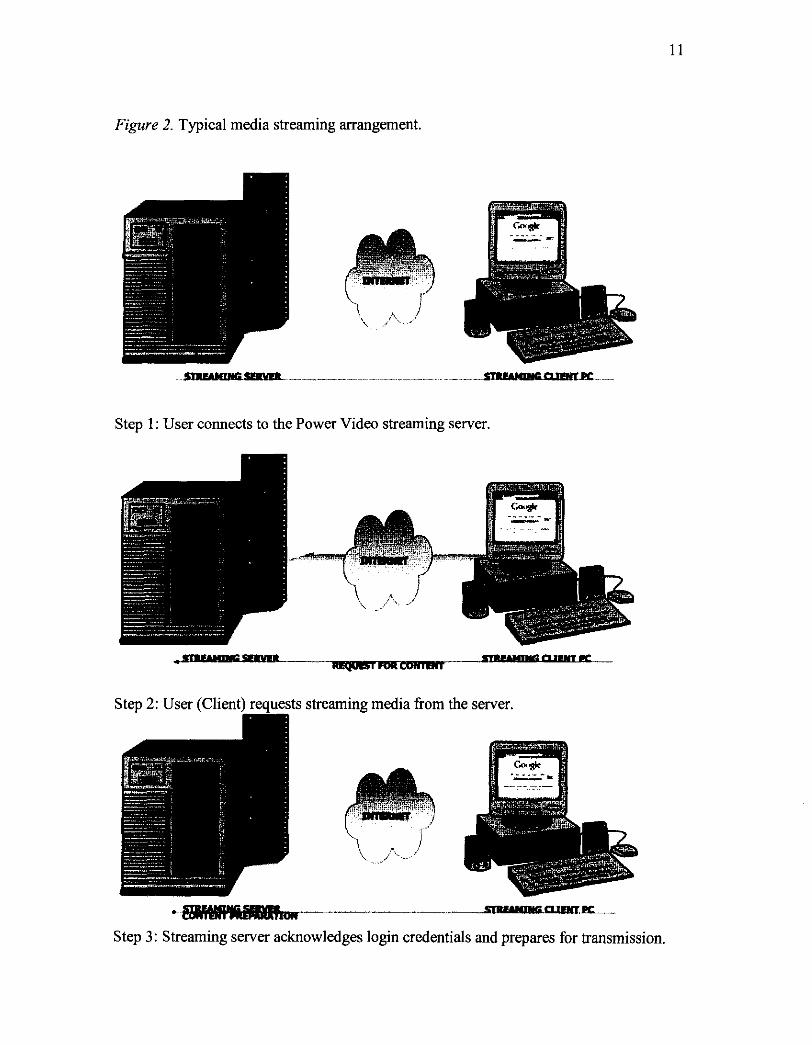
Figure 2. Typical media streaming arrangement.
Step 1: User connects to the Power Video streaming server.
streaming media from the server.
,------------nutoaL
Step 3: Streaming server acknowledges login credentials and prepares for transmission.

Figure 2. Typical media streaming arrangement (continued).
Step 4: Streaming server begins transmission of the media.
Step 5: Buffer fills up as media segments reach the client.
zI.uyuLcsIIyB P --
Step 6: Streaming client displays media as the server sends additional media segments.

Statement of the Problem
There is constantly a shortage of financial resources for education. The dollar
crunch requires scrutiny of products and programs before additional monies are spent.
DCS administrators need data that will inform the leadership how to best allocate these
scarce financial resources. In this study, the researcher analyzed data to assist
administrators in prioritizing investments. That is, are monies best targeted in select PV
product subject areas that have a positive statistical correlation to student achievement, or
are resources better used to support other products? The results of this study provide
essential data for DCS leadership to make clearer decisions.
Purpose of the Study
The purpose of this study was to obtain valid and reliable information to allow
school administrators to make informed decisions regarding data management, student
achievement, and budget requirements. What are the relationships between the use of PV
in elementary classrooms and student achievement as measured by the TAKS test? For
the purposes of this study, TAKS scores were obtained fiom the TEA Web site's AEIS
reports. The researcher examined the relationship (if any) between teachers' usage of the
DCS PV product on a campus and the performance of students on that campus on the
TAKS test in the areas of reading, math, science, and all tests.
The null hypothesis underlying this nonexperimental quantitative study is Ho= p
= 0, indicating that the results are due to chance such that there is no patterned influence
of the use of PV in the classroom on student achievement. The alternative hypothesis can
be stated as HA = p $0 and that the results are not due to chance.

There are conflicting research studies and theories (as well as opinion) on the
merits of media use in the classroom. The PV study will add to research data that either
confirm or refute the conflicting research.
Research Questions
Question I . What were the relationships (if any) between teachers' usage of the
DCS PV product on a campus and the performance of students on that campus on the
TAKS test in reading?
Question 2. What were the relationships (if any) between teachers' usage of the
DCS PV product on a campus and the performance of students on that campus on the
TAKS test in math?
Question 3. What were the relationships (if any) between teachers' usage of the
DCS PV product on a campus and the performance of students on that campus on the
TAKS test in science?
Question 4. What were the relationships (if any) between teachers' usage of the
DCS PV product on a campus and the performance of students on that campus on the
TAKS test in all tests?
Significance of the Study
Texas politicians (e.g., legislators), parents, and others continue to strongly
emphasize student achievement. There is significant pressure from the community, state
leaders, and the media to justify the investment of tax dollars in schools. The mechanism
used to determine success in the schools is student performance on the state-mandated
TAKS test. Results from this study will be combined with outcomes of other studies
regarding the efficacy of digital educational product in the classroom. Prior researchers
reached widely varying conclusions. This study will add to the existing research to assist
in determining relationships between digital educational product usage in the classroom
and student achievement. This study may also serve to extend the knowledge-building
and reasoning processes identified by English, Nason, and Duncan-Howell (2007).
English et al. noted that interactive digital media (IDM) have been used to gain greater
depth in learning that could result in measurable differences in student achievement. The
results will also be a tool for DCS administration to use in evaluating the expenditure of
tax dollars on PV to improve academic achievement.
Design and Methods of the Study
This research was a nonexperimental, correlational, quantitative, and evaluative
study. Nonexperimental research is an important education research tool. Some
researchers suggest that nonexperimental research might be more important than
experimental research. Kerlinger (1986) noted that most education research problems do
not lend themselves to experimental research. Johnson (2001) noted that education
researchers are often in situations where neither experimental nor quasi-experimental
methods are feasible.
The methods included collection of quantitative data for the 2006-2007 school
year regarding TAKS performance from the TEA Web site, which publishes
accountability ratings and test scores for students in public school districts in Texas. Data
for PV usage were collected from standard reports generated by DCS and available on the

DCS Web site. All documents existed in the public domain, and none contained data
identifymg individual students. Of the population of 373 elementary public school
campuses served by DCS, a sample was derived using a random number generator to
identify K-6 schools to be included in the sample for this study. The sample size was
determined using a computerized sample size calculator. The model was taken from the
McdCalc Sample Size Calculator. With the alpha level set at 0.05 and the beta level at
0.10 and a presumed correlation coefficient of 0.40, the minimal sample size was
calculated to be 61, as noted in Figure 3.
Sampling from the population of 373 schools continued until 61 campuses had
been identified that met the criteria regarding exclusion of specialty schools,
socioeconomic status (SES), limited English proficiency (LEP), and class size. Sample
size is one of several quality characteristics of a statistical study that this researcher
focused on for a quality study.
TypeIerra-Alpha TypeUma-Beta
g 0 . m ~3 0.m
IS, 0.10 @ 0.m
<I@ 0.05 89 0.0s
0 0.01 0 0.01
IWt
C a r d a h meffdent: 0.40
R e d t
Minind rewed ra*le sirr = 61
[ T I 1-1 rw-]
Figure 3. MedCalc sample size calculation.

Delimitations ofthe Study
The researcher did not examine how individual teachers use PV. Specialty
schools, such as schools for gifted and talented youths and dedicated disciplinaryljuvenile
justice centers, were excluded from the study. Exclusion of these specialty schools served
as a control for the misleading effect that outliers can have in a correlational study.
Restricting the range of the variables of SES, language, and class size was also a
delimitation as the range of these three variables was defined to narrow the rival
explanations possible. These confounding variables were limited by controls imposed by
the researcher. To control for SES, the researcher included only those campuses where
the percentage of economically disadvantaged students fell within * one (1) standard
deviation of the State of Texas mean for economically disadvantaged students for major
urban areas as reported in the AEIS database. Major urban areas were defined as the
largest school districts in the state that serve the seven metropolitan areas of Houston,
Dallas, San Antonio, Fort Worth, Austin, El Paso, and McAllen. To limit confounding
effects for LEP, this researcher included only those campuses where S O % of students
are proficient in English as identified in the State of Texas AEIS reports. The delimitation
for class size was controlled by including in the study only those campuses where
average class size is within * one standard deviation of the average class size for
elementary schools in major urban areas as defined by the AEIS report. Additional
delimitations were as follows: (a) male-to-female ratio of teachers or students and (b)
student special needs classification.
Additionally, if, during the sampling procedure, the researcher found that either
SES, LEP, or class size controls had created a scenario where 270% of the population

was excluded following use of the control strategies, then that control was released. Any
control that eliminated 70% of the total population threatened to skew the sample and
would likely yield a nonrepresentative sample of the actual population.
Another delimitation at the time of the present study was that training was not
required before Power Video use.
Limitations of the Study
Limitations are associated with this nonexperimental evaluative research study. In
the analysis, the researcher considered only the percentage of the total teacher population
on a campus that had either downloaded or streamed a PV product into the classroom,
and did not examine the impact of PV at the individual student level. Given longstanding
research documenting dramatic differences in individual student learning styles (e.g.,
Grimley, 2007; Moallem, 2007), the use of aggregated data may mask some value of PV
use for either an individual student or select subgroups of students.
Differences in grouping of students into particular classrooms, levels, and
difficulty of the classes using PV were also limitations. Although the statistical analysis
was not conducted to demonstrate if the use of PV resulted in a change in student
achievement, the strength of the relationship would provide school district leadership
with information needed to analyze and justify monies spent on the program.
Another limitation of the study involved a limitation of the literature. Not all of
the research in the review included effect size calculations. This limited the researcher's
ability to determine the strength of the effects produced for those studies. This study also
had a similar limitation as there was no control group appropriate for use in computing

effect sizes.
Potential teacher selection bias was also a limitation. Teachers who downloaded
Power Videos could have been more skilled, more interested in using technology, or
more motivated.
Another limitation is that the all-test section of the TAKS test includes areas of
reading, math, and science that have previously been reported separately.
Assumptions Made for This Study
The following assumptions were made in this study: (a) Students' scores on the
TAKS test reflect the amount of student achievement, (b) higher use of PV on a campus
is indicated by a higher percentage of instructional staff streaming or downloading the
PV product, and (c) streaming or downloading of PV on a campus indicates usage of PV
in the classroom.
Dejnitions
The terms used in this study are defined to ensure consistency in interpretation of
the language used.
Bandwidth. The amount of data per second that can he delivered to a computer. A
56K modem has a bandwidth of 56 kilobitdsecond. The term bandwidth is also used in
conjunction with data rate when discussing video.
Campus usage. This is the percentage of credentialed instructional staff who use
the DCS digital delivery program, Power Videos.
Capturing. This is the process of saving video from an external source to a hard
drive. Analogue video is converted to digital.
Computer-assisted instruction (CAI). This refers to a program of instructional
material presented by means of a computer or computer systems. This may include drill
and practice, tutorials, games, simulation, discovery, or problem solving. This may take
the form of software, media products, or interactive learning. Modem technologies have
added to these hypertext, hypermedia, and multimedia. Also, this may be referred to as
computer-assisted learning (CAL) or computer-based instruction (CBI).
Digital. Information represented as discrete numeric values, e.g., in binary format
(zeros or ones), as opposed to information in continuous or analogue form. Binary digits
(bits) are typically grouped into words of various lengths; 8-bit words are called bytes.
Digital educational videos. These are defined as the Power Videos product
provided by DCS.
Digital Rights Management (DRM). Digital media files can be easily copied and
distributed, without any reduction in quality. Digital media files are now distributed
widely on the Internet, through authorized and unauthorized distribution channels. Piracy
is a concern when security measures are not in place to protect content. Digital Rights
Management (DRM) enables content providers to protect their content and maintain
control over distribution. Content providers can protect and manage their rights by
creating licenses for each digital media file. Consumers are also able to access higher-
quality digital media content on the Internet because content providers using DRM are
more willing to make such content more widely available. Windows Media DRM is one
of the systems that provides end-to-end DRM offering content providers and retailers a
flexible platform for the secure distribution of digital media files.

Digital Video (DV). A video signal stored in binary format. To process and store
video on a computer, the video must first be converted to a binary format. Most digital
video cameras are capable of outputting video directly to a hard drive in this format via
the IEEE 1394 interface. DV is a good format to input into a compression and editing
application, but the file sizes are too large for effective delivery over the Internet without
large bandwidth.
Download. This term means to move a digital file (such as a media file) from a
server where the file is stored to a local system for viewing or editing.
Efect Size. This is a measure of the strength of the relationship between two
variables.
Grade equivalent score. This is a score reported on norm-referenced tests that
allows educators and parents to compare students based on the performance of other
students relative to the school year.
Media. The term media is used throughout this study interchangeably with videos.
Meta-analysis. Meta-analysis is a statistical procedure that allows researchers to
synthesize the results of numerous research studies comparing different treatments.
Multimedia. The term multimedia is used throughout this study interchangeably
with videos.
On demand. This term refers to the ability to request at any moment video, audio,
or information to be sent to the screen immediately by clicking on the appropriate
position on the screen.
Player. Software running on the client to view a stream.
Power Videos. Power Videos is a DCS developed program using multiple

vendors' videos delivered to the desktop. A Power Video may be viewed on multiple
platforms, such as on individual computers or via a single room projection by the teacher.
See Appendix A.
Reliable data. Reliability is the consistency of a measurement, or the degree to
which an instrument measures the same way each time the instrument is used under the
same conditions. It is sometimes called the repeatability of a measurement.
Streaming. Video or audio transmitted over a network that users can begin to play
immediately instead of waiting for the entire file to download. Typically, a few seconds
of data are sent ahead and buffered in case of network transmission delays (although
some data are buffered to the hard drive, the data are written to temporary storage and are
gone once viewing is complete).
Student achievement. Achievement is defined by results on the Texas state
required test, the TAKS.
Tjpe Zerror. Alpha: the probability of making a Type I error (*level, two sided),
i.e., the probability of rejecting the null hypothesis when in fact it is true.
Tjpe ZI error. Beta: the probability of making a Type I1 error @-level), i.e., the
probability of accepting the null hypothesis when in fact it is false.
Valid data. Cook and Campbell (1979) defined this term as the "best available
approximation to the truth or falsity of a given inference, proposition or conclusion."
VOD (video-on-demand). VOD is prerecorded video stored on a server for access
at the user's convenience. Power Videos is an example of a program that can provide
VOD.

Summary of Chapter I and Organization of the Study
Chapter 1 provided background information regarding the use of digital media in
the classroom to support student learning and student achievement. This chapter included
the problem statement, background information about the study, the research questions,
the significance of the study, assumptions, delimitations and limitations of the study, and
identification of the design and methods.
Chapter 2 provides a review of pertinent research and literature that deal with the
use of media in the classroom to support student learning and achievement. This literature
review discusses the use of media, factors that influence its usage, its effectiveness, and
student achievement results when used in the classroom. This chapter also provides a
basis for the theoretical framework for the study.
Chapter 3 presents the design and methodology of the study. This chapter
highlights the procedures for collecting and analyzing the data. It denotes specific steps
taken to compile the data.
Chapter 4 presents the data with the analysis that has been conducted. Data from
the TEA Web site and standard reports from the DCS Power Videos program are used in
the analysis.
Chapter 5 includes the summary of findings from the data analysis in chapter 4.
This chapter also includes conclusions related to the findings of the study. Chapter 5
concludes with recommendations for practices and policies and fLture research regarding
the use of media in the classroom.

Chapter 2:
Review of Research, Theory, and Literature
Introduction
The U.S. Department of Education's National Center for Education Statistics has
produced a number of issue briefs and reports concerning the use of technology and
media in the classroom. Many of these briefs evaluate teacher perceptions of how these
tools are best used in the classroom but do not address any effect on achievement. The
researcher's review in this study focused on studies more closely related to student
achievement.
Desktop video, multimedia, virtual reality, and a number of other technologies
will be used to teach K-12 students in the future (Holden & Holmes, 1995). As noted by
Mayer (1997, p. 4), "At this time, the technology for multimedia education is developing
at a faster pace than the corresponding science of how people learn in multimedia
environments." Mayer's comments direct researchers to try and understand how people
learn in the multimedia environment. Many educators understand the powerful impact of
visual leaming. One reason teachers use videos in classroom instruction is because they
help explore meanings beyond the superficial and allow multiple teaching techniques to
meet students' learning needs (Aiex, 1999).
A number of research studies regarding educational technology's effect on student
achievement found that educational technology had a positive effect on student
achievement. Researchers must measure the effectiveness of educational technology on
achievement. Numerous studies have compared the effectiveness based on an analysis of

an effect size comparison. Effect size is a measure of the strength of the relationship
between two variables, such as the use of the technology and student achievement. Many
researchers have analyzed multiple studies and made effect size comparisons. Kulik and
Kulik (1991) noted that a moderate but significant effect size for educational technology
is between 0.3 and 0.4.
Koechel(1970) studied the effects of visual teaching, specifically concept videos,
in multiple chemistry classes. The researcher found that students were more engaged in
the topic when video was used. Test scores were compared by analysis of variance and F
tests. Thep values converted from the F ratios were transformed into chi-square
statistics. The results were significant at thep 5.05 level. Koechel found that more
involved learners also performed better on assessments.
Thomas and Thomas (1984) noted that videos are a dense medium and an
appropriate choice when large amounts of information are to be disseminated in a short
time. The researchers suggested pre-, post-, and progress testing to validate that the
objectives are being achieved. Other researchers have noted positive attributes of the use
of media.
Cowen (1984) concluded that video was important for representing character-
driven stories. The researcher established the equivalence of text and video versions of
short vignettes depicting a main character. The study found that the video version led to
better recall of story details than the text version. The study also included text
information followed by conflicting video information (and vice versa). The results
indicated that participants were more positively influenced by the video version in their
recall than the text version.

Niemiec and Walberg (1987) reported an average effect size of 0.42 in their meta-
analysis of 16 studies. Of these 16 studies reviewed, 11 were meta-analytic reviews that
discussed the relationships between the use of technology, such as media, and
achievement. Table 4 highlights the findings with specific effect size and percentile gains
found. The results showed a moderate effect, with students using the technology scoring
at the 66th percentile on achievement tests compared to students in the control group who
scored at the 50th percentile. The researchers also noted that achievement may be related
to instructional level. Niemiec and Walberg found effect size student gains were the
highest at the elementary school level i.46) and lowest at the college/university level
(.26), with the high school level between the two i.32).
Riskin (1990) used interactive media in a sociology course. The researcher
concluded that the use of media promoted creative thinking and assisted in transforming
the new information into learning. Riskin's research also tied the new information to past
knowledge (memory) for learning to occur.
Fletcher (1 990) also conducted a meta-analysis of interactive videodisc
instruction. The analysis was composed of 28 studies that compared the effectiveness of
videodisc instruction to traditional classroom instruction. Average effect sizes were
calculated using control group standard deviations. The researcher reported moderate
positive effect sizes for knowledge i.36) and performance i.33). Fletcher also reported
that the time to complete tasks compared to traditional instruction was a large effect size
at 1.19.
Information that is presented visually is more powerful and easier to recall than
information that is presented verbally according to Egan, Welch, Page, and

Table 4 Findings from Eleven Meta-analyses (1978-1985)
Source Information: Niemiec and Walherg (1987)
Sebastian (1992). The researchers used a Liiert-type scale in which students measured
the quality of course features such as organization, content clarity, instructor's delivery,
and course difficulty. Significant differences were established between selected variables.
Similarly, Cronin and Cronin (1992) found improved content comprehension when video
was used. The researchers stated that "[i]nteractive video instruction allows learners to
link specific visual images with specific text or graphic information" (p. 38). The
researchers further noted that if the video activity was well designed, the learner reacted
and interacted, which resulted in increased learning.
Bain, Houghton, Sah, and Carroll (1992) investigated the differences in
achievement between three different types of instruction. The researchers compared
achievement among an interactive video session, a linear video session, and a nonvideo

session. Statistically significant differences were found between the video session and the
other two sessions on student achievement. The researchers concluded that video had a
positive effect on student achievement.
Another area in the literature in which the positive effects of technology in
learning have been noted is the affective domain. A number of researchers (Cotton, 1992;
Rowe, 1993; Sivin-Kachala & Bialo, 1996) found a positive relationship between
educational technology and the development of positive attitudes and improved self-
esteem. The development of these traits influence learning in schools. Cotton (1992)
found in schools that had integrated technology into the classroom a higher level of self-
efficacy, better attendance, fewer behavioral problems, and more time on task. Sivin-
Kachala and Bialo (1996) found that the technology-rich environment made learning
more student centered. The researchers also found more cooperative learning and higher
studentlteacher interactions. Each of these led to improved student performance.
Kulik (1994) summarized a large number of meta-analyses from the 1980s. In the
97 studies reviewed, the analysis investigated effect sizes based on five different uses of
media for instruction. The uses included tutoring, managing, simulation, enrichment, and
programming. The researcher observed that students learned more in courses involving
computer-based instruction. He also noted students who used technological support
acquired information at a more rapid rate. Kulik argued that this type of instruction,
which employed advanced technology, yielded marked improvement and was effective in
improving student achievement. The studies reviewed in the meta-analyses targeted
elementary, middle, and high school students in math, science, language arts, and social
studies. The overall effect size for the tutoring group was moderate at 0.36. The effect

size for the other groups was 0.14 or below.
Kulik also conducted a meta-analysis of 12 meta-studies based on 546 individual
studies (Table 5). The researcher reported average effect sizes ranging from 0.25 to 0.57.
This equated to a 10- to 22-percentile gain over the control group, which performed at the
50th percentile. In addition, Kulik reported that students learned more in less time, and
that they liked their classes more. The results had positive effects in every area. Table 4
depicts how achievement varied with educational level. At the elementary school level,
the effect sizes were greater, 0.37 to 0.40 (14- and 16-percentile gain), while at the
secondary and college levels, the effect sizes were smaller, 0.25 and 0.29, respectively.
Learning with visual representations is also especially important for difficult
concepts that frequently need additional clarification (Wetzel, Radtke, & Stem, 1994).
The Wetzel et al. study indicated a general learning benefit compared to using only audio.
The study focused on how the material was delivered, simultaneous or sequential, and
when audio narration should precede the video images.
Johnson, Cox, and Watson (1994) conducted the ImpacT study with 2,300
students from 87 classrooms in primary and secondary schools in England and Wales.
The study evaluated teachers' practices, schools' policies, and resources related to
student achievement. This national research project used multiple quasi-experimental
designs and then computed an overall effect size from 24 separate studies. Johnson et al.
determined that high levels of instructional technology improved academic achievement
in the four content areas of math, science, geography, and English. The results showed
that there were small but statistically significant academic achievement effect sizes for
those with high computer use. These effects ranged from a low of 0.08 in English to a

Table 5 Kulik's Findings from Twelve Meta-analyses
Source Information: Kulik (1 994)
high of 0.3 1 in mathematics. The two other content areas of geography and science had
small but significant effect sizes of 0.25 and 0.21, respectively.
Large, Beheshti, Breuleux, and Renaud (1 995) studied 71 sixth-grade students to
determine the effect of multimedia on children's learning and achievement. The sample

was composed of approximately equal numbers of males and females. The researchers
had students view text that included animation on how to find direction. The researchers
found that both recall and the following of procedural steps were statistically significantly
higher in the group viewing the video. The differences were significant at [F(3,67) =
6 . 0 2 0 , ~ 1.0011.
Fletcher-Flinn and Gravatt (1995) examined 120 individual studies that reviewed
the effect of a number of variables related to educational level, course content, duration,
and student characteristics. The mean effect size was 0.24 for 1987-1992. In these
studies, no significant differences were found in effect size between the different
educational levels, as has been previously noted by Kulik. Also noted in the results was
that effect size did not differ with computer-assisted instruction (CAI) type. There were
differences, though, in achievement depending on the course subject. The highest gains
were in mathematics, with a 0.32 effect size. The lowest gains were in reading and
writing. The researchers' results are summarized in Table 6.
Researchers have noted that specific demographic and subject groups can be
positively influenced by the use of media. Studies, such as those by Green (1995), noted
that classroom teachers can help language minority students comprehend subjects by
practicing, as the Intercultural Development Research Association (IDRA) suggested,
using filmstrips, video, and audio cassettes in conjunction with approved texts.
Roberts, Cowen, and MacDonald (1 996) reviewed film and text versions of the
short story "The Soap-Box Derby." The researchers found that the video version of the
story provided students with better recall compared to students who experienced only the
text versions of the story. The researchers also noted that the video led to better recall of

secondary information. The study supported higher achievement by students with video
compared to text versions only.
Mann and Shafer (1997) studied five New York counties and found that in
schools with high levels of instructional technology and teacher training an average of
7.5% more high school students took and passed the state college preparatory exam in
math. In English, the average was 8.8% more students taking the exam. The researchers
also noted that 42% of the variation in math scores and 12% of the variation in English
scores could be explained by the addition of technology in the school.
Another study in chemistry conducted by Harwood and McMahon (1997)
included 450 students in Grades 9 through 12 across 18 classrooms in a metropolitan area
on the East Coast. This study reviewed not only academic achievement but also students'
attitudes in chemistry for students using a structured chemistry video series. Four
instruments were used to assess results: the High School Studies Test (a 40-minute norm
referenced standardized test), the High School Chemistry Student Opinion Survey
(Heikkinen, 1973) (a 20-question Likert-scaled attitude survey), microunit quizzes
created by the researchers, and the Test of Logical Thinking (TOLT) (a 20-minute paper-
and-pen assessment). The results of the repeated analysis of variance measures proved a
statistically significant difference in the comprehensive achievement of the students using
the video series at p 5.01.
Christmann, Badgett, and Lucking (1997) analyzed student achievement during a
12-year period (1984 to 1995) of secondary students across multiple academic areas with
and without computers in the instructional environment. The researchers found an effect

Table 6 Mean Effect Sizes and Percentile Gains for Nine Study Feature Variables and Other Variables
Source Information: Fletcher-Flinn & Gravatt (1995)

size of 0.19. The students who used the instructional aids had higher achievement than
57% of the students not using the aids. This finding supported Fletch-Flinn and Gravatt's
(1995) reported effect size of 0.20 for studies at the secondary school level from 1987 to
1992 (Table 6).
Other researchers have also identified a number of benefits of educational
technology. Wild (1998) noted that the use of multimedia allowed a range of resources
such as text, film, sound, graphics, and photographs to be combined effectively into one
learning event. The researcher outlined areas of teaching and learning that would he
enhanced through the use of technology, such as the PV product. These areas included
the following: (a) pedagogy (altering the relationship between teacher and pupil so the
teacher becomes more of a facilitator learning with the class), (b) learning environment
(helping learning by supporting pupils with learning differences), (c) learning processes
(encouraging enquiry-based learning), (d) cognitive modeling (helping pupils relate
separate items of knowledge to a broader context), (e) social contexts (modeling and
enquiry-based learning creating discussions on related topics), (f) new activities
(resources supporting a wide variety of new activities and learning experiences), and
(g) child-centered learning (helping pupils work independently or within a group).
The National Center for Research on Literature Teaching and Learning's project,
the Multimedia and Literature Teaching and Learning Project, reviewed attributes of
multimedia and developed multimedia applications for literature at the elementary and
secondary school levels. Swan and Meski11 (1997) found that electronic media "support
unique and important forms of meaning making that need to be included into a
necessarily broadening view of literature study" (p. 56).
Liao (1998) conducted a meta-analysis comparing achievement of students taught
by traditional instructional delivery and students who were taught with hypermedia
(including video). The results showed positive influences of the hypermedia method.
Liao noted, however, that earlierresearch (e.g., Bain et a]., 1992; Barnes, 1994; Chen,
1993) comparing the effect of increased levels of video support on instruction conflicted
with studies by Azevedo, Shaw, and Bret (1995), Barker (1988), and Hess (1994). In the
former studies, the researchers concluded that video support yielded positive benefits
while in the latter studies the researchers concluded that no such benefits accrued f?om
video support.
Reeves (1998) reviewed the effectiveness of technology and media as tools for
educators to aid in the development of higher-order thinking skills. The researcher noted
that teachers had to make significant changes in their delivery and management of
classroom activities when using media. Teacher-required changes were also noted as a
potential hindrance to implementation. Reeves suggested that a constructivist learning
environment is most effective in achieving success and positive student achievement. The
researcher noted that students learned "from" media and technology and "with" media
and technology. Investigators also examined how the media were used. Was there
teacher-directed instruction, teacher-centered instruction with media used as a
supplement, or total delivered instruction by media? Reeves noted that in this meta-
analysis the effectiveness declined as the grade level increased. The effect size for
elementary schools was 0.47. In secondary schools, this was reduced to 0.04, and further
reduced to 0.03 for colleges and universities. The researcher concluded that media were
effective means for conveying instructional content in the classroom.

Wenglinsky (1998) used the National Assessment of Educational Progress
(NAEP) data sets to analyze multiple variables and their impact on NAEP math
achievement in the fourth and eighth grades. The study consisted of a national sample of
6,277 fourth graders and 7,146 eighth graders. The researcher found that technology use
positively affected student achievement. The researcher also noted that other factors, such
as teacher preparation, access, and types of use, also affected achievement.
Researchers Chang, Honey, Light, Moeller, and Ross (1998) examined the effects
of computer technologies and student achievement in the Union City, New Jersey, school
district during a 10-year period. Over the period of the study, between 69 and 135
students participated in the study. Eighth-grade Early Warning Test (EWT) scores
improved 53% in reading, 30% in math, and 40% in writing during a 5-year period. Over
a 3-year period, ninth-grade EWT scores were 10% higher in reading, 4% higher in
mathematics, and 7% higher in writing. The scores were compared to a control group.
Chang et al. also found positive results with 10th-grade students on the High School
Proficiency Test (HSPT), on which there was an 1 1 % increase in reading and a 14%
increase in writing scores over a 2-year period. At the elementary grade levels, the
researchers found that first-grade reading scores improved 45% while fourth-grade scores
increased by 25%. In mathematics, first-grade achievement scores increased 18%, and
fourth-grade scores were 15% higher. The writing scores increased 34% for first graders
and 14% for fourth graders during the 1989-1997 time frame. The researchers also called
for increases in technology budgets because of the results found in this study.
Clarkson, Dunbar, and Toomey (1999) found that educational technology played
an important role in the area of engaging students in the learning process. The researchers

noted that these skills help produce literacy in students. This literacy leads to improved
student achievement.
Pisapia et al. (1999) reported on a 3-year initiative regarding effects of computer
technologies on a large metropolitan school district of more than 44,000 students. Thirty-
four elementary schools participated. The report covered third and sixth grades using the
Literacy Testing Program (LTP) and the Cognitive Abilities Test (CogAT). The study
investigated before and after affects of computer technologies. Analysis of covariance
(ANCOVA) results showed statistically significant differences in verbal, quantitative,
reading, math, and writing scores of the students exposed to the technologies at the
p S.000 level.
Herron, Cole, and Come (1999) investigated the use of video to teach culture for
university students studying Russian. A pretest was administered, and a posttest was
given at the end of the semester. Videos were reviewed on multiple occasions during the
semester. Also, postvideo viewing tests were given after each video was reviewed.
Students gave written feedback on their perceptions of how well they learned from the
videos. Repeated ANOVAs were conducted. The researcher noted positive results in
cultural knowledge after the students viewed selected specific videos. The posttest scores
were statistically higher than the pretest scores at a level o fp 1001.
The US. Department of Education funded a research study conducted by
Yekovich, Yekovich, and Nagy-Rados (1999) that evaluated the Technology-Rich
Authentic Learning Environment (TRALE) project's impact on students in urban
elementary schools in the District of Columbia. The TRALE project was designed to be a
framework for the creation of meaningful instruction using technology as a tool in

activities. The researchers found that despite expectations there would be no difference in
students' achievement on standardized test scores for at least 3 years, students' scores
increased significantly in the first year. The vocabulary gain equated to 0.83 years as
measured by grade equivalent scores compared to a control group of 0.24. In math, the
gains were even more significant, equating to 0.9 years. The study found that language
scores increased 0.7 years compared to the control group of 0.07. The study also found
that teachers who had high technology implementation in the classroom had average
Normal Curve Equivalent OIJCE) point gains of 10.9 compared to teachers with low rates
of technology implementation of only 1.1 NCE point gains.
Meskill, Mossop and Bates (1999) highlighted the use of electronic media in the
classroom to facilitate language and literacy development for English-as-a-second-
Language (ESL) learners. The data for this case study of two ESL classes were derived
from extended observations. The researcher found that media helped integrate concrete
examples visually, which resulted in greater ability to think and communicate in the
target language.
Other literature reviews also suggested that computer technologies had a positive
effect on academic achievement. Most of the effect sizes ranged from 0.10 to 0.40.
Rarely were strong relationships noted. Christmann and Badgett (1999) found a very
small effect size for chemistry (0.08) and biology (0.04). The researchers, however, noted
a strong effect size for general science at 0.70. Cavanaugh (1999) found that math bad an
effect size of 0.76. Cavanaugh also found an effect size for science of 0.07, in contrast to
the effect size found by Christmann and Badgett of 0.19. These types of differences may
depend on the specific types of media and technology resources being studied.

Soe, Koki, and Chang (2000) conducted a meta-analysis of 17 studies of K-12
students to review the effects of CAI on students reading achievement. The researcher
found an effect size of 0.13 for reading achievement. These results also indicated a
positive effect on reading achievement with a significance level o fp 5.000.
A study by White, Easton, and Anderson (2000) examined the use of video by
learners in a multimedia language course. In the study, researchers asked students to
assess how the learning sources (video, audio, textbook, workbook, and study guide)
contributed to the development of language skills. The figures in Table 7 reveal that
students used video to acquire listening skills and speaking skills. The researchers found
that video was effective in the development of listening and speaking skills, including
pronunciation. The researchers also reported that students outlined the advantages of
video as high enjoyment and low anxiety. The students described positive language
learning and a positive orientation to the course. White et al. noted that "[tlhe video
replicates situations that the foreign language classroom cannot produce" (p. 174).
Table 7 Responses Indicating Perceived Usefulness of Sources in Relation to Aspects of Language Learning
Video Audio Textbook Workbook Study guide
Listening 26 20 0 0 I Speaking 22 19 4 0 4 Reading 3 I 15 8 23 Writing I 0 I I 18 17 Vocabulary 8 3 13 6 26 Structures 6 I 10 6 24 Pronunciation 23 23 0 0 3 Source Information: White, Easton, and Anderson (2000).
Schreibman, Whalen, and Stahmer (2000) investigated the use of video in
children with autism. The researchers used a process of video priming, a means to teach

events and possible outcomes to the special needs students, to reduce disruptive behavior.
Behaviors addressed included whining, crying, screaming, aggression, pulling, and verbal
resistance. Since a number of special needs students are mainstreamed in regular
classrooms, the results go beyond the effect on the autistic students. The researchers had
students view short videos of specific transitions that the autistic students' parents had
noted indicated repeated behavioral problems. The researchers found that in a few short
weeks after viewing the specific situations again and again, the students' disruptive
behavior declined. The researchers found that the implementation of the video priming
procedures led to a reduction and in some cases a complete elimination of the disruptive
behavior.
Other researchers have studied the impact of multimedia in the classroom for
specific subject areas. Xin and Reith (2001) found positive effects for vocabulary and
reading comprehension with video use for special needs students in the fourth, fifth, and
sixth grades. The researchers conducted pretests, posttests, and follow-up tests. Data
analysis from this experiment revealed that video-assisted vocabulary instruction
positively impacted student achievement. Specifically, students randomly assigned to the
video group had higher word acquisition scores than students who were not in the group.
The post hoc one-way analysis of variance (ANOVA) was significant for the video group
at F(1,74) = 4 . 5 0 , ~ = ,037. This occurred in one school at each campus over a 6-week
period.
Spielvogel et al. (2001) conducted a study of nine locations using information
gathered from IBM's Reinventing Education initiative. The study focused on education
reforms that used computer technologies. The study used qualitative and quantitative

methods. The researchers noted that:
Unlike many education reform initiatives, the solutions that directly address
student learning through the provision of new or improved forms of instruction
have had significant positive impact on student achievement in grades 7 through
11 in mathematics, language arts, social studies and science and on the
development of early reading skills. (p. 1)
Wu, Krajcik, and Soloway (2001) conducted a study of 71 1 I th-grade chemistry
students at a public high school in the Midwest over a 6-week period. The researchers
studied the use of a visualization tool to reinforce learning concepts in chemistry. The
study included 36 males and 35 females. There was a mix of ethnic backgrounds,
socioeconomic status as well as academic abilities. The tools used in this study allowed
students to build molecular models and view different models at the same time. The data
were analyzed using a software program that allowed the researchers to code, analyze,
and display data in real time based on students' usage. The results of the pretest vs.
posttest paired two-sample t test indicated that students' understanding of chemical
representations improvement was statistically significant a tp 1.001. The effect size was
2.68, indicating that the posttest scores were more than 2.5 standard deviations higher
than the pretest scores.
Blok, Oostdam, Otter, and Overmaat (2002) studied the effectiveness of computer
assisted instruction (CAI) programs with beginning readers. The researchers reviewed 42
studies and found the effect size was 0.19. These findings were similar to the Kulik
(1994) study that also found small but positive effects. The researchers found that if the
results were limited to English-speaking countries, the overall effect size grew to

approximately 0.5. The researchers' results indicated that students improved in beginning
reading instruction when English is the language of instruction.
Waxman, Connell, and Gray (2002) conducted a meta-analysis of 20 quantitative
studies to review the effects of teaching and learning with technology on student
performance. The study included more than 4,400 students. The researchers calculated
138 effect sizes from the 20 studies. The mean of the study-weighted effect sizes
averaging across all outcomes was 0.30 ( p < .05), with a 95% confidence interval. This
indicated a small-to-medium strength correlation.
In rural Virginia, Boster, Meyer, Roberto, and Inge (2002) conducted a study to
examine video streaming over the Internet and the possible connections to improved
student performance. The experimental group that used in-class educational videos
outperformed the control group by an average of 12.6% in third- and eighth-grade science
and social study scores. This study produced a weighted average effect size of r = 0.29
and was statistically significant. The product evaluated in the Boster et al. research
included video clips so that teachers might specifically target learning of key concepts.
The product had videos aligned to the specific state standards that were tested on state
assessment tests. The product used in the Boster et al. study is a subset of the PV product
being researched in this study.
Boster et al. (2004) repeated video streaming research with 2,134 sixth- and
eighth-grade students from Los Angeles area middle schools. These results showed a
statistically significant improvement for the experimental group of 3% to 5% over the
control group. The sixth-grade students performed 4.7% better than the nonvideo
streaming group. A similar result was noted in the eighth-grade group where the video

streaming group performed 2.2% better than the nonvideo group. Both results were
statistically significant and were noted across schools and teachers.
Beglau (2005) discussed how media improved scores for fourth-grade students on
a state standardized test in Missouri, the Missouri Assessment Program (MAP). Changes
in the students' achievement were credited to the enhanced Missouri's Instructional
Networked Teaching Strategies (eMINTS) that used technology to improve student
performance. The differences in average scores ranged from 7.6 points higher in
communication arts to 19.6 points in mathematics. In communication arts, the Cohen's d
effect size was 0.37 and was 0.37 for Hedge's g. The calculated effect size for
mathematics was 0.55 for Cohen's d and 0.55 for Hedge's g. The research also pointed to
media's ability to narrow the Black-White achievement gap.
Tienken and Wilson (2007) reviewed the impact of computer-assisted instruction
(CAI) on seventh-grade students' mathematics achievement in 4 middle school
classrooms in a school in central New Jersey. The researchers found that CAI had a
positive, small effect on the students' learning of basic mathematics skills. The Cohen's d
calculation resulted in an effect size of d = 0.12.
So and Kong (2007) also examined how teachers used multimedia in the
classroom. The study investigated the use of a multimedia package to help students
understand the movement of the Earth. The researchers investigated two different
approaches to inquiry learning. So and Kong also noted that different pedagogical
methods used affected the level of achievement. A comparison of pretest and posttest
results found significant improvements in two classes of 1G12 year olds studied. A
paired t test was conducted to measure changes in achievement. Transforming mean
differences to standardized progression scores through statistical conversion shows a
percentile gain. In Class A, the effect size was 21.1% and was 39.9% in Class B. The
researchers stated that teacher development tools are needed to observe the greatest
increase in achievement. Another factor was to determine if teachers had been trained in
the use of the multimedia.
James-Shuler (2008) conducted a nonexperimental study analyzing differences in
outcomes on the New Jersey Assessment of Skills and knowledge (NJASK) state-
mandated test based on the influence of the Student Achievement in Reading and Writing
(STAR-W) grant program. The researcher studied language arts literacy for students in
Grades 3 through 5 in the Hackensack Public school district in New Jersey. James-Shuler
found that the student achievement of fourth graders was higher for participants in the
program than nonparticipants. The results, however, were not statistically significant.
While some would tout digital cumculum supplements as universally beneficial
(e.g., Matranga, 2007), Clark (1994) stated that media do not influence learning, only the
content of the materials causes learning. Clark (1983) stated, "The best current evidence
is that media are mere vehicles that deliver instruction but do not influence student
achievement any more than the truck that delivers our groceries causes change in
nutrition" (p. 445).
St. Clair (1999) reported negative results on academic achievement and the use of
computer technologies in the classroom. The program was implemented in six Detroit
public schools in the 1997-1998 school year. The Michigan Educational Assessment
Program (MEAP) was the tool used for determining levels of student achievement. A
total of 655 students and 22 teachers participated in the study. Both a summative and a

formative assessment were conducted. The summative assessment was designed to
determine if students in the treatment group would score higher on the MEAP than
students in the control group. The analysis of the data indicated that the program resulted
in an average normal curve equivalent (NCE) loss of 3.1 1 points for seventh-grade
students on the reading portion of the exam. Similarly, students in the program had an
average loss of 12.79 NCE points on the science portion of the exam.
Johnson (2000) also questioned results of studies indicating positive achievement
results. The researcher used multiple regression analyses to analyze the effects of
computer technologies and other variables on student achievement. Johnson used the
1998 National Assessment of Educational Progress (NAEP) database on reading to
analyze the influence on academic achievement in reading. Johnson's findings established
that on the NAEP reading test, in fourth and eighth grades, the variable for computer
instruction was not statistically significant, indicating no effect on the academic
achievement of students. The researcher also noted that the results of other studies were
questionable because they overlooked the instructor's capabilities.
Also on the other side of the debate are researchers who support the findings of
Mayer, Heiser, and Lonn (2001) who indicated that learners can be "overloaded by
multisensory input that may lead to a decrease in learning. Mayer (2001) also observed
that the methods used in instructional programs, not the delivery method, influence
learning.
Tienken and Maher (2008) researched differences in student achievement on a
state standard test for students in eighth-grade mathematics. The study of 121 students
from a population of 284 focused on the effect of CAI on achievement. The researchers

found that there was no statistically significant improvement in student achievement
scores based on the CAI intervention for this group. Using the Glass (1976) formula, the
effect size calculation was 1.53 and favored the control group in the 25th quartile.
Theoretical Framework
The use of classroom multimedia has had a diverse history in terms of theoretical
underpinnings. Select theories emphasize factors internal to the learner, while other
theories highlight external factors as the critical variables influencing knowledge
acquisition.
One theory regarding learning as a function of multimedia usage is grounded in
the active learner operating in a constructivist environment. The learner uses the
environment, both video and traditional instruction, and integrates this information with
existing knowledge to create learning. For learning to take place, the learner must process
and incorporate information into his or her own cognitive process where the information
can then become a part of what Vygotsky (1978) named the zone of proximal
development.
Schiller (1999) concluded that "[tlhe use of computers in schools for teaching and
learning is best served by a constructivist approach to teaching and learning" (p. 5). Some
researchers also highlight relationships between internal and external cognitive
environments to examine how learning takes place.
Pea (1990) and Perkins (1990) discussed how external stimulus in the
environment can complement internal cognitive processes. The researchers noted that
these interactions between the external environment and the individual have learning

effects that last well beyond the interaction.
Theories also discuss how media-connected learners, with limited prior
knowledge, better connect with concepts that otherwise are difficult because of this
limited prior knowledge. Greeno (1989) researched how such knowledge between the
individual and the environment is processed based on prior knowledge.
Researchers have also noted that there must be a cognitive effort by the learner for
visual literacy to take place. Salomon (1983, 1984) noted that in addition to visual
literacy there must be visual attention, effort put forth, and active processing for learning
to take place. Solomon and Perkins (1989) also noted the necessity for active processing.
Hansen (2006) found that some learners reduce their cognitive efforts if the material is
familiar or believed to be understood. If a learner is already familiar with the material, the
effect could be reduced processing and therefore no learning.
Baggett (1989) concluded that information received by the learner visually and
verbally is actually processed differently in an individual's memory. The researcher
concluded that visual aspects, such as size, shape, and color, make the association more
memorable, thus positively impacting learning. This is also supported by research studies
(Baggett & Ehrenfuecht, 1982, 1983; Hayes & Kelly, 1984; Pezdek & Hartman, 1983)
that noted that the combination of audio and visual information resulted in more recall
than visual-only or audio-only presentations.
Baddeley (1986) created a working memory model that consisted of three
components: central executive, visuospatial sketchpad, and phonological loop (see Figure
4). According to this model, there are two locations for storage: the phonological loop
and the visuo-spatial sketchpad. The phonological loop is important in language

comprehension, reading, and vocabulary. The visuo-spatial location is used for visual and
spatial coding. The central executive is the command center that coordinates the retrieval
of information for further processing. The multimedia format for presentation of
instructional materials works to populate the visuo-spatial sketchpad and phonological
loop. Enhanced learning occurs as processing takes place in the central executive center.
Visuo-spatial Central executive Phonological sketchpad loop
Figure 4. Baddeley's working memory model.
Mayer (2001) called learning from both words and pictures multimedia learning.
Mayer's theory assumed that successful multimedia learning depended on the ability of a
person to select words and pictures from multimedia, organize, and integrate with prior
knowledge stored in long-term memory. The researcher based his theory on the workings
of the human mind and on what multimedia instruction should have to be effective in
learning. His theory used the work of Baddeley (1986, 1992, 1998) on working memory,
and Paivio (1986) and Clark and Paivio (1991) on dual channel coding. Figure 5 gives an
overview of how this process works. Words and pictures enter through the ears and eyes.
The learner must be attentive and select the words and images for further processing.
Next, the selected words and pictures must be organized into different knowledge

structures, which Mayer called verbal models and pictorial models. These two models
must then be integrated with each other by building connections between the verbal and
pictorial models using prior knowledge. Mayer called this process integrating.
Organizing, processing, and integrating do not necessarily occur in a linear manner, but
randomly. Once integrated, the learning is stored in long-term memory for future use.
The visual/pictorial channel processes animations, while the auditorylverbal channel
processes narrations.
WORKING MEMORY LONG-TERU
h r n 0 R T
Figure 5. Cognitive theory of multimedia learning (Mayer, 2001).
Mayer's theoretical model is based on three assumptions: a) the dual channel
assumption, b) the limited capacity assumption, and c) the active learning assumption.
The dual channel assumption is that humans have separate channels for processing
sounds and images. The limited capacity assumption is that people are limited in the
amount of information that can be processed by a channel at one time. The active
processing assumption is that people must be actively engaged to make meaning of the
inputs and create mental models. Active learning requires selecting relevant material,

organizing the material, and integrating the material into prior knowledge structures.
Mayer found that the effect of properly using the model led to what the researcher called
"the promise of multimedia learning" where "students can learn more deeply from well-
designed multimedia messages consisting of words and pictures than from more
traditional modes of communication involving words alone" (p. 125).
Sweller (1994) also researched a limitation similar to Mayer's, cognitive load
theory (CLT). CLT assumes a limited working memory connected to an unlimited long-
term memory. The researcher noted that a user has three possible types of cognitive load:
(a) intrinsic cognitive load (this is load caused by the structure and complexity of the
material being used), @) germane cognitive load (this is the load used by the learner's
effort to comprehend and process the information), and (c) extraneous cognitive load
(this load is overhead that does not contribute to an understanding of the material, for
example, sorting necessary information from extraneous information). Because these
three cognitive loads are being processed, less working memory is available to process
content. This provides limited working memory.
The theoretical aspects of dual channel learning and memory, when coupled with
the multichannel presentation in a multimedia presentation, form the basis for the study
of possible relationships in this research. Given the inherent multichannel presentation of
multimedia materials, what (if any) relationship exists between multimedia presentation
and student learning as measured by student achievement on the TAKS test? A majority
of the researchers cited identified the need for additional studies not only to clarify
conflicting research but also to examine current findings relative to variance in student
learning styles and methodological differences in instructional presentation. This research

project with PV will in part fulfill the need for additional quantitative research. Figure 6
depicts the theoretical framework for this study.
Summary of Chapter 2 and Description of Chapter 3
Chapter 2 reviewed research and literature concerning the use of media in the
classroom, how the instruction was used, the effectiveness of video, and its effect on
student learning and student achievement.
In chapter 3, the researcher details the design, methodology, and specific
procedures used to collect and analyze the data collected in this study.

Limited Capacity
Multimedia
Presentations
a Images
Organizing
Pictures and Images
Words C Organizing
Words and Sounds
I Organizing and integrating dual I channels
n INCREASED LEARNING m
Figure 6. Theoretical framework for Power Videos study.

Chapter 3: Design and Methodology
Introduction
This research study was a nonexperimental, correlational evaluative study
designed to determine what relationships existed between the use of a DCS-owned
program, PV, and student achievement. DCS provided the PV program to all independent
schools in Dallas County, Texas. The researcher analyzed data to assist administrators in
prioritizing investments. The purpose of this study was to obtain valid and reliable
information to allow school administrators to make informed decisions for data
management, student achievement, and budget requirements. Administrators needed data
to assist in prioritizing programs that continue to receive funding because of the scarce
financial resources available. A primary concern was to determine if monies are best
spent in select PV products subject areas that have a positive statistical correlation to
student achievement, or if resources are better used to support other products. The results
of this study provided essential data for DCS leadership to make more informed
decisions.
This study provides data to determine what relationships existed between the use
of PV in a sample of elementary classrooms of schools located in Dallas County, Texas,
and student achievement as measured by the Texas Assessment of Knowledge and Skills
(TAKS) test.
Data for PV usage were collected from standard reports generated by DCS and
available on the DCS Web site. All documents existed in the public domain, and none
contained data identifying individual students. Sampling from the population of 373

schools continued until 61 campuses had been identified that met the criteria regarding
exclusion of specialty schools, SES, LEP, and class size.
As recognized by Johnson (2001), "Nonexperimental quantitative research is an
important area for research for educators because there are so many important but non-
manipulative variables needing further study in the field of education" (p. 3). The
purpose of this study was to obtain valid and reliable information to make informed
decisions for data management, student achievement, and budget requirements. This
information was used as one factor to assist administrators in prioritizing budget funds to
best affect student achievement.
Research Design
Researchers have discussed distinctions between causal-comparative research and
correlational research to determine appropriate research methods for the question or
problem being stated. "Correlational research involves collecting data in order to
determine whether, and to what degree, a relationship exists between two or more
quantifiable variables" (Gay & Airasian, 2000, p. 321). The use of correlational analysis
advances the intent of this research, namely to determine what relationships exist
between the use of PV and student achievement, and the power of these relationships, but
not to determine or imply any cause-and-effect relationships.
Charles (1998) argued that causal-comparative research "strongly suggests cause
and effect" (p. 305) while correlational research "examines the possible existence of
causation" (p. 260). Charles's position is not universally accepted. Johnson (2001)
presented a compelling argument that "the two terms [causal-comparative and

correlational] ultimately suggest a false dichotomy as they are presented in popular
educational research texts" (p. 11).
This correlation analysis enhances the ability of DCS management and school
board members to reach better informed conclusions regarding expenditures of public
monies. The analysis and use of the correlation coefficient squared (2) enable decision
makers to understand better the extent to which PV contribute to helping a campus's
students meet TAKS standards. Unlike many multivariate correlational studies that are
designed to generate a prediction equation, this study uses a design that matches the data
obtained with the decisions that must be made. Stated another way, information produced
by this study should better position DCS executive staff to make decisions regarding
fiscal matters associated with PV than a prediction formula.
Research Questions
Question I . What were the relationships (if any) between teachers' usage of the
DCS PV product on a campus and the performance of students on that campus on the
TAKS test in reading?
Question 2. What were the relationships (if any) between teachers' usage of the
DCS PV product on a campus and the performance of students on that campus on the
TAKS test in math?
Question 3. What were the relationships (if any) between teachers' usage of the
DCS PV product on a campus and the performance of students on that campus on the
TAKS test in science?
Question 4. What were the relationships (if any) between teachers' usage of the

DCS PV product on a campus and the performance of students on that campus on the
TAKS test in all tests?
Hypothesis
The null hypothesis underlying this nonexperimental quantitative study is Ho = p
= 0, indicating that the results are due to chance such that there is no patterned influence
of the use of PV in the classroom on student achievement. If the null hypothesis is
proved, no statistically significant correlation exists between the use of PV and student
achievement. The alternative hypothesis is HA= p # 0, indicating that the results are not
due to chance. Regardless of the outcome, the information obtained is used as one factor
in the determination of tax dollars to be spent on the program.
Research Methods
The researcher collected data regarding TAKS performance to determine student
achievement from the TEA Web site. Data for PV usage were collected from the DCS
Web site from standard reports. All documents existed in the public domain, and none
contained information identifying individual students; therefore, the researcher received
approval to collect data via an exemption from the Institutional Review Board (Appendix
B). K-6 schools were randomly selected by a random number generator from the
population of 373 schools and included in the study. Specialty schools-such as gifted
and talented magnet schools and dedicated disciplinary/juvenile justice centers if
identified in the random selection process-were excluded from the study, and the next
identified school replaced the specialty school in the final sample.

Variable one in each correlation was the extent of use of the PV product, which,
as indicated earlier, is defined as the percentage of the total teacher population on a
campus that had either downloaded andlor streamed a DCS Power Video product during
the 2006-2007 school year. Variable two was the percentage of students meeting TAKS
requirements in reading, math, science, and all-tests areas. Pearson r values were
generated for the following comparisons: Power Video usage vs. elementary TAKS
scores-reading, Power Video usage vs. elementary TAKS scores-math, Power Video
usage vs, elementary TAKS scores-science, and Power Video usage vs. elementary
TAKS scores-all tests.
The Pearson r values were analyzed to test the significance ( p 5.05) of each value to
determine how the relationships identified differed from what would be expected in the
general population. All statistical analyses were completed using the SPSS software, with
SPSS programmed to evaluate the Pearson r value using a two-tailed test.
The 3 value was used to inform decision makers how much of the variance
between aggregate TAKS scores on the campuses sampled might be explained by the
extent of usage of the Power Video product.
Discussion of Controls
Some controls needed to be used to address rival explanations for correlation
values found to be significant (p 5.05). "It is essential that we understand that what is
always important when attempting to make causal attributions is the elimination of
plausible rival explanations" (Johnson, 2001, p. 5). Johnson noted that plausible rival
explanations can be reduced by using correlational research.

In nonexperimental quantitative research, it is seldom possible to control for all
rival explanations for causal attributions via the manipulation of the variables. Therefore,
there must be clear definition of the parameters of the variables to narrow the possible
rival explanations.
In correlational research, confounding variables can produce results that may
skew research data. Possible confounding variables (e.g., by delimitations) must be
addressed by controls imposed by the researcher. Some of the often-researched variables
shown to relate to students' achievement are SES, language proficiency such as English
Language Learners (ELL), or LEP, and class size. Mitchell and Mitchell (1999) noted
that demographic variables, such as student poverty and language spoken, impacted
student achievement. Finn and Achilles (1999) reported that the Student Teacher
Achievement Ratio (STAR) experiment found that students in small size classes (n = 13-
17 students) in early grades consistently showed substantial academic gains over their
randomly assigned counterparts in regular-size classes (n = 22-25 students).
In the present study, the variables of SES, language factors, and class size, if
uncontrolled, could provide rival explanations for any positive findings. Therefore, the
following controls were used to address the following key areas.
Socioeconomic status (SES). Existing research has established a positive
relationship between SES and achievement. Chall(1996) analyzed data from the NAEP
reading results and Scholastic Aptitude Test (SAT) scores over time and found large
differences between higher and lower SES children. In a study from the Second
International Mathematics Study (SIMS), Payne and Biddle (1999) found that the United
States would have ranked only above Nigeria and Swaziland if all high-poverty schools

were included in the study. Indeed, the U.S. Department of Education, in The
Longitudinal Evaluation of School Change and Performance (LESCP) in Title I Schools
(2001), found that individual and school poverty had negative effects on student
achievement. The report noted that students in schools with the highest percentages of
poor students performed worse on both reading and mathematics tests. To minimize the
issue of SES in the present research, the researcher included only those campuses where
the percentage of economically disadvantaged students fell within * one (1) standard
deviation of the State of Texas mean for economically disadvantaged students in major
urban areas as reported in the AEIS database. Texas defines economically disadvantaged
students as those who are (a) eligible for free meals, (b) eligible for reduced meals, (c)
students from families with annual incomes at or below the official poverty line, (d)
students eligible for Temporary Assistance to Needy Families (TANF) or other public
assistance, (e) students who receive a Pel1 Grant or comparable state program of need-
based financial assistance, (t) students eligible for programs assisted under Title I1 of the
Job Training Partnership Act (JTPA), and (g) students eligible for benefits under the
Food Stamp Act of 1977.
Language factors. The State of Texas defines a student of LEP in the Texas
Education Code (TEC) Chapter 29.052 to mean "a student whose primary language is
other than English and whose English skills are such that the student has difficulty
performing ordinary class work in English." Haney (2000) noted significant impacts on
the Texas Assessment of Academic Skills (TAAS), a precursor of the current state test
(TAKS), for Hispanic students. Haney concluded that the TAAS test had discriminatory
impacts on Hispanic students. In 2002, the TEA conducted a longitudinal cohort study

that reported evidence of a gap in performance between LEP and non-LEP students in
meeting the exit-level testing requirements. Current information available on the
performance of LEP students in Texas schools was found on the statewide AEIS report,
indicating LEP student performance on the TAKS test was among the lowest of eight
reported disaggregated student groups (TEA, 2006). According to Canale (1981), English
language proficiency is an important contributor to the differences in academic
achievement between Hispanic-language speakers and native English-language-speaking
students. To address the issue of LEP, this researcher included only those campuses
where 250% of students were proficient in English as identified in the State of Texas
AEIS reports.
Class size. The State of Texas provides guidelines regarding pupil-teacher ratio
(PTR). These are defined in TEC Chapter 25.1 1 1, which states that "each school district
must employ a sufficient number of teachers certified under Subchapter B, Chapter 21, to
maintain an average ratio of not less than one teacher for each 20 students in average
daily attendance." While the State of Texas has promulgated guidelines regarding PTR,
the state has not developed guidelines regarding class size. In this study, the researcher
used only class size information, not PTR. Research has indicated that class size has an
impact on student achievement. For example, Finn and Achilles (1999), in the STAR
experiment, noted that small class size (n = 13-17 students) affects student achievement.
Also, Achilles and Finn (2000) noted that students who were in smaller classes in the
early grades for sufficient duration, each day every day, assigned randomly to cohorts,
realized lasting academic and social benefits. Muennig and Woolf (2007) noted that
investments to address underlying conditions, such as class size, a u l d lead to cost

savings and lasting social benefits. Only those campuses where average class size was
within * one standard deviation of the average class size for elementary schools in major
urban areas, as determined using the AEIS reports, were included in the study.
Step-by-step Procedures
The following steps were followed in the study:
Step 1: Identification of campuses for inclusion in study. A random number table
was produced from an Internet-based random integer generator programmed to provide a
sequence of random numbers, sampling between 1 and 373, a range defining the alpha
listing of all potential elementary schools served by DCS. The number generator
produced numbers within a range unique to the identifiers of all Dallas County
elementary schools. As schools were identified, unless excluded as a specialty school or
as stipulated by a specific delimitation, such as SES, class size, or LEP, the campus was
considered as having been selected for the study. Sixty-one elementary (K-6) campuses
were identified in this manner for the study.
Step 2: Collection of data regarding 2006-2007 TAKSscores. The Texas
Education Agency (TEA) Web site was accessed, and campus TAKS data regarding the
percentage of students meeting TAKS requirements in the specified areas were obtained
fiom the AEIS reports. Percentile scores were converted to normal curve equivalents
(NCE), i.e., interval data, before data analysis.
Step 3: Collection of data regarding 20062007 PV usage. The DCS PV Web site
was accessed, and campus data regarding the percentage of teachers using PV products
obtained.

Step 4: Correlation analysis. Individual correlation coefficients were generated in
the four areas specified using the SPSS software. Scatter plots were produced to assist in
data interpretation. Pearson r values were tested for significance using the SPSS software
and two-tailed test.
Step 5: Generation of? values. Pearson r values were squared to yield
information regarding the extent to which variation in the campus TAKS scores can be
attributed to the use of PV on the campuses.
Step 6: Discussion. All data generated in the study were reviewed, and
conclusions were drawn regarding the relationship between PV products and the ability
of elementary students to meet TAKS standards in the areas of reading, math, science,
and all tests. Inferences were drawn, and implications for decision makers were
discussed.
Step 7: Results compared. Results of the present analysis were compared to prior
work as reported in chapter 2 as a basis for conclusions.
Summary of Chapter 3 and Description of Chapter 4
Chapter 3 described the research design and the methods for data collection and
analysis. The chapter gave a detailed step-by-step process for this study.
Chapter 4 provides a detailed statistical analysis of the data collected in this study.
The chapter also summarizes the findings.

Chapter 4: Data Analysis
In this study, the researcher analyzed data to assist administrators in prioritizing
investments. The purpose of this study was to obtain valid and reliable information to
allow school administrators to make informed decisions for data management, student
achievement, and budget requirements. With the scarce financial resources available,
administrators need data to assist in prioritizing programs that continue to receive
funding. A key concern was to determine if monies are best targeted to select PV
products subject areas that have a positive statistical correlation to student achievement,
or if resources are better used to support other products. The results of this study provided
essential data for DCS leadership to make clearer decisions.
This study provides data to determine what relationships existed between the use
of PV in a sample of elementary classrooms of schools located in Dallas County, Texas,
and student achievement as measured by the TAKS test. The 61 schools included in the
study were selected on a random basis. AAer selection, campus information was obtained
from the TEA Web site. The information contained not only test scores but also
information about class size, demographics, and SES. Appendix E provides an example
of the information available to the researcher for analysis.
The data were analyzed using SPSS 16.0 software. The quantitative findings of
the study were derived from a correlational analysis of the percentage of teachers on a
campus using PV and the achievement of that campus on the state-mandated TAKS test.
Variable one in each correlation was the extent of use of the PV product. Variable two
was the percentage of students meeting TAKS requirements in the reading, math, science,
and all-tests areas.

The analysis was conducted using Pearson's r as a descriptor of the degree of
linear association between the two variables. Pearson's r ranges in value from -1 to + I .
When it is near zero, there is little correlation, but as it approaches -1, a strong negative
relationship exists. As Pearson's r approaches +I, a strong positive relationship exists
between the variables. Cohen (1988, 1992) gave a rule of thumb regarding interpreting
the magnitude of the relationships: small = 0.1, medium = 0.3, and large = 0.5 or greater.
Research Question 1
What were the relationships (if any) between teachers' usage of the DCS PV
product on a campus and the performance of students on that campus on the TAKS test in
reading?
The first correlation analysis computed was the percentage usage of PV and the
achievement on the reading section of the TAKS test. As noted in Table 8, the Pearson
correlation was 0.258, which was statistically significant at thep 1.044 level. This
indicates that in the area of achievement on the reading portion of the TAKS test, a small-
to-medium relationship exists.
Inspection of the scatter plot (Figure 7) indicates that the Pearson r value
generated by a comparison of PV usage and reading TAKS scores indicates a small-to-
medium correlation. Calculating the coefficient of determination (the 2 value) indicates
that approximately 6.7% of the variance between student aggregate TAKS reading scores
could be explained by the extent of usage of the PV product.

Table 8 Power Video Usage vs. Elementary TAKS Scores-Reading -
Correlations
I
PV usage Pearson correlation
Sig. (2-tailed)
Sum of squares and cmss-
D ~ O ~ U C ~ S
I Covariance
I Reading NCE Pearson correlation
I Sig. (2-tailed)
I Sum of squares and cross-
I products
I Covariance
I * Correlation is significant at the 0.05 level (2-,
'V 7 usage Reading NCE

ReadingNCE
Figrrre 7. Scatter plot of Power Video usage vs. elementary TAKS scores-Reading.
Research Question 2
What were the relationships (if any) between teachers' usage of the DCS PV
product on a campus and the performance of students on that campus on the TAKS test in
math?
The second correlation analysis computed was the percentage usage of PV and the
achievement on the math section of the TAKS test. As noted in Table 9, the Pearson
correlation was 0.301, which was statistically significant at thep 1019 level. This

indicates that in the area of achievement on the reading portion of the TAKS test, a
medium relationship exists.
The scatter plot (Figure 8) shows that the Pearson r value generated by
comparison of PV usage and math TAKS scores indicates a medium correlation.
Calculating the 2 value indicates that approximately 9.1% of the variance between
student aggregate TAKS math scores could be explained by the extent of usage of the
Power Video product.
Table 9 Power Video Usage vs. Elementaw TAKS Scores-Math
PV usage Pearson wrrelation
Sig. (2-tailed)
Sum of squares and cross-
products
Covariance
N
Math NCE Pearson correlation
Sig. (2-tailed)
Sum of squares and cross-
products
Covariance
I '. Correlation is significant at the 0.05 leve
'V 7 usage Math NCE

MathNCE
Figure 8. Scatter plot of Power Video usage vs. elementary TAKS scores-Math.
Research Question 3
What were the relationships (if any) between teachers' usage of the DCS PV
product on a campus and the performance of students on that campus on the TAKS test in
science?
The third correlation analysis computed was the percentage usage of PV and the
achievement on the science section of the TAKS test. As noted in Table 10, the Pearson
correlation was 0.185, which was not statistically significant at thep 1.05 level. This

indicates that in the area of achievement on the science portion of the TAKS test, no
measurable relationship exists.
A review of the Figure 9 scatter plot for PV usage versus science scores supported
the conclusion that outliers had no real impact on the Pearson r value. Schools with only
limited PV usage (less than 25%) produced some of the highest scores on the science
portion of the TAKS test. Alternately, schools with "mid-to-high range" PV usage
produced midrange TAKS scores. Finally, schools with no appreciable PV usage yielded
exceptionally low TAKS pass rates.
Table 10 Power Video Usage vs. Elementary TAKS Scores-Science
Correlations
PV usage Peanon correlation
I Sig. (2-tailed)
I Sum of squares and uoss-
I products
Covariance
I Sig. (2-tailed)
I Sum of squares and uoss-
I products

ScienceNCE
Figure 9. Scatter plot of Power Video usage vs. elementary TAKS scores-Science.
Research Question 4
What were the relationships (if any) between teachers' usage of the DCS PV
product on a campus and the performance of students on that campus on the TAKS test in
all tests?
The fourth correlation analysis computed was the percentage usage of PV and the
achievement on the all-tests section of the TAKS test. As noted in Table 11, the Pearson
correlation was 0.298, which was statistically significant at thep 1.019 level. This

indicates that in the area of achievement on the all-tests portion of the TAKS test, a
medium relationship exists.
The scatter plot (Figure 10) shows that the Pearson r value generated by
comparison of PV usage and all-tests TAKS scores indicates a medium correlation.
Calculating the ? value indicates that approximately 8.9% of the variance between the
student aggregate TAKS all-tests scores could be explained by the extent of usage of the
PV product.
Table 11 Power Video Usage vs. Elementary TAKS Scores-All Tests
Correlations
PV usage Pearson correlation
Sig. (2-tailed)
Sum of squares and cmss-
products
Covariance
N
All Test NCE Pearson correlation
Sig. (2-tailed)
Sum of squares and cmss-
products
Covariance
N
'. Correlation is significant at the 0.05 level (2-tailed).
'V usage
1
3.378E4
563.033
61
,298'
,020
4.181 E3
69.677
61
In that the all-tests comparison represents an aggregate of reading, math, and science, the
Pearson r value being significant is not unexpected since the reading and math scores
All Test NCE
,298'
,020
4180.61 1
69.677
61
1
5843.672
97.395
61

indicated statistical significance.
Figure 10. Scatter plot of Power Video usage vs. elementary TAKS scores-All tests.
Summary ofResults
The hypothesis of this nonexperimental quantitative study was stated as Ho = p =
0, indicating that the results are due to chance such that there is no patterned influence of
the use of PV in the classroom on student achievement. The null hypothesis was rejected
in the reading, math, and all-tests areas. Statistically significant correlations existed
between the use of PV and student achievement in the reading, math, and all-tests areas
of the TAKS test.
The null hypothesis was proved in the area of science on the TAKS tests. No
statistically significant correlations exist between the use of PV and student achievement
on the science portion of the TAKS test.
Summary of Chapter 4 and Description of Chapter 5
Chapter 4 provided a detailed statistical analysis of the data collected in this
study. The chapter also summarized the findings.
Chapter 5 includes the summary of findings from the data analysis in chapter 4.
This chapter also includes conclusions relating to the findings of the study. Chapter 5
concludes with recommendations for practices and policies and future research regarding
the use of media in the classroom.

Chapter 5:
Summary of Findings, Conclusions, Discussion, and Recommendations
Introduction and Research Questions
The primary purpose of this study was to provide data to inform the leadership
how to best allocate scarce financial resources. The study provided data to assist decision
makers to determine if PV products, or specific subject areas, have a positive statistical
correlation to student achievement as measured by the TAKS test. Sixty-one schools
were randomly selected for inclusion in the study.
The study was a nonexperimental, correlational evaluative study designed to
determine what relationships existed between the use of a DCS-owned program, PV, and
student achievement.
Possible confounding variables were addressed by controls imposed by the
researcher. The researcher set specific controls for SES, LEP, and class size.
Additionally, because of the number and extent of controls put in place, the researcher
released a control if 70% of the population was excluded in order to reach the sample
size. In this study, SES reached the sample size exclusion control and was released.
Controls for LEP and class size remained in the study.
Pearson r values were used to test the significance ( p 5.05) of each value.
These determined if any relationships identified differed from what would be expected in
the general population. SPSS software was used to complete all statistical analyses. SPSS
was programmed to evaluate the Pearson r value using a two-tailed test. The study had a
single hypothesis with multiple research questions. The four research questions asked

were as follows: What were the relationships (if any) between teachers' usage of the DCS
PV product on a campus and the performance of students on that campus on the TAKS
test in reading? What were the relationships (if any) between teachers' usage of the DCS
PV product on a campus and the performance of students on that campus on the TAKS
test in math? What were the relationships (if any) between teachers' usage of the DCS
PV product on a campus and the performance of students on that campus on the TAKS
test in science? What were the relationships (if any) between teachers' usage of the DCS
PV product on a campus and the performance of students on that campus on the TAKS
test in all tests?
Summary of Findings
This study supported the alternative hypothesis that relationships existed
between the use of Power Videos in the classroom and student achievement in specific
subject areas. In one subject area, the hypothesis was not rejected.
The first correlation analysis computed was the percentage usage of PV and the
achievement on the reading section of the TAKS test. This correlation was statistically
significant at thep 1 0 4 4 level. In the area of achievement on the reading portion of the
TAKS test, a small-to-medium relationship existed.
The second correlation analysis computed was the percentage usage of PV and the
achievement on the math section of the TAKS test. This correlation was statistically
significant at thep 2.019 level. In the area of achievement on the math portion of the
TAKS test, a medium relationship existed.
The third correlation analysis computed was the percentage usage of PV and the

achievement on the science section of the TAKS test. This correlation was not
statistically significant at thep 1.05 level. In the area of achievement on the science
portion of the TAKS test, no measurable relationship existed. The null hypothesis was
proved in the science portion of the test.
The fourth correlation analysis computed was the percentage usage of PV and the
achievement on the all tests section of the TAKS test. This correlation was statistically
significant at thep 5019 level. In the area of achievement where all students passed each
section of the TAKS test, a medium relationship existed.
The results indicated that there are relationships between the use of PV in the
classroom and student achievement in math, reading, and all-tests areas. The results also
indicated there are no significant relationships in the area of science student achievement
and the use of PV.
Conclusions and Discussion
The majority of the studies cited in the research, theory, and literature review
found that there are small-to-moderate gains in overall student achievement when
computer technologies, including media, are used in the classroom. Clearly, the impact of
media, and specifically the PV product, upon academic achievement is an extremely
complex relationship. Multiple variables are involved in determining student achievement
and success. Some of these variables provide additional opportunities to craft future
studies to add to the research base. Factors such as teaching philosophy, teacher
knowledge and skills, the cumculum, and student social factors are a few variables that
can be expanded to better understand the effects of media upon student achievement. As

this study suggested, media may be more suitable for some content areas than others in
affecting student achievement.
Implications from this study suggest media had a positive relationship as a factor
in the achievement of students in specific subject areas. Based on this finding, there are
other implications for policymakers at the local and state levels. Administrators must use
data for this and other studies to balance the cost-benefit of technology tools such as PV.
The study achieved the purpose for which it was intended. This study provided
additional information to use with other data to determine what investments should he
made in the PV product. This data provided specific information about possible subject
areas to prioritize the investment of video materials. With the study highlighting the areas
of reading and math, the administration can now focus on further improving the library in
those areas.
The investment in the PV product is not simply an investment in digitizing and
linking to the state TEKS standards. A factor in the investment equation is the
infrastructure used for PV, and used for other Internet access, such as the DCS Online
Continuing Education program; therefore, fiscal decisions are not one-dimensional but
rather multifaceted and complex. DCS currently spends more than $1,000,000 a year in
infrastructure to support the product.
With the enormous potential of the Internet comes great opportunity, but also
great challenges. One of the greatest challenges is not what or how many tools the
Internet can provide but how to effectively use the resources in the classroom. Lepani
(1997) predicted that the Internet and tools from technology would transform education
and the classroom. The researcher stated that the classrooms would become "hi-touchhi-

tech local hubs of the network of lifetime learning services" (p. 12). As noted in this
study, numerous researchers indicated that this issue must be a policy consideration.
These results also highlight the opportunity for some additional recommendations
to even further clarify the use of PV in the classroom. These clarifications also will
further research on the effect of media usage on student achievement.
Recommendations
One public policy consideration involves balancing how much, when, and how
tools, such as PV, should be implemented. A major concern is how to ensure educators
are technically and professionally prepared for this challenge. This factor, as the literature
suggested, is tied to the professional development of teachers. Multiple researchers
reviewed in this study (Wenglinsky, Reeves, and others) noted that implementation by
the teacher was a factor in attaining positive results. Collis et al. (1996) summarized this
need in an international study of student and teachers:
Teachers are the main gatekeepers in allowing educational innovations to
diffuse into the classrooms. Therefore one of the key factors for effecting
an integration . . . is adequate training of teachers in the handling and
managing these new tools in their daily practices. (p. 3 1)
Public policy must address this issue in the next administration. Technology Counts
(1999) pointed to the fact that after two decades of integrating technology into the
classroom, teachers did not feel prepared to use the tools in meaningful ways. A
significant investment has been made in providing professional development to teachers
and campuses in using PV. During the year, DCS staff members conduct on-site staff

development throughout the county for best use of the product. A thorough review of the
training and practices used should be completed to ensure the training is meeting the
needs of the educators.
One recommendation for DCS to implement on a local level is to survey how
closely teachers using the PV product approximate a best practices approach to product
usage. This also addresses this study's discussion as noted by Collis et al. (1996) that
mandates a requirement for adequate professional development for educators to
effectively integrate these tools into the classroom setting. Users, upon entering the PV
Web site, have access to links on the site detailing using video in the classroom and
recommended practices for classroom media. This detailed information provides tools for
educators to ensure a quality learning experience and a well-integrated use of media in
the classroom. The areas associated with the survey would include the following: (a)
Ensure that the video is included as a part of the lesson and clearly identify the intent of
using that specific video. (b) Determine the educational value of the video. Does the
video provide for learning in the cognitive domain as well as the affective domain? (c)
Preview the tape. For this item, a survey question would determine if the user in fact
previewed the tape or simply thought it looked good and presented it to the class without
previewing it first. (d) Prepare the students for the tape by including lead-in activities
such as reviewing key concepts or key vocabulary terms. Previewing activities such as
distributing focus questions could also be determined. (e) Ensure that the physical
environment is conducive to learning. For this item, the survey could question if the
lights were left on so that the students were alert and could take notes. (f) Segment the
viewing. As an important concept was introduced, did the teacher stop the video to point
out important information? (g) After the viewing, did the teacher discuss the video with
the students? The survey could determine if the teacher used the video to practice critical
thinking. (i) Integrate the concepts into other activities planned in the curriculum.
Another tool on the Dallas County School's Web site that addresses this policy
issue is recommended practices for use of media in the classroom. A second
recommendation is to ensure all teachers are trained with this tool. This tool highlights 14
different considerations when using video:
Intent. For the teaching tools to be used effectively, the teacher should choose a
video that complements or expands on a specific teaching objective. A video can he used
to help engage learners. The video can also expand learning by using two or more forms
of presentation. The video also reaches the strong auditory and visual learners.
Educational value. Educational videos are important as a tool in the development
of intellectual skills, abilities, and thinking skills in the cognitive domain. Students'
feelings, attitudes, values, and emotions in the affective domain are also promoted.
Preview media. Preview each video item before showing to a class.
Build schemata. Use Bloom's taxonomy of knowledge, comprehension,
application, analysis, synthesis, and evaluation to build the background.
Note speciJic items. Select specific items from the video for the students to pay
particular attention.
Emphasize skills. Review listening skills and listening behavior. Give examples to
students on how to listen to gain information from the video. Have students retell specific
parts of the video.
Importance of visual literacy. Jean Lee (1998) noted, "In Mind and Media

(Harvard University Press, 1984), Patricia Greenfield pleads that visual literacy must
become as important as print literacy, and that teachers must develop special programs to
turn children from passive into active consumers of visual materials."
Literature as basis for videos. Rothlein and Meinbach (1991) noted:
Our literature incorporates all that we are and all that we hope to be. It includes
the knowledge of ages past and present and dares us to imagine the future.
Literature is the perfect vehicle for making connections as we strive to understand
our world and our place in it. Literature can help bridge the gap between
classroom lessons and reality, adding additional perspective to the curriculum and
giving dimension to concepts and themes being taught. Literature, no matter what
the genre, easily adapts to any theme being taught. A thematic approach is one in
which a variety of materials, activities, and content areas all combine to teach a
specific concept, idea, or theme. A thematic approach offers a multi-disciplinary
as well as an interdisciplinary approach to learning.
Multicultural education. Herrera (1996) stated that "incorporating a multicultural
perspective into the existing curriculum can be achieved best through the use of literature.
Through literature, students are able to reflect not only on their own culture, but on the
cultures of other ethnic groups" (p. 23). Community resources, videotapes, and other
visual materials can be used to familiarize students with ethnic customs, languages,
music, and dress.
Teaching the English language. The use of videos in the classroom is also an
excellent means for reinforcing difficult concepts, especially for limited English learners.
Video can be used as a means to experience the language in the context of the culture.

This meaningful expression of the language is seen in real contexts and becomes the basis
for language learning.
Comprehension strategies. Comprehension strategies should also be used to bring
me'ming to the video: (a) develop literal meaning by recognizing details and sequential
order, (b) develop global meaning by analyzing and discussing what was seen and
identifymg the main idea, (c) develop inferential meaning via strategies that determine
cause and effect, predicting the outcomes, and drawing conclusions, and (d) evaluate the
video.
Follow-up. Follow-up with questions that relate to the teaching objectives.
Cue video before class. Ensure that if only using clips of the video that the clips
are cued and ready to start.
Keep records. Include in the lesson plans titles and segments of the videos that are
to be used with each unit.
A survey could determine if users integrated these practices into the use of the
product. Once the survey has been developed, future researchers could design a study to
determine if teachers actually followed these recommendations and if maintaining fidelity
to best practices yielded more favorable outcomes, i.e., determine if those additions
provide stronger correlations.
Also, a study could be repeated at the high school level to determine if the results
changed based on different grade levels. The current study analyzed only data associated
with elementary schools. Some of the research reviewed noted that sample size effects
were higher in elementary grades than in secondary and high schools. This would be an

additional tool for administrators to further scrutinize spending and potentially prioritize
spending in the grade levels and subjects with the higher correlational relationships.
Specific teacher demographics, such as years of teaching experience, master
teacher status, and educational level achieved, could be used in a new study to determine
if the results are different for different teacher demographics.
The effect of media to motivate students is another area of possible research. A
relationship existed between higher uses of PV and student achievement. Is there also a
relationship between use of PV and increased student motivation? A survey of teacher
and student perceived engagement could add to the existing research base.
Future studies could also include a qualitative survey of specific subject areas for
teachers to provide data regarding how the media is integrated into the general
curriculum and into a teacher's specific classroom. Tools for this qualitative survey are
available from the Institute for the Integration of Technology into Teaching and Learning
in Denton, Texas.
A number of the research studies reviewed also focused on the classroom
pedagogy and learning environment for successful use of technology tools in the
classroom. Roschelle and Pea (1990) found that traditional classrooms often do not
provide the structure or resources for learning, but technology can effectively enable
learning. Additionally, studies could be created to include a comparison of identified
constructivist classrooms and traditional classroom to determine if significant differences
exist.
This year, Dallas County Schools implemented mandatory training requirements
for anyone requesting access to PV. A study could be conducted in 2-3 years after

implementation of the mandatory training requirements to determine if the results would
differ.
Also, this study could be repeated in the science area by including an analysis of
all science titles used by teachers. This could help establish if the lack of usage of science
titles may be an additional factor in the finding of this study that no correlations existed
in the area of science.
Each of these future studies would add to the existing research and help further
define possible relationships between the use of media in the classroom and the effect on
student achievement.

References
Achilles, C. M., & Finn, J. D. (2000). Should class size be a cornerstone for educational
policy? In M. C. Wang & J. D. Finn (Eds.), How small classes help teachers do
their best (pp. 299-323). Philadelphia: Temple University Center for Research in
Human Development in Education.
Aiex, N. (1999). Muss media use in the classroom. (ERIC Document Reproduction
Service Eric Digest D-147, No. ED436016)
Azevedo, R., Shaw, S. G., & Bret, P. M. (1995, April). The eflectiveness of computer-
based hypermedia teaching modules for radiology students. Paper presented at the
annual meeting of the American Educational Research Association, San
Francisco, CA. (ERIC Document Reproduction Service No. ED 385187)
:ley, A. (1986). Working memory. New York: Oxford University Press.
Baddeley, A. (1992). Working memory. Science, 255,556-559.
Baddeley, A. (1998). Human memory. Boston: Allyn and Bacon.
Baggett, P. (1989). Understanding visual and verbal messages. In H. Mandl & J. Levin
(Eds.), Knowledge acquisition from text andpictures (pp. 101-124). Amsterdam:
North-Holland.
Baggett, P., & Ehrenfeucht, A. (1982). Information in content equivalent movie and text
stories. Discourse Processes, 5, 73-99.
Baggett, P., & Ehrenfeucht, A. (1983). Encoding and retaining information in the visuals
and verbals of an educational movie. Educational Communication and
Technology Journal, 31(1), 23-32.
Bain, A., Houghton, S., Sah, F. B., & Carroll, A. (1992). An evaluation of the application
of interactive video for teaching social problem-solving to early adolescents.
Journal of Computer-Based Instruction, 19(3), 92-99.
Barker, S. P. (1988). Comparison of effectiveness of interactive videodisc versus lecture-
demonstration instruction. Physical Therapy, 68(5), 699-703.
Barnes, W. G. W. (1 994, April). Constructing knowledge from an ill-structured domain:
Testing a multimedia Hamlet. Paper presented at the annual meeting of the
American Educational Research Association, New Orleans, LA. (ERIC Document
Reproduction Service No. ED 372743)
Beglau, M. (2005). Can technology narrow the black-white achievement gap? T.H.E.
Journal, 32(12), 13-17.
Blok, H., Oostdam, R., Otter, M. E., & Overmaat, M. (2002). Computer-assisted
instruction in support of beginning reading instruction: A review. Review of
Educational Research, 72, 101-130.
Boster, F. J., Meyer, G. S., Roberto, A. J., & Inge, C. C. (2002). A report on the effect of
the unitedstreaming (TM) application on educational performance. Cometrika,
Baseline Research, & Longwood University.
Boster, F. J., Meyer, G. S., Roberto, A. J., Lindsey, L., Smith, R., Strom, R., & Inge, C.
(2004). A report on the effect of the unitedstreamingflM) application on
educational performance: The 2004 Los Angeles UniJied School District
mathematics evaluation. Cometrika, Baseline Research, & Longwood University.
Canale, M. (1981). On some theoretical frameworks for language proficiency. In C.
Rivera (Ed.), Language projciency and academic achievement. Avon, England:
Multilingual Matters.

Cavanaugh, C. S. (1 999). The effectiveness of interactive distance education technologies
in K-12 learning: A meta-analysis. Unpublished manuscript. (ERIC Document
Reproduction Service No. ED430547)
Chall, J. S. (1996). American reading achievement: Should we worry? Research in the
Teaching of English, 30,303-3 10.
Chang, H., Honey, M., Light, D., Moeller, B., & Ross, N. (1998). The Union City story:
Education reform and technology students'pei$ormance on standardized tests.
New York: Education Development Center. (ERIC Document Reproduction
Service No. ED4241 08)
Charles, C. M. (1998). Introduction to educational research (2nd ed.). White Plains, NY:
Longman.
Chen, A. (1993). The use of interactive multimedia systems to improve the learning of
classroom practices. Education Research and Perspective, 20(2), 24-32.
Christmann, E., & Badgett, J. (1999). A comparative analysis of the effects of computer-
assisted instruction on student achievement in differing science and
demographical areas. Journal of Computers in Mathematics and Science Teacher,
18(2), 135-143.
Christmann, E., Badgett, J., & Lucking, R. (1997). Progressive comparison of the effects
of computer-assisted instruction on the academic achievement of secondary
students. Journal of Research in Computing in Education, 29(4), 325-337.
Clark, J. M., & Paivio, A. (1991). Dual coding theory and education. Educational
Psychology Review, 3(3), 149-170.
Clark, R. (1983). Reconsidering research on learning from media. Review of Educational

Research, 53(4), 445459.
Clark, R. (1 994). Media will never influence learning. Educational Technology Research
and Development, 42(2), 21-29.
Clarkson, P., Dunbar, A,, & Toomey, R. (1999). Whole school reform and the use of K T :
An evaluation of the navigator schools project. Melbourne, Australia: Department
of Education, Employment and Training.
Cohen, J. (1988). Statisticalpower analysis for the behavioral sciences (2nd 4.).
Hillsdale, NJ: Erlbaum.
Cohen, J. (1 992). A power primer. Psychological Bulletin, 112, 155-1 59.
Collis, B., Knezek, G., Lai, K., Miyashita, K., Pelgrum, W., Plomp, T., et al. (1996).
Children and computers in school. Mahwah, NJ: Erlbaum.
Cook, T. D., & Campbell, D. T. (1979). Quasi-experimentation. Boston: Houghton
MiMin.
Cotton, K. (1992). Computer-assisted instruction. Northwest Regional Educational
Laboratory. Retrieved October 26, 2008, from http://www.nwrel.org/scpdl
sirs/5/culO.html
Cowen, P. S. (1984). Film and text: Order effects in recall and social inferences.
Educational Communication and Technology Journal, 32(3), 131-144.
Cronin, X., & Cronin, K. (1992). A critical analysis of the theoretical foundations of
interactive video instruction. Journal of Computer-Based Instruction, 19(2), 37-
41.
DeMartino, D. J. (2001). Use of video mediated instruction in teaching American Heart
Association emergency cardiac care training courses. In Proceedings of ED-

MEDIA ZOO1 (World Conference on Educational Multimedia, Hypermedia &
Telecommunications) (pp. 388-392). Tampere, Finland.
Egan, M. W., Welch, M., Page, B., & Sebastian, J. (1992). Learners' perceptions of
instructional delivery systems: Conventional and television. The American
Journal of Distance Education, 6(2), 47-55.
English, L., Nason, R., & Duncan-Howell, J. (2007). Modelling within mathematical
online knowledge-building communities. In E. Hamilton (Ed.), Proceedings 2nd
International Distributed Learning and Collaboration Symposium. Singapore.
Finn, J. D., &Achilles, C. M. (1999). Tennessee's class size study: Findings,
implications, misconceptions. Educational Evaluation and Policy Analysis, 21(2),
97-109.
Fletcher-Flinn, C. M., & Gravatt, B. (1995). The efficacy of computer assisted instruction
(CAI): A meta-analysis. Journal ofEducationa1 Computing Research, 12(3), 2 19-
242.
Fletcher, J. D. (1990). Efectiveness and cost of interactive videodisc instruction in
defense training and education. Institute for Defense Analyses Paper P-2372.
Fullan, M., & Hargraves, A. (1996). What's worthfighting for in your school? New
York: Teachers College Press.
Gay, L. R., & Airasian, P. (2000). Educational research; An introduction (6th ed.).
Englewood Cliffs, NJ: Prentice Hall.
Glass, G. V. (1976). Primary, secondary, and metaanalysis of research. Educational
Researcher 5, 3-8.
Green, L. (1995). Math and science. IDRA focus. IDRA Newsletter, 22(2), 2-21.

Greeno, J. (1989). Situations, mental models, and generative knowledge. In D. Khahr &
K. Kotovsky (Eds.), Complex information processing (pp. 285-3 18) . Hillsdale,
NJ: Erlbaum.
Grimley, M. (2007). Learning from multimedia materials: The relative impact of
individual differences. Educational Psychology, 27(4), 465485.
Haney, W. (2000). The myth of the Texas miracle in education. Education Policy
Analysis Archives. Retrieved December 1,2007, from http://epaa.asu.edu/epaa/
v8n41/
Hansen, M. (2006). Instructional support for individual and collaborative demands on
net-basedproblem-solving in dyads. Freiburg im Breisgau, Germany:
Universitatsbibliothek. Retrieved April 8,2008, from http://www.freidok.uni-
freiburg.de/volltexte/283 11
Harwood, W. S., & McMahon, M. M. (1997). Effects of integrated video media on
student achievement and attitudes in high school chemistry. Journal of Research
in Science Teaching, 34,61743 1.
Hayes, D. S., & Kelly, S. B. (1984). Young children's processing of television: Modality
differences in the retention of temporal relations. Journal of Experimental Child
Psychology, 38,505-514.
Heikkinen, H. W. (1973). A study offactors influencing student attitudes toward the
study of high school chemistry. Unpublished doctoral dissertation, University of
Maryland.
Herrera, S. (1996). Multicultural education: Meeting the needs of ethnic minority
students. The Delta Kappa Gamma Bulletin, 63(1), 20-25.
Herron, C. A,, Cole, S. P., & Come, C. (1999). The effectiveness of a video-based
curriculum in teaching culture. The Modern Language Journal, 83, 5 18-533.
Hess, G. J., Jr. (1994, June). Strategies for integrating computer-based training in college
music theory courses. Paper presented at the EDMEDIA 94 World Conference on
Educational Multimedia and Hypermedia, Vancouver, British Columbia, Canada.
(ERIC Document Reproduction Service No. ED 388256)
Holden, A. M., & Holmes, G . H. (March, 1995). Multimedia simulation of the Internet.
Association for Business Communication: Southwest Region Proceedings.
Orlando, F1.
James-Shuler, J. (2008). The influence of a STAR- Wtechnology grant on mean scale
dzfferences measuring student achievement in language arts literaq among
elementary schools in New Jersey. Unpublished doctoral dissertation, Seton Hall.
Johnson, D. C., Cox, M. J., & Watson, D. M. (1994). Evaluating the impact of IT on
pupils' achievements. Journal ofcomputer Assisted Learning, 10, 138-1 56.
Johnson, K. (2000). Do computers in the classroom boost academic achievement? A
report of the Heritage Center for Data Analysis. Retrieved March 12,2007, from
http://www.heritage.org./Research/EducatiodCDAOO-O8.ch
Johnson, X. (2001). Toward a new classification of nonexperimental quantitative
research. Educational Researcher, 30(2), 3-13.
Kerlinger, F. N. (1986). Foundations ofbehavioral research (3rd 4 . ) . New York: Holt,
Rinehart, &Winston.
Koechel, L. (1970). Effects of the use of two visual methods in teaching college chemistry

to non-science majors. Unpublished doctoral dissertation, University of
Michigan-Ann Arbor.
Kulik, J. (1994). Meta-analytic studies of findings on computer-based instruction. In E. L.
Baker & H. F. O'Neil, Jr. (Eds.), Technology assessment in education and
training (pp. 9-33). Hillsdale, NJ: Erlbaum.
Kulik, J., & Kulik, C. (1991). Effectiveness of computer-based instruction: An updated
analysis. Computers in Human Behavior, 7(1-2), 75-94.
Large, A., Beheshti, J., Breuleux, A., & Renaud, A. (1995). Multimedia and
comprehension: The relationship among text, animation, and captions. Journal of
the American Society for Information Science, 46(5), 34&347.
Lee, J. (1998). Children, teachers and the Internet. The Delta Kappa Gamma Bulletin,
64(2), 5-9.
Lepani, B. (1997). The new learning architecture. Paper delivered at the National
Professional Development Program Seminar. Stanwick Park: Lateral Solutions
Liao, Y. (1998). Effects of hypermedia verses traditional instruction on students'
achievement: A meta-analysis. Journal of Research on Computing in Education,
30,341-359.
Mann, D., & Shafer, E. A. (1997). Technology and achievement. The American School
Board Journal, 48,22-23.
Matranga, A. (2007). Solving the mawscience riddle. T.H.E. Journal. Retrieved
February 1,2007, from http://www.thejoumal.com/articles/20162
Mayer, R. E. (1997). Multimedia learning: Are we asking the right questions?
Educational Psychologist, 32, 1-1 9.

Mayer, R. E. (2001). Multimedia learning. Cambridge: Cambridge University Press.
Mayer, R. E., Heiser, J., & Lonn, S. (2001). Cognitive constraints on multimedia
learning: When presenting more material results in less understanding. Journal of
Educational Psychology, 93(1), 187-1 98.
Meskill, C., Mossop, J., & Bates, R. (1999). Electronic text and English as a Second
Language environments (CELA Research Report). (ERIC Document
Reproduction Service No. ED436956). Retrieved June 22,2008, from
www.eric.ed.gov
Mitchell, D. E., & Mitchell, R. E. (1999). The impact ofCalifornia's class size reduction
initiative on student achievement: DetailedJindings from eight school districts.
Riverside, CA: University of California, California Educational Research
Cooperative.
Moallem, M. (2007). Accommodating individual differences in the design of online
learning environments: A comparative study. Journal of Research on Technology
in Education, 40(2), 21%247.
Muennig, P., & Woolf, S. H. (2007). Health and economic benefits of reducing the
number of students per classroom in US primary schools. American Journal of
Public Health, 97(1 I), 2020-2027.
Niemiec, R., & Walberg, H. J. (1987). Comparative effects of computer-assisted
instruction: A synthesis of reviews. Journal ofEducational Computing Research,
3, 19-37.
Paivio, A. (1986). Mental representation: A dual coding approach. New York: Oxford.
Payne, K., & Biddle, B. (1999). Poor school funding, child poverty, and mathematics

achievement. Educational Researcher, 28(6), 4-1 3.
Pea, R. (1990, April). Distributed intelligence and education. Paper presented at the
annual meeting of the American Educational Research Association, Boston, MA.
Perkins, D. (1990, April). Person plus: A distributed view of thinking and learning. Paper
presented at the annual meeting of the American Educational Research
Association, Boston, MA.
Pezdek, K., & Hartman, E. F. (1983). Children's television viewing: Attention and
comprehension of auditory versus visual information. Child Development, 54,
101 5-1 023.
Pisapia, J. R., Knutson, K., & Coukos, E. D. (1999, November). The impact of computers
on studentperformance and teacher behavior. Paper presented at the 44th annual
meeting of the Florida Educational Research Association (ERIC Document
Reproduction Service No. ED438323)
Reeves, T. C. (1 998). The impact of media and technology in schools: A research report
prepared for the Bertelsmann Foundation. Retrieved July 28,2006, from
http://www.athensacaderny.org~instruct~media - tech/reevesO.html
Riskin, S. R. (1 990). Teaching through interactive multi-mediaprogramming: A new
philosophy of the social sciences and a new epistemology of creativity. (ERIC
Document Reproduction Service No. ED327133)
Roberts, D. S. L., Cowen, P. S., & MacDonald, B. E. (1996). Effects of narrative
structure and emotional content on cognitive and evaluative responses to film and
text. Empirical Studies of the Arts, 14(1), 3 3 4 7 .

Roblyer, M. D., & Edwards, J. (2000). Integrating educational technology into teaching
(2nd ed.). Columbus, Ohio: Prentice-HallIMenill.
Rodney, D. (2002). Methods of evaluating educational technology. International Journal
ofZnstructiona1 Media, 29(4), 469-472.
Roschelle, J., & Pea, R. (1990). Situated learning: Computer-based multimedia analysis
of learning activities. Paper presented at the annual conference of the American
Educational Research Association, Boston, MA.
Rothlein, L., & Meinbach, A. (1991). Literature and the curriculum: A thematic
approach. Challenge, 44,5540.
Rowe, H. (1 993). Learning with personal computers: Issues, observations and
perspectives. Hawthorn, Victoria: The Australia Council for Educational
Research.
Salomon, G. (1983). The differential investment of mental effort in learning from
different sources. Educational Psychologist, 18,42-50.
Salomon, G. (1994). Interaction of media, cognition, and learning. Hillsdale, NJ:
Erlbaum.
Salomon, G., & Perkins, D. (1989). Rocky roads to transfer: Rethinking mechanisms of a
neglected phenomena. Educational Psychologist, 18,42-50.
Schiller, J. (1999). School leaders' competencies in using information technologies. The
International Principal, 5(2), 13-15.
Schluger, J., Hayes, J. G., Turino, G. M., Fishman, S., &Fox, A. C. (1987). The
effectiveness of film and videotape in teaching cardiopulmonary resuscitation to
the lay public. New York State Journal of Medicine, 87,382-385.

Schoonjans, F. (2008). MedCalcR for Windows (version 9.6.4.0) [Software].
Mariakerke, Belgium.
Schreibman, L., Whalen, C., & Stahmer, A. (2000). The use of video priming to reduce
disruptive transition behavior in children with autism. Journal of Positive
Behavioral Interventions, 2,3-11.
Sivin-Kachala, J., & Bialo, E. (1996). Report on the effectiveness of technology in
schools, '95-'96. Washington, DC: Software Publishers Association.
So, W., & Kong, S. (2007). Approaches of inquiry learning with multimedia resources in
primary classrooms. Journal of Computers in Mathematics and Science Teaching,
26(4), 329-354.
Soe, K., Koki, S., & Chang, J. M. (2000). Eflect of computer-assisted instruction on
reading achievement: A meta-analysis. Washington, DC: Oftice of Educational
Research and Improvement. (ERIC Document Reproduction Service No.
ED443079)
Spielvogel, R., Brunner, C., Pasnik, S., Keane, J. T., Friedman, W., Jeffers, L., et al.
(2001). IBM's Reinventing Education Grant Partnership Initiative. Retrieved
May 3,2008, from www.edc.org/CCT/IBM/evaluation.doc
SPSS for Windows, Rel. 16.0.0 2007. Chicago: SPSS Inc.
St. Clair, S. Y. (1999). Evaluation of the ACHIP pilot project, Detroit Public Schools,
1997-1998. Detroit, MI: Detroit Public Schools, Office of Research, Evaluation,
and Assessment. (ERIC Document Reproduction Service No. ED427133)
Swan, K., & Meskill, C. (1997). Multimedia and response-based literature teaching and
learning (Report Series 2.32). (ERIC Document Reproduction Service No.

ED403585). Retrieved August 22,2008, from www.eric.ed.gov
Sweller, J. (1994). Cognitive load theory, learning difficulty, and instructional design.
Learning and Instruction, 4(4), 295-3 12.
Technology Counts. (1999). Education Week on the web: Schools and reform in the
information age. A special report. Retrieved October 2 1,2007, from
http:Ncounts.edweek.org/sreports/tc99
Texas Education Agency. (2002). Program participation and academic progress of
second language learners: Texas middle school update (Policy Research Report
No. 15, GE02-600-01) [Electronic version]. Austin, TX: Author.
Texas Education Agency. (2006). 2005-06 Academic Excellence Indicator System (AEIS)
state, district and campus reports. Austin, TX: Author. Retrieved October 20,
2007, from http://www.tea.state.tx.us/perfreport/aeis/2006/index.html
Texas Education Code. (2006). Texas Education Agency. Retrieved October 20,2007,
from http://tlo2.tlc.state.tx.us/statutes/ed.toc.htm
Thomas, W., & Thomas, C. (1984). The payoffs and pitfalls of video-based training.
Training &Development Journal, 38,28-29.
Tienken, C. H., & Maher, J. (2008). The influence of computer assisted instruction on
eighth-grade mathematics achievement, RMLE Online, 32, 3 . Retrieved
November 11,2008, from http://www.nmsa.org~Publications/RMLEOnline/
ArticlesNol32No3/tabid/l8 1 O/Default.aspx
Tienken, C. H., & Wilson, M. (2007). The impact of computer-assisted instruction on
seventh-grade students' mathematics achievement. Planning and Changing,
38(3/4),18 1-190.

Tsai, C. (2000). A typology of the use of educational media, with implications for
internet-based instruction. Educational Media International, 37, 157-1 60.
Vanbuel M., Bijnens, H., & Bijnens M. (2004). Streaming media in the classroom. Linz,
Austria: Education Highway.
Vygotsky, L. S. (1 978). Mind and society: The development of higher psychological
processes. Cambridge, MA: Harvard University Press.
Waxman, H. C., Connell, M. L., & Gray, J. (2002). Meta-analysis: effects of educational
technology on student outcomes. North Central Regional Laboratory. Retrieved
August 5,2008, fiom North Central Regional Laboratory Web site:
http://www.ncrel.org~tech~effects2/
Wenglinsky, P. (1998). Does it compute -relationships between educational technology
and student acceleration in math. Princeton, NJ: Educational Testing Service.
(ERIC Document Reproduction Service No. ED425191)
Wetzel, C. D., Radtke, P. H., & Stem, H. W. (1994). Instructional effectiveness of video
media. Hillsdale, NJ: Erlbaum.
White, C., Easton, P., & Anderson, C. (2000). Students' perceived value of video in a
multimedia language course. Education Media International, 37(3), 167-1 75.
Wild, M. (1998). History and new technology in schools: Problems, possibilities and the
way forward. In P. Denley, S. Fogelvik, & C. Harvey (Eds.), History and
computing (pp. 20-34). Manchester, England: Manchester University Press.
Wu, H. K., Krajcik, J. S., & Soloway, E. (2001). Promoting understanding of chemical
representations: Students' use of a visualization tool in the classroom, Journal of
Research in Science Teaching, 38, 821-842.
Xin, J. F., & Reith, H. (2001). Video-assisted vocabulary instruction for elementary
school students with learning disabilities. Information Technology in Childhood
Education Annual, p. 87.
Yekovich, F., Yekovich, C., & Nagy-Rados, A. (1999). A formative evaluation of the
TRALE (Technology-Rich Authentic Learning Environments) Project. (ERIC
Document Reproduction Service No. ED429123). Retrieved May 5,2008, from
www.eric.ed.gov

Appendix A: Power Videos Web site and Product Description (www.powe~ideos.com )
*.-"&_..*._I.. -.- -&
rite-u- - W c l c - m t o k r e r r s d - org p r o r 9 d e d h v Dallas C a . n C y Sc-k
EssxeXZ - ElesUw.~ delmrrn ar e d - . a a n @ d e - do- ta - - Inst- - rresr i no -eeu*n. , m ",~,t,W , for czel.rew, oo pap--* - Orcr 1 100 ~duratl-l .dks s-ebm-d t o - TEKS' - Or-. 1 300 a a k - s l o n - t hrclopm-nt t s U - iveol-bk PQ stream- -8"
--e"--c. - ~ a s r h olar 0, -a-nlorrlr am-Y rmm aur -b 5.g
Power Videos is a copyrighted product produced by Dallas County Schools. The library has more than 10,300 titles available from multiple sources, including Disney, National Geographic, Weston Woods, Visual Learning, and many more. A collection of audio titles including textbooks on audio for special needs students is also available from the Reading and Radio Resource. Users may search by subject, keyword, title, or grade level. Videos are correlated to the Texas Essential Knowledge and Skills (TEKS) Standards. Most videos are divided into short clips for ease of use.

Appendix B: IRB Forms
Completion CertiJicate
This is to certify that
Rick Sorrells
has completed the Human Participants Protection Education for Research Teams online
course, sponsored by the National Institutes of Health (NIH), on August 8, 2006.
This course included the following:
key historical events and current issues that impact guidelines and legislation on human participant protection in research. ethical principles and guidelines that should assist in resolving the ethical issues inherent in conducting research with human participants. the use of key ethical principles and federal regulations to protect human participants at various stages in the research process. a description of guidelines for the protection of special populations in research. a definition of informed consent and components necessary for valid consent. a description of the role of the IRB in the research process. the roles, responsibilities, and interactions of federal agencies, institutions, and researchers in conducting research with human participants.
National Institutes of Health
http://www.nih.gov

IRB Non Review Certification
STUDENT: %.f& Title o f ~ i s s e r t a t i o n : ~ k \ d ( o nskdpp &httk Shh. M L ~ M ~ 0-4
ULL 9 f ' o d 1 . 4 - m ~ &,he 4 h ~ a L d Vl&eo s I certify, by my signature below, that the above indicated study does not require IRB review as a result of a lack of involvement with human subjects (see OHRP
. flow chart) and as indicated by any or all of the following (check all that apply).
1. Historical research - 2. Public data base 3. *Proprietary data base
-X_
4. Freedom of Information 5. Right to know - sunshine law
Student signature: Advisor approval:
Reviewed by : Marty Finklestein -Higher Ed
Proprietary data that does not identify individuals

Appendix C: Campuses Randomly Selected for Inclusion in the Study
Albert Johnson Alexander Blanton Bonham Casa View Centerville Club Hill Colin Powell CountryPlacee Cowart Daniels Degolyer Dickinson Donald E. Martinez Ervin Frank Freeman Freeman CFB Galloway Gamer Gooch Good Gray Handley HB Gonzalez Heather Glen Hernandez Hill John N Bryan Johnson GP Kent Lakewood Landry Marshall McCoy Miller Moreno Oran Roberts Peabody Peeler Preston Hollow R. E. Lee

Raybum Reilly Runyon S S Comer Sally Moore Sam Houston Sanger Seguin Thompson Thomton Tosch Townley U. Lee Umphrey Lee Weaver Webster Winnetka Zavala

Appendix D: P o w e r V i d e o s S a m p l e S t a n d a r d Report
Educational Download Log:
TITLE
Ph.17 i77Y~ l lAVT~DG
go back
305 Discovered
DOWNLOAD DISTRICT
DATElTlME 1 Hlanc11 ISD 11 7 1 0 19 AM I
Dallas I S D (Dallas 5 5 2008 Tl====-l

Br)arl .Adass Hlph School
1- 7 1 Dallas lSD!D:~llas Public ( 5 5 2008 8:04:30 Hector P. Ci;irc#a Mlddlc 1
D.ill;is ISD IDallss Public 5 5 2008 8:Ob 27 4111ngllw Purk C l C
Dallas ISDlDsllas Public 5 5 211088:15 JO Arlington Park ( 'LC
5 5 2008 8: lh lO r l i l l i j f ~ l l Plrh ('LC


Appedx E AEIS sample report
1- t W. 67% 79% . ma . 11% mar 50% '19% . a* .
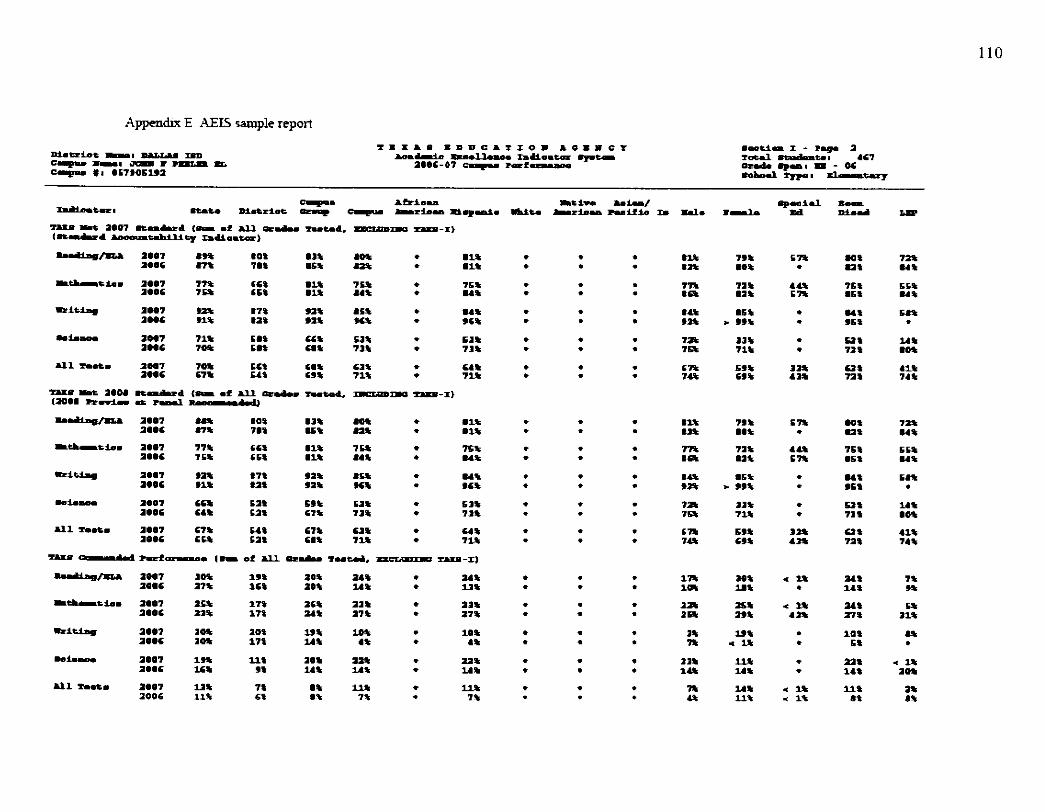
U1 MI 1.97 7- 66% 6 % 63% t G4L 2.96 67% U1 69% 71% . 71%
7% 9%
6% II.
LLL 11%
11% lit
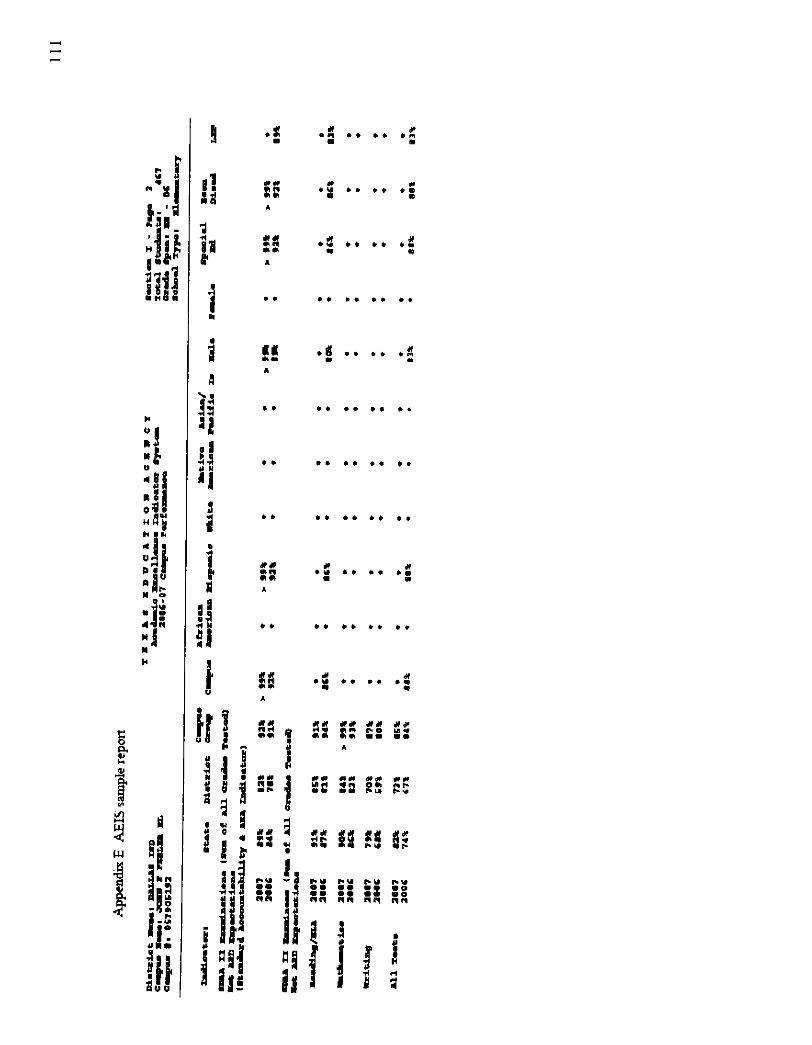

r . . . . . . . r r r r r s rqq? 44444 a 0 ~ c o c o o unno o o o o o 3 " c n n
a as s sag raaa q s a r 1 . . . . . . . . . . . . . . . u u...o. nnn. noon. m a m

Appcndm E MIS sample report
-+hu- a107 14% 27s am* w . 11% . . . SOL amu am am: 41% 47% . 47% . . . COL

. . . . . il. tCL i ¶ L Y.U . . . . iu WI? . i.1 i ? L L lmC 3 - r T - u . . . . . . . I C C ,.LC . . . . . . . :R wc LoLC ¶---=a
i(C tCC iC. w. I Y L i T L


W'O W'OL W ' . W . 0 W'(T W'OL W'O
u. 5 u. Y IT' L U'. +.' L W L u. L n' L n. L tY'L U' L IT. . U' L IT' I u.0
Lrn- I- Porn.